DAVID S. WRAYSchool of Science, The University of Greenwich, Chatham Maritime, Kent, ME4 4TB, U.K.
ABSTRACT: Laterally extensive, thin, eustatically controlled, transgressive marine shale beds that occur within paralic sequences aregenerally regarded as reliable correlative markers. Such shale beds in the Carboniferous of NW Europe are referred to as marine bands andhave been used extensively for stratigraphic correlations, particularly in the petroleum industry, where they are used to construct interwellcorrelations. True marine bands are represented by black anoxic shales (characterized by high U levels and high gamma API responses)that contain definitive ammonoid assemblages, i.e., demonstrably were deposited in a marine environment. However, not all black shalesin the Carboniferous of NW Europe are the product of marine deposition, despite which they are still colloquially referred to as “marinebands” and are used for stratigraphic correlations. The problem of “marine band” recognition and correlation is exacerbated when dealingwith well bores, where only wireline-log data and cuttings are available. This study demonstrates how inorganic geochemical data are usedas a means to refine the identification of true marine bands and how these data can be used for enhanced stratigraphic correlations.
“Marine-band chemostratigraphy” is established using core sections from the onshore Carboniferous Coal Measures sequencesencountered in the West Midlands of England. Using variations in U, Mo, Zn, Cu, V, P2O5, Al2O3, Th, and Zr concentrations, a geochemicallybased facies classification scheme is erected, which allows the differentiation of mudstones deposited in marine, freshwater lacustrine, andfloodplain environments, and which has been validated by palynological and sedimentological facies data. This scheme is successfullyextended to a nearby well from which only cuttings are available.
The general concept of marine-band chemostratigraphy can be applied to the sedimentary rocks deposited in any coastal-plain tomarginal-marine setting. The methodology provides a robust technique for the identification and correlation of “marine bands” and alsodemonstrates the importance of inorganic geochemical data in the context of sequence stratigraphy.
During late Carboniferous times extensive, low-lying coastalswamps were developed across much of what is now northwestEurope, resulting in the deposition of thick coal sequences andmudstone-dominated sequences. These successions became thefocus of widespread coal mining in many countries, and ensuredthat their stratigraphy became closely studied. More recently, theassociated sandstones have become the target for hydrocarbonexploration in the Southern North Sea. It was rapidly realizedthat, associated the nonmarine sandstones, coals, and gray rootedmudstone deposits, certain mudstone horizons possess marinefossils (goniatites and bivalves). Following the pioneering workof Ramsbottom (1977, 1978) and Ramsbottom et al. (1978), theterm “marine band” was adopted for such horizons. In theCarboniferous of the UK, marine bands correspond to thin (oneto two meters) intervals of organic, pyritic, dark gray to blackfissile shale containing goniatites and bivalves, along with frag-
ments of degraded wood and biogenic kerogen. By using goniatiteand bivalve zone fossils at outcrop, these horizons were found todisplay notable lateral persistence, and “marine band” correla-tions became widely used to constrain the stratigraphy of UpperCarboniferous sequences in the UK and across Europe(Ramsbottom, 1977, 1978; Ramsbottom et al,. 1978; Wilson, 1980;Eager et al., 1991; Owen, 1998; Wilson and Chisholm, 2004).
The identification, and particularly the correlation, of marinebands in boreholes and wells is more difficult due to the scarcityof macrofossils. However, petroleum exploration in SouthernNorth Sea has increased the need for stratigraphic correlations inthe Upper Carboniferous. Commonly, the recognition and corre-lation of marine bands in the southern North Sea has relied ongamma logs and palynological data. In many instances, marinebands have high gamma API values, due to their high levels ofuranium (U). The U is concentrated mostly in organic matter,which is preserved in the shales owing to their deposition underanoxic conditions (Adams and Weaver, 1958; Archard and Trice,
TIM J. PEARCE, DUNCAN MCLEAN, JOHN H. MARTIN, KEN RATCLIFFE, AND DAVID S. WRAY222
1990). Leeder et al. (1990), Davies and McLean (1996), and O’Maraand Turner (1997) have all reported that marine bands commonlycoincide with “hot shales”, i.e., shales with gamma API valuestwo to five times greater than the surrounding mudstones. There-fore, through time, “marine band” in the Carboniferous of North-ern Europe has become a generic term synonymous with blackfissile shales that have high gamma values, whether they havedemonstrably marine faunas or not. Subsequently, when corre-lating these sequences, there has been a tendency to accept allhigh-gamma shale horizons as “marine bands” without furthercorroboration from biostratigraphic and sedimentological data.This approach is flawed, since high gamma responses in theCarboniferous can be the result of heavy-mineral lags or tonsteinsand not all marine bands exhibit high-gamma API responses.
When dealing with non-cored well-bore sequences, palyno-logical analysis of cuttings is the most reliable method for thecorrelation of Upper Carboniferous paralic sequences (McLeanand Murray, 1996; McLean and Davies 1999). However, marinebands in the Upper Carboniferous often do not exhibit a diagnos-tic marine palynoassemblage, their position being inferred fromthe occurrence of abundant amorphous organic material, bleachedpalynomorphs, high numbers of Potonieisporites spp., and possi-bly the arenaceous foraminifera. While these criteria can helpprove the marine nature of a thin, high-gamma shale, they are notnecessarily diagnostic of a particular marine band, making iden-tification and correlation of individual marine bands difficult.Generally, the identity of marine bands is constrained by thebackground biostratigraphic zonation of the associated nonma-rine mudstones. Typically, one or two marine bands may occurwithin one biostratigraphic zone which may be equivalent to 30–60 m intervals. However, in instances where the biostratigraphiczonation of the nonmarine mudstones is of low resolution, or thepalynological elements are facies-dependent, there is potentialfor the misidentification and potential miscorrelation of marinebands.
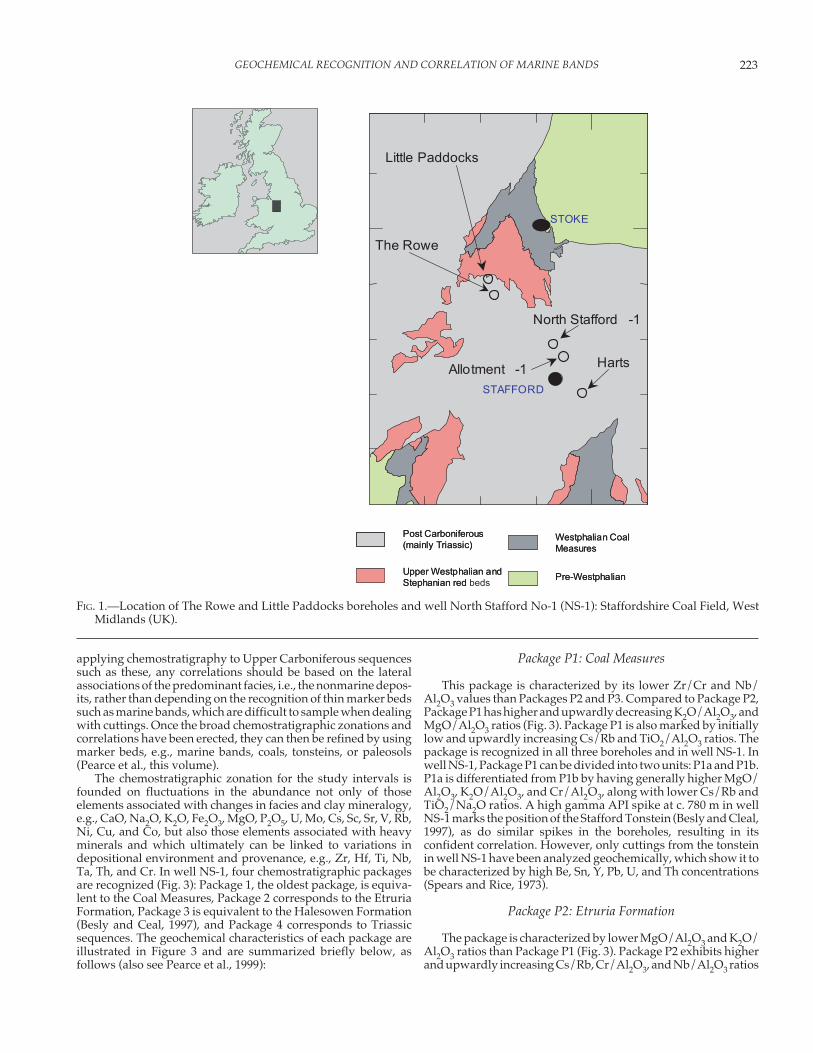
This study focuses on two extensively cored intervals throughthe Coal Measures from the West Midlands of England (Beslyand Cleal, 1997; Pearce et al., 1999) (Fig. 1). The sections havebeen sedimentologically logged and correlated using palynol-ogy and chemostratigraphy by the authors cited above. Thepurpose of this paper is to demonstrate that inorganic geochemi-cal data can be used to differentiate between true marine bands,nonmarine mudstones, heavy-mineral lags, coals, and tonsteinsin two cored sections. The geochemical criteria established fromthe cored intervals are then applied to cuttings from a nearbywell. The resulting high-resolution correlation, when placedwithin a sequence stratigraphic context, can greatly improvereservoir-scale and subregional correlation schemes of paralicsequences.
DATA SET AND STUDY INTERVALS
The study focuses on onshore Upper Carboniferous(Duckmantian) coal measures sections from the StaffordshireCoal Field, West Midlands (U.K.), as encountered by two coalexploration boreholes (Little Paddocks and The Rowe) and oneoil exploration well (North Stafford No-1 (NS-1) (Fig. 1). For thisstudy, 436.9 m of core is available from The Rowe borehole, 149.4m of core is available from the Little Paddocks borehole, andcuttings samples covering c.400 m of section are available fromwell NS-1 (Fig. 2).
Detailed sedimentological logs are available for the two coreintervals, along with detailed palynological analyses. The studyintervals include a total of eight thin shales that have been calledmarine bands and have been used for regional correlation. Each
of these “marine bands” has been assigned a name: Vanderbeckei(VMB), Maltby (MMB), Clown (ClMB), Haughton (HMB), Sutton(SuMB), Aegiranum (AMB), Shafton (SMB), Edmondia (EMB),and Cambriense (CMB). The positions of the marine bands inthe Little Paddocks and The Rowe boreholes are inferred fromcore descriptions and E-logs, as well as with reference to nearbyboreholes Allotment-1 and Harts (Fig. 1). Their positions in wellNS-1 are based on gamma responses and coal-seam stratigra-phy (Besly and Cleal, 1997; Besly, personal communication),along with reference to borehole Allotment-1 (Pearce et al.,1999); see Figure 2.
MATERIALS AND METHODS
The analyzed samples consist primarily of mudstones andoccasional coals. The size of the core samples ranges from 2 to 3cm3, whereas between 300 and 400 chips, making up about 1 g inweight, are hand-picked from each cuttings sample of well NS-1.Where chips of black and medium to dark gray mudstone occurin the same cuttings sample, both lithologies are picked andseparately analyzed, just in case each lithology represents adifferent facies, (i.e., the black mudstones might be marine inorigin, but the lighter gray ones could be nonmarine). Withrespect to well NS-1, 37 cuttings from the Etruria Formation andthe Halesowen Formation, plus 106 cuttings from the Coal Mea-sures, were analyzed geochemically, the spacing between theanalyzed samples ranging from 1 m to 15 m. A total of 140 coresamples from the two boreholes were analyzed geochemically,the spacing of these samples ranging from 1 m to 30 m (Fig. 2) withclosely spaced sampling (0.5–1 m) across potential marine bandsand other transgressive mudstone horizons. All of the sampleswere prepared for geochemical analysis by alkali fusion (Pearceet al., 1999) and then analyzed using inductively coupled plasma–optical emission spectrometry (ICP-OES) and inductively coupledplasma–mass spectrometry (ICP-MS), with data being acquiredfor 48 elements and the methods outlined in Jarvis and Jarvis(1992) and Pearce et al. (1999).
CHEMOSTRATIGRAPHIC ZONATION
Chemostratigraphy, or chemical stratigraphy, uses major-element and trace-element geochemistry to characterize andcorrelate sedimentary sequences. The elemental composition ofsediments is highly variable due to source composition, facies,paleoclimate, and diagenesis (Ratcliffe et al., 2008, Pearce et al.,this volume, and references cited therein). Even otherwise appar-ently homogeneous sequences show differences in their whole-rock geochemistry, which has resulted in chemostratigraphybeing extensively used in the petroleum industry to help definestratigraphic correlations between well bores (Ehrenberg andSiring, 1992; Racey et al., 1995; Pearce et al., 1999; Pearce et al.,2004; Wray, 1999; Ratcliffe et al., 2004; Pearce et al., 2005a; Pearceet al., 2005b; Ratcliffe et al., 2006).
Here, chemostratigraphy has been applied to the UpperCarboniferous sequences encountered in both boreholes andwell NS-1 (Pearce et al., 1999). The existing lithostratigraphyand the resultant chemostratigraphic zonations together pro-vide a stratigraphic correlation framework for the study se-quences that have been used to constrain whether chemo-stratigraphy can be used for identification and correlation ofmarine bands.
Based on interpretations made from the graphical analysis ofthe mudstone geochemical data, a chemostratigraphic correla-tion has been established between well NS-1 and the LittlePaddocks, Harts, and The Rowe boreholes (Fig. 2). Ideally, when
223GEOCHEMICAL RECOGNITION AND CORRELATION OF MARINE BANDS
FIG. 1.—Location of The Rowe and Little Paddocks boreholes and well North Stafford No-1 (NS-1): Staffordshire Coal Field, WestMidlands (UK).
applying chemostratigraphy to Upper Carboniferous sequencessuch as these, any correlations should be based on the lateralassociations of the predominant facies, i.e., the nonmarine depos-its, rather than depending on the recognition of thin marker bedssuch as marine bands, which are difficult to sample when dealingwith cuttings. Once the broad chemostratigraphic zonations andcorrelations have been erected, they can then be refined by usingmarker beds, e.g., marine bands, coals, tonsteins, or paleosols(Pearce et al., this volume).
The chemostratigraphic zonation for the study intervals isfounded on fluctuations in the abundance not only of thoseelements associated with changes in facies and clay mineralogy,e.g., CaO, Na2O, K2O, Fe2O3, MgO, P2O5, U, Mo, Cs, Sc, Sr, V, Rb,Ni, Cu, and Co, but also those elements associated with heavyminerals and which ultimately can be linked to variations indepositional environment and provenance, e.g., Zr, Hf, Ti, Nb,Ta, Th, and Cr. In well NS-1, four chemostratigraphic packagesare recognized (Fig. 3): Package 1, the oldest package, is equiva-lent to the Coal Measures, Package 2 corresponds to the EtruriaFormation, Package 3 is equivalent to the Halesowen Formation(Besly and Ceal, 1997), and Package 4 corresponds to Triassicsequences. The geochemical characteristics of each package areillustrated in Figure 3 and are summarized briefly below, asfollows (also see Pearce et al., 1999):
Package P1: Coal Measures
This package is characterized by its lower Zr/Cr and Nb/Al2O3 values than Packages P2 and P3. Compared to Package P2,Package P1 has higher and upwardly decreasing K2O/Al2O3, andMgO/Al2O3 ratios (Fig. 3). Package P1 is also marked by initiallylow and upwardly increasing Cs/Rb and TiO2/Al2O3 ratios. Thepackage is recognized in all three boreholes and in well NS-1. Inwell NS-1, Package P1 can be divided into two units: P1a and P1b.P1a is differentiated from P1b by having generally higher MgO/Al2O3, K2O/Al2O3, and Cr/Al2O3, along with lower Cs/Rb andTiO2/Na2O ratios. A high gamma API spike at c. 780 m in wellNS-1 marks the position of the Stafford Tonstein (Besly and Cleal,1997), as do similar spikes in the boreholes, resulting in itsconfident correlation. However, only cuttings from the tonsteinin well NS-1 have been analyzed geochemically, which show it tobe characterized by high Be, Sn, Y, Pb, U, and Th concentrations(Spears and Rice, 1973).
Package P2: Etruria Formation
The package is characterized by lower MgO/Al2O3 and K2O/Al2O3 ratios than Package P1 (Fig. 3). Package P2 exhibits higherand upwardly increasing Cs/Rb, Cr/Al2O3, and Nb/Al2O3 ratios
TIM J. PEARCE, DUNCAN MCLEAN, JOHN H. MARTIN, KEN RATCLIFFE, AND DAVID S. WRAY224
FIG
. 2.—
A s
umm
ary
of t
he s
tud
y in
terv
als
in b
oreh
oles
(L
ittl
e Pa
dd
ocks
and
The
Row
e) a
nd w
ell
Nor
th S
taff
ord
No-
1 (N
S-1)
. The
dep
ths
of s
ampl
es a
naly
zed
by
chem
ostr
atig
raph
y an
d p
alyn
olog
y ar
e in
dic
ated
for
each
stu
dy
inte
rval
. Str
atig
raph
y is
bas
ed o
n B
esly
and
Cle
al (1
997)
and
Bes
ly (u
npub
lishe
d d
ata)
.
225GEOCHEMICAL RECOGNITION AND CORRELATION OF MARINE BANDS
F IG
. 3.—
Che
mos
trat
igra
phic
zon
atio
n of
the
wel
l NS-
1 st
udy
inte
rval
cut
ting
s sa
mpl
es.
TIM J. PEARCE, DUNCAN MCLEAN, JOHN H. MARTIN, KEN RATCLIFFE, AND DAVID S. WRAY226
and generally higher TiO2/Na2O ratios compared to Package P1.Package P2 is recognized in well NS-1 and the Harts borehole butlies above the study intervals of The Rowe and Little Paddocksboreholes. Package 2 can be subdivided into three units, withUnit 2A having low Cr/Al2O3 and Nb/Al2O3 ratios and generallyhigher TiO2/Na2O, Unit 2B having the highest TiO2/Na2O in thispackage, and Unit 2C having the highest Cr/Al2O3 and Nb/Al2O3 ratios (Fig. 3).
Package P3: Halesowen Formation
This package is characterized by having higher MgO/Al2O3,K2O/Al2O3, TiO2/P2O5, and lower TiO2/Na2O ratios than Pack-age P2. Package P3 also exhibits high Cr/Al2O3 and Nb/Al2O3ratios comparable to Package P2 (Fig. 3). Package P3 can befurther subdivided into two units, with the lower Unit 3A havinghigh MgO/Al2O3 ratios and Unit 3B having higher K2O/Al2O3and TiO2/P2O5 values (Fig. 3). Package P3 is recognized in wellNS-1 and the nearby Harts borehole (Pearce et al., 1999) and isbelieved to lie somewhere above the study intervals of The Roweand Little Paddocks boreholes (Besly and Cleal, 1997).
Package 4: Triassic Sequences
The package corresponds to the Triassic sequences and ischaracterized by having much higher MgO/Al2O3, K2O/Al2O3,and Nb/Al2O3 ratios than Package P3 (Fig. 3). The Triassicinterval also exhibits significantly lower Cr/Al2O3 and Cs/Rbratios than Package P3.
PALYNOSTRATIGRAPHIC ZONATION
The core intervals from the Little Paddocks and The Roweboreholes have also been subjected to extensive palynologicalanalyses, with the recovered palynological assemblages beingreferred to the Langsettian to Westphalian D Biozones of the in-house University of Sheffield biozonation for the Carboniferous(modified after McLean, 1995). With regards to the Little Pad-docks borehole, the study section corresponds to Biozones W6aand W5b (McLean, 1995), of Bolsovian age. The top of BiozoneW5b is placed at 1038 m by the top of Grumosisporitesvarioreticulatus, with the base of the X Biozone of Smith andButterworth (1967) and the SL Biozone (Clayton et al., 1977)being placed at 1084.50 m (Fig. 2). The Cambriense MB is placedat 1063 m and the Shafton MB at 1079.6 m.
The study interval of The Rowe borehole is assigned toBiozones W2b–W5b (middle Langsettian to early Bolsovian) (Fig.4). The top of Biozone W2b is placed at 1217.60 m to correspondwith the top of Radiizonates aligerens, whereas the top of BiozoneW3a, which coincides with the Vanderbeckei MB, is put at 1156.65m, based on the occurrence of Schulzospara rara and Apiculatisporisvariocorneus. Very few samples from the interval 993.25 m–1147.40m have been analyzed, though nevertheless it is assigned toBiozones W4a–W4b, due to the presence immediately above993.25 m of Biozone W4c elements R. striatus, T. cf. sculptils, L.noctina, and common L. noctiuna. The Clown MB is placed at 951.5m within Biozone W5a, with the Maltby MB being put in a samplegap between 975.4 m and 993.25 m. Samples from 892.1 m downto 924.8 m are assigned to Biozone W5a, with the top ofAhrensisporites guerickei and common Triquitrites sculptilis,Vestispora magna, Cristatisporites connexus, and Lycospora rotundarotunda occurring at 892.1 m. The Aegiranum MB lies close to thetop of this biozone at 894.2 m, with the Haughton MB being nearits base at 921.9 m. The remainder of the study interval is assignedto Biozone W5b, with its top being placed just above 803.4 m,
based on the top of Grumosisporites varioreticulatus. The CambrienseMB is placed at 803.7 m and the Shafton MB is put at 819.3 m,which also coincides with the base of SL Biozone of Clayton et al.(1977).
The robust, integrated chemostratigraphic and palynostrati-graphic correlation established for The Rowe and Little Pad-docks is consistent with the correlation presented by Besly andCleal (1997) and Besly (personal communication), which arebased on detailed core logging and E-log interpretations, andprovides a stratigraphic context into which to place the marinebands.
RECOGNITION OF MARINE BANDS USINGGEOCHEMICAL EVIDENCE
Numerous candidate “marine bands” have been recognizedfollowing detailed logging of core sections through the CoalMeasures sequences encountered in the Staffordshire Coal Field(Besly and Cleal, 1997; Besly, personal communication). Theycorrespond to laminated, dark gray to black mudstones thatoften immediately overlie coal seams. The mudstones are gen-erally organic and pyritic, and contain fish detritus, bivalves,and arenaceous foraminifera. Some of these intervals corre-spond to marine bands, but others reflect “freshwater” lacus-trine flooding events: differentiating the two can be difficultwhere macrofossils, core material, or E-logs are absent (Beslyand Cleal, 1997).
Geochemical Evidence Used to Recognize Marine Bands
Adams and Weaver (1958), Archard and Trice (1990), Leederet al. (1990), Davies and McLean (1996), and O’Mara and Turner(1997) have shown that the marine and nonmarine mudstones ofthe Coal Measures differ geochemically. Marine black mud-stones have more U than continental mudstones, because thelatter were deposited in more oxidizing environments, where Uforms highly soluble U6+. Marine bands were deposited duringtimes of very low oxygen levels (anoxia) and little clastic input,which allowed the concentration of insoluble U4+. Sedimentscontain abundant organic matter and U can be remobilized,becoming fixed in amorphous organic matter and adsorbed ontoplant detritus and clay minerals (Archard and Trice, 1990; Leederet al., 1990). Th, on the other hand, is effectively insoluble in waterand thus its abundance has little relationship to the oxidationstate of the sediments. Consequently, the above workers haveused low Th/U values as evidence for the presence of marinebands over the Coal Measures sections.
Leeder et al. (1990) note that Coal Measures mudstones with> 6 ppm of U probably have marine affinities. Adams and Weaver(1958) suggest that Th/U values below 2 are diagnostic of marinedepositional environments, whereas Hollywood and Whorlow(1993) use a Th/U value below 3 as an indicator for marinedeposition. Davies and McLean (1996) suggest that Th/U valuesbelow 3.8 and Th/K2O values below 6 indicate marine bands,which are also frequently enriched in phosphatic, carbonaceous,and bituminous material.
O’Mara and Turner (1997) erected a fourfold classification ofmarine bands from the Namurian and Westphalian successionsof the Pennine Basin and the Southern North Sea, based primarilyon the gamma and spectral gamma responses of the bands,coupled with sedimentological and biostratigraphical data.
(a) Namurian marine bands are represented by black marineshales deposited during times of anoxia. They contain thick“ammonoid acme” intervals and have high U levels.
227GEOCHEMICAL RECOGNITION AND CORRELATION OF MARINE BANDS
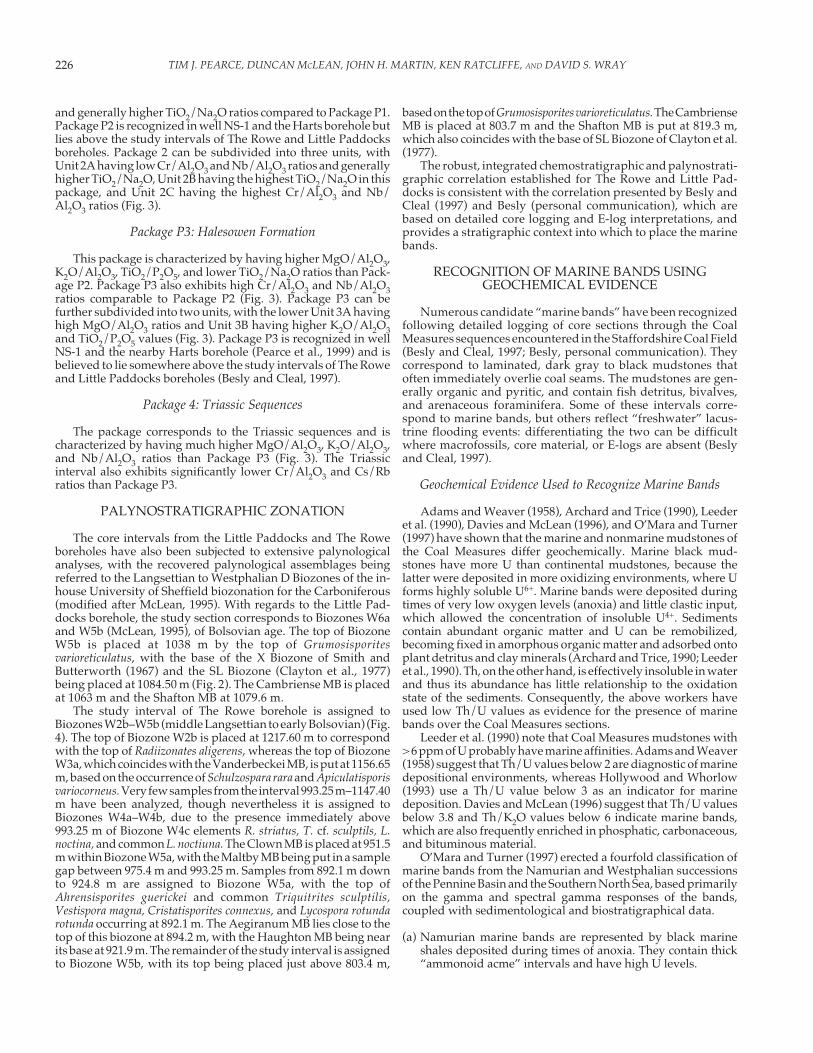
FIG
. 4.—
A c
ompa
riso
n be
twee
n th
e ch
emos
trat
igra
phic
zon
atio
n an
d p
alyn
ostr
atig
raph
ic sc
hem
e in
The
Row
e an
d L
ittl
e Pa
dd
ocks
bor
ehol
es. N
o pa
lyno
stra
tigr
aphi
cd
ata
are
avai
labl
e fr
om N
orth
Str
affo
rd N
o-1,
but
in th
is w
ell t
he p
osit
ion
of m
arin
e ba
nds
is c
ompa
red
wit
h th
e ch
emos
trat
igra
phic
zon
atio
n.
TIM J. PEARCE, DUNCAN MCLEAN, JOHN H. MARTIN, KEN RATCLIFFE, AND DAVID S. WRAY228
FIG. 5.—Relationship between Mo/Al2O3 values and the abun-dance of amorphous organic matter in the Aegiranum MBoccurring in The Rowe Borehole.
(b) Vanderbeckei-type marine bands were laid down in shal-lower water than the Namurian marine bands, during timeswhen seawater oxygen levels were somewhat reduced. Theycontain thin “ammonoid acme” intervals and abundant benthicmarine fossils and have relatively reduced U levels. Thesemarine bands have little terrestrial humic material, becausetheir depositional environments lay some way from land.
(c) Duckmantian–Bolsovian marine bands have high U levelsdue to the presence of abundant terrestrial plant material ontowhich U has been adsorbed. U levels are also high in thephosphatic valves of the inarticulate bivalve Lingula, whichare particularly common in these types of marine band.
(d) Brackish-water Lingula beds contain much terrigenous clasticmaterial but little U.
In most instances, marine bands can be identified from theirspectral gamma responses, though problems occur wheremarine bands lack high U levels. It should be noted that thecurrent study focuses on Duckmantian sequences, and ma-rine bands are similar to those described in category (c) above
GEOCHEMICAL CHARACTERISTICSOF MARINE BANDS
As stated earlier in this paper, Th and U data can be used torecognize marine bands. In cases where these data are cross-correlated with the data for other elements, e.g., Mo, P2O5, Cu, Zn,Ni, V, and Zr, it is possible to differentiate between mudstonesdeposited in freshwater and brackish to marginal marine envi-ronments from those mudstones that come from proven marinebands.
Metallic elements, particularly P2O5, Mo, Ni, and Cu, but alsoCr, Co, and Zn, are common in certain black mudstones. P2O5levels are high in mudstones containing Lingula valves and/orfish scales (O’Mara and Turner, 1997), whereas Mo/Al2O3 levelscan be linked with the occurrence of amorphous organic matter(AOM; Wilde et al. 2004) (Fig. 5) and, to a lesser extent, the
presence of algal detritus, as determined from palynofacies inves-tigations. High levels of Ni, Co, Zn, V, Cu, and Cr are typicallyfound together with high U levels and are all associated with AOMand sulfide minerals, such as pyrite. However, high U levels can bedue to the presence of heavy minerals such as zircon, apatite, andmonazite occurring as silt-grade grains even in extremely fine-grained mudstones, so when attempting to identify marine bands,the possible presence of these heavy minerals and their contribu-tion to the overall U content can be taken into account by employ-ing U/Zr and U/Th values rather than absolute U contents.
To highlight the range of geochemical characteristics associ-ated with a marine band, Figure 6 plots the data for selectedelements acquired from the Aegiranum MB as encountered inThe Rowe borehole. Apart from the Th and U data, which areplotted as Th/U values, the remainder of the data are plotted asAl2O3 ratios, in order to compensate for the variable amounts ofclay in the analyzed samples. Samples from the marine band arecharacterized by very high U/Al2O3, Mo/Al2O3, and P2O5/Al2O3values, as well as high Al2O3 ratio values for the metallic ele-ments, i.e., Ni, V, Zn, and Cu. In addition, these samples have lowTh/U values, along with high Mo/Th and U/Zr values (notshown). Figure 6 shows that two samples from the AegiranumMB have high Mo/Al2O3 values, which are due to the presence ofabundant AOM (as determined by palynological investigations).Furthermore, high P2O5/Al2O3 levels are recorded from themarine band and can be linked to the occurrence of Lingula valvesand fish debris noted in the band during core logging.
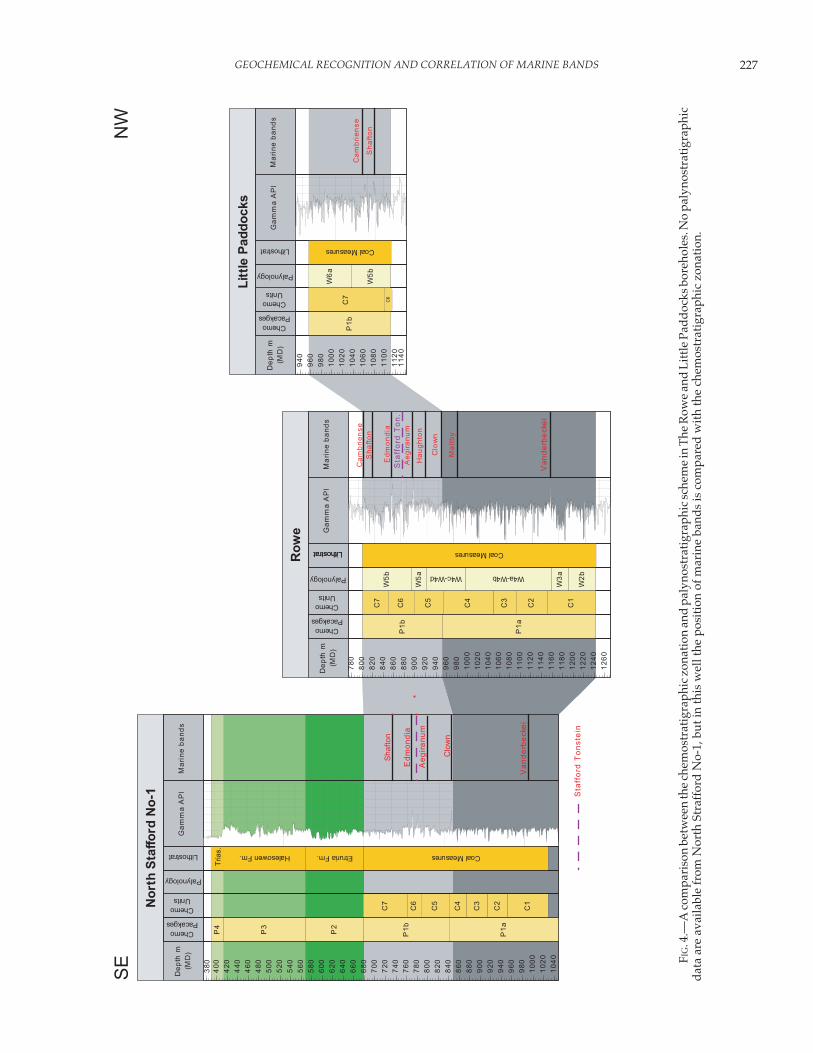
Figures 7 to 9 relate to the three study intervals and plot thegeochemical criteria used previously to characterize theAegiranum MB. Figure 8 shows that by using the aforesaidcriteria, several marine bands are recognized in the core fromThe Rowe borehole: the Cambriense and Shafton both occur inUnit C7, the Edmondia is found at the top of Unit C6, theAegiranum, Haughton, and Clown all occur within Unit C5,and the Vanderbeckei is identified at the top of Unit C1. How-ever, the position of the Maltby MB remains somewhat uncer-tain, though it probably lies in an interval from which nosamples have been collected. In the cored interval from the LittlePaddocks borehole the Cambriense and Shatfon marine bandsare well defined (Fig. 9). The Vanderbeckei, Clown, Aegiranum,and Edmondia marine bands are all recognized in well NS-1 (Fig.7), though the Shafton MB is poorly defined, with only high P2O5/Al2O3 and Cu/Al2O3 values being recorded. It probably is verythin in this well, and the characteristically subtle U enrichmentsand, to a lesser extent, the Mo enrichments have been “diluted”by the incidence of nonmarine, dark gray mudstone chips in theanalyzed cuttings sample collected over the three-meter-thickinterval that includes the marine band in question. Therefore,when attempting to recognize marine bands using geochemicaldata acquired from cuttings, attention should be paid to the datarelating to U, U/Al2O3, P2O5/Al2O3, Mo/Al2O3, and the metallicelements, along with Th/U values, so that the bands can beidentified with confidence.
Criteria Used for Geochemical Classification of Mudstones
By utilizing a combination of geochemical criteria, petro-physical data, and biostratigraphic data the potential for therecognition of marine bands can be confidently proposed. In theclassification proposed below, each analyzed mudstone sampleis given a weighted score that ultimately allows those mudstonesdeposited during marine flooding events, during brackish wateror lacustrine flooding events and in floodplain settings, to begeochemically differentiated, with the facies of each samplebeing corroborated by sedimentological and palynological data.
229GEOCHEMICAL RECOGNITION AND CORRELATION OF MARINE BANDS
F IG
. 6.—
Geo
chem
ical
cha
ract
eris
tics
and
geo
chem
ical
faci
es c
lass
ific
atio
n as
soci
ated
wit
h th
e A
egir
anum
MB
in T
he R
owe
bore
hole
.
The classification also ensures that samples with either high U orhigh P2O5 levels, due to the presence of abundant heavy minerals,can be disregarded. The interpretation of the scores obtained byapplying the criteria listed in Table 1 are as follows:
Score of 4 = floodplain mudstoneScore of 7 = brackish water or lacustrineScore of 10 = marginal marine mudstoneScore of 13 or 16 = marine mudstone (= marine band)If a sample has a very high Zr/U value (above 65), it is presumed
to contain abundant heavy minerals and is awarded a finalscore of 2.
If a sample comes from a coal, it is awarded a default score of 0.
Marine bands can also have high levels of Cu, V, Ni, Zn, Fe2O3,MnO, and CaO, due to the presence of macrofossils and sulfideminerals, though such high levels are not recorded exclusivelyfrom marine bands.
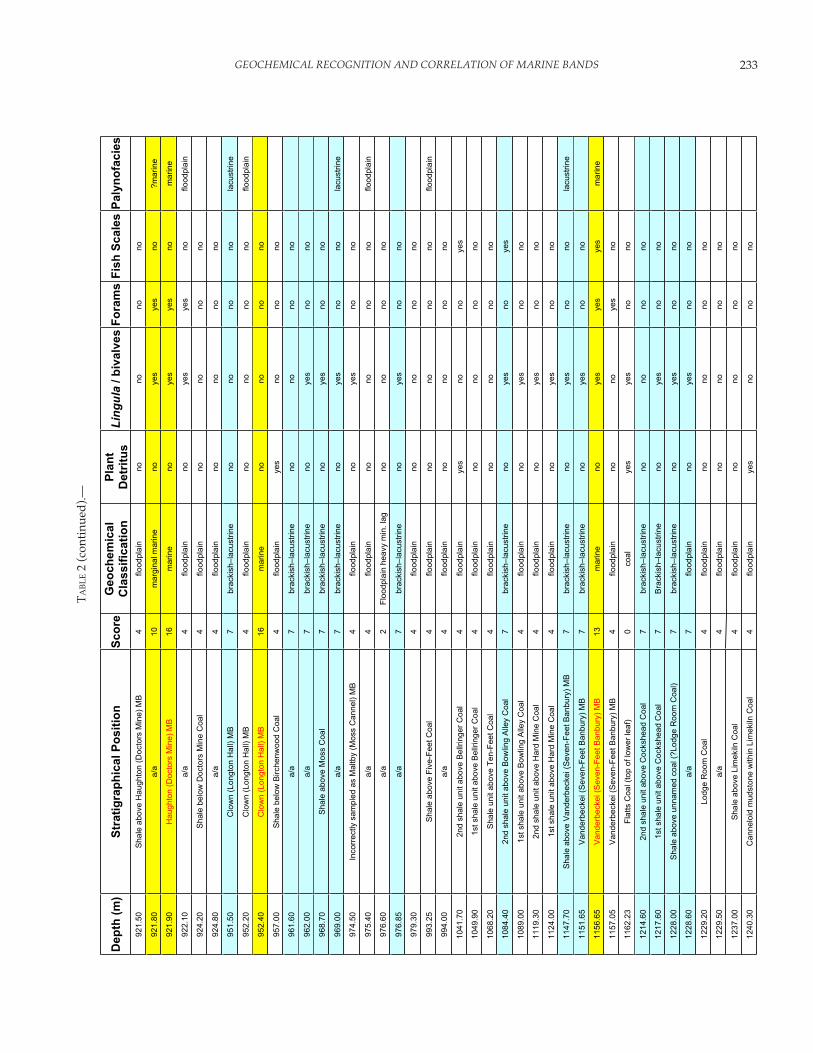
Results of the Geochemical Classification
Table 2 summarizes the geochemical classification scores forthe analyzed mudstones from The Rowe borehole and shows thatall the samples from known marine bands have scores above 10,i.e., marginal marine mudstones–marine mudstones. Furthermore,the brackish-water or lacustrine flooding-event mudstones canbe differentiated from the proven marine mudstones, inasmuchas the former have high P2O5/Al2O3 values, occasional moderateenrichments in the metallic elements, and no U or Mo enrich-ments, so do not exhibit the low Th/U values and high Mo/Thvalues that characterize the marine bands. For example, Table 2shows that the 827.1 m sample has a score of 7 and is interpretedas a brackish-water/lacustrine mudstone. The core descriptionsreport the presence of fish scales from around this depth, whichpresumably are the source for the high P2O5 level recorded fromthis sample. In well NS-1 and The Rowe and Little Paddocksboreholes, application of the aforesaid geochemical criteria allowthe marine bands and those mudstones deposited by lacustrineflooding events to be differentiated with confidence.
When applied to the thicker marine bands from which severalsamples have been analyzed, the geochemical classification re-veals that they record fluctuating anoxic events related to local-ized periods of transgression and regression that are associatedwith increases in the rates of input of terrigenous material (Boydet al., 2000; Wadsworth et al., this volume). For example, theAegiranum MB in The Rowe borehole was deposited initially inanoxic conditions, which then became progressively more brack-ish before floodplain environments became established (Fig. 6).
With respect to individual marine bands, the geochemicalclassification scheme can also highlight lateral changes in depo-sitional settings. For instance, the Shafton MB encountered in theLittle Paddocks borehole is classified as marginal marine (Fig. 9),whereas the mudstone samples from the same marine band inThe Rowe borehole are classified as fully marine (Fig. 8, Table 2).In addition, the sample from the base of the above marine bandin the Little Paddocks borehole is classified as brackish/lacus-trine, whereas the overlying mudstone sample is classified asmarginal marine. These variations in the geochemistry and thick-ness of the Shafton MB show that this band, as penetrated by TheRowe borehole, was deposited by a marine flooding event into afloodplain area, whereas the same band encountered in the LittlePaddocks borehole was deposited by a similar event but into alagoonal environment.
High Fe2O3, MgO, MnO, and CaO levels are often recordedfrom samples associated with the marine bands, though similar
TIM J. PEARCE, DUNCAN MCLEAN, JOHN H. MARTIN, KEN RATCLIFFE, AND DAVID S. WRAY230
FIG
. 7.—
Geo
chem
ical
cha
ract
eris
tics
ass
ocia
ted
wit
h th
e m
arin
e ba
nds
in w
ell N
S-1.
231GEOCHEMICAL RECOGNITION AND CORRELATION OF MARINE BANDS
FIG. 8.—Geochemical characteristics associated with the marine bands in The Rowe borehole.
TABLE 1.—Criteria used to produce a weighted score from whole-rock geochemical data.
Parameter Criteria Score Rationale
U> 6 ppm< 6 ppm
41
average U levels in the study interval are c. 5,therefore 5 and over is high
Th/U> 3.0< 3.0
14
average Th/U values in the study interval arec. 2.0, therefore 2.0 and over is high
P2O5/Al2O3> 0.02< 0.02
41
average P2O5/Al2O3values in the studyinterval is 0.01, therefore 0.02 and over is
high
Mo/Al2O3> 0.08< 0.08
41
average Mo/Al2O3values in the study intervalare 0.06, therefore 0.08 and over is high*
Zr/U > 65 2 this score is added to compensate for heavymineral abundance**
*Mo is present in pyrite and amorphous organic matter, therefore Mo levels typically are very highin nearshore (marine) environments close to vegetated swamps (Coveney et al., 1991).
** Samples with high U and P2O5 levels may come from horizons containing exceptionallyabundant heavy minerals; these high element levels would lead to the samples being classifiedas “marine”. To compensate for this, Zr/U values are used to identify those samples containingabundant heavy minerals.
concentrations of these elements are found in the other mud-stones due to the presence of calcareous macrofossils (Lingula),siderite, ankerite, and ferroan calcite. Particularly high levels ofthese four elements are recorded from mudstones lying above theCMB in the Little Paddocks and Harts boreholes, the mudstonesprobably having been deposited during brackish-water/lacus-trine flooding events.
In well NS-1, low Th/U values and high levels of the metallicelements confirm the presence of the Edmondia and Aegiranummarine bands, whereas high levels for P2O5, Mo, and the metal-lic elements, e.g., Cu, indicate the occurrence of the Shafton MB(Fig. 7). Furthermore, the Edmondia MB is placed at 770 m, withthe 820 m sample being classified as a marine mudstone andthus could be from one of the minor marine bands such as either
TIM J. PEARCE, DUNCAN MCLEAN, JOHN H. MARTIN, KEN RATCLIFFE, AND DAVID S. WRAY232T
AB
LE 2
.—A
sum
mar
y th
e of
geo
chem
ical
and
pal
ynol
ogic
al fa
cies
cla
ssif
icat
ion
sche
me
for
the
silt
y cl
ayst
ones
from
the
Row
e B
oreh
ole.
Dep
th (
m)
Str
atig
rap
hic
al P
osi
tio
nS
core
Geo
chem
ical
Cla
ssif
icat
ion
Pla
nt
Det
ritu
sLingula
/ b
ival
ves
Fo
ram
sF
ish
Sca
les
Pal
yno
faci
es
803.
40S
hale
imm
edia
tely
abo
ve C
ambr
iens
e (B
ay)
MB
10m
argi
nal m
arin
eno
nono
no
803.
70a/
a10
mar
gina
l mar
ine
nono
nono
804.
50C
ambr
iens
e (B
ay)
MB
7br
acki
sh–l
acus
trin
eno
yes
nono
805.
20C
ambr
iens
e (B
ay)
MB
13m
arin
eno
yes
nono
mar
ine
817.
60S
hale
imm
edia
tely
abo
ve S
hafto
n (P
riors
field
) M
B4
flood
plai
nno
nono
no
818.
50S
hale
imm
edia
tely
abo
ve S
hafto
n (P
riors
field
) M
B4
flood
plai
nno
nono
no
819.
27S
hafto
n (P
riors
field
) M
B13
mar
ine
nono
nono
mar
ine
819.
30S
hafto
n (P
riors
field
) M
B10
mar
gina
l mar
ine
nono
nono
mar
ine
819.
40C
oal b
elow
Sha
fton
MB
0co
alno
nono
no
827.
107
brac
kish
–lac
ustr
ine
nono
noye
s
854.
00E
dmon
dia
(Row
hurs
t Rid
er)
MB
10m
argi
nal m
arin
eno
nono
no
854.
30E
dmon
dia
(Row
hurs
t Rid
er)
MB
10m
argi
nal m
arin
eno
noye
sno
854.
60E
dmon
dia
(Row
hurs
t Rid
er)
MB
10m
argi
nal m
arin
eno
noye
sno
?mar
ine
– br
acki
sh
855.
00E
dmon
dia
(Row
hurs
t Rid
er)
MB
10m
argi
nal m
arin
eno
nono
no
855.
00E
dmon
dia
(Row
hurs
t Rid
er)
MB
10m
argi
nal m
arin
eno
nono
no
855.
30E
dmon
dia
(Row
hurs
t Rid
er)
MB
10m
argi
nal m
arin
eno
nono
no
855.
90E
dmon
dia
(Row
hurs
t Rid
er)
MB
10m
argi
nal m
arin
eno
nono
no
856.
50E
dmon
dia
(Row
hurs
t Rid
er)
MB
10m
argi
nal m
arin
eno
noye
sno
856.
80E
dmon
dia
(Row
hurs
t Rid
er)
MB
16m
arin
eno
noye
sno
mar
ine
857.
00E
dmon
dia
(Row
hurs
t Rid
er)
MB
10m
argi
nal m
arin
eno
noye
sno
892.
10S
hale
abo
ve A
egira
num
(G
in M
ine)
MB
4flo
odpl
ain
yes
nono
no
892.
40a/
a4
flood
plai
nye
sno
nono
892.
70a/
a4
flood
plai
nno
nono
no
893.
00a/
a4
flood
plai
nno
nono
no
893.
30a/
a4
flood
plai
nye
sno
nono
893.
60a/
a4
flood
plai
nye
sno
nono
893.
90a/
a7
brac
kish
–lac
ustr
ine
yes
nono
no
894.
20a/
a7
brac
kish
–lac
ustr
ine
yes
nono
no
894.
85A
egira
num
(G
in M
ine)
MB
10m
argi
nal m
arin
eno
yes
yes
no
895.
20A
egira
num
(G
in M
ine)
MB
13m
arin
eye
sye
sye
sno
895.
50A
egira
num
(G
in M
ine)
MB
10m
argi
nal m
arin
eye
sye
sye
sno
895.
80A
egira
num
(G
in M
ine)
MB
13m
arin
eno
yes
yes
nom
arin
e
896.
10A
egira
num
(G
in M
ine)
MB
13m
arin
eno
yes
yes
nom
arin
e
896.
15A
egira
num
(G
in M
ine)
MB
13m
arin
eno
yes
yes
nom
arin
e
896.
45A
egira
num
(G
in M
ine)
MB
10m
argi
nal m
arin
eno
nono
no
896.
70A
egira
num
(G
in M
ine)
MB
10m
argi
nal m
arin
eno
nono
no
897.
00a/
a10
coal
nono
nono
899.
50S
hale
bet
wee
n S
utto
n (C
layt
on)
and
Aeg
.(G
in M
ine)
MB
s13
mar
ine
nono
nono
233GEOCHEMICAL RECOGNITION AND CORRELATION OF MARINE BANDS
TA
BL
E 2
(con
tinu
ed).—
Dep
th (
m)
Str
atig
rap
hic
al P
osi
tio
nS
core
Geo
chem
ical
Cla
ssif
icat
ion
Pla
nt
Det
ritu
sLingula
/ b
ival
ves
Fo
ram
sF
ish
Sca
les
Pal
yno
faci
es
921.
50S
hale
abo
ve H
augh
ton
(Doc
tors
Min
e) M
B4
flood
plai
nno
nono
no
921.
80a/
a10
mar
gina
l mar
ine
noye
sye
sno
?mar
ine
921.
90H
augh
ton
(Doc
tors
Min
e) M
B16
mar
ine
noye
sye
sno
mar
ine
922.
10a/
a4
flood
plai
nno
yes
yes
noflo
odpl
ain
924.
20S
hale
bel
ow D
octo
rs M
ine
Coa
l4
flood
plai
nno
nono
no
924.
80a/
a4
flood
plai
nno
nono
no
951.
50C
low
n (L
ongt
on H
all)
MB
7br
acki
sh–l
acus
trin
eno
nono
nola
cust
rine
952.
20C
low
n (L
ongt
on H
all)
MB
4flo
odpl
ain
nono
nono
flood
plai
n
952.
40C
low
n (L
ongt
on H
all)
MB
16m
arin
eno
nono
no
957.
00S
hale
bel
ow B
irche
nwoo
d C
oal
4flo
odpl
ain
yes
nono
no
961.
60a/
a7
brac
kish
–lac
ustr
ine
nono
nono
962.
00a/
a7
brac
kish
–lac
ustr
ine
noye
sno
no
968.
70S
hale
abo
ve M
oss
Coa
l7
brac
kish
–lac
ustr
ine
noye
sno
no
969.
00a/
a7
brac
kish
–lac
ustr
ine
noye
sno
nola
cust
rine
974.
50In
corr
ectly
sam
pled
as
Mal
tby
(Mos
s C
anne
l) M
B4
flood
plai
nno
yes
nono
975.
40a/
a4
flood
plai
nno
nono
noflo
odpl
ain
976.
60a/
a2
Flo
odpl
ain
heav
y m
in. l
agno
nono
no
976.
85a/
a7
brac
kish
–lac
ustr
ine
noye
sno
no
979.
304
flood
plai
nno
nono
no
993.
25S
hale
abo
ve F
ive-
Fee
t Coa
l4
flood
plai
nno
nono
noflo
odpl
ain
994.
00a/
a4
flood
plai
nno
nono
no
1041
.70
2nd
shal
e un
it ab
ove
Bel
lring
er C
oal
4flo
odpl
ain
yes
nono
yes
1049
.90
1st s
hale
uni
t abo
ve B
ellri
nger
Coa
l4
flood
plai
nno
nono
no
1068
.20
Sha
le u
nit a
bove
Ten
-Fee
t Coa
l4
flood
plai
nno
nono
no
1084
.40
2nd
shal
e un
it ab
ove
Bow
ling
Alle
y C
oal
7br
acki
sh–l
acus
trin
eno
yes
noye
s
1089
.00
1st s
hale
uni
t abo
ve B
owlin
g A
lley
Coa
l4
flood
plai
nno
yes
nono
1119
.30
2nd
shal
e un
it ab
ove
Har
d M
ine
Coa
l4
flood
plai
nno
yes
nono
1124
.00
1st s
hale
uni
t abo
ve H
ard
Min
e C
oal
4flo
odpl
ain
noye
sno
no
1147
.70
Sha
le a
bove
Van
derb
ecke
i (S
even
-Fee
t Ban
bury
) M
B7
brac
kish
–lac
ustr
ine
noye
sno
nola
cust
rine
1151
.65
Van
derb
ecke
i (S
even
-Fee
t Ban
bury
) M
B7
brac
kish
–lac
ustr
ine
noye
sno
no
1156
.65
Van
derb
ecke
i (S
even
-Fee
t Ban
bury
) M
B13
mar
ine
noye
sye
sye
sm
arin
e
1157
.05
Van
derb
ecke
i (S
even
-Fee
t Ban
bury
) M
B4
flood
plai
nno
noye
sno
1162
.23
Fla
tts C
oal (
top
of lo
wer
leaf
)0
coal
yes
yes
nono
1214
.60
2nd
shal
e un
it ab
ove
Coc
kshe
ad C
oal
7br
acki
sh–l
acus
trin
eno
nono
no
1217
.60
1st s
hale
uni
t abo
ve C
ocks
head
Coa
l7
Bra
ckis
h–la
cust
rine
noye
sno
no
1228
.00
Sha
le a
bove
unn
amed
coa
l (?L
odge
Roo
m C
oal)
7br
acki
sh–l
acus
trin
eno
yes
nono
1228
.60
a/a
7flo
odpl
ain
noye
sno
no
1229
.20
Lodg
e R
oom
Coa
l4
flood
plai
nno
nono
no
1229
.50
a/a
4flo
odpl
ain
nono
nono
1237
.00
Sha
le a
bove
Lim
ekiln
Coa
l4
flood
plai
nno
nono
no
1240
.30
Can
nelo
id m
udst
one
with
in L
imek
iln C
oal
4flo
odpl
ain
yes
nono
no
TIM J. PEARCE, DUNCAN MCLEAN, JOHN H. MARTIN, KEN RATCLIFFE, AND DAVID S. WRAY234
the Sutton or Haughton marine bands. Previous E-log interpre-tations have suggested that the Vanderbeckei MB is at 1003.55m, but the sample from this depth is not classified as a marinemudstone. However, the 990.6 m sample has high Mo/Al2O3and P2O5/Al2O3 levels, whereas the sample from 1018.03 m isclassified as a marine mudstone on the basis of a low Th/Uvalue, high U and P2O5 levels, and a moderately high Mo/Al2O3level. It is suggested that the Vanderbeckei MB lies at c. 990 mand the 1018.03 m sample corresponds to an older marine band.
Although marine mudstones can often be identified from justtheir color (Besly and Cleal, 1997), this study demonstrates thatsuch an approach is flawed, inasmuch as those geochemicallyclassified as marine mudstones exhibit a variety of colors. Forexample, mudstones from the Edmondia and Maltby marinebands are black (N1—from the Rock Color Chart), whereas thosefrom the Aegiranum MB are dark gray (N3) and the mudstonesfrom the Vanderbeckei, Shafton, and Cambriense marine bandsare medium gray (N5). Therefore, with respect to cuttings, theselective picking of black mudstone chips in preference to othercolors offers no confident guarantee that material from marinebands has been selected for geochemical analysis.
Integration of the Geochemical, Sedimentological,Microfossil, and Palynofacies Data
With reference to The Rowe and Little Paddocks boreholes, thegeochemical classification of the mudstones is supplemented bysedimentological data, palynofacies data, and information regard-ing flora, macrofossils, and microfossils. The marine bands corre-spond to laminated, dark gray to black mudstones that mostlyimmediately overlie coal seams. Core inspection reveals that thesemudstones are typically pyritic and rich in organic matter, withsome containing fish detritus, bivalves, and arenaceous foramin-ifera, though no goniatites were observed. There are instances,especially if macrofossils are absent, where core examination alonecannot differentiate between these different flooding events. Onethen needs to turn to palynology to achieve this. Table 2 lists theinterpreted palynofacies for the flooding events identified in theabove boreholes, and the criteria employed to discriminate thevarious palynofacies are as follows (McLean, 1995):
• Marine facies: in general, “typical” marine palynofacies indica-tors, e.g., abundant amorphous organic material, bleachedpalynomorphs, high numbers of Potonieisporites spp., rela-tively high numbers of hinterland forms sensu Davies and
McLean (1994), and striate and non-striate bisaccate gymno-sperm pollen, appear restricted to the lower parts of themarine bands. Distinct palynofacies variations are noted withinindividual marine bands, although they have not, as yet, beenstudied in detail.
• Brackish-water facies: the remains of scolecodonts, which arethe jaw apparatuses of brackish to marine annelid worms, arerelatively common in the marine band samples. Their pres-ence may signify deposition in brackish lacustrine settings.
• Freshwater facies: the relatively common occurrence of thefreshwater alga Botryococcus indicates that the depositionalenvironments had high water tables, with deposition occur-ring in either interdistributary-marsh or interdistributary-lake settings. Freshwater influences are recognized in some ofthe marine-band samples in this study, thus suggesting thatmarine flooding events invaded freshwater settings, thoughsometimes this makes positive discrimination between fresh-water and marine facies difficult.
• The abundance and distribution of fish detritus in the samplesare recorded, but high abundances of such detritus can occur inmudstones deposited in marine and freshwater environments.
Palynological assemblages were subjected to palynofaciesanalyses, i.e., subjective and not quantified, in order to generatepaleoenvironmental information that could be used to supple-ment the chemostratigraphical and sedimentological informa-tion relating to the two boreholes but not well NS-1. Conse-quently, certain strata have thus been identified as being of eithermarine or freshwater origin (Table 2, Fig. 10).
There is good correspondence between the placement ofmarine bands based on geochemical evidence and their recogni-tion using palynology (Fig. 11). In addition, Table 2 highlights theintervals classified geochemically as lacustrine or brackish water,floodplain, and vegetated swamp (= coal), and once again, thereis a strong correlation between these interpretations and thepalynofacies.
Where possible, any facies interpreted from geochemicalevidence should always be corroborated by sedimentologicaldata and palynofacies data. However, when dealing with cut-tings, inorganic geochemical data could be used, preferably incombination with palynological data (and along with E-log data),to interpret facies.
FIG. 9.—Geochemical characteristics associated with the marine bands in the Little Paddocks borehole.
235GEOCHEMICAL RECOGNITION AND CORRELATION OF MARINE BANDS
FIG. 10.—A comparison between the geochemical facies classification and palynological criteria for the recognition of marine bandsin relation to the Aegiranum MB in The Rowe borehole.
Chemostratigraphy and Correlation of Marine Bands
The study has demonstrated that geochemical data can lead tobetter recognition and correlation of the mudstones previouslydefined as solely “marine bands” occurring in the onshore UpperCarboniferous Coal Measures sequences of the West Midlands(UK). However, the approach utilized in this study can be appliedequally well to any coastal-plain to marginal-marine sedimen-tary rocks.
The recognition and correlation of marine transgressive de-posits, coals, and unconformities in paralic sequences of all agesare of vital importance to sequence stratigraphy (Flint et al., 1995;Bohacs and Suter, 1997, Hampson et al., 1997) Furthermore,Hampson et al. (1997) argue that coal-measures facies architec-ture is dependent on variations not only in the rate of sedimentsupply but also in the rate of change in accommodation space(Fig. 12) and put forward a detailed discussion on the applicationof sequence stratigraphy in paralic sequences, and the recogni-tion of sequence boundaries, incised-valley fills, and interfluves,along with the significance of coals and marine bands. In low-accommodation settings during development of lowstand sys-tems tracts (LSTs), incised valleys are developed abovesubregionally correlative sequence boundaries (SB), whereasmarshy areas develop as accommodation increases during devel-opment of a transgressive systems tract (TST). Marine bandsrepresent the periods of most condensed sedimentation and are
developed at the point of maximum rate of base-level rise (the Rinflection point, not at the eustatic sea-level highstand; Fig. 12).Flint et al. (1995) and Hampson et al. (1997) suggest that differ-ences in the lateral extent and faunal content (“marineness”) ofmarine bands, coupled with the amount of base-level rise, allowsa hierarchy of flooding surfaces, depending on whether themarine bands are either marginal marine or open marine inorigin. It is suggested that with further investigation the geo-chemical classification of marine-band facies into brackish/lacus-trine, marginal marine, and marine may provide a means todistinguish and improve the recognition hierarchy of marineband surfaces in a sequence stratigraphic context, especially insequences where only cuttings are available. For example, it isspeculated that marine bands in this study with high scores maycorrespond to true open-marine deposits equivalent to third- orfourth-order maximum-flooding events, whereas bands withmarginal marine and brackish or lacustrine scores may corre-spond to fifth-order parasequence flooding events.
CONCLUSIONS OF THE CASE STUDY
• Geochemical data from mudstones are used to differentiatebetween marine and nonmarine mudstones, thereby enablingtrue marine bands to be differentiated from shales with fea-tures such as high gamma values that do not represent aperiod of marine flooding.
TIM J. PEARCE, DUNCAN MCLEAN, JOHN H. MARTIN, KEN RATCLIFFE, AND DAVID S. WRAY236
FIG
. 11.
—C
hem
ostr
atig
raph
ic c
orre
lati
on o
f the
Coa
l Mea
sure
s se
ctio
ns c
ombi
ned
wit
h th
e co
rrel
atio
n of
the
mar
ine
band
s: T
he R
owe
and
Lit
tle
Pad
doc
ks b
oreh
oles
and
wel
l NS-
1.
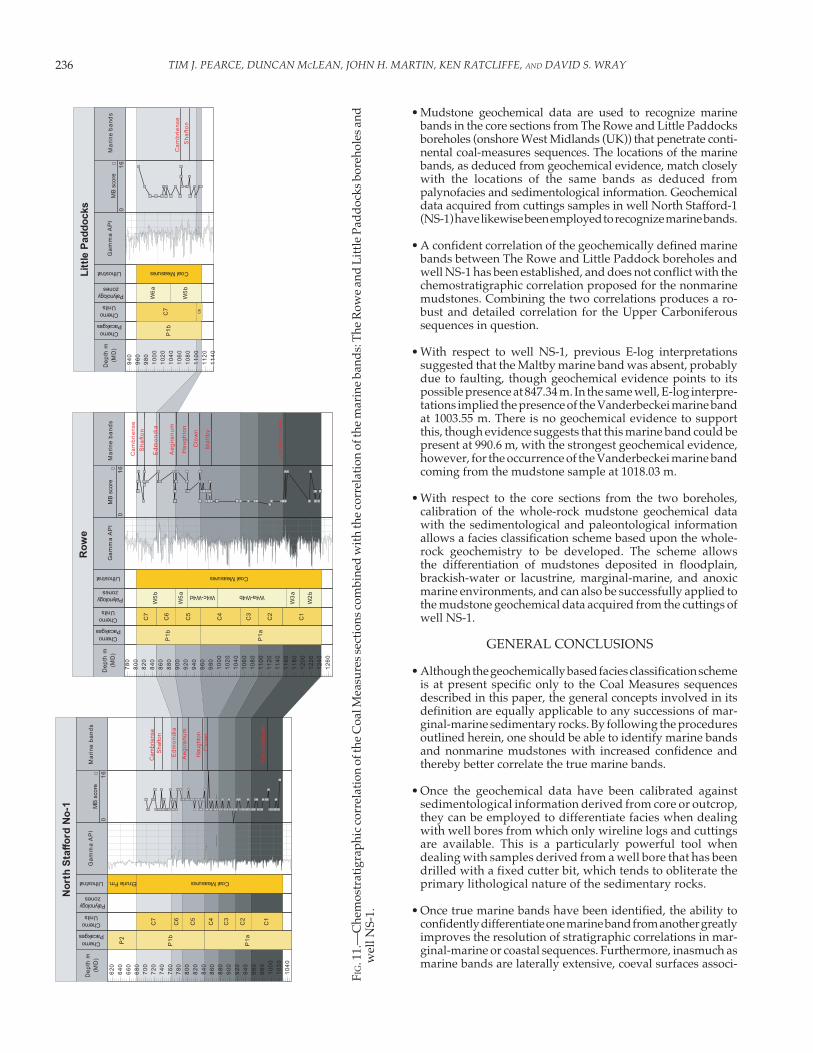
• Mudstone geochemical data are used to recognize marinebands in the core sections from The Rowe and Little Paddocksboreholes (onshore West Midlands (UK)) that penetrate conti-nental coal-measures sequences. The locations of the marinebands, as deduced from geochemical evidence, match closelywith the locations of the same bands as deduced frompalynofacies and sedimentological information. Geochemicaldata acquired from cuttings samples in well North Stafford-1(NS-1) have likewise been employed to recognize marine bands.
• A confident correlation of the geochemically defined marinebands between The Rowe and Little Paddock boreholes andwell NS-1 has been established, and does not conflict with thechemostratigraphic correlation proposed for the nonmarinemudstones. Combining the two correlations produces a ro-bust and detailed correlation for the Upper Carboniferoussequences in question.
• With respect to well NS-1, previous E-log interpretationssuggested that the Maltby marine band was absent, probablydue to faulting, though geochemical evidence points to itspossible presence at 847.34 m. In the same well, E-log interpre-tations implied the presence of the Vanderbeckei marine bandat 1003.55 m. There is no geochemical evidence to supportthis, though evidence suggests that this marine band could bepresent at 990.6 m, with the strongest geochemical evidence,however, for the occurrence of the Vanderbeckei marine bandcoming from the mudstone sample at 1018.03 m.
• With respect to the core sections from the two boreholes,calibration of the whole-rock mudstone geochemical datawith the sedimentological and paleontological informationallows a facies classification scheme based upon the whole-rock geochemistry to be developed. The scheme allowsthe differentiation of mudstones deposited in floodplain,brackish-water or lacustrine, marginal-marine, and anoxicmarine environments, and can also be successfully applied tothe mudstone geochemical data acquired from the cuttings ofwell NS-1.
GENERAL CONCLUSIONS
• Although the geochemically based facies classification schemeis at present specific only to the Coal Measures sequencesdescribed in this paper, the general concepts involved in itsdefinition are equally applicable to any successions of mar-ginal-marine sedimentary rocks. By following the proceduresoutlined herein, one should be able to identify marine bandsand nonmarine mudstones with increased confidence andthereby better correlate the true marine bands.
• Once the geochemical data have been calibrated againstsedimentological information derived from core or outcrop,they can be employed to differentiate facies when dealingwith well bores from which only wireline logs and cuttingsare available. This is a particularly powerful tool whendealing with samples derived from a well bore that has beendrilled with a fixed cutter bit, which tends to obliterate theprimary lithological nature of the sedimentary rocks.
• Once true marine bands have been identified, the ability toconfidently differentiate one marine band from another greatlyimproves the resolution of stratigraphic correlations in mar-ginal-marine or coastal sequences. Furthermore, inasmuch asmarine bands are laterally extensive, coeval surfaces associ-
237GEOCHEMICAL RECOGNITION AND CORRELATION OF MARINE BANDS
FIG. 12.—A basic accommodation envelope of an unconformity-bounded sequence (from Van Wagoner et al., 1990), and a conceptualsea-level curve showing the positions of systems tracts as a function of rate of creation and destruction of accommodation spacenecessary to preserve sediment (Flint et al., 1995). LST, lowstand systems tract; TST, transgressive systems tract; HST, highstandsystems tract; SB, sequence boundary; MFS, maximum flooding surface.
ated with eustatic fluctuations, their improved chemostrati-graphic correlation in sequences represented just by cuttingsstrengthens their role in the sequence stratigraphy of paralicsequences
ACKNOWLEDGMENTS
The authors wish to thank Nederlandse Aardolie MaatschappijB.V., plus their respective partners, for access to sample materialand for permission to publish the paper. The work of Lorna Dyer,Department of Earth Sciences, University of Greenwich, is greatlyappreciated. We are indebted to the incredible patience andendless support of the editors (Ken Ratcliffe and Brian Zaitlin) ofthis volume.
REFERENCES
ADAMS, J.A., AND WEAVER, P.A., 1958, Thorium to uranium ratios asindicators of sedimentary processes: Examples of concept of geochemi-cal facies: American Association of Petroleum Geologists, Bulletin, v.42, p. 387–430.
ARCHARD, G., AND TRICE, R.A., 1990, A preliminary investigation into thespectral radiation of the Upper Carboniferous marine bands: News-letters on Stratigraphy, v. 21, p. 167–173.
BESLY, B.M., AND CLEAL, C.J., 1997, Upper Carboniferous stratigraphy of theWest Midlands (UK) revised in the light of borehole geophysical logsand detrital composition suites: Geological Journal, v. 32, p. 85–118.
BOHACS, K.M., AND SUTER, J., 1997, Sequence stratigraphic distribution ofcoaly rocks: Fundamental controls and examples: American Associa-tion of Petroleum Geologists, Bulletin, v. 81, p. 1612–1639.
BOYD, R., DIESSEL, C., WADSWORTH, J., LECKIE, D., AND ZAITLIN, B.A., 2000,Developing a model for non-marine sequence stratigraphy—Appli-cation to the Western Canada Sedimentary Basin (abstract):GeoCanada 2000—The Millennium Geosciences Summit, Confer-ence Abstract.
COVENEY, R.M., WATNEY, W.L., AND MAPLES, C.G., 1991, Contrasting depo-sitional models for Pennsylvanian black shale discerned from molyb-denum abundances: Geology, v. 19, p. 147–150.
DAVIES, S., AND MCLEAN, D., 1996, Spectral gamma ray and palynologicalcharacterisation of Kinderscoutian marine bands in the Namurian ofthe Pennine Basin: Yorkshire Geological Society, Proceedings, v. 51,p. 103–114.
TIM J. PEARCE, DUNCAN MCLEAN, JOHN H. MARTIN, KEN RATCLIFFE, AND DAVID S. WRAY238
EAGER, R.M.C., CHISHOLM, J.I., VARKER J., AND WILLIAMSON, I.A., 1991, Anewly-discovered Coal Measures marine band in Billinge BeaconQuarry, Lancashire, and its stratigraphical significance: GeologicalJournal, v. 26, p. 203–208.
EHRENBERG, S.N., AND SIRING, E., 1992, Use of bulk chemical analysis instratigraphic correlation of sandstones: an example from the Statfjordfield, Norwegian continental shelf: Journal of Sedimentary Petrology,v. 62, p. 318–330.
FLINT, S., AITKEN, J., AND HAMPSON, G.J., 1995, Application of sequencestratigraphy to coal-bearing coastal plain successions: implicationsfor the UK Coal Measures, in Whateley, M.K.G., and Spears, D.A.,eds., European Coal Geology: Geological Society of London, SpecialPublication 82, p. 1–16.
HAMPSON, G.J., ELLIOT, T., AND DAVIES, S.J., 1997, The application of se-quence stratigraphy to Upper Carboniferous fluvio-deltaic strata ofthe onshore UK and Ireland: implications for the southern North Sea:Geological Society of London, Journal, v. 154, p. 719–733.
HOLLYWOOD, J.M., AND WHORLOW, C.V., 1993, Structural development andhydrocarbon occurrence of the Carboniferous in the UK SouthernNorth Sea Basin, in Parker, J.R., ed., Petroleum Geology of NorthwestEurope: Proceedings of the Fourth Conference: Geological Society ofLondon, p. 689–696.
JARVIS, I., AND JARVIS, K.E., 1992, Plasma spectrometry in Earth Sciences:techniques, applications and future trends: Chemical Geology, v. 95,p. 1–33.
LEEDER, M.R., RAISWELL, R., AL-BIATTY, H., MCMAHON, A., AND HARDMANN,M., 1990, Carboniferous stratigraphy, sedimentation and correla-tion of well 48/3-3 in the southern North Sea Basin: integrated useof palynology, natural gamma/sonic logs and carbon/sulfurgeochemistry: Geological Society of London, Journal, v. 147, p. 287–300.
MCLEAN, D., 1995, Provenance of reworked palynomorphs from theGreenmoor Rock (Langsettian, late Carboniferous) near Sheffield,England: Review of Palaeobotany and Palynology, v. 89, p. 305–317.
MCLEAN, D., AND DAVIES, S.J., 1999, Constraints on the application ofpalynology to the correlation of Euramerican Late Carboniferousclastic hydrocarbon reservoirs, in Jones, R.W., and Simmons, M.D.,eds., Geological Society of London, Special Publication 152, p. 201–218.
MCLEAN, D., AND MURRAY, I., 1996, Subsurface correlation of Carbonifer-ous coal seams and inter-seam sediments using palynology: applica-tion to exploration for coalbed methane, in Gayer, R., ed., CoalbedMethane and Coal Geology: Geological Society of London, SpecialPublication 109, p. 315–324.
O’MARA, P.T., AND TURNER, B.R., 1997, Westphalian B marine bands andtheir subsurface recognition using gamma-ray spectrometry: York-shire Geological Society, Proceedings, p. 307–316.
OWEN, L.A., 1988, The palaeontology and geochemistry of the Gastriocerascancellatum marine band, on the Glyn Neath Bank, north crop of theSouth Wales Coalfield: Mercian Geologist, v. 11, p. 161–170
PEARCE, T.J., BESLY, B.M., WRAY, D., AND WRIGHT, D.K., 1999, Chemo-stratigraphy: a method to improve interwell correlation in barrensequences—a case study using onshore Duckmantian/Stephaniansequences (West Midlands, U.K.): Sedimentary Geology, v. 124, p.197–220.
PEARCE, T.J., MCLEAN, D., WRIGHT, D.K., JEANS C.J., AND Mearns, E.W.,2005a, Stratigraphy of the Upper Carboniferous Schooner Formation,southern North Sea: chemostratigraphy, mineralogy, palynology andSm-Nd isotope analysis, in Collinson, J.D., Evans, D.J., Holliday,D.W., and Jones, N.S., eds., Carboniferous Hydrocarbon Geology:The Southern North Sea and Surrounding Onshore Areas: YorkshireGeological Society, Occasional Publications Series no. 7, p. 165–182.
PEARCE, T.J., WRAY, D.S., RATCLIFFE, K.T., WRIGHT, D.K., AND MOSCARIELLO,A., 2005b, Chemostratigraphy of the Upper Carboniferous Schoo-ner Formation, southern North Sea, in Collinson, J.D., Evans, D.J.,
Holliday, D.W., and Jones, N.S., eds., Carboniferous HydrocarbonGeology: The Southern North Sea and Surrounding Onshore Areas:Yorkshire Geological Society, Occasional Publications Series no. 7,p. 47–164.
RACEY, A., LOVE, M.A., BOBOLECKI, R.M., AND WALSH, J.N., 1995, The use ofchemical element analysis in the study of biostratigraphically barrensequences: an example from the Triassic of the central North Sea(UKCS), in Dunay, R.E., and Hailwood, E.A., eds., Non-Biostrati-graphical Methods of Dating and Correlation: Geological Society ofLondon, Special Publication 89, p. 69–105.
RAMSBOTTOM, W.H.C., 1977, Major cycles of transgression and regression(mesotherms) in the Namurian: Yorkshire Geological Society, Pro-ceedings, v. 41, p. 261–291.
RAMSBOTTOM, W.H.C., 1978, Namurian mesotherms in South Wales andnorthern France: Geological Society of London, Journal, v. 135, p. 307–312.
RAMSBOTTOM, W.H.C., CALVER, C.J., EAGER, R.M.C., HODSON, F., HOLLIDAY,D.W., STUBBLEFIELD, C.J., AND WILSON, R.B., 1978, A correlation ofSilesian rocks in the British Isles: Geological Society of London,Special Report 10, 81 p.
RATCLIFFE, K.T., WRIGHT, A.M., HALLSWORTH, C., MORTON, A., ZAITLIN, B.A.,POTOCKI, D., AND WRAY, D.S., 2004, Alternative correlation techniquesin the petroleum industry: an example from the (Lower Cretaceous)Basal Quartz, Southern Alberta: American Association of PetroleumGeologists, Bulletin, v. 88, p. 1419–1432.
RATCLIFFE, K.T., HUGHES, A.D., LAWTON, D.E., WRAY, D.S., BESSA, F., PEARCE,T.J., AND MARTIN, J., 2006, A regional chemostratigraphically-definedcorrelation framework for the late Triassic TAG-I in Blocks 402 and405a, Algeria: Petroleum Geoscience, v. 12, p. 3–12
RATCLIFFE, K.T., MORTON, A., RITCEY, D., AND EVENCHICK, C.E., 2008, Wholerock geochemistry and heavy mineral analysis as exploration tools inthe Bowser and Sustut Basins, British Columbia, Canada: Bulletin ofCanadian Petroleum Geology, v. 55, p. 320–337.
SMITH, A.H.V., AND BUTTERWORTH, M.A., 1967, Miospores in the coal seamsof the Carboniferous of Great Britain: The Palaeontological Associa-tion, Special Papers in Palaeontology, v. 1, 324 p.
SPEARS, D.A., AND RICE, C.M., 1973, An Upper Carboniferous tonstein ofvolcanic origin: Sedimentology, v. 20, p. 281–294.
VAN WAGONER, J.C., MITCHUM, R.M., CAMPION, K.M., AND RAHMANIAN, V.D.,1990, Siliciclastic Sequence Stratigraphy in Well Logs, Cores, andOutcrops: American Association of Petroleum Geologists, Methodsin Exploration, no. 7, p. 55 p.
WILDE, P., LYONS, T.W., AND QUIMBY-HUNT, M.S., 2004, Organic carbonproxies in black shales: Molybdenum: Chemical Geology, v. 206, p.167–176.
WILSON, A.A., AND CHISHOLM, J.I., 2004, Reference sections of faunal bandsin the lower Coal Measures Formation at Elland, west Yorkshire, UK:Yorkshire Geological Society, Proceedings, v. 55, p. 21–32.
WILSON, R.M., 1980, A goniatite from the Mill Hill Marine Band, LowerLimestone Group, of East Fife: Scottish Journal of Geology, v. 16, p.33–34.
WRAY, D.S., 1999, Identification and long-range correlation of bentonitesin Turonian–Coniacian (Upper Cretaceous) chalks of northwest Eu-rope: Geological Magazine, v. 136, p. 361–371.


![Geochemical Study of Oil Shales Sargelo Formation in Kuh-e ... · Basin with special attention to geochemistry of source rock [21]. Ala et al. (1980) also studied organic geochemical](https://static.documents.pub/doc/80x56/5f19f9b4b70345531231d716/geochemical-study-of-oil-shales-sargelo-formation-in-kuh-e-basin-with-special.jpg)


