USDA Forest Service Proceedings RMRS-P-41. 2006. 149 In: Andrews, Patricia L.; Butler, Bret W., comps. 2006. Fuels Management—How to Measure Success: Conference Proceedings. 28-30 March 2006; Portland, OR. Proceedings RMRS-P-41. Fort Collins, CO: U.S. Department of Agriculture, Forest Service, Rocky Mountain Research Station. 1 Operations Research Analyst with USDA Forest Service, Pacific Northwest Research Station, La Grande, OR, currently stationed at the Western Wildlands Environmental Threat Center in Prineville, OR. [email protected]. 2 Research forester, USDA Forest Service, Rocky Mountain Research Station, Missoula, MT. 3 Research Ecologist, ITX Inc, Forest Health Technology Enterprise Team, Fort Collins, CO. Abstract—Despite a wealth of literature and models concerning wildfire risk, field units in Federal land management agencies lack a clear framework and operational tools to measure how risk might change from proposed fuel treatments. In an actuarial context, risk is defined as the expected value change from a fire, calculated as the product of (1) probability of a fire at a specific intensity and location, and (2) the resulting change financial or ecological value. The expected value definition accounts for landscape- scale wildfire spread, intensity, and damage in a single measure, providing a relatively robust metric for comparing the effects of fuel treatment scenarios. New advances in calculating burn probabilities and recent work on resource valuation has set the stage for actuarial risk analysis in fuels treatment planning. To demonstrate this approach, we estimated expected net value change on 16,000 ha wildland-urban interface using 12 fuel treatment scenarios and four hypothetical value schemes. Burn probabilities were estimated by simulating 200 randomly-ignited wildfires. The results showed a non- linear response in expected value with increasing treatment area. Fuels treatments on a relatively minor percentage of the landscape (20%) resulted in 20% to 50% increases in expected net value for most scenarios. The modeling advances the application of actuarial science to wildfire risk management and fuels treatment planning Introduction Despite an overwhelming literature concerning wildfi re risk, field units in the federal land management agencies lack a clear framework and the appro- priate risk assessment tools for prioritizing and measuring the effectiveness of proposed fuel treatment projects. It has been suggested that the lack of risk assessment tools has led to short term, risk-averse management that has perhaps exacerbated longer term risks from natural disturbances (Irwin and Wigley 2005). With few exceptions, existing wildfire risk systems are not well founded in the actuarial sciences. None we know of model the interactions among landscape-scale wildfi re spread, fi re intensity, and wildfi re effects on the net value of resources. The actuarial defi nition of wildfi re risk is the expected net value change calculated as the product of (1) probability of a fi re at a specific intensity and location, and (2) the resulting change in fi nancial or ecological value (e.g., Bachmann and Allgöwer 2001; Brillinger 2003; Finney 2005). The net value change can include both present and future discounted values. Assumptions about the effects of wildfi re suppression on wildfi re probability and value change can also be incorporated into the expected net value change equation. The process of wildfi re risk assessment is concerned with changes in expected loss in response to fuel treatments, structure improvements, and assumptions about fi re weather and suppression capabilities. A Wildfire Risk Modeling System for Evaluating Landscape Fuel Treatment Strategies Alan Ager 1 , Mark Finney 2 , and Andrew McMahan 3
Transcript
USDA Forest Service Proceedings RMRS-P-41. 2006. 149
In: Andrews, Patricia L.; Butler, Bret W., comps. 2006. Fuels Management—How to Measure Success: Conference Proceedings. 28-30 March 2006; Portland, OR. Proceedings RMRS-P-41. Fort Collins, CO: U.S. Department of Agriculture, Forest Service, Rocky Mountain Research Station.
1 Operations Research Analyst with USDA Forest Service, Pacifi c Northwest Research Station, La Grande, OR, currently stationed at the Western Wildlands Environmental Threat Center in Prineville, OR. [email protected].
2 Research forester, USDA Forest Service, Rocky Mountain Research Station, Missoula, MT.
3 Research Ecologist, ITX Inc, Forest Health Technology Enterprise Team, Fort Collins, CO.
Abstract—Despite a wealth of literature and models concerning wildfi re risk, fi eld units in Federal land management agencies lack a clear framework and operational tools to measure how risk might change from proposed fuel treatments. In an actuarial context, risk is defi ned as the expected value change from a fi re, calculated as the product of (1) probability of a fi re at a specifi c intensity and location, and (2) the resulting change fi nancial or ecological value. The expected value defi nition accounts for landscape-scale wildfi re spread, intensity, and damage in a single measure, providing a relatively robust metric for comparing the effects of fuel treatment scenarios. New advances in calculating burn probabilities and recent work on resource valuation has set the stage for actuarial risk analysis in fuels treatment planning. To demonstrate this approach, we estimated expected net value change on 16,000 ha wildland-urban interface using 12 fuel treatment scenarios and four hypothetical value schemes. Burn probabilities were estimated by simulating 200 randomly-ignited wildfi res. The results showed a non- linear response in expected value with increasing treatment area. Fuels treatments on a relatively minor percentage of the landscape (20%) resulted in 20% to 50% increases in expected net value for most scenarios. The modeling advances the application of actuarial science to wildfi re risk management and fuels treatment planning
Introduction
Despite an overwhelming literature concerning wildfi re risk, fi eld units in the federal land management agencies lack a clear framework and the appro-priate risk assessment tools for prioritizing and measuring the effectiveness of proposed fuel treatment projects. It has been suggested that the lack of risk assessment tools has led to short term, risk-averse management that has perhaps exacerbated longer term risks from natural disturbances (Irwin and Wigley 2005). With few exceptions, existing wildfi re risk systems are not well founded in the actuarial sciences. None we know of model the interactions among landscape-scale wildfi re spread, fi re intensity, and wildfi re effects on the net value of resources. The actuarial defi nition of wildfi re risk is the expected net value change calculated as the product of (1) probability of a fi re at a specifi c intensity and location, and (2) the resulting change in fi nancial or ecological value (e.g., Bachmann and Allgöwer 2001; Brillinger 2003; Finney 2005). The net value change can include both present and future discounted values. Assumptions about the effects of wildfi re suppression on wildfi re probability and value change can also be incorporated into the expected net value change equation. The process of wildfi re risk assessment is concerned with changes in expected loss in response to fuel treatments, structure improvements, and assumptions about fi re weather and suppression capabilities.
A Wildfi re Risk Modeling System for Evaluating Landscape Fuel Treatment Strategies
Alan Ager1, Mark Finney2, and Andrew McMahan3
150 USDA Forest Service Proceedings RMRS-P-41. 2006.
Ager, Finney, and McMahan A Wildfi re Risk Modeling System for Evaluating Landscape Fuel Treatments Strategies
Major advances in the spatial modeling of burn probabilities (e.g. Finney 2005; Miller and Parsons 2005; Parisien and others 2005) has set the stage for rapid improvements in tools and methods for wildfi re risk assessments. Extensive work on resource valuation and ecosystem services has also provided many frameworks for valuing resources in the expected loss equation (Calkin and Hummel 2005; Calkin and others 2005; Rideout and Ziesler 2005). We believe that a risk assessment model for fuels treatment planning is now within our grasp, and such a model would signifi cantly improve our ability to measure the performance of fuel treatments over existing methods, especially those that do not consider fuel contagion (Parisien and others 2005). Even simplistic valuation schemes that weight key resources such as homes, wildlife habitat, visual areas, combined with coarse estimates of burn probabilities would provide far more robust measures for comparing fuel treatment options compared to existing methods often used by fi eld units.
In this paper we describe a wildfi re risk model based on established concepts and defi nitions of risk from the actuarial sciences. The modeling approach was designed to be compatible with project level application on federal lands in terms of resolution and data requirements. The system estimates expected change in net value considering wildfi re spread, intensity, and the effects of fi re on resources of concern. We tested the model on a 16,000 ha wildland-urban interface in eastern Oregon, USA, using several hypothetical valuation schemes. We report our initial fi ndings here and discuss further work towards an operational risk model for fuels treatment planning.
Materials and Methods
Study Area and DataThe Mt. Emily wildland urban interface extends 30 km along a north-
south ridge immediately north of La Grande, Oregon, where the forested slopes of Mt. Emily and adjacent ridges descend to the agricultural lands in the Grande Ronde Valley. For analysis purposes, a boundary was established around the area using major drainages and natural breaks in vegetation, and the area within contained 16,296 ha of federal, state, and privately owned lands. About 12,471 ha within the study area are classifi ed as forested lands based on inventory data. Approximately 9,432 ha are managed by the U.S. Department of Agriculture, Forest Service. The forest composition ranges from dry forests of ponderosa pine (Pinus ponderosa), cold forests dominated by subalpine-fi r (Abies lasiocarpa) and Engelmann spruce (Picea engelman-nii), and a transition zone containing grand fi r (Abies grandis), Douglas-fi r (Pseudotsuga menziesii), and western larch (Larix occidentalis). Surface fuel loadings exceed 140 metric tons/ha in some areas, with high loading of dead ladder fuels in a large number of the stands (Wallace 2003). Fuel accumulations accelerated after the 1980-1986 Western spruce budworm (Choristoneura occidentalis) epidemic. Vegetation and surface fuels data ac-quisition was accomplished in concert with a fuels reduction project on the La Grande Ranger District and have been described in detail elsewhere (Ager and others 2005; Wallace 2003).
Modeling OverviewWe used a three step modeling process that involved: (1) Simulating landscape
fuel treatment scenarios with the Forest Vegetation Simulator linked to the Parallel
USDA Forest Service Proceedings RMRS-P-41. 2006. 151
A Wildfi re Risk Modeling System for Evaluating Landscape Fuel Treatments Strategies Ager, Finney, and McMahan
Processing Extension (PPE, Crookston and Stage 1991), (2) Calculating fi re spread parameters (elliptical dimensions) with FlamMap, and (3) simulating random fi res and net value change with the mechanistic fi re spread program RANDIG (devel-oped by M. Finney). We integrated the fi rst two steps into ArcGIS using Visual Basic scripts (Pattison 1998) and the ArcObjects library (Chang 2004) to facilitate the design and simulation of fuel treatment scenarios. Step three involved batch processing landscapes with the RANDIG program.
Simulating Fuel Treatment ScenariosWe simulated fuel treatments using the Blue Mountains variant of the PPE
and the Fire and Fuels Extension (FFE, Reinhardt and Crookston 2003). PPE simulates multiple stands in a parallel fashion, i.e., the simulation is com-pleted for all stands each time period before cycling to the next time period. PPE can model multiple, spatially explicit treatment constraints and priori-ties at the stand scale for a given landscape (Crookston and Stage 1991). We simulated 12 treatment scenarios by combining six treatment intensities with two treatment priorities. Treatment intensities were created by constraining the total treatment area to 0, 10, 20, 30, 40, and 66 percent of the forested lands. The 66 percent constraint represents treating every overstocked stand in the landscape (Ager and others 2005). The treatment priorities were based on stand density index (SDENS) and residential density (RDENS). SDENS chose stands for treatment based on their level of overstocking as defi ned by the current SDI relative to the site potential (Cochran and others 1994). RDENS prioritized stands based on the spatial density of homes in the sur-rounding area. Residential density (residences/km2) was calculated from a point layer of homes obtained from the Oregon Department of Forestry us-ing a kernel density estimator with a 2 km search radius. Each stand polygon was assigned the average residential density of the pixels within the polygon. In the RDENS scenario, stands were also required to meet the same stand density as in the SDENS scenario.
Fuel Treatment PrescriptionsThe fuels treatment prescription consisted of selective thinning, site re-
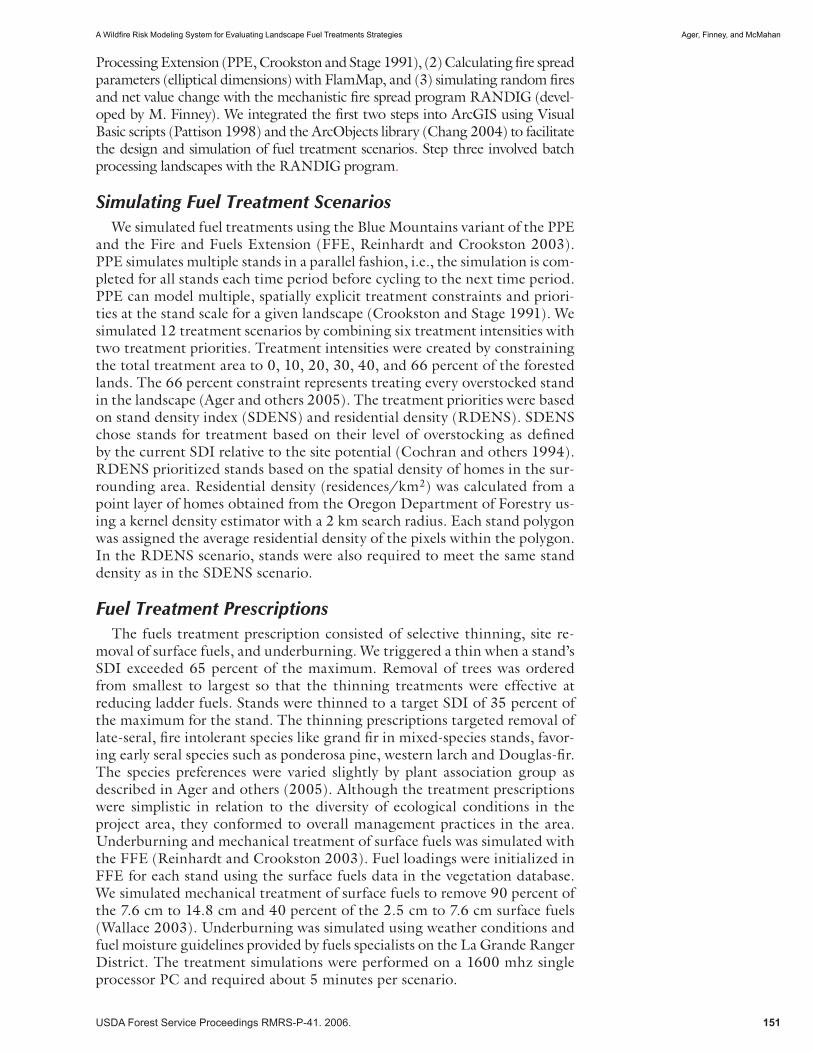
moval of surface fuels, and underburning. We triggered a thin when a stand’s SDI exceeded 65 percent of the maximum. Removal of trees was ordered from smallest to largest so that the thinning treatments were effective at reducing ladder fuels. Stands were thinned to a target SDI of 35 percent of the maximum for the stand. The thinning prescriptions targeted removal of late-seral, fi re intolerant species like grand fi r in mixed-species stands, favor-ing early seral species such as ponderosa pine, western larch and Douglas-fi r. The species preferences were varied slightly by plant association group as described in Ager and others (2005). Although the treatment prescriptions were simplistic in relation to the diversity of ecological conditions in the project area, they conformed to overall management practices in the area. Underburning and mechanical treatment of surface fuels was simulated with the FFE (Reinhardt and Crookston 2003). Fuel loadings were initialized in FFE for each stand using the surface fuels data in the vegetation database. We simulated mechanical treatment of surface fuels to remove 90 percent of the 7.6 cm to 14.8 cm and 40 percent of the 2.5 cm to 7.6 cm surface fuels (Wallace 2003). Underburning was simulated using weather conditions and fuel moisture guidelines provided by fuels specialists on the La Grande Ranger District. The treatment simulations were performed on a 1600 mhz single processor PC and required about 5 minutes per scenario.
152 USDA Forest Service Proceedings RMRS-P-41. 2006.
Ager, Finney, and McMahan A Wildfi re Risk Modeling System for Evaluating Landscape Fuel Treatments Strategies
FVS database outputs (Crookston and other 2006) for crown bulk density (kg/m2), height to live crown (ft), total height (ft), canopy closure (percent), fl ame length, and crown fi re activity were examined to quantify the effects of the treatments on stand structure. For space considerations those results are omitted from the present paper. We converted the databases to FlamMap landscape fi les using Visual Basic scripts (Ager 2005). After fi nding problems with the post thinning, FFE fuel model selection logic, we overrode the FFE fuel model selection on treated stands and, based on expected fi re spread rates and behavior for the treated stands, assigned them to fuel model 181 (Scott and Burgan 2005). This assignment was based on expected fi re spread rates in the post-treated stands.
Wildfi re SimulationsFor each management scenario, wildfi re spread parameters (elliptical dimen-
sions, Finney 2002) for each 30 x 30 pixel in the study area were calculated with a command line version of FlamMap (M. Finney). A fi xed set of weather conditions and fuel moistures were used to represent 97th percentile weather conditions generated from local RAWS weather stations (Ager and others 2005; Bradshaw and McCormick 2000). The spread parameters for each 30 x 30 m pixel were then used as input for the RANDIG.fi re simulation program. RANDIG simulates fi re spread using the minimum travel time methods (Finney 2002) and inputs on wind, fuel moisture and topography. We used RANDIG to simulate 200 random ignitions for each of the 12 fuel treatment scenarios. The number of ignitions was chosen after preliminary runs showed that burn probability estimates rapidly stabilized at this value, which is similar to the fi ndings of Parisien and others (2005 fi g. 16). The dura-tion of each fi re was determined using a Monte Carlo approach that sampled a frequency distribution of spread event days developed from a database of recorded fi res on the Umatilla National Forest from 1970 to 2005 (data on fi le, Umatilla National Forest). We simulated a range of wildfi re burn periods with FlamMap for the study area, and then assigned a burn period value to each fi re in the database by matching it to a FlamMap simulated fi re with similar size. We recognize a number of assumptions and limitations in this approach, although alternative methods are not readily available.
Calculating RiskUsing the defi nition of risk as the expected net value change, we incorporated
risk calculations into the RANDIG program with the following process. We created four pairs of landscape value grids (30 x 30 m), each pair containing data on the potential positive and negative impacts from wildfi re (table 1), and representing a particular valuation scenario. Loss functions were then created for each valuation scenario that defi ned proportional changes in value for different fl ame lengths (table 1). RANDIG was then modifi ed to tally the value change at each pixel for each simulated wildfi re and report the net change at the end of simulation (200 fi res per scenario). It is important to note that the loss functions and value layers were purely hypothetical and created for the purpose of demonstrating the utility of the wildfi re risk approach in the current study area. The fi rst valuation scenario (FX) assumed a fi xed value of $500 per ha, and the loss function specifi ed a loss directly proportional to fl ame length (table 1). The scenario was included to demonstrate a simple method to incorporate both fi re intensity and spread in measuring landscape effects of fuel treatment scenarios. The second valuation scenario was developed using home locations. We assigned a fi xed value of $200,000 to each of the 176 homes in the WUI and then smoothed the point data using a kernel density
USDA Forest Service Proceedings RMRS-P-41. 2006. 153
A Wildfi re Risk Modeling System for Evaluating Landscape Fuel Treatments Strategies Ager, Finney, and McMahan
f unction with a search radius of 200 m to generate a smooth grid of home values. The goal was to represent the value of individual homes on a number of pixels to refl ect the uncertainty in the modeling about loss from direct ignition, and the fact that signifi cant value in the rural residences exists around the main structure. Each residence was represented by 125 pixels having a maximum and minimum value of about $2000 and $8,000 respectively. A loss function was then created that as-sumed linear damage with increasing fl ame length (table 1). No benefi ts from fi re were assumed in this scenario. Again, the scenario was purely hypothetical and built to demonstrate the utility of the risk system. A third valuation scenario assumed that fl ame lengths under 1.2 m (4 ft.) constituted a fuels treatment, and generated a positive value of $350/ha. Negative values were not included in this scenario. A fourth scenario (RES+WB) combined portions of the third and second scenarios to consider both the loss of residences at fl ame lengths > 1.2 m, and the benefi ts of low intensity fi re when fl ame length was less than 1.2 m.
Within each simulated fi re, the fl ame length at each pixel was used to cal-culate the net value change using a loss function. The loss function translated fl ame length into an expected change in value expressed as a proportion. We simulated 200 wildfi res for each combination of management intensity, treatment priority, and valuation scheme, for a total of 9,600 fi res. For dem-onstration purposes we ignored a number of important factors including the cost of fi re suppression and fuel treatments, and revenues from harvests. These factors will be considered in future work
Results
Burn ProbabilitiesBurn probability (BP) and average wildfi re size decreased linearly with
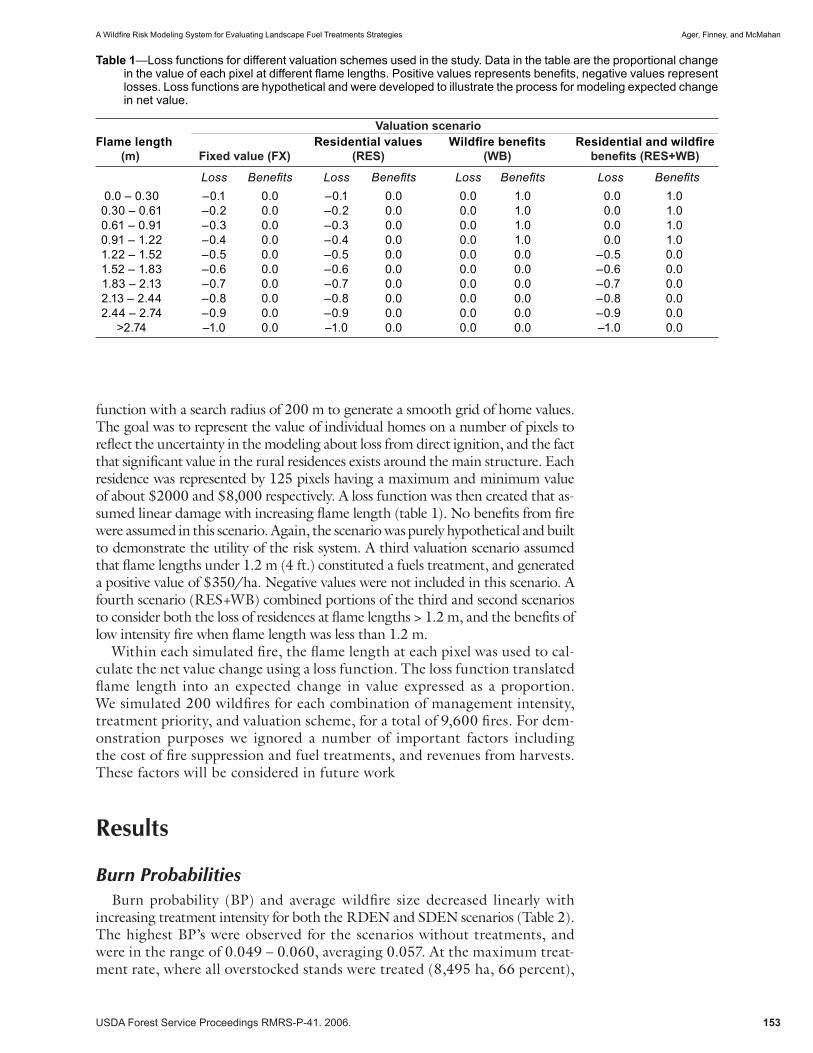
increasing treatment intensity for both the RDEN and SDEN scenarios (Table 2). The highest BP’s were observed for the scenarios without treatments, and were in the range of 0.049 – 0.060, averaging 0.057. At the maximum treat-ment rate, where all overstocked stands were treated (8,495 ha, 66 percent),
Table 1—Loss functions for different valuation schemes used in the study. Data in the table are the proportional change in the value of each pixel at different fl ame lengths. Positive values represents benefi ts, negative values represent losses. Loss functions are hypothetical and were developed to illustrate the process for modeling expected change in net value.
Valuation scenario Flame length Residential values Wildfi re benefi ts Residential and wildfi re (m) Fixed value (FX) (RES) (WB) benefi ts (RES+WB)
Loss Benefi ts Loss Benefi ts Loss Benefi ts Loss Benefi ts
154 USDA Forest Service Proceedings RMRS-P-41. 2006.
Ager, Finney, and McMahan A Wildfi re Risk Modeling System for Evaluating Landscape Fuel Treatments Strategies
average BP was reduced to 0.016 for the RDEN and 0.017 for the SDEN management scenarios. Thus, treating every overstocked stand reduces the average probability of a 30 x 30 m pixel burning by 0.04. The BP estimates varied only slightly among the four different simulations for each scenario with the range averaging 0.0043. Considerable spatial variation in BP was observed, with the largest values (0.22) along the eastern edge in the middle of the study area. This same area also showed the largest reduction in BP from the thinning treatments. For instance, BP was reduced from 0.22 to 0.07 between the no treatment and treating 66 percent of the landscape us-ing the SDEN treatment priority.
Average Wildfi re SizeWildfi re sizes in the 9600 simulations (12 management scenarios by 4
valuation schemes x 200 fi res) ranged from 1 to 5,600 ha. Average wildfi re size decreased linearly with increasing treatment at the rate of about 0.07 ha per ha treated for both the RDEN and SDEN (table 2). Thus, for every 100 ha treated, the average wildfi re on the entire study area was reduced by 6 ha. On a proportional basis, treating 20% of the landscape (3,255 ha) reduced the average wildfi re size by about 34%. Differences among the spatial treatment scenarios (RDEN, SDEN) in terms of wildfi re size were minor.
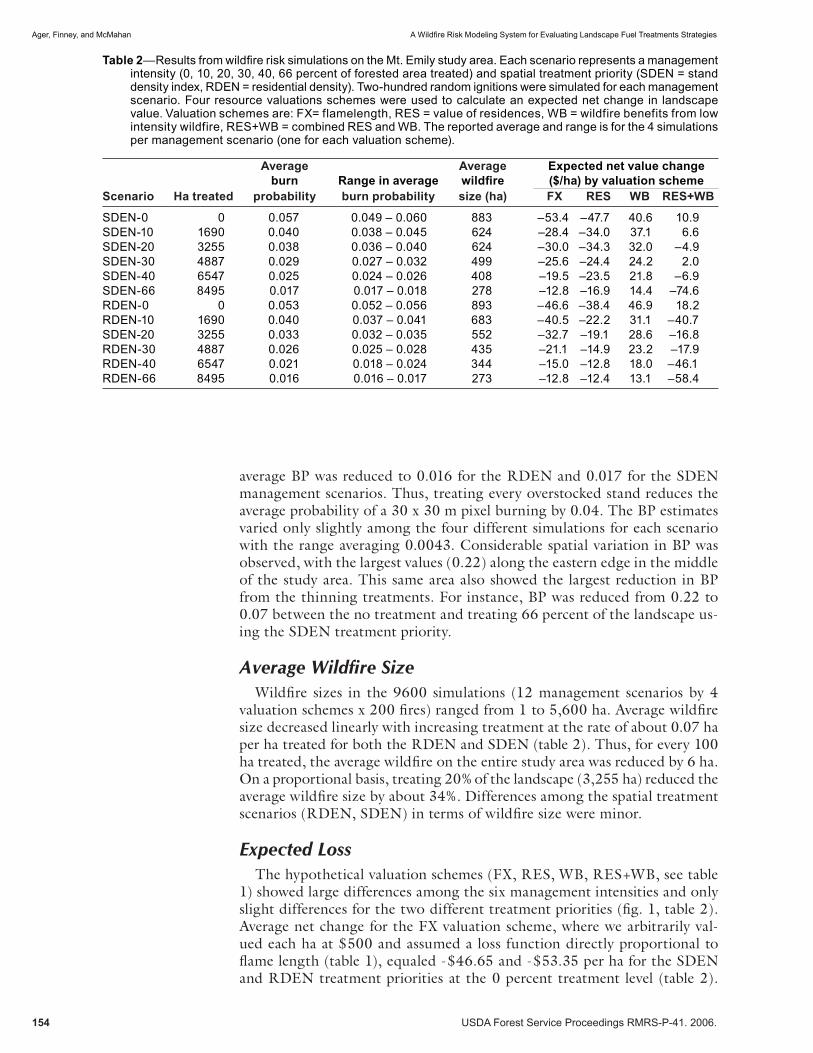
1) showed large differences among the six management intensities and only slight differences for the two different treatment priorities (fi g. 1, table 2). Average net change for the FX valuation scheme, where we arbitrarily val-ued each ha at $500 and assumed a loss function directly proportional to fl ame length (table 1), equaled -$46.65 and -$53.35 per ha for the SDEN and RDEN treatment priorities at the 0 percent treatment level (table 2).
Table 2—Results from wildfi re risk simulations on the Mt. Emily study area. Each scenario represents a management intensity (0, 10, 20, 30, 40, 66 percent of forested area treated) and spatial treatment priority (SDEN = stand density index, RDEN = residential density). Two-hundred random ignitions were simulated for each management scenario. Four resource valuations schemes were used to calculate an expected net change in landscape value. Valuation schemes are: FX= flamelength, RES = value of residences, WB = wildfire benefits from low intensity wildfire, RES+WB = combined RES and WB. The reported average and range is for the 4 simulations per management scenario (one for each valuation scheme).
Average Average Expected net value change burn Range in average wildfi re ($/ha) by valuation schemeScenario Ha treated probability burn probability size (ha) FX RES WB RES+WB
USDA Forest Service Proceedings RMRS-P-41. 2006. 155
A Wildfi re Risk Modeling System for Evaluating Landscape Fuel Treatments Strategies Ager, Finney, and McMahan
Figure 1—Expected net value for the SDEN (top) and RDEN (bottom) treatment priorities by treatment level ( percent of landscape treated) and resource valuation scheme. SDEN and RDEN prioritized stand treatments based on stand density and residential density, respectively.
At the maximum level of treatment (66 percent of landscape), the net value increased to -$12.8 per ha for both treatment scenarios. On a proportional basis, there was a 44% increase in net value when the treatments rate was in-creased from 0% to 20%. We observed a slightly more rapid increase in value with the SDEN versus the RDEN spatial priority between 0 percent and 10 percent treatment levels, perhaps due to the treatment of stands with higher SDI and more extreme fi re behavior.
Maps comparing the expected loss (FX) between two treatment priorities (RDEN, SDEN) at 20 percent treatment showed distinct treatment patterns (fi g. 2). At higher treatment levels, the difference between spatial priorities was diminished (fi g. 1). The SDEN treatment priority resulted in a relatively
156 USDA Forest Service Proceedings RMRS-P-41. 2006.
Ager, Finney, and McMahan A Wildfi re Risk Modeling System for Evaluating Landscape Fuel Treatments Strategies
large increase in the net value in the central portion of the project area which currently supports a higher proportion of overstocked stands. In contrast, the RDEN treatment priority, which selected stands for treatment along the eastern edge of the study area near residences, showed relatively low expected values in the central portion of the project area.
Mapping the difference in expected value (FX) between the untreated and treating 20 percent of the forested area for the SDEN treatment priority was used to compare the effects of fuel treatments on expected loss inside and outside the treatment areas (fi g. 3). Changes in expected loss were apparent especially in the treated areas (fi g. 3). However, the effect of the treatments outside the treatment units were also apparent (fi g. 3), thus illustrating the secondary (landscape) benefi ts of the treatments.
Simulation results for the RES valuation schemes, which valued homes at $200,000 with a linear loss function (table 1) appeared very similar to the FX valuation scheme, with increasing net value with increasing treatment levels. The effect of prioritizing treatment according to residential density (RDEN) versus the stand density (SDEN) was evident in the results, with the expected value for the former scenario substantially higher for the lower treatment levels (10 to 30 percent, table 2). For instance, at the 30 percent treatment level the expected value for the RDEN spatial treatment priority was about $15 per ha higher as compared to SDEN where stands were treated based only on their SDI. The expected value for the RES valuation scheme
Figure 2—Map of the study area showing expected value loss ($ per ha) from wildfi re for the SDEN (left panel) and RDEN (right panel) treatment priorities with 20 percent of the landscape treated and fi xed land values ($500 per ha). Values shown in legend represent value loss.
USDA Forest Service Proceedings RMRS-P-41. 2006. 157
A Wildfi re Risk Modeling System for Evaluating Landscape Fuel Treatments Strategies Ager, Finney, and McMahan
and RDEN treatment priority increased about 50% when the treatment rate was increased from 0% to 20% of the landscape. The increased expected value (decreased loss) between the SDEN and RDEN treatment priorities were largely due to localized treatments around residences (fi g. 4). Nevertheless, treating stands based on density alone, which resulted in the bulk of the treatments several kilometers from the residences, reduced the expected loss in the RES valuation scheme (fi g. 4, lower right panel)
As expected, the WB scenario, which valued wildfi re fuel treatments at $350 per ha when the fl ame length was less than 1.2 m showed decreasing expected value with increasing levels of treatments (fi g. 1). The drop in ex-pected value with increasing treatment intensity mirrored the reduction in average wildfi re size (table 2). With less area burned by wildfi re under the higher treatment levels the expected value would be expected to drop.
The valuation scheme that considered both residential values and wildfi re benefi ts (RES+WB) produced some erratic results, although in general the decrease in wildfi re benefi ts with increasing treatment levels overshadowed the effects on residential values (table 2, fi g. 1). The variable results are diffi cult to explain and are perhaps a larger number of simulated fi res are required to estimate expected values when there are multiple valuations on a landscape.
Figure 3—Difference in expected loss between no treatment and treating 20 percent of the landscape (left panel) for the SDEN treatment priority, and fi xed land valuation ($500 per ha). Darker areas represent benefi ts (reduced loss) from the fuel treatments. Left panel is a zoomed image of the central portion of the study area showing the same data and treatment units (horizontal hatching). Darker shading shows the off-site, landscape effect of the fuel treatments in terms of reducing burn probability and intensity, and potential loss from fi re.
158 USDA Forest Service Proceedings RMRS-P-41. 2006.
Ager, Finney, and McMahan A Wildfi re Risk Modeling System for Evaluating Landscape Fuel Treatments Strategies
Discussion
The results demonstrate a wildfi re risk assessment process that incorporates important interactions among wildfi re spread, intensity, and resource values, and illustrates how landscape fuel treatment strategies may affect the expected net value change. The simulations assumed that, from a risk standpoint, the primary concern is escaped fi res and extreme fi re conditions (Finney 2005), since these are the fi res that are responsible for the most damage. Suppression
Figure 4—Expected loss for the RES valuation scheme at the 20 percent treatment level for the RDEN and SDEN treatment priorities. The RES valuation scheme valued each home at $200,000. Left panel shows treated stands (horizontal hatching) for the RDEN treatment priority where stands were prioritized for treatment based on residential density. Black circles denote residences. Panels on right show the expected value change for the stand density (SDEN, upper right) and residential (RDEN, lower left) treatment priorities. Values in the legend represent expected loss.
USDA Forest Service Proceedings RMRS-P-41. 2006. 159
A Wildfi re Risk Modeling System for Evaluating Landscape Fuel Treatments Strategies Ager, Finney, and McMahan
activities are generally ineffective in these types of fi res, and thus were ex-cluded from the model. Modifying the expected value equation to account for mitigation such as suppression capability is discussed by Smith (2001).
We envision this modeling framework as a useful one for simulating fuel treatment scenarios and analyzing their performance with measures like burn probability and net value change, especially within the context of col-laborative fuels treatment planning (Bahro 2004; Gercke and Stewart 2006). For instance, the change in expected value per ha treated could be used as a measure of treatment performance. This measure can be partitioned be-tween the treated area and non-treated area to measure the effi ciency of the treatment package in terms of local (treated stands) versus landscape-scale (non-treated stands) effects.
From a research perspective, this modeling framework could also help resolve one of the key risk assessment questions concerning fuels treatment on federal lands: the tradeoff between potential short term impacts of fuel treatments versus long term benefi ts of wildfi re mitigation (Irwin and Wigley 2005). In this case the net value formulation will require discounted, future losses and benefi ts, and the vegetation simulations will require a temporal component. This type of problem is tractable with the FVS-Parallel Processing Extension and the RANDIG program.
There are important differences between the methods used here to esti-mate burn probabilities versus probabilistic models built with historical fi re occurrence and size data (Martell and others 1989; Mercer and Prestemon 2005; Preisler and others 2005). We have estimated a conditional burn prob-ability to compare the effects of management, and set the number of fi res to a value that sample the landscape in terms of fi re spread, intensity, and value. Until we factor in spatio-temporal probabilities for ignition, escape, and burn conditions (Davis and Miller 2004; Miller 2003; Parisien and other 2005), there is most likely little relationship to the burn probabilities estimated here and the actual probability of a wildfi re on the Mt. Emily area. However, precisely what parameters most infl uence burn probabilities and whether a more complex model is necessary for modeling the effectiveness of fuel treatments remains to be seen.
Although our resource value layers were hypothetical, they were useful for demonstrating the application of the system. The modeling framework is also well suited for analyzing long-term risk tradeoff between wildland fi re benefi ts and the cost of wildfi re suppression and fuels treatments (Calkin and Hyde 2004). More realistic valuation and loss scenarios have been used in other studies to examine treatment costs, potential timber revenues, and wildlife habitat impacts over time (Hummel and Calkin 2005).
Resource valuation is a complex problem (Freeman 2003) especially on federally-managed lands where planners need to integrate monetary and non-monetary valuations for analyzing and comparing risk among fuel treatment alternatives. Valuation schemes that use a common, relative weighting system for multiple resource values have been proposed for federal lands (Rideout and Zielser 2005). Many other kinds of valuation data are readily available online or in agency GIS systems. The risk framework described here could be easily expanded to accommodate multiple loss and benefi t grids and loss functions in an integrated measure of risk.
Future work will involve experimenting with a number of factors that affect burn probabilities, such as ignition location, weather conditions, and the effectiveness of suppression. We also plan to simulate treatment scenarios through time to address the temporal aspects of wildfi re risk assessment.
160 USDA Forest Service Proceedings RMRS-P-41. 2006.
Ager, Finney, and McMahan A Wildfi re Risk Modeling System for Evaluating Landscape Fuel Treatments Strategies
Acknowledgments
We are indebted to Carol Miller and Marc Parisien for discussions on estimating burn probabilities. We thank Dave Calkin and Carol Miller for reviewing an earlier version of the paper. The simulation of fuel treatments on Mt. Emily was funded by a Joint Fire Science Program grant (03-4-1-04) to the senior author. Additional support was provided by the Forest Service Western Wildlands Environmental Threat Center, Prineville, OR.
Literature Cited
Ager, A. A. 2005. ArcFuels: Forest planning tools for managing wildland fuels. Proceedings of the 25th ESRI international users conference, July 25-29, San Diego, CA. 5 p. http://gis.esri.com/library/userconf/proc05/papers/pap1296.pdf. Accessed 3/15/06.
Ager, A. A.; Barbour, R. J.; Hayes, J. L. 2005. Examination of long-term fuels management scenarios on a wildland-urban interface in northeastern Oregon. In: Bevers, Michael; Barrett, Tara M., tech. comps. Systems analysis in forest resources: proceedings of the 2003 symposium. Gen. Tech. Rep. PNW-GTR-656. Portland OR: U.S. Department of Agriculture, Forest Service, Pacifi c Northwest Research Station: 215-228.
Bachmann, A.; Allgöwer, B. 2001. A consistent wildland fi re risk terminology is needed! Fire Management Today. 61: 28-33.
Bahro, B. 2004. Fireshed assessment: An integrated approach to landscape planning. R5-TP-017. U.S. Department of Agriculture, Forest Service, Pacifi c Southwest Region. http://199.128.173.130/psw/centennial/agenda/prefi re_planning/BerniBahro%20fi reshed.pdf Accessed 3/15/06.
Bradshaw, L.; McCormick, E. 2000. FireFamily Plus user’s guide, version 2.0. Gen. Tech. Rep. RMRS-GTR-67WWW. Ogden, UT: U.S. Department of Agriculture, Forest Service, Rocky Mountain Research Station. 124 p.
Brillinger, D. R. 2003. Three environmental probabilistic risk problems. Statistical Science. 18: 412-421.
Calkin, D.; Hyde, K. 2004. Break-Even Point. Wildfi re. September 1 issue. http://wildfi remag.com/ar/breakeven_point/index.htm Accessed 3/15/06.
Calkin, D.; Hyde, K.; Gebert, K.; Jones, G. 2005. Comparing resource values at risk from wildfi res with Forest Service fi re suppression expenditures: Examples from 2003 western Montana wildfi re season. Res. Note RMRS-RN-24WWW. Missoula, MT: U.S. Department of Agriculture, Forest Service, Rocky Mountain Research Station. 6 p.
Chang, K. T. 2004. Programming ArcObjects with VBA: a task oriented approach. Boca Raton, FL. CRC Press. 352 p.
Cochran, P. H.; Geist, J. M.; Clemens, D. L.; Clausnitzer, R.R.; Powell, D.C. 1994. Suggested stocking levels for forest stands of northeastern Oregon and southeastern Washington. Gen. Tech. Rep. PNW-RN-513. Portland, OR: U.S. Department of Agriculture, Forest Service, Pacifi c Northwest Research Station. 21 p.
Crookston, N. L.; Gammel, D. L.; Rebain, S. 2006. User’s guide to the Database Extension of the Forest Vegetation Simulator Version 2.0. Moscow, ID. U.S. Department of Agriculture, Forest Service, Rocky Mountain Research Station. 50 p. http://www.fs.fed.us/fmsc/ftp/fvs/docs/gtr/DB-FVS-UserGuide.pdf. Accessed 3/15/06.
USDA Forest Service Proceedings RMRS-P-41. 2006. 161
A Wildfi re Risk Modeling System for Evaluating Landscape Fuel Treatments Strategies Ager, Finney, and McMahan
Crookston, N. L.; Stage, A. R. 1991. User’s guide to the Parallel Processing Extension of the Prognosis Model. Gen. Tech. Rep. INT-281. Ogden, UT: U.S. Department of Agriculture, Forest Service, Rocky Mountain Research Station. 87 p.
Davis, Brett; Carol Miller. 2004. Modeling wildfi re probability using a GIS. In: Proceedings of the ASPRS 2004 annual conference, Denver, USA. May 23-28. Bethesda, MD: American Society for Photogrammetry and Remote Sensing, 2004. Available on CD only.
Finney, M. A. 2002. Fire growth using minimum travel time methods. Canadian Journal of Forest Research. 32:1420-1424.
Finney, M. A. 2005. The challenge of quantitative risk analysis for wildland fi re. Forest Ecology and Management. 211:97-108.
Freeman, A. M. 2003. The measurement of environmental and resource values. 2nd ed. Washington, D.C.: Resources for the Future. 491 p.
Gercke, D. M.; Stewart, S. A. 2006. Strategic placement of treatments (SPOTS): maximizing the effectiveness of fuel and vegetation treatments on problem fi re behavior and effects. In: 1st Fire behavior and fuels conference on fuels management—How to measure success; March 28-30, 2006; Portland, Oregon. [Abstract] http://www.iawfonline.org/pdf/Abstracts-1.pdf. Accessed 3/16/06.
Hummel, S.; Calkin, D. E. 2005. Costs of landscape silviculture for fi re and habitat management. Forest Ecology and Management. 207: 385-404.
Irwin, L. L.; Wigley, T. B. 2005. Relative risk assessments for decision-making related to uncharacteristic wildfi re. Forest Ecology and Management. 211: 1-2.
Martell, D.L.; Bevilacqua, E.; Stocks, B. J. 1989. Modelling seasonal variation in daily people-caused forest fi re occurrence. Canadian Journal of Forest Research. 19: 1555-1563.
Mercer, D. E.; Prestemon, J. F. 2005. Comparing production function models for wildfi re risk analysis in the wildland urban-interface. Forest Policy and Economics. 7: 782-795.
Miller, C. 2003. The spatial context of fi re: A new approach for predicting fi re occurrence. In: Galley, K. E. M.; Klinger, R. C.; Sugihara, N. G., eds. Proceedings of fi re conference 2000: The fi rst national congress on fi re ecology, prevention, and management. Misc. publication No. 13. Tallahassee, FL: Tall Timbers Research Station: 22-29.
Miller, C.; Parsons, D. P. 2005. Can wildland fi re use restore natural fi re regimes in wilderness and other unroaded lands? Final report to the Joint Fire Science Program, Project #01-1-1-5. Hardcopy on fi le at Joint Fire Science Program offi ce and Aldo Leopold Wilderness Research Institute. http://leopold.wilderness.net/research/fprojects/pdfs/FinalReport_JFSP01_Jan01_05.pdf Accessed 3/15/06.
Parisien, M. A.; Kafka, V. G.; Hirsch, K. G.; Todd, B. M.; Lavoie, S. G.; Maczek, P. D. 2005. Using the BURN-P3 simulation model to map wildfi re susceptibility. Canadian Forest Service Report NOR-X-405. 36 p.
Pattison, T. 1998. Programming distributed applications with COM and Microsoft Visual Basic 6.0. Redmond, WA: Microsoft Press. 500 p.
Preisler, H. K.; Brillinger, D.R.; Burgan, R. E.; Benoit, J. W. 2004. Probability based models for estimating wildfi re risk. International Journal of Wildland Fire. 13: 133-142.
Reinhardt, E.; Crookston, N. L., tech. eds. 2003. The Fire and Fuels Extension to the Forest Vegetation Simulator. Gen. Tech. Rep. RMRS-GTR-116. Ogden, UT: U.S. Department of Agriculture, Forest Service, Rocky Mountain Research Station. 209 p.
162 USDA Forest Service Proceedings RMRS-P-41. 2006.
Ager, Finney, and McMahan A Wildfi re Risk Modeling System for Evaluating Landscape Fuel Treatments Strategies
Rideout, D. B.; Ziesler, P. S. 2005. Weight System (EOWEP) for FPA-PM1. Working Draft Version 2.5 Department of Forest, Rangeland, and Watershed Stewardship. Colorado State University, Fort Collins, CO. February 4, 2005. http://www.fpa.nifc.gov/Library/Papers/Docs/EOWEP_V2_2005_02.pdf
Scott, J. H.; Burgan, R. E. 2005. Standard fi re behavior fuel models: a comprehensive set for use with Rothermel’s surface fi re spread model. Gen. Tech. Rep. RMRS-GTR-153. Fort Collins, CO: U.S. Department of Agriculture, Forest Service, Rocky Mountain Research Station. 72 p.
Smith, Keith. 2001. Environmental Hazards: Assessing Risk and Reducing Disaster. London: Routledge 392 p.
Wallace, P.L., 2003. Mt. Emily fuels reduction project. Specialist report on fi le, Wallowa Whitman National Forest, La Grande Ranger District, La Grande, OR. 22 p.