A Workshop Investigating the Potential for the Application of Decision Analysis Principles and Processes to Geoenvironmental Situations: Selenium in West Virginia Open-File Report 2006-1283 By James L. Coleman, Jr. 1 , Ione L. Taylor 2 , Tim Nieman 3 , and Karen Jenni 4 1 U. S. Geological Survey, Mail Stop 956 National Center, Reston VA 20192 2 U. S. Geological Survey, Mail Stop 150 National Center, Reston VA 20192 3 Geomatrix Consultants, Inc., 2101 Webster Street, Oakland CA 94612 4 Insight Decisions LLC, 1616 Seventeenth Street, Suite 268, Denver CO 80202 (formerly with Geomatrix Consultants, 1401 Seventeenth St, Suite 600, Denver CO 80212) U.S. Department of the Interior U.S. Geological Survey
Transcript
A Workshop Investigating the Potential for the Application of Decision Analysis Principles and Processes to Geoenvironmental Situations: Selenium in West Virginia
Open-File Report 2006-1283
By James L. Coleman, Jr.1, Ione L. Taylor2, Tim Nieman3, and Karen Jenni4
1 U. S. Geological Survey, Mail Stop 956 National Center, Reston VA 20192 2 U. S. Geological Survey, Mail Stop 150 National Center, Reston VA 20192 3 Geomatrix Consultants, Inc., 2101 Webster Street, Oakland CA 94612 4 Insight Decisions LLC, 1616 Seventeenth Street, Suite 268, Denver CO 80202 (formerly with Geomatrix Consultants, 1401 Seventeenth St, Suite 600, Denver CO 80212)
U.S. Department of the Interior U.S. Geological Survey
ii
U.S. Department of the Interior Dirk Kempthorne, Secretary
U.S. Geological Survey P. Patrick Leahy, Acting Director
U.S. Geological Survey, Reston, Virginia 20192
For product and ordering information: World Wide Web: http://www.usgs.gov/pubprod Telephone: 1-888-ASK-USGS
For more information on the USGS—the Federal source for science about the Earth, its natural and living resources, natural hazards, and the environment: World Wide Web: http://www.usgs.gov Telephone: 1-888-ASK-USGS
Suggested citation: Coleman, James L., Jr., Taylor, Ione L., Nieman, Tim, and Jenni, Karen, 2006, A Workshop Investigating the Potential for the Application of Decision Analysis Principles and Processes to Geoenvironmental Situations: Selenium in West Virginia: Reston VA, U. S. Geological Survey, Open-file Report, 2006-1283, 43 p.; http://pubs.usgs.gov/of/2006/1283.
Any use of trade, product, or firm names is for descriptive purposes only and does not imply endorsement by the U.S. Government.
Although this report is in the public domain, permission must be secured from the individual copyright owners to reproduce any copyrighted material contained within this report.
Contents Executive Summary ......................................................................................................................2 Introduction ...................................................................................................................................5 Theme of the Workshop................................................................................................................9 Subject Matter Expert Presentations...........................................................................................13 Geomatrix Case Studies .............................................................................................................14 Workshop Results .......................................................................................................................15 Summary and Conclusions .........................................................................................................33 References Cited ........................................................................................................................36 Appendix I: Geomatrix Case Studies .........................................................................................38 Appendix II: Workshop Participants ...........................................................................................39 Appendix III: Post-workshop Questions and Answers................................................................41 Appendix IV: Outstanding Issues ...............................................................................................43
Figures 1. Diagram illustrating the mobility of selenium in the western U. S. A........................................10 2. Objectives hierarchy for state regulatory agency. ...................................................................18 3. Objectives hierarchy for “group of concerned citizens”. ..........................................................18 4. Combined objectives hierarchy. ..............................................................................................19 5. Example strategy table for permitting decisions. .....................................................................21 6. Initial problem elements. .........................................................................................................23 7. Initial illustration of relationships..............................................................................................24 8. Final illustration of relationships. .............................................................................................25 9. Example quantification of uncertainty, Se overburden concentration......................................26 10. Example quantification of uncertainty, paraphyte to fish transfer. .........................................27 11. Example quantification of relationships, taxes collected........................................................28 12. Example quantification of relationships, fish mortality ...........................................................29 13. Example output: fish mortality (fraction dying) as a function of time and permitting strategy 30 14. Example output: tax revenue as a function of permitting strategy. ........................................31 15. For decision-making, compare results and consider tradeoffs. .............................................32 Tables 1. Potential decision-makers for Selenium issues. ......................................................................15
iii
A Workshop Investigating the Potential for the Application of Decision Analysis Principles and Processes to Geoenvironmental Situations: Selenium in West Virginia
By James L. Coleman, Jr., Ione L. Taylor, Tim Nieman, and Karen Jenni
1
Executive Summary: On February 2, 2005, the U. S. Geological Survey (USGS), welcomed a number of participants from the USGS, U. S. Bureau of Land Management (BLM), U. S. Fish and Wildlife Service (FWS) and West Virginia Department of Environmental Protection (WVDEP) to a workshop investigating the potential for employing Decision Analysis (DA) principles and processes to the scientific research and data delivery by the USGS. Decision Analysis is an integrated set of processes and tools that can be used to support decision-making under conditions incorporating uncertainty and risk. The workshop was conducted by Geomatrix Consultants, who taught the participants the fundamentals of Decision Analysis, while also guiding them to develop a DA framework for an actual real-life problem. The goal of this workshop, sponsored by the Office of the Director, Eastern Region USGS, was to evaluate the feasibility of utilizing a Decision Analysis approach to
(1) involve more fully USGS scientists and customers, particularly those from other DOI Bureaus, in co-designing multidisciplinary science that addresses complex issues, and to (2) permit USGS to appraise and learn how to enhance the value of its science and information in reducing uncertainty and evaluating risk.
Decision Analysis is one of a series of approaches the USGS and others are evaluating which have proven useful for addressing decision making for complex problems in different contexts. These include adaptive management, joint fact-finding, decision support, and stakeholder analysis. Decision Analysis is somewhat broader in scope than the other four, and can be usefully combined with some of the more process-focused approaches. In short, DA is
• more quantitative than Joint Fact Finding, • more analytically-focused than Adaptive Management, • more process-focused than Decision Support Systems, and • more decision-focused than Stakeholder Analysis.
The USGS has a set of unique advantages, which enable it to embrace Decision Analysis. It is currently composed of 4 scientific disciplines (geology, geography, hydrology, biology), which address process-focused issues of variable physical and temporal scales from the microscopic to the planetary and from microseconds to millions of years. Workshop goals were addressed by developing a framework for a pilot DA study that focused on the presence of selenium in West Virginia watersheds. The pilot study examined the factors associated with the benefits of energy resource use versus potential health risks. This pilot study was intended both as a training exercise for the participants and a feasibility study for the USGS to assess the potential value of DA in conveying USGS products and services to a variety of customers.
2
Effective, multidisciplinary science requires an overarching vision and understanding of the challenges at hand, efficiently linked to an organization of individuals and their expertise, each bringing and sharing a unique perspective, methodology, and conceptual model. DA links the vision and the organization, encouraging the participants to investigate alternative solution pathways that are intended to make the solution more relevant and durable. The participants in this workshop came together to practice integrative science, to learn how fully integrative science could be designed and implemented, and how that science could be packaged and delivered to decision makers and other end users of USGS science. Selenium (Se) was chosen as a theme for the workshop to enable the participants to bring together their individual knowledge about a highly relevant geoenvironmental issue with which they were personally and regularly involved. The objective of the workshop was not to solve the problem, but rather to learn how to solve a problem, using Decision Analysis, and to introduce the technique to scientists and managers. We could have picked practically any geoenvironmental problem to address as an example problem. Selenium is a trace metal that has been recognized in the coal-bearing stratigraphy in the Appalachian Basin of the eastern United States. It (as well as other Appalachian Basin trace metal elements, such as mercury and arsenic) is known to cause adverse health effects, when its concentrations exceed critical thresholds. Selenium has been reported from some Appalachian watersheds and their associated biologic communities. The area of focus of the workshop was the potential mobilization of Se as a result of mountain top mining and valley filling operations in the Central Appalachian coalfields. Selenium in eastern watershed drainages was a specific theme on which to anchor the workshop, because concerns have been voiced regarding its apparent increased environmental presence as a result of significant ground disturbances in the Central Appalachian coalfields. Summary and Conclusions from Workshop: Any satisfactory learning experience creates more questions than answers. This was certainly true of this experience. By getting a glimpse of what “the other guy” sees and needs to know, it quickly became apparent how limited our present approaches are to defining and solving scientific problems AND THEN communicating the results in effective terms to decision makers and other stakeholders. A list of some of these questions is presented in Appendix II. At the end of the three-day exercise, at a time when individuals should be eager to quickly wrap things up and go home, there was an unusually high level of energy and enthusiasm among the participants. This was noted, both by the participants, as well as by outside observers who were present from the beginning to the conclusion of the workshop. Those in the regulatory role were very excited about how science could play a stronger and more useful part in the decisions they routinely make. In addition, it was invigorating to see highly respected scientists come together to discuss what they knew AND did not know about their component of the issue and potential new areas of research that could be undertaken to fill in some of the gaps. The participants dispersed at the end of the workshop thinking that if they had the money and the time, they could immediately address several newly identified issues around selenium in Appalachian
3
watersheds and work towards an integrated method for helping decision makers make more informed decisions. With Decision Analysis, we recognized that we could bring two ends of an issue together and be better informed about their interdependencies. In using this comparison framework, our science, then, becomes realistic, transparent, and useful – not just some theoretical or abstract intellectual exercise. It is important to note that no conclusions or interpretations from the workshop (or any of the examples discussed in this summary) should be considered scientific in terms of content or accuracy. This workshop was merely an experiment to see if Decision Analysis tools and processes could be used for the USGS to address an integrated thematic issue. As intended, this work does provide a broad foundation for further work on selenium geoenvironmental issues. Selected responses from Workshop Participants (full collection on pages 41 and 42).
• In the DA process, the stakeholders identify the most important issues.
• The resultant DA model helps bring people together; they can go away and still stay on track with model as a guide
• The treatment of uncertainty and sensitivity is valuable for understanding options
and decisions.
• DA leaves a strong record of how you reached a decision, because the record of decisions is left behind within the process decision documents. This helps the user clearly document a decision process to better address future questions.
• DA can help identify keystone research needs.
• The Guiding Group was amazed at energy of Core Group at the end of 3 days.
They wanted to know how did USGS disciplines come together so well?
4
Introduction: On February 2, 2005, Ione Taylor, Deputy Director of the Eastern Region and Jim Coleman, Chief Scientist, Eastern Energy Resources, U. S. Geological Survey (USGS), welcomed a number of participants from the USGS, U. S. Bureau of Land Management (BLM), U. S. Fish and Wildlife Service (FWS) and West Virginia Department of Environmental Protection (WVDEP) to a workshop convened to investigate the potential for employing Decision Analysis (DA) principles and processes to the scientific research and data delivery of the USGS. The workshop was conducted by Tim Nieman and Karen Jenni of Geomatrix Consultants. Decision Analysis is an integrated set of processes and tools that can be used to support decision-making under uncertainty. The goal of this workshop, sponsored by the Office of the Director, Eastern Region USGS, was to evaluate the feasibility of utilizing a Decision Analysis approach to (1) involve more fully USGS scientists and customers, particularly those from other DOI Bureaus, in co-designing integrated science that addresses complex issues, and to (2) permit USGS to appraise and learn how to enhance the value of its science and information in reducing uncertainty and in evaluating risk. These goals were addressed by developing a framework for a pilot DA study, which examined the factors associated with the benefits of energy resource use versus potential health risks caused by significant ground disturbances. This pilot study was intended both as a training exercise for the participants and a feasibility study for USGS to assess the potential value of DA in conveying USGS products and services to a variety of customers. In her opening remarks, Taylor reminded the audience that a review by the National Research Council (NRC) (2001) determined that the USGS will be asked increasingly to address the questions “How do natural systems affect human systems, and how do human systems modify natural systems?” In addition, decision makers, from the US Congress, to business, to local communities, will call extensively on USGS expertise, data and information to address complex problems involving extraction of natural resources and the effect of that extraction on the environment. USGS must be prepared to respond to their needs in a timely and understandable manner.
According to the NRC Panel review, in order to be effective in the future, the USGS must be able to address successfully many challenges, including:
• Changes in group dynamics • Changes in analytical approaches • Changes in types of synthesis activities • Learning new vocabularies • Working at new spatial and temporal scales • Being comfortable with new interpretive results and explanations • Changes in professional culture • Changes in perspective • Developing new application of methods • Greater emphasis on defining conceptual system models
5
Undertaking these new challenges will be daunting if they are faced singularly and without context. Adapting the principles and processes of Decision Analysis to USGS strategic planning would facilitate learning and implementing each of these in a focused, reinforcing environment. Effective, integrative science requires an overarching vision and understanding of the challenges at hand, efficiently linked to an organization of individuals and their expertise, each bringing and sharing a unique perspective, methodology, and conceptual model. DA links the vision and the framework, encouraging the participants to investigate alternative solution pathways that are intended to make the chosen solution more relevant and durable. The participants came together to practice integrative science, to learn how fully integrative science could be designed and implemented, and how that science could be packaged and delivered to decision makers and other end users of USGS science. The USGS has a set of unique advantages, which enable it to embrace the Decision Analysis process. It is composed currently of 4 scientific disciplines (geology, geography, hydrology, biology), which address process-focused issues of variable physical and temporal scales from the microscopic to the planetary and from microseconds to millions of years. Decision Making: Decision-making begins with two simple definitions:
A decision is an allocation of resources. A decision maker is one who has authority over the resources being allocated.
The objective, then, is to develop a decision making process that produces decisions that can be made with knowledgeable foresight under conditions incorporating uncertainty and risk. Decision Analysis is such a process.
• Is an overall approach for making logical, reproducible, and defensible decisions in the face of technical complexity, uncertainty, and multiple, possibly competing, objectives.
• Includes a set of tools for structuring and analyzing complex decision problems.
• Actively involves customers and users of a product or service at all stages of the process, instead of only at later stages, which is more typical of current practices.
• Addresses risks and rewards in quantifiable entities, and clearly communicates judgments about risk and uncertainty in an unambiguous way.
• Creates a set of options with anticipated outcomes based on assigned uncertainties and resource economics.
DA provides methods to identify key decision factors and uncertainties and to quantify the value of obtaining additional information.
There are a number of other decision-making processes that have been discussed and used within the USGS, which appear to be similar to DA. These include Joint Fact Finding (JFF), Decision Support Systems (DSS), Stakeholder Analysis (SA), and Adaptive Management (AM). These processes and approaches, however, differ in some substantial ways from DA in process, intent, and the types of problems each most effectively addresses. 1. Joint Fact Finding (JFF) is a process wherein stakeholder groups are brought together
for facilitated discussions of a particular problem with the intent that they ultimately agree on what information is relevant and how it should be used. JFF: • Strives to pool all relevant information. • Involves face-to-face communication among technical experts, decision makers,
and other key stakeholders. • Translates technical information for all participants to understand. • Accurately defines questions to be addressed. • “Maps” areas of agreement and narrows areas of disagreement and uncertainty. • Aims for agreement on how to use the results, including accommodating
conflicting data and interpretations. • Communicates results through a single record. (McCreary, Gamman, and Brooks, 2001; http://www.doiu.nbc.gov/usgsseminar.html)
2. Decision Support Systems (DSS) are computer and database tools based on “expert
systems” that strive to codify routine, but complex, decision problems.
DSS: • Is a set of concepts and methods to make and improve business decision making
by using a fact-based support system. • Is the evolutionary byproduct of large-scale information systems (i.e.,
management information systems – MIS), that were designed after the development of powerful computing systems.
• Is usually data-driven. • Is technology and data processing limited.
(http://dssresources.com/history/dsshistory.html) 3. Stakeholder Analysis (SA) is an approach used for identifying and assessing the
impact of key stakeholders on a particular activity. It is commonly used to facilitate understanding and communication in a collaborative decision making problem. SA: • Identifies and assesses the importance of key people, groups of people, or
institutions that may significantly influence the success of a planned activity or project.
• Anticipates the kind of influence, positive or negative, these groups will have on your initiative.
• Develops strategies to get the most effective support possible. • Reduces obstacles to successful implementation.
(http://erc.msh.org/quality/ittools/itstkan.cfm)
4. Adaptive management (AM) is an analysis, management, and experimental approach to evaluating the impacts of different decisions on outcomes of interest.
AM: • Reducing uncertainty becomes an objective of management, and policies are
treated as experiments. • Analyzes outcomes of management decisions in consideration of the original
objectives. • Policies are adapted depending on experimental observations. • Incorporates the results into future decisions.
Each of these approaches has proven useful in different contexts. Decision Analysis is somewhat broader in scope than the other four, and can be usefully combined with some of the more process-focused approaches. In short, DA is
• more quantitative than Joint Fact Finding, • more analytically-focused than Adaptive Management, • more process-focused than Decision Support Systems, and • more decision-focused than Stakeholder Analysis.
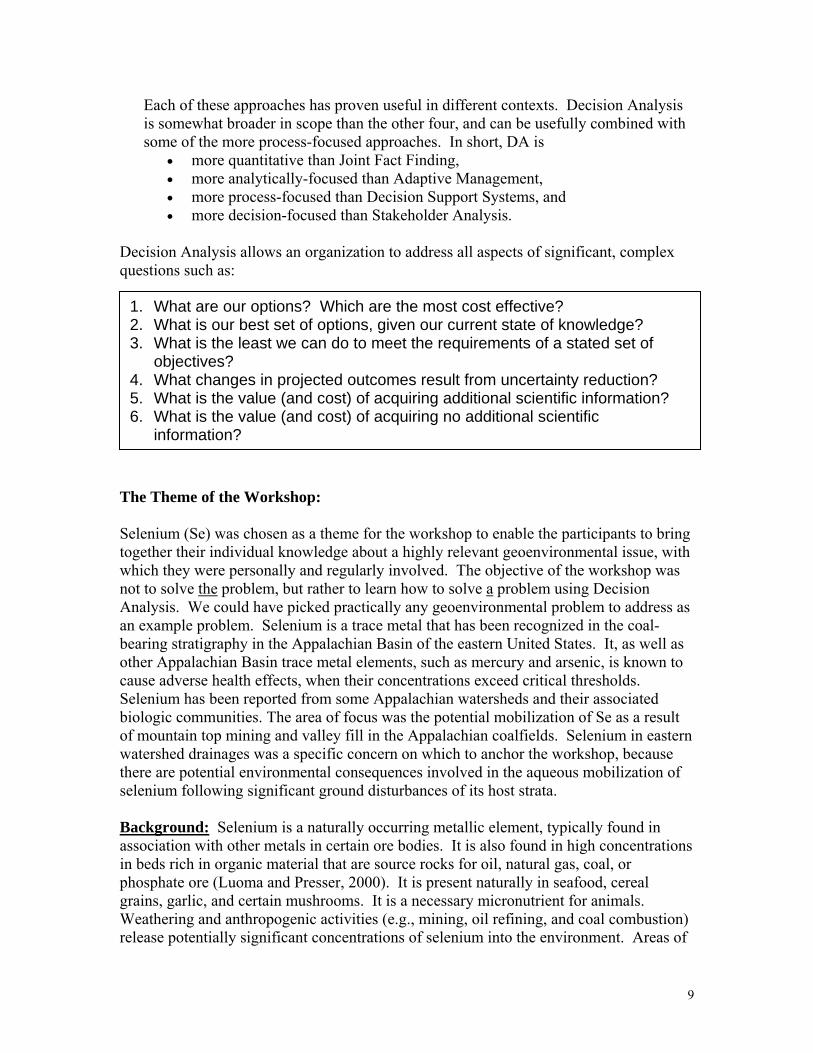
Decision Analysis allows an organization to address all aspects of significant, complex questions such as:
1. What are our options? Which are the most cost effective? 2. What is our best set of options, given our current state of knowledge? 3. What is the least we can do to meet the requirements of a stated set of
objectives? 4. What changes in projected outcomes result from uncertainty reduction? 5. What is the value (and cost) of acquiring additional scientific information? 6. What is the value (and cost) of acquiring no additional scientific
information?
The Theme of the Workshop: Selenium (Se) was chosen as a theme for the workshop to enable the participants to bring together their individual knowledge about a highly relevant geoenvironmental issue, with which they were personally and regularly involved. The objective of the workshop was not to solve the problem, but rather to learn how to solve a problem using Decision Analysis. We could have picked practically any geoenvironmental problem to address as an example problem. Selenium is a trace metal that has been recognized in the coal-bearing stratigraphy in the Appalachian Basin of the eastern United States. It, as well as other Appalachian Basin trace metal elements, such as mercury and arsenic, is known to cause adverse health effects, when their concentrations exceed critical thresholds. Selenium has been reported from some Appalachian watersheds and their associated biologic communities. The area of focus was the potential mobilization of Se as a result of mountain top mining and valley fill in the Appalachian coalfields. Selenium in eastern watershed drainages was a specific concern on which to anchor the workshop, because there are potential environmental consequences involved in the aqueous mobilization of selenium following significant ground disturbances of its host strata. Background: Selenium is a naturally occurring metallic element, typically found in association with other metals in certain ore bodies. It is also found in high concentrations in beds rich in organic material that are source rocks for oil, natural gas, coal, or phosphate ore (Luoma and Presser, 2000). It is present naturally in seafood, cereal grains, garlic, and certain mushrooms. It is a necessary micronutrient for animals. Weathering and anthropogenic activities (e.g., mining, oil refining, and coal combustion) release potentially significant concentrations of selenium into the environment. Areas of
9
high evaporation in seasonal drainage basins may concentrate selenium in water bodies and bounding wetlands, causing, under alkaline conditions, potentially toxic levels in some places. Some plants may also selectively concentrate selenium causing potential problems with grazing livestock. Under the more acidic and reducing conditions of the eastern United States, the prevailing form (or species) of selenium is different than in the western United States. As a consequence, selenium is not as mobile in the east as it is in the western United States. Higher evaporation rates in the western United States locally produce larger concentrations in surficial materials than are present in the eastern portions of the country.
Figure 1: Diagram illustrating the mobility of selenium in the western U. S. A. (modified from Polakovic, 1993, and used by permission of Steven Sedam-Stone/The Press Enterprise and
Joan S. Dainer, SDSU Center for Inland Waters, Biology Department, San Diego State University, San Diego, CA)
Selenium is also important to the technological development of mankind. Currently, its greatest use is in making electronic and photocopier components. It is also used to make glass, semiconductors, photovoltaic cells, pigments, rubber, metal alloys, textiles, petroleum, medical therapeutic agents, photographic emulsions, and antifungicide agents (Polakovic, 1993; http://minerals.usgs.gov/minerals/pubs/commodity/selenium/selenmcs06.pdf).
Humans and animals need selenium in extremely small concentrations to maintain normal body functions. If the concentrations become too low, flaccid muscles or infertility may result. In slightly elevated levels, hair and fingernail changes, damage to the peripheral nervous system, and fatigue and irritability may develop for relatively short periods of time. After longer periods of exposure (including lifetime levels above the maximum contaminant level of 0.05 ppm), selenium has the potential to cause progressive hair and fingernail loss and damage to kidney and liver tissue and the nervous and circulatory systems (http://www.epa.gov/safewater/contaminants/dw_contamfs/selenium.html).
“Selenium has the narrowest band of any toxic chemical between what’s safe and what’s toxic” (Skorupa, 1993).
The National Institutes of Health recommend a daily allowance (RDA) of 0.055 milligrams of selenium for adult men and women, with an RDA of 0.060 milligrams during pregnancy and 0.070 milligrams during lactation (National Institutes of Health, 2003, updated 2004). The substance probably becomes toxic for humans at 30 – 60 milligrams per day, with a median lethal dose of 1.5 – 60.0 milligrams/kilogram/day body weight (U. S. Dept. Health and Human Services, 2003; Andreotti, 2003). Maximum Contaminant Level Goals (MCLG) from the 1974 Safe Drinking Water Act for selenium have been set at 0.05 parts per million (ppm). The Maximum Contaminant Level (MCL) has been set at 0.05 ppm because EPA believes, given present technology and resources, this is the lowest level to which water systems can reasonably be required to remove this contaminant should it occur in drinking water. The EPA has recently proposed a maximum selenium concentration of 7.91 μg/g of dry fish (Environmental Protection Agency, 2004). There is currently much debate about the appropriate use of Se concentration in fish tissues as a regulatory standard. Because of selenium’s elemental properties, it will replace sulfur in amino acids, the building blocks for protein molecules. The presence of selenium in the protein molecules of egg and sperm cells scrambles the genetic information in embryos, potentially causing substantially abnormal development. The role of selenium as an essential nutrient in conjunction with its biochemical cycling creates a dominance of biological reactions over thermodynamic reactions in aquatic systems. Consequently, selenium is taken up by all receptor life forms as soon as it is available. Bioaccumulation upward through the tropic levels means that upper level species are at greatest risk for selenium toxicity. Selenium is passed from adults to offspring during critical stages of development and growth, potentially resulting in suppression of the immune system, reduced juvenile growth, and embryo to juvenile mortality. As a toxic situation persists, local species populations become adult-only, with few to no juveniles in their ecosystem. Eventually the adults die, resulting in complete population loss in the affected area. Because of selenium’s high reactivity, dilution is presently the only effective remediation technique for potentially adverse concentrations (Luoma and Presser, 2000).
In 1999, in response to a court order for an Environmental Impact Statement, researchers from the EPA detected elevated levels of selenium in streams flowing through some West Virginia drainage basins below areas where overburden stripped from mountain top mining operations had been dumped. Soon afterwards, the EPA discussed their initial findings at an Eastern Mine Drainage Federal Consortium (EMDFC) meeting, where USGS geologist Dr. Blaine Cecil recognized the potentially broader scope of the information. An on-going USGS project to core and analyze the coal-bearing strata of the Appalachian Basin was modified to include an investigation of the stratigraphic occurrences of selenium in the mountain top mining areas of West Virginia. Water samples were taken and analyzed for selenium by the West Virginia Department of Environmental Protection (WVDEP) during 2002 and 2003. From 2002 to 2005, researchers from the USGS Eastern Energy Resources Team (EERT) completed drilling three cores and reexamined previously collected coal data to produce a preliminary overview of the stratigraphic variability of selenium in the study area. In July 2004, the USGS Eastern Region office authorized funding for a training workshop whereby Geomatrix Consultants would introduce decision analysis (DA) principles and processes to the USGS, using selenium in West Virginia watersheds as a workshop example of a real life geoenvironmental issue of concern. Geomatrix was chosen for their expertise in both DA theory and process development, and application of DA to actual complex problems at the scientific and policy interface similar to integrated science challenges faced by the USGS in content and objective. In August, 2004, in a separate, but related effort, Hugh Bevans, West Virginia Water Science Center Director, convened a meeting on selenium in the Appalachians to begin development of a research strategy. At this workshop, the presence of selenium in samples taken from the first USGS corehole was discussed. By fall, key personnel across the USGS, BLM, FWS, and WVDEP had been identified and invited to participate in the Eastern Region DA workshop. This workshop was intentionally delayed several months in order for all invitees to be able to attend. The Workshop: In early February, two groups of participants came together in a workshop on Decision Analysis (DA). One group consisted of subject matter experts on selenium and resource management and ranged in expertise from coal geologists to hydrologists to biologists, to federal and state land and mineral managers, permitters, and regulators. For purposes of this workshop, this group was called the Core Group. The Core Group participated for all sessions of the 3-day workshop. This group addressed the real issues of collecting, interpreting, and presenting their findings to sister agencies and the public, and at the end of the workshop, produced a product that is a framework for possible future projects. The second group consisted of managers (including some upper level managers) and senior scientists who are also decision makers and subject matter experts, and who could provide guidance and feedback to the core group as potential customers and users of the DA product. This second group was known as the Guiding Group. They participated in both the opening and closing half-day sessions of the workshop. They heard the initial goals and charge for the workshop along with background information and instruction on Decision Analysis during the Opening Session. Then, they returned for the final session to listen to the Core Group’s summary
12
presentation and to review and provide feedback on the framework for a possible future Decision Analysis Pilot Project. Framing the Workshop: Workshop pre-planning indicated that workshop participants would probably not have all of the data and time necessary to fully frame up a possible solution to the issue of selenium in the watershed. Identifying possible data that were needed was one of the planned outcomes of the workshop. In order to complete the training exercise, some scientific data parameters were crudely estimated based on the participants’ experiences and prior knowledge. Consequently, no conclusions or interpretations from the workshop (or any of the examples discussed in this summary) should be considered scientific in terms of content or accuracy. As intended, this work does provide a broad foundation for further work on selenium problems. The three days of the workshop were meant to simulate a Decision Analysis approach to problem solving. Many steps were combined or eliminated in order to transition the participants through all of the key steps of the process. As this was an experiment, it was very important that the participants see the full scope and potential of DA during the short training exercise. This summary follows the steps worked through by the workshop participants. Each step is described briefly, and some examples of the results or conclusions from each step are illustrated. Prior to beginning the exercise portion of the workshop, all of the participants were given the following “warning.”
• This workshop is a training exercise. • No conclusions or interpretations from this workshop should be considered
scientific in terms of content and accuracy. In order to proceed through the various steps of the DA process, it was necessary to estimate some input parameters1 based on the participants’ experience and expertise in the context of a likely range of values for each data set. At best, the workshop results illustrate what might be a logical set of outcomes. However, it is important to accept that none of the outcomes are scientifically constrained or rigorously tested against a body of observations. Subject Matter Expert Presentations: Three scientists from the USGS and one from the USFWS gave short, technical review presentations on their discipline’s perspective of the selenium issue. 1 These data were fabricated based on real data and real experiences in order to complement fully the computer model, so that participants could see the full utility of the DA process from beginning to end.
13
1. Blaine Cecil (USGS - Eastern Energy Resources Team) presented his team’s work on the analyses of subsurface core data from the mountain top mining stratigraphic interval in southern West Virginia. Analyses of these cores for selenium content are still underway, and it is premature to discuss tentative conclusions. However, Cecil reviewed the stratigraphic occurrence of higher levels of selenium in the coal beds within the coal-bearing section and indicated that the selenium was not present solely within the coal beds themselves, but occurred at measurable concentrations within other lithologies in the strata between individual coal beds.
2. Allan Kolker (USGS - Eastern Energy Resources Team) presented a review of the
modes of occurrence and potential sources of selenium from the coal-bearing intervals of the area. He also briefly reviewed the chemical reactivity of selenium and influence of organic matter on this reactivity. In addition, he showed some of the latest technologies for analyzing the presence, distribution within the rock, and concentration of selenium within coal-bearing strata.
3. Doug Chambers (USGS - West Virginia Water Science Center) presented analyses
from the USGS, WVDEP, and WVU/WVWRI of water samples in some drainages below valley fills from mountain top mining. Most areas of high selenium concentrations are downstream from heavily mined or disturbed areas. Most conditions of high selenium concentration are associated with base-flow (or low water) conditions. He also included a review of older data sets and concluded that many data sets are greater than 20 years old, and potentially irrelevant, since land use has changed significantly in many areas since 1985. Additionally, there are large areas with little or no current data, and there are currently no studies or conceptual models of the fate and transport of selenium for the Central Appalachians.
4. Joe Skorupa (U. S. Fish and Wildlife Service), a widely recognized expert on the
biological effects of selenium on animals of the western United States, reviewed work by the USFWS over the past several decades in the western US and more recently, in 2003, on the presence of selenium in fish in West Virginia streams. In the West Virginia study, they found selenium in all of the fish collected and analyzed. In some areas, the levels were close to the FWS thresholds for reproductive failure in fish and birds; in other areas, the levels were below these thresholds. In all streams studied, bioavailable selenium was detected. He also briefly reviewed new studies on selenium in Alberta, which has a wetter climate than that of the western U. S., where most of the biological effects of selenium studies have been conducted. As this new work is reviewed and tested, it may provide a supplemental data set for better understanding the possible effects of selenium in higher rainfall areas.
Geomatrix Case Studies: As part of the initial instruction on Decision Analysis, Tim Nieman and Karen Jenni, the Geomatrix consultants conducting the workshop, presented several case studies where Decision Analysis was used to address problems of varying size. These were presented
14
to show the breadth, scope, and utility of DA. Six case studies were included in the handouts; three of these were presented in the workshop: (1) development of a large R&D portfolio for the Yucca Mountain Nuclear Waste Storage Project (DOE), (2) development of a site strategy for an industrial perchlorate contaminated property, and (3) demonstration of web-based decision modeling for the health effects of radiation exposure (National Cancer Institute). Findings from these studies are reviewed in Appendix I.
Workshop Steps: The workshop was designed as an integrated Decision Analysis Training Seminar with the training woven into an actual hands-on problem solving session. The steps of the DA process, and the steps implemented in the selenium example, were:
Step 1: Problem framing (A) Identify decision makers (B) Identify stakeholders (C) Define scope and key components of the decision problem
a. Objectives b. Decision and Alternatives c. Uncertainties
Step 2: Structuring and modeling • Identifying how the pieces of the decision problem fit together
Step 3: Quantification • Quantification of uncertainties and of impacts on objectives
Step 4: Analysis and sensitivity analysis Step 5: Presentation of results Workshop results:
Step 1 - Problem Framing:
(A) Decision Makers There are a variety of organizations that make decisions related to selenium and ground disturbance (primarily mining) issues. The workshop group developed a list of these potential decision-makers to aid in understanding the types of decisions being made, and to aid in selecting one or more of these decision-makers to focus on for the workshop example (Table 1).
15
Table 1: Potential decision-makers for Selenium issues Decision maker Types of decisions Regulators - West Virginia Dept. Environ.
Protection - U. S. Environ. Protection Agency - U. S. Army Corps of Engineers - U. S. Fish & Wildlife Service - U. S. Office of Surface Mining - Various surface management agencies
- Leasing - Standard setting (e.g., regulatory
standards for maximum Se concentrations in environment)
- Permitting - Required mitigation measures - Conduct EIS - Invest in further studies - Regulation enforcement (what
regulations, where and when to enforce)
Community planners and development agencies - Land use planners - City planners - Local/regional economic development
agencies - County commissioners
- Land use and development practices - Zoning restrictions - Political & economic development
plans
Coal companies - Whether to pursue a given resource - Types of coal/conditions under which
to pursue - Mining practices
Research funders and research agencies - US Congress (appropriations) - USGS
- Which studies to fund
Special interest groups - Environmental activist groups - Conservation groups - Fishing and hunting organizations
- Allocation of resources
(B) Stakeholders
This group includes any party that might be impacted or otherwise interested in decisions regarding selenium. The list includes the decision-makers listed above, plus the following groups.
• State Departments of Transportation
• State Tourism Departments • Coal-dependent industries • Utility companies • Utility customers • Local landowners • Real estate developers
• Potential users of reclaimed land • Agricultural interests • Recreational users • Communities and the general
public (concerned local residents)
• Medical community
16
(C) Define scope and key components of the decision problem Following the identification of decision-makers and stakeholders, the group elected to focus on potential decisions faced by a state regulatory agency for the example problem. This decision made the path forward relatively straightforward and manageable within the time and resource constraints of the workshop. The decision was made after discussing alternatives which might have had more scientific content, but which would have been harder to map out in the time available.
(a) Objectives
In considering decisions that they must make regarding selenium, state regulators will have a set of “values” or objectives that they wish to satisfy in making those decisions. In the process, they also need to be aware of the objectives of other parties that may be affected by their decisions. The workshop participants split into two groups to develop objectives from diverse perspectives. Both groups were asked to address their interests as hypothetical stakeholders in a decision whether or not to grant a mining permit in a hypothetical region of current mountain top mining, in which there has been detection of selenium in some of the region’s watersheds. The figures below show the objectives from the regulator perspective (Figure 2) as well as the objectives from the perspective of an interested stakeholder group, in this case, a group of concerned citizens (Figure 3). (In a complete Decision Analysis, a number of objective hierarchies might be developed to illustrate the perspectives of all of the key stakeholder groups.) In the development of an objectives hierarchy, individual objectives are first identified. Then they are clustered into common themes with a final overarching objective defined to characterize the entire set. In the first example (Figure 2), a number of individual objectives were identified as significant for state regulators by workshop participants working in state regulatory agencies or those familiar with their work or by those providing information to help regulatory agents make decisions. These individual objectives were collected upward into the overall objective of “maximizing protection of public well-being.”
17
Overarching Objective
1st Order Objective
Individual Objectives
(not ordered)
Figure 2: Objectives hierarchy for state regulatory agency A second group, acting as a coalition of concerned citizens, selected objectives they would like to see addressed and met by the state regulatory agency. While their sets of objectives were larger and more diverse, it still summarized to an overarching objective of “maximize quality of life in community (short and long-term)”, a position very similar to that developed by the first group. Even though there was not a group to advocate a strong pro-mining position, potential mining objectives were captured by both groups as “maximize value of proposed mine location” and “maximize profitability of coal companies.”
Figure 3 Objectives hierarchy for “group of concerned citizens”
Overarching Objective
1st Order Objective
Individual Objectives
(not ordered)
18
When these two objective sets are combined, a resultant merged hierarchy (Figure 4) was developed by consensus of both breakout groups representing the two divergent perspectives. This combined hierarchy was carried forward to the next stage, where the objectives were organized into objectives hierarchies, a commonly used DA tool, where the overarching objective is listed at the top of the hierarchy, then successively broken down into smaller component objectivof the objective hierarchy is that is accommodates all recognized objectives that have been embraced by diverse stakeholders and thus is inclusive of all potential options inherent in thproblem. It allows the discussion to start optimistically with the distinct possibility that each stakeholder will have his or her key concerns integrated into an achievable solution. This mthe group to creative and non-obvious alternatives and breakthrough approaches. Whcompletion, this structuring leads to a set of defined and measurable objectives, with quantifiable metrics, at the lowest level of the hierarchy. Time did not permit a detailed definition of all lower level objectives and quantifiable metrics in the workshop examples.
es. The value
e
ay lead en taken to
hy
(b) Decisions and Alternatives
The group next identified a broad set of decisions that state regulators might make regarding selenium, potentially within a to-be-mined area; these are primarily focused on different components of permitting decisions. The following lists the components of various permitting decisions where the state regulator has flexibility in how the permit is constructed or issued.
Figure 4: Combined bjectives hierarco
OverarchingObjective
1st OrderObjectiv
IndividualObjectives
(not ordered)
e
19
Components of permitting decisions where state regulator has flexibility:
Rock core sampling requirements Number Location Analysis requirements
Mine design requirements Mining plan Retention pond design Placement of mined (or excavated) materials Mine-surface restoration approach Post-mining land use
Water quality monitoring requirements Types of elements, compounds, or ions to sample for Sampling frequency Monitoring requirements Permit limits
Water treatment appro
•
•
•
•• If Selenium become sting?
What animals, what methods, etc.
we consider all of the alternatives available for each of these decisions, the number of potential combin somewhat unwieldy for further analysis. Decision Analysts typically c
ach s a body burden standard2, what type of te
If
ations becomes very large, and reate a strategy table for managing the potentially large number of combinations to be
ives into
le permitting dec o special conditions) and
analyzed. It turns out that many of the alternatives would not make sense in combination; a strategy table is a means of organizing the different decisions and their associated alternatlogical “strategies.” Each strategy is composed of a combination of decisions and alternatives related to a certain theme. In our workshop example, the objective was to be able to make a knowledgeab
isi n (to either deny, grant, or grant with meet the primary objective to “maxim community (both short- and long-term)” (Figure 4). Figure 5 shows a strategy table constructed by all members of the Core Group, taking the perspective of the decisio ion. The main decisions are listed along the top, and different alternatives for each decision are shown in the column below that decision.
ize quality of life in the
n maker, to aid in this permitting decis
2 “B tance of a chemical present in an organism at a given time” (www.sis.n body burden standard” is the standard value against which a body burden value is compared.
ody burden” is the “total amount of subslm.nih.gov/Glossary/b.html). A “
20
otential strategy themes were constructed (see legend, Figure 5 and footnote 3). Using the table,
Figure 5: Example strategy table for permitting decisions Two (of many) possible scenarios are presented. A “conservative” decision maker would make “yellow” choices: require baseline Se sampling (+ in biota); Se analysis of core samples, with
3Pone can identify the combination of alternatives for that theme from the colored squares under eachdecision.
Legend
3 Potential strategy themes illustrated as possible alternative spoken viewpoints taken by a decision maker: a. “No worries”: I don’t think there is a real problem, here. I’m going to take a minimalist approach composed of
minimally active alternatives for each of the possible decisions. b. Monitoring-intensive: I don’t think there is a significant problem; however, I am going to monitor the situation
carefully, so if something develops, I can respond appropriately. c. Rely on special handling: I think there is a problem, here, but I believe that if I handle the Se-containing mined
material under special conditions, I can still meet my primary objective. d. Conservative: I think there is a problem, here, and I’m going to be very careful at every step along the way,
out any further monitoring or testing.
potentially being more careful than is required in every instance, “just in case.” e. Deny permit: I think there is a problem, here, and I don’t think anything can be done about it, so I’m going to deny
the permit with
21
increased core density; increased required core analysis; special handling for higher-selenium ontent strata; monitoring program includes limits on allowable selenium concentrations, and more
handling requirements for higher-selenium content strata; monitoring program does not clude limits on allowable selenium concentrations; and standard monitoring time intervals.
cfrequent monitoring. A decision maker who maintained a “no worries” position, would make “red” choices: no baseline Se sampling; no Se analysis of core samples; current, standard core analysis; no specialin
(c) Uncertainties
Next, the Core Group identified a number of measurable components, called “uncertainties” in the
• Speciation oo bioa
• Amelioration of Se released into the water
• Other sources of Se (disturbed areas; e.g., construction, highways, etc.)
model, around which an envelope of knowledge uncertainty may lie. The magnitude of the uncertainty around each of these measurable components will be important to understanding how different decisions will impact the objectives that the regulator cares about. The identified uncertainties are listed below. This list of uncertainties is by no means comprehensive, but was considered to be robust enough to provide a solid basis for the example problem.
• Regulatory limits o water based standard? o body burden standard?
• Amount of Se in stratigraphic units o spatial variability o rock type o elements present
• Se concentration in coal • Se from underground mining • Se concentrations in groundwater • Sorption and dissolution processes
o impact of pH and Eh • Mobilization of Se from rocks
f Se vailability of various species of Se
o time, distance, kinetic environment • Activities releasing/disturbing Se • Amount of selenium in disturbed areas (including valley fill)
• Bacterial reduction of oxidized species • Bioaccumulation rates • Uptake of Se by plant communities • Se concentrations in fish • Se concentrations in fowl • Exposure pathways for fish • Exposure pathways for fowl • Exposure pathway for humans
22
• Dose response for fish • Dose response for fowl • Dose response for humans • Synergistic effects with other chemicals (e.g., mercury) • Effectiveness of remediation approaches for Se in water (treatability)
Step 2 - Structuring and Modeling At this point, the key components of the decision problem have been identified: the Core Group’s set of objectives that they wish to measure, a set of strategies that could be pursued, and a set of uncertainties that will determine how things unfold under pursuit of different strategies. The structuring and modeling of Step 2 begin to link available alternatives to potential predictions in how they might affect desired outcomes (objectives). This initial structuring phase can be done in several different ways; in the workshop we used an influence diagram approach, another DA tool, to begin to construct a decision logic. The Core Group broke into two sub-teams to do this. One focused on selenium occurrence and release into the surface waters; the other focused on biologi
ptake and impact on mortality and morbidity. Figure 6 shows the several possiblcal
e decisions, nc a components), and objectives (desired outcomes), that were made before
uu ert inties (measurable any of the influences (decisi
on logic) had been identified.
6: Initial problem elements
Co r Scheme for Figures 6 & 7: Green rectangllo es = possible decisions; cyan ovals = uncertainties; angles = intermediate variables. Objectives were developed from
p ectives (fig. 4). Uncertainties are measurable components of the ncertainty is constructed.
red polygons = objectives; blue rectthe reviously defined first order objmodel, around which an envelope of u
Figure
23
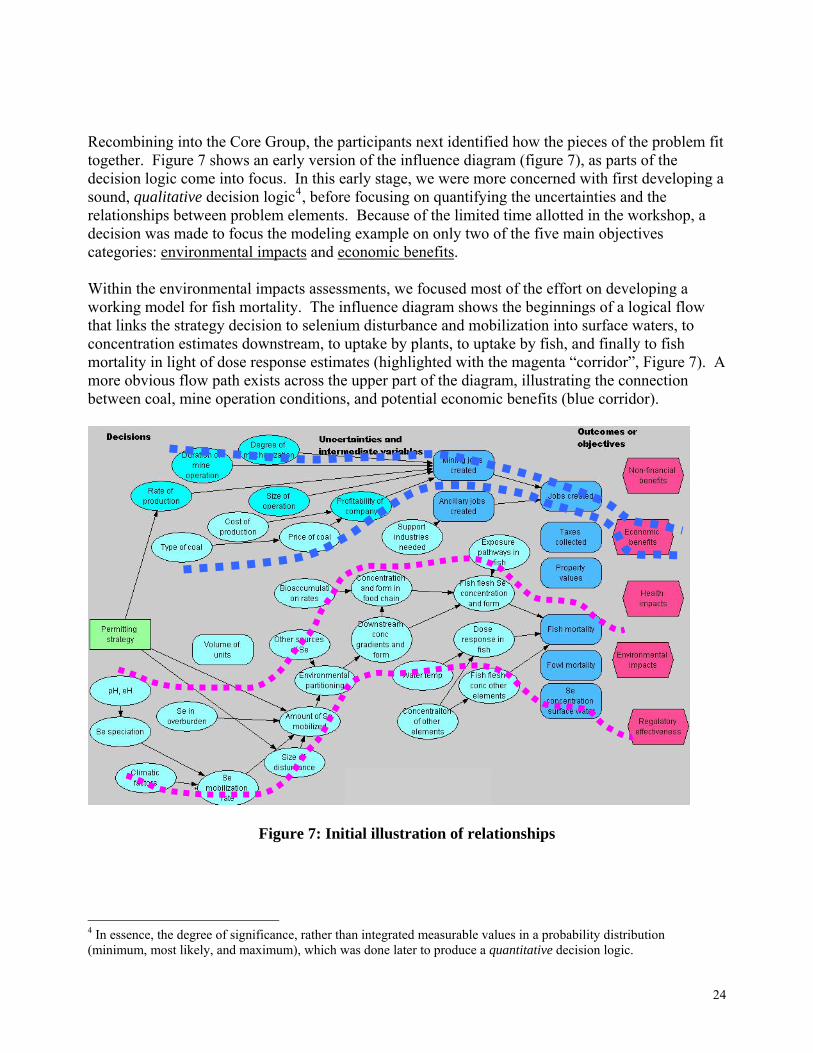
Recom the participants next identified how the pieces of the problem fit tog e am (figure 7), as parts of the dec ith first developing a sound,
ts. Because of the limited time allotted in the workshop, a
bining into the Core Group, eth r. Figure 7 shows an early version of the influence diagrision logic come into focus. In this early stage, we were more concerned w
qualitative decision logic4, before focusing on quantifying the uncertainties and the relationships between problem elemendecision was made to focus the modeling example on only two of the five main objectives categories: environmental impacts and economic benefits. Within the environmental impacts assessments, we focused most of the effort on developing a working model for fish mortality. The influence diagram shows the beginnings of a logical flow that links the strategy decision to selenium disturbance and mobilization into surface waters, to concentration estimates downstream, to uptake by plants, to uptake by fish, and finally to fish mortality in light of dose response estimates (highlighted with the magenta “corridor”, Figure 7). A more obvious flow path exists across the upper part of the diagram, illustrating the connection between coal, mine operation conditions, and potential economic benefits (blue corridor).
Figure 7: Initial illust ation of relationships r
4 In essence, the degree of significanc a probability distribution (minimum, most likely, and maximum), which was done later to produce a quantitative decision logic.
e, rather than integrated measurable values in
24
As the discussion within the Core Group continued and specific points were raised by the subject atter experts, the Geomatrix consultants, proficient with the DA software and its operation,
antify
n blue, the quantified ones in yellow,
nd the two key objectives that were ultimately computed are shown in red. All strategy themes are
Step 3 - Quantification
ne of the differentiating elements of Decision Analysis is its ability to quantify uncertainties, risk, nd resources. During the workshop modeling process, key uncertainties were quantified. Figure 9 hows an example quantification of the average selenium concentration in two of the overburden
rock layers, shown as a cumulative probability distribution. This probability distribution was
mconstructed the framework and modified it in real time as the decision took shape – with the process projected from a laptop computer onto a screen for all participants to view together. The “final” version of the influence diagram is shown in Figure 8. As the group began to quuncertainties and relationships among variables, the diagram was iteratively modified to reflect theevolving decision logic. Not all of the original components were quantified in the model. IFigure 8 below, the “unquantified” components are shown inabrought forward from Figure 5 and included in this version of the model.
The “unquantified” components are shown in blue, the quantified ones in yellow, and the two key objectives that were ultimately computed are shown in red.
Figure 8: Final illustration of relationships
Oas
25
developed by the group through a structured discussion, and reflects their subjective estimate of selenium concentration.
These group discussions on bracketing uncertainty were one of the most valuable aspects of e workshop. Typically, when the question of establishing what is known about a variable was
igure 9 illustrates one of the many “behind the scenes” probability distributions for all of the easurable components (“uncertainties”). In this instance, the modeled uncertainty around Se
iagram is brought up by clicking on the “Se overburden concentration” icon.
thposed by Jenni and Neiman, Geomatrix consultants, the subject matter experts claimed much was unknown or unknowable or required a great deal more study. As the conversation evolved under the artful guidance of Jenni and Neiman, we almost always found that we knew more than wethought we did and that many variables could be constrained much more than initially thought. The interplay of people with differing discipline expertise was critical to establishing uncertainty. Fmoverburden concentration is illustrated. With this particular computer program, the probability d
Figure 9: Example quantification of uncertainty, Se overburden concentration
26
Figure 10 shows another example of the quantification of uncertainty in a model parameter: the concentration increase in selenium in biota going from paraphyte to fish. Like Figure 9, Figure 10
an illustration of the behind the scenes functions which drive the quantification of the model. is
Figure 10: Example quantification of uncertainty, paraphyte to fish transfer
27
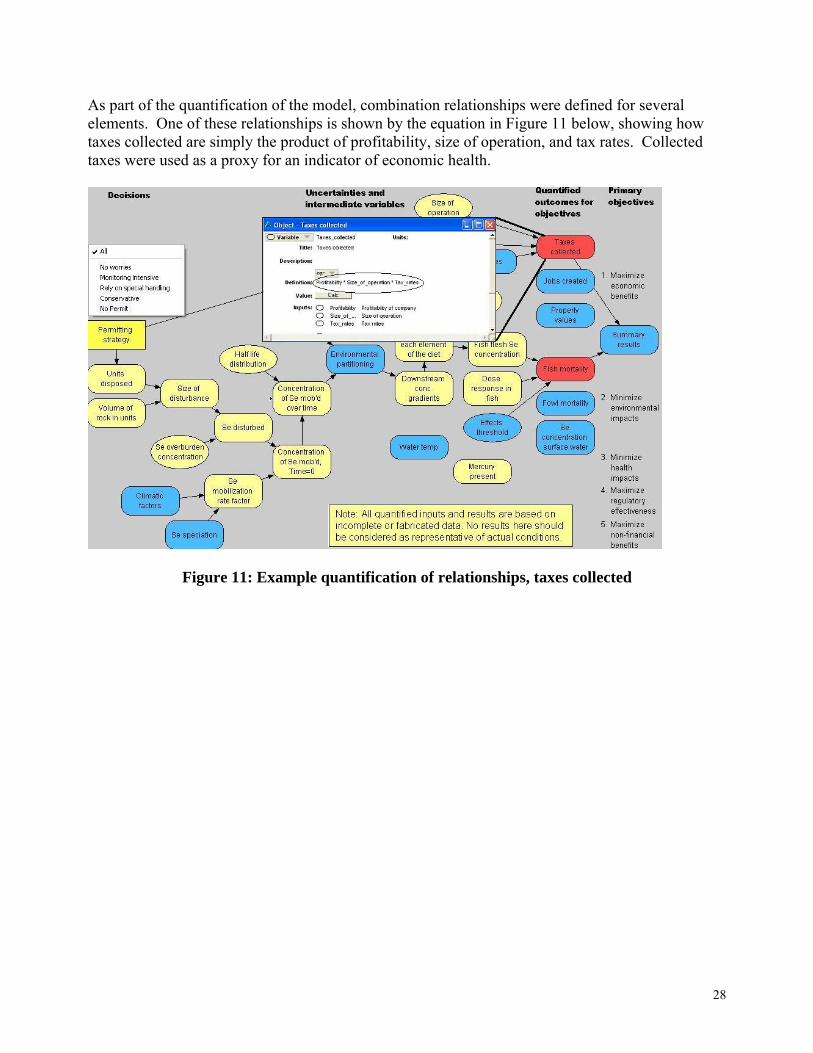
As part of the quantification of the model, combination relationships were defined for several elements. One of these relationships is shown by the equation in Figure 11 below, showing how taxes collected are simply the product of profitability, size of operation, and tax rates. Collected
xes were used as a proxy for an indicator of economic health. ta
Figure 11: Example quantification of relationships, taxes collected
28
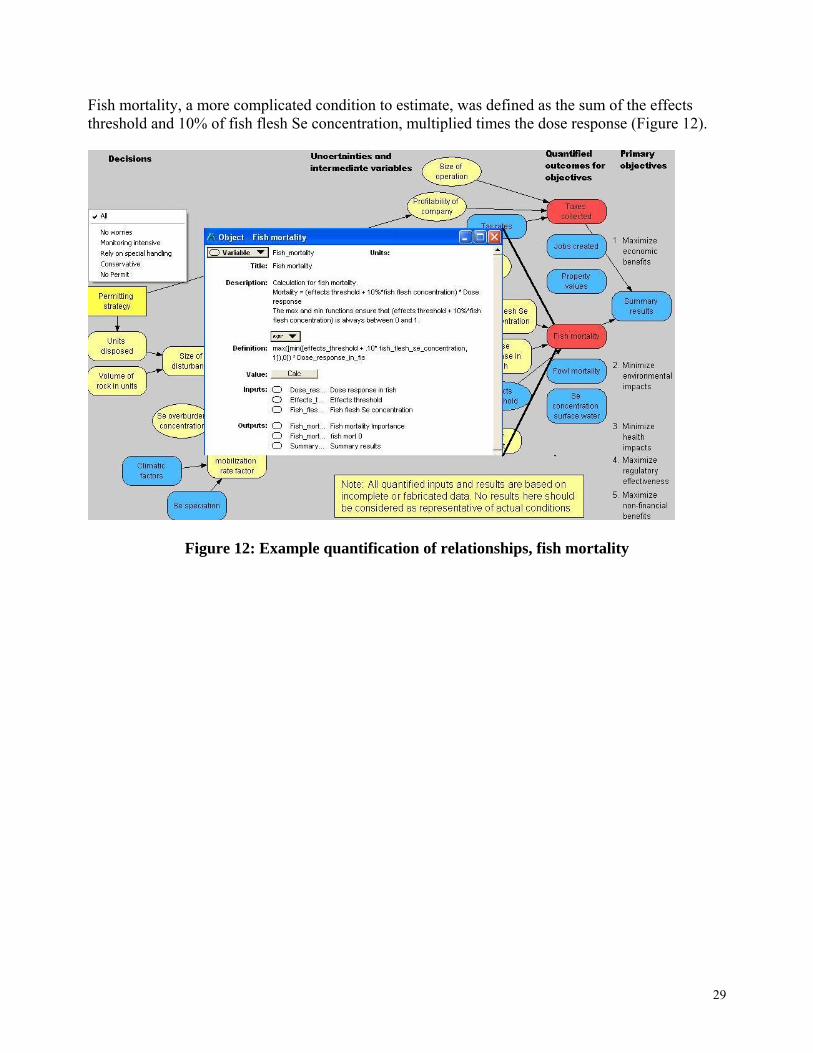
Fish mortality, a more complicated condition to estimate, was defined as the sum of the effectsthreshold and 10% of fish flesh Se concentration, multiplied times the dose response (Figure 12).
Figure 12: Example quantification of relationships, fish mortality
29
As parts of the model are completed, we began to calculate the impact on objectives. Figure 13 shows the calculated fish mortality rate over time (in years since an initial significant ground disturbance) for the different strategies, using the estimated model parameters (with uncertainty) illustrated in yellow in Figure 10. Note that the strategies cluster into two groups so that the five strategies are represented by only two different mortality profiles. Also, it’s important to note again that these results are not scientifically sound; the data used here were in large part specially created for this exercise to allow for completion of the exercise.
Figure 13: Example output: fish mortality (fraction dying) as a function of time and permitting strategy
30
Because all of the measured components (“uncertainties”) are actually described as probability istributions, well-crafted objectives (i.e., measurable objectives) can be modeled and viewed for
ic es of
deach of the employed strategies. For decisions requiring numerical comparison, such as economdecisions, the DA process conveys clearly the pathway, relationship sensitivities, and influencthe various possible decisions, relevant uncertainties, and outcomes. Figure 14 shows such an output, with the resultant tax revenue for different jurisdictions for the different strategies.
Figure 14: Example output: tax revenue as a function of permitting strategy
31
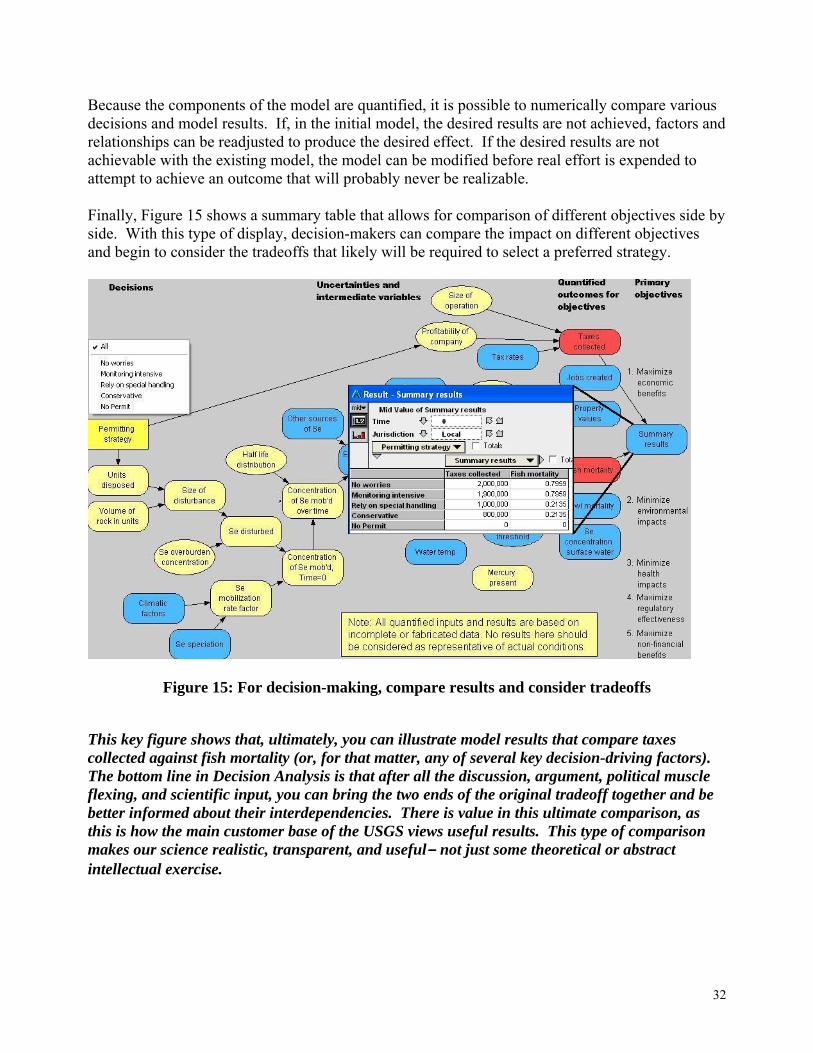
Because the components of the model are quantified, it is possible to numerically compare variodecisions and model results. If, in the initial model, the desired results are not achieved, factors anrelationships can be readjusted to produce the desired effect. If the desired results are not achievable with the existing model, the model can be modified before real effort is expended to attempt to achieve an outcome that will probably never be realizable.
us d
inally, Figure 15 shows a summary table that allows for comparison of different objectives side by side. With this type of display, decision-makers can compare the impact on different objectives and begin to consider the tradeoffs that likely will be required to select a preferred strategy.
F
Figure 15: For decision-making, compare results and consider tradeoffs This key figure shows that, ultimately, you can illustrate model results that compare taxes collected against fish mortality (or, for that matter, any of several key decision-driving factors). The bottom line in Decision Analysis is that after all the discussion, argument, political muscle flexing, and scientific input, you can bring the two ends of the original tradeoff together and be better informed about their interdependencies. There is value in this ultimate comparison, as this is how the main customer base of the USGS views useful results. This type of comparison makes our science realistic, transparent, and useful- not just some theoretical or abstract intellectual exercise.
32
Step 4 - Analysis and sensitivity analysis Time did not permit significant analysis of the constructed model, aside from simple comparisonof outcomes illustrated above. If this work is continued with more rea
s listic data, additional
Step 5 - Presentation of results A short presentation of the results was made to the larger Guiding Group at the end of the workshop. Feedback and recommendations for future project ideas were solicited. They are summarized below. Summary and Conclusions from Workshop: Any satisfactory learning experience creates more questions than answers. This was certainly true of this experience. By getting a glimpse of what “the other guy” sees and needs to know, it quickly became apparent how limited our present approaches are to defining and solving scientific problems AND THEN communicating our results in effective terms to decision makers and other stakeholders. A list of some of these questions is presented in Appendix II. At the end of the three-day exercise, at a time when individuals should be eager to quickly wrap things up and go home, there was an unusually high level of energy and enthusiasm among the members of the Core Group. This energy level was noticed by most in the returning members of the Guiding Group, who came back to hear a summary presentation of what the Core Group had learned and developed. A series of questions were posed to the Guiding and Core Groups (see Appendix III) to attempt to learn how DA was interpreted and received. The responses were wide
nging, but, for the most part, all were positive.
was invigorating to see highly respected scientists come together to discuss what they knew AND id not know about their component of the issue and potential new areas of research that could be
The Next Steps/Stages:
analyses and sensitivities would be conducted to gain insight into decisions, and to understand data gaps and which uncertainties warrant additional efforts to better understand the decisions and serve the decision-makers’ needs.
ra
Itdundertaken to fill in some of the gaps. The Core Group dispersed at the end of the workshop thinking that if they had the money and the time, they could immediately address several newly identified issues around selenium in Appalachian watersheds and works towards an integrated method for helping decision makers make more informed decisions. The Guiding Group saw otheropportunities to employ DA in many other themes ranging from organizational restructuring to thematic initiative planning.
Following the conclusion of the workshop, it became very apparent to the organizers, presenters, and Core Group participants that we had only scratched the surface of what could be done by
33
applying Decision Analysis processes to the issues of selenium in the watershed. Several participants were highly interested in using Geomatrix Consultants to bring DA tools into other,
ringing disparate stakeholders together to discuss and
ples and processes as involved in the workshop, followed by a summary of the workshop and outcomes. This report is the first
ent.
t and osal
is proposal was reviewed, modified, and accepted for future USGS Decision Analysis work. Some of our non-USGS workshop participants expressed a strong desire
process into our regular scientific research. BLM for a possible follow-on DA project with
implemented. Work
r
6
ncorporating this into the management and
currently active opportunities that involve bmove forward on issues. Three courses of action were agreed upon:
1. In order to raise internal awareness of the power of the DA process and tools, review with USGS management Decision Analysis princi
step in delivering this elem 2. Develop with Geomatrix a consulting structure where they could be involved in curren
future USGS integrative work. Geomatrix provided to the USGS a draft contract propto do this. Th
that we pursue incorporating this type of work In mid 2006, discussions were begun withtheir Eastern States field office.
3. Develop a proposal to use Decision Analysis to address the full scope of the selenium issue
across the multiple disciplines involved within the USGS and outside stakeholders and decision makers. Geomatrix provided to the USGS a draft proposal as part of their follow-up on the workshop. This proposal has been reviewed, discussed, andbegan in FY06, with initial deliverables due at the end of FY06.
Additional opportunities for review of the potential use of Decision Analysis were also planned foseveral upcoming consortia meetings and technical reviews, such as the USGS-sponsored Appalachian Basin Workshop (May 9 – 11, 2005) and the Leadership 101 training course (May 1– 20, 2005). Opportunities to use Decision Analysis in modernizing National Environmental Policy Act (NEPA) implementation are being investigated. Attempts to review this with CEQ are also being considered. Discussion has begun on iemployee development training curricula.
34
Contacts for further information on Decision Analysis and its application in the geoscience USGS: Jim Coleman, Team Chief Scientist, Eastern Energy Resources Team, Reston, VA
Tim Nieman, Senior Decision Analyst, Oakland, CA (510) 663-4152, [email protected]
35
References Cited Andreo ngton Tutorial In Environmental And Occupational Health, 24 p. (available online at http://www.gwu.edu/~macche/presentations/Selenium.pdf) (access
Environmental Protection Agency, 2004, Notice of draft aquatic life criteria for Selenium and request , 2004), v. 69, no. 242
co Bay-elta E ffects of a proposed San Luis drain extension: U. S. Geological Survey
McCre d testing joint fact-finding for environm arterly, v. 18, n. 4, p. 329 – 348.
National Institutes of Health, 2003 (updated 2004), Dietary Supplement Fact Sheet: Selenium (available on line at http://ods.od.nih.gov/factsheets/selenium.asp) (accessed September 2, 2005).
National Research Council, 2001, Future roles and opportunities for the U. S. Geological Survey: National Academy Press, Washington (DC), 179 p.
Polakovic, G., 1993, Selenium: a necessity of life, but not too much or too little: The Press-Enterprise, (www.sci.sdsu.edu/salton/SeTooMuchTooLittle.html) (accessed September 2, 2005).
Skorupa, J., 1993, quote from Polakovic, 1993, Selenium: a necessity of life, but not too much or too little: The Press-Enterprise, (www.sci.sdsu.edu/salton/SeTooMuchTooLittle.html) (accessed September 2, 2005).
U. S. Department of Health and Human Services, 2003, Toxicological profile for selenium: U. S. Department of Health and Human Services, 457 p. (available online at http://www.atsdr.cdc.gov/toxprofiles/tp92.html) (accessed September 2, 2005).
Worldwide Web References:
A Brief History of Decision Support Systems: http://dssresources.com/history/dsshistory.html (accessed September 1, 2005)
A Lexicon of Decision Making: http://faculty.fuqua.duke.edu/daweb/lexicon.htm (accessed September 1, 2005)
tti, G., 2003, Selenium: George Washi
ed September 2, 2005).
for scientific information, data, and views: Federal Register (December 17, p. 75541 – 75546.
Luoma, S. N. and T. S. Presser, 2000, Forecasting selenium discharges to the San FrancisD stuary: ecological e
ile Report 00-416, 171 p. (available online at http://S
ary, S. T., J. K. Gamman, and B. Brooks, 2001, Rental dispute resolution: ten years of success: Mediation Qu
National Institutes of Health Toxicology Glossary “B”: http://sis.nlm.nih.gov/enviro/glossaryb.html(accessed August 26, 2006)
Selenium: http://www.gwu.edu/~macche/presentations/Selenium.pdf (accessed September 2, 2005).
Selenhttp://minerals.usgs.gov/minerals/pubs/commodity/selenium/selenmcs06.pdf (accessed August 2006)
Stakeholder Analysis: http://erc.msh.org/quality/ittools/itstkan.cfm (accessed September 1, 2005)
Toxicological profile for selenium http://www.atsdr.September 2, 2005).
USGS Seminar: Joint Fact Finding – Finding Your Way through the Thicket of Science IntensiveDisputes: http://www.doiu.nbc.gov/usgsseminar.html (accessed September 1, 2005)
Appendices Appendix I: Findings from 3 case studies in DA presented by Geomatrix Consultants.
• Internal agreement that the “right” portfolio was selected
objectives
rocess led to consensus among stakeholders
ng of a preferred strategy including the range of potential costs, and
• DA allowed us to place uncertainty bounds around remediation effectiveness estimates s difficult or not yet available.
web-based radiation exposure application: • Allowed complicated decision models to be made available and usable by the general
• Focused on providing a single, usable measure for end-user health decisions needs
For Yucca Mountain:
• Understanding from technical experts as to why activities were included or excluded • Explicit incorporation of management values and how tradeoffs are made among
competing For the perchlorate site:
• The DA po The process is transparent, traceable, and defensible. o The process facilitated discussion and shared understanding.
• Clear understandicost drivers.
• Considerations of failure likelihoods and consequences changed preferred decisions.
where modeling wa For the
public
• Analysis, application design, and presentation format all driven by decision maker
38
Appendix II: Core Group Participants:
elenium stratigraphy
Jon Ko gy issues Bruce D wmanageme n-making
f Land Management Eastern States Field Office): land use issues associa Jim Luppens (USG E technical issues, env Hugh B a al fields, l
at Campbell (West Virginia Department of Environmental Protection) Regulatory issues esource and extraction needs with preserving
environme Doug Cham al extract Allan Kolker (USGS Eastern Energy Resources Team): Mineralogy of trace constituents in coal and the effect of texture, morphology and composition on speciation of selenium and its release into the environment Joe Skorupa (US Fish & Wildlife Service): expertise in the biology of fish, general ecology, dynamics and interdependencies of natural systems as they impact the potential mobilization of selenium and its potential pathways of movement in the West Virginia coalfields. Pete Albers (USGS Patuxent Wildlife Research Center): biology and broad understanding of and expertise in ecosystems biology Jim Coleman (USGS Eastern Energy Resources Team): team chief scientist, environmental issues associated with coal geochemistry and stratigraphy Ione Taylor (USGS Eastern Region Deputy Director): customer and partner relations; science planning, coordination, and performance assurance for Eastern Region Karen Jenni (Insight Decisions LLC, formerly with Geomatrix Consultants): Decision Analyst, workshop developer and instructor
Blaine Cecil (USGS Eastern Energy Resources Team): coal genesis and geochemistry and s
lak (USGS Energy Program): aqueous geochemistry and ener
a son (Bureau of Land Management Eastern States Field Office): natural resource nt and land use decisio
Stuart Granger (Bureau o
ted with energy resources
S astern Energy Resources Team): coal mining regulatory and ironmental impacts associated with coal extraction
ev ns (USGS West Virginia Water Science Center): hydrologic issues associated with cocoa mining and the environmental effects of coal on stream flow and water quality
Passociated with coal mining and balancing energy r
ntal quality
bers (USGS West Virginia Water Science Center): hydrologic impacts of coion in West Virginia
39
Tim Nieman (Geomatrix Consultants, Inc.): Decision Analyst, workshop developer and instructor
aye Lunsford (USGS HQ Water Resources Discipline): USGS partnership with EPA, in addition GS science more
seful for the NEPA process and
ee Development): in employee development, adult arning and shared best practices within the USGS
n Geologist’s office): science planning and oversight, USGS source specialist for selenium
decision analysis, science ssistance, and economics
Additional Involved Core Group Participants: Jto the workings and process for environmental impact statements and making USu Laure Wallace (USGS HQ Office of Employle Jim McNeal (USGS Eastern Regiore Lynne Koontz (USGS Fort Collins Science Center): policy anda
40
Appendix III: Post-workshop Questions and Answers At the end of the workshop with Core Group and Guidance Group recombined and following a
resentation of the model process and results, the following questions were posed to the audience:
How could this process be used from your perspective?
the DA process? Did you see yourself in the process?
hese are their collected responses:
uiding Group still in attendance was definitely the way to go!
• The Geomatrix consultants meshed well with the Core and Guiding Groups, creating just the right group of people for the workshop.
• The Guiding Group was amazed at energy of Core Group at the end of 3 days. They wanted to know how did USGS disciplines come together so well?
• In a workshop setting it is relatively easy to listen and learn, because there was no real threat index and no funding consequences; how will it work in the “real world” with real contention?
• The DA process has an advantage in properly managing the input to the process in a transparent and documented way. Scientific egos do not get in the way.
• DA leaves a strong record of how you reached a decision, because the record of decisions is left behind within the process decision documents. This helps the user clearly document a decision process to better address future questions.
• The DA process is the best structural process ever seen for building a conceptual model. • The treatment of uncertainty and sensitivity is valuable for understanding options and decisions. • The DA process has built in tools for process/product/function. • Do NOT do a train-the-trainer approach. Rather, we need an expert (or experts) who can
manipulate the software for the working group real time. • DA can help identify keystone research needs. • DA lays out whole model in one place in just a few figures. There are no walls covered with
flip charts. • In the DA process, the stakeholders identify the most important issues. • The DA process can encompass the highly quantitative results model versus a highly qualitative
results model. • The resultant DA model helps bring people together; they can go away and still stay on track
with model as a guide • The DA process has a layered process to address scale issues and keep you straight on where
you are scale-wise and process-wise. • Since the decision model is dynamic, somebody must update model; it probably needs to be
constantly tweaked.
p
What surprised you? What did you learn?
What were the most valuable aspects of this approach? Do you have any cautions or concerns about
What should be the role of science in the process? T • Having the subject matter experts talk with the G
41
• A recognized downside to the approach, is that the DA framework/software works best for making decision based on money (or other quantifiable elements). It doing so, it quantifies
Under the table issues are retrievable, put on top of table and examined by other experts. • e in identifying data gaps early and clearly identifying objectives. • cus on the issues. • SGS] could do. It could be
• n this, specific issue
• your organization can best use the tools. The DA process can take complicated issues and put them into a context.
aining session around the issue. From a regulator perspective, in an ideal world, the DA process would get all of the tradeoffs
s of the decision-making. DA has the ability to play with sensitivities, and help
do not know.
e the drivers are. It is semi-
•
tradeoffs and acknowledges softer values for various stakeholders. In the end, you know youare heard.
•Th re is recognized value The DA process forces foThe DA process takes the second-guessing out of what we [Uapplied to workforce planning or to the hazards initiative. The DA process may not work as well on generic issues as it did oexample. There is value in early training to “prime the pump” so
•• The DA process can serve as a tr•
on the table up front. The DA process could be used to understand the uncertainty around the various elementunderstand the research needs. In a litigious environment, need a reproducible decision process. DA forces you to see what you
• DA helps everyone who is working together to get a good list on what can be bought into. Sensitivity analysis can be conducted to see what and wherquantitative and helps you focus your work. Everyone had plenty to say and was engaged; we brought into the process any remaining skeptics by the end of day 3.
42
pendix IV: Outstanding Issues -- Good questions for which we had no immediate answers:
• How to t
Ap
ransfer this to National Environmental Policy Act (NEPA) process? id
to listen and learn, because there was no real al
• Guiding group – amazed at energy of core group at the end of 3 days. Asked: How dUSGS disciplines come together? How did group use partner and stakeholder data?
• In a workshop setting it is relatively easythreat index and no funding consequences; how will it work in the “real world” with recontention?
• Question: should USGS convene these types of meetings or just participate? • Concern – how will this work when there is real contention? • How to incorporate multiple models into your decisions? • Stakeholders- who do you pick?