A worldwide SRTM terrain database suitable for aviation use J. Schiefele *a , M. Launer a , C. Pschierer a , D. Howland b , B. Dorrell b , M. Fox b a Jeppesen, Frankfurt, Germany b Jeppesen, Denver, CO, USA ABSTRACT In the past Jeppesen has built and distributed worldwide terrain models for several Terrain Awareness and Warning Systems (TAWS) avionics clients. The basis for this model is a 30 arc-second NOAA Globe dataset with higher resolution data used where available (primarily in the US). On a large scale however these terrain models have a 900m (3000ft) resolution with errors that can often add up to 650m (1800ft) vertically. This limits the use of these databases to current TAWS systems and is deemed unusable for other aviation applications like SVS displays that require a more resolute and accurate terrain model. To overcome this deficiency, the target of this project was to develop a new worldwide terrain database providing a consistent terrain model that can be used by current (TAWS) and future applications (e.g. 2D moving maps, vertical situation displays, SVS). The basis for this project is the recently released SRTM data from NGA that provides a more resolute, accurate and consistent worldwide terrain model. The dataset however has holes in the peak and valley regions, desert, and very flat areas due to irrecoverable data capture issues. These voids have been filled using new topography algorithms developed in this project. The error distribution of this dataset has been analyzed in relation to topography, acquisition method and other factors. Based on this analysis, it is now possible to raise the terrain a certain amount, such that it can be guaranteed that only a certain number of real terrain points are higher than the data stored in the terrain database. Using this method, databases for designated confidence levels of 10 -3 , 10 -5 and 10 -8 – called TerrainScape level 1 - 3 – have been generated. The final result of the project is a worldwide terrain database with quality factors sufficient for use in a broader range of civil aviation applications. Keywords: SRTM, worldwide terrain database, aviation use 1. INTRODUCTION The goal of this project was to develop a new worldwide terrain database for use in current (TAWS) and future aviation applications (e.g. 2D moving maps, vertical situation displays, SVS). This means that the new database must not only have a high resolution but also high data quality requirements. The database should be based on the SRTM dataset. The first step to reach this goal was to remove known deficiencies like void areas from the SRTM datasets (chapter 3). Second, the resulting terrain model has been analyzed and selective buffering envelopes added, such that confidence levels of 10 -3 , 10 -5 or 10 -8 can be guaranteed. 2. STATE-OF-THE-ART OF TERRAIN DATABASES 2.1. Current Terrain Databases in Aviation Prior to the SRTM mission, high-resolution worldwide datasets were not readily available for commercial aviation applications. Lower-resolution terrain data have been available from the National Oceanic and Atmospheric Administration (NOAA, GLOBE) and the U.S. Geological Survey (USGS, GTOPO30). Additionally, many countries * [email protected], phone +49-6102-50-8425; fax +49-6102-50-8463 Enhanced and Synthetic Vision 2006, edited by Jacques G. Verly, Jeff J. Guell Proc. of SPIE Vol. 6226, 622604, (2006) · 0277-786X/06/$15 · doi: 10.1117/12.664898 Proc. of SPIE Vol. 6226 622604-1
Transcript
A worldwide SRTM terrain database suitable for aviation use
J. Schiefele*a, M. Launera, C. Pschierera, D. Howlandb, B. Dorrellb, M. Foxb a Jeppesen, Frankfurt, Germany b Jeppesen, Denver, CO, USA
ABSTRACT In the past Jeppesen has built and distributed worldwide terrain models for several Terrain Awareness and Warning Systems (TAWS) avionics clients. The basis for this model is a 30 arc-second NOAA Globe dataset with higher resolution data used where available (primarily in the US). On a large scale however these terrain models have a 900m (3000ft) resolution with errors that can often add up to 650m (1800ft) vertically. This limits the use of these databases to current TAWS systems and is deemed unusable for other aviation applications like SVS displays that require a more resolute and accurate terrain model.
To overcome this deficiency, the target of this project was to develop a new worldwide terrain database providing a consistent terrain model that can be used by current (TAWS) and future applications (e.g. 2D moving maps, vertical situation displays, SVS).
The basis for this project is the recently released SRTM data from NGA that provides a more resolute, accurate and consistent worldwide terrain model. The dataset however has holes in the peak and valley regions, desert, and very flat areas due to irrecoverable data capture issues. These voids have been filled using new topography algorithms developed in this project.
The error distribution of this dataset has been analyzed in relation to topography, acquisition method and other factors. Based on this analysis, it is now possible to raise the terrain a certain amount, such that it can be guaranteed that only a certain number of real terrain points are higher than the data stored in the terrain database. Using this method, databases for designated confidence levels of 10-3, 10-5 and 10-8 – called TerrainScape level 1 - 3 – have been generated.
The final result of the project is a worldwide terrain database with quality factors sufficient for use in a broader range of civil aviation applications.
Keywords: SRTM, worldwide terrain database, aviation use
1. INTRODUCTION The goal of this project was to develop a new worldwide terrain database for use in current (TAWS) and future aviation applications (e.g. 2D moving maps, vertical situation displays, SVS). This means that the new database must not only have a high resolution but also high data quality requirements.
The database should be based on the SRTM dataset. The first step to reach this goal was to remove known deficiencies like void areas from the SRTM datasets (chapter 3). Second, the resulting terrain model has been analyzed and selective buffering envelopes added, such that confidence levels of 10-3, 10-5 or 10-8 can be guaranteed.
2. STATE-OF-THE-ART OF TERRAIN DATABASES
2.1. Current Terrain Databases in Aviation Prior to the SRTM mission, high-resolution worldwide datasets were not readily available for commercial aviation applications. Lower-resolution terrain data have been available from the National Oceanic and Atmospheric Administration (NOAA, GLOBE) and the U.S. Geological Survey (USGS, GTOPO30). Additionally, many countries
Enhanced and Synthetic Vision 2006, edited by Jacques G. Verly, Jeff J. GuellProc. of SPIE Vol. 6226, 622604, (2006) · 0277-786X/06/$15 · doi: 10.1117/12.664898
Proc. of SPIE Vol. 6226 622604-1
r -
I
publish a high-resolution dataset for their own territory with proprietary quality factors. To compose a worldwide terrain dataset, it has been necessary to use different sources of terrain data. As of 2005 the Jeppesen terrain database was built from 28 sources of terrain data which were derived from cartographic, satellite and aircraft collected terrain models (see Figure 1).
Figure 1 Distribution of terrain data sources before SRTM.
Each of these data sources has its own horizontal and vertical accuracy quality statement. Depending on the source of data, the vertical relative accuracies range from ±3m up to ± 650m (!) at a 90% confidence level. The terrain model computed from these different data sources is a 30 arc-second model which means elevation sample points are approximately 900m apart. A 1x1degree tile with this postspacing has 120x120 elevation points creating an elevation matrix of 14,400 elevation values. The highest elevation within each 900m x 900m cell is provided as the maximum elevation dataset to TAWS clients. This terrain model satisfies the current TSO-C151b Terrain Awareness and Warning System requirements [1], but it does not satisfy DO-276A Area 1 requirements [2].
Figure 2 TAWS display of terrain data.
Proc. of SPIE Vol. 6226 622604-2
SRTIVI COVERADENIARso -
-150 -120 -90LANO•1 a sU •
C
3D - -
0-,
-30
•1
-ED -—_t__ —-——
LDNDITUDE
Figure 2 shows a depiction of terrain data in a TAWS display. Such displays are intended to provide terrain awareness only and are not to be used for navigational purposes (i.e. advisory). For future applications like Synthetic Vision Displays a high-resolution database is needed, but the data quality shall still meet the TSO-C151b requirements.
2.2. SRTM Data The Shuttle Radar Topography Mission (SRTM) of February 2000 was spearheaded by the National Geospatial-Intelligence Agency (NGA), the National Aeronautics and Space Administration (NASA) and other international agencies. The sensor used was a modified C-Band radar with the transmitting antenna installed in the bay of the Space Shuttle Endeavor with two receivers, one in the bay and another on a deployed mast. The interferometric baseline of this configuration was 60m, enabling the system to capture 225km swaths with a resolution of 1 arc-second (30 meters) in one pass.
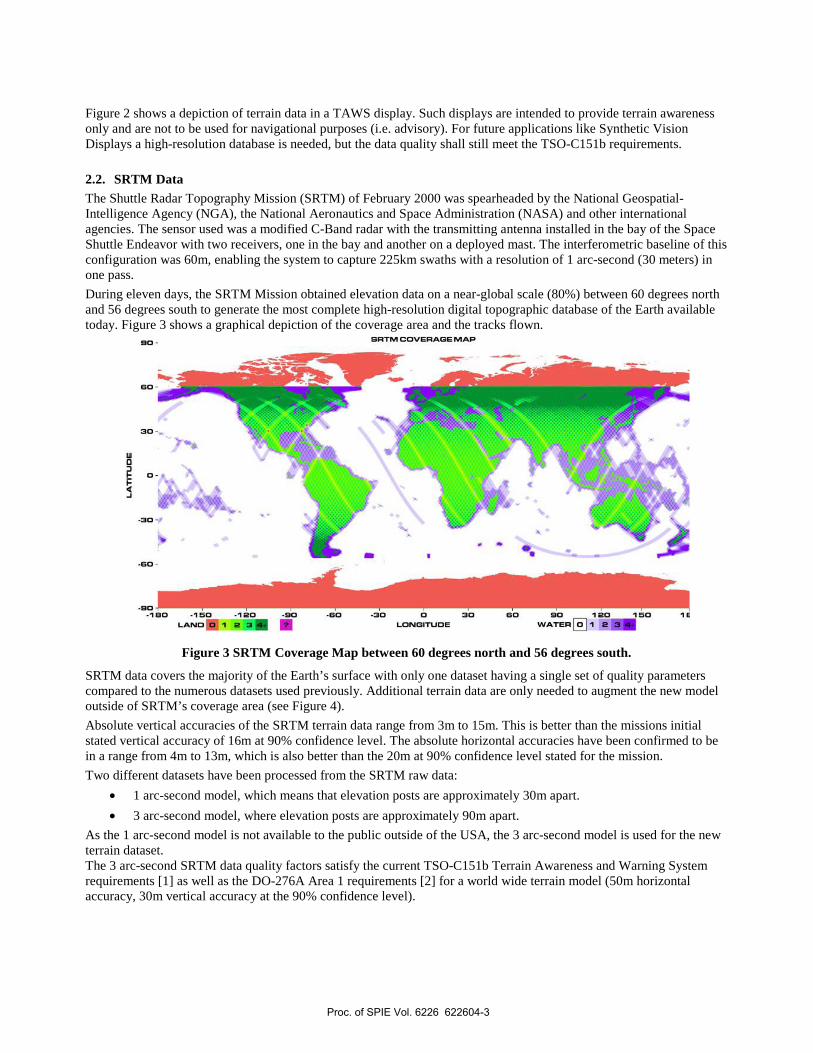
During eleven days, the SRTM Mission obtained elevation data on a near-global scale (80%) between 60 degrees north and 56 degrees south to generate the most complete high-resolution digital topographic database of the Earth available today. Figure 3 shows a graphical depiction of the coverage area and the tracks flown.
Figure 3 SRTM Coverage Map between 60 degrees north and 56 degrees south.
SRTM data covers the majority of the Earth’s surface with only one dataset having a single set of quality parameters compared to the numerous datasets used previously. Additional terrain data are only needed to augment the new model outside of SRTM’s coverage area (see Figure 4).
Absolute vertical accuracies of the SRTM terrain data range from 3m to 15m. This is better than the missions initial stated vertical accuracy of 16m at 90% confidence level. The absolute horizontal accuracies have been confirmed to be in a range from 4m to 13m, which is also better than the 20m at 90% confidence level stated for the mission.
Two different datasets have been processed from the SRTM raw data:
• 1 arc-second model, which means that elevation posts are approximately 30m apart.
• 3 arc-second model, where elevation posts are approximately 90m apart.
As the 1 arc-second model is not available to the public outside of the USA, the 3 arc-second model is used for the new terrain dataset. The 3 arc-second SRTM data quality factors satisfy the current TSO-C151b Terrain Awareness and Warning System requirements [1] as well as the DO-276A Area 1 requirements [2] for a world wide terrain model (50m horizontal accuracy, 30m vertical accuracy at the 90% confidence level).
Proc. of SPIE Vol. 6226 622604-3
•1-'
_-t jd'fr
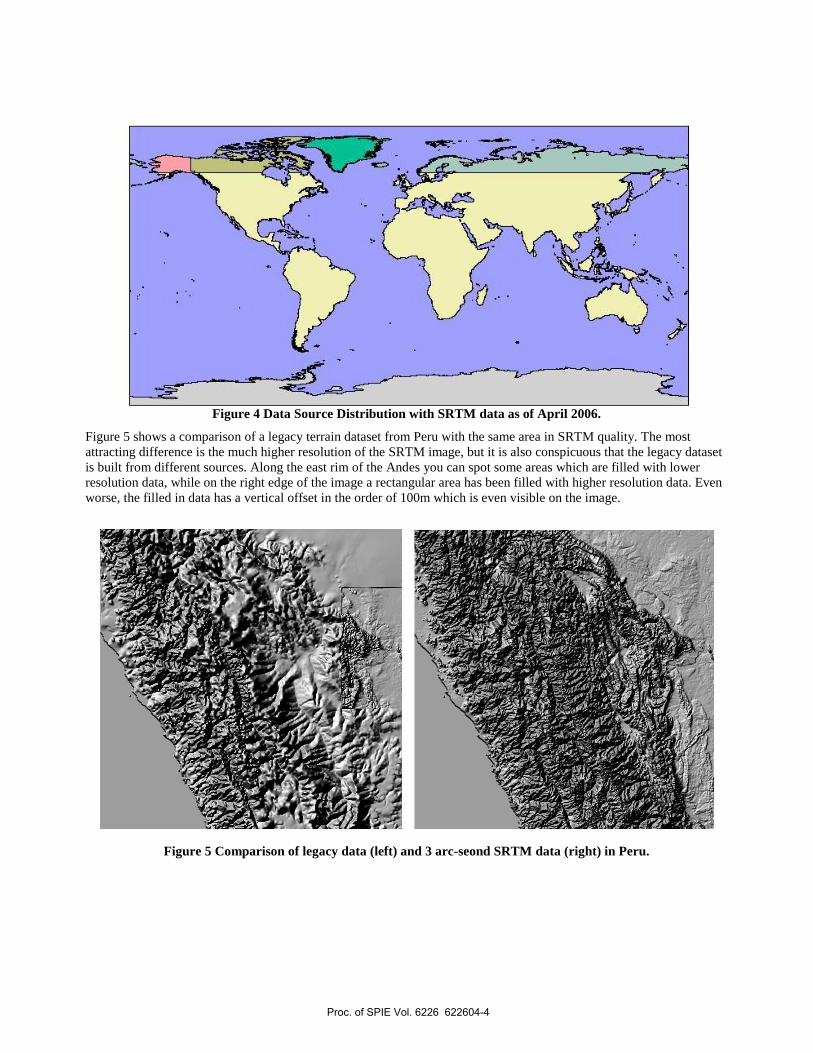
Figure 4 Data Source Distribution with SRTM data as of April 2006.
Figure 5 shows a comparison of a legacy terrain dataset from Peru with the same area in SRTM quality. The most attracting difference is the much higher resolution of the SRTM image, but it is also conspicuous that the legacy dataset is built from different sources. Along the east rim of the Andes you can spot some areas which are filled with lower resolution data, while on the right edge of the image a rectangular area has been filled with higher resolution data. Even worse, the filled in data has a vertical offset in the order of 100m which is even visible on the image.
Figure 5 Comparison of legacy data (left) and 3 arc-seond SRTM data (right) in Peru.
Proc. of SPIE Vol. 6226 622604-4
H
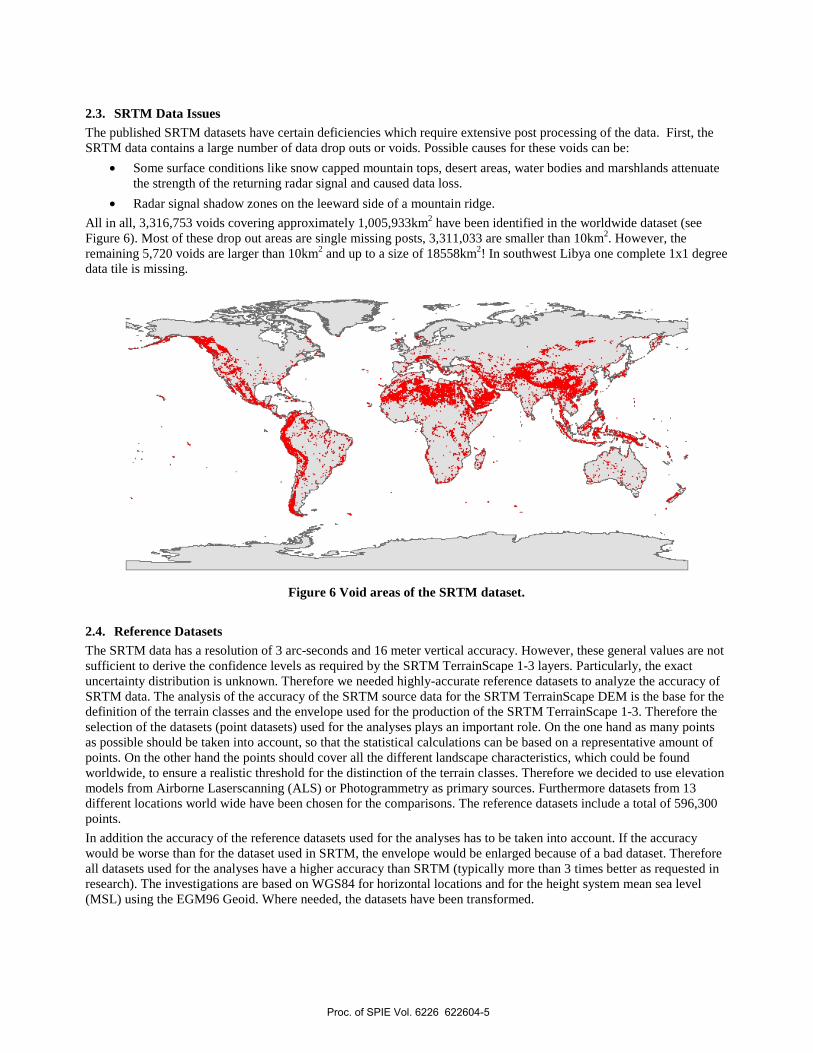
2.3. SRTM Data Issues The published SRTM datasets have certain deficiencies which require extensive post processing of the data. First, the SRTM data contains a large number of data drop outs or voids. Possible causes for these voids can be:
• Some surface conditions like snow capped mountain tops, desert areas, water bodies and marshlands attenuate the strength of the returning radar signal and caused data loss.
• Radar signal shadow zones on the leeward side of a mountain ridge.
All in all, 3,316,753 voids covering approximately 1,005,933km2 have been identified in the worldwide dataset (see Figure 6). Most of these drop out areas are single missing posts, 3,311,033 are smaller than 10km2. However, the remaining 5,720 voids are larger than 10km2 and up to a size of 18558km2! In southwest Libya one complete 1x1 degree data tile is missing.
Figure 6 Void areas of the SRTM dataset.
2.4. Reference Datasets The SRTM data has a resolution of 3 arc-seconds and 16 meter vertical accuracy. However, these general values are not sufficient to derive the confidence levels as required by the SRTM TerrainScape 1-3 layers. Particularly, the exact uncertainty distribution is unknown. Therefore we needed highly-accurate reference datasets to analyze the accuracy of SRTM data. The analysis of the accuracy of the SRTM source data for the SRTM TerrainScape DEM is the base for the definition of the terrain classes and the envelope used for the production of the SRTM TerrainScape 1-3. Therefore the selection of the datasets (point datasets) used for the analyses plays an important role. On the one hand as many points as possible should be taken into account, so that the statistical calculations can be based on a representative amount of points. On the other hand the points should cover all the different landscape characteristics, which could be found worldwide, to ensure a realistic threshold for the distinction of the terrain classes. Therefore we decided to use elevation models from Airborne Laserscanning (ALS) or Photogrammetry as primary sources. Furthermore datasets from 13 different locations world wide have been chosen for the comparisons. The reference datasets include a total of 596,300 points.
In addition the accuracy of the reference datasets used for the analyses has to be taken into account. If the accuracy would be worse than for the dataset used in SRTM, the envelope would be enlarged because of a bad dataset. Therefore all datasets used for the analyses have a higher accuracy than SRTM (typically more than 3 times better as requested in research). The investigations are based on WGS84 for horizontal locations and for the height system mean sea level (MSL) using the EGM96 Geoid. Where needed, the datasets have been transformed.
Proc. of SPIE Vol. 6226 622604-5
The density of ALS datasets is very high, typically one to ten meters. For the analyses with the SRTM data which have a resolution of 3 arc-seconds (approximately 90m) these datasets are too dense. Therefore the datasets were thinned out to a point spacing of 50 m using the Software TerraScan by TerraSolid. To ensure, that the detailed and therefore very valuable information about the local height variances will not be lost, not only an average Z-Value (for the 50 by 50 m area) was calculated for the thinned out points, but also a maximum and a minimum value for the thinned out area were defined. So, for ALS datasets the input for analyses is based on 3 Z-Values but it became evident that single outliers occurring in ALS data sets impeded the use of minimum and maximum value for detailed analyses. For ALS data sets accuracy values are typically stated only for the vertical component, not for the horizontal. From research, we know that the horizontal accuracy is approximately twice the vertical value. Due to the high point density and the resampling the impact of these errors can be neglected.
3. SRTM PREPROCESSING As described in section 2.3, the SRTM dataset has some defects. On the one side, water and shorelines are not modeled in the dataset. On the other side, it has a considerable number of data drop out areas. As part of this project, those voids (NO DATA elevation values) will be replaced by useable elevation values. This is called “void-filling”. Three possible data sources are used to fill voids (the order corresponds to the priority): high-resolution data (3” or better resolution), interpolation from surrounding data values or lower-resolution data (30” resolution).
3.1. Results If voids are filled with data from other data sources, it has to be assured, that they fit into the SRTM model and do not have a bias. An example of such a void fill of like data quality is depicted in Figure 7. It is clearly visible that the filled in edge of the mountain rim is modeled with the same accuracy as the SRTM terrain.
Figure 7 SRTM dataset with voids (black areas in the left image) and SRTM dataset with voids filled using other high-resolution data (blue areas in the right image).
Another mountain that caused some problems in the past is Mt. Illimani near La Paz, Bolivia (6460m), which is shown in Figure 8. The unprocessed SRTM data are incomplete which is easily visible when correlating them with Jeppesen’s obstacle database: the obstacles (red boxes) are floating around in the air. After correction, the two data match up and the obstacles are located right on top of the mountain.
Proc. of SPIE Vol. 6226 622604-6
t't
?'
.
Figure 8 SRTM dataset with voids (left) and SRTM dataset with voids villed using other high-resolution data.
After voids are filled using data of like or similar quality, voids smaller than a certain area are interpolated. The interpolation of a void is heavily influenced by the surrounding data. An analysis was performed using results from interpolation as compared with ground control points and while the quality does not match the SRTM data, it was deemed acceptable since the total area of voids of 10km2 or less is under 1% of the total landmass supported by SRTM data and the quality is still better than using a lower resolution terrain model at 30 arc-seconds.
Figure 9 Example of an interpolated void in the Andes Mountains.
Proc. of SPIE Vol. 6226 622604-7
Once all voids are filled using data of like or similar quality and interpolation, there are still some larger voids that need to be filled, as well as the areas above North 60° and below South 56° (areas outside the SRTM coverage). In order to provide a worldwide terrain model and lacking higher resolution data in these areas, lower resolution data at 30 arc-seconds is used. A continual improvement process is in place to reduce if not eliminate the use of 30 arc-second data for future terrain models.
Figure 10 Example of a SRTM void filled with lower resolution data.
4. TERRAIN ENVELOPES The main challenge generating the SRTM TerrainScape 1-3 models is to achieve a specified confidence level of the terrain data. This is done by adding a buffer to the base terrain model, such that no more than the specified fraction of posts in the terrain database is lower than reality. On the other side, the envelope shall be as small as possible in order to keep the database accuracy as high as possible. The buffer applied depends on the following factors:
• Accuracy of the source data
• Terrain characteristics of the surrounding area
• Confidence level for the model
• Proximity to airport
Using these factors together allows for varying degrees of buffer to be applied over a dataset instead of a constant value. For instance, since the accuracy of the source data is not homogeneous across the entire dataset based on differing terrain characteristics, envelope values should vary depending on these terrain characteristics, rather than adding a single envelope value according to the worst accuracy across the entire source dataset.
Proc. of SPIE Vol. 6226 622604-8
4.1. Definition of Envelope parameters It is essential for the definition of SRTM TerrainScape to determine which factors influence accuracy. In a workshop it was decided to analyse the following terrain characteristics in order to better understand contributing factors in the datasets like
• Slope
• Roughness (change of slope within a defined area)
• Curvature
• Elevation differences (min/max) within a defined area (range)
• Majority (value that occurs most often) / Minority (value that occurs least often) elevation within a defined area
The indicators mentioned above can be summarized to the term ‘relief’. Besides discussing the factors which could influence the accuracy, how terrain characteristics will be categorized into distinguishable terrain classes was also discussed.
For the definition of classification criteria and the number of terrain classes all datasets were analyzed against the SRTM dataset (reference data). Thus the main landscape characteristics which occur worldwide are taken into account using the homogenous dataset of SRTM.
After doing the above analyses and terrain classification, the error distributions for each terrain class and each terrain source could be defined. Together with the desired confidence levels
• TerrainScape 1 (Routine, 10-3)
• TerrainScape 2 (Essential, 10-5)
• TerrainScape 3 (Critical, 10-8)
the envelope which insures this confidence level can be derived.
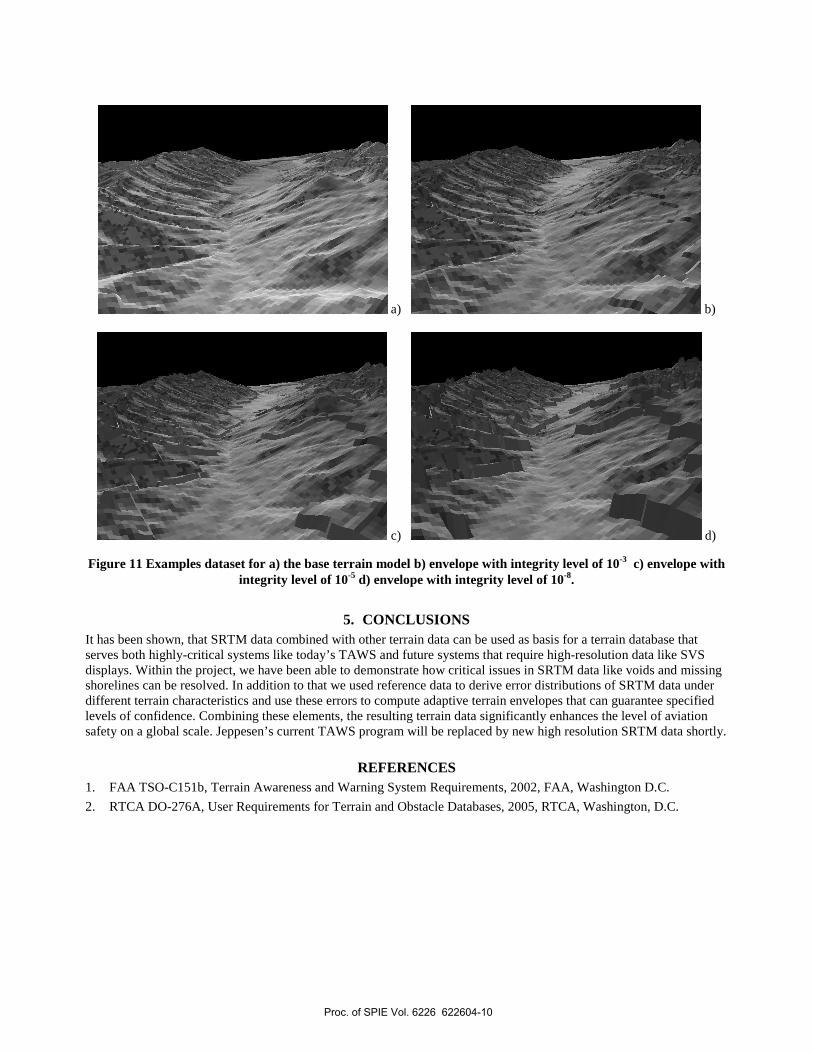
4.2. Results Based on this research, buffers were defined based on source of data, terrain classification, confidence level of data, and proximity to airport. Concerning proximity to airports, buffers are applied as a percentage scale based on distance from the runway surfaces, out a distance that coincides with Area 2 definitions in DO-276A. Figure 11 is an example of how varying buffers are applied over the same area based on different confidence levels. This illustrates how in the valley or flat portion a minimal buffer is able to be applied, while in the hilly or mountainous areas, a higher buffer is applied due to more uncertainty with the data based on the terrain characteristics.
Proc. of SPIE Vol. 6226 622604-9
w Pr I a) b)
c) d)
Figure 11 Examples dataset for a) the base terrain model b) envelope with integrity level of 10-3 c) envelope with integrity level of 10-5 d) envelope with integrity level of 10-8.
5. CONCLUSIONS It has been shown, that SRTM data combined with other terrain data can be used as basis for a terrain database that serves both highly-critical systems like today’s TAWS and future systems that require high-resolution data like SVS displays. Within the project, we have been able to demonstrate how critical issues in SRTM data like voids and missing shorelines can be resolved. In addition to that we used reference data to derive error distributions of SRTM data under different terrain characteristics and use these errors to compute adaptive terrain envelopes that can guarantee specified levels of confidence. Combining these elements, the resulting terrain data significantly enhances the level of aviation safety on a global scale. Jeppesen’s current TAWS program will be replaced by new high resolution SRTM data shortly.
REFERENCES 1. FAA TSO-C151b, Terrain Awareness and Warning System Requirements, 2002, FAA, Washington D.C.
2. RTCA DO-276A, User Requirements for Terrain and Obstacle Databases, 2005, RTCA, Washington, D.C.