12
Wingfield Glassey Unit AS 1: Physical Geography CHEMISTRY FOR CCEA A2 LEVEL A2 LEVEL

Wingfield Glassey
Unit AS 1:Physical GeographyCHEMISTRY
FOR CCEA A2 LEVEL
A2LEVEL
3
CONTENTS
Unit A2 1: Further Physical and Organic Chemistry4.1 – Energetics: Solids and Solutions . . . . . . . . . . . . . . . . . . . . . . . . . . . . . . . . . . . . . . . . . . . . . . . . . 54.2 – Entropy and Free Energy . . . . . . . . . . . . . . . . . . . . . . . . . . . . . . . . . . . . . . . . . . . . . . . . . . . . . .204.3 – Chemical Kinetics. . . . . . . . . . . . . . . . . . . . . . . . . . . . . . . . . . . . . . . . . . . . . . . . . . . . . . . . . . . . .314.4 – Chemical Equilibrium . . . . . . . . . . . . . . . . . . . . . . . . . . . . . . . . . . . . . . . . . . . . . . . . . . . . . . . . .494.5 – Acid-Base Equilibria . . . . . . . . . . . . . . . . . . . . . . . . . . . . . . . . . . . . . . . . . . . . . . . . . . . . . . . . . .564.6 – Isomerism . . . . . . . . . . . . . . . . . . . . . . . . . . . . . . . . . . . . . . . . . . . . . . . . . . . . . . . . . . . . . . . . . . .774.7 – Carbonyl Compounds . . . . . . . . . . . . . . . . . . . . . . . . . . . . . . . . . . . . . . . . . . . . . . . . . . . . . . . . .834.8 – Carboxylic Acids . . . . . . . . . . . . . . . . . . . . . . . . . . . . . . . . . . . . . . . . . . . . . . . . . . . . . . . . . . . . .1004.9 – Esters . . . . . . . . . . . . . . . . . . . . . . . . . . . . . . . . . . . . . . . . . . . . . . . . . . . . . . . . . . . . . . . . . . . . . . .1124.10 – Fats and Oils . . . . . . . . . . . . . . . . . . . . . . . . . . . . . . . . . . . . . . . . . . . . . . . . . . . . . . . . . . . . . . . .1244.11 – Arenes . . . . . . . . . . . . . . . . . . . . . . . . . . . . . . . . . . . . . . . . . . . . . . . . . . . . . . . . . . . . . . . . . . . . . .130
Unit A2 2: Analytical, Transition Metals, Electrochemistry and Organic Nitrogen Chemistry
5.1 – Chromatography . . . . . . . . . . . . . . . . . . . . . . . . . . . . . . . . . . . . . . . . . . . . . . . . . . . . . . . . . . . .1405.2 – Volumetric Analysis . . . . . . . . . . . . . . . . . . . . . . . . . . . . . . . . . . . . . . . . . . . . . . . . . . . . . . . . .1485.3 – Mass Spectrometry . . . . . . . . . . . . . . . . . . . . . . . . . . . . . . . . . . . . . . . . . . . . . . . . . . . . . . . . . .1555.4 – NMR Spectroscopy . . . . . . . . . . . . . . . . . . . . . . . . . . . . . . . . . . . . . . . . . . . . . . . . . . . . . . . . . .1625.5 – Electrochemistry . . . . . . . . . . . . . . . . . . . . . . . . . . . . . . . . . . . . . . . . . . . . . . . . . . . . . . . . . . . . .1685.6 – Transition Metals . . . . . . . . . . . . . . . . . . . . . . . . . . . . . . . . . . . . . . . . . . . . . . . . . . . . . . . . . . .1805.7 – Metal Complexes . . . . . . . . . . . . . . . . . . . . . . . . . . . . . . . . . . . . . . . . . . . . . . . . . . . . . . . . . . . .1855.8 – Transition Metal Chemistry . . . . . . . . . . . . . . . . . . . . . . . . . . . . . . . . . . . . . . . . . . . . . . . . . . .1965.9 – Organic Nitrogen Chemistry: Amines . . . . . . . . . . . . . . . . . . . . . . . . . . . . . . . . . . . . . . . . . .2065.10 – Organic Nitrogen Chemistry: Amides . . . . . . . . . . . . . . . . . . . . . . . . . . . . . . . . . . . . . . . . . .2225.11 – Amino Acids . . . . . . . . . . . . . . . . . . . . . . . . . . . . . . . . . . . . . . . . . . . . . . . . . . . . . . . . . . . . . . . .2275.12 – Polymer Chemistry . . . . . . . . . . . . . . . . . . . . . . . . . . . . . . . . . . . . . . . . . . . . . . . . . . . . . . . . . .2355.13 – Chemistry in Medicine . . . . . . . . . . . . . . . . . . . . . . . . . . . . . . . . . . . . . . . . . . . . . . . . . . . . . . .239
Unit A2 3: Further Practical Chemistry . . . . . . . . . . . . . . . . . . . . . . . . . . . . . . . . . . . . .247
Answers . . . . . . . . . . . . . . . . . . . . . . . . . . . . . . . . . . . . . . . . . . . . . . . . . . . . . . . . . . . . . . . . . . . . . . .266
Glossary . . . . . . . . . . . . . . . . . . . . . . . . . . . . . . . . . . . . . . . . . . . . . . . . . . . . . . . . . . . . . . . . . . . . . . .317 Copyright . . . . . . . . . . . . . . . . . . . . . . . . . . . . . . . . . . . . . . . . . . . . . . . . . . . . . . . . . . . . . . . . . . . . . .324

31
4.1 ENERGETICS: SOLIDS AND SOLUTIONS
4.3 Chemical Kinetics
CONNECTIONS
• The shelf-life of foods, medicines, cosmetics and other health care products can be estimated by studying the kinetics of the reactions that cause the products to degrade over time.
• Kinetic models can be used to determine the optimum reaction conditions for the large-scale production of chemicals in industry.
• Kinetic studies can be used to determine the role of individual substances in complex reactions such as the reactions that occur in living organisms.
Rate of Reaction
In this section we are learning to:
• Define the rate of a reaction in terms of the rate at which individual reactants are used and the rate at which individual products are formed.
• Distinguish between the rate, initial rate and average rate of a reaction.
Defining RateThe rate of a reaction is a positive number that describes how quickly the concentrations of the reactants and products change during the reaction. Consider the reaction that occurs between propanone and iodine in acidic solution.
The rate of the reaction can be determined by plotting the concentration of propanone in the reaction mixture, [CH3COCH3] against time and calculating the slope of the plot. The construction used to determine the rate at a time t0 after the start of the reaction is shown in Figure 1a.
If during the reaction, the concentration of propanone changes by an amount, Δ[CH3COCH3] during a small interval of time, Δt (where Δt << 1 second) the rate of reaction at this point in time during the reaction is defined as:
Rate of reaction, R = –
Units: mol dm–3 s–1
The units of rate are concentration (mol dm–3) divided by time (s). The negative sign is introduced to transform the negative change in concentration, Δ[CH3COCH3] into a positive number, and by so doing ensure that the rate of reaction, R is a positive number.
The rate of the reaction can also be determined by plotting the concentration of iodopropanone in the reaction mixture, [CH3COCH2I] against time and calculating the slope of the plot. The construction used to determine the rate at a time t0 after the start
Figure 1: Determining the rate of reaction at a time to from a plot showing the concentration of (a) propanone
against time and (b) iodopropanone against time.
(a)
(b)
32
CHEMISTRY for CCEA A2 LEVEL • A2 1
of the reaction is shown in Figure 1b.If during the reaction, the concentration of
iodopropanone changes by an amount, Δ[CH3COCH2I] during a small interval of time, Δt the rate of reaction at this point in time during the reaction is defined as:
Rate of reaction, R = +
In this instance a negative sign is not required as the change in the concentration of iodopropanone, Δ[CH3COCH2I] is a positive number.
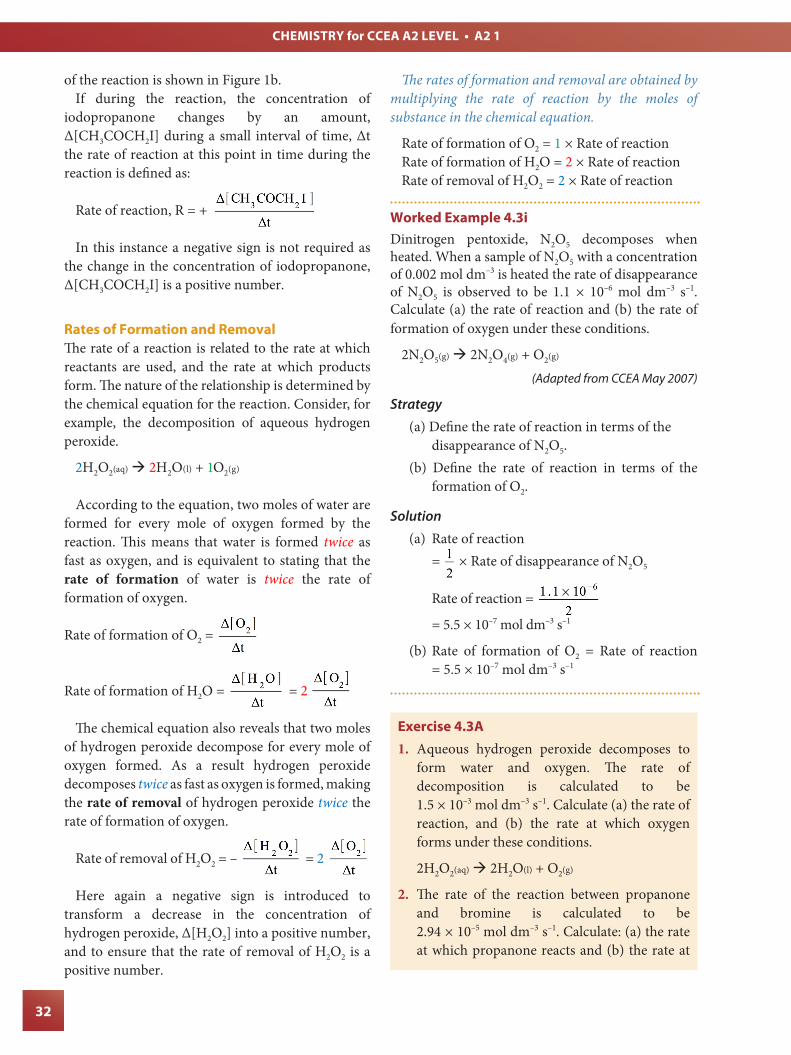
Rates of Formation and RemovalThe rate of a reaction is related to the rate at which reactants are used, and the rate at which products form. The nature of the relationship is determined by the chemical equation for the reaction. Consider, for example, the decomposition of aqueous hydrogen peroxide.
2H2O2(aq) à 2H2O(l) + 1O2(g)
According to the equation, two moles of water are formed for every mole of oxygen formed by the reaction. This means that water is formed twice as fast as oxygen, and is equivalent to stating that the rate of formation of water is twice the rate of formation of oxygen.
Rate of formation of O2 =
Rate of formation of H2O = = 2
The chemical equation also reveals that two moles of hydrogen peroxide decompose for every mole of oxygen formed. As a result hydrogen peroxide decomposes twice as fast as oxygen is formed, making the rate of removal of hydrogen peroxide twice the rate of formation of oxygen.
Rate of removal of H2O2 = – = 2
Here again a negative sign is introduced to transform a decrease in the concentration of hydrogen peroxide, Δ[H2O2] into a positive number, and to ensure that the rate of removal of H2O2 is a positive number.
The rates of formation and removal are obtained by multiplying the rate of reaction by the moles of substance in the chemical equation.
Rate of formation of O2 = 1 × Rate of reactionRate of formation of H2O = 2 × Rate of reaction Rate of removal of H2O2 = 2 × Rate of reaction
Worked Example 4.3iDinitrogen pentoxide, N2O5 decomposes when heated. When a sample of N2O5 with a concentration of 0.002 mol dm–3 is heated the rate of disappearance of N2O5 is observed to be 1.1 × 10⁻⁶ mol dm–3 s–1. Calculate (a) the rate of reaction and (b) the rate of formation of oxygen under these conditions.
2N2O5(g) à 2N2O4(g) + O2(g)
(Adapted from CCEA May 2007)
Strategy
(a) Define the rate of reaction in terms of the disappearance of N2O5.
(b) Define the rate of reaction in terms of the formation of O2.
Solution
(a) Rate of reaction = × Rate of disappearance of N2O5
Rate of reaction = ×
= 5.5 × 10⁻⁷ mol dm–3 s–1
(b) Rate of formation of O2 = Rate of reaction = 5.5 × 10⁻⁷ mol dm–3 s–1
Exercise 4.3A1. Aqueous hydrogen peroxide decomposes to
form water and oxygen. The rate of decomposition is calculated to be 1.5 × 10⁻³ mol dm–3 s–1. Calculate (a) the rate of reaction, and (b) the rate at which oxygen forms under these conditions.
2H2O2(aq) à 2H2O(l) + O2(g)
2. The rate of the reaction between propanone and bromine is calculated to be 2.94 × 10⁻⁵ mol dm–3 s–1. Calculate: (a) the rate at which propanone reacts and (b) the rate at

100
4.8 Carboxylic Acids
CONNECTIONS
• Commercially important polymers such as Nylon and PET are synthesised from carboxylic acids.
• Many different types of cells use The Citric Acid Cycle to generate chemical energy from food. The process involves compounds derived from carboxylic acids with up to six carbon atoms.
Structure and Properties
In this section we are learning to:
• Account for the physical properties of carboxylic acids in terms of bonding and structure.
• Use systematic (IUPAC) rules to name carboxylic acids.
Structure and BondingA carboxylic acid is a compound containing a carboxyl (-COOH) functional group. Small carboxylic acids such as ethanoic acid, CH3COOH and propanoic acid, CH3CH2COOH are colourless liquids and are miscible with water.
ethanoic acid, CH3COOH propanoic acid, CH3CH2COOH
In aqueous solution the carboxyl group partially dissociates to form hydrogen ions. The extent to which a carboxyl group dissociates is described by the acid dissociation constant, Ka for the group.
Acid dissociation in ethanoic acid: CH3COOH D CH3COO– + H+
Ka =
A dicarboxylic acid is a compound containing two carboxyl groups. Oxalic acid, (COOH)2 is a dicarboxylic acid. The dissociation of each carboxyl group is described by an acid dissociation constant.
oxalic acid, H2C2O4
The first acid dissociation in oxalic acid:
H2C2O4 D HC2O4– + H+ Ka1 =
The second acid dissociation in oxalic acid:
HC2O4– D C2O4
2– + H+ Ka2 =
The formulas of simple carboxylic acids containing one carboxyl (COOH) group can be obtained by setting n = 1, 2, ... in the general formula CnH2nO2. The molecular structures and formulas for simple straight-chain carboxylic acids with n=1–6 are summarised in Table 1.
n Molecular Formula
Molecular Structure
1 CH2O2
methanoic acid, HCOOH
2 C2H4O2
ethanoic acid, CH3COOH
3 C3H6O2
propanoic acid, CH3CH2COOH
4 C4H8O2
butanoic acid, CH3CH2CH2COOH
5 C5H10O2
pentanoic acid, CH3CH2CH2CH2COOH
6 C6H12O2
hexanoic acid, CH3CH2CH2CH2CH2COOH
Table 1: Molecular formulas and structures for simple straight-chain carboxylic acids.
101
4.8 CARBOXYLIC ACIDS
Exercise 4.8A1. Which one of the following is the formula of a
simple carboxylic acid?
A C4H6O2 B C3H6O C C3H6O2 D C4H8O
2. A carboxylic acid was found to contain 58.7 % carbon, 9.8 % hydrogen and 31.5 % oxygen. Deduce the empirical formula of the acid.
(CCEA January 2010)
• Recall and use the general formula CnH2nO2 to generate formulas for simple carboxylic acids.
• Draw the structures of simple carboxylic acids with up to six carbon atoms.
• Explain why carboxylic acids are weak acids.
Before moving to the next section, check that you are able to:
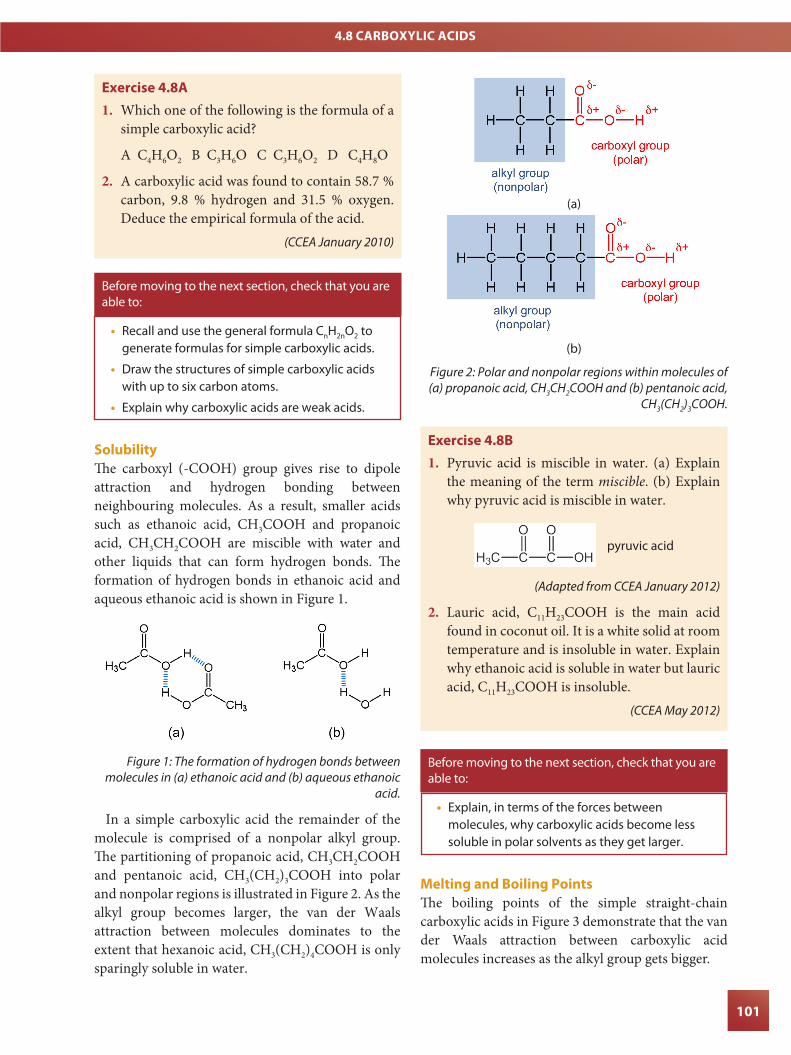
SolubilityThe carboxyl (-COOH) group gives rise to dipole attraction and hydrogen bonding between neighbouring molecules. As a result, smaller acids such as ethanoic acid, CH3COOH and propanoic acid, CH3CH2COOH are miscible with water and other liquids that can form hydrogen bonds. The formation of hydrogen bonds in ethanoic acid and aqueous ethanoic acid is shown in Figure 1.
Figure 1: The formation of hydrogen bonds between molecules in (a) ethanoic acid and (b) aqueous ethanoic
acid.
In a simple carboxylic acid the remainder of the molecule is comprised of a nonpolar alkyl group. The partitioning of propanoic acid, CH3CH2COOH and pentanoic acid, CH3(CH2)3COOH into polar and nonpolar regions is illustrated in Figure 2. As the alkyl group becomes larger, the van der Waals attraction between molecules dominates to the extent that hexanoic acid, CH3(CH2)4COOH is only sparingly soluble in water.
(a)
(b)
Figure 2: Polar and nonpolar regions within molecules of (a) propanoic acid, CH3CH2COOH and (b) pentanoic acid,
CH3(CH2)3COOH.
Exercise 4.8B1. Pyruvic acid is miscible in water. (a) Explain
the meaning of the term miscible. (b) Explain why pyruvic acid is miscible in water.
pyruvic acid
(Adapted from CCEA January 2012)
2. Lauric acid, C11H23COOH is the main acid found in coconut oil. It is a white solid at room temperature and is insoluble in water. Explain why ethanoic acid is soluble in water but lauric acid, C11H23COOH is insoluble.
(CCEA May 2012)
• Explain, in terms of the forces between molecules, why carboxylic acids become less soluble in polar solvents as they get larger.
Before moving to the next section, check that you are able to:
Melting and Boiling PointsThe boiling points of the simple straight-chain carboxylic acids in Figure 3 demonstrate that the van der Waals attraction between carboxylic acid molecules increases as the alkyl group gets bigger.
140
5.1 Chromatography
CONNECTIONS
• Thin-layer chromatography (TLC) is routinely used in industry to monitor progress during the synthesis of pharmaceuticals and other compounds.
• Gas-liquid chromatography (GLC) is used in forensic science to analyse the composition of complex liquid and gas mixtures.
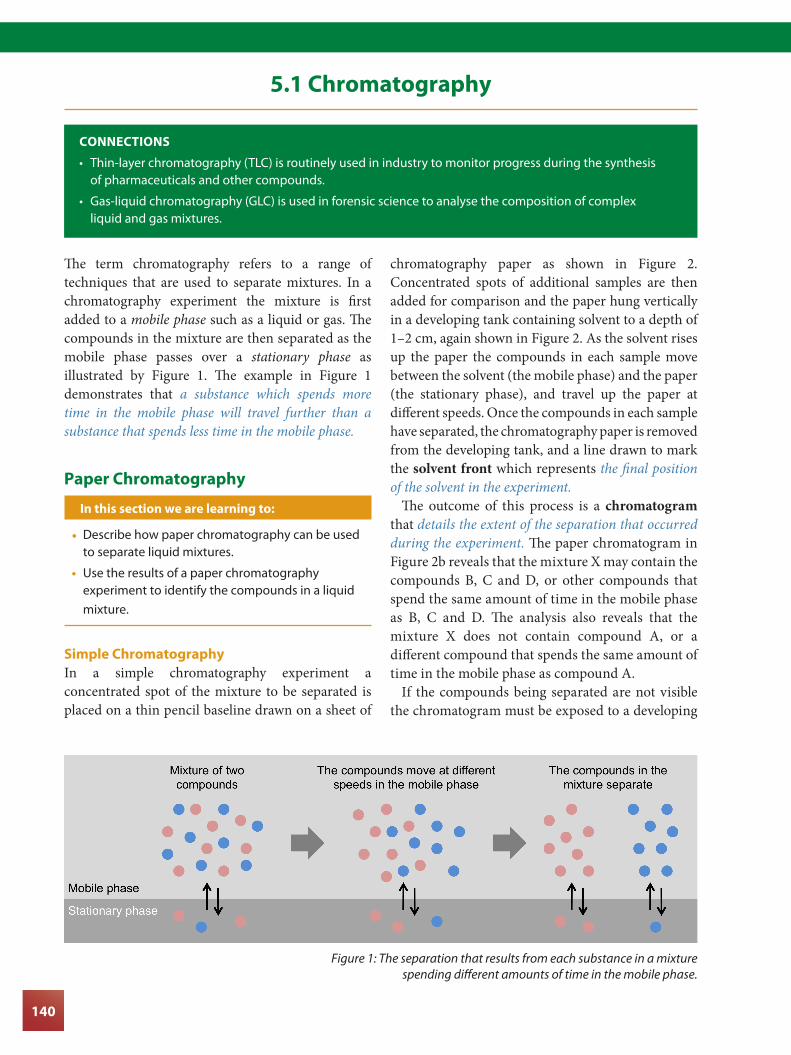
The term chromatography refers to a range of techniques that are used to separate mixtures. In a chromatography experiment the mixture is first added to a mobile phase such as a liquid or gas. The compounds in the mixture are then separated as the mobile phase passes over a stationary phase as illustrated by Figure 1. The example in Figure 1 demonstrates that a substance which spends more time in the mobile phase will travel further than a substance that spends less time in the mobile phase.
Paper Chromatography
In this section we are learning to:
• Describe how paper chromatography can be used to separate liquid mixtures.
• Use the results of a paper chromatography experiment to identify the compounds in a liquid mixture.
Simple ChromatographyIn a simple chromatography experiment a concentrated spot of the mixture to be separated is placed on a thin pencil baseline drawn on a sheet of
chromatography paper as shown in Figure 2. Concentrated spots of additional samples are then added for comparison and the paper hung vertically in a developing tank containing solvent to a depth of 1–2 cm, again shown in Figure 2. As the solvent rises up the paper the compounds in each sample move between the solvent (the mobile phase) and the paper (the stationary phase), and travel up the paper at different speeds. Once the compounds in each sample have separated, the chromatography paper is removed from the developing tank, and a line drawn to mark the solvent front which represents the final position of the solvent in the experiment.
The outcome of this process is a chromatogram that details the extent of the separation that occurred during the experiment. The paper chromatogram in Figure 2b reveals that the mixture X may contain the compounds B, C and D, or other compounds that spend the same amount of time in the mobile phase as B, C and D. The analysis also reveals that the mixture X does not contain compound A, or a different compound that spends the same amount of time in the mobile phase as compound A.
If the compounds being separated are not visible the chromatogram must be exposed to a developing
Figure 1: The separation that results from each substance in a mixture spending different amounts of time in the mobile phase.

141
4.1 ENERGETICS
agent, or viewed under ultraviolet (UV) light, to locate the compounds on the chromatogram.
The location of a compound on a chromatogram can be specified by calculating the retardation factor or ‘Rf value’ for the compound.
Rf = Distance traveled by the compound
Distance traveled by the the solvent = dd0
The distances d and do used to calculate the Rf
value for compound A are shown in Figure 2.Paper is made of cellulose fibres. The surface of a
cellulose fibre is covered in hydroxyl (-OH) groups and is therefore a polar environment. If the mobile phase is a nonpolar solvent such as dichloromethane, CH2Cl2 or hexane, C6H14 nonpolar compounds will prefer to spend most of their time in the mobile phase (and have high Rf values), while polar compounds such as alcohols will spend most of their time in the stationary phase (and have low Rf values).
Worked Example 5.1iDifferent inks contain unique combinations of dyes such as methyl violet 2b and methyl violet 6b. Describe how simple paper chromatography could be used to demonstrate tthat a bank cheque was forged. The pen used to write the cheque and pure samples of the dyes methyl violet 2b, 6b and 10b are available for use.
SolutionUsing a pencil, draw five crosses along a pencil line that is approximately 2 cm from the bottom of the chromatography paper. Use a clean capillary tube to
place a small spot of the ink from the suspect’s pen on the first cross. Use a clean capillary tube to place a spot of the ink used to write the cheque on the second cross before placing spots of methyl violet 2b, 6b and 10b on the remaining crosses.
Develop the chromatogram and draw a pencil line to mark the position of the solvent front before exposing the chromatogram to a developing agent, or viewing the chromatogram under UV light, to locate the compounds on the chromatogram. The presence of methyl violet 2b, 6b and 10b in each ink is confirmed by comparing the Rf values for the pure dyes to the Rf values for the compounds in each ink. The cheque is forged if the relative amount of each dye is different in the two inks.
Exercise 5.1A1. A mixture of amino acids may be separated
using paper chromatography. (a) Explain the term Rf value as it applies to paper chromatography. (b) Explain what a low Rf value indicates about a particular amino acid.
(Adapted from CCEA June 2011)
2. Use the paper chromatogram to identify which compounds or mixtures are present in Sample 1.
A 2 + 5 B 3 + 4
C 3 + 5 D 4 + 5
continued overleaf
5.1 CHROMATOGRAPHY
(a) (b)
Figure 2: (a) A simple paper chromatography experiment. (b) Using pure compounds A-D to identify the compounds in a mixture (X).

206
Structure and Properties
In this section we are learning to:
• Classify the structures of amines as primary, secondary or tertiary.
• Account for the properties of amines in terms of their structure, and the nature of the bonding between amine molecules.
• Use systematic (IUPAC) rules to name amines.
StructureAn amine is a derivative of ammonia, NH3 in which one or more of the hydrogen atoms have been replaced by an alkyl group (R). Amines are classified as primary, secondary or tertiary amines according to the number of alkyl groups bonded to the nitrogen atom.
The compound propylamine, C3H7NH2 is an example of a primary amine as the nitrogen atom is bonded to one carbon atom and the compound has the structure RNH2. The compound ethylmethylamine is a structural isomer of propylamine. It is a secondary amine as the nitrogen atom is bonded to two carbon atoms and the compound has the structure RNHR' where R and R' are different groups. Similarly, the compound trimethylamine is a structural isomer of propylamine and is a tertiary amine as the nitrogen atom is bonded to three carbon atoms and the compound has the structure RNR'R'' where R, R' and R'' are different groups.
Exercise 5.9A1. Phenylethylamine is a ‘chemical cousin’ of the
amphetamines. It is found in chocolate and to a lesser extent in the brain. In terms of brain chemistry, the effects of eating chocolate and taking amphetamines are similar. The structures of phenylethylamine and amphetamine are shown below. (a) Which of these molecules is chiral? Explain your answer. (b) Which of these molecules is a primary amine? Explain your reasoning.
phenylethylamineC6H5CH2CH2NH2
amphetamineC6H5CH2CH(CH3)NH2
(Adapted from CCEA June 2004)
5.9 Organic Nitrogen Chemistry: Amines
CONNECTIONS
• Amines such as trimethylamine, N(CH3)3 are abundant in living things and give fish their characteristic ‘fishy’ smell.
• Azo compounds (RN=NR’) are used as indicators and dyes and are synthesised by coupling reactions involving amines with aromatic character.

207
5
2. Ephedrine is a decongestant and is a component of many cold and flu remedies. (a) Write the condensed formula for ephedrine. (b) Classify ephedrine as a primary, secondary or tertiary amine. Explain your reasoning.
ephedrine
3. Salbutamol is an active ingredient in some inhalers used to treat asthma. (a) Write the molecular formula for salbutamol. (b) Classify salbutamol as a primary, secondary or tertiary amine. Explain your reasoning.
salbutamol
4. Draw all possible structural isomers of butanamine, C4H9NH2 and classify each as a primary, secondary or tertiary amine.
5. Compound D is a tertiary amine with a molecular formula C5H13N. The NMR spectrum of compound D reveals three types of chemically equivalent hydrogen atom in the ratio 6:6:1. Draw one possible structure for compound D.
(CCEA June 2012)
• Write structural and condensed formulas for amines.
• Classify the structures of amines as primary, secondary or tertiary.
Before moving to the next section, check that you are able to:
SolubilityThe molecular formulas of amines can be obtained by setting n = 1, 2, 3 ... in the general formula, CnH2n+1NH2. Small amines such as methylamine, CH3NH2 (n=1) and ethylamine, CH3CH2NH2 (n=2)
are gases. Larger amines such as butan-1-amine, CH3CH2CH2CH2NH2 are colourless liquids with a characteristic ‘fishy’ smell.
Smaller amines such as ethylamine are miscible in water as they can use the lone pair of electrons on the nitrogen atom to bond with hydrogen atoms on neighbouring water molecules as shown in Figure 1a. The molecules in primary and secondary amines (RNH2 and RNHR′) can also hydrogen bond with each other as shown in Figure 1b. As the molecular mass of the amine (n) increases, the attraction between neighbouring molecules becomes increasingly dominated by van der Waals’ attraction between the alkyl groups on neighbouring molecules. As a result amines with longer alkyl groups such as hexan-1-amine, CH3(CH2)5NH2 are miscible in nonpolar solvents such as hexane, but are only sparingly soluble in polar solvents such as water.
(a)
(b)
Figure 1: Hydrogen bonding between (a) methylamine and water in aqueous methylamine, and (b) the
molecules in a primary amine (RNH2).
5.9 ORGANIC NITROGEN CHEMISTRY: AMINES

247
IntroductionThe format of the A2 Practical Assessment is familiar from AS Chemistry and consists of two parts. The first part of the assessment is laboratory-based, and is focussed on making and recording observations. The second part is timetabled for a different day, and is focussed on the analysis of experimental data and the evaluation of experimental techniques.
The tasks in Part A afford candidates an opportunity to demonstrate their knowledge of practical chemistry, including the tasks listed in the A2 3 Section of the specification. The Worked Examples and Problems in the following sections exemplify the level of detail expected when making observations, analysing data, and evaluating experimental techniques, and should be used in conjunction with the Specimen Assessment Materials (SAMs)
published by CCEA to gain insight into the likely format and scope of questions in both parts of practical assessment.
Volumetric Analysis
In this section we are learning to:
• Identify the knowledge and skills required to complete volumetric analysis questions as part of the practical assessment.
The format of a titration exercise is familiar from AS Chemistry. In the first part of the assessment candidates may be asked to perform a titration and record their results in a suitable table. In the second part, candidates may be asked to analyse the results of a titration, and to describe relevant procedures such as: how to prepare a solution, how to perform a titration, or how to ensure that the results of a titration experiment are accurate.
Worked Example 6i demonstrates how the determination of iron(II) by acidified manganate(VII) could be used to assess understanding of the various aspects of titrations. The laboratory-based tasks in Parts (a) and (b) would be conducted in the first part of the assessment.
6 PRACTICAL ASSESSMENT
6: Practical Assessment
Worked Example 6iYou are required to dissolve a weighed sample of ammonium iron(II) sulfate in dilute sulfuric acid and make the solution up to 250 cm3 in a volumetric flask. You will then titrate 25.0 cm3 portions of this solution with acidified potassium manganate(VII). You will use your results to calculate the concentration of the acidified potassium manganate(VII) solution.You are provided with:
• Hydrated ammonium iron(II) sulfate, (NH4)2Fe(SO4)2.6H2O• Dilute sulfuric acid• Deionised water• A 250 cm3 volumetric flask• An acidified solution of potassium manganate(VII).
(CCEA June 2014)
(a) Weigh out between 7.80 g and 7.90 g of ammonium iron(II) sulfate. Record the mass to two decimal places.
7.84 g

321
GLOSSARY
4.11 ArenesBenzene• The term delocalisation refers to the formation of
partial π-bonds by the sharing of the electrons in a π-bond between three or more atoms.
• The aromatic character of a compound refers to the stability associated with the delocalisation of π-electrons within the compound.
Arenes• An arene is a compound with aromatic character.Reactions of Benzene• In a bromination reaction a bromine atom is
added to a compound.• An electrophilic substitution reaction involves
the addition of an electrophile followed by the elimination of an atom, molecule or ion.
• In an alkylation reaction an alkyl (-R) group is added to a compound.
• In an acylation reaction an acyl (-COR) group is added to a compound.
• In a nitration reaction a nitro (-NO2) group is added to a compound.
5.1 ChromatographyPaper Chromatography• The solvent front is the final position of the
solvent in a chromatography experiment.• A chromatogram details the extent of the
separation that occurred during a chromatography experiment.
• The retardation factor or ‘Rf value’ of a compound is the distance travelled by the compound divided by the distance travelled by the solvent.
Gas-Liquid Chromatography• The retention time of a compound is the time
taken from injection until the compound is detected.
5.2 Volumetric AnalysisBack titration Methods• In a back titration the excess reagent added to a
sample that cannot be analysed by titration is titrated to determine the amount of substance in the sample.
5.3 Mass SpectrometryInterpreting Mass Spectra• The molecular ion (M) peak is the signal
produced by the ion formed when an electron is removed from a molecule of the compound.
• A fragment ion is a positive ion that is formed when the molecular ion breaks apart.
• Fragmentation is the breaking apart of a molecular ion to form a smaller ion with a positive charge.
• The mass-to-charge ratio (m/z) for an ion is equal to the RMM of the ion divided by the charge on the ion.
• The base peak is the signal with the greatest abundance in a mass spectrum.
• In high-resolution mass spectrometry the masses of the ions formed are determined to at least one decimal place.
• The M+1 peak is the signal produced by molecular ions that contain a carbon-13 atom.
5.4 NMR SpectroscopyObtaining an NMR Spectrum• An internal standard is a substance that is part of
the mixture being analysed, and provides reference data for the analysis.
• The chemical shift of an NMR signal is the difference in frequency, in units of parts-per million, between the signal and the signal produced by an internal standard.
Interpreting an NMR Spectrum• The term chemically equivalent is used to describe
atoms that contribute to the same NMR signal.• The integration curve for an NMR spectrum
details the area under each signal in the spectrum.• The term shielding refers to the magnitude of the
magnetic field produced by the electrons in the atom when the atom is placed in a magnetic field.
• The term spin-spin splitting refers to the action of one or more adjacent atoms on the signal produced by a set of chemically equivalent atoms.
• The term multiplet refers to the group of signals produced when an NMR signal is subject to spin-spin splitting.


![Assessment Unit A2 1 *AB211* - CCEA · 2019. 9. 17. · ADANCED General Certificate of Education 2017 Biology Assessment Unit A2 1 assessing Physiology and Ecosystems [AB211] ONDAY](https://static.documents.pub/doc/80x56/610210f0bf5e3920975257ac/assessment-unit-a2-1-ab211-ccea-2019-9-17-adanced-general-certificate-of.jpg)


![Assessment Unit A2 2 assessing *AMT21* - CCEA...Assessment Unit A2 2 assessing Applied Mathematics [AMT21] WEDNESDAY 5 JUNE, MORNING TIME 1 hour 30 minutes. INSTRUCTIONS TO CANDIDATES](https://static.documents.pub/doc/80x56/61100793fd747904ab7d4e2c/assessment-unit-a2-2-assessing-amt21-ccea-assessment-unit-a2-2-assessing.jpg)


