65
1
1
2 © 2018 American Automobile Association, Inc.
AAA All-Season Tire Testing
(this page intentionally left blank)
3 © 2018 American Automobile Association, Inc.
AAA All-Season Tire Testing
Abstract
AAA conducted primary research1 to understand first, the performance differences between high-priced and low-priced all-season tires2 and second, performance differences between new tires and those worn to a tread depth of 4/32”. Characteristics including stopping distance on a wet road surface, maximum lateral acceleration on a wet road surface and noise-vibration-harshness (NVH) were evaluated on varying types of pavements typically encountered on public roadways.
U.S. sales data spanning a four-year period (2013 – 2016) was used to determine the most frequently purchased passenger car and light truck. As a result, the Toyota Camry and Ford F-150 were selected as test vehicles to represent their respective categories. For each vehicle, the most common original equipment (OE) tire size was tested.
Research Questions:
1. Are there performance differences in certain scenarios between high-priced and low-priced tires?
a. Quantitatively determined by analysis of wet stopping distances, wet maximum lateral
acceleration and NVH characteristics.
2. Are there performance differences in certain scenarios between new tires and tires artificially worn
to a tread depth of 4/32” in terms of:
a. Wet stopping distance?
b. Wet maximum lateral acceleration?
3. What is the average cost difference between a new high-priced tire versus a new low-priced tire?
Key Findings:
1. On average, new high-priced tires did not perform significantly better than new low-priced tires in
terms of stopping distance on a wet road surface, maximum lateral acceleration on a wet road
surface and NVH characteristics.
2. Compared to new tires, tires worn to a tread depth of 4/32” exhibit:
a. An increased stopping distance of 42 percent for the Toyota Camry and 44 percent for the
Ford F-150. When decelerating from 60 mph, worn tires are still traveling at 39 mph and 37
mph at the average stopping point of new tires for the Toyota Camry and F-150,
respectively.
b. A decreased maximum lateral acceleration on a wet road surface of 33 percent for the
Toyota Camry and 28 percent for the Ford F-150.
3. A set of four higher priced tires cost, on average, $247.52 more for the Toyota Camry and $203.80
for the Ford F-150.
1 This research received no specific grant from any funding agency in the public, commercial or not-for-profit sectors. 2 The authors declare no conflicts of interest in preparing this article.

4 © 2018 American Automobile Association, Inc.
AAA All-Season Tire Testing
Contents
1 Introduction .......................................................................................................................................... 6
2 Background ........................................................................................................................................... 6
2.1 Tire Types .................................................................................................................................................. 7
2.2 Tire Components ....................................................................................................................................... 7
2.3 Tire Specifications .................................................................................................................................... 10
2.4 Uniform Tire Quality Grade (UTQG) Standards ....................................................................................... 12
3 Vehicle Selection Methodology .......................................................................................................... 13
4 Tire Selection Methodology ............................................................................................................... 13
4.1 2017 Toyota Camry .................................................................................................................................. 14
4.2 2017 Ford F-150 ....................................................................................................................................... 14
5 Test Equipment and Resources .......................................................................................................... 14
5.1 Vehicle Dynamics Equipment .................................................................................................................. 14
5.1.1 DEWESoft IMU-1 GPS Aided Inertial Measurement Unit ................................................................ 15
5.1.2 Futek LAU220 Pedal Force Sensor ................................................................................................... 15
5.2 NVH Equipment ....................................................................................................................................... 15
5.2.1 PCB Piezotronics Random-Incidence Condenser Microphone ........................................................ 15
5.2.2 PCB Piezotronics Triaxial Seat Pad Accelerometer .......................................................................... 15
5.3 Data Logging Equipment ......................................................................................................................... 16
5.4 Test Facility .............................................................................................................................................. 16
6 Inquiry #1: Are there differences in performance between commonly available high-priced and low-priced
tires? ........................................................................................................................................................... 16
6.1 Objective .................................................................................................................................................. 16
6.2 Methodology ........................................................................................................................................... 17
6.2.1 Wet Performance Testing ................................................................................................................ 17
6.2.2 NVH Characterization ...................................................................................................................... 18
6.3 Test Procedures & Results ....................................................................................................................... 19
6.3.1 NVH Characterization ...................................................................................................................... 19
6.3.2 Wet Stopping Distance .................................................................................................................... 27
5 © 2018 American Automobile Association, Inc.
AAA All-Season Tire Testing
6.3.3 Wet Maximum Lateral Acceleration ................................................................................................ 31
6.4 Summary of Findings ............................................................................................................................... 36
7 Inquiry #2: Are there differences in performance between new tires and tires artificially worn to a tread
depth of 4/32”? .......................................................................................................................................... 36
7.1 Objective .................................................................................................................................................. 36
7.2 Methodology ........................................................................................................................................... 36
7.3 Test Results .............................................................................................................................................. 38
7.3.1 Wet Stopping Distance .................................................................................................................... 38
7.3.2 Wet Maximum Lateral Acceleration ................................................................................................ 44
7.4 Summary of Findings ............................................................................................................................... 48
8 Inquiry #3: What is the cost increase associated with switching to a high-priced all-season tire? ... 49
8.1 Objective .................................................................................................................................................. 49
8.2 Methodology ........................................................................................................................................... 49
8.3 Findings .................................................................................................................................................... 49
8.3.1 2017 Toyota Camry .......................................................................................................................... 49
8.3.2 2017 Ford F-150 ............................................................................................................................... 49
9 Key Findings ........................................................................................................................................ 50
10 Summary Recommendations ............................................................................................................. 50
11 Bibliography ........................................................................................................................................ 50
12 Appendices ......................................................................................................................................... 52

6 © 2018 American Automobile Association, Inc.
AAA All-Season Tire Testing
1 Introduction
Tires are critical to driver safety. When in good condition, properly maintained and of the correct type and size, they enable a vehicle to accelerate, steer and brake safely under a wide variety of road and weather conditions.
Because they are responsible for much of the vehicle’s handling and stopping ability, tire quality plays a critical role in the optimal performance of a variety of safety systems, including Antilock Braking Systems (ABS), Dynamic Stability Control, Active Cruise Control and Forward Collision Mitigation. Ultimately, the friction between the tires and the road are responsible for vehicle handling and stopping characteristics.
Figure 1: Vehicle dynamics are primarily influenced by tires Image Source: Discount Tire Direct
When shopping for new tires, drivers are often presented many options within various price points. To better advise drivers on the right tire choice, AAA evaluated high-priced and low-priced all-season tires in a variety of conditions to understand the performance variation.
When to replace a worn tire is another important consideration for drivers. AAA recommends that drivers begin shopping for new tires when tread depth falls below 4/32”. To evaluate the impact of tread depth, wet stopping distances and wet skid pad performance of new tires and tires artificially worn to a tread depth of 4/32” were compared.
2 Background
Modern tires generally last several years and tens of thousands of miles. A typical radial passenger car tire is assembled with 20 or more components with 15 or more rubber compounds employed throughout. Tire design takes into account several factors including vehicle manufacturer’s ride, handling and traction criteria, along with consumer expectations relating to quality and performance [1].

7 © 2018 American Automobile Association, Inc.
AAA All-Season Tire Testing
The primary purpose of the tire is to transmit acceleration and braking torque, generate cornering forces and provide dampening characteristics [2]. For a common passenger car, the area of all four tires in contact with the ground is roughly the size of an 8.5 x 11 inch sheet of paper. It is through this contact patch or footprint that all forces act to move the vehicle according to driver inputs.
2.1 Tire Types
Tire types vary, ranging from designs built for maximum dry road summer performance to those optimized for extreme winter ice and snow traction. Most new vehicles are fitted with all-season tires suitable for year-round use in many parts of the country.
All-season tires are the most common type because they work well in both hot and cold weather. These tires have medium rubber compounds, often with special additives such as silica that improve traction. They typically use more open and grooved tread designs that allow water to easily escape and provide better grip on ice and snow. All-season tires with “M+S” (mud and snow) on the sidewall are a good choice for year-round use on most vehicles in many parts of the country.
Performance tires include high-performance, maximum performance and ultra-high performance options. These tires are made with soft rubber compounds and low-profile sidewalls to enhance dry-road traction and handling. Basic high-performance tires offer a reasonable balance of ride and handling, but the highest performance models have very short and rigid sidewalls, and robust tread support. These traits maximize steering response, cornering ability and high-speed stability, but result in less compliance and a firm ride. Their softer rubber gives performance tires limited tread life that can be less than 10,000 miles for the most aggressive models.
Light truck tires are designed to safely carry heavier loads while providing greater durability, reasonable tread life and a good balance of on- and off-road traction. Some light-duty trucks use what are essentially large passenger car tires. Heavy-duty light-truck tires include the letters “LT” in the size markings on their sidewalls. See the Tire Specifications section 2.3 later in this paper for additional information.
Winter tires provide maximum traction on ice and snow by using very aggressive tread designs and special soft rubber compounds that remain pliable even in subzero temperatures. Modern winter tires also use technologies such as silica and fiber additives in the tread, and “micropore” rubbers that help increase grip. The mountain and snowflake symbol on winter tire sidewalls indicates they can provide 25 to 50 percent better traction than all-season tires in heavy snow. Winter tires are usually recommended for areas with frequent storms and temperatures that remain below 45°F for extended periods. Because of their soft tread rubber, winter tires tend to wear rapidly at higher temperatures.
2.2 Tire Components
From the outside, tires appear to be simply constructed. However, today’s tires are made up of many raw materials comprising a multitude of parts, all carefully engineered and assembled to provide safety, durability and specific performance characteristics [3].

8 © 2018 American Automobile Association, Inc.
AAA All-Season Tire Testing
The accompanying picture shows a cross-section view of a modern radial tire. Following are short descriptions of the main components in Figure 2 keyed to the numbers in the illustration [3].
Figure 2: A cutaway view of a typical radial tire Image Source: Tire Guides Inc.
1. Grooves – circumferential slots that channel water away from under the tread to help prevent hydroplaning on wet roads.
2. Ribs – circumferential bands of raised tread rubber, situated between the grooves that provide the tire’s contact patch with the road. Ribs often contain cross grooves that help channel away water and form tread blocks whose edges aid grip on loose and slippery surfaces. Some ribs also have very small slits, called sipes that further enhance traction on wet and icy roads.
3. Tread Pattern – the design of the tread area that contacts the road. As a general rule, winter, all-season and off-road tires have more open tread designs with lots of grooves to evacuate water and many individual tread blocks to provide traction on compromised surfaces. High-performance tires have fewer grooves and larger solid rubber sections for maximum dry-road grip, the trade-off being less traction on wet roads, and reduced suitability for use in cold, ice and snow conditions.
9 © 2018 American Automobile Association, Inc.
AAA All-Season Tire Testing
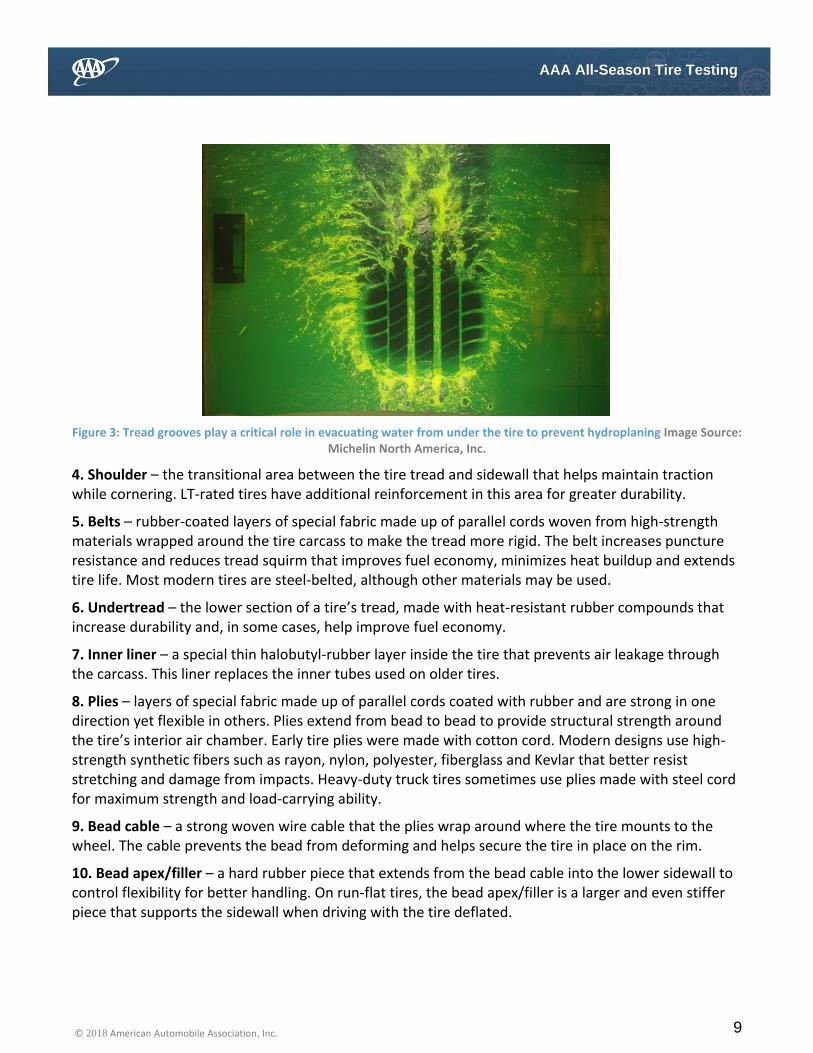
Figure 3: Tread grooves play a critical role in evacuating water from under the tire to prevent hydroplaning Image Source: Michelin North America, Inc.
4. Shoulder – the transitional area between the tire tread and sidewall that helps maintain traction while cornering. LT-rated tires have additional reinforcement in this area for greater durability.
5. Belts – rubber-coated layers of special fabric made up of parallel cords woven from high-strength materials wrapped around the tire carcass to make the tread more rigid. The belt increases puncture resistance and reduces tread squirm that improves fuel economy, minimizes heat buildup and extends tire life. Most modern tires are steel-belted, although other materials may be used.
6. Undertread – the lower section of a tire’s tread, made with heat-resistant rubber compounds that increase durability and, in some cases, help improve fuel economy.
7. Inner liner – a special thin halobutyl-rubber layer inside the tire that prevents air leakage through the carcass. This liner replaces the inner tubes used on older tires.
8. Plies – layers of special fabric made up of parallel cords coated with rubber and are strong in one direction yet flexible in others. Plies extend from bead to bead to provide structural strength around the tire’s interior air chamber. Early tire plies were made with cotton cord. Modern designs use high-strength synthetic fibers such as rayon, nylon, polyester, fiberglass and Kevlar that better resist stretching and damage from impacts. Heavy-duty truck tires sometimes use plies made with steel cord for maximum strength and load-carrying ability.
9. Bead cable – a strong woven wire cable that the plies wrap around where the tire mounts to the wheel. The cable prevents the bead from deforming and helps secure the tire in place on the rim.
10. Bead apex/filler – a hard rubber piece that extends from the bead cable into the lower sidewall to control flexibility for better handling. On run-flat tires, the bead apex/filler is a larger and even stiffer piece that supports the sidewall when driving with the tire deflated.
10 © 2018 American Automobile Association, Inc.
AAA All-Season Tire Testing
11. Bead chafer – a layer of fabric that helps protect the bead cable and apex/filler from being chafed by the wheel rim or damaged when the tire is mounted on a wheel.
2.3 Tire Specifications
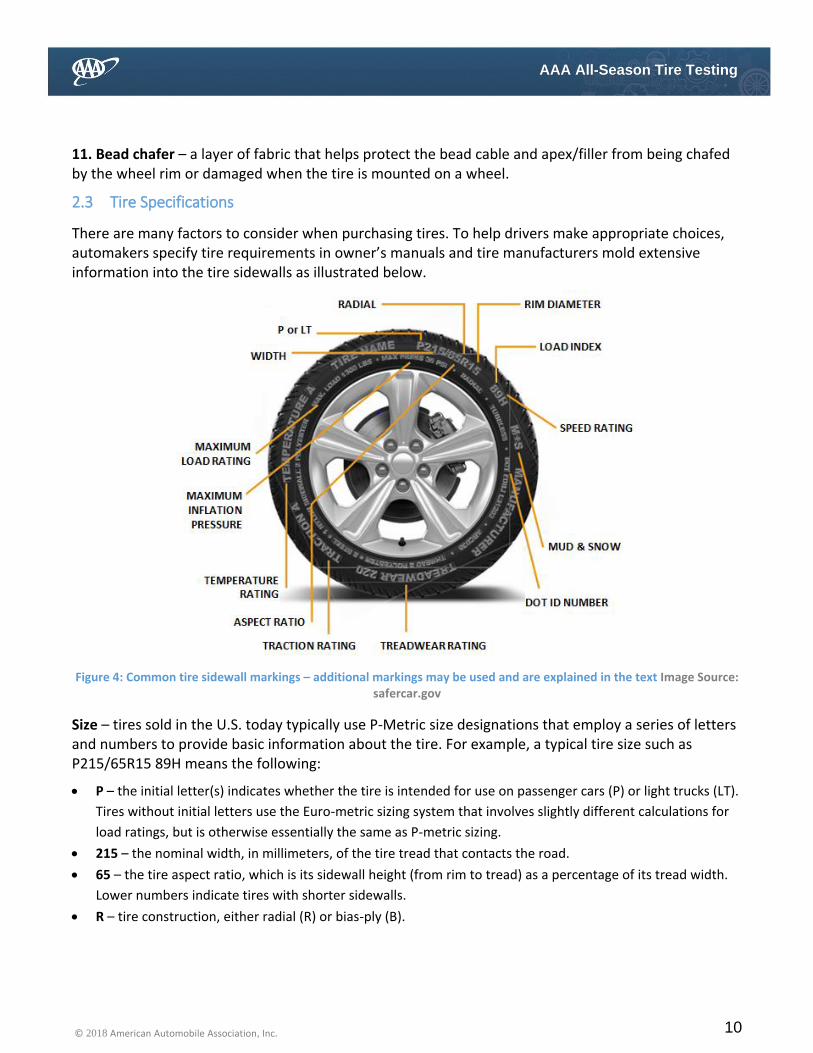
There are many factors to consider when purchasing tires. To help drivers make appropriate choices, automakers specify tire requirements in owner’s manuals and tire manufacturers mold extensive information into the tire sidewalls as illustrated below.
Figure 4: Common tire sidewall markings – additional markings may be used and are explained in the text Image Source: safercar.gov
Size – tires sold in the U.S. today typically use P-Metric size designations that employ a series of letters and numbers to provide basic information about the tire. For example, a typical tire size such as P215/65R15 89H means the following:
P – the initial letter(s) indicates whether the tire is intended for use on passenger cars (P) or light trucks (LT).
Tires without initial letters use the Euro-metric sizing system that involves slightly different calculations for
load ratings, but is otherwise essentially the same as P-metric sizing.
215 – the nominal width, in millimeters, of the tire tread that contacts the road.
65 – the tire aspect ratio, which is its sidewall height (from rim to tread) as a percentage of its tread width.
Lower numbers indicate tires with shorter sidewalls.
R – tire construction, either radial (R) or bias-ply (B).
11 © 2018 American Automobile Association, Inc.
AAA All-Season Tire Testing
15 – the tire’s inside diameter in inches, which is also the outside diameter of the wheel rim the tire is
designed to fit. Common passenger car and light truck wheel sizes range from 15 to 22 inches, although
some older models have smaller wheels and larger-diameter custom wheels are available from aftermarket
suppliers.
Load Index – this two- or three-digit code following the tire size designation indicates the maximum weight a tire can safely support. Load indexes run from zero to 150, with most passenger car and light-truck ratings falling in the 71 to 110 range (761 to 2,337 pounds). Most tires also have a “max load” weight molded into the tire sidewall.
Max Load – the tire’s maximum load carrying capacity at the stated inflation pressure. This is roughly equivalent to the weight represented by the load index code.
Load Range – most passenger car tires fall into load range B, which is roughly equivalent to the older 4-ply tire rating. Tires in this range usually deliver their maximum rated load capacity at an inflation pressure of around 36 psi. Some light-truck tires, particularly those on ¾-ton or higher-rated vehicles, meet load range C, D or E requirements which are roughly equivalent to the older 6-, 8- and 10-ply ratings. These heavy-duty tires are designed to be inflated at pressures of up to 80 psi, depending on the load range, to meet their maximum carrying and towing capacities.
The load range may be molded separately into the tire sidewall or the rim diameter in the tire size designation may be followed by the letter C, D or E as appropriate. When a load range is not explicitly stated on a car tire, load range B is assumed. Unlike older tires with 4, 6, 8 or 10 plies made of cotton cord, modern tires contain fewer, thicker and stronger plies to achieve the equivalent load ranges.
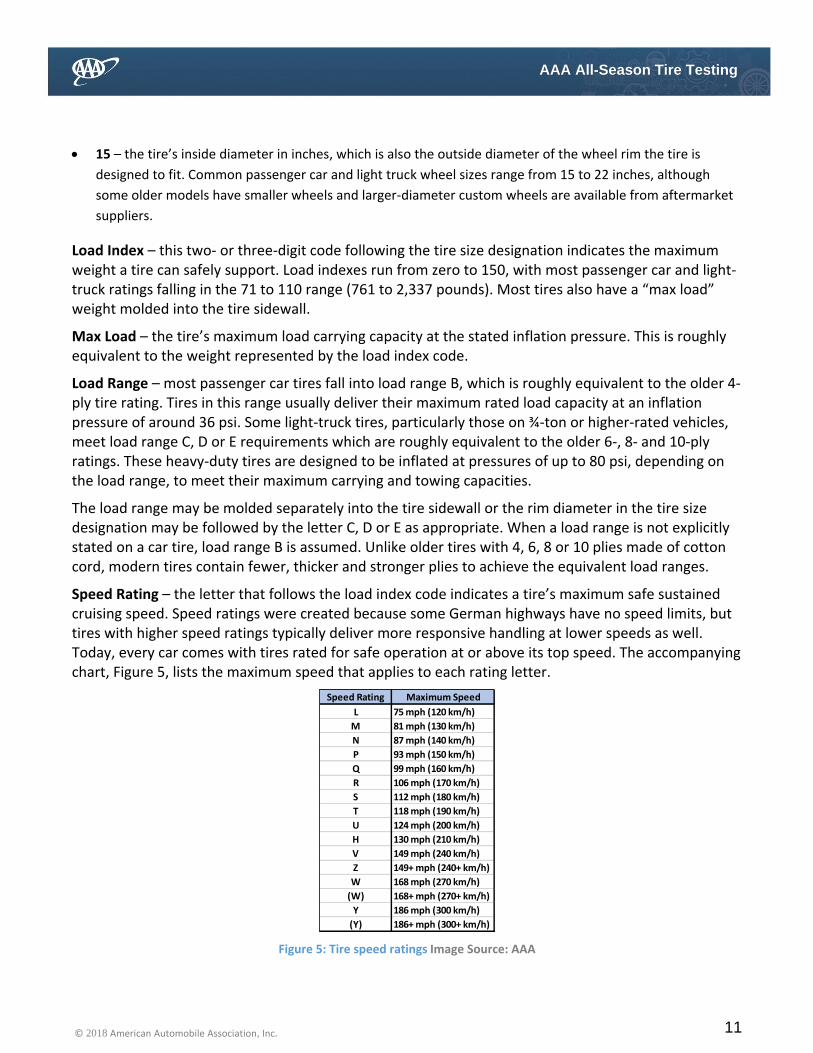
Speed Rating – the letter that follows the load index code indicates a tire’s maximum safe sustained cruising speed. Speed ratings were created because some German highways have no speed limits, but tires with higher speed ratings typically deliver more responsive handling at lower speeds as well. Today, every car comes with tires rated for safe operation at or above its top speed. The accompanying chart, Figure 5, lists the maximum speed that applies to each rating letter.
Figure 5: Tire speed ratings Image Source: AAA
Speed Rating Maximum Speed
L 75 mph (120 km/h)
M 81 mph (130 km/h)
N 87 mph (140 km/h)
P 93 mph (150 km/h)
Q 99 mph (160 km/h)
R 106 mph (170 km/h)
S 112 mph (180 km/h)
T 118 mph (190 km/h)
U 124 mph (200 km/h)
H 130 mph (210 km/h)
V 149 mph (240 km/h)
Z 149+ mph (240+ km/h)
W 168 mph (270 km/h)
(W) 168+ mph (270+ km/h)
Y 186 mph (300 km/h)
(Y) 186+ mph (300+ km/h)

12 © 2018 American Automobile Association, Inc.
AAA All-Season Tire Testing
For a long time, Z (149 mph) was the highest speed rating. However, as automakers built higher-performance exotic cars, W (168 mph) and Y (186 mph) speed ratings were introduced. Today, some supercars are capable of even greater speeds and use tires that have the (W) or (Y) in parentheses, the former indicates a speed rating of 168+ mph, and the latter a rating of 186+ mph. Any tire with a Z, W or Y speed rating may also have a Z in the tire size designation before the radial (R) designation – for example 225/50ZR16 91W; however, the speed rating letter after the load index takes precedence.
Tire Identification Number (TIN) – the U.S. Department of Transportation (DOT) requires that every tire have a TIN molded into the sidewall. As shown in the accompanying illustration, Figure 6, two TIN formats have been used, the only difference is how the tire manufacture date is indicated. Characters that appear after the manufacture date are manufacturer specific marketing codes. NHTSA uses TIN information to identify tires involved in recalls.
Figure 6. The old and current DOT tire identification numbering schemes Image Source: AAA
Tire Ply Composition – this information describes the number of plies in the tire carcass and belts, and the type of cord materials used for each.
Max Press – the pressure required for the tire to meet its maximum load capacity. This pressure will vary with the load range of the tire. “Max Press” is not the recommended inflation pressure for the tire. That value can be found on the vehicle’s Tire and Loading Information decal that is usually located on the driver’s doorjamb.
2.4 Uniform Tire Quality Grade (UTQG) Standards
The DOT and the National Highway Traffic Safety Administration (NHTSA) created the UTQG standards to help consumers evaluate tire performance. The standards consist of three grades:
Treadwear grade – a three-digit number typically ranging from 100 to 600 that indicates relative tread life. A tire with a treadwear rating of 400 will last twice as many miles as a tire rated at 200. However, of the UTQG standards, treadwear ratings vary the most because tires are tested for only 7,200 miles alongside a government-specified control tire. Treadwear for the full tire life is then extrapolated using a calculation established by each tire manufacturer. Results vary depending on how conservative or
13 © 2018 American Automobile Association, Inc.
AAA All-Season Tire Testing
optimistic the formula is. Treadwear grade comparisons are fairly accurate within a manufacturer’s product line, but much less so when comparing one tire brand to another.
Traction grade – the four traction grades (AA, A, B and C, with AA being best) indicate the friction coefficient of a locked tire sliding on wet pavement – similar to an emergency stop. This test does not account for hydroplaning or wet cornering characteristics. As such, the test evaluates tread rubber compound much more than the tread pattern, which can play a major role in hydroplaning resistance and cornering traction under more normal driving conditions.
Temperature grade – a letter (A, B or C, with A being best) that indicates the tire’s ability to dissipate heat at higher speeds when properly inflated. Temperature grade tests are similar to those performed to establish a tire’s speed rating. Tires sold in the U.S. must have at least a C rating, which indicates adequate heat resistance at 85-100 mph. Tires with a B rating meet the standards at 100-115 mph, and A-rated tires do so at speeds of more than 115 mph.
3 Vehicle Selection Methodology
AAA researchers evaluated U.S. vehicle sales data spanning a four-year period (2013 – 2016) to determine the most frequently purchased passenger car and light truck. As top-selling vehicles, the Toyota Camry and Ford F-150 were selected as test vehicles to represent their respective categories.
For the purpose of this study, the most popular trim level of each 2017 model was selected for testing, outfitted with the tire size that comes standard on each. In order to ensure that the majority of drivers are familiar with the selected test tire size, researchers verified that similar tire sizes were either standard or optional on other popular vehicles.
A 2017 Toyota Camry and a 2017 Ford F-150 were procured for track evaluation of test tires. Each vehicle was aligned to factory specifications and inspected to determine suitability for track testing according to the following checklist:
a. Scan for active trouble codes. Open issues could result in selection of an alternate vehicle of the same
make and model.
b. Check for Technical Service Bulletins (TSBs) and recalls that pertain to the braking system. Any open
issues would result in the selection of an alternate vehicle of the same make and model.
c. Inspect brake fluid level and top-off as necessary.
d. Inspect pads and rotors for adequate thickness and absence of rotor warping.
4 Tire Selection Methodology
The 2017 Toyota Camry comes standard with 215/55R17 tires and the 2017 Ford F-150 comes standard with P265/70R17 tires. The following procedure was used to select six tire models per vehicle for testing:
a. The websites of major retailers were utilized to develop a list of commonly available 215/55R17 and
265/70R17 tires. To be eligible for testing, prospective tires had to meet the following criteria:
i. Classified as an all-season tire.
14 © 2018 American Automobile Association, Inc.
AAA All-Season Tire Testing
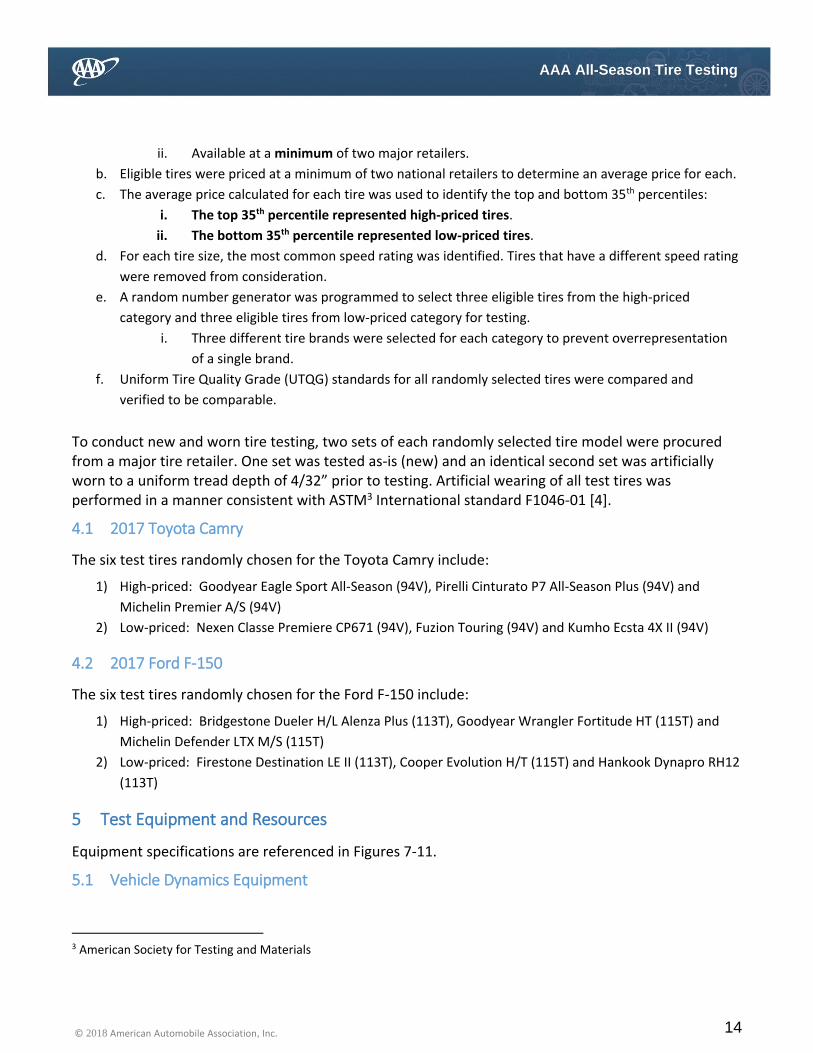
ii. Available at a minimum of two major retailers.
b. Eligible tires were priced at a minimum of two national retailers to determine an average price for each.
c. The average price calculated for each tire was used to identify the top and bottom 35th percentiles:
i. The top 35th percentile represented high-priced tires.
ii. The bottom 35th percentile represented low-priced tires.
d. For each tire size, the most common speed rating was identified. Tires that have a different speed rating
were removed from consideration.
e. A random number generator was programmed to select three eligible tires from the high-priced
category and three eligible tires from low-priced category for testing.
i. Three different tire brands were selected for each category to prevent overrepresentation
of a single brand.
f. Uniform Tire Quality Grade (UTQG) standards for all randomly selected tires were compared and
verified to be comparable.
To conduct new and worn tire testing, two sets of each randomly selected tire model were procured from a major tire retailer. One set was tested as-is (new) and an identical second set was artificially worn to a uniform tread depth of 4/32” prior to testing. Artificial wearing of all test tires was performed in a manner consistent with ASTM3 International standard F1046-01 [4].
4.1 2017 Toyota Camry
The six test tires randomly chosen for the Toyota Camry include:
1) High-priced: Goodyear Eagle Sport All-Season (94V), Pirelli Cinturato P7 All-Season Plus (94V) and
Michelin Premier A/S (94V)
2) Low-priced: Nexen Classe Premiere CP671 (94V), Fuzion Touring (94V) and Kumho Ecsta 4X II (94V)
4.2 2017 Ford F-150
The six test tires randomly chosen for the Ford F-150 include:
1) High-priced: Bridgestone Dueler H/L Alenza Plus (113T), Goodyear Wrangler Fortitude HT (115T) and
Michelin Defender LTX M/S (115T)
2) Low-priced: Firestone Destination LE II (113T), Cooper Evolution H/T (115T) and Hankook Dynapro RH12
(113T)
5 Test Equipment and Resources
Equipment specifications are referenced in Figures 7-11.
5.1 Vehicle Dynamics Equipment
3 American Society for Testing and Materials
15 © 2018 American Automobile Association, Inc.
AAA All-Season Tire Testing
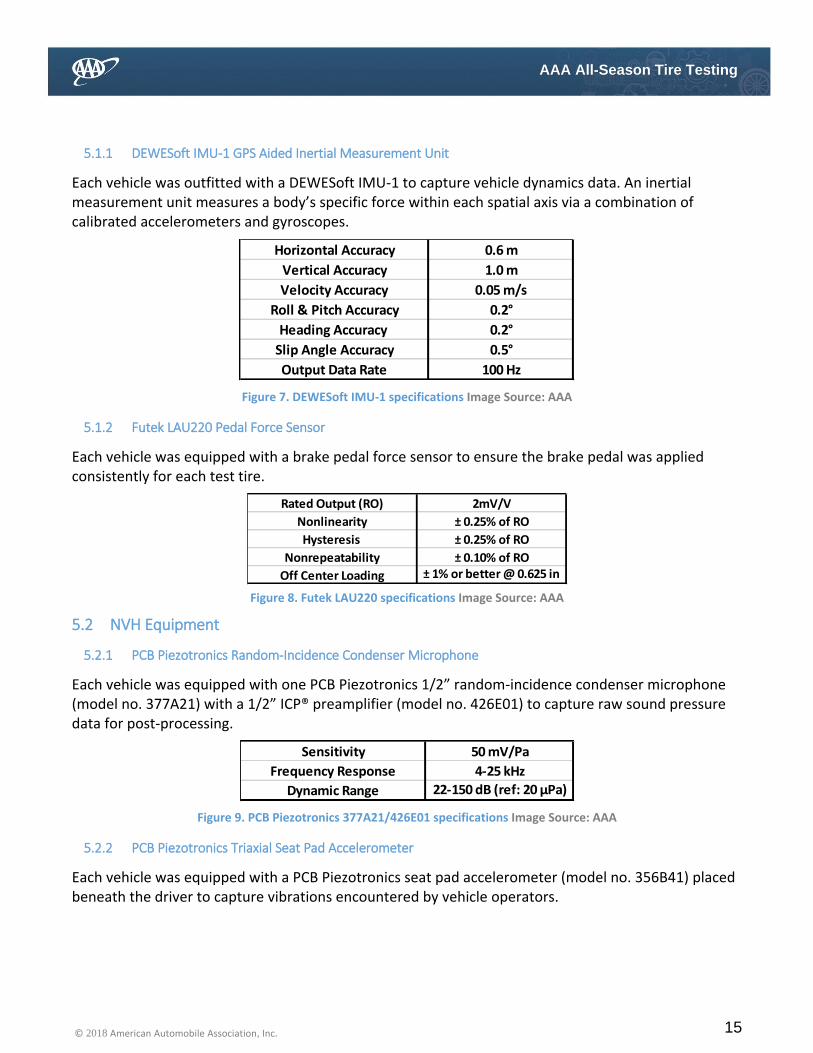
5.1.1 DEWESoft IMU-1 GPS Aided Inertial Measurement Unit
Each vehicle was outfitted with a DEWESoft IMU-1 to capture vehicle dynamics data. An inertial measurement unit measures a body’s specific force within each spatial axis via a combination of calibrated accelerometers and gyroscopes.
Figure 7. DEWESoft IMU-1 specifications Image Source: AAA
5.1.2 Futek LAU220 Pedal Force Sensor
Each vehicle was equipped with a brake pedal force sensor to ensure the brake pedal was applied consistently for each test tire.
Figure 8. Futek LAU220 specifications Image Source: AAA
5.2 NVH Equipment
5.2.1 PCB Piezotronics Random-Incidence Condenser Microphone
Each vehicle was equipped with one PCB Piezotronics 1/2” random-incidence condenser microphone (model no. 377A21) with a 1/2” ICP® preamplifier (model no. 426E01) to capture raw sound pressure data for post-processing.
Figure 9. PCB Piezotronics 377A21/426E01 specifications Image Source: AAA
5.2.2 PCB Piezotronics Triaxial Seat Pad Accelerometer
Each vehicle was equipped with a PCB Piezotronics seat pad accelerometer (model no. 356B41) placed beneath the driver to capture vibrations encountered by vehicle operators.
Horizontal Accuracy 0.6 m
Vertical Accuracy 1.0 m
Velocity Accuracy 0.05 m/s
Roll & Pitch Accuracy 0.2°
Heading Accuracy 0.2°
Slip Angle Accuracy 0.5°
Output Data Rate 100 Hz
Rated Output (RO) 2mV/V
Nonlinearity ± 0.25% of RO
Hysteresis ± 0.25% of RO
Nonrepeatability ± 0.10% of RO
Off Center Loading ± 1% or better @ 0.625 in
Sensitivity 50 mV/Pa
Frequency Response 4-25 kHz
Dynamic Range 22-150 dB (ref: 20 μPa)

16 © 2018 American Automobile Association, Inc.
AAA All-Season Tire Testing
Figure 10. PCB Piezotronics 356B41 specifications Image Source: AAA
5.3 Data Logging Equipment
The Toyota Camry test vehicle was equipped with a DEWESoft DEWE-43 data logger and the Ford F-150 test vehicle was equipped with a DEWESoft SIRIUS® slice data logger. Each data logger was equipped with anti-aliasing filters to attenuate any frequencies above the Nyquist frequency.
Figure 11. Data sampling rate of each sensor Image Source: AAA
5.4 Test Facility
All testing was conducted at Michelin Laurens Proving Grounds in Mountville, S.C., and was rented by AAA for independent testing. The facility was chosen because it is specially equipped to provide consistent track conditions, which are necessary for repeatable test data.
The wet braking area contained precise water depth controls with an average, consistent depth of 1.0 mm throughout the testing lane. The surface was composed of asphalt with granite aggregate and is representative of roads throughout the southeastern United States.
The NVH area featured surfaces representative of real-world roads such as smooth and rough asphalt, smooth and rough concrete, potholes and other types of road imperfections.
The wet skid pad area was composed of polished concrete watered with a sprinkler system. The radius of the skid pad was 394 feet with an average water depth of 0.8 mm. This surface is representative of a low-traction situation and significantly challenges the wet-handling characteristics of tires under test.
Validation testing was independently conducted at a separate facility also equipped to provide consistent track conditions. Test results were confirmed in the course of validation testing.
6 Inquiry #1: Are there differences in performance between commonly available high-
priced and low-priced tires?
6.1 Objective
Determine if performance differences exist between new high-priced and low-priced tires.
Amplitude Range ± 10 g
Sensitivity 100 mV/g
Frequency Range 0.5-1000 Hz
Resolution 0.0002 g rms
Mechanical Shock Limit 2000 g
Sensor Sampling Rate
Inertial Measurement Unit 100 Hz
Pedal Force Sensor 2000 Hz
Seat-Pad Accelerometer 20000 Hz
Microphone 20000 Hz
17 © 2018 American Automobile Association, Inc.
AAA All-Season Tire Testing
6.2 Methodology
Wet stopping distance, wet maximum lateral acceleration, and NVH characteristics were utilized to identify performance differences between new high-priced and low-priced tires. All equipment, tires, vehicles and drivers were provided by AAA.
6.2.1 Wet Performance Testing
Wet stopping distance and wet maximum lateral acceleration tests were chosen because wet stopping and cornering characteristics greatly influence vehicle performance during emergencies encountered in adverse conditions. This situation increases the likelihood of skidding, which can be defined as “the inability of the driver to maintain ‘vectorial trajectory control’ in any maneuver” [5]. In other words, if control of either vehicle speed or trajectory is lost, the vehicle is in a skid.
Available traction is a function of vehicle speed, water depth, combined macro-micro texture of the pavement, and the specific performance factors of a given tire. Every type of maneuver, from driving down a straight road at a constant velocity to a high-speed emergency lane change requires a certain amount of traction. If the traction demand exceeds available traction at that instant, skidding will occur [5]. To evaluate tires for their wet performance, test conditions were chosen to produce a high probability of skidding while accounting for conditions typically encountered on public roads.
The braking traction coefficient is inversely related to vehicle speed. A test speed of 60 mph was chosen for wet stopping distance tests because this test speed is a recognized industry standard. Additionally, Gegenback et al. [6] have found that while traction level is mostly independent of water depth at low speeds (<30 mph), traction level is strongly influenced by water depth at speeds of 60 mph or greater. Yeager et al. [7] have determined on-road water depths likely encountered during rainfall range from 0.6 mm for a drizzle to 2.4 mm for a heavy thunderstorm. For wet stopping tests, an average water depth of 1.0 mm is an appropriate approximation for typical rainfall encountered throughout much of the country. The pavement surface of asphalt with granite aggregate is typical of public roads throughout the southeastern United States.
Additionally, it is important to evaluate lateral acceleration because this acceleration is responsible for cornering. With no lateral acceleration, turning or cornering would not be possible. The lateral force generated by a tire results in lateral acceleration according to Newton’s Second Law. The ability of a tire to generate lateral force and thereby cause lateral acceleration is strongly dependent on speed, water depth and surface texture during high-slip angles developed in emergency maneuvers. Wet lateral acceleration tests were conducted on a polished concrete skid pad with a radius of 394 feet and an average water depth of 0.8 mm. These characteristics are representative of a worst-case scenario because the low grip surface and moderately deep water depth will create extremely low cornering traction coefficients. Low cornering traction coefficients also are found in low-skid resistant sections of public highways. Historical work has shown that accident rates increased significantly at pavement sites with low skid resistance [8]. The maximum wet lateral acceleration allowed by each test tire set was generated by driving on the skid pad at a gradually increasing speed until front tires began to lose grip and the vehicle consequently veered off the centerline of the course.

18 © 2018 American Automobile Association, Inc.
AAA All-Season Tire Testing
6.2.2 NVH Characterization
NVH characteristics are an important consideration for the consumer. For passenger cars, it is possible for tire rolling noise to be the dominant source of driving noise at speeds above 35 mph when the vehicle is driven in a high gear [9]. Additionally, tires can be a significant source of vibrations felt by vehicle occupants at contact points such as the seat, floorboard and steering wheel. Both noise and vibration resulting from tire characteristics contribute to occupant fatigue and discomfort. Current design and construction practices allow for tires that have low-rolling noise and vibration characteristics while maintaining good performance in dry and wet conditions.
For each test tire, input from the microphone was processed to generate the dB(A) weighted equivalent continuous sound level for each track section. This value is reported in decibels, the logarithmic ratio of a given sound pressure relative to a reference sound pressure. In this case, the reference sound pressure is the threshold of human hearing. Since decibel values are based on the logarithmic scale, care must be taken when comparing values. For example, a decibel increase of 3 dB translates to a doubling of sound pressure.
A-weighting was applied to the measured sound levels because the response of the human ear is not linear across perceivable frequencies. A-weighting is widely used to account for the relative loudness perceived by a typical, healthy human ear and is formally defined by the International Electrotechnical Commission standard IEC 61672-1:2013.
Within each track section, input from the seat-pad accelerometer was collected to determine the following parameters for each test tire:
Maximum root-mean-square (RMS) vibration magnitude – running RMS vibration magnitude was recorded for five-second intervals. The peak running RMS value is reported herein. Each spatial axis is summed within this parameter. The x-axis is orientated with fore and aft motion, the y-axis is orientated with side-to-side motion, the z-axis is orientated along the body’s longitudinal axis. The x-axis and y-axis are weighted higher because humans are more sensitive to horizontal vibrations. This parameter is well suited for quantifying consistent vibrations typical of vehicle operation on most well-maintained, public roads.
Maximum transient vibration value (MTVV) – maximum of the running RMS vibration magnitude over one-second intervals. This value can be utilized to evaluate the ability of tires to dampen transient shocks caused by bumpy roads.
Maximum Crest factor – ratio between the peak vibration magnitude and RMS magnitude. The maximum crest factor in the z-axis is reported herein. This ratio is useful for determining if the RMS magnitude is solely adequate for evaluating the vibration profile of a measurement period.
Maximum Peak Vibration in the z-axis – the peak vibration in the z-axis was recorded over five second intervals. The maximum peak vibration is reported in the test results.
Since the route was identical for each test tire, it is possible to directly compare microphone and accelerometer data. In addition to quantitative data from the microphone and seat-pad accelerometer, subjective driver feedback was utilized to evaluate NVH characteristics for each test tire.

19 © 2018 American Automobile Association, Inc.
AAA All-Season Tire Testing
6.3 Test Procedures & Results
Both vehicles were inspected and fully instrumented prior to track testing. All passenger car and light truck test tires were pre-mounted on OE wheels for the Toyota Camry and Ford F-150, respectively. The tire inflation pressure was identical to the placard pressure for each vehicle.
The ambient temperature, track temperature(s) and average water depths for each day of testing are included in the Appendix.
The sequence of test tires remained constant for each test and was inspected by AAA personnel. High-priced and low-priced tires were alternated to minimize environmental bias on any one category. Both new and artificially worn tires followed the sequence described below.
The test sequence for the Toyota Camry was as follows: 1) Nexen Classe Premiere CP671
2) Goodyear Eagle Sport
3) Fuzion Touring
4) Pirelli Cinturato All-Season Plus
5) Kumho Ecsta 4X II
6) Michelin Premier A/S
The test sequence for the Ford F-150 was as follows: 1) Firestone Destination LE II
2) Bridgestone Dueler H/L Alenza Plus (113T)
3) Cooper Evolution H/T (115T)
4) Michelin Defender LTX M/S (115T)
5) Hankook Dyanpro RH12 (113T)
6) Goodyear Wrangler Fortitude HT (115T)
6.3.1 NVH Characterization
NVH characterization was conducted first to eliminate the possibility of tire wear having an undesired influence on both objective and subjective data. Only new tires were evaluated due to concerns that artificially worn tires will not have NVH characteristics representative of tires worn during naturalistic driving. This will be discussed in further detail in Section 7.2.
To evaluate the NVH characteristics of test tires, a 3.0-mile course specifically designed for noise and comfort evaluations was utilized. The course was comprised of 12 sections, each representative of a different road surface.
For each test tire, two laps were driven around the course at a consistent speed of 45 mph. Software was used to map a precise route within the NVH course for maximum consistency between test tires.
For each test tire, data collection was initiated at the beginning of the evaluation loop and terminated once the vehicle came to a stop at the end of the evaluation loop. Software was used to divide the NVH loop into 12 sections, each representing a different pavement type. All parameters are calculated with

20 © 2018 American Automobile Association, Inc.
AAA All-Season Tire Testing
respect to each section of the NVH loop and reported in the Appendix. Data pertaining to smooth asphalt, bumpy asphalt and uneven concrete are detailed here.
For each vehicle, a set of OE reference tires was driven on the evaluation loop before and after test tires were run. Data from each reference set were compared to ensure test data were not influenced by environmental variations.
6.3.1.1 2017 Toyota Camry
Figure 12. Average NVH data for smooth asphalt Image Source: AAA
Figure 13. Average NVH data for bumpy asphalt Image Source: AAA
LAeq (dBA) RMS SUM MAX (g) MTVV SUM MAX (g) PEAK Z (g) CREST Z MAX
Goodyear Eagle 66.58 0.041 0.069 0.154 4.991
Pirelli Cinturato 65.77 0.051 0.096 0.268 5.228
Michelin Premier 65.68 0.052 0.096 0.259 5.081
Average 66.03 0.048 0.09 0.23 5.10
Standard Deviation N/A 0.005 0.01 0.05 0.10
LAeq (dBA) RMS SUM MAX (g) MTVV SUM MAX (g) PEAK Z (g) CREST Z MAX
Nexen Classe 64.94 0.052 0.094 0.249 5.170
Fuzion Touring 65.67 0.049 0.092 0.239 5.715
Kumho Ecsta 66.96 0.052 0.097 0.264 5.071
Average 65.94 0.051 0.09 0.25 5.32
Standard Deviation N/A 0.001 0.00 0.01 0.28
Smooth Asphalt
Low-Priced New
High-Priced New
LAeq (dBA) RMS SUM MAX (g) MTVV SUM MAX (g) PEAK Z (g) CREST Z MAX
Goodyear Eagle 73.40 0.170 0.303 0.887 6.491
Pirelli Cinturato 70.17 0.099 0.132 0.358 4.344
Michelin Premier 70.63 0.111 0.148 0.405 4.236
Average 71.65 0.127 0.19 0.55 5.02
Standard Deviation N/A 0.031 0.08 0.24 1.04
LAeq (dBA) RMS SUM MAX (g) MTVV SUM MAX (g) PEAK Z (g) CREST Z MAX
Nexen Classe 70.26 0.113 0.143 0.419 4.097
Fuzion Touring 70.79 0.108 0.143 0.401 4.258
Kumho Ecsta 70.79 0.117 0.158 0.440 4.245
Average 70.62 0.113 0.15 0.42 4.20
Standard Deviation N/A 0.004 0.01 0.02 0.07
Low-Priced New
High-Priced New
Bumpy Asphalt
21 © 2018 American Automobile Association, Inc.
AAA All-Season Tire Testing
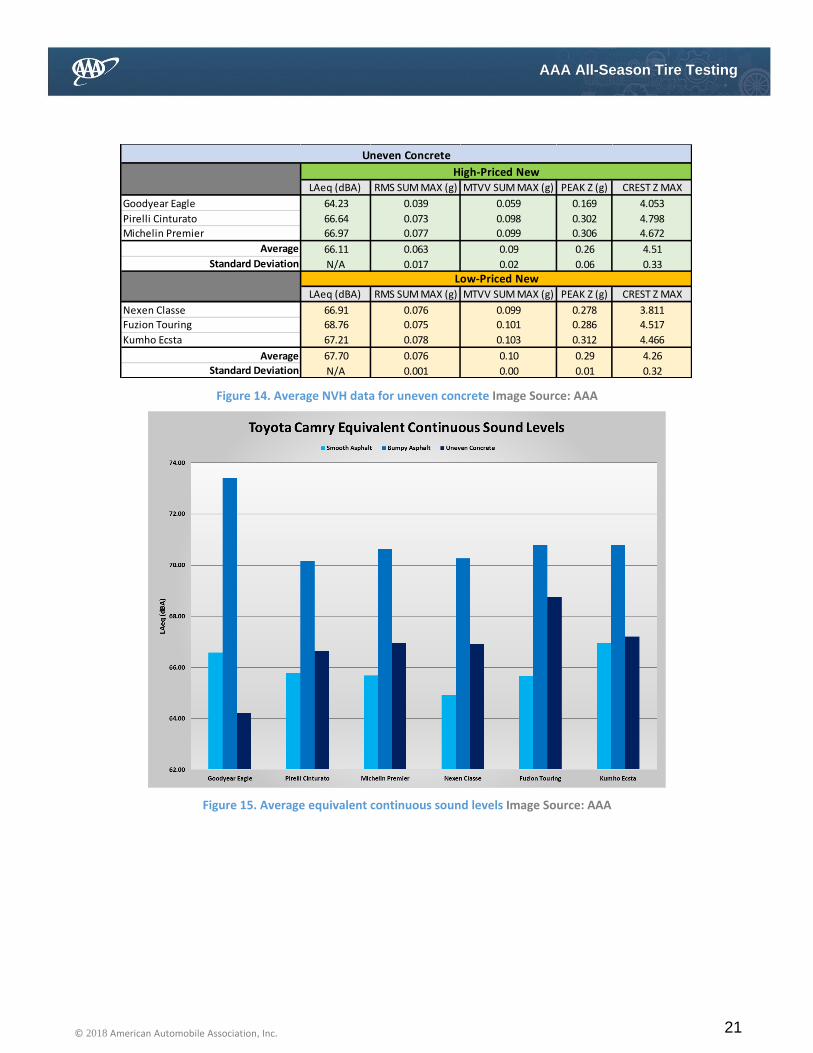
Figure 14. Average NVH data for uneven concrete Image Source: AAA
Figure 15. Average equivalent continuous sound levels Image Source: AAA
LAeq (dBA) RMS SUM MAX (g) MTVV SUM MAX (g) PEAK Z (g) CREST Z MAX
Goodyear Eagle 64.23 0.039 0.059 0.169 4.053
Pirelli Cinturato 66.64 0.073 0.098 0.302 4.798
Michelin Premier 66.97 0.077 0.099 0.306 4.672
Average 66.11 0.063 0.09 0.26 4.51
Standard Deviation N/A 0.017 0.02 0.06 0.33
LAeq (dBA) RMS SUM MAX (g) MTVV SUM MAX (g) PEAK Z (g) CREST Z MAX
Nexen Classe 66.91 0.076 0.099 0.278 3.811
Fuzion Touring 68.76 0.075 0.101 0.286 4.517
Kumho Ecsta 67.21 0.078 0.103 0.312 4.466
Average 67.70 0.076 0.10 0.29 4.26
Standard Deviation N/A 0.001 0.00 0.01 0.32
Low-Priced New
High-Priced New
Uneven Concrete

22 © 2018 American Automobile Association, Inc.
AAA All-Season Tire Testing
Figure 16. Average NVH data for smooth asphalt Image Source: AAA
Figure 17. Average NVH data for bumpy asphalt Image Source: AAA
23 © 2018 American Automobile Association, Inc.
AAA All-Season Tire Testing
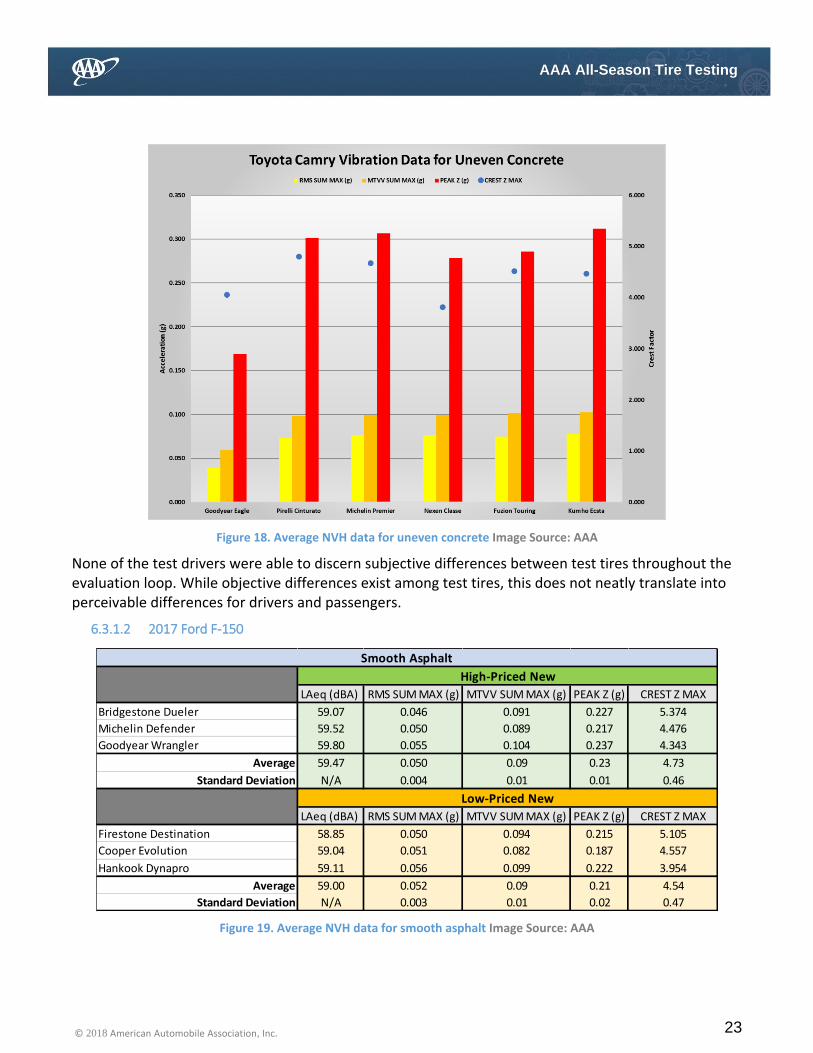
Figure 18. Average NVH data for uneven concrete Image Source: AAA
None of the test drivers were able to discern subjective differences between test tires throughout the evaluation loop. While objective differences exist among test tires, this does not neatly translate into perceivable differences for drivers and passengers.
6.3.1.2 2017 Ford F-150
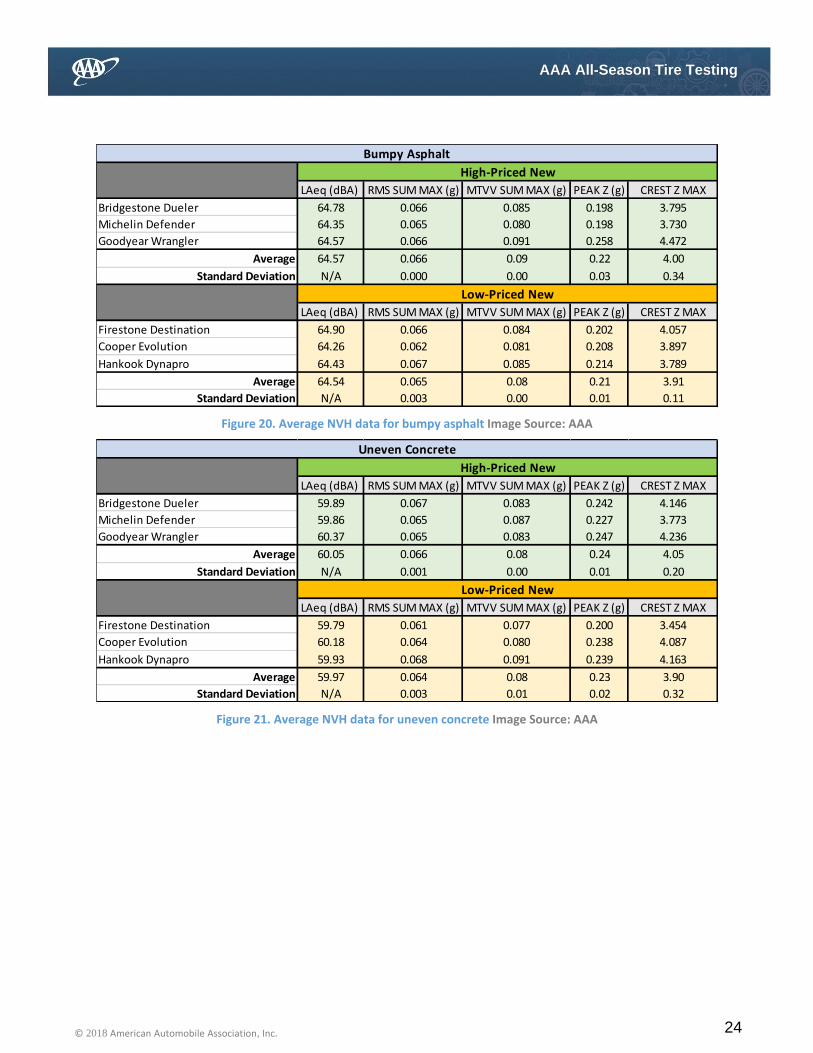
Figure 19. Average NVH data for smooth asphalt Image Source: AAA
LAeq (dBA) RMS SUM MAX (g) MTVV SUM MAX (g) PEAK Z (g) CREST Z MAX
Bridgestone Dueler 59.07 0.046 0.091 0.227 5.374
Michelin Defender 59.52 0.050 0.089 0.217 4.476
Goodyear Wrangler 59.80 0.055 0.104 0.237 4.343
Average 59.47 0.050 0.09 0.23 4.73
Standard Deviation N/A 0.004 0.01 0.01 0.46
LAeq (dBA) RMS SUM MAX (g) MTVV SUM MAX (g) PEAK Z (g) CREST Z MAX
Firestone Destination 58.85 0.050 0.094 0.215 5.105
Cooper Evolution 59.04 0.051 0.082 0.187 4.557
Hankook Dynapro 59.11 0.056 0.099 0.222 3.954
Average 59.00 0.052 0.09 0.21 4.54
Standard Deviation N/A 0.003 0.01 0.02 0.47
High-Priced New
Smooth Asphalt
Low-Priced New
24 © 2018 American Automobile Association, Inc.
AAA All-Season Tire Testing
Figure 20. Average NVH data for bumpy asphalt Image Source: AAA
Figure 21. Average NVH data for uneven concrete Image Source: AAA
LAeq (dBA) RMS SUM MAX (g) MTVV SUM MAX (g) PEAK Z (g) CREST Z MAX
Bridgestone Dueler 64.78 0.066 0.085 0.198 3.795
Michelin Defender 64.35 0.065 0.080 0.198 3.730
Goodyear Wrangler 64.57 0.066 0.091 0.258 4.472
Average 64.57 0.066 0.09 0.22 4.00
Standard Deviation N/A 0.000 0.00 0.03 0.34
LAeq (dBA) RMS SUM MAX (g) MTVV SUM MAX (g) PEAK Z (g) CREST Z MAX
Firestone Destination 64.90 0.066 0.084 0.202 4.057
Cooper Evolution 64.26 0.062 0.081 0.208 3.897
Hankook Dynapro 64.43 0.067 0.085 0.214 3.789
Average 64.54 0.065 0.08 0.21 3.91
Standard Deviation N/A 0.003 0.00 0.01 0.11
High-Priced New
Bumpy Asphalt
Low-Priced New
LAeq (dBA) RMS SUM MAX (g) MTVV SUM MAX (g) PEAK Z (g) CREST Z MAX
Bridgestone Dueler 59.89 0.067 0.083 0.242 4.146
Michelin Defender 59.86 0.065 0.087 0.227 3.773
Goodyear Wrangler 60.37 0.065 0.083 0.247 4.236
Average 60.05 0.066 0.08 0.24 4.05
Standard Deviation N/A 0.001 0.00 0.01 0.20
LAeq (dBA) RMS SUM MAX (g) MTVV SUM MAX (g) PEAK Z (g) CREST Z MAX
Firestone Destination 59.79 0.061 0.077 0.200 3.454
Cooper Evolution 60.18 0.064 0.080 0.238 4.087
Hankook Dynapro 59.93 0.068 0.091 0.239 4.163
Average 59.97 0.064 0.08 0.23 3.90
Standard Deviation N/A 0.003 0.01 0.02 0.32
Uneven Concrete
Low-Priced New
High-Priced New
25 © 2018 American Automobile Association, Inc.
AAA All-Season Tire Testing
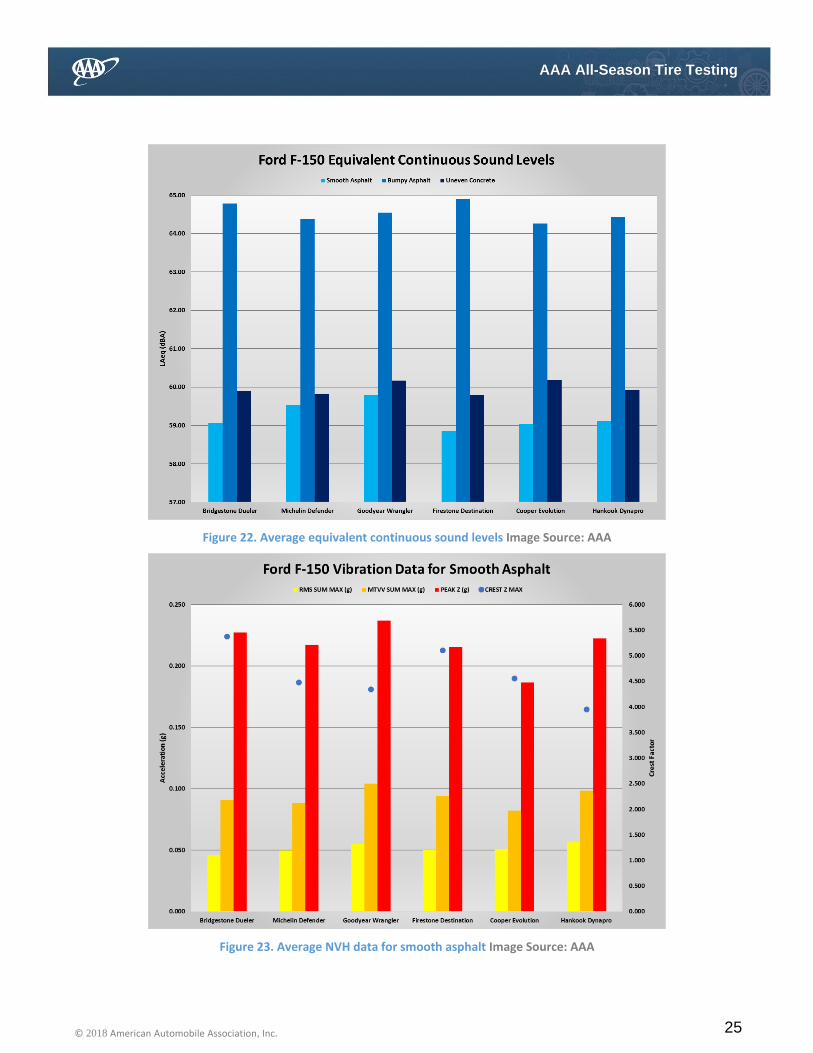
Figure 22. Average equivalent continuous sound levels Image Source: AAA
Figure 23. Average NVH data for smooth asphalt Image Source: AAA

26 © 2018 American Automobile Association, Inc.
AAA All-Season Tire Testing
Figure 24. Average NVH data for bumpy asphalt Image Source: AAA
Figure 25. Average NVH data for uneven concrete Image Source: AAA

27 © 2018 American Automobile Association, Inc.
AAA All-Season Tire Testing
None of the test drivers was able to discern subjective differences between test tires throughout the evaluation loop. While objective differences exist among test tires, this does not neatly translate into perceivable differences for drivers and passengers.
6.3.2 Wet Stopping Distance
Wet stopping distance measurements were conducted on all new and artificially worn test tires for each vehicle. At the beginning of the day, track personnel checked the water system for proper operation, measured water depths in various parts of the testing lane to determine the average water depth and burnished the surface by conducting multiple ABS stops in the testing lane. Once the testing lane was prepared by track personnel, AAA researchers conducted all track-testing activities.
Before test tires were measured, the stopping distance of a new set of OE reference tires was measured nine consecutive times; all measurements were averaged. After six test tires were run, the OE reference set was rerun six consecutive times and all six stopping distances were averaged. The average stopping distances before and after the test tires served as a reference to account for environmental variations that occurred throughout the day.
To ensure the brakes were applied in a consistent manner for all stops, including the reference stops, pedal force measurements were compared between all tires. The data acquisition system was configured to measure the brake pedal force (N) and the brake pedal force rate (N/s). The data acquisition rate for brake pedal force and brake pedal force rate was set at 2000 Hz.
To measure the stopping distance from 60-0 mph, the testing lane was entered at 65 mph. Full braking was applied at this speed to allow the braking system to reach a steady state before the target speed of 60 mph was reached. The data acquisition system was programmed to begin measuring the stopping distance once the instantaneous vehicle velocity reached 60 mph. To enhance data quality, stops were initiated within a consistent location; the lateral tolerance was ±4 in and the longitudinal tolerance was +6 ft (longitudinal tolerance was unilateral because stops must be initiated in an area of consistent water depth). Each test tire set underwent nine stops; each stop was averaged to determine the average stopping distance. The average time to stop (s) is also reported for each tire. To identify outlying runs for each test tire, the Shapiro-Wilk test was first used to determine normality of the stopping distance dataset. If the ρ-value from the Shapiro-Wilk test was greater than 0.05, the Extreme Studentized Deviate test was utilized to identify a maximum of two outliers per dataset. Any identified outliers were excluded from averaging.
The reference stopping distances were utilized to apply a linear correction factor to the stopping distance of each test tire. All stopping distances were corrected with respect to the reference measurement with the shorter stopping distance. Specifically, a portion of the difference between the reference set stopping distance at the beginning and end of the test tire runs was subtracted from the stopping distance of each test tire. The value subtracted from a specific test tire was linearly dependent on the time at which a test tire was run relative to the reference sets.

28 © 2018 American Automobile Association, Inc.
AAA All-Season Tire Testing
6.3.2.1 2017 Toyota Camry
Figure 26. Average new wet stopping distances Image Source: AAA
Figure 27. Average new wet stopping distances Image Source: AAA
Brake Distance (ft) Time to Stop (s)
Goodyear Eagle 223.39 4.748
Pirelli Cinturo 197.41 4.343
Michelin Premier 192.25 4.224
Average 204.35 4.438
Standard Deviation 13.63 0.224
Brake Distance (ft) Time to Stop (s)
Nexen CP671 204.90 4.387
Fuzion Touring 229.00 4.788
Kumho Ecsta 209.67 4.542
Average 214.53 4.572
Standard Deviation 10.42 0.165
Percentage Difference 4.86% 2.97%
High-Priced New
Low-Priced New

29 © 2018 American Automobile Association, Inc.
AAA All-Season Tire Testing
Figure 28. Average high-priced & low-priced new wet stopping distances Image Source: AAA
The average stopping distance for each category is shown in Figure 28. The difference between categories is 10.18 feet; this difference is not statistically significant at the 95 percent confidence level. Based on the tires randomly selected for testing, it cannot be said that there is a significant difference in wet stopping distance between high-priced and low-priced tires.

30 © 2018 American Automobile Association, Inc.
AAA All-Season Tire Testing
6.3.2.2 2017 Ford F-150
Figure 29. Average new wet stopping distances Image Source: AAA
Figure 30. Average new wet stopping distances Image Source: AAA
Brake Distance (ft) Time to Stop (s)
Bridgestone Dueler 199.29 4.336
Michelin Defender 182.35 4.151
Goodyear Wrangler 196.70 4.314
Average 192.78 4.267
Standard Deviation 7.45 0.082
Brake Distance (ft) Time to Stop (s)
Firestone Destination 194.31 4.261
Cooper Evolution 213.06 4.647
Hankook Dynapro 202.31 4.418
Average 203.22 4.442
Standard Deviation 7.68 0.158
Percentage Difference 5.27% 4.02%
High-Priced New
Low-Priced New

31 © 2018 American Automobile Association, Inc.
AAA All-Season Tire Testing
Figure 31. Average high-priced & low-priced new wet stopping distances Image Source: AAA
The average stopping distance for each category is shown in Figure 31. The difference between categories is 10.44 feet; this difference is not statistically significant at the 95 percent confidence level. Based on the tires randomly selected for testing, it cannot be said that there is a significant difference in wet stopping distance between high-priced and low-priced tires.
6.3.3 Wet Maximum Lateral Acceleration
Wet maximum lateral acceleration measurements were conducted on all new and artificially worn test tires for each vehicle. At the beginning of the day, track personnel checked the water system for proper operation. The skid pad was allowed to equilibrate for 30 minutes before testing to allow for a consistent water depth. Once the skid pad was prepared by track personnel, AAA researchers conducted all track-testing activities.
To determine the maximum lateral acceleration allowed by each tire, the vehicle was driven on the inner diameter of the skid pad at a gradually increasing speed until traction was lost; this was performed three times per tire. For each run, five seconds of steady-state lateral acceleration and vehicle speed preceding traction loss was averaged to determine the average maximum values. The average of the three runs is reported for each tire. Vehicle speed is reported because the lateral acceleration is dependent on this parameter by the following equation:
𝑎𝑛 =𝑣2
𝑟
𝑎𝑛 = magnitude of lateral acceleration

32 © 2018 American Automobile Association, Inc.
AAA All-Season Tire Testing
v = vehicle speed r = radius of rotation Traction loss on the Toyota Camry caused the vehicle to plow toward the outer diameter of the skid pad regardless of steering angle, otherwise known as understeer. Traction loss on the Ford F-150 resulted in either understeer or oversteer depending on throttle input.
Before test tires were measured, the average maximum lateral acceleration of OE reference tires was measured. After six test tires were run, the OE reference set was measured again. The average maximum lateral acceleration and vehicle speed before and after the test tires served as a reference to account for environmental variations that occurred throughout the day.
6.3.3.1 2017 Toyota Camry
Figure 32. Average maximum wet skid pad performance Image Source: AAA
Lateral Acceleration (g) Speed (mph)
Goodyear Eagle 0.51 54.5
Pirelli Cinturo 0.56 57.0
Michelin Premier 0.56 56.9
Average 0.54 56.2
Standard Deviation 0.02 1.2
Lateral Acceleration (g) Speed (mph)
Nexen CP671 0.52 55.4
Fuzion Touring 0.48 53.1
Kumho Ecsta 0.56 57.3
Average 0.52 55.3
Standard Deviation 0.03 1.7
Percentage Difference 3.77% 1.61%
Low-Priced New
High-Priced New
33 © 2018 American Automobile Association, Inc.
AAA All-Season Tire Testing
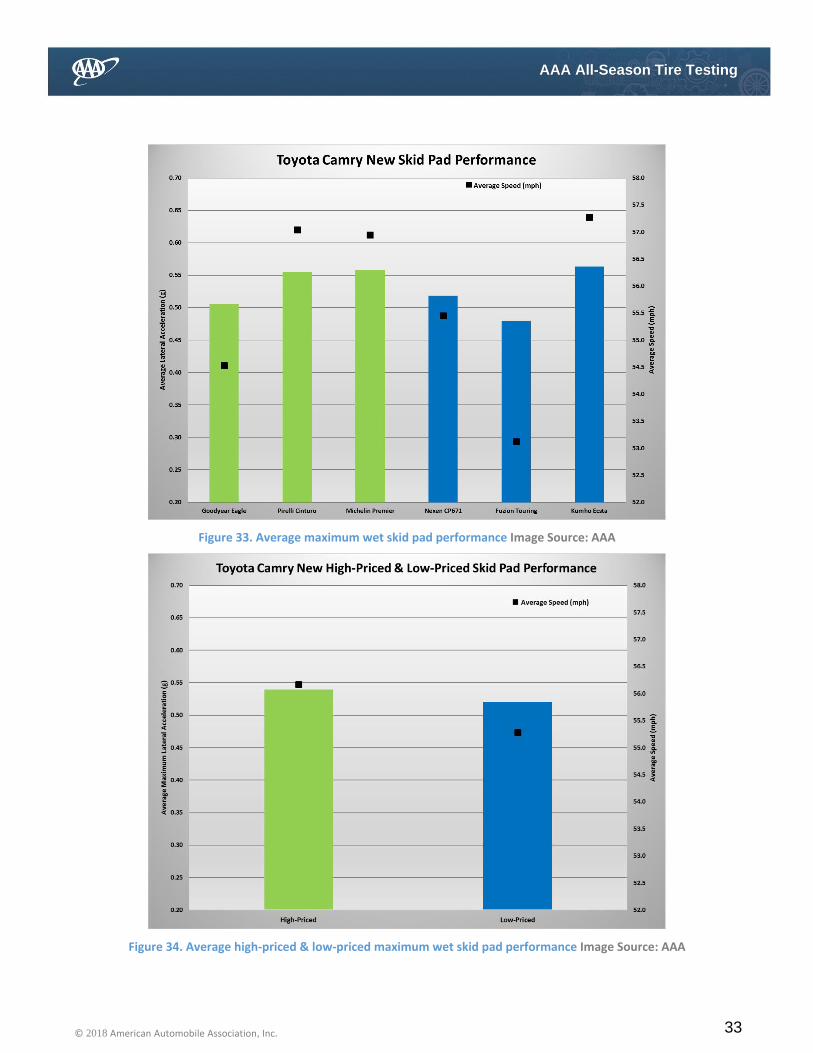
Figure 33. Average maximum wet skid pad performance Image Source: AAA
Figure 34. Average high-priced & low-priced maximum wet skid pad performance Image Source: AAA
34 © 2018 American Automobile Association, Inc.
AAA All-Season Tire Testing
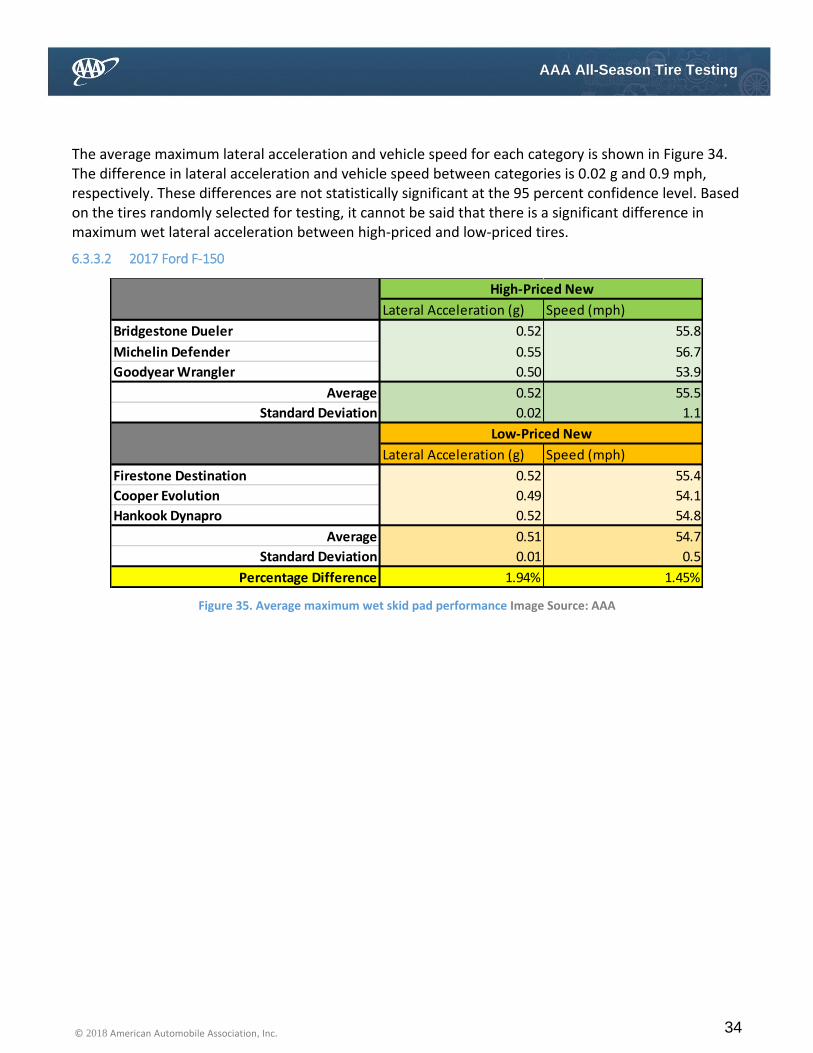
The average maximum lateral acceleration and vehicle speed for each category is shown in Figure 34. The difference in lateral acceleration and vehicle speed between categories is 0.02 g and 0.9 mph, respectively. These differences are not statistically significant at the 95 percent confidence level. Based on the tires randomly selected for testing, it cannot be said that there is a significant difference in maximum wet lateral acceleration between high-priced and low-priced tires.
6.3.3.2 2017 Ford F-150
Figure 35. Average maximum wet skid pad performance Image Source: AAA
Lateral Acceleration (g) Speed (mph)
Bridgestone Dueler 0.52 55.8
Michelin Defender 0.55 56.7
Goodyear Wrangler 0.50 53.9
Average 0.52 55.5
Standard Deviation 0.02 1.1
Lateral Acceleration (g) Speed (mph)
Firestone Destination 0.52 55.4
Cooper Evolution 0.49 54.1
Hankook Dynapro 0.52 54.8
Average 0.51 54.7
Standard Deviation 0.01 0.5
Percentage Difference 1.94% 1.45%
High-Priced New
Low-Priced New
35 © 2018 American Automobile Association, Inc.
AAA All-Season Tire Testing
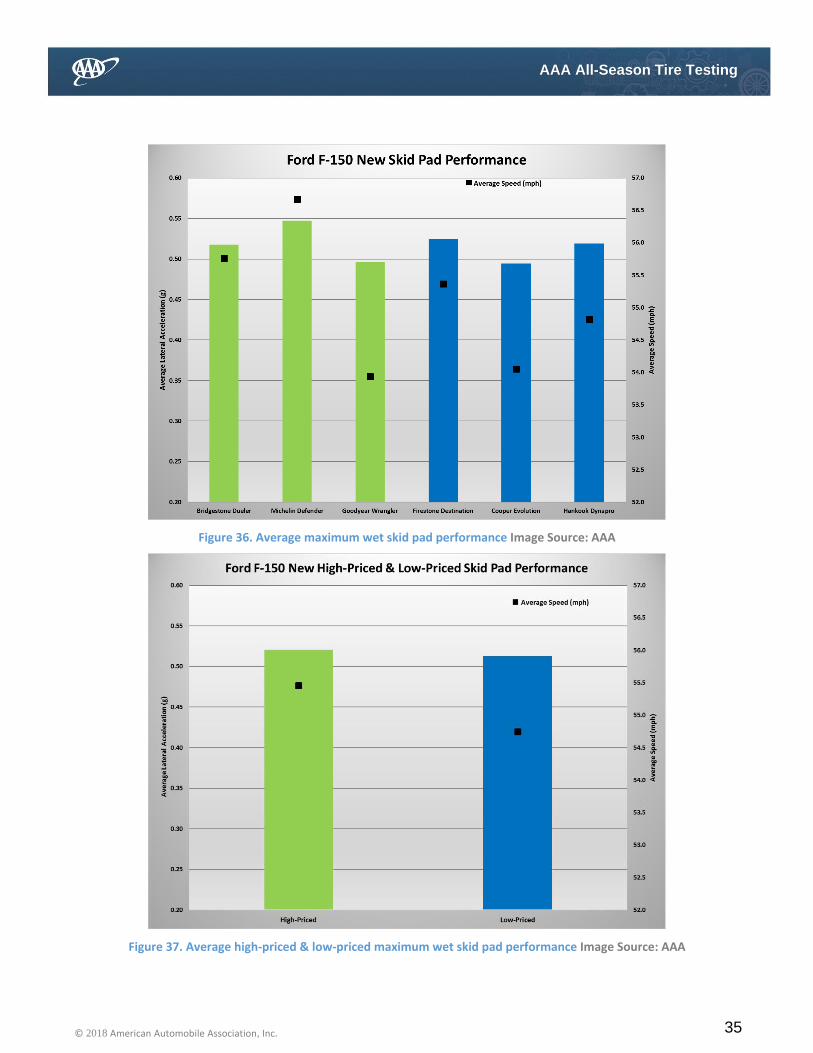
Figure 36. Average maximum wet skid pad performance Image Source: AAA
Figure 37. Average high-priced & low-priced maximum wet skid pad performance Image Source: AAA

36 © 2018 American Automobile Association, Inc.
AAA All-Season Tire Testing
The average maximum lateral acceleration and vehicle speed for each category is shown in Figure 37. The difference in lateral acceleration and vehicle speed between categories is 0.01 g and 0.8 mph, respectively. These differences are not statistically significant at the 95 percent confidence level. Based on the tires randomly selected for testing, it cannot be said that there is a significant difference in maximum wet lateral acceleration between high-priced and low-priced tires.
6.4 Summary of Findings
None of the selected tests revealed significant performance differences between high-priced and low-priced tires. It should be noted that this finding is solely based on tires randomly selected for testing. For both vehicles, many available tires were not evaluated as part of this work. Additionally, the reported results are specific to only the tire model referenced; these results are not representative of a manufacturer’s entire product line.
7 Inquiry #2: Are there differences in performance between new tires and tires artificially
worn to a tread depth of 4/32”?
7.1 Objective
Quantitatively measure performance differences between new tires and tires artificially worn to a tread depth of 4/32”.
7.2 Methodology
The majority of tire manufacturers recommend tire replacement when the tread depth reaches 3/32”. Additionally, most states that require periodic vehicle inspections mandate that tires be replaced when the tread reaches 2/32”. AAA has traditionally recommended that motorists replace their tires at a tread depth of 4/32”.
It is hypothesized that tires with a tread depth of 4/32” will exhibit significantly decreased wet handling and braking capabilities relative to new tires. If tires worn to 4/32” perform significantly worse than new tires, it is likely that tires with a tread depth lower than 4/32” pose a serious safety hazard to the motoring public.
To evaluate the performance of tires with a tread depth of 4/32”, an additional set of test tires was procured. All tires were artificially worn using Michelin North America, Inc. equipment, under the supervision of and/or close inspection by AAA researchers. The tread profile of all tires was precisely measured by a laser scanner and the profile data was then input into a specialized buffing machine that automatically buffed the tire surface with an abrasive disk that provides a surface finish representative of actual road-wear. The machine was manually operated for the final buffing stage. All tires were buffed to a uniform tread depth of 4/32” and prepared in a manner consistent with ASTM F-1046-01 [4]. This standard for preparing worn tires was utilized because it ensures all tires are worn in the same manner. This would not be possible with actual road-wear.
37 © 2018 American Automobile Association, Inc.
AAA All-Season Tire Testing
Naturalistic aging effects could adversely influence the wet performance of tires. These effects would be in addition to performance deteriorations caused by reduced tread depth. Therefore, the results reported here represent a best-case scenario for the performance of worn tires.
All wet performance tests were repeated on artificially worn tires. NVH characterization was not performed because artificial wear could fail to account for tread mushrooming/pounding and block stiffening caused by naturalistic aging. These naturalistic effects could adversely influence NVH characteristics and would not be seen with artificially worn tires.
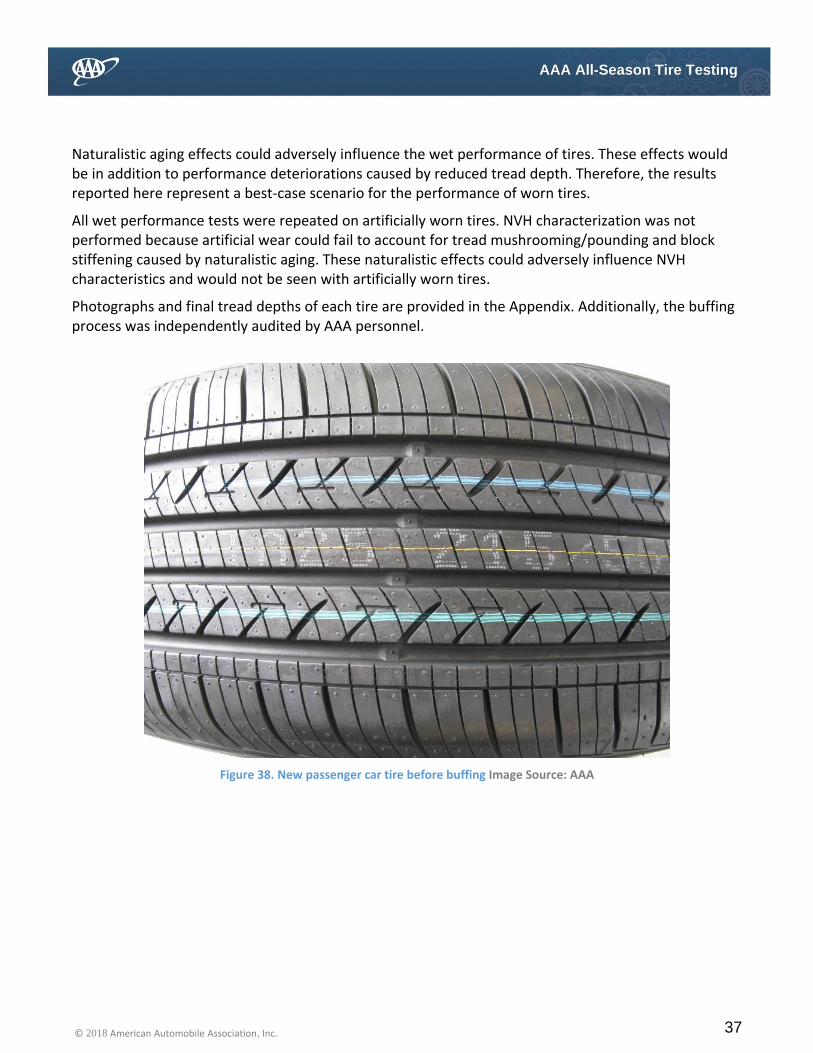
Photographs and final tread depths of each tire are provided in the Appendix. Additionally, the buffing process was independently audited by AAA personnel.
Figure 38. New passenger car tire before buffing Image Source: AAA
38 © 2018 American Automobile Association, Inc.
AAA All-Season Tire Testing
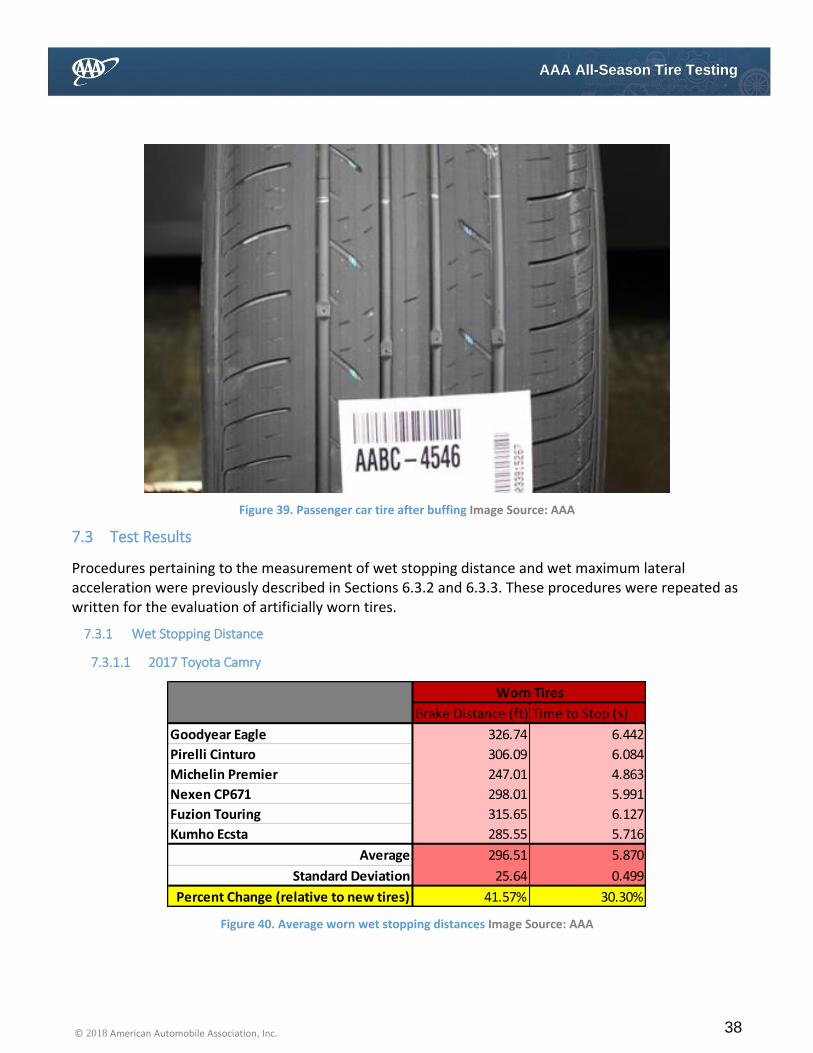
Figure 39. Passenger car tire after buffing Image Source: AAA
7.3 Test Results
Procedures pertaining to the measurement of wet stopping distance and wet maximum lateral acceleration were previously described in Sections 6.3.2 and 6.3.3. These procedures were repeated as written for the evaluation of artificially worn tires.
7.3.1 Wet Stopping Distance
7.3.1.1 2017 Toyota Camry
Figure 40. Average worn wet stopping distances Image Source: AAA
Brake Distance (ft) Time to Stop (s)
Goodyear Eagle 326.74 6.442
Pirelli Cinturo 306.09 6.084
Michelin Premier 247.01 4.863
Nexen CP671 298.01 5.991
Fuzion Touring 315.65 6.127
Kumho Ecsta 285.55 5.716
Average 296.51 5.870
Standard Deviation 25.64 0.499
Percent Change (relative to new tires) 41.57% 30.30%
Worn Tires
39 © 2018 American Automobile Association, Inc.
AAA All-Season Tire Testing
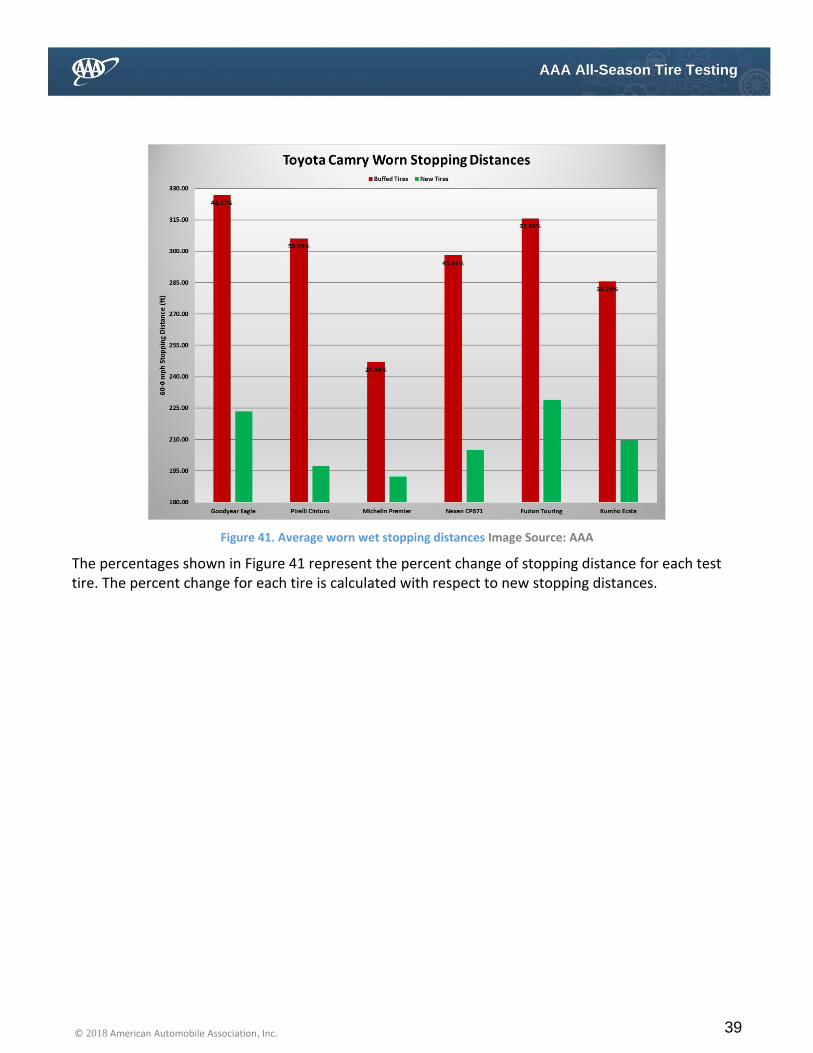
Figure 41. Average worn wet stopping distances Image Source: AAA
The percentages shown in Figure 41 represent the percent change of stopping distance for each test tire. The percent change for each tire is calculated with respect to new stopping distances.
40 © 2018 American Automobile Association, Inc.
AAA All-Season Tire Testing
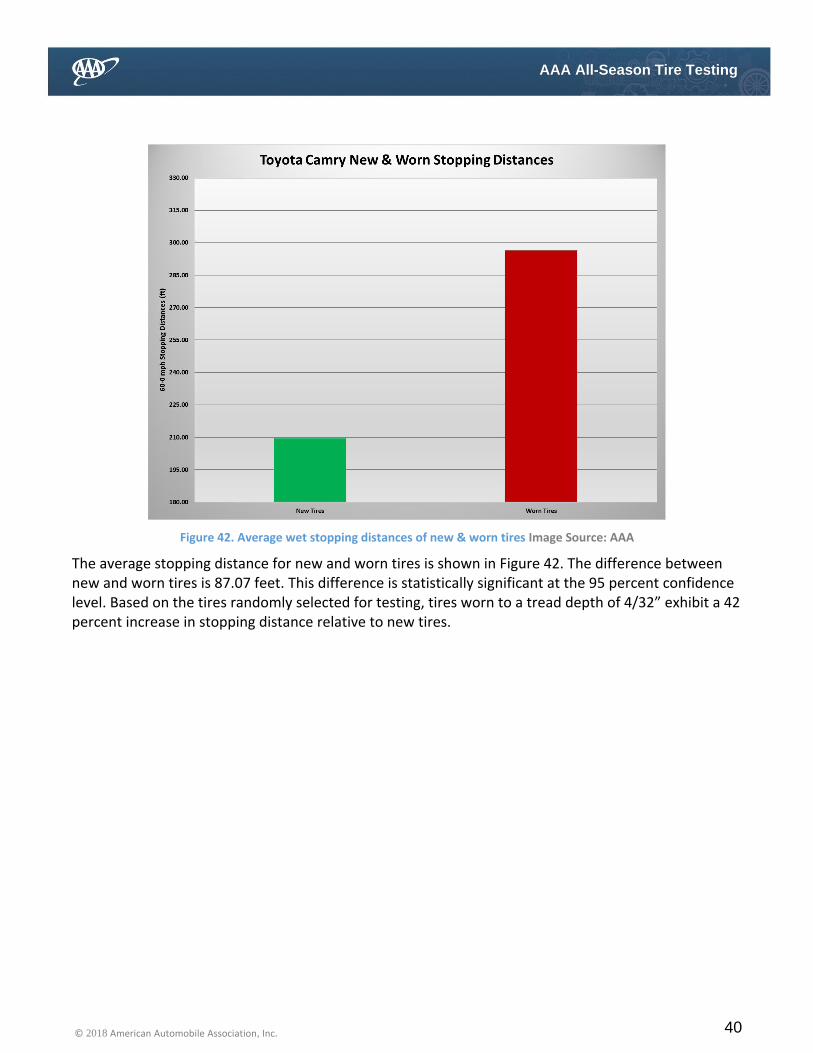
Figure 42. Average wet stopping distances of new & worn tires Image Source: AAA
The average stopping distance for new and worn tires is shown in Figure 42. The difference between new and worn tires is 87.07 feet. This difference is statistically significant at the 95 percent confidence level. Based on the tires randomly selected for testing, tires worn to a tread depth of 4/32” exhibit a 42 percent increase in stopping distance relative to new tires.
41 © 2018 American Automobile Association, Inc.
AAA All-Season Tire Testing
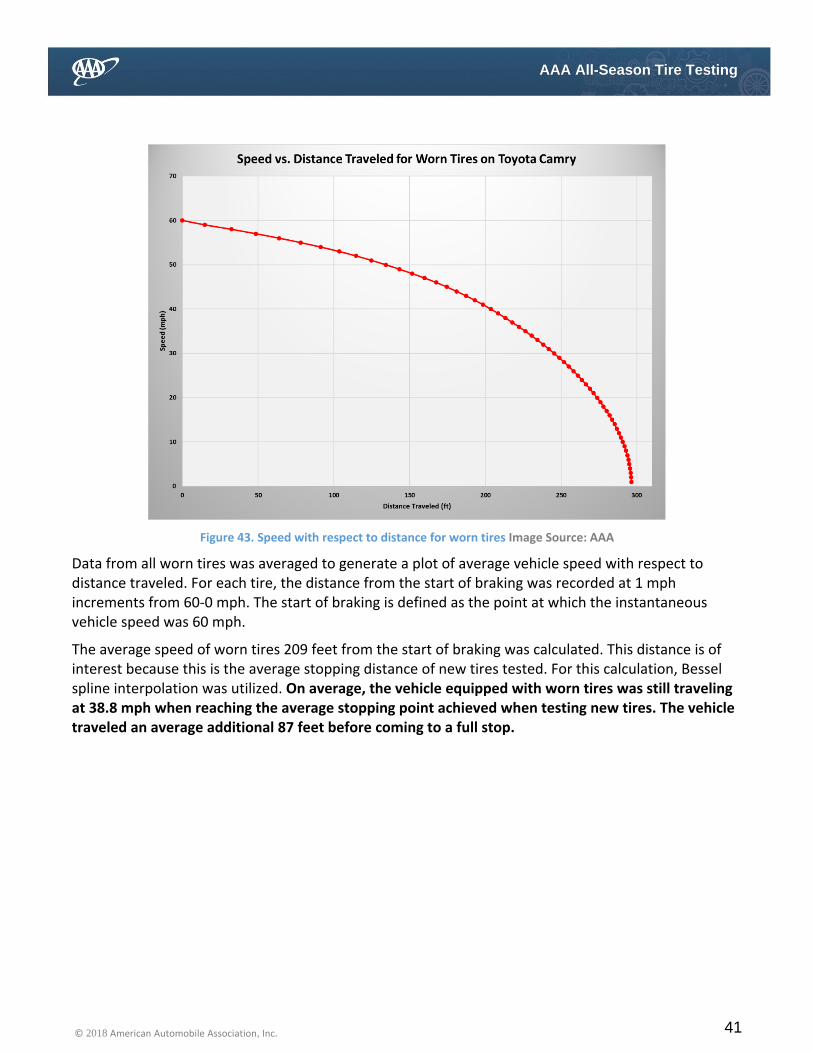
Figure 43. Speed with respect to distance for worn tires Image Source: AAA
Data from all worn tires was averaged to generate a plot of average vehicle speed with respect to distance traveled. For each tire, the distance from the start of braking was recorded at 1 mph increments from 60-0 mph. The start of braking is defined as the point at which the instantaneous vehicle speed was 60 mph.
The average speed of worn tires 209 feet from the start of braking was calculated. This distance is of interest because this is the average stopping distance of new tires tested. For this calculation, Bessel spline interpolation was utilized. On average, the vehicle equipped with worn tires was still traveling at 38.8 mph when reaching the average stopping point achieved when testing new tires. The vehicle traveled an average additional 87 feet before coming to a full stop.
42 © 2018 American Automobile Association, Inc.
AAA All-Season Tire Testing
7.3.1.2 2017 Ford F-150
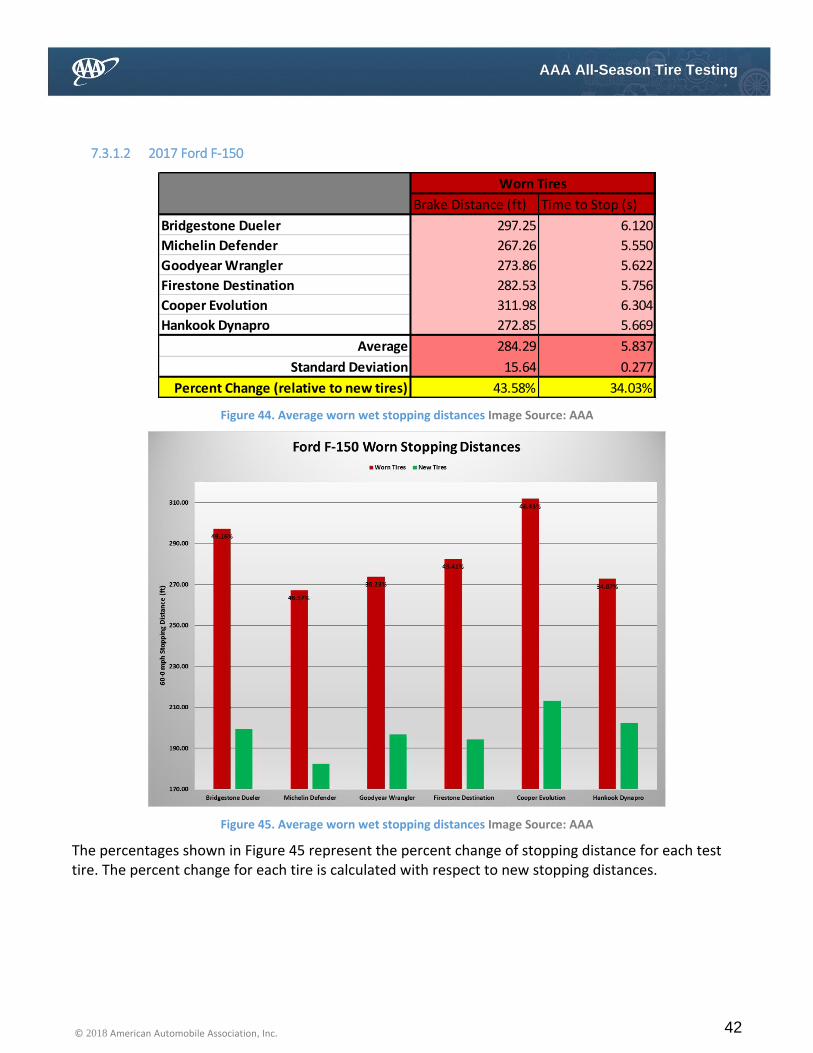
Figure 44. Average worn wet stopping distances Image Source: AAA
Figure 45. Average worn wet stopping distances Image Source: AAA
The percentages shown in Figure 45 represent the percent change of stopping distance for each test tire. The percent change for each tire is calculated with respect to new stopping distances.
Brake Distance (ft) Time to Stop (s)
Bridgestone Dueler 297.25 6.120
Michelin Defender 267.26 5.550
Goodyear Wrangler 273.86 5.622
Firestone Destination 282.53 5.756
Cooper Evolution 311.98 6.304
Hankook Dynapro 272.85 5.669
Average 284.29 5.837
Standard Deviation 15.64 0.277
Percent Change (relative to new tires) 43.58% 34.03%
Worn Tires

43 © 2018 American Automobile Association, Inc.
AAA All-Season Tire Testing
Figure 46. Average wet stopping distances of new & worn tires Image Source: AAA
The average stopping distance for new and worn tires is shown in Figure 46. The difference between new and worn tires is 86.29 feet; this difference is statistically significant at the 95 percent confidence level. Based on the tires randomly selected for testing, tires worn to a tread depth of 4/32” exhibit a 44 percent increase in stopping distance relative to new tires.
44 © 2018 American Automobile Association, Inc.
AAA All-Season Tire Testing
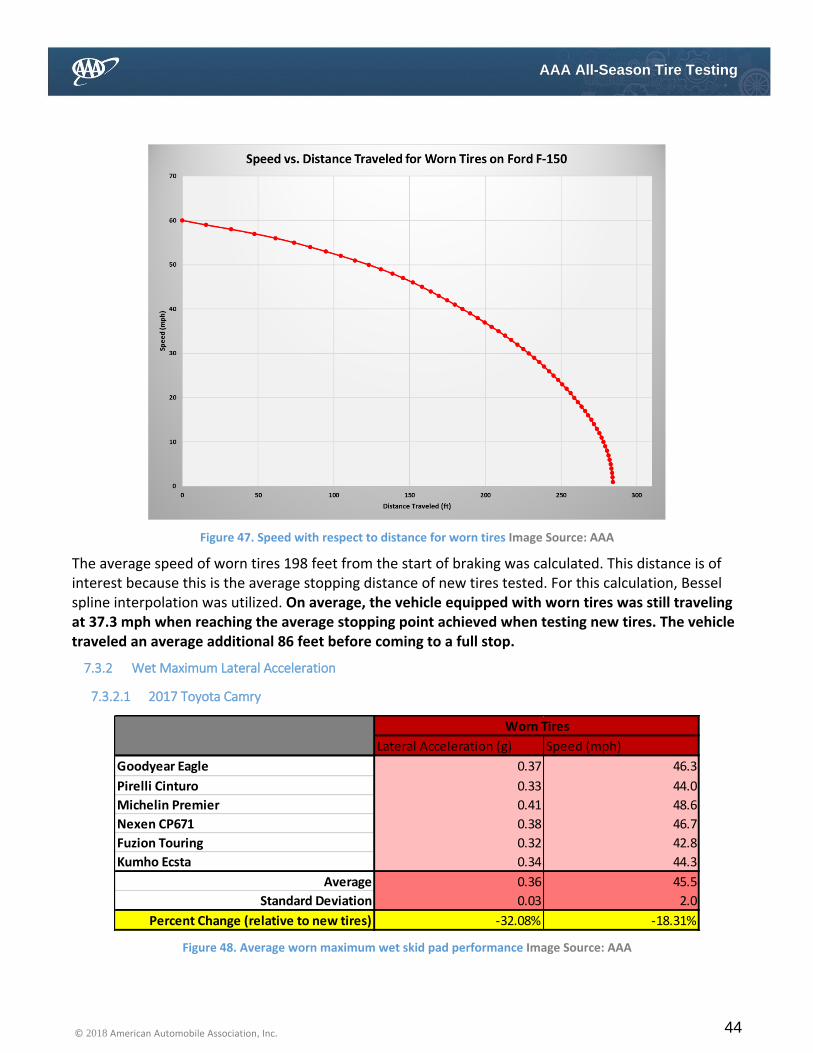
Figure 47. Speed with respect to distance for worn tires Image Source: AAA
The average speed of worn tires 198 feet from the start of braking was calculated. This distance is of interest because this is the average stopping distance of new tires tested. For this calculation, Bessel spline interpolation was utilized. On average, the vehicle equipped with worn tires was still traveling at 37.3 mph when reaching the average stopping point achieved when testing new tires. The vehicle traveled an average additional 86 feet before coming to a full stop.
7.3.2 Wet Maximum Lateral Acceleration
7.3.2.1 2017 Toyota Camry
Figure 48. Average worn maximum wet skid pad performance Image Source: AAA
Lateral Acceleration (g) Speed (mph)
Goodyear Eagle 0.37 46.3
Pirelli Cinturo 0.33 44.0
Michelin Premier 0.41 48.6
Nexen CP671 0.38 46.7
Fuzion Touring 0.32 42.8
Kumho Ecsta 0.34 44.3
Average 0.36 45.5
Standard Deviation 0.03 2.0
Percent Change (relative to new tires) -32.08% -18.31%
Worn Tires
45 © 2018 American Automobile Association, Inc.
AAA All-Season Tire Testing
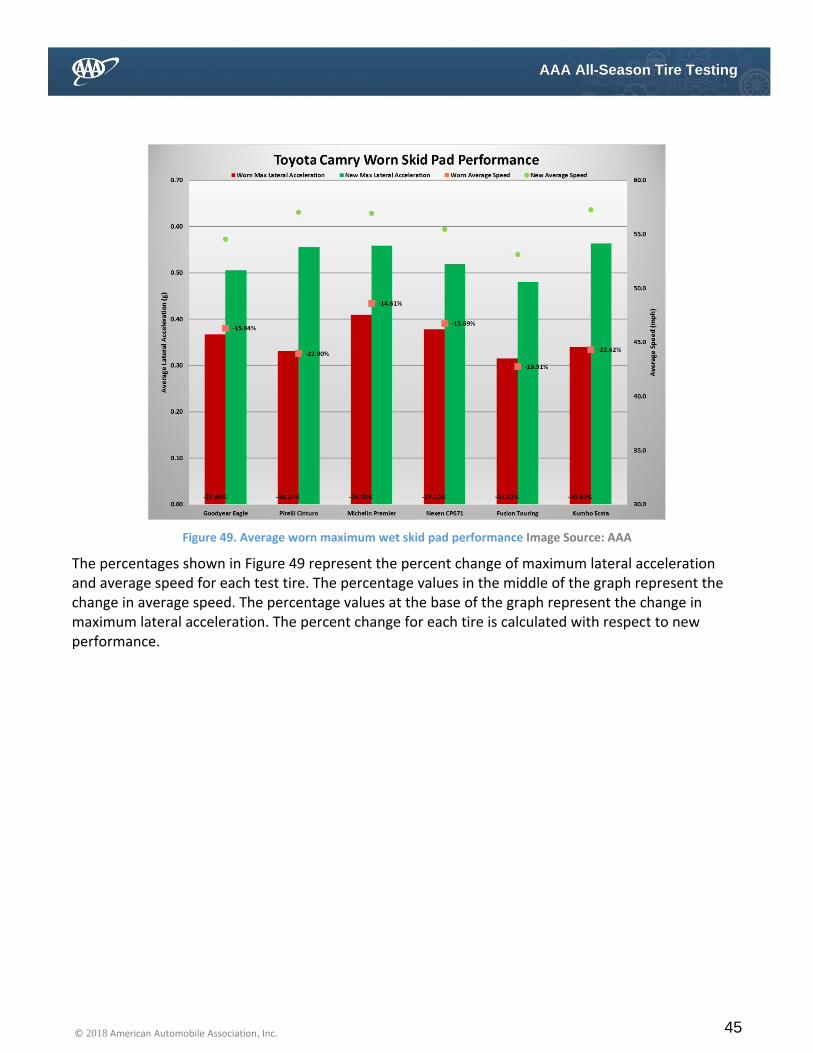
Figure 49. Average worn maximum wet skid pad performance Image Source: AAA
The percentages shown in Figure 49 represent the percent change of maximum lateral acceleration and average speed for each test tire. The percentage values in the middle of the graph represent the change in average speed. The percentage values at the base of the graph represent the change in maximum lateral acceleration. The percent change for each tire is calculated with respect to new performance.

46 © 2018 American Automobile Association, Inc.
AAA All-Season Tire Testing
Figure 50. Average wet maximum skid pad performance of new and worn tires Image Source: AAA
The average maximum lateral acceleration and vehicle speed for new and worn tires is shown in Figure 50. The difference in lateral acceleration and vehicle speed between new and worn tires is 0.17 g and 10.2 mph, respectively. These differences are statistically significant at the 95 percent confidence level. Based on the tires randomly selected for testing, tires worn to a tread depth of 4/32” cause a 33 percent decrease of lateral acceleration and 19 percent decrease of vehicle speed relative to new tires.
7.3.2.2 2017 Ford F-150
Figure 51. Average worn maximum wet skid pad performance Image Source: AAA
Lateral Acceleration (g) Speed (mph)
Bridgestone Dueler 0.37 46.8
Michelin Defender 0.41 49.4
Goodyear Wrangler 0.35 45.7
Firestone Destination 0.37 46.7
Cooper Evolution 0.34 44.4
Hankook Dynapro 0.37 46.9
Average 0.37 46.7
Standard Deviation 0.02 1.5
Percent Change (relative to new tires) -28.85% -15.25%
Worn Tires
47 © 2018 American Automobile Association, Inc.
AAA All-Season Tire Testing
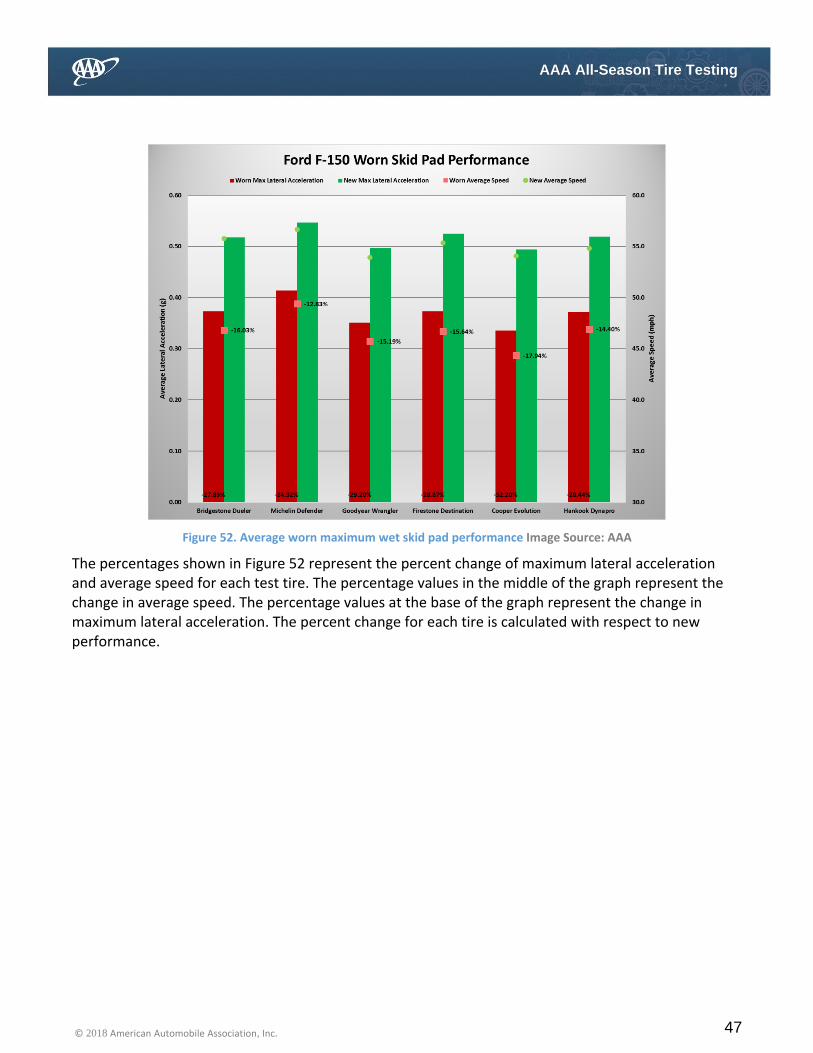
Figure 52. Average worn maximum wet skid pad performance Image Source: AAA
The percentages shown in Figure 52 represent the percent change of maximum lateral acceleration and average speed for each test tire. The percentage values in the middle of the graph represent the change in average speed. The percentage values at the base of the graph represent the change in maximum lateral acceleration. The percent change for each tire is calculated with respect to new performance.
48 © 2018 American Automobile Association, Inc.
AAA All-Season Tire Testing
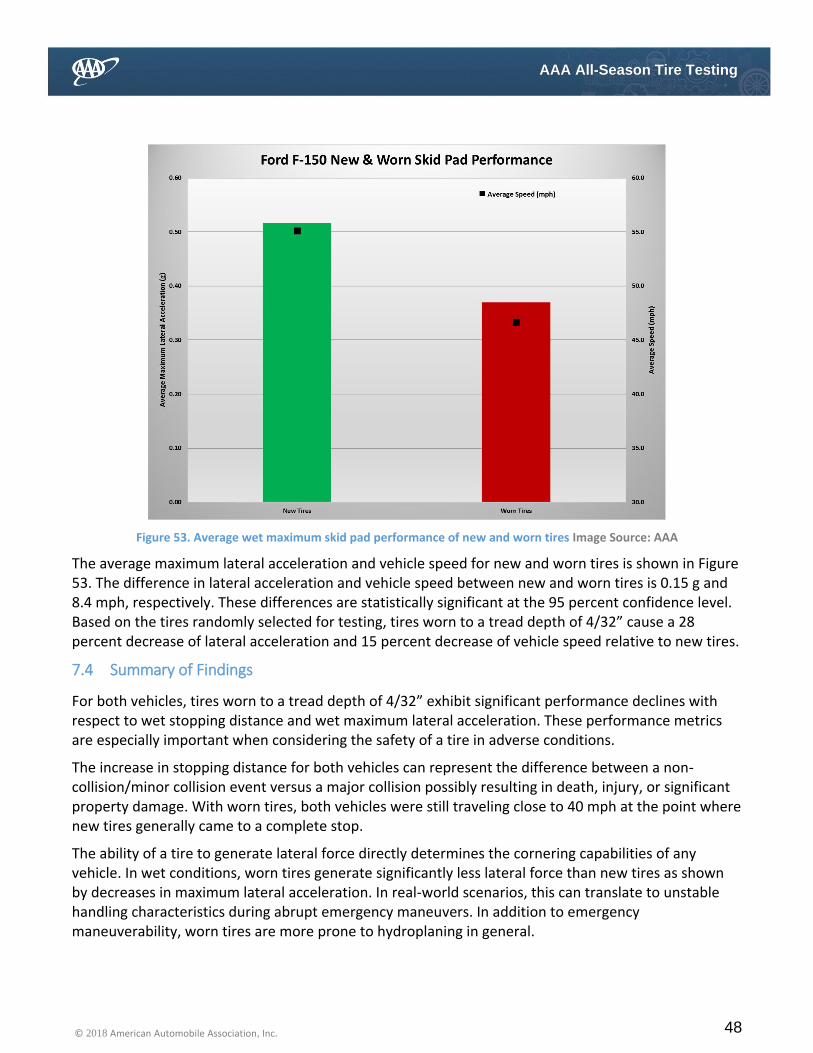
Figure 53. Average wet maximum skid pad performance of new and worn tires Image Source: AAA
The average maximum lateral acceleration and vehicle speed for new and worn tires is shown in Figure 53. The difference in lateral acceleration and vehicle speed between new and worn tires is 0.15 g and 8.4 mph, respectively. These differences are statistically significant at the 95 percent confidence level. Based on the tires randomly selected for testing, tires worn to a tread depth of 4/32” cause a 28 percent decrease of lateral acceleration and 15 percent decrease of vehicle speed relative to new tires.
7.4 Summary of Findings
For both vehicles, tires worn to a tread depth of 4/32” exhibit significant performance declines with respect to wet stopping distance and wet maximum lateral acceleration. These performance metrics are especially important when considering the safety of a tire in adverse conditions.
The increase in stopping distance for both vehicles can represent the difference between a non-collision/minor collision event versus a major collision possibly resulting in death, injury, or significant property damage. With worn tires, both vehicles were still traveling close to 40 mph at the point where new tires generally came to a complete stop.
The ability of a tire to generate lateral force directly determines the cornering capabilities of any vehicle. In wet conditions, worn tires generate significantly less lateral force than new tires as shown by decreases in maximum lateral acceleration. In real-world scenarios, this can translate to unstable handling characteristics during abrupt emergency maneuvers. In addition to emergency maneuverability, worn tires are more prone to hydroplaning in general.
49 © 2018 American Automobile Association, Inc.
AAA All-Season Tire Testing
All tests were performed on tires artificially worn to a tread depth of 4/32”. This tread depth is conservative in comparison to most recommendations for tire replacement and mandated replacement by states that require periodic vehicle inspections. Additionally, the results reported herein are representative of a best-case scenario due to a lack of additional aging effects caused by naturalistic driving.
8 Inquiry #3: What is the cost increase associated with switching to a high-priced all-
season tire?
8.1 Objective
Evaluate the average cost difference between all-season high-priced & low-priced tires for the 2017 Toyota Camry and 2017 Ford F-150.
8.2 Methodology
The price differences described in Section 8.3 are specific to the standard tire size on the most popular trim level of the 2017 Toyota Camry (215/55R17) and the 2017 Ford F-150 (P265/70R17). In addition to the Toyota Camry and Ford F-150, these tire sizes are widely used among many cars and light trucks/SUVs.
The cost of tire procurement for this study was used to quantify the average price difference between all-season high-priced and low-priced tires.
8.3 Findings
For each vehicle, prospective all-season tires were priced at a minimum of two major national retailers and averaged for each tire. If a specific tire model was not available at a minimum of two major national retailers, it was not eligible for further consideration. For the purpose of this work, high-priced and low-priced tires are defined as having an average price within the top and bottom 35th price percentile of all eligible tires, respectively. All eligible tires were included within price calculations, regardless of speed or load rating.
For each vehicle, the average price of each category was calculated. The average price of a high-priced and low-priced tire was compared to determine the average price difference between categories.
8.3.1 2017 Toyota Camry
The average price of a high-priced and low-priced tire is $152.60 and $90.72, respectively. For 215/55R17 tires, this represents an average price difference of $61.88 per tire for a total price difference of $247.52 for a set of four tires.
8.3.2 2017 Ford F-150
The average price of a high-priced and low-priced tire is $183.35 and $132.40, respectively. For P265/70R17 tires, this represents an average price difference of $50.95 per tire for a total price difference of $203.80 for a set of four tires.

50 © 2018 American Automobile Association, Inc.
AAA All-Season Tire Testing
9 Key Findings
1. On average, new high-priced tires did not perform significantly better than new low-priced tires in terms of stopping distance on a wet road surface, maximum lateral acceleration on a wet road surface and NVH characteristics.
2. Compared to new tires, tires worn to a tread depth of 4/32” exhibit: a. An increased stopping distance of 42 percent for the Toyota Camry and 44 percent
for the Ford F-150. When decelerating from 60 mph, worn tires are still traveling at 39 mph and 37 mph at the average stopping point of new tires for the Toyota Camry and F-150, respectively.
b. A decreased maximum lateral acceleration on a wet road surface of 33 percent for the Toyota Camry and 28 percent for the Ford F-150.
3. The average price difference between a set of four high-priced tires cost, on average, $247.52 more for the Toyota Camry and $203.80 for the Ford F-150.
10 Summary Recommendations
1. When shopping for replacement tires, it is important to remember that the price of a tire does not necessarily indicate quality.
2. Researching prospective tire models through consumer reviews may yield useful information. Ratings on the sidewall of the tire do not tell the whole story about overall performance.
3. In contrast to most state laws that mandate tire replacement when tread depth reaches 2/32”, AAA recommends that consumers begin shopping for replacement tires when tread depth reaches 4/32”.
11 Bibliography
[1] B. E. Lindemuth, "An Overview of Tire Technology," in The Pneumatic Tire, U.S Department of
Transportation, 2006.
[2] D. Beach and J. Schroeder, An Overview of Tire Technology, Rubber World, 2000.
[3] B. Lindemuth, "An Overview of Tire Technology," in The Pneumatic Tire, U.S Department of Transportation,
2006, pp. 6-10.
[4] ASTM International, Standard Guide for Preparing Artifically Worn Passenger and Light Truck Tires for
Testing, F1046 - 01 ed.
[5] A. G. Veith, "Tires-Roads-Rainfall-Vehicles: The Traction Connection," in Frictional Interaction of Tire and
Pavement, ASTM STP 793, 1983, pp. 3-40.
51 © 2018 American Automobile Association, Inc.
AAA All-Season Tire Testing
[6] A. G. Veith, in The Physics of Tire Traction, New York-London, Plenum Press, 1974, pp. 5-19.
[7] B. E. Sabey, T. Williams and G. N. Lupton, "Paper 70036, Joint Meeting, SAE-FISITA," Society of Automotive
Engineers, 1970.
[8] H. Williams, Tire Science and Technology, vol. 3, 1975.
[9] W. Liedl and E. Kohler, "Tire Rolling Noise in Dry and Wet Conditions on Pavement Surfaces of Different
Skid Resistance," in Frictional Interaction of Tire and Pavement, American Society for Testing and
Materials, 1983, pp. 232-249.
[10] SAE International, Light Vehicle Dry Stopping Distance, J2909 2010-05, p. 6.

52 © 2018 American Automobile Association, Inc.
AAA All-Season Tire Testing
12 Appendices
Figure 54. NVH parameters for the 2017 Toyota Camry Image Source: AAA
Goodyear Eagle Pirelli Cinturato Michelin Premier Nexen Classe Fuzion Touring Kumho Ecsta
LAeq (dBA) 68.31 67.66 67.62 68.92 67.68 67.80
RMS SUM MAX (g) 0.055 0.062 0.047 0.047 0.080 0.063
MTVV SUM MAX (g) 0.097 0.123 0.084 0.079 0.157 0.115
PEAK Z (g) 0.248 0.511 0.279 0.216 0.385 0.474
CREST Z MAX 5.508 8.150 6.427 4.936 6.586 7.491
LAeq (dBA) 66.58 65.77 65.68 64.94 65.67 66.96
RMS SUM MAX (g) 0.041 0.051 0.052 0.052 0.049 0.052
MTVV SUM MAX (g) 0.069 0.096 0.096 0.094 0.092 0.097
PEAK Z (g) 0.154 0.268 0.259 0.249 0.239 0.264
CREST Z MAX 4.991 5.228 5.081 5.170 5.715 5.071
LAeq (dBA) 70.64 67.42 67.90 66.14 66.69 67.05
RMS SUM MAX (g) 0.066 0.037 0.035 0.034 0.035 0.034
MTVV SUM MAX (g) 0.102 0.054 0.055 0.060 0.050 0.051
PEAK Z (g) 0.322 0.157 0.139 0.150 0.155 0.155
CREST Z MAX 4.908 5.390 5.034 5.042 4.891 4.983
LAeq (dBA) 71.06 72.14 72.34 72.03 72.44 72.78
RMS SUM MAX (g) 0.083 0.052 0.050 0.061 0.050 0.053
MTVV SUM MAX (g) 0.129 0.073 0.073 0.088 0.070 0.074
PEAK Z (g) 0.382 0.236 0.244 0.257 0.199 0.247
CREST Z MAX 4.908 5.145 5.177 5.149 4.151 4.667
LAeq (dBA) 73.88 68.90 69.10 67.68 69.23 69.22
RMS SUM MAX (g) 0.083 0.070 0.086 0.093 0.083 0.092
MTVV SUM MAX (g) 0.129 0.114 0.120 0.121 0.116 0.124
PEAK Z (g) 0.381 0.332 0.370 0.377 0.354 0.392
CREST Z MAX 4.577 4.726 4.823 4.569 4.324 4.762
LAeq (dBA) 71.98 71.36 71.55 72.21 73.04 71.44
RMS SUM MAX (g) 0.118 0.083 0.086 0.086 0.084 0.092
MTVV SUM MAX (g) 0.161 0.118 0.121 0.119 0.120 0.127
PEAK Z (g) 0.468 0.357 0.373 0.356 0.364 0.396
CREST Z MAX 5.403 4.726 4.337 4.705 5.044 4.823
LAeq (dBA) 73.40 70.17 70.63 70.26 70.79 70.79
RMS SUM MAX (g) 0.170 0.099 0.111 0.113 0.108 0.117
MTVV SUM MAX (g) 0.303 0.132 0.148 0.143 0.143 0.158
PEAK Z (g) 0.887 0.358 0.405 0.419 0.401 0.440
CREST Z MAX 6.491 4.344 4.236 4.097 4.258 4.245
LAeq (dBA) 70.17 71.86 72.22 72.35 72.79 71.88
RMS SUM MAX (g) 0.170 0.153 0.155 0.153 0.151 0.157
MTVV SUM MAX (g) 0.303 0.284 0.297 0.286 0.293 0.302
PEAK Z (g) 0.725 0.785 0.849 0.850 0.855 0.866
CREST Z MAX 5.138 6.286 5.876 6.673 6.354 6.362
LAeq (dBA) 67.85 71.03 67.70 69.71 68.66 67.70
RMS SUM MAX (g) 0.103 0.099 0.107 0.106 0.101 0.114
MTVV SUM MAX (g) 0.132 0.126 0.134 0.130 0.127 0.140
PEAK Z (g) 0.433 0.480 0.533 0.488 0.491 0.482
CREST Z MAX 4.392 4.989 5.309 4.938 5.243 4.525
LAeq (dBA) 64.23 66.64 66.97 66.91 68.76 67.21
RMS SUM MAX (g) 0.039 0.073 0.077 0.076 0.075 0.078
MTVV SUM MAX (g) 0.059 0.098 0.099 0.099 0.101 0.103
PEAK Z (g) 0.169 0.302 0.306 0.278 0.286 0.312
CREST Z MAX 4.053 4.798 4.672 3.811 4.517 4.466
LAeq (dBA) 62.92 65.47 65.40 64.93 65.77 65.50
RMS SUM MAX (g) 0.024 0.055 0.059 0.058 0.058 0.062
MTVV SUM MAX (g) 0.032 0.083 0.098 0.083 0.085 0.101
PEAK Z (g) 0.086 0.279 0.258 0.239 0.245 0.274
CREST Z MAX 3.591 5.377 4.624 4.272 4.511 4.473
LAeq (dBA) 66.48 62.66 62.82 59.96 62.97 62.90
RMS SUM MAX (g) 0.027 0.030 0.032 0.028 0.034 0.039
MTVV SUM MAX (g) 0.034 0.053 0.054 0.040 0.052 0.059
PEAK Z (g) 0.099 0.132 0.133 0.097 0.134 0.145
CREST Z MAX 3.989 4.480 4.175 3.453 4.079 3.758
Section 12 SMOOTH
CONCRETE
Section 11 SPALLED
CONCRETE
Section 10 UNEVEN
CONCRETE
Section 9 BUMPY
CONCRETE
Section 8 BROKEN
CONCRETE
Section 7 BUMPY
ASPHALT
Section 6
SIMULATED
SHALLOW POTHOLES
Section 5 ROUGH
ASPHALT
Section 4 COURSE
ASPHALT
Section 3 BROKEN IN
ASPHALT
Section 2 SMOOTH
ASPHALT
Section 1
WORN/PATCHED
ASPHALT

53 © 2018 American Automobile Association, Inc.
AAA All-Season Tire Testing
Figure 55. NVH parameters for the 2017 Ford F-150 Image Source: AAA
Bridgestone Dueler Michelin Defender Goodyear Wrangler Firestone Destination Cooper Evolution Hankook Dynapro
LAeq (dBA) 61.33 63.34 61.35 61.79 61.81 63.23
RMS SUM MAX (g) 0.187 0.087 0.132 0.059 0.143 0.122
MTVV SUM MAX (g) 0.396 0.157 0.274 0.109 0.314 0.245
PEAK Z (g) 0.725 0.322 0.659 0.272 0.441 0.291
CREST Z MAX 6.869 6.561 7.738 4.943 9.281 6.033
LAeq (dBA) 59.07 59.52 59.80 58.85 59.04 59.11
RMS SUM MAX (g) 0.046 0.050 0.055 0.050 0.051 0.056
MTVV SUM MAX (g) 0.091 0.089 0.104 0.094 0.082 0.099
PEAK Z (g) 0.227 0.217 0.237 0.215 0.187 0.222
CREST Z MAX 5.374 4.476 4.343 5.105 4.557 3.954
LAeq (dBA) 59.92 61.82 59.81 59.37 63.16 60.70
RMS SUM MAX (g) 0.066 0.037 0.035 0.034 0.035 0.034
MTVV SUM MAX (g) 0.102 0.054 0.055 0.060 0.050 0.051
PEAK Z (g) 0.322 0.157 0.139 0.150 0.155 0.155
CREST Z MAX 4.908 5.390 5.034 5.042 4.891 4.983
LAeq (dBA) 63.70 63.28 63.39 63.24 63.38 65.52
RMS SUM MAX (g) 0.048 0.046 0.048 0.043 0.044 0.044
MTVV SUM MAX (g) 0.067 0.072 0.067 0.065 0.067 0.069
PEAK Z (g) 0.168 0.195 0.178 0.169 0.183 0.155
CREST Z MAX 3.703 4.266 4.399 4.143 4.197 3.757
LAeq (dBA) 62.35 61.79 61.87 62.14 62.14 61.70
RMS SUM MAX (g) 0.048 0.057 0.064 0.056 0.061 0.061
MTVV SUM MAX (g) 0.070 0.085 0.095 0.080 0.088 0.094
PEAK Z (g) 0.192 0.228 0.244 0.219 0.266 0.261
CREST Z MAX 4.769 4.604 3.957 4.408 4.420 4.324
LAeq (dBA) 64.26 64.01 63.96 64.48 65.52 63.64
RMS SUM MAX (g) 0.070 0.066 0.067 0.067 0.065 0.068
MTVV SUM MAX (g) 0.092 0.092 0.095 0.083 0.089 0.097
PEAK Z (g) 0.256 0.253 0.290 0.225 0.267 0.261
CREST Z MAX 4.769 4.635 4.563 4.693 4.602 4.403
LAeq (dBA) 64.78 64.35 64.57 64.90 64.26 64.43
RMS SUM MAX (g) 0.066 0.065 0.066 0.066 0.062 0.067
MTVV SUM MAX (g) 0.085 0.080 0.091 0.084 0.081 0.085
PEAK Z (g) 0.198 0.198 0.258 0.202 0.208 0.214
CREST Z MAX 3.795 3.730 4.472 4.057 3.897 3.789
LAeq (dBA) 64.89 62.99 64.48 65.51 65.08 64.53
RMS SUM MAX (g) 0.093 0.089 0.099 0.094 0.096 0.096
MTVV SUM MAX (g) 0.156 0.156 0.158 0.167 0.155 0.158
PEAK Z (g) 0.429 0.514 0.511 0.440 0.480 0.485
CREST Z MAX 4.686 5.798 5.744 5.370 5.508 5.605
LAeq (dBA) 61.43 62.40 61.27 61.59 66.71 60.96
RMS SUM MAX (g) 0.082 0.084 0.087 0.087 0.084 0.088
MTVV SUM MAX (g) 0.110 0.111 0.109 0.116 0.114 0.116
PEAK Z (g) 0.311 0.311 0.306 0.321 0.324 0.344
CREST Z MAX 4.244 3.853 3.537 3.946 3.952 4.028
LAeq (dBA) 59.89 59.86 60.37 59.79 60.18 59.93
RMS SUM MAX (g) 0.067 0.065 0.065 0.061 0.064 0.068
MTVV SUM MAX (g) 0.083 0.087 0.083 0.077 0.080 0.091
PEAK Z (g) 0.242 0.227 0.247 0.200 0.238 0.239
CREST Z MAX 4.146 3.773 4.236 3.454 4.087 4.163
LAeq (dBA) 58.53 58.20 58.85 58.42 59.24 59.16
RMS SUM MAX (g) 0.048 0.050 0.050 0.049 0.047 0.050
MTVV SUM MAX (g) 0.083 0.069 0.070 0.071 0.076 0.074
PEAK Z (g) 0.185 0.169 0.168 0.170 0.171 0.202
CREST Z MAX 4.294 3.679 3.469 4.077 4.388 4.343
LAeq (dBA) 56.98 57.03 57.36 56.45 57.60 57.35
RMS SUM MAX (g) 0.036 0.031 0.026 0.037 0.035 0.029
MTVV SUM MAX (g) 0.060 0.061 0.051 0.059 0.058 0.057
PEAK Z (g) 0.138 0.119 0.093 0.148 0.153 0.117
CREST Z MAX 3.824 3.695 3.964 4.077 4.388 4.046
Section 7 BUMPY
ASPHALT
Section 1
WORN/PATCHED
ASPHALT
Section 2 SMOOTH
ASPHALT
Section 3 BROKEN IN
ASPHALT
Section 4 COURSE
ASPHALT
Section 5 ROUGH
ASPHALT
Section 6 SIMULATED
SHALLOW POTHOLES
Section 8 BROKEN
CONCRETE
Section 9 BUMPY
CONCRETE
Section 10 UNEVEN
CONCRETE
Section 11 SPALLED
CONCRETE
Section 12 SMOOTH
CONCRETE

54 © 2018 American Automobile Association, Inc.
AAA All-Season Tire Testing
Wet braking tests were conducted from 8:00-16:00 on 11/7/2017 & 11/8/2017. Wet skid pad testing was conducted from 8:00-16:00 on 11/9/2017.
Average Temperatures (⁰C)
Timestamp Dry Track Ambient Air
A9 Wet Track
11/7/2017 8:00 18.6 15.7 19.1 11/7/2017 9:00 19.6 16.0 19.3
11/7/2017 10:00 21.5 16.8 19.7 11/7/2017 11:00 24.8 18.3 20.6 11/7/2017 12:00 26.8 21.1 21.0 11/7/2017 13:00 29.1 22.9 21.9 11/7/2017 14:00 30.1 24.1 22.2 11/7/2017 15:00 28.9 23.7 22.1 11/7/2017 16:00 26.8 22.9 21.6
11/8/2017 8:00 15.4 10.8 18.1 11/8/2017 9:00 14.2 9.8 17.6
11/8/2017 10:00 15.1 9.9 17.3 11/8/2017 11:00 15.1 9.6 17.3 11/8/2017 12:00 15.0 9.6 17.1
11/8/2017 13:00 15.0 9.6 17.0 11/8/2017 14:00 14.2 9.0 16.5 11/8/2017 15:00 13.8 8.9 16.3 11/8/2017 16:00 13.6 8.8 16.1
11/9/2017 8:00 10.9 8.1 13.9 11/9/2017 9:00 11.9 8.5 14.0
11/9/2017 10:00 13.4 9.0 14.3 11/9/2017 11:00 13.6 9.2 14.3 11/9/2017 12:00 14.2 9.7 14.5 11/9/2017 13:00 14.3 9.8 14.6 11/9/2017 14:00 14.3 9.9 14.7 11/9/2017 15:00 14.1 10.1 14.8 11/9/2017 16:00 14.1 10.6 14.8
Figure 56. Track Temperatures during testing in 1-hour intervals Image Source: AAA

55 © 2018 American Automobile Association, Inc.
AAA All-Season Tire Testing
Figure 57. Water Depth measured in fixed intervals along wet braking lane Image Source: AAA
RDI Serial Number
Final Buffed Tread Depth (mm) Average of all measurements across the tire in 4 locations around the tire
Overall Average
DOT Code
AABC-4544 3.2 3.2 3.2 3.0 3.2 UA8V35363916
AABC-4546 3.1 3.1 3.2 3.2 3.2 UA8V35363916
AABC-4548 3.1 3.0 3.3 3.2 3.2 UA8V35363916
AABC-4549 3.1 3.2 3.3 3.1 3.2 UA8V35363916
Figure 58. Buffed Tire Information: Nexen Classe Premiere CP671 Image Source: AAA
Figure 59. Buffed Tire Photos: Nexen Classe Premiere CP671 Image Source: AAA
11/7/2017 11/8/2017
Area 1 0.805 1.000
Area 2 0.916 0.880
Area 3 1.184 1.010
Area 4 0.974 0.980
Area 5 1.083 0.940
Area 6 1.071 1.120
Water Depths In Wet Braking Lane
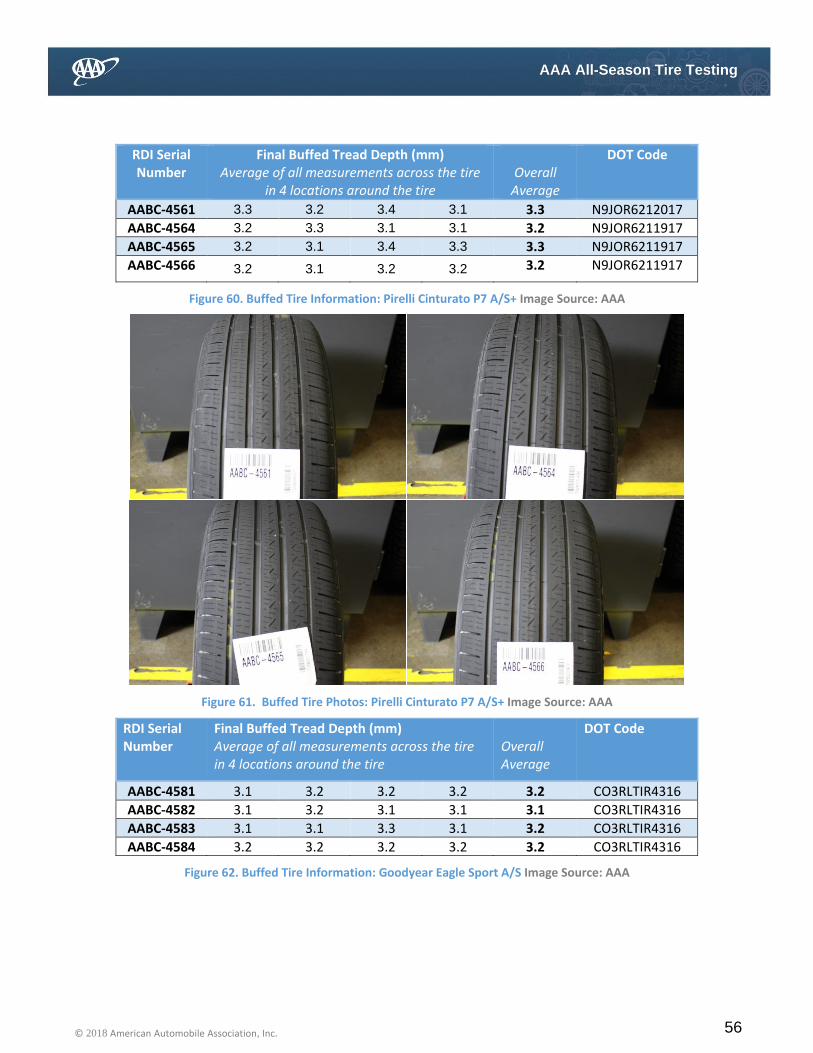
56 © 2018 American Automobile Association, Inc.
AAA All-Season Tire Testing
RDI Serial Number
Final Buffed Tread Depth (mm) Average of all measurements across the tire
in 4 locations around the tire
Overall
Average
DOT Code
AABC-4561 3.3 3.2 3.4 3.1 3.3 N9JOR6212017
AABC-4564 3.2 3.3 3.1 3.1 3.2 N9JOR6211917
AABC-4565 3.2 3.1 3.4 3.3 3.3 N9JOR6211917
AABC-4566 3.2 3.1 3.2 3.2 3.2 N9JOR6211917
Figure 60. Buffed Tire Information: Pirelli Cinturato P7 A/S+ Image Source: AAA
Figure 61. Buffed Tire Photos: Pirelli Cinturato P7 A/S+ Image Source: AAA
RDI Serial Number
Final Buffed Tread Depth (mm) Average of all measurements across the tire in 4 locations around the tire
Overall Average
DOT Code
AABC-4581 3.1 3.2 3.2 3.2 3.2 CO3RLTIR4316
AABC-4582 3.1 3.2 3.1 3.1 3.1 CO3RLTIR4316
AABC-4583 3.1 3.1 3.3 3.1 3.2 CO3RLTIR4316
AABC-4584 3.2 3.2 3.2 3.2 3.2 CO3RLTIR4316
Figure 62. Buffed Tire Information: Goodyear Eagle Sport A/S Image Source: AAA
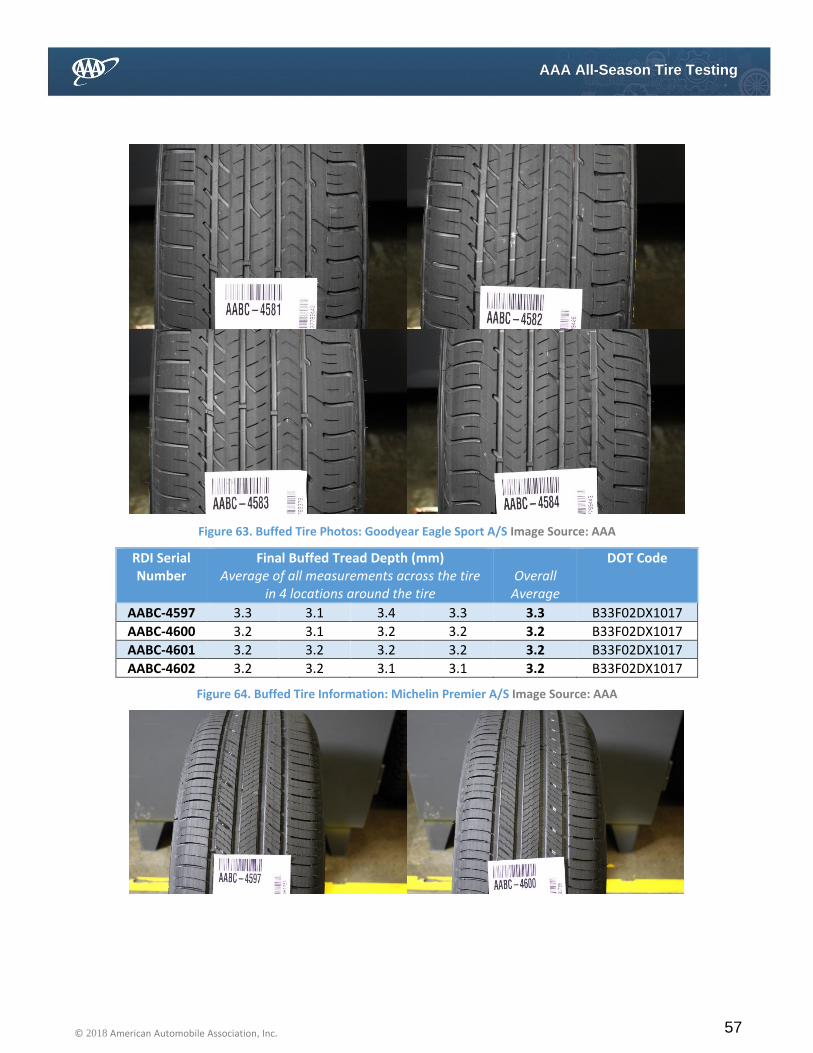
57 © 2018 American Automobile Association, Inc.
AAA All-Season Tire Testing
Figure 63. Buffed Tire Photos: Goodyear Eagle Sport A/S Image Source: AAA
RDI Serial Number
Final Buffed Tread Depth (mm) Average of all measurements across the tire
in 4 locations around the tire
Overall
Average
DOT Code
AABC-4597 3.3 3.1 3.4 3.3 3.3 B33F02DX1017
AABC-4600 3.2 3.1 3.2 3.2 3.2 B33F02DX1017
AABC-4601 3.2 3.2 3.2 3.2 3.2 B33F02DX1017
AABC-4602 3.2 3.2 3.1 3.1 3.2 B33F02DX1017
Figure 64. Buffed Tire Information: Michelin Premier A/S Image Source: AAA
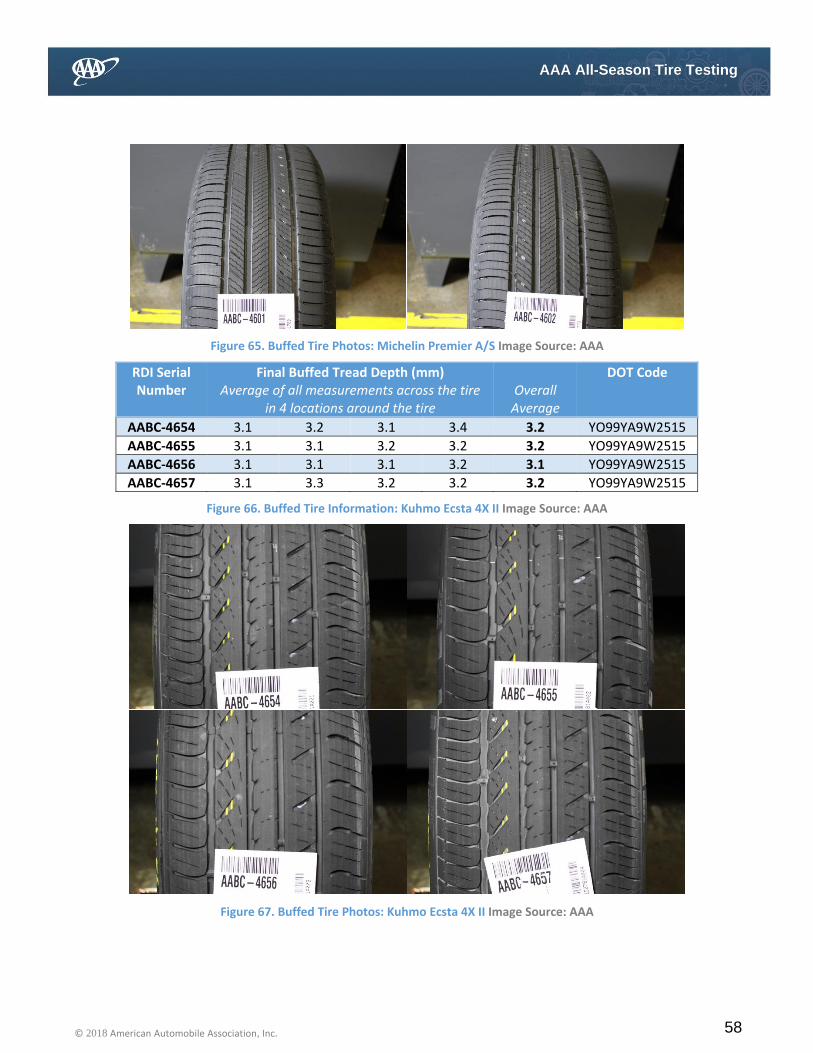
58 © 2018 American Automobile Association, Inc.
AAA All-Season Tire Testing
Figure 65. Buffed Tire Photos: Michelin Premier A/S Image Source: AAA
RDI Serial Number
Final Buffed Tread Depth (mm) Average of all measurements across the tire
in 4 locations around the tire
Overall
Average
DOT Code
AABC-4654 3.1 3.2 3.1 3.4 3.2 YO99YA9W2515
AABC-4655 3.1 3.1 3.2 3.2 3.2 YO99YA9W2515
AABC-4656 3.1 3.1 3.1 3.2 3.1 YO99YA9W2515
AABC-4657 3.1 3.3 3.2 3.2 3.2 YO99YA9W2515
Figure 66. Buffed Tire Information: Kuhmo Ecsta 4X II Image Source: AAA
Figure 67. Buffed Tire Photos: Kuhmo Ecsta 4X II Image Source: AAA
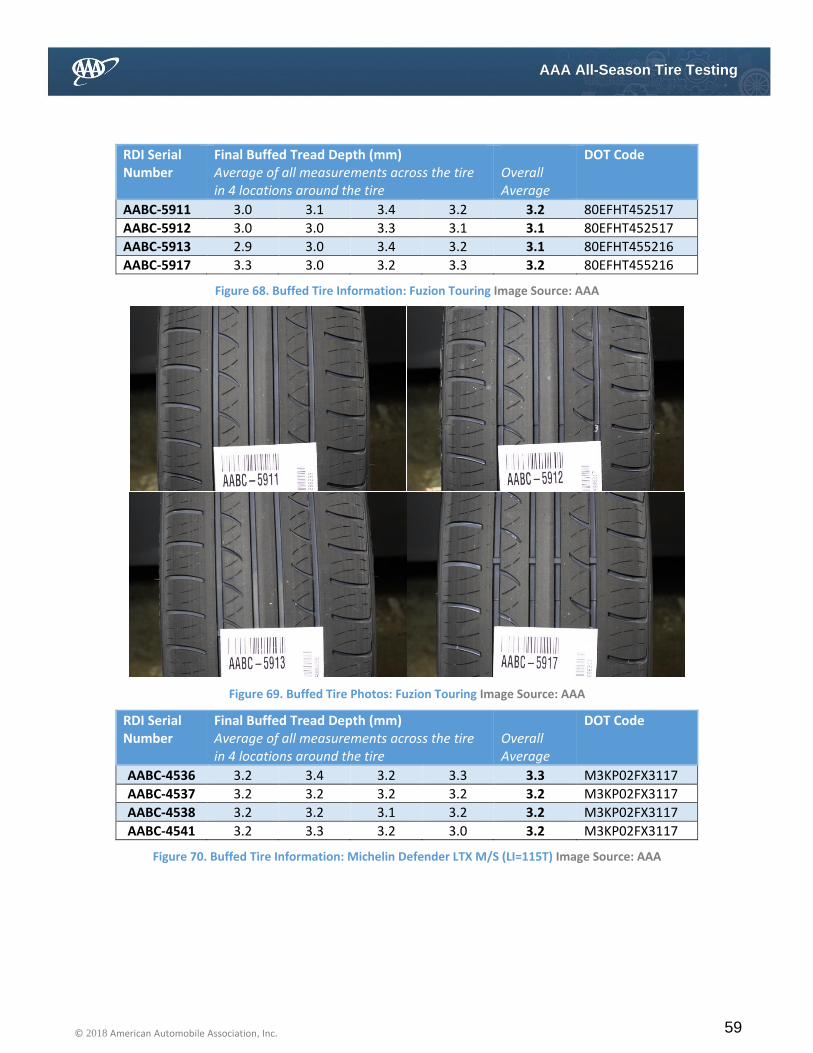
59 © 2018 American Automobile Association, Inc.
AAA All-Season Tire Testing
RDI Serial Number
Final Buffed Tread Depth (mm) Average of all measurements across the tire in 4 locations around the tire
Overall Average
DOT Code
AABC-5911 3.0 3.1 3.4 3.2 3.2 80EFHT452517
AABC-5912 3.0 3.0 3.3 3.1 3.1 80EFHT452517
AABC-5913 2.9 3.0 3.4 3.2 3.1 80EFHT455216
AABC-5917 3.3 3.0 3.2 3.3 3.2 80EFHT455216
Figure 68. Buffed Tire Information: Fuzion Touring Image Source: AAA
Figure 69. Buffed Tire Photos: Fuzion Touring Image Source: AAA
RDI Serial Number
Final Buffed Tread Depth (mm) Average of all measurements across the tire in 4 locations around the tire
Overall Average
DOT Code
AABC-4536 3.2 3.4 3.2 3.3 3.3 M3KP02FX3117
AABC-4537 3.2 3.2 3.2 3.2 3.2 M3KP02FX3117
AABC-4538 3.2 3.2 3.1 3.2 3.2 M3KP02FX3117
AABC-4541 3.2 3.3 3.2 3.0 3.2 M3KP02FX3117
Figure 70. Buffed Tire Information: Michelin Defender LTX M/S (LI=115T) Image Source: AAA
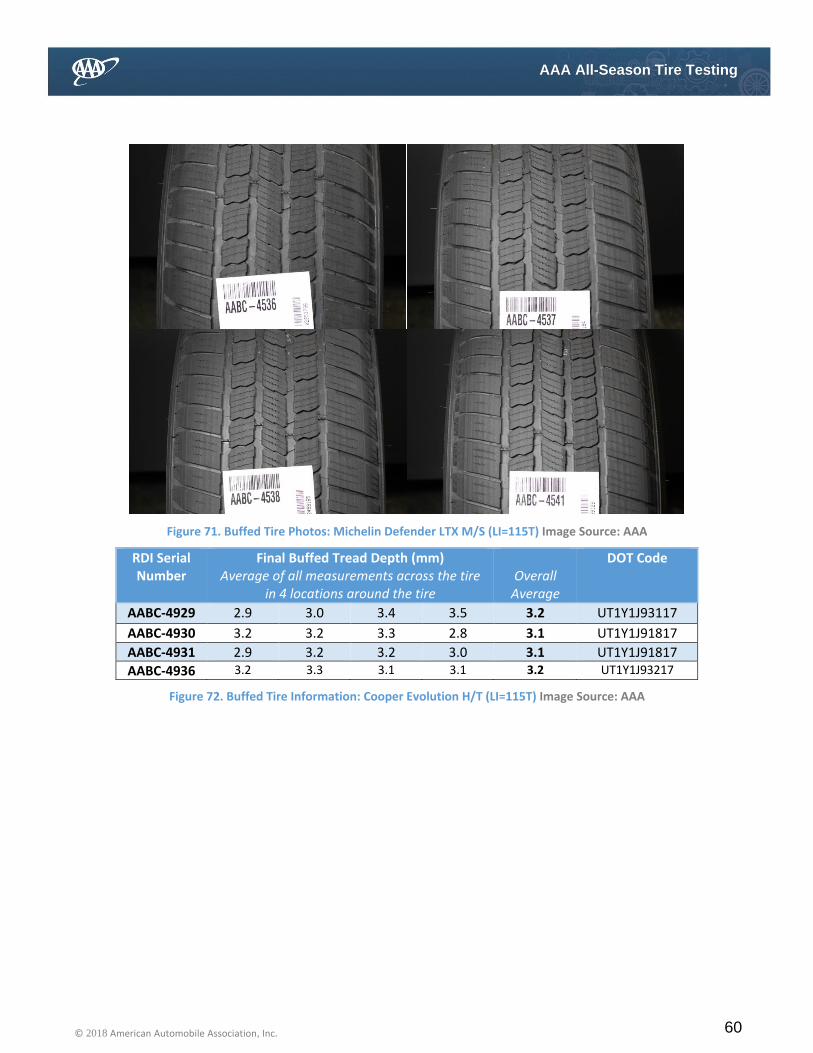
60 © 2018 American Automobile Association, Inc.
AAA All-Season Tire Testing
Figure 71. Buffed Tire Photos: Michelin Defender LTX M/S (LI=115T) Image Source: AAA
RDI Serial Number
Final Buffed Tread Depth (mm) Average of all measurements across the tire
in 4 locations around the tire
Overall
Average
DOT Code
AABC-4929 2.9 3.0 3.4 3.5 3.2 UT1Y1J93117
AABC-4930 3.2 3.2 3.3 2.8 3.1 UT1Y1J91817
AABC-4931 2.9 3.2 3.2 3.0 3.1 UT1Y1J91817
AABC-4936 3.2 3.3 3.1 3.1 3.2 UT1Y1J93217
Figure 72. Buffed Tire Information: Cooper Evolution H/T (LI=115T) Image Source: AAA

61 © 2018 American Automobile Association, Inc.
AAA All-Season Tire Testing
Figure 73. Buffed Tire Photos: Cooper Evolution H/T (LI=115T) Image Source: AAA
RDI Serial Number
Final Buffed Tread Depth (mm) Average of all measurements across the tire in 4 locations around the tire
Overall Average
DOT Code
AABC-4938 3.0 3.2 3.3 3.2 3.2 M61YJK1R1017
AABC-4943 3.2 3.2 3.2 3.1 3.2 M61YJK1R1017
AABC-4947 3.1 3.3 3.4 3.3 3.3 M61YJK1R1017
AABC-4948 3.2 3.4 3.3 3.1 3.3 M61YJK1R1017
Figure 74. Buffed Tire Information: Goodyear Wrangler Fortitude (LI=115T) Image Source: AAA
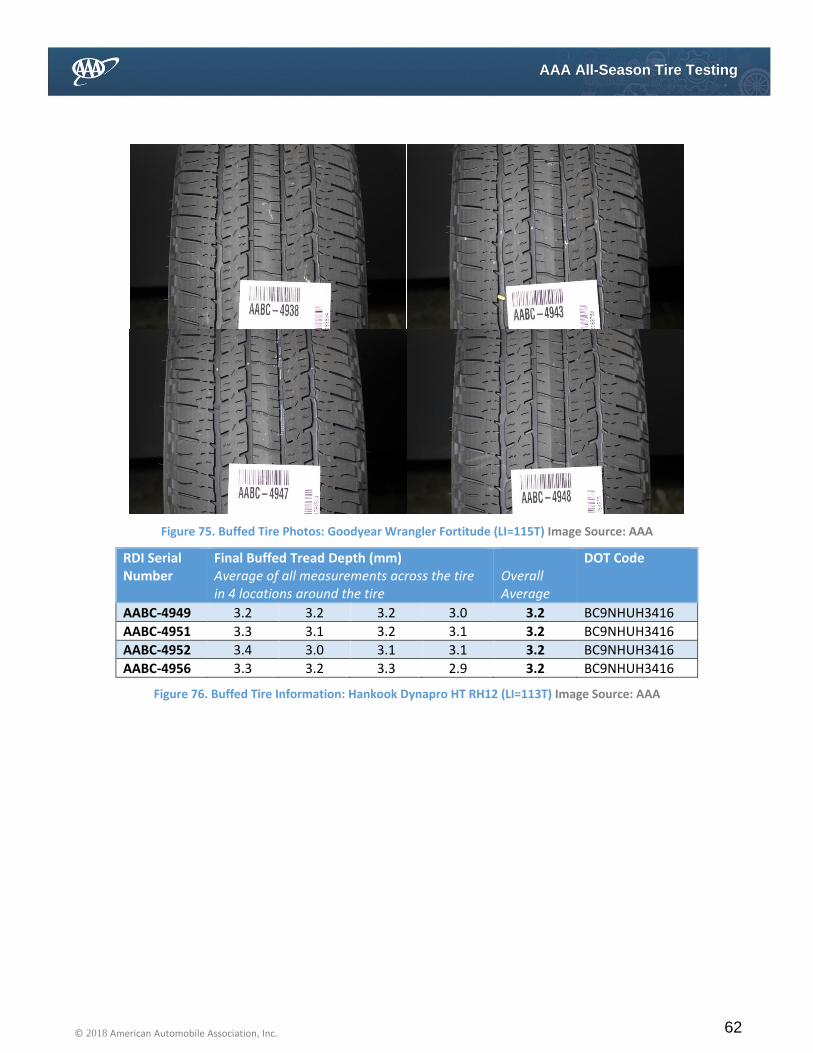
62 © 2018 American Automobile Association, Inc.
AAA All-Season Tire Testing
Figure 75. Buffed Tire Photos: Goodyear Wrangler Fortitude (LI=115T) Image Source: AAA
RDI Serial Number
Final Buffed Tread Depth (mm) Average of all measurements across the tire in 4 locations around the tire
Overall Average
DOT Code
AABC-4949 3.2 3.2 3.2 3.0 3.2 BC9NHUH3416
AABC-4951 3.3 3.1 3.2 3.1 3.2 BC9NHUH3416
AABC-4952 3.4 3.0 3.1 3.1 3.2 BC9NHUH3416
AABC-4956 3.3 3.2 3.3 2.9 3.2 BC9NHUH3416
Figure 76. Buffed Tire Information: Hankook Dynapro HT RH12 (LI=113T) Image Source: AAA

63 © 2018 American Automobile Association, Inc.
AAA All-Season Tire Testing
Figure 77. Buffed Tire Photos: Hankook Dynapro HT RH12 (LI=113T) Image Source: AAA
RDI Serial Number
Final Buffed Tread Depth (mm) Average of all measurements across the tire in 4 locations around the tire
Overall Average
DOT Code
AABC-4960 3.3 3.2 2.8 3.2 3.1 W2T6DE13117
AABC-4961 3.3 3.4 3.1 3.0 3.2 W2T6DE13117
AABC-4962 3.1 3.5 3.4 3.0 3.3 W2T6DE13117
AABC-4964 3.0 3.5 3.4 3.1 3.3 W2T6DE13117
Figure 78. Buffed Tire Information: Firestone Destination LE2 (LI=113T) Image Source: AAA

64 © 2018 American Automobile Association, Inc.
AAA All-Season Tire Testing
Figure 79. Buffed Tire Photos: Firestone Destination LE2 (LI=113T) Image Source: AAA
RDI Serial Number
Final Buffed Tread Depth (mm) Average of all measurements across the tire in 4 locations around the tire
Overall Average
DOT Code
AABC-4969 3.2 3.2 3.0 3.3 3.2 7XT6RLM2217
AABC-4970 3.3 3.2 3.1 3.1 3.2 7XT6RLM2217
AABC-4971 3.2 3.2 3.2 3.1 3.2 7XT6RLM2217
AABC-4972 3.2 3.3 3.1 3.2 3.2 7XT6RLM2217
Figure 80. Buffed Tire Information: Bridgestone Dueler Alenza H/L (LI=113T) Image Source: AAA

65 © 2018 American Automobile Association, Inc.
AAA All-Season Tire Testing
Figure 81. Buffed Tire Photos: Bridgestone Dueler Alenza H/L (LI=113T) Image Source: AAA


