40
1 CONFIDENTIAL FOR INTERNAL USE ONLY AAA Memorial Day 2013 Travel Forecast Prepared for: Prepared for: American Automobile Association May 22, 2013

1 CONFIDENTIAL FOR INTERNAL USE ONLY
AAA Memorial Day 2013 Travel Forecast
Prepared for:
Prepared for:
American Automobile Association
May 22, 2013
1 IHS / AAA 2013 Memorial Day Forecast
Table of Contents
Table of Contents .................................................................................................................................................................... 1
Holiday Forecast Methodology: A Brief Overview ................................................................................................................... 2
2013Memorial Day HolidayTravel Forecast ............................................................................................................................ 3
Travel by Mode of Transportation ........................................................................................................................................... 5
Travel by Region: East North Central ..................................................................................................................................... 8
Travel by Region: East South Central ................................................................................................................................... 10
Travel by Region: Middle Atlantic ......................................................................................................................................... 12
Travel by Region: Mountain .................................................................................................................................................. 14
Travel by Region: New England............................................................................................................................................ 16
Travel by Region: Pacific ...................................................................................................................................................... 18
Travel by Region: South Atlantic ........................................................................................................................................... 20
Travel by Region: West North Central .................................................................................................................................. 22
Travel by Region: West South Central .................................................................................................................................. 24
Memorial Day 2013 Holiday Traveler Profile Survey Methodology ...................................................................................... 26
Change in the Average Memorial Day Traveler .................................................................................................................... 27
Travel Distances ................................................................................................................................................................... 28
Total Spending ...................................................................................................................................................................... 29
Party Composition ................................................................................................................................................................. 31
Activities ................................................................................................................................................................................ 32
The Impact of Fuel Prices on Travel Plans ........................................................................................................................... 34
Addendum 1: US Economic Forecast Summary: ................................................................................................................. 35
Addendum 2: US Regional Forecast Summary .................................................................................................................... 37
Regional definitions used throughout the report:
East North Central (ENC): IL, IN, MI, OH, WI
East South Central (ESC): AL, KY, MS, TN
Middle Atlantic (MATL): NJ, NY, PA
Mountain (MTN): AZ, CO, ID, MT, NM, NV, UT, WY
New England (NENG): CT, MA, ME, NH, RI, VT
South Atlantic (SATL): DC, DE, FL, GA, MD, NC, SC, VA, WV
West South Central (WSC): AR, LA, OK, TX
West North Central (WNC): IA, KS, MN, MO, ND, NE, SD
Pacific (PAC): AK, CA, HI, OR, WA
2 IHS / AAA 2013 Memorial Day Forecast
Holiday Forecast Methodology: A Brief Overview The AAA Memorial Day 2013 Travel Forecast combines information from several sources to provide a prospective assessment of likely travel patterns for the upcoming holiday weekend. This report comprises two key components: the travel forecast and the holiday traveler profile. The travel forecast is based on economic conditions while the holiday traveler profile is developed employing survey data on travel behaviors. This approach provides the most comprehensive and detailed understanding of holiday travel at both the national and regional levels. In addition, the regional travel sections in this report have been enhanced to incorporate information about the state of the local tourism industries throughout the United States.
Holiday Travel Forecast
In cooperation with AAA, IHS developed an approach to forecast domestic travel volumes. The economic variables used to forecast travel for the current holiday are leveraged from IHS. These data include macroeconomic drivers such as employment, output, household net worth, asset prices including stock indices, interest rates, housing market indicators, and variables related to travel and tourism, including prices of gasoline, airline travel, and hotel stays.
The historical travel volume estimates come from the ongoing travel survey database of D.K. Shifflet & Associates, the premier source of US resident travel volume and behavior. DKSA interviews over 50,000 US households per month tracking trip incidence, party composition, traveler behavior, and spending all after the trips have been taken.
Holiday travel is forecast by person-trips, where a person-trip is defined as a trip that involves travel of 50 miles or more away from home. In particular, AAA and IHS forecasts total US holiday travel, travel by mode of transportation, and travel by US census region. The Travel Forecast presented in this report was prepared the week of April 22.
Holiday Traveler Profile
The Holiday Traveler Profile is a survey of intended travel behaviors related to party composition, travel distances, trip expenditures, and vacation activities conducted by D.K. Shifflet & Associates. The initial survey includes 1,352 households, out of which only the respondents intending to travel during the designated holiday are interviewed in detail about their anticipated trips. For Memorial Day 2013, 306 respondents were interviewed in detail about their intended trips. The survey was in the field from Monday, April 8 to Friday, April 12, 2013.
Memorial Day Holiday Travel Period
For purposes of this forecast, the Memorial Day holiday travel period is defined as trips that include travel of 50 miles or more away from home during the five-day period from Thursday, May 23 to Monday, May 27.
3 IHS / AAA 2013 Memorial Day Forecast
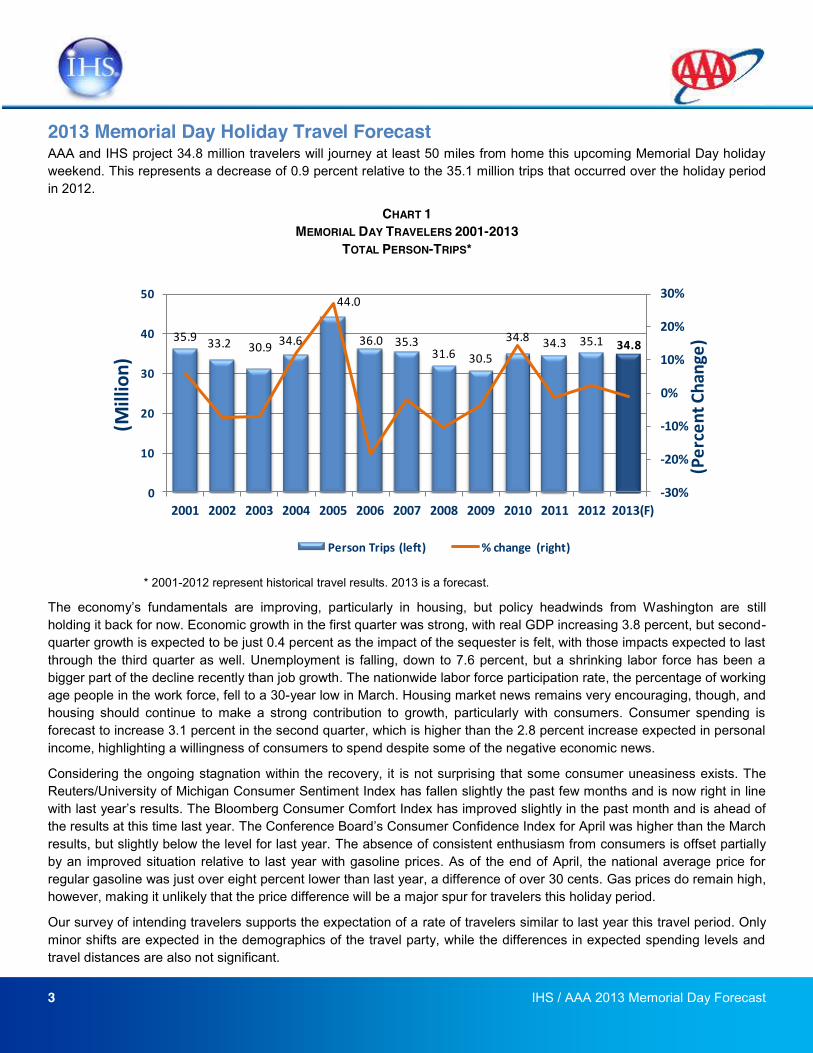
2013 Memorial Day Holiday Travel Forecast AAA and IHS project 34.8 million travelers will journey at least 50 miles from home this upcoming Memorial Day holiday weekend. This represents a decrease of 0.9 percent relative to the 35.1 million trips that occurred over the holiday period in 2012.
CHART 1 MEMORIAL DAY TRAVELERS 2001-2013
TOTAL PERSON-TRIPS*
* 2001-2012 represent historical travel results. 2013 is a forecast.
still holding it back for now. Economic growth in the first quarter was strong, with real GDP increasing 3.8 percent, but second-quarter growth is expected to be just 0.4 percent as the impact of the sequester is felt, with those impacts expected to last through the third quarter as well. Unemployment is falling, down to 7.6 percent, but a shrinking labor force has been a bigger part of the decline recently than job growth. The nationwide labor force participation rate, the percentage of working age people in the work force, fell to a 30-year low in March. Housing market news remains very encouraging, though, and housing should continue to make a strong contribution to growth, particularly with consumers. Consumer spending is forecast to increase 3.1 percent in the second quarter, which is higher than the 2.8 percent increase expected in personal income, highlighting a willingness of consumers to spend despite some of the negative economic news.
Considering the ongoing stagnation within the recovery, it is not surprising that some consumer uneasiness exists. The Reuters/University of Michigan Consumer Sentiment Index has fallen slightly the past few months and is now right in line
Bloomberg Consumer Comfort Index has improved slightly in the past month and is ahead of the results at this time last year. for April was higher than the March results, but slightly below the level for last year. The absence of consistent enthusiasm from consumers is offset partially by an improved situation relative to last year with gasoline prices. As of the end of April, the national average price for regular gasoline was just over eight percent lower than last year, a difference of over 30 cents. Gas prices do remain high, however, making it unlikely that the price difference will be a major spur for travelers this holiday period.
Our survey of intending travelers supports the expectation of a rate of travelers similar to last year this travel period. Only minor shifts are expected in the demographics of the travel party, while the differences in expected spending levels and travel distances are also not significant.
35.9 33.2 30.9 34.6
44.0
36.0 35.331.6 30.5
34.8 34.3 35.1 34.8
-‐30%
-‐20%
-‐10%
0%
10%
20%
30%
0
10
20
30
40
50
2001 2002 2003 2004 2005 2006 2007 2008 2009 2010 2011 2012 2013(F)
(Percent Change)
(Million)
Person Trips (left) % change (right)

4 IHS / AAA 2013 Memorial Day Forecast
The Memorial Day holiday commemorates those who have died in service to our country, while also serving as the unofficial kickoff of the summer season. AAA and IHS forecast a minor decline in travelers this Memorial Day holiday of 0.9 percent, with 34.8 million travelers expected. Now four years removed from the recessionary declines of 2009, pent-up demand has been largely satisfied. This figure is just above the average volume in the previous 12 years, which is 34.7 million.
5 IHS / AAA 2013 Memorial Day Forecast
Last year, holiday spending included airfare and hotel
accommodations and my 2013 Memorial Day holidays plans do
not include those costs. Pacific Respondent
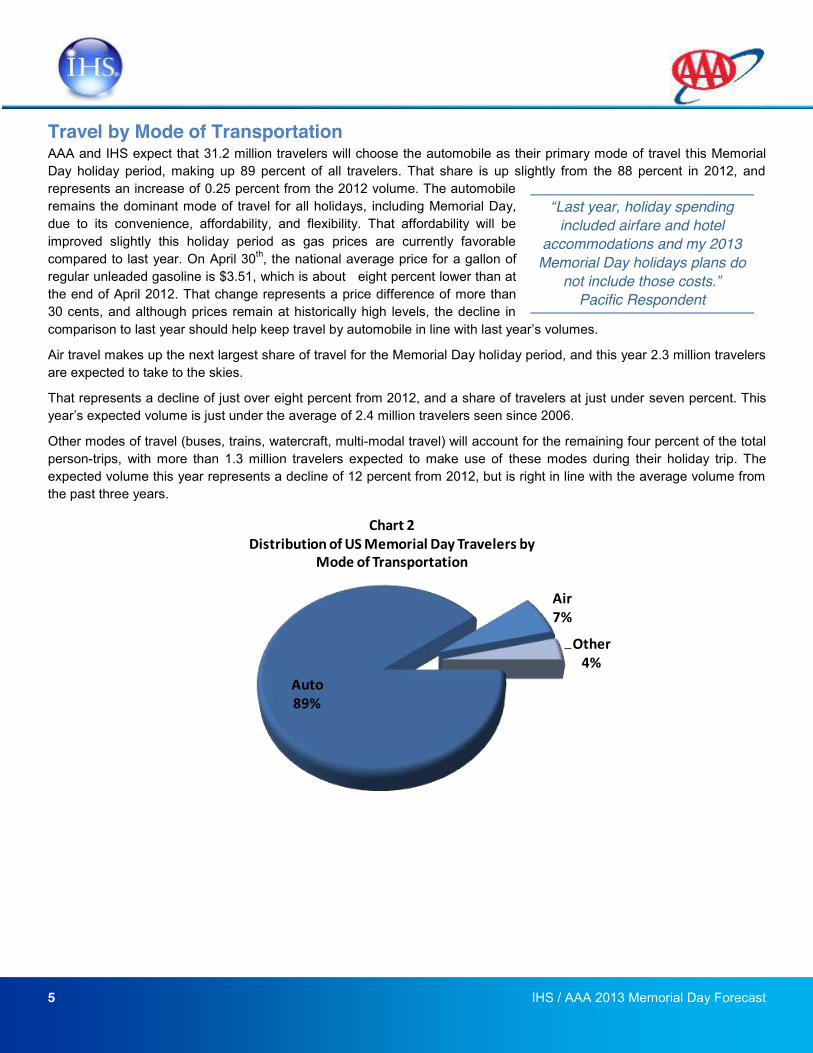
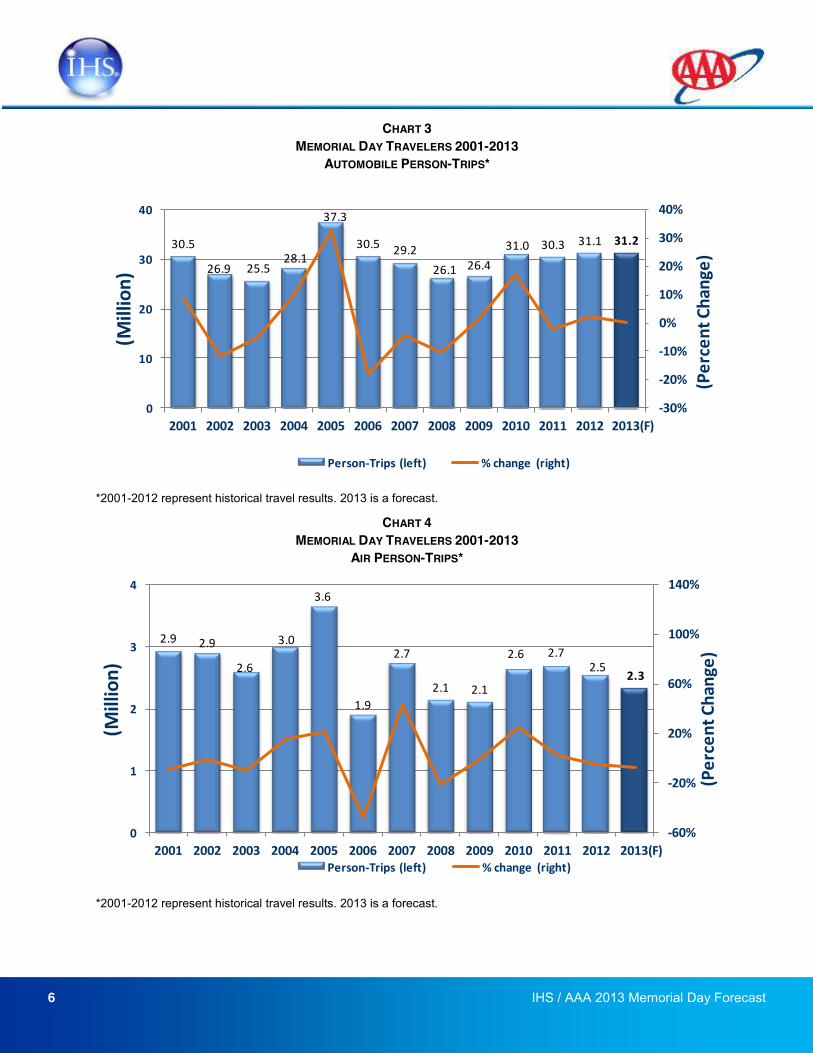
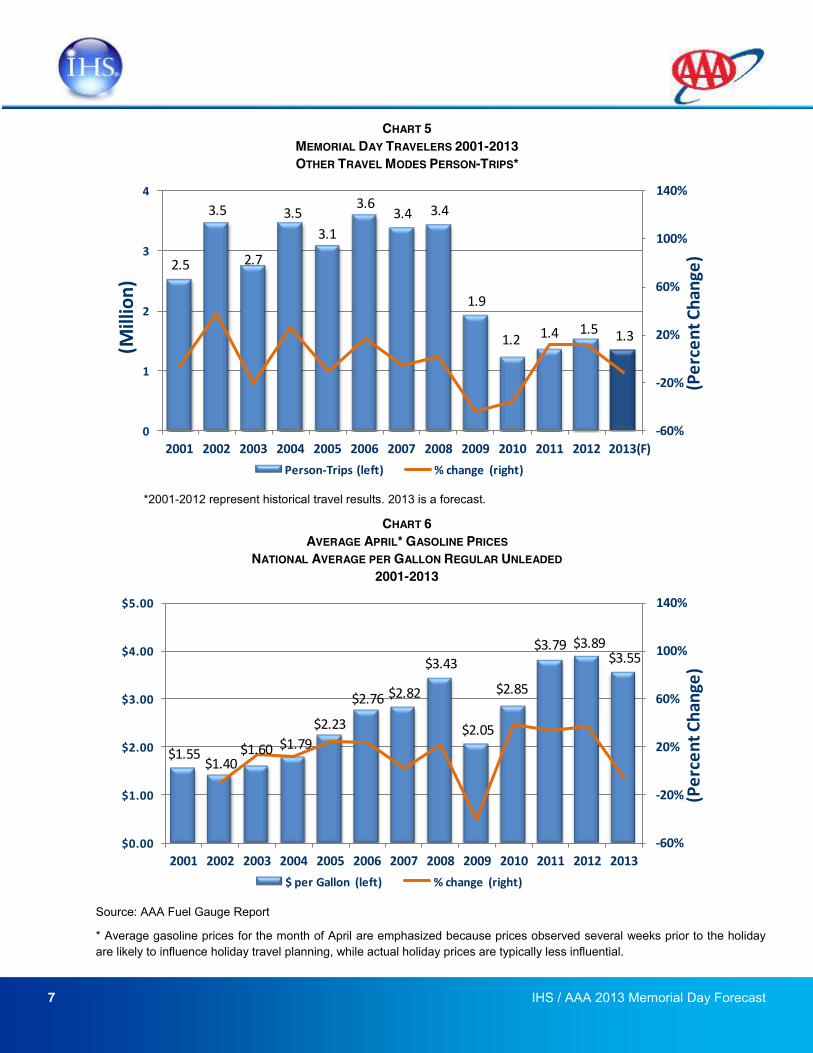
Travel by Mode of Transportation AAA and IHS expect that 31.2 million travelers will choose the automobile as their primary mode of travel this Memorial Day holiday period, making up 89 percent of all travelers. That share is up slightly from the 88 percent in 2012, and represents an increase of 0.25 percent from the 2012 volume. The automobile remains the dominant mode of travel for all holidays, including Memorial Day, due to its convenience, affordability, and flexibility. That affordability will be improved slightly this holiday period as gas prices are currently favorable compared to last year. On April 30th, the national average price for a gallon of regular unleaded gasoline is $3.51, which is about eight percent lower than at the end of April 2012. That change represents a price difference of more than 30 cents, and although prices remain at historically high levels, the decline in
Air travel makes up the next largest share of travel for the Memorial Day holiday period, and this year 2.3 million travelers are expected to take to the skies.
That represents a decline of just over eight percent from 2012, and a share of travelers at just under seven percent. This of 2.4 million travelers seen since 2006.
Other modes of travel (buses, trains, watercraft, multi-modal travel) will account for the remaining four percent of the total person-trips, with more than 1.3 million travelers expected to make use of these modes during their holiday trip. The expected volume this year represents a decline of 12 percent from 2012, but is right in line with the average volume from the past three years.
Auto89%
Air7%
Other4%
Chart 2Distribution of US Memorial Day Travelers by
Mode of Transportation
6 IHS / AAA 2013 Memorial Day Forecast
CHART 3 MEMORIAL DAY TRAVELERS 2001-2013
AUTOMOBILE PERSON-TRIPS*
*2001-2012 represent historical travel results. 2013 is a forecast.
CHART 4 MEMORIAL DAY TRAVELERS 2001-2013
AIR PERSON-TRIPS*
*2001-2012 represent historical travel results. 2013 is a forecast.
30.5
26.9 25.528.1
37.3
30.5 29.226.1 26.4
31.0 30.3 31.1 31.2
-‐30%
-‐20%
-‐10%
0%
10%
20%
30%
40%
0
10
20
30
40
2001 2002 2003 2004 2005 2006 2007 2008 2009 2010 2011 2012 2013(F)
(Percent Change)
(Million)
Person-‐Trips (left) % change (right)
2.9 2.9
2.6
3.0
3.6
1.9
2.7
2.1 2.1
2.6 2.72.5
2.3
-‐60%
-‐20%
20%
60%
100%
140%
0
1
2
3
4
2001 2002 2003 2004 2005 2006 2007 2008 2009 2010 2011 2012 2013(F)
(Percent Change)
(Million)
Person-‐Trips (left) % change (right)
7 IHS / AAA 2013 Memorial Day Forecast
CHART 5 MEMORIAL DAY TRAVELERS 2001-2013 OTHER TRAVEL MODES PERSON-TRIPS*
*2001-2012 represent historical travel results. 2013 is a forecast.
CHART 6 AVERAGE APRIL* GASOLINE PRICES
NATIONAL AVERAGE PER GALLON REGULAR UNLEADED 2001-2013
Source: AAA Fuel Gauge Report
* Average gasoline prices for the month of April are emphasized because prices observed several weeks prior to the holiday are likely to influence holiday travel planning, while actual holiday prices are typically less influential.
2.5
3.5
2.7
3.53.1
3.63.4 3.4
1.9
1.2 1.4 1.5 1.3
-‐60%
-‐20%
20%
60%
100%
140%
0
1
2
3
4
2001 2002 2003 2004 2005 2006 2007 2008 2009 2010 2011 2012 2013(F)
(Percent Change)
(Million)
Person-‐Trips (left) % change (right)
$1.55$1.40
$1.60 $1.79$2.23
$2.76 $2.82
$3.43
$2.05
$2.85
$3.79 $3.89$3.55
-‐60%
-‐20%
20%
60%
100%
140%
$0.00
$1.00
$2.00
$3.00
$4.00
$5.00
2001 2002 2003 2004 2005 2006 2007 2008 2009 2010 2011 2012 2013
(Percent Change)
$ per Gallon (left) % change (right)
8 IHS / AAA 2013 Memorial Day Forecast
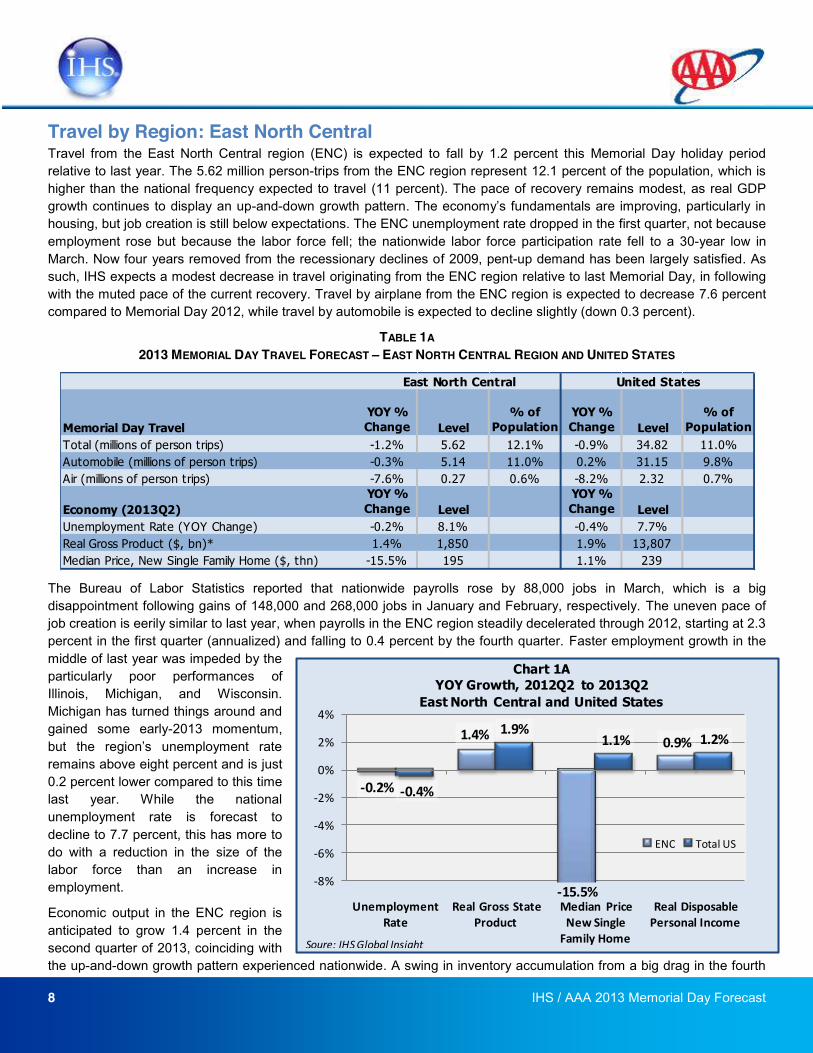
Travel by Region: East North Central Travel from the East North Central region (ENC) is expected to fall by 1.2 percent this Memorial Day holiday period relative to last year. The 5.62 million person-trips from the ENC region represent 12.1 percent of the population, which is higher than the national frequency expected to travel (11 percent). The pace of recovery remains modest, as real GDP growth continues to display an up-and-down growth patternhousing, but job creation is still below expectations. The ENC unemployment rate dropped in the first quarter, not because employment rose but because the labor force fell; the nationwide labor force participation rate fell to a 30-year low in March. Now four years removed from the recessionary declines of 2009, pent-up demand has been largely satisfied. As such, IHS expects a modest decrease in travel originating from the ENC region relative to last Memorial Day, in following with the muted pace of the current recovery. Travel by airplane from the ENC region is expected to decrease 7.6 percent compared to Memorial Day 2012, while travel by automobile is expected to decline slightly (down 0.3 percent).
TABLE 1A 2013 MEMORIAL DAY TRAVEL FORECAST EAST NORTH CENTRAL REGION AND UNITED STATES
The Bureau of Labor Statistics reported that nationwide payrolls rose by 88,000 jobs in March, which is a big disappointment following gains of 148,000 and 268,000 jobs in January and February, respectively. The uneven pace of job creation is eerily similar to last year, when payrolls in the ENC region steadily decelerated through 2012, starting at 2.3 percent in the first quarter (annualized) and falling to 0.4 percent by the fourth quarter. Faster employment growth in the middle of last year was impeded by the particularly poor performances of Illinois, Michigan, and Wisconsin. Michigan has turned things around and gained some early-2013 momentum,
remains above eight percent and is just 0.2 percent lower compared to this time last year. While the national unemployment rate is forecast to decline to 7.7 percent, this has more to do with a reduction in the size of the labor force than an increase in employment.
Economic output in the ENC region is anticipated to grow 1.4 percent in the second quarter of 2013, coinciding with the up-and-down growth pattern experienced nationwide. A swing in inventory accumulation from a big drag in the fourth
Memorial Day TravelYOY % Change Level
% of Population
YOY % Change Level
% of Population
Total (millions of person trips) -1.2% 5.62 12.1% -0.9% 34.82 11.0%Automobile (millions of person trips) -0.3% 5.14 11.0% 0.2% 31.15 9.8%Air (millions of person trips) -7.6% 0.27 0.6% -8.2% 2.32 0.7%
Economy (2013Q2)YOY % Change Level
YOY % Change Level
Unemployment Rate (YOY Change) -0.2% 8.1% -0.4% 7.7%Real Gross Product ($, bn)* 1.4% 1,850 1.9% 13,807Median Price, New Single Family Home ($, thn) -15.5% 195 1.1% 239
East North Central United States
-‐0.2%
1.4% 0.9%
-‐0.4%
1.9%1.1% 1.2%
-‐8%
-‐6%
-‐4%
-‐2%
0%
2%
4%
Unemployment Rate
Real Gross State Product
Median Price New Single Family Home
Real Disposable Personal Income
Chart 1AYOY Growth, 2012Q2 to 2013Q2
East North Central and United States
ENC Total US
Soure: IHS Globql Insight
-‐15.5%
9 IHS / AAA 2013 Memorial Day Forecast
to a big plus in the first quarter accounted for most of the sway in national GDP growth. In the second quarter, inventory accumulation will probably slow and become a drag once again. Consequently, IHS sees no immediate end to the up-and-down pattern of growth in both the ENC region and the greater nation.
Real disposable personal income growth in the ENC is slightly below the national rate and is projected to rise 0.9 percent as compared to one year ago (versus 1.2 percent nationally). The increase in disposable income means that potential travelers will have more money in their pockets than last holiday, but the expiry of the payroll tax cut and the disappearance of special dividends are headwinds to discretionary spending growth. The regional housing market continues to struggle as the median price of new single-family homes is expected to fall 15.5 percent in the second quarter. In order for the housing market to improve significantly, there will need to be economic recovery to the extent of providing enough qualified borrowers and buyers to stimulate demand, which will clear the existing inventory from the market and drive new starts, sales and construction employment.
In general, because the majority of travel occurs by automobile and remains within regional borders, regional travel ties closely with the output generated by that region's leisure and hospitality industry. The following information provides a look into the state of the local tourism industry in the East North Central region
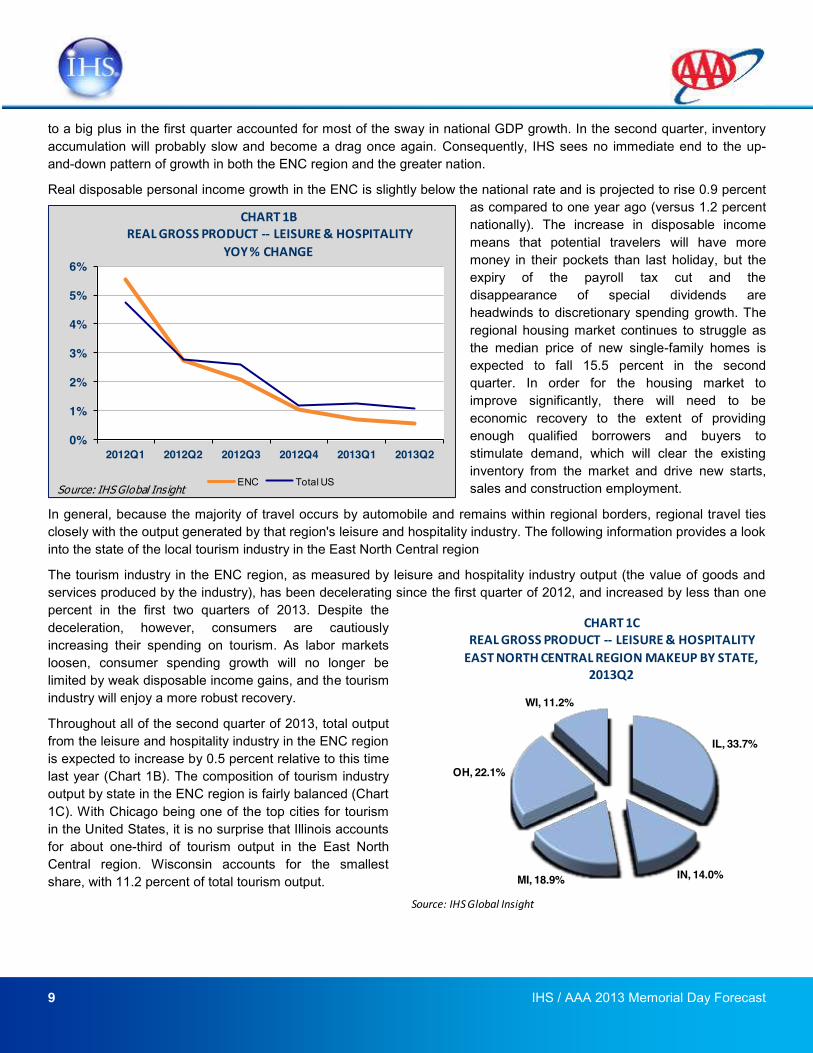
The tourism industry in the ENC region, as measured by leisure and hospitality industry output (the value of goods and services produced by the industry), has been decelerating since the first quarter of 2012, and increased by less than one percent in the first two quarters of 2013. Despite the deceleration, however, consumers are cautiously increasing their spending on tourism. As labor markets loosen, consumer spending growth will no longer be limited by weak disposable income gains, and the tourism industry will enjoy a more robust recovery.
Throughout all of the second quarter of 2013, total output from the leisure and hospitality industry in the ENC region is expected to increase by 0.5 percent relative to this time last year (Chart 1B). The composition of tourism industry output by state in the ENC region is fairly balanced (Chart 1C). With Chicago being one of the top cities for tourism in the United States, it is no surprise that Illinois accounts for about one-third of tourism output in the East North Central region. Wisconsin accounts for the smallest share, with 11.2 percent of total tourism output.
0%
1%
2%
3%
4%
5%
6%
2012Q1 2012Q2 2012Q3 2012Q4 2013Q1 2013Q2
CHART 1BREAL GROSS PRODUCT -‐-‐ LEISURE & HOSPITALITY
YOY % CHANGE
ENC Total USSource: IHS Global Insight
IL, 33.7%
IN, 14.0%MI, 18.9%
OH, 22.1%
WI, 11.2%
CHART 1CREAL GROSS PRODUCT -‐-‐ LEISURE & HOSPITALITYEAST NORTH CENTRAL REGION MAKEUP BY STATE,
2013Q2
Source: IHS Global Insight
10 IHS / AAA 2013 Memorial Day Forecast
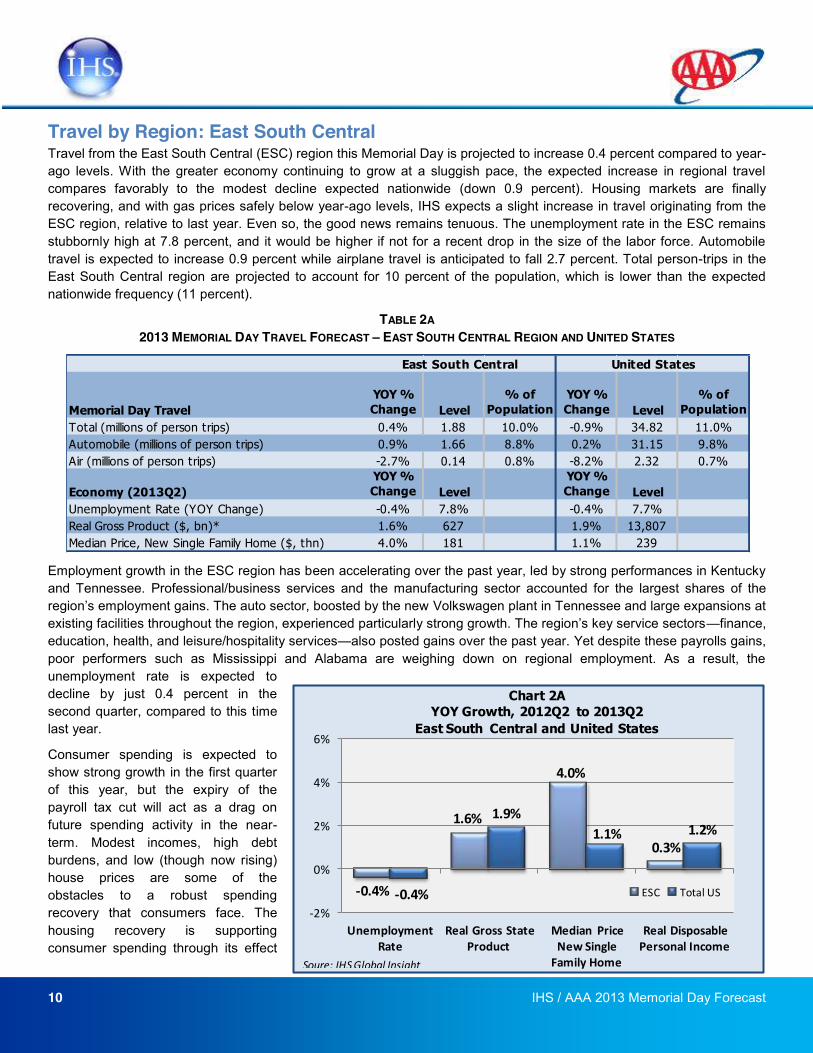
Travel by Region: East South Central Travel from the East South Central (ESC) region this Memorial Day is projected to increase 0.4 percent compared to year-ago levels. With the greater economy continuing to grow at a sluggish pace, the expected increase in regional travel compares favorably to the modest decline expected nationwide (down 0.9 percent). Housing markets are finally recovering, and with gas prices safely below year-ago levels, IHS expects a slight increase in travel originating from the ESC region, relative to last year. Even so, the good news remains tenuous. The unemployment rate in the ESC remains stubbornly high at 7.8 percent, and it would be higher if not for a recent drop in the size of the labor force. Automobile travel is expected to increase 0.9 percent while airplane travel is anticipated to fall 2.7 percent. Total person-trips in the East South Central region are projected to account for 10 percent of the population, which is lower than the expected nationwide frequency (11 percent).
TABLE 2A 2013 MEMORIAL DAY TRAVEL FORECAST EAST SOUTH CENTRAL REGION AND UNITED STATES
Employment growth in the ESC region has been accelerating over the past year, led by strong performances in Kentucky and Tennessee. Professional/business services and the manufacturing sector accounted for the largest shares of the
Volkswagen plant in Tennessee and large expansions at finance,
education, health, and leisure/hospitality services also posted gains over the past year. Yet despite these payrolls gains, poor performers such as Mississippi and Alabama are weighing down on regional employment. As a result, the unemployment rate is expected to decline by just 0.4 percent in the second quarter, compared to this time last year.
Consumer spending is expected to show strong growth in the first quarter of this year, but the expiry of the payroll tax cut will act as a drag on future spending activity in the near-term. Modest incomes, high debt burdens, and low (though now rising) house prices are some of the obstacles to a robust spending recovery that consumers face. The housing recovery is supporting consumer spending through its effect
Memorial Day TravelYOY % Change Level
% of Population
YOY % Change Level
% of Population
Total (millions of person trips) 0.4% 1.88 10.0% -0.9% 34.82 11.0%Automobile (millions of person trips) 0.9% 1.66 8.8% 0.2% 31.15 9.8%Air (millions of person trips) -2.7% 0.14 0.8% -8.2% 2.32 0.7%
Economy (2013Q2)YOY % Change Level
YOY % Change Level
Unemployment Rate (YOY Change) -0.4% 7.8% -0.4% 7.7%Real Gross Product ($, bn)* 1.6% 627 1.9% 13,807Median Price, New Single Family Home ($, thn) 4.0% 181 1.1% 239
East South Central United States
-‐0.4%
1.6%
4.0%
0.3%
-‐0.4%
1.9%1.1% 1.2%
-‐2%
0%
2%
4%
6%
Unemployment Rate
Real Gross State Product
Median Price New Single Family Home
Real Disposable Personal Income
Chart 2AYOY Growth, 2012Q2 to 2013Q2
East South Central and United States
ESC Total US
Soure: IHS Globql Insight
11 IHS / AAA 2013 Memorial Day Forecast
on wealth and on housing-related purchases, and is probably one of the reasons why consumer spending growth was strong in the first quarter. The median price of a new single-family home in the ESC region is expected to grow four percent in the second quarter relative to the same quarter last year. While we expect home prices to steadily rise, the impact of the housing recovery on consumer spending is unlikely to be maintained. As such, we expect a modest increase in ESC travel this coming Memorial Day.
The ES e region is back to a sustained growth track. Job creation continues to remain a concern and despite the housing recovery, consumers continue to experience a drag from high (though falling) debt burdens. With weak improvements in employment and output, the ESC region is expected to see a small 0.4 percent increase in total person-trips over the Memorial Day holiday, which compares favorably to the 0.9 percent decline that is forecasted nationwide.
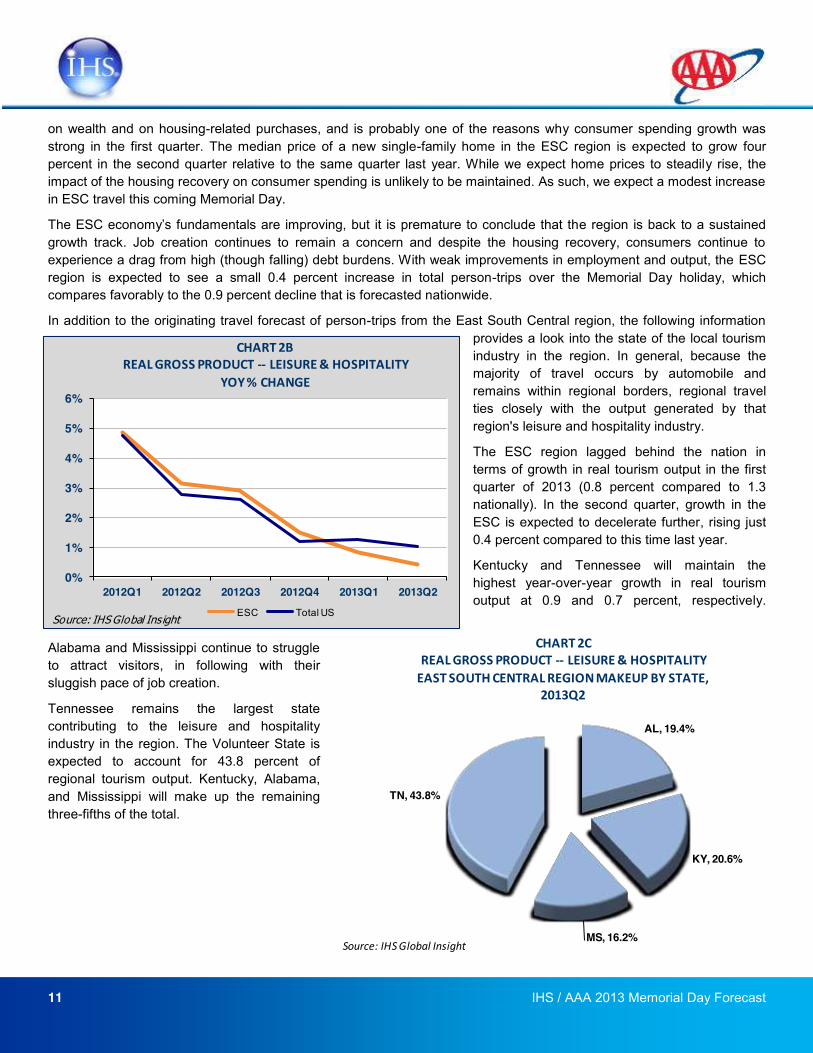
In addition to the originating travel forecast of person-trips from the East South Central region, the following information provides a look into the state of the local tourism industry in the region. In general, because the majority of travel occurs by automobile and remains within regional borders, regional travel ties closely with the output generated by that region's leisure and hospitality industry.
The ESC region lagged behind the nation in terms of growth in real tourism output in the first quarter of 2013 (0.8 percent compared to 1.3 nationally). In the second quarter, growth in the ESC is expected to decelerate further, rising just 0.4 percent compared to this time last year.
Kentucky and Tennessee will maintain the highest year-over-year growth in real tourism output at 0.9 and 0.7 percent, respectively.
Alabama and Mississippi continue to struggle to attract visitors, in following with their sluggish pace of job creation.
Tennessee remains the largest state contributing to the leisure and hospitality industry in the region. The Volunteer State is expected to account for 43.8 percent of regional tourism output. Kentucky, Alabama, and Mississippi will make up the remaining three-fifths of the total.
AL, 19.4%
KY, 20.6%
MS, 16.2%
TN, 43.8%
CHART 2CREAL GROSS PRODUCT -‐-‐ LEISURE & HOSPITALITYEAST SOUTH CENTRAL REGION MAKEUP BY STATE,
2013Q2
Source: IHS Global Insight
0%
1%
2%
3%
4%
5%
6%
2012Q1 2012Q2 2012Q3 2012Q4 2013Q1 2013Q2
CHART 2BREAL GROSS PRODUCT -‐-‐ LEISURE & HOSPITALITY
YOY % CHANGE
ESC Total USSource: IHS Global Insight
12 IHS / AAA 2013 Memorial Day Forecast
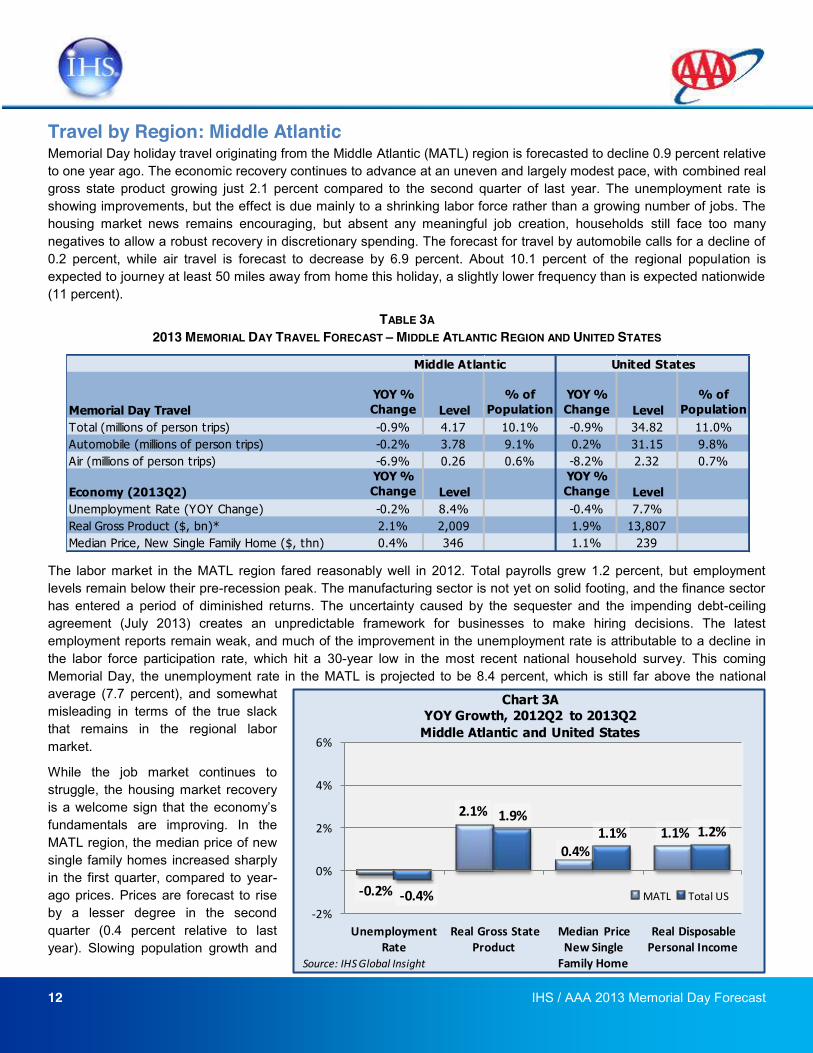
Travel by Region: Middle Atlantic Memorial Day holiday travel originating from the Middle Atlantic (MATL) region is forecasted to decline 0.9 percent relative to one year ago. The economic recovery continues to advance at an uneven and largely modest pace, with combined real gross state product growing just 2.1 percent compared to the second quarter of last year. The unemployment rate is showing improvements, but the effect is due mainly to a shrinking labor force rather than a growing number of jobs. The housing market news remains encouraging, but absent any meaningful job creation, households still face too many negatives to allow a robust recovery in discretionary spending. The forecast for travel by automobile calls for a decline of 0.2 percent, while air travel is forecast to decrease by 6.9 percent. About 10.1 percent of the regional population is expected to journey at least 50 miles away from home this holiday, a slightly lower frequency than is expected nationwide (11 percent).
TABLE 3A 2013 MEMORIAL DAY TRAVEL FORECAST MIDDLE ATLANTIC REGION AND UNITED STATES
The labor market in the MATL region fared reasonably well in 2012. Total payrolls grew 1.2 percent, but employment levels remain below their pre-recession peak. The manufacturing sector is not yet on solid footing, and the finance sector has entered a period of diminished returns. The uncertainty caused by the sequester and the impending debt-ceiling agreement (July 2013) creates an unpredictable framework for businesses to make hiring decisions. The latest employment reports remain weak, and much of the improvement in the unemployment rate is attributable to a decline in the labor force participation rate, which hit a 30-year low in the most recent national household survey. This coming Memorial Day, the unemployment rate in the MATL is projected to be 8.4 percent, which is still far above the national average (7.7 percent), and somewhat misleading in terms of the true slack that remains in the regional labor market.
While the job market continues to struggle, the housing market recovery
fundamentals are improving. In the MATL region, the median price of new single family homes increased sharply in the first quarter, compared to year-ago prices. Prices are forecast to rise by a lesser degree in the second quarter (0.4 percent relative to last year). Slowing population growth and
Memorial Day TravelYOY % Change Level
% of Population
YOY % Change Level
% of Population
Total (millions of person trips) -0.9% 4.17 10.1% -0.9% 34.82 11.0%Automobile (millions of person trips) -0.2% 3.78 9.1% 0.2% 31.15 9.8%Air (millions of person trips) -6.9% 0.26 0.6% -8.2% 2.32 0.7%
Economy (2013Q2)YOY % Change Level
YOY % Change Level
Unemployment Rate (YOY Change) -0.2% 8.4% -0.4% 7.7%Real Gross Product ($, bn)* 2.1% 2,009 1.9% 13,807Median Price, New Single Family Home ($, thn) 0.4% 346 1.1% 239
Middle Atlantic United States
-‐0.2%
2.1%
0.4%1.1%
-‐0.4%
1.9%1.1% 1.2%
-‐2%
0%
2%
4%
6%
Unemployment Rate
Real Gross State Product
Median Price New Single Family Home
Real Disposable Personal Income
Chart 3AYOY Growth, 2012Q2 to 2013Q2Middle Atlantic and United States
MATL Total US
Source: IHS Global Insight
13 IHS / AAA 2013 Memorial Day Forecast
high foreclosure rates remain a threat to future price increases, but MATL prices should continue to slowly recover.
Despite recent improvements in the housing market, the MATL recovery has not yet moved to a sustained, stronger, growth path. Real gross state product for the region is expected to be 2.1 percent higher this Memorial Day than last, but growth continues to oscillate between periods of expansion and relative contraction. In annualized percent change terms, by which economic output is usually measured, regional output is expected to be flat in the second quarter, following 5.3 percent growth in the first quarter. The up-and-down growth pattern seen in the MATL is consistent with that of the greater nation. A swing in inventory accumulation from a big drag in the fourth quarter (0.3 percent annualized growth) to a big plus in the first quarter (3.8 percent) accounted for most of the swing in national GDP growth. In the second quarter, inventory accumulation will probably slow and become a drag once again, as real GDP is forecast to rise just 0.4 percent.
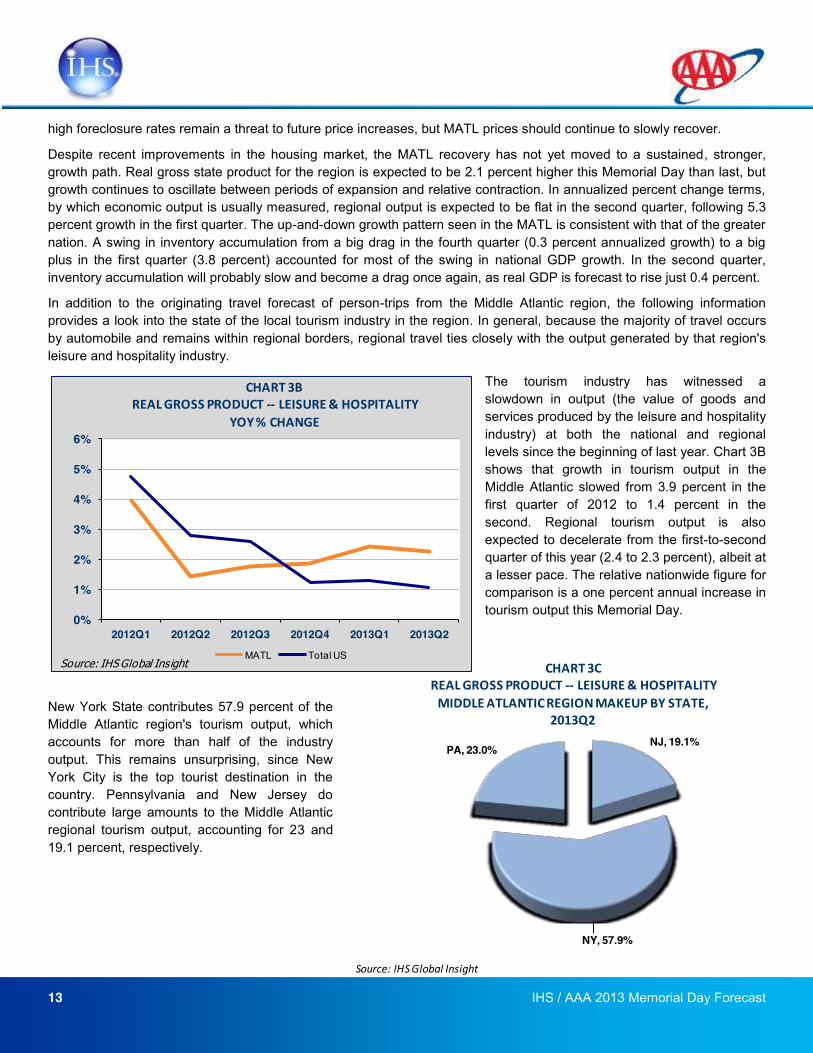
In addition to the originating travel forecast of person-trips from the Middle Atlantic region, the following information provides a look into the state of the local tourism industry in the region. In general, because the majority of travel occurs by automobile and remains within regional borders, regional travel ties closely with the output generated by that region's leisure and hospitality industry.
The tourism industry has witnessed a slowdown in output (the value of goods and services produced by the leisure and hospitality industry) at both the national and regional levels since the beginning of last year. Chart 3B shows that growth in tourism output in the Middle Atlantic slowed from 3.9 percent in the first quarter of 2012 to 1.4 percent in the second. Regional tourism output is also expected to decelerate from the first-to-second quarter of this year (2.4 to 2.3 percent), albeit at a lesser pace. The relative nationwide figure for comparison is a one percent annual increase in tourism output this Memorial Day.
New York State contributes 57.9 percent of the Middle Atlantic region's tourism output, which accounts for more than half of the industry output. This remains unsurprising, since New York City is the top tourist destination in the country. Pennsylvania and New Jersey do contribute large amounts to the Middle Atlantic regional tourism output, accounting for 23 and 19.1 percent, respectively.
0%
1%
2%
3%
4%
5%
6%
2012Q1 2012Q2 2012Q3 2012Q4 2013Q1 2013Q2
CHART 3BREAL GROSS PRODUCT -‐-‐ LEISURE & HOSPITALITY
YOY % CHANGE
MATL Total USSource: IHS Global Insight
NJ, 19.1%
NY, 57.9%
PA, 23.0%
CHART 3CREAL GROSS PRODUCT -‐-‐ LEISURE & HOSPITALITYMIDDLE ATLANTIC REGION MAKEUP BY STATE,
2013Q2
Source: IHS Global Insight
14 IHS / AAA 2013 Memorial Day Forecast
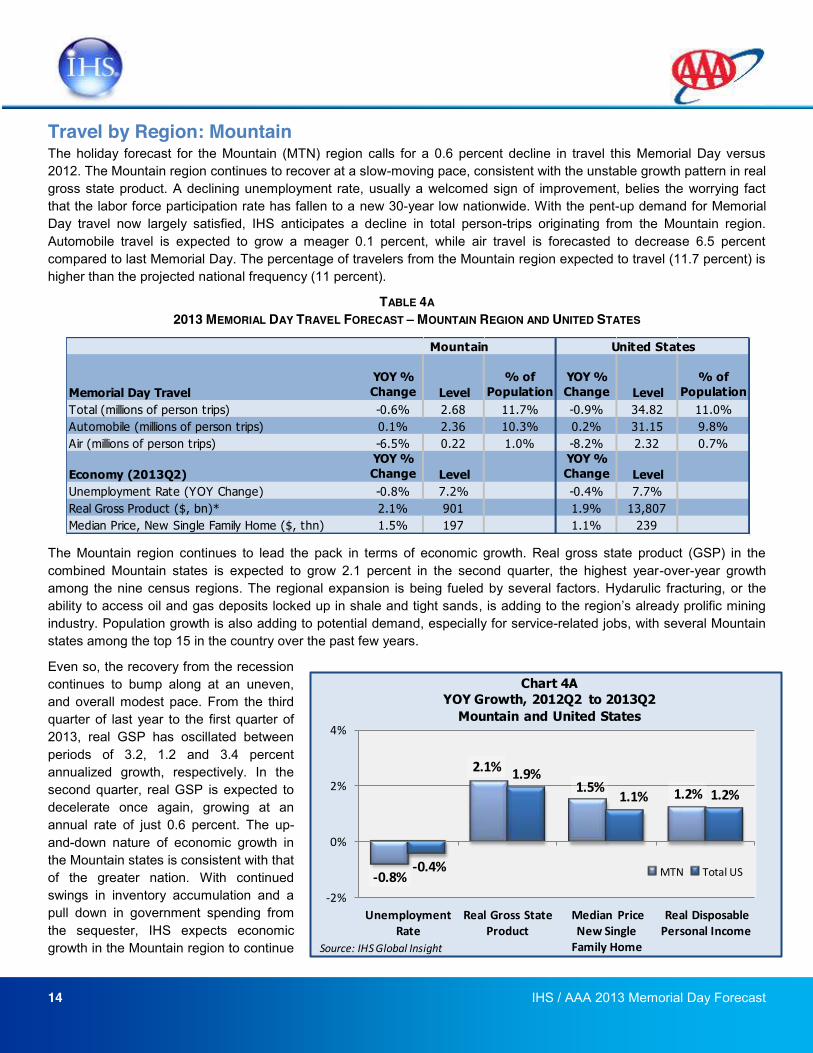
Travel by Region: Mountain The holiday forecast for the Mountain (MTN) region calls for a 0.6 percent decline in travel this Memorial Day versus 2012. The Mountain region continues to recover at a slow-moving pace, consistent with the unstable growth pattern in real gross state product. A declining unemployment rate, usually a welcomed sign of improvement, belies the worrying fact that the labor force participation rate has fallen to a new 30-year low nationwide. With the pent-up demand for Memorial Day travel now largely satisfied, IHS anticipates a decline in total person-trips originating from the Mountain region. Automobile travel is expected to grow a meager 0.1 percent, while air travel is forecasted to decrease 6.5 percent compared to last Memorial Day. The percentage of travelers from the Mountain region expected to travel (11.7 percent) is higher than the projected national frequency (11 percent).
TABLE 4A 2013 MEMORIAL DAY TRAVEL FORECAST MOUNTAIN REGION AND UNITED STATES
The Mountain region continues to lead the pack in terms of economic growth. Real gross state product (GSP) in the combined Mountain states is expected to grow 2.1 percent in the second quarter, the highest year-over-year growth among the nine census regions. The regional expansion is being fueled by several factors. Hydarulic fracturing, or the ability to access oil and gas deposits locked up in shale and tight sands, industry. Population growth is also adding to potential demand, especially for service-related jobs, with several Mountain states among the top 15 in the country over the past few years.
Even so, the recovery from the recession continues to bump along at an uneven, and overall modest pace. From the third quarter of last year to the first quarter of 2013, real GSP has oscillated between periods of 3.2, 1.2 and 3.4 percent annualized growth, respectively. In the second quarter, real GSP is expected to decelerate once again, growing at an annual rate of just 0.6 percent. The up-and-down nature of economic growth in the Mountain states is consistent with that of the greater nation. With continued swings in inventory accumulation and a pull down in government spending from the sequester, IHS expects economic growth in the Mountain region to continue
Memorial Day TravelYOY % Change Level
% of Population
YOY % Change Level
% of Population
Total (millions of person trips) -0.6% 2.68 11.7% -0.9% 34.82 11.0%Automobile (millions of person trips) 0.1% 2.36 10.3% 0.2% 31.15 9.8%Air (millions of person trips) -6.5% 0.22 1.0% -8.2% 2.32 0.7%
Economy (2013Q2)YOY % Change Level
YOY % Change Level
Unemployment Rate (YOY Change) -0.8% 7.2% -0.4% 7.7%Real Gross Product ($, bn)* 2.1% 901 1.9% 13,807Median Price, New Single Family Home ($, thn) 1.5% 197 1.1% 239
Mountain United States
-‐0.8%
2.1%1.5% 1.2%
-‐0.4%
1.9%1.1% 1.2%
-‐2%
0%
2%
4%
Unemployment Rate
Real Gross State Product
Median Price New Single Family Home
Real Disposable Personal Income
Chart 4AYOY Growth, 2012Q2 to 2013Q2Mountain and United States
MTN Total US
Source: IHS Global Insight
15 IHS / AAA 2013 Memorial Day Forecast
to move at an uneven and modest pace.
The unemployment rate in the Mountain region (7.2 percent) remains the fourth-lowest among all census regions, and 0.8 percent lower than this time last year. This is partly due to an increase in energy activity (e.g., mining, oil and natural gas extraction) but is also, to some extent, merely a statistical artifact. The latest US household survey saw the labor force decline by 496,000 workers, while the number of people employed also fell, but by less than the size of the labor force. As a result, the labor force participation rate fell to a new 30-year low (63.3 percent), leading to a drop in the unemployment rate. Meanwhile, the March employment report, which comes from a different survey, was much worse than expected with only 88,000 new jobs created. Taken together, the reduction in unemployment is likely overstating the strength of the regional labor market.
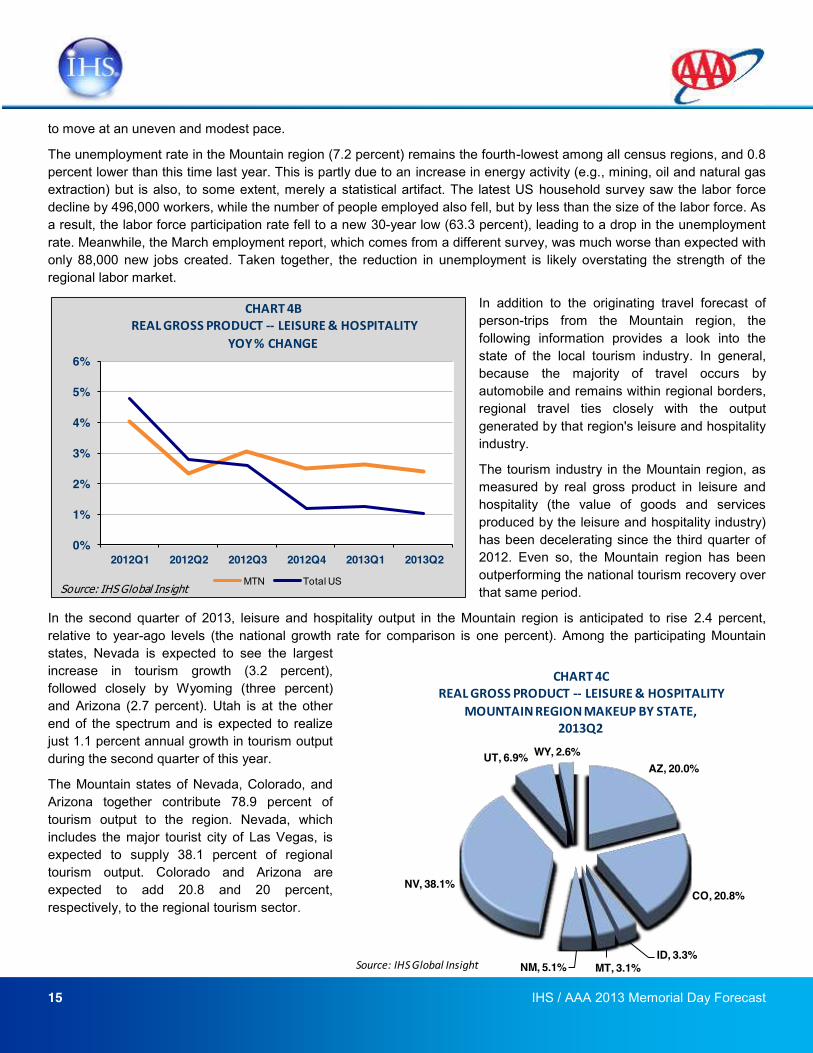
In addition to the originating travel forecast of person-trips from the Mountain region, the following information provides a look into the state of the local tourism industry. In general, because the majority of travel occurs by automobile and remains within regional borders, regional travel ties closely with the output generated by that region's leisure and hospitality industry.
The tourism industry in the Mountain region, as measured by real gross product in leisure and hospitality (the value of goods and services produced by the leisure and hospitality industry) has been decelerating since the third quarter of 2012. Even so, the Mountain region has been outperforming the national tourism recovery over that same period.
In the second quarter of 2013, leisure and hospitality output in the Mountain region is anticipated to rise 2.4 percent, relative to year-ago levels (the national growth rate for comparison is one percent). Among the participating Mountain states, Nevada is expected to see the largest increase in tourism growth (3.2 percent), followed closely by Wyoming (three percent) and Arizona (2.7 percent). Utah is at the other end of the spectrum and is expected to realize just 1.1 percent annual growth in tourism output during the second quarter of this year.
The Mountain states of Nevada, Colorado, and Arizona together contribute 78.9 percent of tourism output to the region. Nevada, which includes the major tourist city of Las Vegas, is expected to supply 38.1 percent of regional tourism output. Colorado and Arizona are expected to add 20.8 and 20 percent, respectively, to the regional tourism sector.
0%
1%
2%
3%
4%
5%
6%
2012Q1 2012Q2 2012Q3 2012Q4 2013Q1 2013Q2
CHART 4BREAL GROSS PRODUCT -‐-‐ LEISURE & HOSPITALITY
YOY % CHANGE
MTN Total USSource: IHS Global Insight
AZ, 20.0%
CO, 20.8%
ID, 3.3%MT, 3.1%NM, 5.1%
NV, 38.1%
UT, 6.9% WY, 2.6%
CHART 4CREAL GROSS PRODUCT -‐-‐ LEISURE & HOSPITALITY
MOUNTAIN REGION MAKEUP BY STATE, 2013Q2
Source: IHS Global Insight
16 IHS / AAA 2013 Memorial Day Forecast
Travel by Region: New England
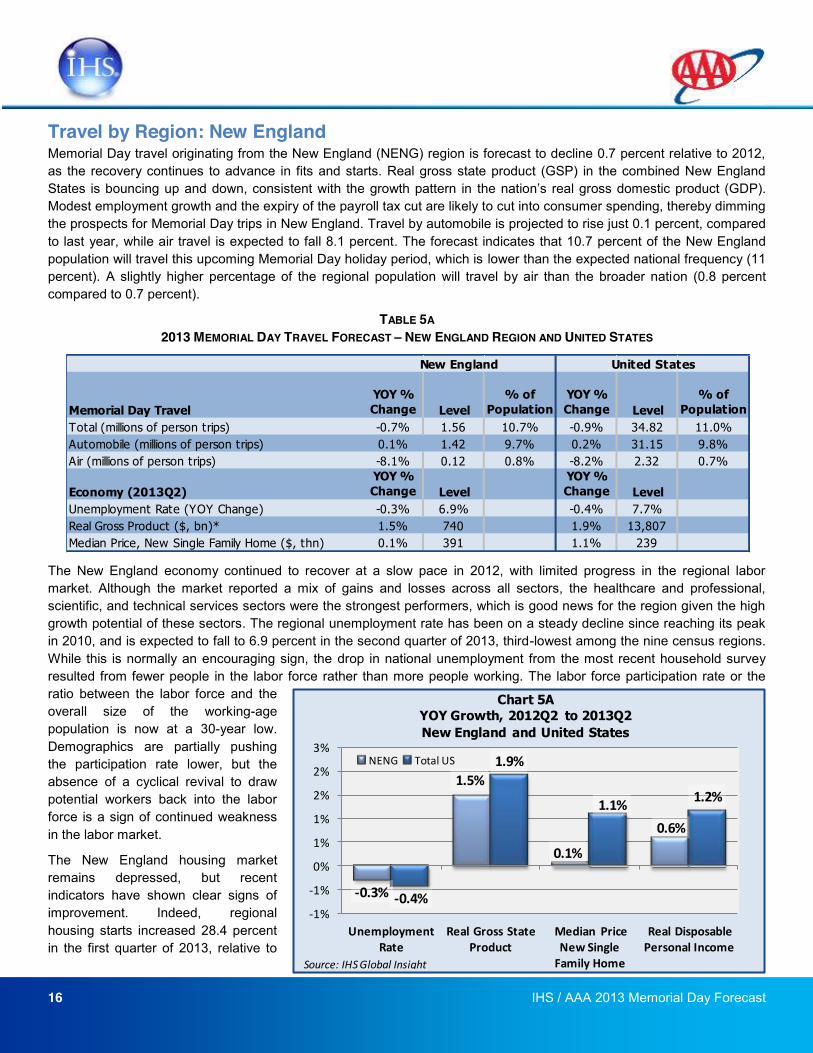
Memorial Day travel originating from the New England (NENG) region is forecast to decline 0.7 percent relative to 2012, as the recovery continues to advance in fits and starts. Real gross state product (GSP) in the combined New England States is bouncing up and down, consistent with the growth pattern in real gross domestic product (GDP). Modest employment growth and the expiry of the payroll tax cut are likely to cut into consumer spending, thereby dimming the prospects for Memorial Day trips in New England. Travel by automobile is projected to rise just 0.1 percent, compared to last year, while air travel is expected to fall 8.1 percent. The forecast indicates that 10.7 percent of the New England population will travel this upcoming Memorial Day holiday period, which is lower than the expected national frequency (11 percent). A slightly higher percentage of the regional population will travel by air than the broader nation (0.8 percent compared to 0.7 percent).
TABLE 5A 2013 MEMORIAL DAY TRAVEL FORECAST NEW ENGLAND REGION AND UNITED STATES
The New England economy continued to recover at a slow pace in 2012, with limited progress in the regional labor market. Although the market reported a mix of gains and losses across all sectors, the healthcare and professional, scientific, and technical services sectors were the strongest performers, which is good news for the region given the high growth potential of these sectors. The regional unemployment rate has been on a steady decline since reaching its peak in 2010, and is expected to fall to 6.9 percent in the second quarter of 2013, third-lowest among the nine census regions. While this is normally an encouraging sign, the drop in national unemployment from the most recent household survey resulted from fewer people in the labor force rather than more people working. The labor force participation rate or the ratio between the labor force and the overall size of the working-age population is now at a 30-year low. Demographics are partially pushing the participation rate lower, but the absence of a cyclical revival to draw potential workers back into the labor force is a sign of continued weakness in the labor market.
The New England housing market remains depressed, but recent indicators have shown clear signs of improvement. Indeed, regional housing starts increased 28.4 percent in the first quarter of 2013, relative to
Memorial Day TravelYOY % Change Level
% of Population
YOY % Change Level
% of Population
Total (millions of person trips) -0.7% 1.56 10.7% -0.9% 34.82 11.0%Automobile (millions of person trips) 0.1% 1.42 9.7% 0.2% 31.15 9.8%Air (millions of person trips) -8.1% 0.12 0.8% -8.2% 2.32 0.7%
Economy (2013Q2)YOY % Change Level
YOY % Change Level
Unemployment Rate (YOY Change) -0.3% 6.9% -0.4% 7.7%Real Gross Product ($, bn)* 1.5% 740 1.9% 13,807Median Price, New Single Family Home ($, thn) 0.1% 391 1.1% 239
New England United States
-‐0.3%
1.5%
0.1%
0.6%
-‐0.4%
1.9%
1.1% 1.2%
-‐1%
-‐1%
0%
1%
1%
2%
2%
3%
Unemployment Rate
Real Gross State Product
Median Price New Single Family Home
Real Disposable Personal Income
Chart 5AYOY Growth, 2012Q2 to 2013Q2New England and United States
NENG Total US
Source: IHS Global Insight
17 IHS / AAA 2013 Memorial Day Forecast
last year, and are expected to grow 4.4 percent in the second quarter. The prolonged duration of the current recovery has enabled a gradual release in the pent-up demand for household formation. At the same time, depressed construction levels have ensured that the supply of vacant homes could be pared down, despite poor housing market conditions. Housing prices have also shown signs of stabilizing, but high foreclosure rates and slowing regional population growth remain a threat to future price increases. In the New England region, the median price of new single-family homes is expected to inch upwards by 0.1 percent in the second quarter, relative to year-ago prices.
Households still face too many negatives to allow a robust consumer spending recovery, one of which is the expiry of the payroll tax cut. IHS expects about a 1 percent loss of disposable income due to the ending of the payroll tax provision. As such, real disposable personal incomes are expected to rise just 0.6 percent in the second quarter compared to one year ago (versus 1.2 percent nationally). Gasoline prices have been slowly retreating since February, but high debt burdens,
modest employment growth, and a lack of
make things better are likely to hasten any spending increases on discretionary items such as travel.
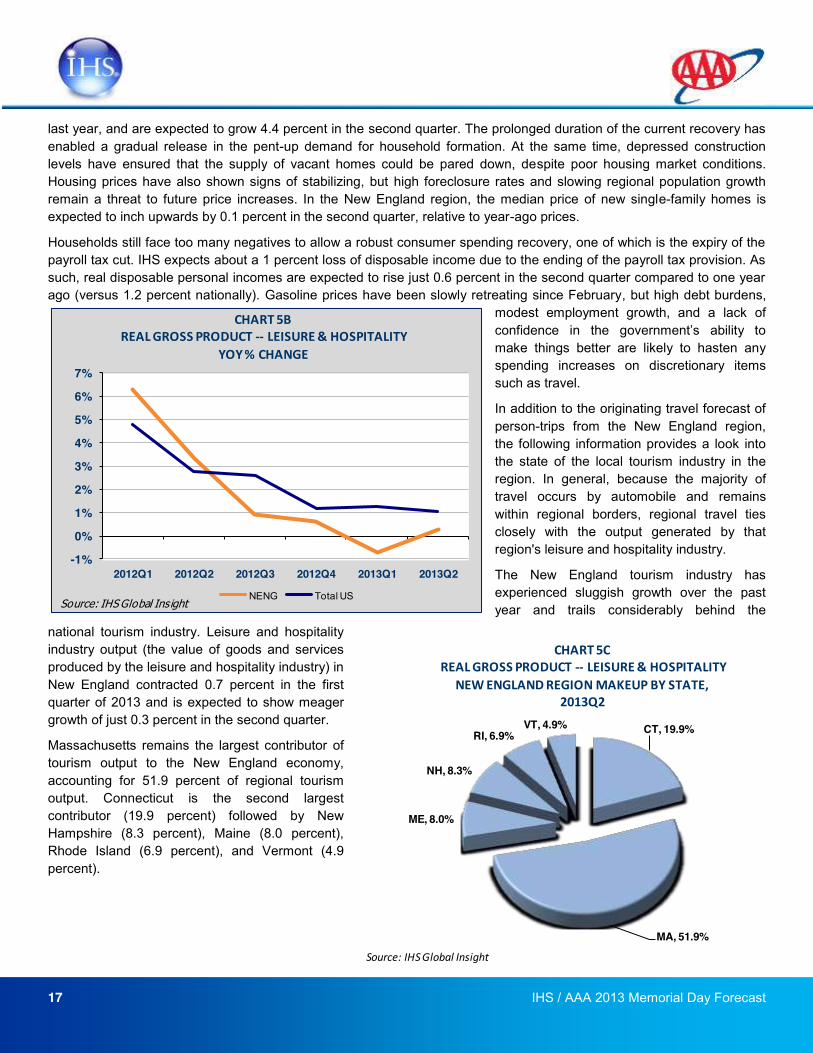
In addition to the originating travel forecast of person-trips from the New England region, the following information provides a look into the state of the local tourism industry in the region. In general, because the majority of travel occurs by automobile and remains within regional borders, regional travel ties closely with the output generated by that region's leisure and hospitality industry.
The New England tourism industry has experienced sluggish growth over the past year and trails considerably behind the
national tourism industry. Leisure and hospitality industry output (the value of goods and services produced by the leisure and hospitality industry) in New England contracted 0.7 percent in the first quarter of 2013 and is expected to show meager growth of just 0.3 percent in the second quarter.
Massachusetts remains the largest contributor of tourism output to the New England economy, accounting for 51.9 percent of regional tourism output. Connecticut is the second largest contributor (19.9 percent) followed by New Hampshire (8.3 percent), Maine (8.0 percent), Rhode Island (6.9 percent), and Vermont (4.9 percent).
CT, 19.9%
MA, 51.9%
ME, 8.0%
NH, 8.3%
RI, 6.9%VT, 4.9%
CHART 5CREAL GROSS PRODUCT -‐-‐ LEISURE & HOSPITALITY
NEW ENGLAND REGION MAKEUP BY STATE, 2013Q2
Source: IHS Global Insight
-1%
0%
1%
2%
3%
4%
5%
6%
7%
2012Q1 2012Q2 2012Q3 2012Q4 2013Q1 2013Q2
CHART 5BREAL GROSS PRODUCT -‐-‐ LEISURE & HOSPITALITY
YOY % CHANGE
NENG Total USSource: IHS Global Insight
18 IHS / AAA 2013 Memorial Day Forecast
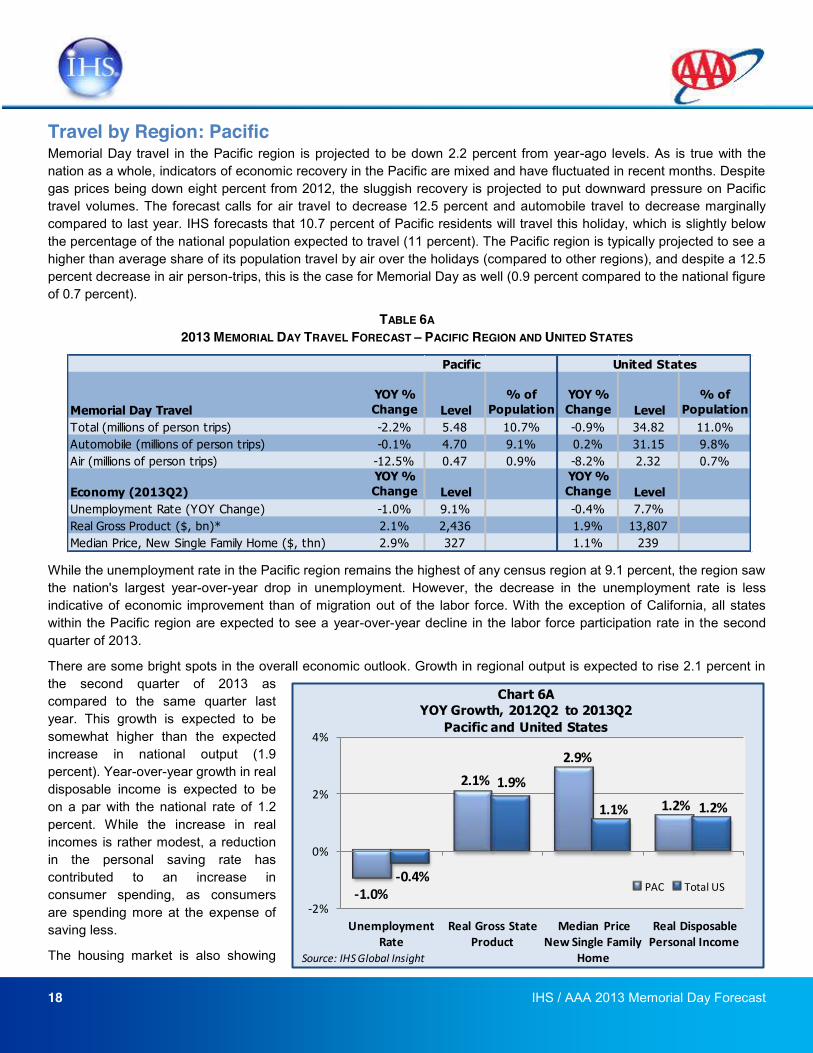
Travel by Region: Pacific Memorial Day travel in the Pacific region is projected to be down 2.2 percent from year-ago levels. As is true with the nation as a whole, indicators of economic recovery in the Pacific are mixed and have fluctuated in recent months. Despite gas prices being down eight percent from 2012, the sluggish recovery is projected to put downward pressure on Pacific travel volumes. The forecast calls for air travel to decrease 12.5 percent and automobile travel to decrease marginally compared to last year. IHS forecasts that 10.7 percent of Pacific residents will travel this holiday, which is slightly below the percentage of the national population expected to travel (11 percent). The Pacific region is typically projected to see a higher than average share of its population travel by air over the holidays (compared to other regions), and despite a 12.5 percent decrease in air person-trips, this is the case for Memorial Day as well (0.9 percent compared to the national figure of 0.7 percent).
TABLE 6A 2013 MEMORIAL DAY TRAVEL FORECAST PACIFIC REGION AND UNITED STATES
While the unemployment rate in the Pacific region remains the highest of any census region at 9.1 percent, the region saw the nation's largest year-over-year drop in unemployment. However, the decrease in the unemployment rate is less indicative of economic improvement than of migration out of the labor force. With the exception of California, all states within the Pacific region are expected to see a year-over-year decline in the labor force participation rate in the second quarter of 2013.
There are some bright spots in the overall economic outlook. Growth in regional output is expected to rise 2.1 percent in the second quarter of 2013 as compared to the same quarter last year. This growth is expected to be somewhat higher than the expected increase in national output (1.9 percent). Year-over-year growth in real disposable income is expected to be on a par with the national rate of 1.2 percent. While the increase in real incomes is rather modest, a reduction in the personal saving rate has contributed to an increase in consumer spending, as consumers are spending more at the expense of saving less.
The housing market is also showing
Memorial Day TravelYOY % Change Level
% of Population
YOY % Change Level
% of Population
Total (millions of person trips) -2.2% 5.48 10.7% -0.9% 34.82 11.0%Automobile (millions of person trips) -0.1% 4.70 9.1% 0.2% 31.15 9.8%Air (millions of person trips) -12.5% 0.47 0.9% -8.2% 2.32 0.7%
Economy (2013Q2)YOY % Change Level
YOY % Change Level
Unemployment Rate (YOY Change) -1.0% 9.1% -0.4% 7.7%Real Gross Product ($, bn)* 2.1% 2,436 1.9% 13,807Median Price, New Single Family Home ($, thn) 2.9% 327 1.1% 239
Pacific United States
-‐1.0%
2.1%2.9%
1.2%
-‐0.4%
1.9%
1.1% 1.2%
-‐2%
0%
2%
4%
Unemployment Rate
Real Gross State Product
Median Price New Single Family
Home
Real Disposable Personal Income
Chart 6AYOY Growth, 2012Q2 to 2013Q2Pacific and United States
PAC Total US
Source: IHS Global Insight
19 IHS / AAA 2013 Memorial Day Forecast
signs of life, but again, results across the region are mixed. The median price of new single-family homes in the Pacific is projected to increase 2.9 percent from this time last year. The regional price increase is being driven primarily by California, where prices are projected to be up three percent annually in the second quarter. Hawaii is also expected to see a marginal price increase, while Washington, Oregon, and Alaska are projected to show declines. Home prices in these states remain relatively low due to the huge overhang of empty dwellings. As lending standards tighten, less credit is available to finance home ownership. Credit availability is gradually improving, but its slow recovery coupled with insufficient job growth has contributed to the lack of recovery in the housing market. A growing economy will provide consumers with the income and confidence to purchase the excess supply available in the housing market and in time, drive prices back to pre-recession levels.
Continued economic uncertainty and the absence of strong economic recovery is expected to elicit caution in discretionary travel spending. A lower personal saving rate as a percentage of disposable income, and increased real gross state output, will not be enough to spark higher levels of travel traffic this Memorial Day weekend. Gas prices are expected to have little influence on travel plans, though a spike in prices before the holiday weekend may cause some travelers to curb spending on non-fuel travel expenditures.
In addition to the originating travel forecast of person-trips from the Pacific region, the following information provides a look into the state of the local tourism industry in the region. In general, because the majority of travel occurs by automobile and remains within regional borders, regional travel ties closely with the output
generated by that region's leisure and hospitality industry.
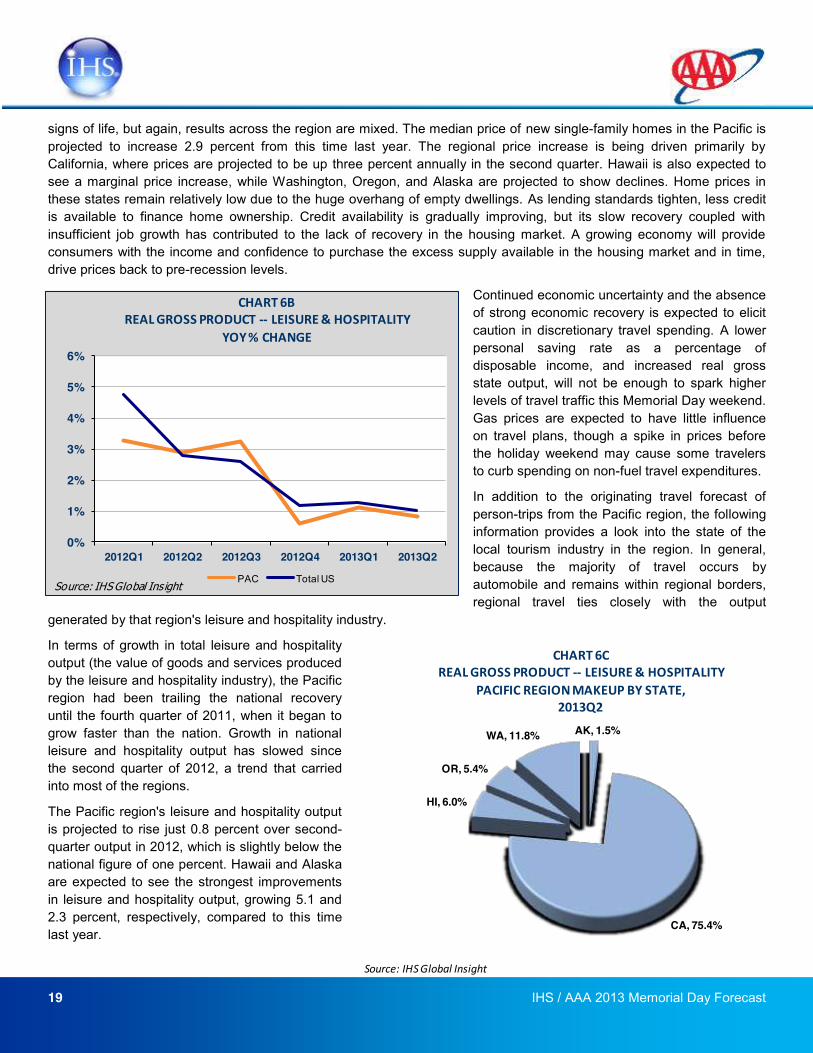
In terms of growth in total leisure and hospitality output (the value of goods and services produced by the leisure and hospitality industry), the Pacific region had been trailing the national recovery until the fourth quarter of 2011, when it began to grow faster than the nation. Growth in national leisure and hospitality output has slowed since the second quarter of 2012, a trend that carried into most of the regions.
The Pacific region's leisure and hospitality output is projected to rise just 0.8 percent over second-quarter output in 2012, which is slightly below the national figure of one percent. Hawaii and Alaska are expected to see the strongest improvements in leisure and hospitality output, growing 5.1 and 2.3 percent, respectively, compared to this time last year.
0%
1%
2%
3%
4%
5%
6%
2012Q1 2012Q2 2012Q3 2012Q4 2013Q1 2013Q2
CHART 6BREAL GROSS PRODUCT -‐-‐ LEISURE & HOSPITALITY
YOY % CHANGE
PAC Total USSource: IHS Global Insight
AK, 1.5%
CA, 75.4%
HI, 6.0%
OR, 5.4%
WA, 11.8%
CHART 6CREAL GROSS PRODUCT -‐-‐ LEISURE & HOSPITALITY
PACIFIC REGION MAKEUP BY STATE, 2013Q2
Source: IHS Global Insight
20 IHS / AAA 2013 Memorial Day Forecast
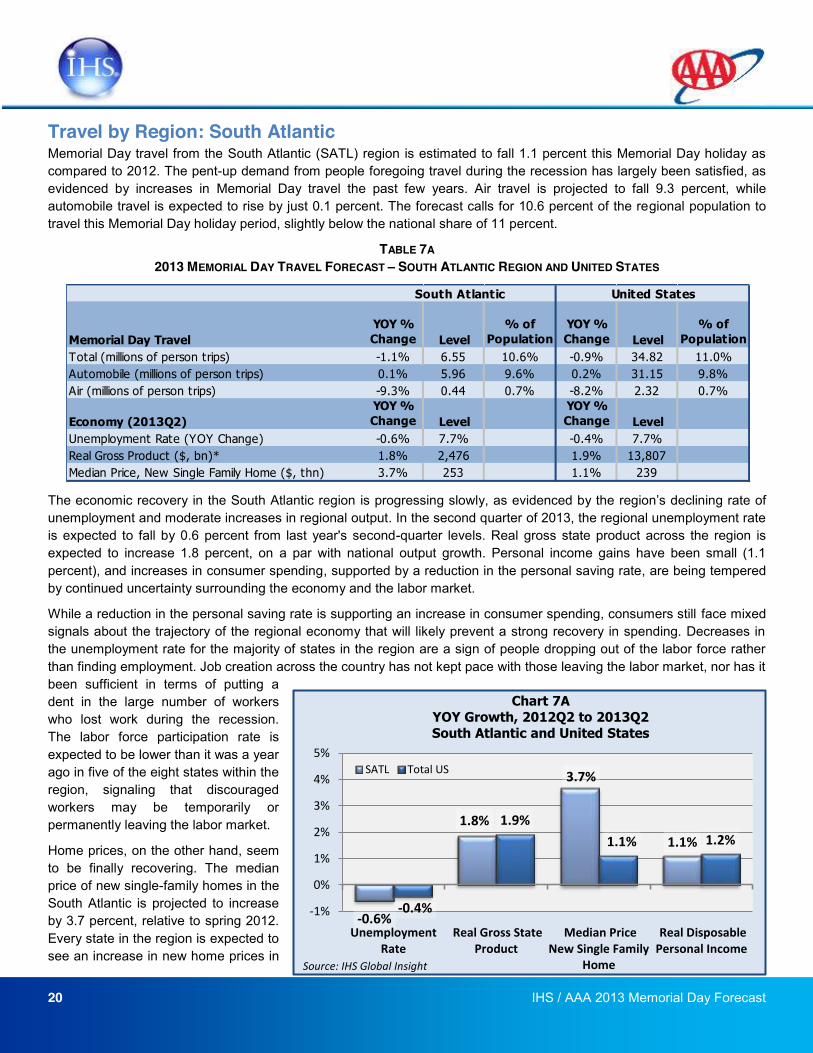
Travel by Region: South Atlantic Memorial Day travel from the South Atlantic (SATL) region is estimated to fall 1.1 percent this Memorial Day holiday as compared to 2012. The pent-up demand from people foregoing travel during the recession has largely been satisfied, as evidenced by increases in Memorial Day travel the past few years. Air travel is projected to fall 9.3 percent, while automobile travel is expected to rise by just 0.1 percent. The forecast calls for 10.6 percent of the regional population to travel this Memorial Day holiday period, slightly below the national share of 11 percent.
TABLE 7A 2013 MEMORIAL DAY TRAVEL FORECAST SOUTH ATLANTIC REGION AND UNITED STATES
The economic recovery in the South Atlantic region is progressing slowly, as evidenced by the declining rate of unemployment and moderate increases in regional output. In the second quarter of 2013, the regional unemployment rate is expected to fall by 0.6 percent from last year's second-quarter levels. Real gross state product across the region is expected to increase 1.8 percent, on a par with national output growth. Personal income gains have been small (1.1 percent), and increases in consumer spending, supported by a reduction in the personal saving rate, are being tempered by continued uncertainty surrounding the economy and the labor market.
While a reduction in the personal saving rate is supporting an increase in consumer spending, consumers still face mixed signals about the trajectory of the regional economy that will likely prevent a strong recovery in spending. Decreases in the unemployment rate for the majority of states in the region are a sign of people dropping out of the labor force rather than finding employment. Job creation across the country has not kept pace with those leaving the labor market, nor has it been sufficient in terms of putting a dent in the large number of workers who lost work during the recession. The labor force participation rate is expected to be lower than it was a year ago in five of the eight states within the region, signaling that discouraged workers may be temporarily or permanently leaving the labor market.
Home prices, on the other hand, seem to be finally recovering. The median price of new single-family homes in the South Atlantic is projected to increase by 3.7 percent, relative to spring 2012. Every state in the region is expected to see an increase in new home prices in
Memorial Day TravelYOY % Change Level
% of Population
YOY % Change Level
% of Population
Total (millions of person trips) -1.1% 6.55 10.6% -0.9% 34.82 11.0%Automobile (millions of person trips) 0.1% 5.96 9.6% 0.2% 31.15 9.8%Air (millions of person trips) -9.3% 0.44 0.7% -8.2% 2.32 0.7%
Economy (2013Q2)YOY % Change Level
YOY % Change Level
Unemployment Rate (YOY Change) -0.6% 7.7% -0.4% 7.7%Real Gross Product ($, bn)* 1.8% 2,476 1.9% 13,807Median Price, New Single Family Home ($, thn) 3.7% 253 1.1% 239
South Atlantic United States
-‐0.6%
1.8%
3.7%
1.1%
-‐0.4%
1.9% 1.1% 1.2%
-‐1%
0%
1%
2%
3%
4%
5%
UnemploymentRate
Real Gross StateProduct
Median PriceNew Single Family
Home
Real DisposablePersonal Income
Chart 7A YOY Growth, 2012Q2 to 2013Q2 South Atlantic and United States
SATL Total US
Source: IHS Global Insight
21 IHS / AAA 2013 Memorial Day Forecast
the second quarter. Sales of existing homes, another indicator of the health of the housing market, are also projected to be higher than they were in the second quarter of 2012 in all nine South Atlantic states. Improving personal credit conditions are revitalizing the housing market by allowing more potential homebuyers to enter the market and reduce the quantity of excess empty homes.
Gas prices are expected to have a negligible impact on travel decisions this Memorial Day weekend. The average gasoline price is down more than eight percent from the second quarter of 2012. An increase in the gas price prior to the Memorial Day holiday is unlikely to influence the decision of whether or not to travel, but it may convince some travelers to
reallocate travel budgets to account for higher fuel costs by spending less in other areas.
In addition to the originating travel forecast of person-trips from the South Atlantic region, the following information provides a look into the state of the local tourism industry in the region. In general, because the majority of travel occurs by automobile and remains within regional borders, regional travel ties closely with the output generated by that region's leisure and hospitality industry.
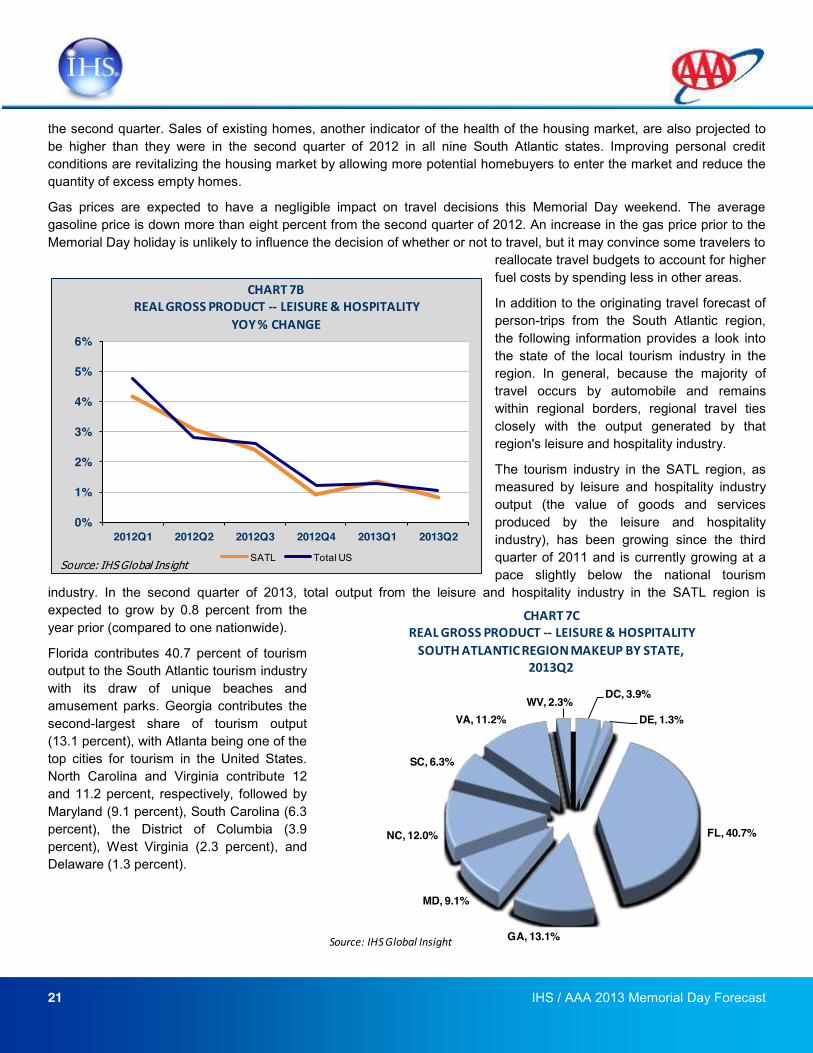
The tourism industry in the SATL region, as measured by leisure and hospitality industry output (the value of goods and services produced by the leisure and hospitality industry), has been growing since the third quarter of 2011 and is currently growing at a pace slightly below the national tourism
industry. In the second quarter of 2013, total output from the leisure and hospitality industry in the SATL region is expected to grow by 0.8 percent from the year prior (compared to one nationwide).
Florida contributes 40.7 percent of tourism output to the South Atlantic tourism industry with its draw of unique beaches and amusement parks. Georgia contributes the second-largest share of tourism output (13.1 percent), with Atlanta being one of the top cities for tourism in the United States. North Carolina and Virginia contribute 12 and 11.2 percent, respectively, followed by Maryland (9.1 percent), South Carolina (6.3 percent), the District of Columbia (3.9 percent), West Virginia (2.3 percent), and Delaware (1.3 percent).
0%
1%
2%
3%
4%
5%
6%
2012Q1 2012Q2 2012Q3 2012Q4 2013Q1 2013Q2
CHART 7BREAL GROSS PRODUCT -‐-‐ LEISURE & HOSPITALITY
YOY % CHANGE
SATL Total USSource: IHS Global Insight
DC, 3.9%
DE, 1.3%
FL, 40.7%
GA, 13.1%
MD, 9.1%
NC, 12.0%
SC, 6.3%
VA, 11.2%WV, 2.3%
CHART 7CREAL GROSS PRODUCT -‐-‐ LEISURE & HOSPITALITYSOUTH ATLANTIC REGION MAKEUP BY STATE,
2013Q2
Source: IHS Global Insight
22 IHS / AAA 2013 Memorial Day Forecast
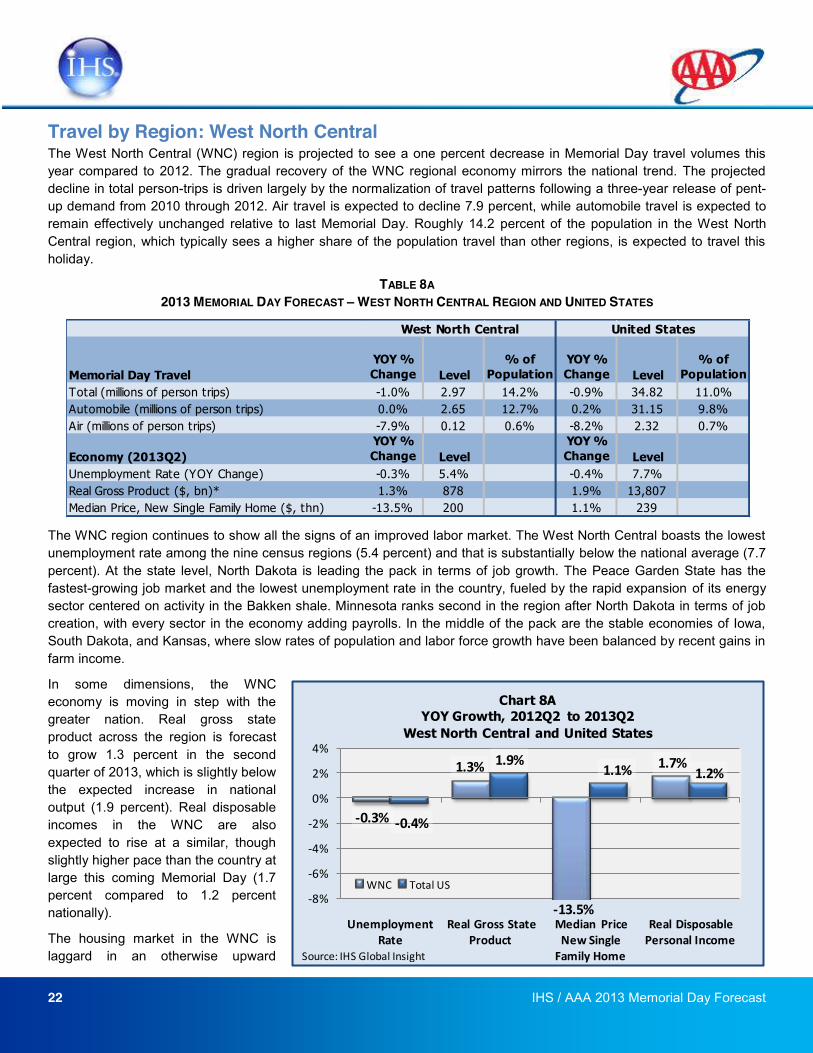
Travel by Region: West North Central
The West North Central (WNC) region is projected to see a one percent decrease in Memorial Day travel volumes this year compared to 2012. The gradual recovery of the WNC regional economy mirrors the national trend. The projected decline in total person-trips is driven largely by the normalization of travel patterns following a three-year release of pent-up demand from 2010 through 2012. Air travel is expected to decline 7.9 percent, while automobile travel is expected to remain effectively unchanged relative to last Memorial Day. Roughly 14.2 percent of the population in the West North Central region, which typically sees a higher share of the population travel than other regions, is expected to travel this holiday.
TABLE 8A 2013 MEMORIAL DAY FORECAST WEST NORTH CENTRAL REGION AND UNITED STATES
The WNC region continues to show all the signs of an improved labor market. The West North Central boasts the lowest unemployment rate among the nine census regions (5.4 percent) and that is substantially below the national average (7.7 percent). At the state level, North Dakota is leading the pack in terms of job growth. The Peace Garden State has the fastest-growing job market and the lowest unemployment rate in the country, fueled by the rapid expansion of its energy sector centered on activity in the Bakken shale. Minnesota ranks second in the region after North Dakota in terms of job creation, with every sector in the economy adding payrolls. In the middle of the pack are the stable economies of Iowa, South Dakota, and Kansas, where slow rates of population and labor force growth have been balanced by recent gains in farm income.
In some dimensions, the WNC economy is moving in step with the greater nation. Real gross state product across the region is forecast to grow 1.3 percent in the second quarter of 2013, which is slightly below the expected increase in national output (1.9 percent). Real disposable incomes in the WNC are also expected to rise at a similar, though slightly higher pace than the country at large this coming Memorial Day (1.7 percent compared to 1.2 percent nationally).
The housing market in the WNC is laggard in an otherwise upward
Memorial Day TravelYOY % Change Level
% of Population
YOY % Change Level
% of Population
Total (millions of person trips) -1.0% 2.97 14.2% -0.9% 34.82 11.0%Automobile (millions of person trips) 0.0% 2.65 12.7% 0.2% 31.15 9.8%Air (millions of person trips) -7.9% 0.12 0.6% -8.2% 2.32 0.7%
Economy (2013Q2)YOY % Change Level
YOY % Change Level
Unemployment Rate (YOY Change) -0.3% 5.4% -0.4% 7.7%Real Gross Product ($, bn)* 1.3% 878 1.9% 13,807Median Price, New Single Family Home ($, thn) -13.5% 200 1.1% 239
West North Central United States
-‐0.3%
1.3% 1.7%
-‐0.4%
1.9%1.1% 1.2%
-‐8%
-‐6%
-‐4%
-‐2%
0%
2%
4%
Unemployment Rate
Real Gross State Product
Median Price New Single Family Home
Real Disposable Personal Income
Chart 8AYOY Growth, 2012Q2 to 2013Q2
West North Central and United States
WNC Total US
Source: IHS Global Insight
-‐13.5%
23 IHS / AAA 2013 Memorial Day Forecast
trending regional economy. Unable to sustain the spike in home prices from this time last year, the median price of new single-family homes is forecast to decrease 13.5 percent in the second quarter of 2013, compared to year-ago levels. The price depreciation in the WNC region diverges from the upward trend seen in the national housing market, in which home prices are projected to grow 1.1 percent. The states in the WNC region saw home prices increase through the third quarter of 2012, but the market has since taken a downward turn. In South Dakota, median home prices are projected to be 17 percent lower in the second quarter of 2013 than they were one year ago.
Fuel prices in the region are higher than in January of this year but lower than they were in the second quarter of 2012. The decision to travel is unlikely to be influenced significantly by gas prices this year, but a price spike before the holiday weekend may encourage travelers to reallocate expenses to accommodate for an increase in fuel costs.
In addition to the originating travel forecast of person-trips from the West North Central region, the following information provides a look into the state of the local tourism industry in the region. In general, because the majority of travel occurs by automobile and remains within regional borders, regional travel ties closely with the output generated by that region's leisure and hospitality industry.
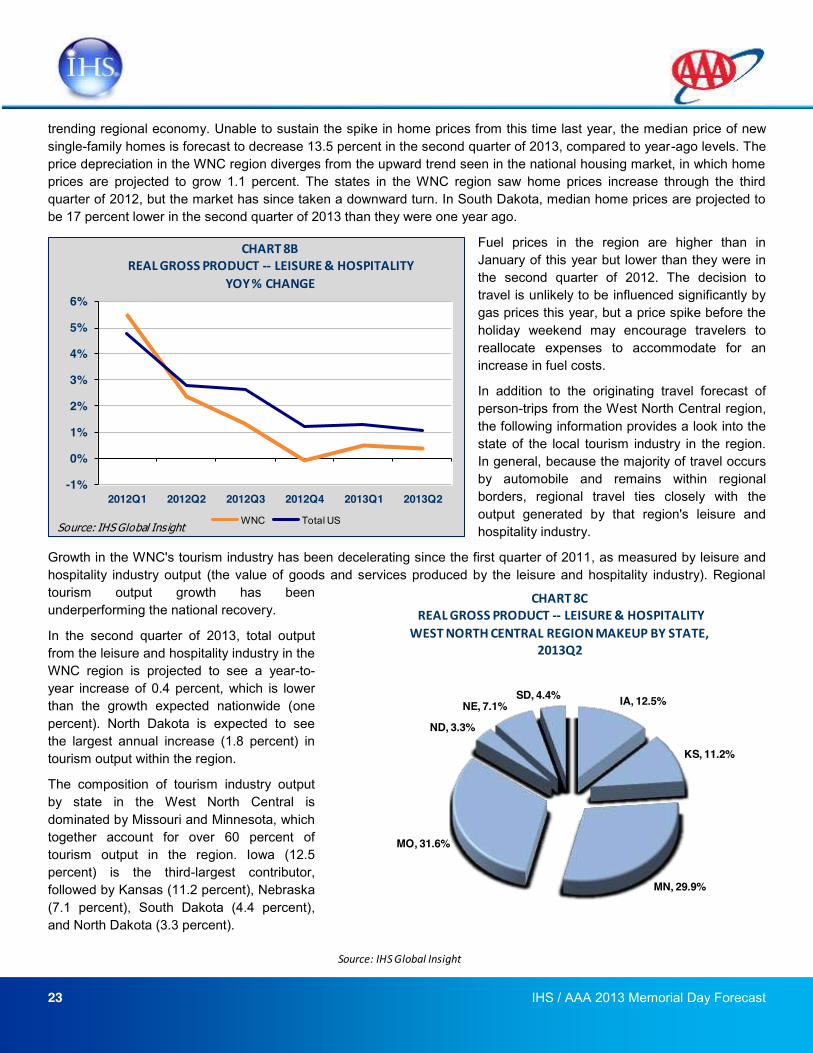
Growth in the WNC's tourism industry has been decelerating since the first quarter of 2011, as measured by leisure and hospitality industry output (the value of goods and services produced by the leisure and hospitality industry). Regional tourism output growth has been underperforming the national recovery.
In the second quarter of 2013, total output from the leisure and hospitality industry in the WNC region is projected to see a year-to-year increase of 0.4 percent, which is lower than the growth expected nationwide (one percent). North Dakota is expected to see the largest annual increase (1.8 percent) in tourism output within the region.
The composition of tourism industry output by state in the West North Central is dominated by Missouri and Minnesota, which together account for over 60 percent of tourism output in the region. Iowa (12.5 percent) is the third-largest contributor, followed by Kansas (11.2 percent), Nebraska (7.1 percent), South Dakota (4.4 percent), and North Dakota (3.3 percent).
-1%
0%
1%
2%
3%
4%
5%
6%
2012Q1 2012Q2 2012Q3 2012Q4 2013Q1 2013Q2
CHART 8BREAL GROSS PRODUCT -‐-‐ LEISURE & HOSPITALITY
YOY % CHANGE
WNC Total USSource: IHS Global Insight
IA, 12.5%
KS, 11.2%
MN, 29.9%
MO, 31.6%
ND, 3.3%
NE, 7.1%SD, 4.4%
CHART 8CREAL GROSS PRODUCT -‐-‐ LEISURE & HOSPITALITY
WEST NORTH CENTRAL REGION MAKEUP BY STATE, 2013Q2
Source: IHS Global Insight
24 IHS / AAA 2013 Memorial Day Forecast
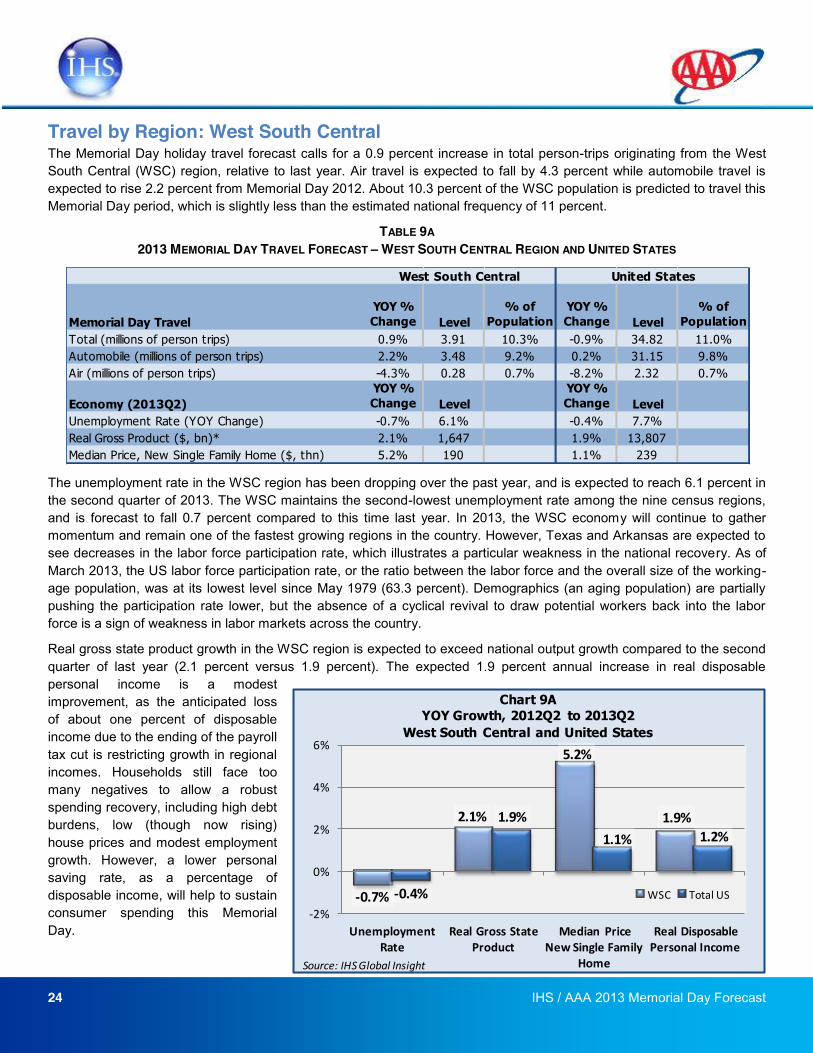
Travel by Region: West South Central The Memorial Day holiday travel forecast calls for a 0.9 percent increase in total person-trips originating from the West South Central (WSC) region, relative to last year. Air travel is expected to fall by 4.3 percent while automobile travel is expected to rise 2.2 percent from Memorial Day 2012. About 10.3 percent of the WSC population is predicted to travel this Memorial Day period, which is slightly less than the estimated national frequency of 11 percent.
TABLE 9A 2013 MEMORIAL DAY TRAVEL FORECAST WEST SOUTH CENTRAL REGION AND UNITED STATES
The unemployment rate in the WSC region has been dropping over the past year, and is expected to reach 6.1 percent in the second quarter of 2013. The WSC maintains the second-lowest unemployment rate among the nine census regions, and is forecast to fall 0.7 percent compared to this time last year. In 2013, the WSC economy will continue to gather momentum and remain one of the fastest growing regions in the country. However, Texas and Arkansas are expected to see decreases in the labor force participation rate, which illustrates a particular weakness in the national recovery. As of March 2013, the US labor force participation rate, or the ratio between the labor force and the overall size of the working-age population, was at its lowest level since May 1979 (63.3 percent). Demographics (an aging population) are partially pushing the participation rate lower, but the absence of a cyclical revival to draw potential workers back into the labor force is a sign of weakness in labor markets across the country.
Real gross state product growth in the WSC region is expected to exceed national output growth compared to the second quarter of last year (2.1 percent versus 1.9 percent). The expected 1.9 percent annual increase in real disposable personal income is a modest improvement, as the anticipated loss of about one percent of disposable income due to the ending of the payroll tax cut is restricting growth in regional incomes. Households still face too many negatives to allow a robust spending recovery, including high debt burdens, low (though now rising) house prices and modest employment growth. However, a lower personal saving rate, as a percentage of disposable income, will help to sustain consumer spending this Memorial Day.
Memorial Day TravelYOY % Change Level
% of Population
YOY % Change Level
% of Population
Total (millions of person trips) 0.9% 3.91 10.3% -0.9% 34.82 11.0%Automobile (millions of person trips) 2.2% 3.48 9.2% 0.2% 31.15 9.8%Air (millions of person trips) -4.3% 0.28 0.7% -8.2% 2.32 0.7%
Economy (2013Q2)YOY % Change Level
YOY % Change Level
Unemployment Rate (YOY Change) -0.7% 6.1% -0.4% 7.7%Real Gross Product ($, bn)* 2.1% 1,647 1.9% 13,807Median Price, New Single Family Home ($, thn) 5.2% 190 1.1% 239
West South Central United States
-‐0.7%
2.1%
5.2%
1.9%
-‐0.4%
1.9%1.1% 1.2%
-‐2%
0%
2%
4%
6%
Unemployment Rate
Real Gross State Product
Median Price New Single Family
Home
Real Disposable Personal Income
Chart 9AYOY Growth, 2012Q2 to 2013Q2
West South Central and United States
WSC Total US
Source: IHS Global Insight
25 IHS / AAA 2013 Memorial Day Forecast
The WSC housing market is beginning to turn around, as the median price of new single-family homes is projected to rise 5.2 percent from the second quarter of 2012. Of the four contributing states, Oklahoma is expected to see the largest increase in second-quarter prices (six percent), followed by Louisiana (5.8 percent), Texas (5.3 percent), and Arkansas (1.4 percent). Housing starts and sales of existing homes are also above year-ago levels in each of the WSC states. Homebuilders continue to break ground on more homes as household formation rates begin to pick up, while some of the excess existing supply is being gobbled up by investors and conventional homebuyers. Low interest rates will keep housing very affordable by historical standards, which should continue to boost home sales and new construction.
The price of gasoline is expected to have little effect on holiday travel from the WSC region this Memorial Day. April gas prices are down from a year ago. Any price increase that comes shortly before the holiday is unlikely to impact travel decisions, though it may compel travelers to reallocate their travel budgets to account for higher fuel prices.
In addition to the originating travel forecast of person-trips from the West South Central region, the following information provides a look into the state of the local tourism industry in the region. In general, because the majority of travel occurs by automobile and remains within regional borders, regional travel ties closely with the output generated by that region's leisure and hospitality industry.
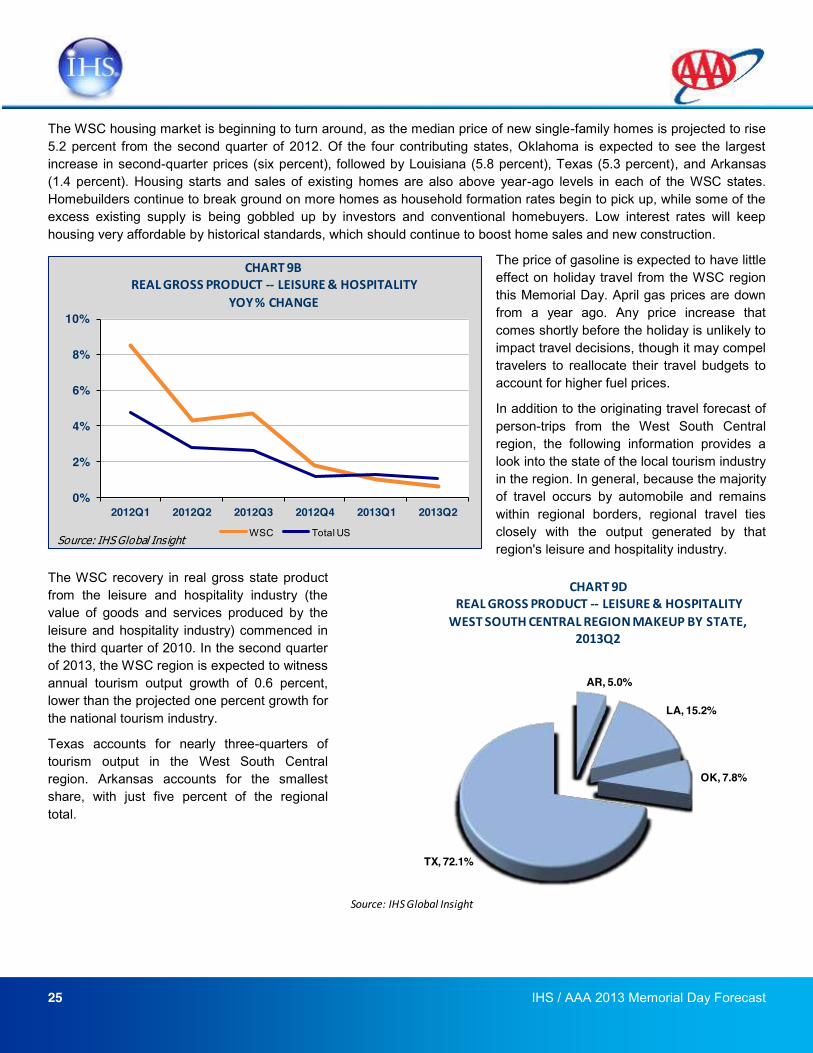
The WSC recovery in real gross state product from the leisure and hospitality industry (the value of goods and services produced by the leisure and hospitality industry) commenced in the third quarter of 2010. In the second quarter of 2013, the WSC region is expected to witness annual tourism output growth of 0.6 percent, lower than the projected one percent growth for the national tourism industry.
Texas accounts for nearly three-quarters of tourism output in the West South Central region. Arkansas accounts for the smallest share, with just five percent of the regional total.
0%
2%
4%
6%
8%
10%
2012Q1 2012Q2 2012Q3 2012Q4 2013Q1 2013Q2
CHART 9BREAL GROSS PRODUCT -‐-‐ LEISURE & HOSPITALITY
YOY % CHANGE
WSC Total USSource: IHS Global Insight
AR, 5.0%
LA, 15.2%
OK, 7.8%
TX, 72.1%
CHART 9DREAL GROSS PRODUCT -‐-‐ LEISURE & HOSPITALITYWEST SOUTH CENTRAL REGION MAKEUP BY STATE,
2013Q2
Source: IHS Global Insight
26 IHS / AAA 2013 Memorial Day Forecast
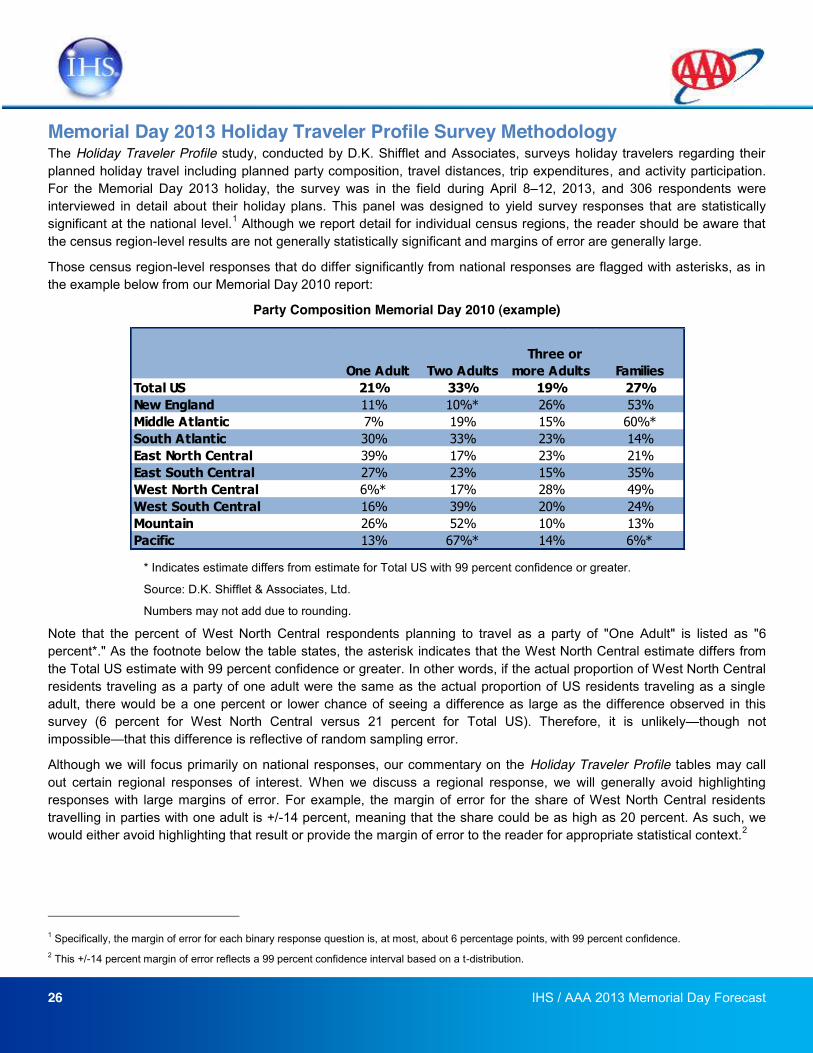
Memorial Day 2013 Holiday Traveler Profile Survey Methodology The Holiday Traveler Profile study, conducted by D.K. Shifflet and Associates, surveys holiday travelers regarding their planned holiday travel including planned party composition, travel distances, trip expenditures, and activity participation. For the Memorial Day 2013 holiday, the survey was in the field during April 8 12, 2013, and 306 respondents were interviewed in detail about their holiday plans. This panel was designed to yield survey responses that are statistically significant at the national level.1 Although we report detail for individual census regions, the reader should be aware that the census region-level results are not generally statistically significant and margins of error are generally large.
Those census region-level responses that do differ significantly from national responses are flagged with asterisks, as in the example below from our Memorial Day 2010 report:
Party Composition Memorial Day 2010 (example)
* Indicates estimate differs from estimate for Total US with 99 percent confidence or greater.
Source: D.K. Shifflet & Associates, Ltd.
Numbers may not add due to rounding.
Note that the percent of West North Central respondents planning to travel as a party of "One Adult" is listed as "6 percent*." As the footnote below the table states, the asterisk indicates that the West North Central estimate differs from the Total US estimate with 99 percent confidence or greater. In other words, if the actual proportion of West North Central residents traveling as a party of one adult were the same as the actual proportion of US residents traveling as a single adult, there would be a one percent or lower chance of seeing a difference as large as the difference observed in this survey (6 percent for West North Central versus 21 percent for Total US). Therefore, it is unlikely though not impossible that this difference is reflective of random sampling error.
Although we will focus primarily on national responses, our commentary on the Holiday Traveler Profile tables may call out certain regional responses of interest. When we discuss a regional response, we will generally avoid highlighting responses with large margins of error. For example, the margin of error for the share of West North Central residents travelling in parties with one adult is +/-14 percent, meaning that the share could be as high as 20 percent. As such, we would either avoid highlighting that result or provide the margin of error to the reader for appropriate statistical context.2
1 Specifically, the margin of error for each binary response question is, at most, about 6 percentage points, with 99 percent confidence. 2 This +/-14 percent margin of error reflects a 99 percent confidence interval based on a t-distribution.
One Adult Two Adults Three or more Adults Families
Total US 21% 33% 19% 27%New England 11% 10%* 26% 53%Middle Atlantic 7% 19% 15% 60%*South Atlantic 30% 33% 23% 14%East North Central 39% 17% 23% 21%East South Central 27% 23% 15% 35%West North Central 6%* 17% 28% 49%West South Central 16% 39% 20% 24%Mountain 26% 52% 10% 13%Pacific 13% 67%* 14% 6%*
27 IHS / AAA 2013 Memorial Day Forecast
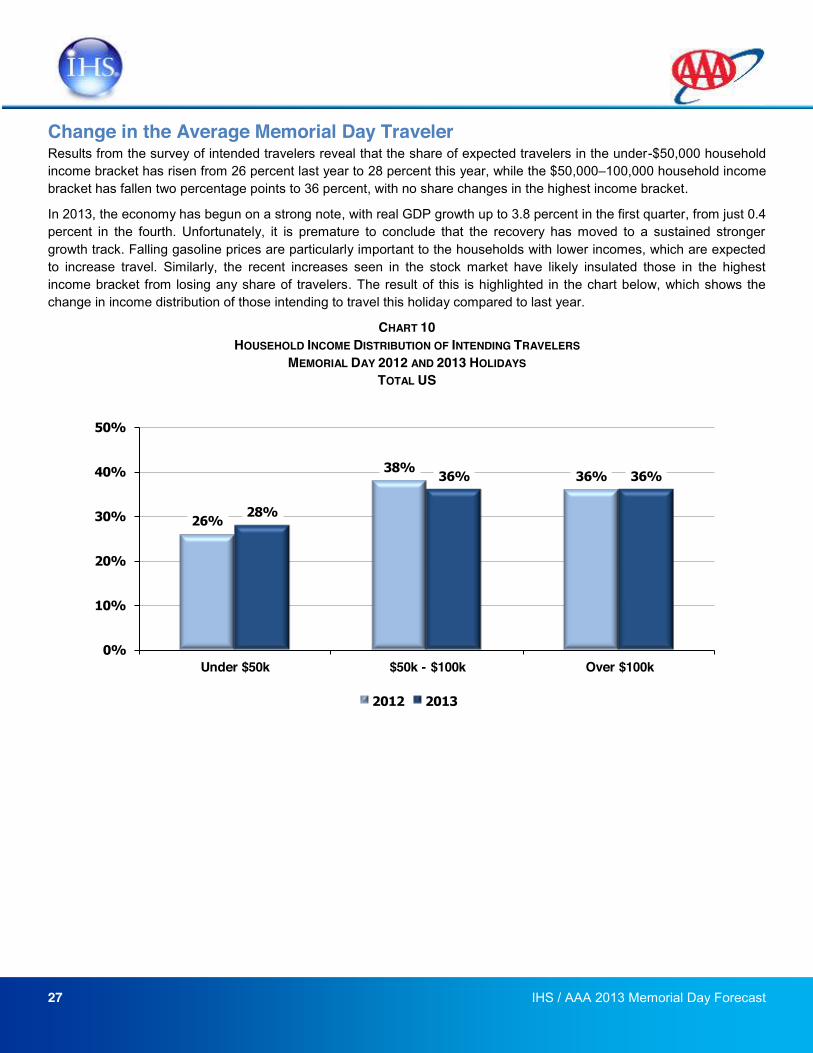
Change in the Average Memorial Day Traveler Results from the survey of intended travelers reveal that the share of expected travelers in the under-$50,000 household income bracket has risen from 26 percent last year to 28 percent this year, while the $50,000 100,000 household income bracket has fallen two percentage points to 36 percent, with no share changes in the highest income bracket.
In 2013, the economy has begun on a strong note, with real GDP growth up to 3.8 percent in the first quarter, from just 0.4 percent in the fourth. Unfortunately, it is premature to conclude that the recovery has moved to a sustained stronger growth track. Falling gasoline prices are particularly important to the households with lower incomes, which are expected to increase travel. Similarly, the recent increases seen in the stock market have likely insulated those in the highest income bracket from losing any share of travelers. The result of this is highlighted in the chart below, which shows the change in income distribution of those intending to travel this holiday compared to last year.
CHART 10 HOUSEHOLD INCOME DISTRIBUTION OF INTENDING TRAVELERS
MEMORIAL DAY 2012 AND 2013 HOLIDAYS TOTAL US
26%
38%36%
28%
36% 36%
0%
10%
20%
30%
40%
50%
Under $50k $50k - $100k Over $100k
2012 2013
28 IHS / AAA 2013 Memorial Day Forecast
Going on a longer trip to visit family/friends at the
Grand Canyon." ENC Respondent
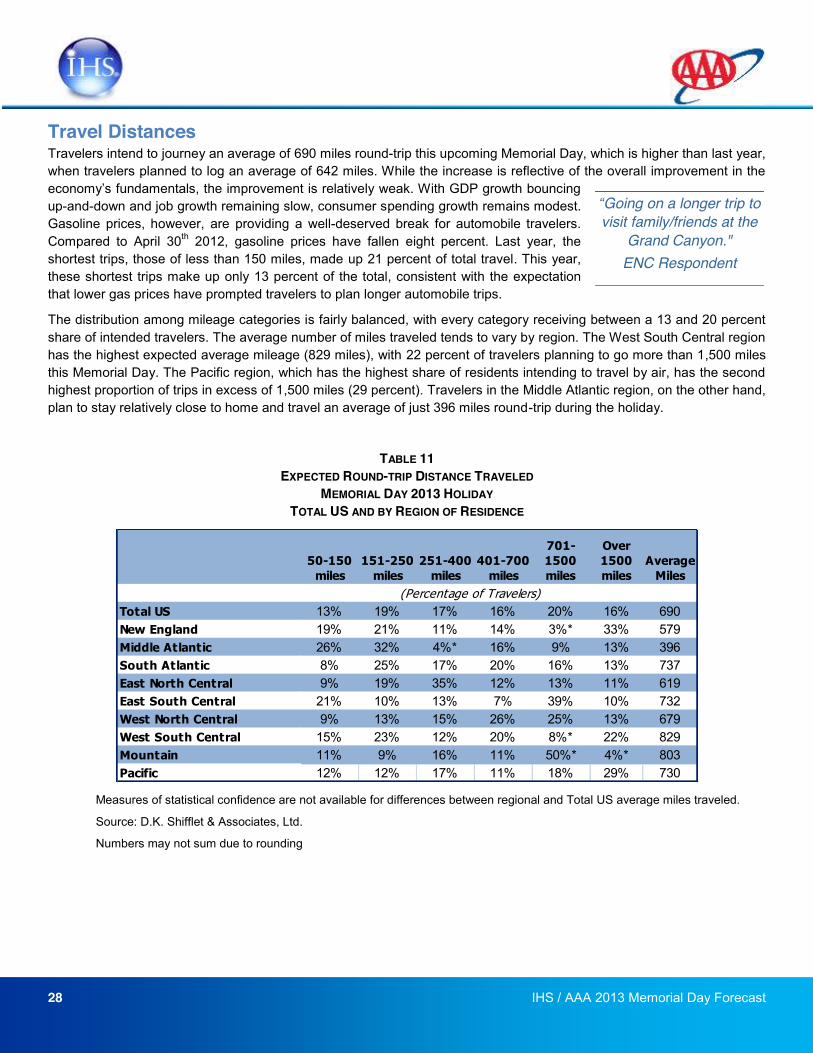
Travel Distances Travelers intend to journey an average of 690 miles round-trip this upcoming Memorial Day, which is higher than last year, when travelers planned to log an average of 642 miles. While the increase is reflective of the overall improvement in the
up-and-down and job growth remaining slow, consumer spending growth remains modest. Gasoline prices, however, are providing a well-deserved break for automobile travelers. Compared to April 30th 2012, gasoline prices have fallen eight percent. Last year, the shortest trips, those of less than 150 miles, made up 21 percent of total travel. This year, these shortest trips make up only 13 percent of the total, consistent with the expectation that lower gas prices have prompted travelers to plan longer automobile trips.
The distribution among mileage categories is fairly balanced, with every category receiving between a 13 and 20 percent share of intended travelers. The average number of miles traveled tends to vary by region. The West South Central region has the highest expected average mileage (829 miles), with 22 percent of travelers planning to go more than 1,500 miles this Memorial Day. The Pacific region, which has the highest share of residents intending to travel by air, has the second highest proportion of trips in excess of 1,500 miles (29 percent). Travelers in the Middle Atlantic region, on the other hand, plan to stay relatively close to home and travel an average of just 396 miles round-trip during the holiday.
TABLE 11 EXPECTED ROUND-TRIP DISTANCE TRAVELED
MEMORIAL DAY 2013 HOLIDAY TOTAL US AND BY REGION OF RESIDENCE
Measures of statistical confidence are not available for differences between regional and Total US average miles traveled.
Source: D.K. Shifflet & Associates, Ltd.
Numbers may not sum due to rounding
50-150 miles
151-250 miles
251-400 miles
401-700 miles
701-1500 miles
Over 1500 miles
Average Miles
Total US 13% 19% 17% 16% 20% 16% 690New England 19% 21% 11% 14% 3%* 33% 579Middle Atlantic 26% 32% 4%* 16% 9% 13% 396South Atlantic 8% 25% 17% 20% 16% 13% 737East North Central 9% 19% 35% 12% 13% 11% 619East South Central 21% 10% 13% 7% 39% 10% 732West North Central 9% 13% 15% 26% 25% 13% 679West South Central 15% 23% 12% 20% 8%* 22% 829Mountain 11% 9% 16% 11% 50%* 4%* 803Pacific 12% 12% 17% 11% 18% 29% 730
(Percentage of Travelers)
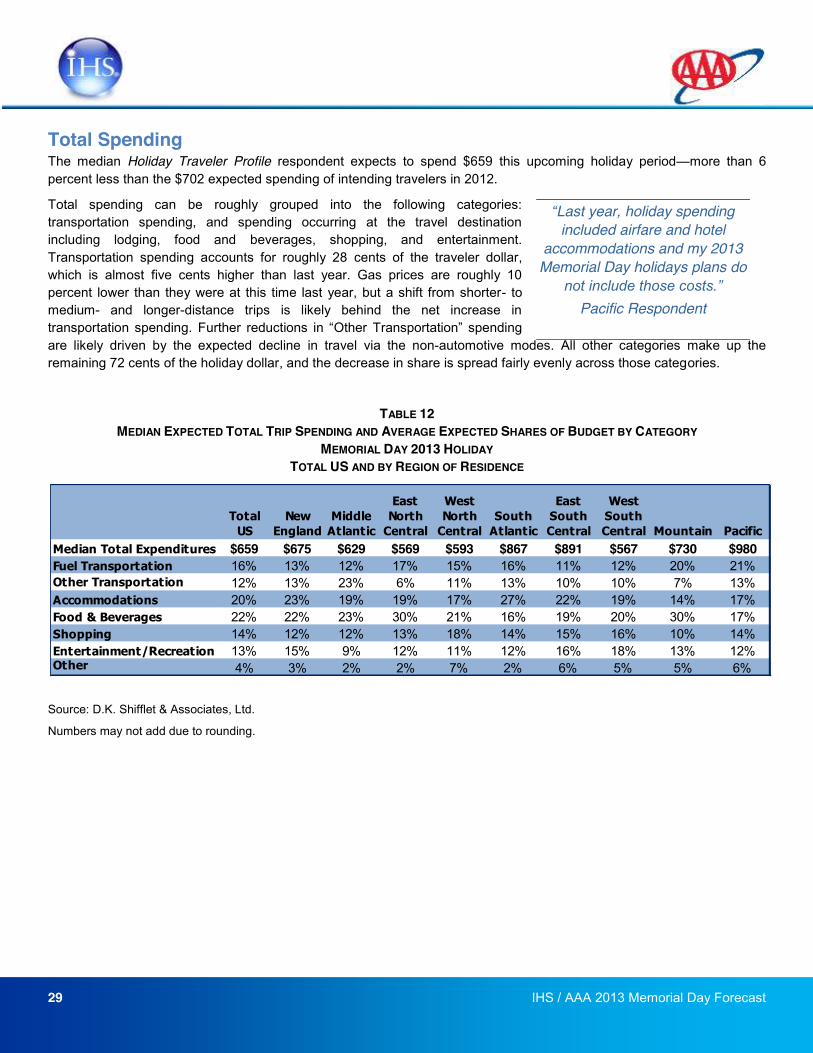
29 IHS / AAA 2013 Memorial Day Forecast
Last year, holiday spending included airfare and hotel
accommodations and my 2013 Memorial Day holidays plans do
Pacific Respondent
Total Spending The median Holiday Traveler Profile respondent expects to spend $659 this upcoming holiday period more than 6 percent less than the $702 expected spending of intending travelers in 2012.
Total spending can be roughly grouped into the following categories: transportation spending, and spending occurring at the travel destination including lodging, food and beverages, shopping, and entertainment. Transportation spending accounts for roughly 28 cents of the traveler dollar, which is almost five cents higher than last year. Gas prices are roughly 10 percent lower than they were at this time last year, but a shift from shorter- to medium- and longer-distance trips is likely behind the net increase in transportation spending. Fare likely driven by the expected decline in travel via the non-automotive modes. All other categories make up the remaining 72 cents of the holiday dollar, and the decrease in share is spread fairly evenly across those categories.
TABLE 12 MEDIAN EXPECTED TOTAL TRIP SPENDING AND AVERAGE EXPECTED SHARES OF BUDGET BY CATEGORY
MEMORIAL DAY 2013 HOLIDAY TOTAL US AND BY REGION OF RESIDENCE
Source: D.K. Shifflet & Associates, Ltd.
Numbers may not add due to rounding.
Total US
New England
Middle Atlantic
East North Central
West North Central
South Atlantic
East South Central
West South Central Mountain Pacific
Median Total Expenditures $659 $675 $629 $569 $593 $867 $891 $567 $730 $980 Fuel Transportation 16% 13% 12% 17% 15% 16% 11% 12% 20% 21%Other Transportation Spending
12% 13% 23% 6% 11% 13% 10% 10% 7% 13%Accommodations 20% 23% 19% 19% 17% 27% 22% 19% 14% 17%Food & Beverages 22% 22% 23% 30% 21% 16% 19% 20% 30% 17%Shopping 14% 12% 12% 13% 18% 14% 15% 16% 10% 14%Entertainment/Recreation 13% 15% 9% 12% 11% 12% 16% 18% 13% 12%Other 4% 3% 2% 2% 7% 2% 6% 5% 5% 6%
30 IHS / AAA 2013 Memorial Day Forecast
Chart 12 illustrates the average expected shares of budget by category for 2013. Chart 13 shows the change in expected budget distribution from Memorial Day 2012 to Memorial Day 2013.
CHART 11 US MEMORIAL DAY 2013 HOLIDAY SPENDING
DISTRIBUTION BY CATEGORY
Source: D.K. Shifflet & Associates, Ltd.
CHART 12 TOTAL US MEMORIAL DAY HOLIDAY SPENDING
CHANGE IN BUDGET SHARE FROM 2012 TO 2013
Source: D.K. Shifflet & Associates, Ltd.
Fuel16%
Other Transp.12%
Lodging20%
Food & Bev.22%
Shopping 14%
Ent/Rec13% Other
4%
4.2%
0.6%
-0.4%-1.0%
-0.6%
-1.5% -1.3%-‐2%
0%
2%
4%
6%
Fuel Other Transp.
Lodging Food & Bev.
Shopping Ent/Rec Other
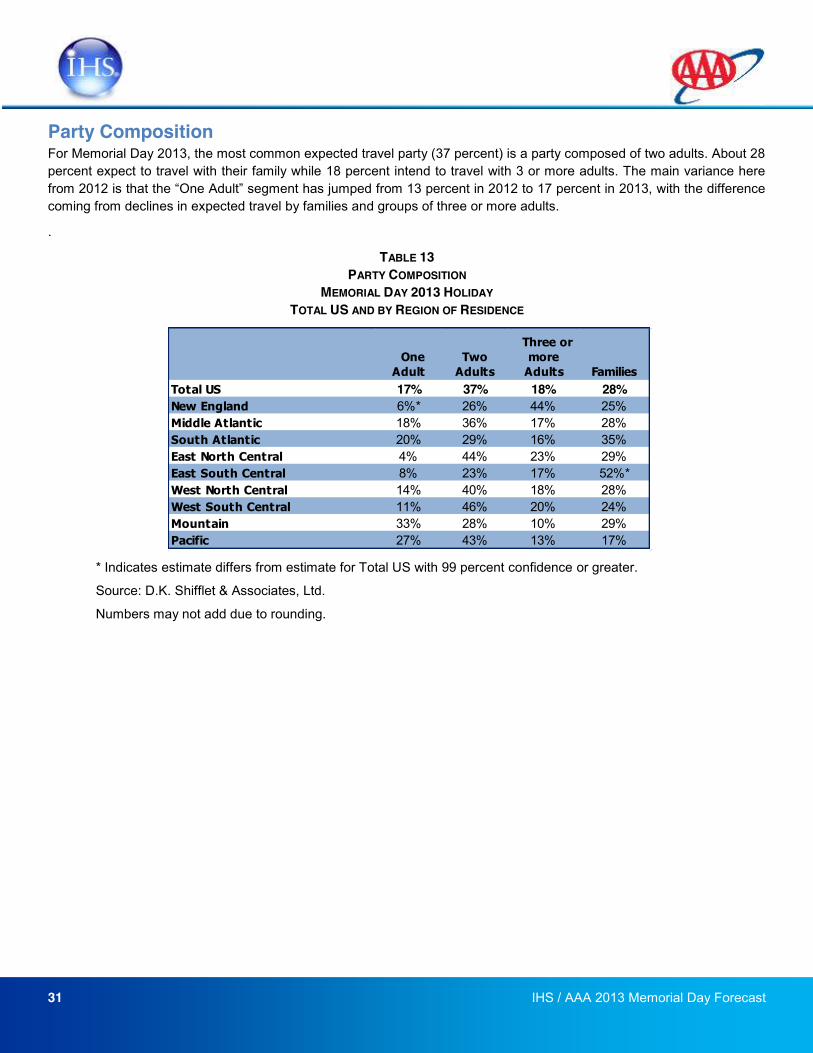
31 IHS / AAA 2013 Memorial Day Forecast
Party Composition For Memorial Day 2013, the most common expected travel party (37 percent) is a party composed of two adults. About 28 percent expect to travel with their family while 18 percent intend to travel with 3 or more adults. The main variance here from 2012 is thcoming from declines in expected travel by families and groups of three or more adults.
.
TABLE 13 PARTY COMPOSITION
MEMORIAL DAY 2013 HOLIDAY TOTAL US AND BY REGION OF RESIDENCE
* Indicates estimate differs from estimate for Total US with 99 percent confidence or greater.
Source: D.K. Shifflet & Associates, Ltd.
Numbers may not add due to rounding.
One Adult
Two Adults
Three or more Adults Families
Total US 17% 37% 18% 28%New England 6%* 26% 44% 25%Middle Atlantic 18% 36% 17% 28%South Atlantic 20% 29% 16% 35%East North Central 4% 44% 23% 29%East South Central 8% 23% 17% 52%*West North Central 14% 40% 18% 28%West South Central 11% 46% 20% 24%Mountain 33% 28% 10% 29%Pacific 27% 43% 13% 17%
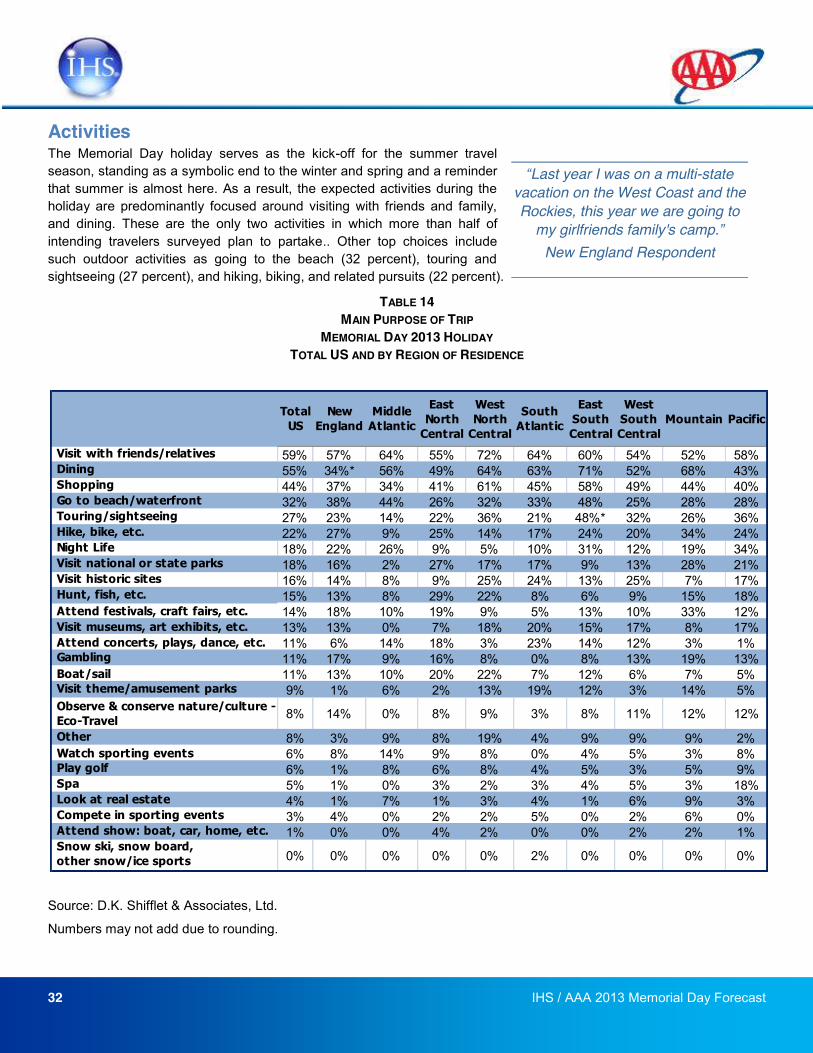
32 IHS / AAA 2013 Memorial Day Forecast
Last year I was on a multi-state vacation on the West Coast and the Rockies, this year we are going to
my girlfriends family's camp. New England Respondent
Activities The Memorial Day holiday serves as the kick-off for the summer travel season, standing as a symbolic end to the winter and spring and a reminder that summer is almost here. As a result, the expected activities during the holiday are predominantly focused around visiting with friends and family, and dining. These are the only two activities in which more than half of intending travelers surveyed plan to partake.. Other top choices include such outdoor activities as going to the beach (32 percent), touring and sightseeing (27 percent), and hiking, biking, and related pursuits (22 percent).
TABLE 14 MAIN PURPOSE OF TRIP
MEMORIAL DAY 2013 HOLIDAY TOTAL US AND BY REGION OF RESIDENCE
Source: D.K. Shifflet & Associates, Ltd.
Numbers may not add due to rounding.
Total US
New England
Middle Atlantic
East North Central
West North Central
South Atlantic
East South Central
West South Central
Mountain Pacific
Visit with friends/relatives 59% 57% 64% 55% 72% 64% 60% 54% 52% 58% Dining 55% 34%* 56% 49% 64% 63% 71% 52% 68% 43% Shopping 44% 37% 34% 41% 61% 45% 58% 49% 44% 40% Go to beach/waterfront 32% 38% 44% 26% 32% 33% 48% 25% 28% 28% Touring/sightseeing 27% 23% 14% 22% 36% 21% 48%* 32% 26% 36% Hike, bike, etc. 22% 27% 9% 25% 14% 17% 24% 20% 34% 24% Night Life 18% 22% 26% 9% 5% 10% 31% 12% 19% 34% Visit national or state parks 18% 16% 2% 27% 17% 17% 9% 13% 28% 21% Visit historic sites 16% 14% 8% 9% 25% 24% 13% 25% 7% 17% Hunt, fish, etc. 15% 13% 8% 29% 22% 8% 6% 9% 15% 18% Attend festivals, craft fairs, etc. 14% 18% 10% 19% 9% 5% 13% 10% 33% 12% Visit museums, art exhibits, etc. 13% 13% 0% 7% 18% 20% 15% 17% 8% 17% Attend concerts, plays, dance, etc. 11% 6% 14% 18% 3% 23% 14% 12% 3% 1% Gambling 11% 17% 9% 16% 8% 0% 8% 13% 19% 13% Boat/sail 11% 13% 10% 20% 22% 7% 12% 6% 7% 5% Visit theme/amusement parks 9% 1% 6% 2% 13% 19% 12% 3% 14% 5% Observe & conserve nature/culture - Eco-Travel 8% 14% 0% 8% 9% 3% 8% 11% 12% 12%
Other 8% 3% 9% 8% 19% 4% 9% 9% 9% 2% Watch sporting events 6% 8% 14% 9% 8% 0% 4% 5% 3% 8% Play golf 6% 1% 8% 6% 8% 4% 5% 3% 5% 9% Spa 5% 1% 0% 3% 2% 3% 4% 5% 3% 18% Look at real estate 4% 1% 7% 1% 3% 4% 1% 6% 9% 3% Compete in sporting events 3% 4% 0% 2% 2% 5% 0% 2% 6% 0% Attend show: boat, car, home, etc. 1% 0% 0% 4% 2% 0% 0% 2% 2% 1% Snow ski, snow board, other snow/ice sports 0% 0% 0% 0% 0% 2% 0% 0% 0% 0%
33 IHS / AAA 2013 Memorial Day Forecast
sportation spending, there were no major shifts in the distribution among spending categories. As such, it is not surprising that the mix of expected activities does not show a dramatic change from last year. However, one change of note is the increase in expected travelers who intend to dine out and shop. While these two activities maintain their second- and third-place rankings from last year, the proportion of travelers who include shopping and dining as primary activities in their travel plans has increased by 2 and 5 percentage points, respectively.
TABLE 15 VARIANCE IN EXPECTED PRIMARY ACTIVITIES
MEMORIAL DAY 2012 HOLIDAY COMPARED TO MEMORIAL DAY 2013 HOLIDAY
Expected Primary Activities 2013 2012 Variance Visit with friends/relatives 59% 59% 0% Dining 55% 53% 2% Shopping 44% 39% 5% Go to beach/waterfront 32% 36% -4% Touring/sightseeing 27% 32% -5% Hike, bike, etc. 22% 18% 4% Night Life 18% 26% -8% Visit national or state parks 18% 20% -2% Visit historic sites 16% 20% -4% Hunt, fish, etc. 15% 11% 4% Attend festivals, craft fairs, etc. 14% 18% -4% Visit museums, art exhibits, etc. 13% 20% -7% Attend concerts, plays, dance, etc. 11% 11% 0% Gambling 11% 11% 0% Boat/sail 11% 13% -2% Visit theme/amusement parks 9% 10% -1% Observe & conserve nature/culture - Eco-Travel 8% 8% 0%
Other 8% 7% 1% Watch sporting events 6% 13% -7% Play golf 6% 10% -4% Spa 5% 10% -5% Look at real estate 4% 2% 2% Compete in sporting events 3% 1% 2% Attend show: boat, car, home, etc. 1% 1% 0% Snow ski, snow board, other snow/ice sports 0% 0% 0%
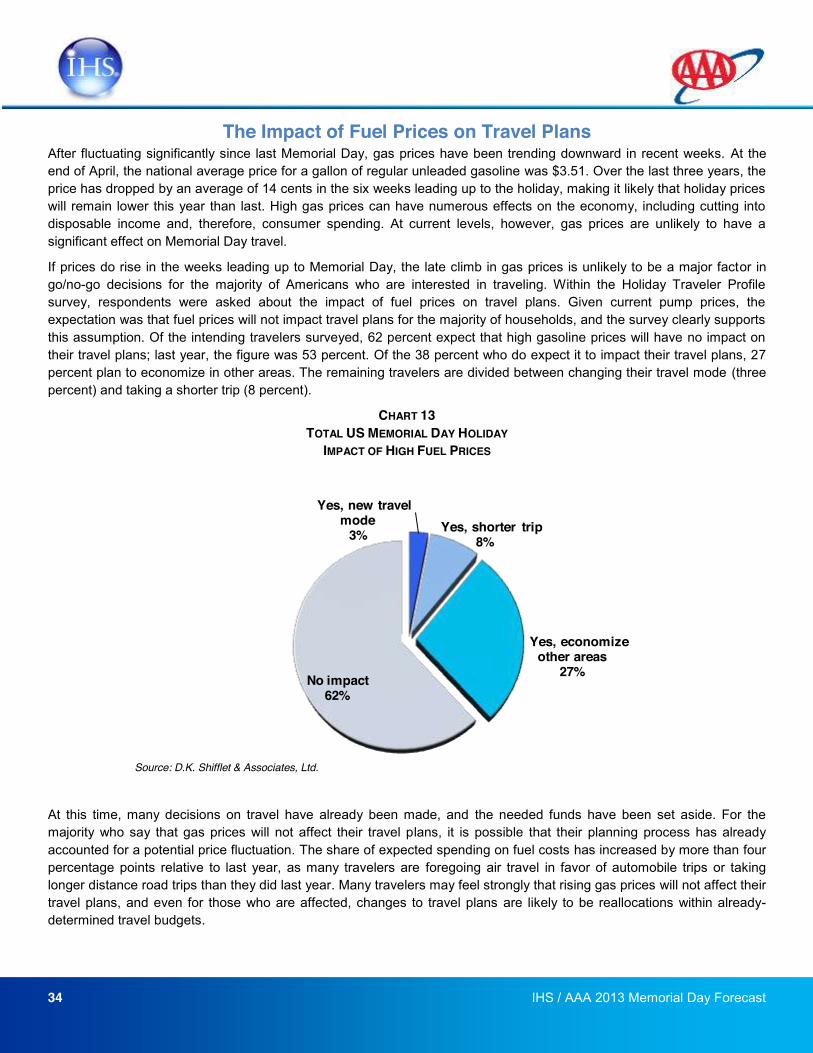
34 IHS / AAA 2013 Memorial Day Forecast
The Impact of Fuel Prices on Travel Plans After fluctuating significantly since last Memorial Day, gas prices have been trending downward in recent weeks. At the end of April, the national average price for a gallon of regular unleaded gasoline was $3.51. Over the last three years, the price has dropped by an average of 14 cents in the six weeks leading up to the holiday, making it likely that holiday prices will remain lower this year than last. High gas prices can have numerous effects on the economy, including cutting into disposable income and, therefore, consumer spending. At current levels, however, gas prices are unlikely to have a significant effect on Memorial Day travel.
If prices do rise in the weeks leading up to Memorial Day, the late climb in gas prices is unlikely to be a major factor in go/no-go decisions for the majority of Americans who are interested in traveling. Within the Holiday Traveler Profile survey, respondents were asked about the impact of fuel prices on travel plans. Given current pump prices, the expectation was that fuel prices will not impact travel plans for the majority of households, and the survey clearly supports this assumption. Of the intending travelers surveyed, 62 percent expect that high gasoline prices will have no impact on their travel plans; last year, the figure was 53 percent. Of the 38 percent who do expect it to impact their travel plans, 27 percent plan to economize in other areas. The remaining travelers are divided between changing their travel mode (three percent) and taking a shorter trip (8 percent).
CHART 13 TOTAL US MEMORIAL DAY HOLIDAY
IMPACT OF HIGH FUEL PRICES
At this time, many decisions on travel have already been made, and the needed funds have been set aside. For the majority who say that gas prices will not affect their travel plans, it is possible that their planning process has already accounted for a potential price fluctuation. The share of expected spending on fuel costs has increased by more than four percentage points relative to last year, as many travelers are foregoing air travel in favor of automobile trips or taking longer distance road trips than they did last year. Many travelers may feel strongly that rising gas prices will not affect their travel plans, and even for those who are affected, changes to travel plans are likely to be reallocations within already-determined travel budgets.
Yes, new travel mode
3% Yes, shorter trip8%
Yes, economize other areas
27%No impact62%
Source: D.K. Shifflet & Associates, Ltd.
35 IHS / AAA 2013 Memorial Day Forecast
Addendum 1: US Economic Forecast Summary: Published 4/4/2013
Ups and downs continue The economy has begun 2013 on a strong note, with real GDP growth now expected to bounce up to 3.8% in the first quarter, from just 0.4% in the fourth. Unfortunately, it is premature to conclude that the recovery has moved to a sustained stronger growth track. A swing in inventory accumulation from a big drag in the fourth quarter to a big plus in the first quarter accounts for most of the swing in GDP growth. In the second quarter, inventory accumulation will probably slow and become a drag once again. In addition, the sequester will be taking effect, pulling down government spending. As a result, we see no immediate end to the up-and-down pattern of GDP growth, and expect the second quarter to register a meager 0.4% growth rate.
We now assume that the sequester will continue through the end of the third quarter rather than through the end of the second, as we assumed last month and as a result have cut our third-quarter growth rate from 3.2% to 1.8%. Growth then bounces back above 3% in the fourth quarter, after the assumed end to the sequester. Despite the longer sequester, the stronger-than-expected start to the year still leaves the calendar-year 2013 growth rate higher than our previous forecast. We now project 2013 GDP growth at 2.0%, compared with 1.8% in our March forecast. We have shaved our projected 2014 growth rate from 2.9% to 2.8%.
The stream of upbeat news on the economy has been interrupted, at least temporarily, consistent with the view that growth will slow in the second quarter. The two ISM indexes both showed slower growth in March than in February, and the March employment report came in much weaker than expected, with only 88,000 jobs added, and the unemployment rate dropping 0.1 percentage point to 7.6% only because the labor force plunged by 496,000. The housing market news remains very encouraging, though, across all dimensions home sales, housing starts, and house prices and housing should continue to make a strong contribution to growth. The housing recovery is the main reason that we expect growth to improve to around 3% not just for one quarter, but on a sustained basis after the sequester's effects unwind.
The sequester has become entrenched, at least for the rest of the fiscal year. The continuing resolution to keep the government funded through the end of the fiscal year passed with little fuss at the end of March, leaving the sequester in place. There is general agreement that the sequester is a bad thing, but the crucial disagreement is whether extra revenues should be part of any replacement deal Democrats say yes, Republicans say no. If the sequester is to end soon, it will require some evidence of severe public discomfort from its effects (not yet seen) to turn up the heat in Washington and produce a compromise.
The next key deadline will probably not arrive until August, when the debt ceiling will once again become binding. The new fiscal year will be approaching, as well. If a deal can be done, this would be the time, replacing the sequester's crude spending cuts with better-targeted cuts spread over many years including to entitlement programs and with extra revenues from limits on tax expenditures.
Our baseline forecast assumes that such a package is agreed in time to end the sequester at the beginning of the new fiscal year in October. Under our assumptions, the sequester delivers $44 billion in actual spending cuts in fiscal 2013 and $57 billion in calendar 2013, and cuts 0.4% off the calendar-year GDP growth rate for 2013.
The housing recovery continues to gather momentum. Household formation is reviving, and the recovery in demand is spreading from rental units to the owner-occupied sector. For 2012 overall, housing starts rose 28%, albeit from a low base (782,000 units, compared with 612,000 in 2011). We expect starts to improve another 24% in 2013, to 970,000, and
36 IHS / AAA 2013 Memorial Day Forecast
then by 30% in 2014, to 1.27 million. House prices are also reviving. We expect a 6.5% house-price increase in 2013 to follow a 5.5% increase in 2012, as measured by the FHFA purchase-only index, fourth quarter to fourth quarter.
The housing recovery is supporting consumer spending (through its effect on wealth and on housing-related purchases), and is probably one of the reasons why consumer spending growth is heading for 3.3% in the first quarter despite the drag from the loss of the payroll tax cut. We doubt that this pace can be maintained, though, since it would be far ahead of the 1.2% growth rate that we expect for real disposable incomes this year. Households still face too many negatives to allow a robust consumer spending recovery a loss of about 1% of disposable income due to the ending of the payroll tax cut, high (though falling) debt burdens, low (though now rising) house prices, modest employment growth, and a lack of confidence in the government's ability to make things better. Overall, we expect consumer spending to rise 2.2% in 2013, slightly better than 2012 (1.9%), and to strengthen to 2.5% growth in 2014. Light-vehicle sales are the brightest spot, as pent-up demand is coming through, and we have nudged higher our sales forecast for 2013 to 15.3 million (from 15.2 million), up from 14.4 million in 2012.
Capital equipment should remain an important driver of GDP growth. After a dip in mid-2012, capital goods orders have revived strongly. Business equipment and software spending bounced up at an 11.8% pace in the fourth quarter (led by aircraft). The fourth-quarter bounce may have been exaggerated by the anticipated expiry of bonus depreciation, and we expect spending growth to slow to 4.3% in the first quarter, before accelerating again in the second quarter. On a calendar-year basis, we expect spending growth of 6.5% in 2013, similar to the 6.9% growth rate in 2012.
On the business structures side, spending on buildings is improving, although at an uneven pace. We expect spending to rise 3.2% in 2013, down from 10.7% growth in 2012. Oil and gas drilling activity surprisingly rose in the third and fourth quarters, despite a retreat in natural gas drilling in the face of low prices. Overall drilling rose 5.7% in 2012, but we expect only a 0.8% increase in 2013.
In the state and local government sector, the pace of budget tightening has eased slightly as revenues have begun to improve, but municipalities remain under severe pressure, and the sequester will cut federal grants. We expect real state and local government spending to decline 0.8% in calendar 2013, after dropping 1.4% in calendar 2012.
The federal budget deficit in fiscal 2012 narrowed to $1.1 trillion (7.0% of GDP), from $1.3 trillion in fiscal 2011 (8.7% of GDP). Fiscal policy is tightening, as stimulus fades away and spending cuts and tax increases take effect. We expect the deficit to decline further to $868 billion in fiscal 2013 (5.4% of GDP).
Slower growth around the world has created a headwind for US export growth. Exports fell sharply in the fourth quarter, but we think that paints an unduly pessimistic picture. We expect modest export growth during 2013, at 2.6%, down slightly from 3.4% in 2012. We expect the dollar to strengthen against the euro over the rest of 2013 as the Eurozone recession lingers. We foresee a downward trend against emerging-market currencies, dictated by the pace at which China allows the renminbi to appreciate. The overall current-account deficit should shrink to 2.7% of GDP in 2013, from 3.0% in 2012, due to a smaller bill for imported oil.
Inflation remains a nonissue. We expect lower oil prices to pull headline CPI inflation down to 1.4% in 2013, from 2.1% in 2012. Moreover, in the face of sluggish demand growth, we expect core inflation to continue to ease gradually through mid-2013.
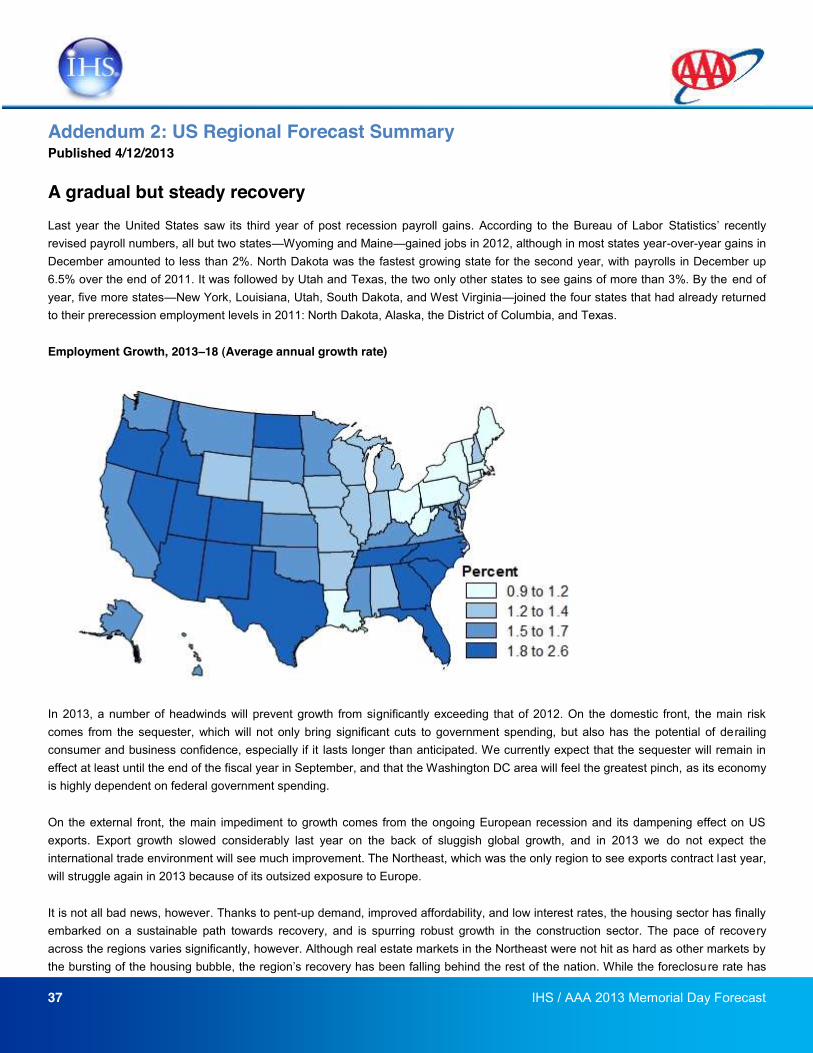
37 IHS / AAA 2013 Memorial Day Forecast
Addendum 2: US Regional Forecast Summary Published 4/12/2013
A gradual but steady recovery
Last year the United States saw its third year of post recession payroll gains. According to the Bureau of Labor revised payroll numbers, all but two states Wyoming and Maine gained jobs in 2012, although in most states year-over-year gains in December amounted to less than 2%. North Dakota was the fastest growing state for the second year, with payrolls in December up 6.5% over the end of 2011. It was followed by Utah and Texas, the two only other states to see gains of more than 3%. By the end of year, five more states New York, Louisiana, Utah, South Dakota, and West Virginia joined the four states that had already returned to their prerecession employment levels in 2011: North Dakota, Alaska, the District of Columbia, and Texas.
Employment Growth, 2013 18 (Average annual growth rate)
In 2013, a number of headwinds will prevent growth from significantly exceeding that of 2012. On the domestic front, the main risk comes from the sequester, which will not only bring significant cuts to government spending, but also has the potential of derailing consumer and business confidence, especially if it lasts longer than anticipated. We currently expect that the sequester will remain in effect at least until the end of the fiscal year in September, and that the Washington DC area will feel the greatest pinch, as its economy is highly dependent on federal government spending.
On the external front, the main impediment to growth comes from the ongoing European recession and its dampening effect on US exports. Export growth slowed considerably last year on the back of sluggish global growth, and in 2013 we do not expect the international trade environment will see much improvement. The Northeast, which was the only region to see exports contract last year, will struggle again in 2013 because of its outsized exposure to Europe.
It is not all bad news, however. Thanks to pent-up demand, improved affordability, and low interest rates, the housing sector has finally embarked on a sustainable path towards recovery, and is spurring robust growth in the construction sector. The pace of recovery across the regions varies significantly, however. Although real estate markets in the Northeast were not hit as hard as other markets by
re rate has
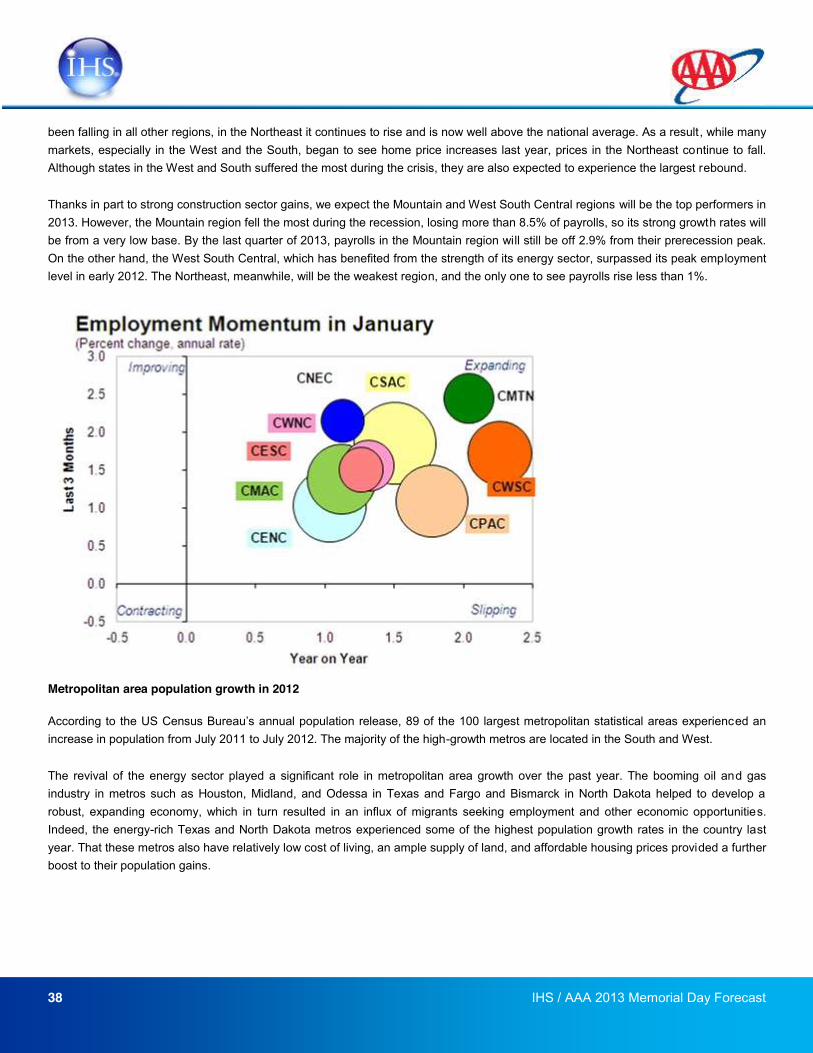
38 IHS / AAA 2013 Memorial Day Forecast
been falling in all other regions, in the Northeast it continues to rise and is now well above the national average. As a result, while many markets, especially in the West and the South, began to see home price increases last year, prices in the Northeast continue to fall. Although states in the West and South suffered the most during the crisis, they are also expected to experience the largest rebound.
Thanks in part to strong construction sector gains, we expect the Mountain and West South Central regions will be the top performers in 2013. However, the Mountain region fell the most during the recession, losing more than 8.5% of payrolls, so its strong growth rates will be from a very low base. By the last quarter of 2013, payrolls in the Mountain region will still be off 2.9% from their prerecession peak. On the other hand, the West South Central, which has benefited from the strength of its energy sector, surpassed its peak employment level in early 2012. The Northeast, meanwhile, will be the weakest region, and the only one to see payrolls rise less than 1%.
Metropolitan area population growth in 2012
ed an increase in population from July 2011 to July 2012. The majority of the high-growth metros are located in the South and West.
The revival of the energy sector played a significant role in metropolitan area growth over the past year. The booming oil and gas industry in metros such as Houston, Midland, and Odessa in Texas and Fargo and Bismarck in North Dakota helped to develop a robust, expanding economy, which in turn resulted in an influx of migrants seeking employment and other economic opportunities. Indeed, the energy-rich Texas and North Dakota metros experienced some of the highest population growth rates in the country last year. That these metros also have relatively low cost of living, an ample supply of land, and affordable housing prices provided a further boost to their population gains.
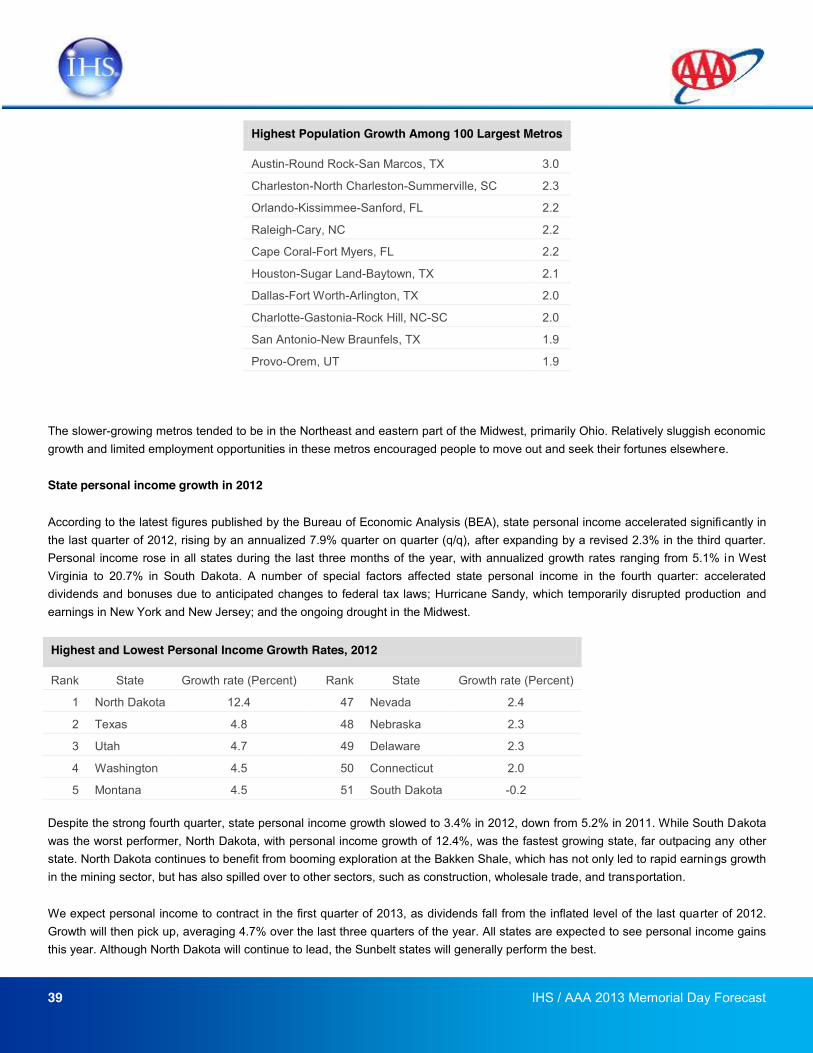
39 IHS / AAA 2013 Memorial Day Forecast
Highest Population Growth Among 100 Largest Metros
Austin-Round Rock-San Marcos, TX 3.0
Charleston-North Charleston-Summerville, SC 2.3
Orlando-Kissimmee-Sanford, FL 2.2
Raleigh-Cary, NC 2.2
Cape Coral-Fort Myers, FL 2.2
Houston-Sugar Land-Baytown, TX 2.1
Dallas-Fort Worth-Arlington, TX 2.0
Charlotte-Gastonia-Rock Hill, NC-SC 2.0
San Antonio-New Braunfels, TX 1.9
Provo-Orem, UT 1.9
The slower-growing metros tended to be in the Northeast and eastern part of the Midwest, primarily Ohio. Relatively sluggish economic growth and limited employment opportunities in these metros encouraged people to move out and seek their fortunes elsewhere.
State personal income growth in 2012
According to the latest figures published by the Bureau of Economic Analysis (BEA), state personal income accelerated significantly in the last quarter of 2012, rising by an annualized 7.9% quarter on quarter (q/q), after expanding by a revised 2.3% in the third quarter. Personal income rose in all states during the last three months of the year, with annualized growth rates ranging from 5.1% in West Virginia to 20.7% in South Dakota. A number of special factors affected state personal income in the fourth quarter: accelerated dividends and bonuses due to anticipated changes to federal tax laws; Hurricane Sandy, which temporarily disrupted production and earnings in New York and New Jersey; and the ongoing drought in the Midwest.
Highest and Lowest Personal Income Growth Rates, 2012
Rank State Growth rate (Percent) Rank State Growth rate (Percent)
1 North Dakota 12.4 47 Nevada 2.4
2 Texas 4.8 48 Nebraska 2.3
3 Utah 4.7 49 Delaware 2.3
4 Washington 4.5 50 Connecticut 2.0
5 Montana 4.5 51 South Dakota -0.2
Despite the strong fourth quarter, state personal income growth slowed to 3.4% in 2012, down from 5.2% in 2011. While South Dakota was the worst performer, North Dakota, with personal income growth of 12.4%, was the fastest growing state, far outpacing any other state. North Dakota continues to benefit from booming exploration at the Bakken Shale, which has not only led to rapid earnings growth in the mining sector, but has also spilled over to other sectors, such as construction, wholesale trade, and transportation.
We expect personal income to contract in the first quarter of 2013, as dividends fall from the inflated level of the last quarter of 2012. Growth will then pick up, averaging 4.7% over the last three quarters of the year. All states are expected to see personal income gains this year. Although North Dakota will continue to lead, the Sunbelt states will generally perform the best.


![arranged by tom wallace percussion by tony mccutchen 11 a a 10 aaa > e] aa aaa 6 aaa aaa aaa aaa aaa aaa 13 > 19 — 18 15 a a aa 16 a a 12 20 23 a > 24 aaa > 25 a > 26 aaa > 27 gÆ4k](https://static.documents.pub/doc/80x56/5e6c4dfc8bd84b079d5a5076/arranged-by-tom-wallace-percussion-by-tony-mccutchen-11-a-a-10-aaa-e-aa-aaa.jpg)


