Aalborg Universitet Elektrisk miljø i svinestalde Silva, Filipe Faria Da; Bak, Claus Leth Publication date: 2013 Document Version Publisher's PDF, also known as Version of record Link to publication from Aalborg University Citation for published version (APA): Silva, F. F. D., & Bak, C. L. (2013). Elektrisk miljø i svinestalde. Department of Energy Technology, Aalborg University. General rights Copyright and moral rights for the publications made accessible in the public portal are retained by the authors and/or other copyright owners and it is a condition of accessing publications that users recognise and abide by the legal requirements associated with these rights. ? Users may download and print one copy of any publication from the public portal for the purpose of private study or research. ? You may not further distribute the material or use it for any profit-making activity or commercial gain ? You may freely distribute the URL identifying the publication in the public portal ? Take down policy If you believe that this document breaches copyright please contact us at [email protected] providing details, and we will remove access to the work immediately and investigate your claim. Downloaded from vbn.aau.dk on: December 17, 2021
Transcript
Aalborg Universitet
Elektrisk miljø i svinestalde
Silva, Filipe Faria Da; Bak, Claus Leth
Publication date:2013
Document VersionPublisher's PDF, also known as Version of record
Link to publication from Aalborg University
Citation for published version (APA):Silva, F. F. D., & Bak, C. L. (2013). Elektrisk miljø i svinestalde. Department of Energy Technology, AalborgUniversity.
General rightsCopyright and moral rights for the publications made accessible in the public portal are retained by the authors and/or other copyright ownersand it is a condition of accessing publications that users recognise and abide by the legal requirements associated with these rights.
? Users may download and print one copy of any publication from the public portal for the purpose of private study or research. ? You may not further distribute the material or use it for any profit-making activity or commercial gain ? You may freely distribute the URL identifying the publication in the public portal ?
Take down policyIf you believe that this document breaches copyright please contact us at [email protected] providing details, and we will remove access tothe work immediately and investigate your claim.
II. Risks and challenges .................................................................................................................................. 2
III. Theories pre-measurements ................................................................................................................... 2
III.1. Unbalance on the loads .................................................................................................................. 2
III.3. Replacement of the 10kV overhead line by a cable ...................................................................... 5
III.4. Stray Voltages inside the farm ....................................................................................................... 6
IV. Measurements: ....................................................................................................................................... 6
IV.1. Material .......................................................................................................................................... 7
V. References ............................................................................................................................................... 17
VI. Appendix ............................................................................................................................................. 18
2
I. Introduction The objective of this project is to find if electricity may be causing an increase in the number of sick pigs at Lars Peter’s farm. In order to fulfil the objective, several sets of measurements were prepared, providing data that can be analysed and studied. The proposed measurements are based on electromagnetic principles and on the input received from other members of the project, which is mostly based on empirical observations and can, therefore, be biased toward the experience and prejudices of the observers.
II. Risks and challenges The main risk is related with the apparent randomness of the phenomenon. Since it is not possible to predict when the problem occurs, it is possible that nothing out of the ordinary is registered during the measurements. The first set of measurements is of short duration and without remote access. Thus, it is not possible to keep the instruments measuring until something unusual is measured. This drawback will be solved later if the second part of the project is approved. In this case, there is enough time to programme a remote measurement setup that may work 24/7 and register any values that go above a defined threshold, increasing the likelihood of measuring unusual values. Another risk of this project is that the empirical observations previously done lead the studies and analysis to a dead end path. This can be minimised by gathering more data. One of the challenges associated to the project is the amount of literature existent in this area. The existent sources are typically old, made by agricultural experts, which seem not always to fully understand electrical phenomena, and focus on dairy production instead of pigs. Some scientific sources in this topic, which focuses more in pig farms, were found in French. One of the authors can read the language, making it possible to also use these sources. However, these sources are more focuses on the eating and drinking aspects and do not cover all the problems detected in the farm.
III. Theories pre-measurements Before doing the measurements, there are proposed some possible causes for the problem. From the received inputs, the main theory is that there are currents flowing in the ground that are responsible for the stress of the animals. These currents can be caused by several factors, but we should work on the principle that apparently only this particular farm is affected, which being true reduces substantially the number of possible causes and the area of interest. However, this can be explained by the lack of other animal farms in the area, as humans would not fell these current due to the large impedance of the human body, when compare with a pig. The different factors that can be behind these ground currents are described below.
III.1. Unbalance on the loads This unbalance can both be on the farm or on near consumers that will result in currents flowing in the ground. However, several conditions have to be attained in order for the ground current reaches values high enough to be of concern.
3
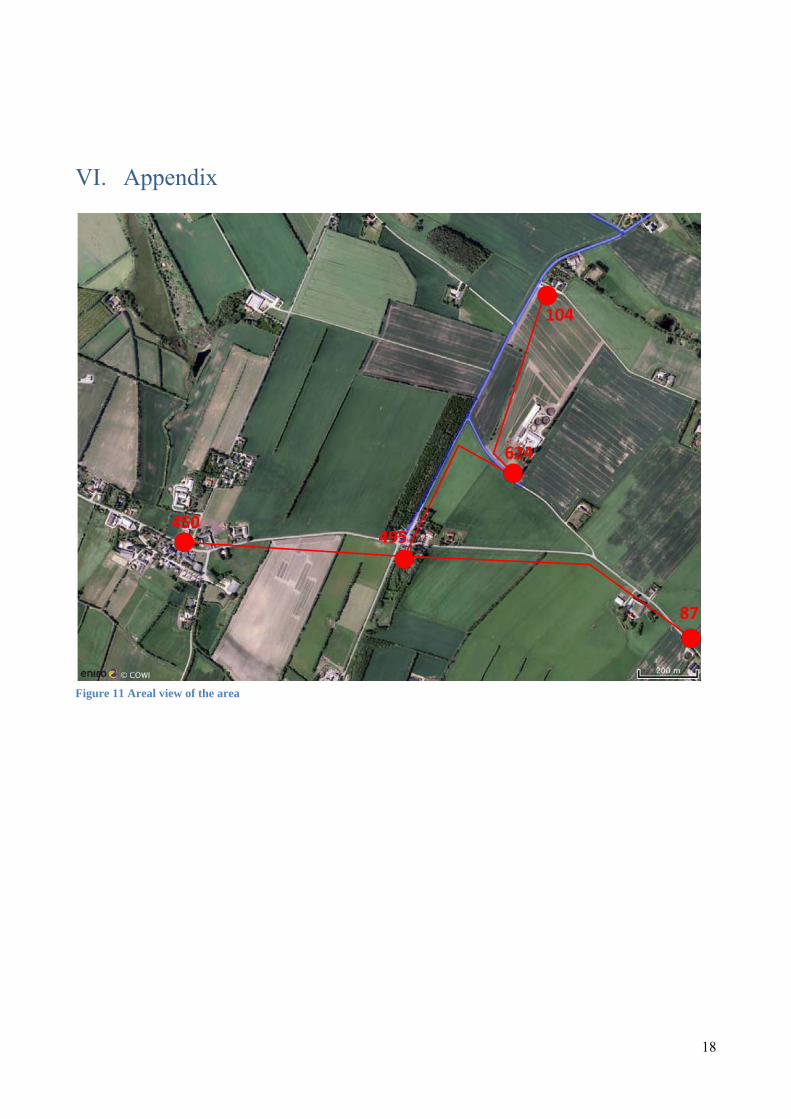
We start by assuming an unbalance in the farm’s load. With the exception of the gylle-pumpe, all the loads are connected to a neutral wire that is connected to the neutral of the transformer. The pump is connected in average one hour every two weeks being disconnected the rest of the time, even the plug is out of the socket. Thus, it cannot be causing the problems. The fact that all the loads are connected to the neutral also reduces the likelihood of an unbalance in the farm’s load be the cause of the ground currents. The neutral wire is connected directly to the transformer’s neutral, which is grounded through a ~1.3Ω impedance that is installed between the ground and the point to which the neutral wire is connected. As a result, the return path through the neutral wire has an impedance that is hundreds times lower than the return path through the ground and very little current would flow though the ground. Assuming that the grounding at the farm is properly done and that there is not a connection between the ground and a wire at any point of the farm, it can be said, with a certain degree of confidence, that an unbalance in the farm’s load is not the cause of high ground currents as most of the current would return in the neutral wire. These expectations also match well with the apparent randomness of the phenomenon. If an unbalance on the farm’s load was the cause, it would be expected a more constant behaviour during the night, which could either be calmness or distress of the animals. This expectation is based on the fact that pigs have a daylight cycle that strongly resembles the human one (approximately 8h per day). Therefore, it would be expected an almost constant load at the farm between midnight and 4am. The previous paragraphs demonstrated that is reduced the probability of an unbalance at the farm’s load be the cause of the ground currents. However, this does not mean that it is not the cause. It just shows that we should maybe focus more of our attention and time trying to speculate other possible causes. Thus, measurements are to be made at the neutral wire going to the farm and at the current flowing to the ground at the farm location, in order to confirm this theory. It is now time to study the likelihood of an unbalance on the loads of the neighbour areas be the cause of ground currents in the farm area. The reference point for us is the transformer 624 that provides energy to the farm, being the farm the only load connected to the 0.4kV side of the transformer. On the 10kV side, the transformer is connected to two transformers: 104 and 495. The former seems to provide energy to half a dozen of residential houses and maybe one animal farm. This transformer is also the last one of the 10kV distribution network. The transformer 495 seems to be connected on the 0.4kV side to a few number of residential houses, while the 10kV side is connected to transformers 450, which feeds a village including several farms. The transformer 87 seems to feed a group of farms1. The importance of all these transformers will become clear in a moment. It was previously explained why the majority of the return current at Lars Peter farm would return through the neutral conductor instead of the ground. The explanation continues to be valid for other loads that are connected on the same conditions. The Danish law mandates that all private loads in Denmark have to be connected to a neutral wire that will carry the return current, reducing the currents flowing in the ground. If all the loads in all the houses are properly installed and the neutral wire is properly connected there would be almost no current flowing through the soil. However, it is possible that in so many loads something is not properly connected and a current would appear in the ground instead of the neutral wire during a transient. In this situation the current flowing in the ground would flow to the neutrals of the different transformers depending on the impedance paths.
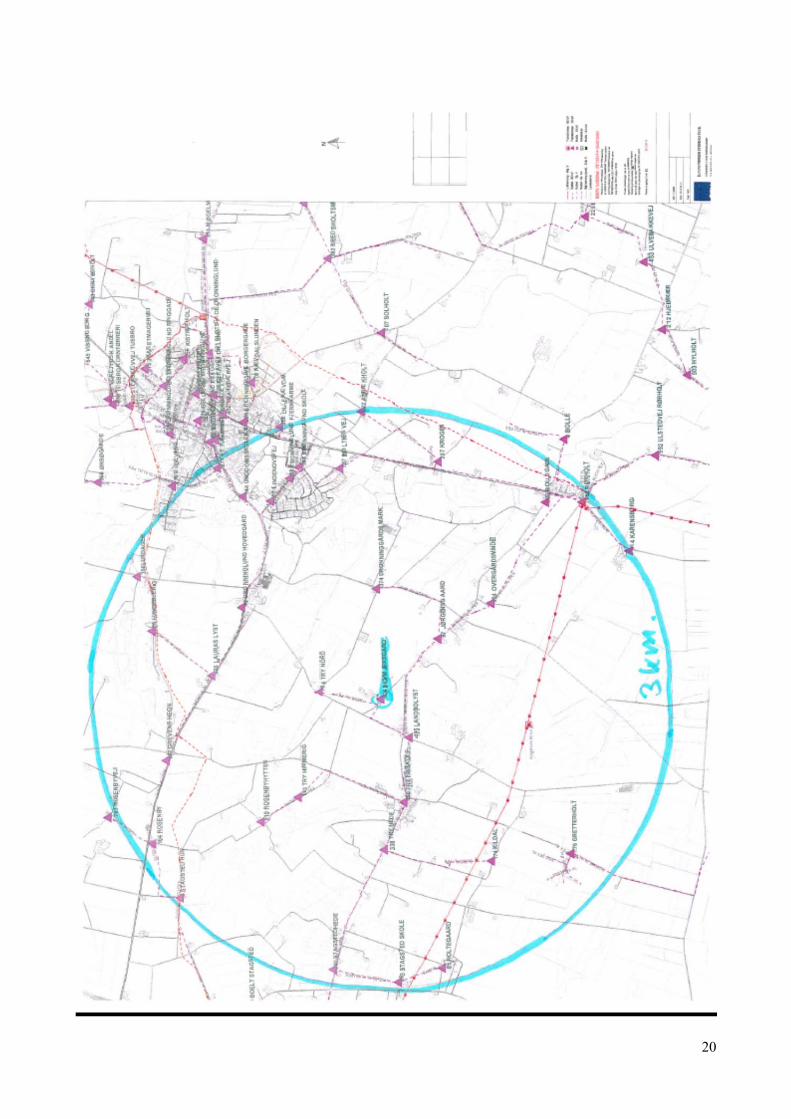
1 It is shown in the appendix areal charts of the area with the approximate location of the transformers. The location of the transformer is proposed by the authors based on the charts received from Nordenergi, which are also in the appendix
4
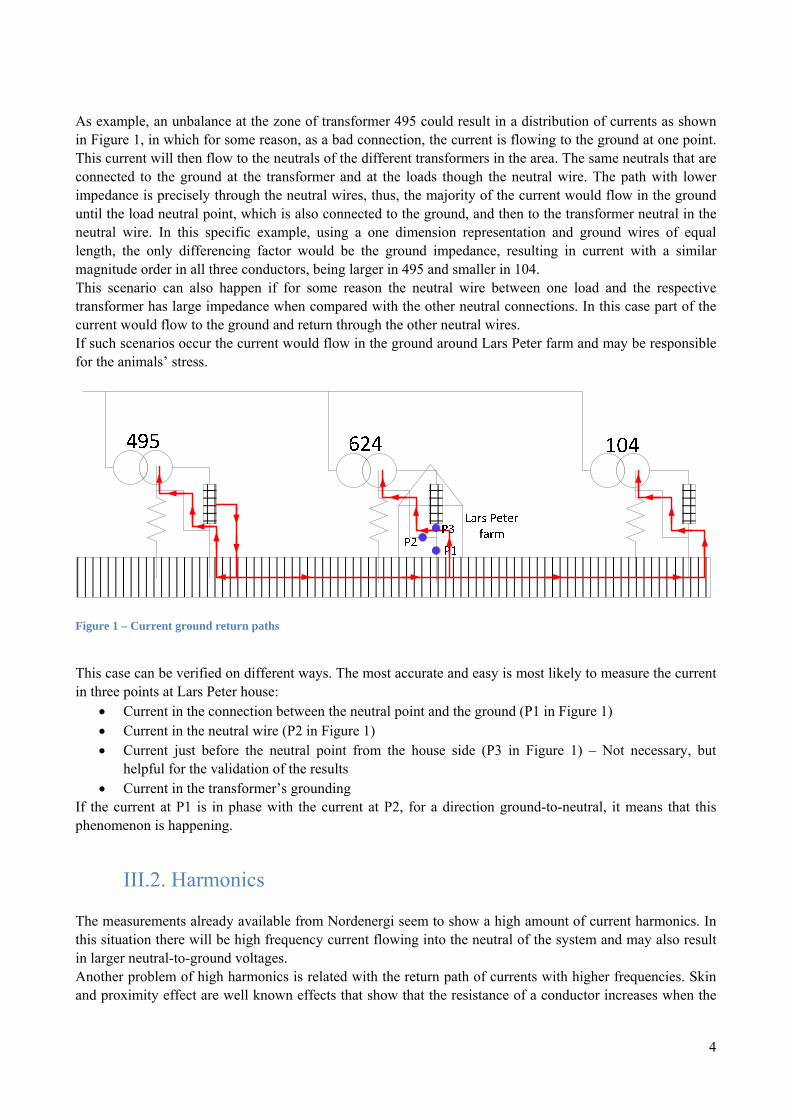
As example, an unbalance at the zone of transformer 495 could result in a distribution of currents as shown in Figure 1, in which for some reason, as a bad connection, the current is flowing to the ground at one point. This current will then flow to the neutrals of the different transformers in the area. The same neutrals that are connected to the ground at the transformer and at the loads though the neutral wire. The path with lower impedance is precisely through the neutral wires, thus, the majority of the current would flow in the ground until the load neutral point, which is also connected to the ground, and then to the transformer neutral in the neutral wire. In this specific example, using a one dimension representation and ground wires of equal length, the only differencing factor would be the ground impedance, resulting in current with a similar magnitude order in all three conductors, being larger in 495 and smaller in 104. This scenario can also happen if for some reason the neutral wire between one load and the respective transformer has large impedance when compared with the other neutral connections. In this case part of the current would flow to the ground and return through the other neutral wires. If such scenarios occur the current would flow in the ground around Lars Peter farm and may be responsible for the animals’ stress.
Figure 1 – Current ground return paths
This case can be verified on different ways. The most accurate and easy is most likely to measure the current in three points at Lars Peter house:
Current in the connection between the neutral point and the ground (P1 in Figure 1) Current in the neutral wire (P2 in Figure 1) Current just before the neutral point from the house side (P3 in Figure 1) – Not necessary, but
helpful for the validation of the results Current in the transformer’s grounding
If the current at P1 is in phase with the current at P2, for a direction ground-to-neutral, it means that this phenomenon is happening.
III.2. Harmonics The measurements already available from Nordenergi seem to show a high amount of current harmonics. In this situation there will be high frequency current flowing into the neutral of the system and may also result in larger neutral-to-ground voltages. Another problem of high harmonics is related with the return path of currents with higher frequencies. Skin and proximity effect are well known effects that show that the resistance of a conductor increases when the
5
frequency increases. At the same time the inductance of a line decreases when the frequency increases, however, the total reactance of the line continues to increases. Therefore, the impedance of a line increases when the frequency increases. The frequency dependence of the soil is a rather complex subject that has being studied for several decades. The classic models indicate that the impedance increases when the frequency increases, similar to a normal conductor. However, recent research indicates that in reality there may be a decrease of the soil impedance when the frequency increases for some types of soil [2],[3] which could lead to an increase of the current flowing in the ground. It was previously explained that the majority of the return current would in normal conditions flow in the neutral wire instead of the ground, because of the much lower impedance of the former. As the frequency increases the impedance of the neutral wire increases, whereas the impedance of the soil decreases. This does not mean that the current from the farm will flow to the correspondent through the ground as there is a ~1.3Ω impedance between the transformer’s neutral and the soil that also increases when the frequency increases. However, it is important to keep in mind that the farm is not in an isolated system and there are many loads around the area. The farm is very close to the transformer, meaning that the neutral wire is short. In the same area there are other loads that are much more distant from the respective server transformers. As an example, referring to the areal map shown in Figure 11, it can be seen that there is another farm east of Lars Peter farm that is most likely connected to the transformer 104, and the distance of the farm to this transformer is almost the same as to the transformer 624. It is possible that as the frequency increases, part of the current starts to flow in the soil to Lars Peter farm, enters the neutral point of the farm, which is also grounded, and returns to the neutral of the transformer 624 through the neutral wire (remember that this wire is much shorter than the wire connecting the other farm to the transformer 104). If this happen, there is current flowing in the ground in the farm area, which if high enough can cause the observed problems. This situation can also be generated by other loads located in the area. It is not possible for us to define the soil parameters for the area under study and thus, we cannot specify the likelihood of such phenomenon happening. Based on experience, we can say that it is very unlikely to see this happening, but since we are looking for an unusual case, it is not possible to discard this one and it will therefore be checked. A measurement of this phenomenon requires more than just the RMS values, it is also necessary to acquire the waveforms. We do not know if the phenomenon is happening, and if it is, which neighbour loads are generating the currents. Therefore, it would be an exaggeration to measure in this first phase points that are more distant from the farm. Instead, the attention is focuses on the neutral point of the farm and measure the current at the same three points define in Figure 1. By doing this it will be possible to see if there is any current flowing from the ground to the neutral wire and its frequency.
III.3. Replacement of the 10kV overhead line by a cable According to Lars Peter the problems started when the existing 10kV overhead line (OHL) was replaced by an underground cable, which means that the transformer station was also changed, including the grounding rod. It is not possible to compare the before with the present, since there are not available measurements from the prior setup. However, it is possible to speculate on two aspects that were changed in the migration from an OHL to a cable. The first aspect is a possible decrease of the grounding impedance of the transformer, which is now closer to the ground and may have a grounding rod with lower impedance that would lead to more current flowing in the soil to the transformer’s neutral. Nordenergi stated that the impedance of the grounding is ~1.3Ω, which
6
is a typical value. Nevertheless, the current in the transformer neutral will be measured and compared with the standard values. The second aspect is the connection of the cable screen to the neutral of the transformers, which is at the 0.4kV side, i.e., the screen of a 10kV cable is grounded on a 0.4kV sub-network. To do a connection like this creates a low impedance path between the neutrals of the different transformers, whose loop may be closed through the soil, either by having the current flowing in the grounding rod of the transformer or the neutral wires that are connected to the loads. This current may be caused by either an unbalance in the network or mutual coupling between the screen of the cable and other conductors. The existence of such current can be checked by measuring the connection between the transformer neutral and the screen.
III.4. Stray Voltages inside the farm Connection between the ground and a conductor at the farm, i.e., stray voltage. The presence of stray voltages in the farm can manifests itself in the pigs by: higher aggressiveness, nervous behaviour, cannibalism, lower water consumption, reproductive problems and loss of weight [13], [15], symptoms that are present in lower or large scale among the animals. If there is stray voltage between two points and the pig touches those two points, the same stray voltage will exist between two points of the pig’s body. If there is a voltage difference there must also be a current flowing between these two points, whose value depends on the animal’s impedance and contact impedance, i.e., the total impedance is larger in a dry environment than in a wet environment. Several sources point out that the high neutral-to-ground voltage can be used as an indication of stray voltages, whereas others have some reserves regarding this (see section IV.6 for more details). Thus, there is going to be measured the neutral-to-ground voltage in the farm and the voltage between different points inside of one of the pig’s boxes.
IV. Measurements: Having this in mind, it is possible to arrange a first set of measurements which should compose of:
Measurements at the farm: o Current in the neutral wire o Current flowing into the ground o Current from all the loads to the farm neutral point o Voltage and current between metal structures and the ground inside the farm, using resistors
with a magnitude similar to that of a pig; o Voltage between the neutral and the ground; o Measurements between two grounding points
Measurements at the transformer 624: o Current in the screen o Current flowing into the ground (used also to estimate the voltage at the neutral point) o Current in the neutral wire
The sample frequency is not very relevant as steady-state signals will be measured. Thus, it is enough to have 25kHz/s or lower (equivalent to 50 points for the 10th harmonic), which is given by any oscilloscope.
7
The number of acquire should be high enough that we can measure 5 steady-state cycles (60ms), which for an acquisition frequency of 25kHz is equal to 2500 points, a number that it is way below the oscilloscope capabilities and thus, it is not a problem. We are not expecting to measure high currents or high voltages, thus there are necessary probes that have a high precision (0.01A and 0.1V).
IV.1. Material Current Probes: 3 probes – The better here would be to use the smaller ones that have a large precision,
but this may be problematic because of the thickness of the wires in the farm and transformer. Thus, it is necessary to take different types of probes with different measuring sections, just in case
o The TCP0150 has a minimum sensitivity of 5mA Voltage probes: 3 probes. It will be tricky to do the voltage measurements in the neutral point, but they
are important inside the farm. However, it is easy to get measuring points there o The P5200 has a sensitivity of
Oscilloscopes: 2 with usb doors o The DPO2014 has a sampling of 200Mhz and can acquire 1 million points
Resistance representing the impedance of a 45kg pig (930Ω [1]) and also larger and lower impedances. Try to get one of the larger resistances because of the contacts
Grounding rods for inside the farm Ammeter for measuring the current through the resistor that represents a pig Other generic material
IV.2. Harmonics The current measurements do not show anything unusual, except for a large unbalance between the phases inside the farm and a high neutral current with a large harmonic distortion. The measurements show that in some cases the third harmonic can be larger than the fundamental and that the THD (Total Harmonic Distortion) is several times larger than the recommended, which is in the best scenario 15% according to IEEE 519. Tests made at the site, indicate that this is caused by a combination of several factors, having apparently the ventilation as main cause. Figure 2 shows the frequency spectrum in the neutral of the farm (several curves) and also of the transformer (yellow curve). The first two curves (red and blue) were measured with a 25 minutes difference and without changing anything at the farm. This means, that any change in the power system as a result of normal/everyday operations in the farm. In both cases, it can be seen a large THD (approximately 125% and 90% for respectively the red and blue curve). Later it was connected the VLC from the water treatment station located at approximately 8km. These measurements are shown in green curve. This spectrum seems to be rather different from the previous two, but this is because this measurement was made 20 minutes after the previous ones. There were not observed any differences in the oscilloscope while switching on/off the VLC. Thus, we can say it a high degree of certainty that the reduction of the fundamental was not caused by the VLC, but from connections/disconnections on the farm electrical equipment during those 20 minutes. The THD for this case is approximately 200%.
8
Finally, we tried to temporary eliminate the harmonic problem and we disconnected the area of the farm that was apparently responsible for most of the harmonics. The frequency spectrum of this case is shown in the black curve, which shows a third harmonic now lower than the fundamental. The THD for this case is approximately 37%. Notice also that the fundamental has magnitude very similar to the previous curves, which may indicate that the loads disconnected for this case are only generating third harmonic. The current in the neutral of the transformer connected to the farm was also measured and shown in the yellow curve. This result seems similar to the previous measurement made at the farm with all the equipment on (green curve), confirming that most of the current seems to return in the neutral. The THD for this case is approximately 230%.
Figure 2 – Frequency spectrum for the current in the neutral for different times
Before any further analysis, it is possible to say immediately that the harmonic distortion at the farm is much larger than recommended and even if it is not cause for the problems in the pigs it should be dealt with, as it reduced the lifetime of some of the equipment and increases the losses, resulting in larger power consumption. The majority of the investigation made on how electrical power may influence animal behaviour is made for cows. Thus, many of the used references mention specifically cows instead of pigs. However, reference [16] points out that for several phenomena the causes of problems are similar for both animals, even if the consequences are not exactly the same (e.g., while the cows produce less milk, the pigs get to be more agrgessive). Thus, the articles specifically to cows are also used as references. The articles are also typically from North America, where the fundamental frequency is 60Hz, instead of 50Hz as in Europe. However, the problems referred in the literature are normally associated to triplen harmonics, which is defined as a multiple of the fundamental. In other words, the important is not if the fundamental is 50Hz or 60Hz, but if there is a harmonic that is a multiple of three of the fundamental. Several observations on cow farms noticed a strong decrease in the milk production with the increase of the triplen harmonics [4], [5]. Thus, these harmonics may be a cause of the problems observed at the farm. If this is the case, it would also explain why the phenomenon got worse when the number of groundings in the farm increased or when Nordenergi changed the ground from TT to TN-C-S. In both cases there would not be just
0 50 100 150 200 250 3000
2
4
6
8
10
12
14
16
Cur
rent
[A]
Frequency [Hz]
Farm - Normal OperationFarm - Normal OperationFarm - Normal OperationFarm - Without Area 2Transf - Normal Operation
9
a grounding point and thus, there would be currents flowing in the ground between the multiple neutrals. The same would happen if there was increased the number of grounding points in the farm. It would also explain the apparently randomness of the phenomenon. The harmonics are created by the combination of several different pieces of equipment, being the ventilation apparently the worse. The ventilation and many other farm equipment are turn on/off automatically, which can explain why the phenomenon may happens at any time of day or night. However, as the current is returning in the neutral wire this should not be a problem assuming that the farm electric installation is properly done.
IV.3. Ground current In section III.1 was referred that a possible cause of the problem could be the existence of currents of other loads flowing into the ground to the farm neutral and then returning to the transformer by the neutral wire. However, the measurements show that the ground current is unlikely the cause of the problem. However, one must point out that it is possible that simply there was nothing out of the ordinary happening during the measurements and only long-term measurements can demonstrate unequivocally the (non)-existence of the problem. Figure 3 shows the current in the ground wire of the farm during the measurements, for being too small. The current magnitude is in the order of the 20mA, being the current probe error 5mA. Moreover, the neutral point is still some meters from the barn and thus, the current flowing in the ground under the barn should be even smaller. Figure 4 shows the frequency spectrum of this current. The value of 1mA is typically use as reference, but sources [6], [8] indicate that pigs can feel current as low as 0.25mA and many animals start to have changes in their behaviour for currents larger than 0.3mA. Thus, it is possible that the current flowing into the ground may affect the animals, even being this small. However, this needs to be checked with a further measurement. Two ground rods will be installed in the ground some meters from each other and then short-circuited. The current in the wire connected the two rods will then be measured as shown in Figure 5.
Figure 3 – Current in the farm’s ground wire
0 0.02 0.04 0.06 0.08 0.1-30
-20
-10
0
10
20
30
Cur
rent
[mA
]
Time [s]
10
Figure 4 – Frequency spectrum of the current in the ground wire
Figure 5 – Measurements of the current flowing in the ground
The current was measured between a grounding stick installed approximately 5m ways from the farm grounding, by short-circuiting both. Only noise was measured. However, this can be because of the impedance between the grounding stick and the ground. The stick was putted ad-hoc and thus, it is expected a contact impedance of some Ohms. If this happens the current flowing in the short-circuit connection will be small. However, this can be solved by measuring the voltage between both grounding points. If there is no potential difference, then, there is also no current flowing in the ground. The measurements do not show any potential difference between the two points, meaning that there is no current flowing in the ground. However, it is important to point out that because of the phenomenon randomness there may exist current in the ground when the pigs have strange behaviours.
IV.4. Measurements inside the farm There were measured both the current (using a 10Ω resistance, which is much lower than a pig impedance) and the voltage between different points of one of the pigs box (Figure 6). The current was too small to be measured and the voltage potential between different points of the box was at maximum 70mV. Thus, nothing exceptional was measured during the minutes that lasted the measurements inside the box. This result can be expected, as all the metal structures in the box were all connected. Therefore, the potential difference between the different points of the box depends only on the impedance of the metal, which is very low, unless if there are rusty parts or loose screws (more on this topic on section IV.6).
50 100 150 200 250 3000
2
4
6
8
10
Cur
rent
[mA
]
Frequency [Hz]
11
Figure 6 – Example of pig boxes
IV.5. Phase Currents Due to the lack of space it was not possible to measure the three current entering in the farm at the same time. However, it was possible to measure all three current separately in an interval of 3 minutes. Figure 7 shows the measurements results. It is possible to manipulate the data so that there is 120° phase difference between the phases and then use these results to estimate the neutral current. It is known that there is an error in the estimation as the currents were not measured at exactly the same instant. Yet, the results can still be used to confirm the previous measurements. Figure 8 shows the frequency spectrum of the neutral current calculated using the phase currents (by adding the currents in the time domain). The results confirm the measurements previously done in section IV.2.
Figure 7 – Currents into the farm: Phase A: Red; Phase B: Blue; Phase C: Green
0 0.01 0.02 0.03 0.04 0.05-60
-40
-20
0
20
40
60
Cur
rent
[A]
Time [s]
12
Figure 8 – Frequency spectrum of the neutral current calculated using the phase currents
IV.6. Neutral to ground voltage and stray voltages There were not measured the waveforms between the neutral and the ground, because of the technical difficulties associated to these measurements. More precisely, the neutral of the oscilloscope is the same of the system, resulting in biased results. However, there was measured the true RMS voltage value using a Fluke multimeter (the only extra information given by the waveforms would be related with the frequency content). The value measured was around 1.1 Vrms, which depending on the farm configuration, the size of the pigs and their contact resistance can in theory be high enough for having a current larger than 0.25mA flowing through the animals. A possible cause for NtG voltages is the presence of large current in the neutral. These currents have been measured (section IV.2), reinforcing this specific measurement. The multimeter was left at the farm and it was told to Lars Peter to see the value measured by it on the next time that problems with the pigs are detected. Analysis of the results Neutral-to-ground (NtG) voltage can in some scenarios indicate the existence of stray voltages inside a farm [1], [11]. However, another source [12] indicates that the NtG voltage should not be used as an indicator of stray voltages. It is the authors’ opinion from the reading of [12] and analysis of the respective statistical results in the paper that the NtG magnitude cannot be used to estimate the magnitude of the stray voltage. However, it can be used to indicate the likelihood of having stray voltages and to have large NtG increase the probability of having also large stray voltages. The reasons for not be possible to find a relation between both magnitudes is that the relation would depend on the farm installation and the impedances of the materials existent in the farm. Hydro-Quebec from Canada states 5 Vrms steady-state has threshold value for NtG and that no actions are required if the measured voltage is below this value [11]. However, two aspects may indicate that this value should not be taken as granted. First, the relation between the magnitudes of NtG voltage and stray voltage is not equal everywhere, as previous explained. Second, the impedance of a pig decreases when the frequency of a current increases [4], [14] and when the animals get
0 50 100 150 200 250 3000
2
4
6
8
10
12
14
Cur
rent
[A]
Frquency [Hz]
13
bigger (older) [14], especially in dry floors (the variation between a young and an old pig can be in the order or 2kΩ). In these situations a lower stray voltage may result in larger currents in the animals. A comment that can be raised in this point is that the stray voltage was also measured (section IV.4) and its value was very small, thus, indicating that this is not a problem. However, it was only possible to do the measurements in one of the boxes, as there were pigs in the others, and the results can be different for other boxes, as they are dependent on the location, state of the material and even weather conditions. Moreover, as it was pointed out before there could have been measured something if the measures were made at a different time period. To do this, a voltimer was left in the farm and Lars Peter was instructed on how to see the value the next time that problems arise. Table I shows the voltage measured by Lars and Kirsten during one and half week. Table I – Neutral-to-ground voltage in the farm for different time periods (Left side of the cell: time; Right side: Voltage in Volts).
The measured values are typically between 0.75V and 1.1V. However larger values were measured between the 8th and 10th of March, and in both the 8th and the 9th was there a larger agitation of the pigs at 13.55 and 10.55 respectively. According to Lars and Kirsten measurements, the larger voltage was measured on Friday the 8th at 11.30, with a magnitude of 1.7V. Ten minutes later the voltage was 1.25V and after thirty minutes it was 1.12V. At 13.40 the animals started to behave strangely and a voltage of 1.01V was measured fifteen minutes later. On the next day there was again a strange behaviour in the farm and the NtG voltage was approximately 1.3V, which is larger than the voltage measured in the other days. At first there may seem not to be any relation between the aggressive behaviour of the animals and the NtG voltage was it was just 1.01V during the time frame of the problem and the same voltage, or larger, was measured in the previous days, without the observation of any unusual animal behaviour. However, it is interesting that the animals were more aggressive in the same days were the measured voltage was larger than usual, even if not at the same time instant. Especially, because the measured voltage can change substantially just in ten minutes has seen between the 11.50 and 12.00 on the 8th of March (a specific reference [14] refer this as big problem). Moreover, research shows that the animals can maintain the unusual behaviour for long periods after the stimulus is over, mostly regarding food and water consumption [9]. Lars Peter also said that the pigs become very aggressive almost instantaneous and then calm down slowly during a long period.
14
IV.7. Impedance measurements A possible cause for the problem can be leakages currents inside of the farm. In order to test this hypothesis measurements were prepared. The farm as a main three-phase breaker which is connected to three other three-phase breakers, each feeding different parts of the farm (Figure 9). Each of these local breakers is to be switch-off and then it is measured the impedance between the phases and the ground. As the neutral is also passing by the local circuit breakers, the impedance between each phase and the ground as well as between the neutral and the ground should be infinite. The results for area 1 and area 3 are according to the expected and the impedance between the phases and the ground is indeed virtually infinite (in reality in the order of MΩ). However, the impedance between phase and ground for area 2 with the switch open is only 150kΩ. The area 2 is connected to other smaller circuit breakers and it was possible to check in more detail which area/equipment was responsible for this lower impedance. This test showed that the lower impedance was caused by the lights (single-phase line) and three-phase switches (stikkontakter på gang), according to the description that was next to the circuit breakers. When any of these sub-areas was switched off, the impedance between phase-ground raised to high values. The fact that the impedances raises when for two switches is unusual and it indicates that there is at least two high impedance connections to the ground, which should be of the same order of magnitude. This can be said, as if there was a low impedance connection path in one of the sub-areas, the impedance would only increase for the switch-off of that sub-area. Considering the measured values, it is concluded that there is not a wire touching the ground or a short-circuit, as the measured impedance would have to be much smaller. Possibilities for an electric path are: high content of moist around metal parts of the conductors or other electric equipment (refer as possible cause of stray voltages in [13]), very short distance (smaller than 1 millimetre) between one metal part of a conductor/neutral and the ground or something short-circuited to the ground, connection between a conductor/neutral and the ground through some material with high resistivity, like dust.
Figure 9 – Setup for the measurement of the impedances
15
IV.8. Magnetic Field There was measured the magnetic field inside the farm. The values did not surpass the 0.2mT for DC magnetic fields. This is a rather low value, even inferior to the values typical measured close to a refrigerator, a computer or a television. The standard [10] recommends for humans a maximum of 118mT for DC fields. Thus, it can be said that the magnetic field is not an issue. This, conclusion is logic and expected at priori. All the pigs in the farm are affected and a magnetic field decreases very fast with the cube of the distance. Thus, the only way of having problems caused by the magnetic field was to have the source of it passing under or over the farm, or at least very close to it. Another possibility was to have equipment generating a large magnetic field inside the farm, but then the problem would be concentrated in one area and not spread all over the farm
IV.9. Phase voltage Figure 10 shows the voltage from phase-to-neutral at the entrance of the farm. The voltage is very balance and very small harmonics are present. The waveforms are well inside the standard limits as should not be of concern.
Figure 10 – Voltage from phase-to-neutral
IV.10. Conclusions Several measurements were made at Lars Peter farm in two distinct periods. However, due to the randomness of the phenomenon none of the measurements coincided with periods of distress. As a result, it is not possible to point out with absolute certain possible the causes of the problem. Yet, it is possible to indicate the most unusual results. Three situations stand out from the measurements:
Current harmonics and neutral current; Possible leakage currents; Voltage between the neutral and the ground – transient stray voltages;
Current harmonics: There is a big unbalance between the three phases, as well as strong harmonic content (Figure 7). As the feeder transformer is connected only to the farm, the unbalanced is caused by the farm’s loads (computers, ventilation, equipment using electronics and power switches, …). Due to the unbalance between the phases there is a large neutral current, whose RMS value is between 10A and 15A. Moreover, this neutral current has a large third harmonic and THD as larger as 230% were measured, values that are larger than those recommended in any existent standard There are several articles from North America that show a correlation between high harmonics and animal distress, mainly for cows and showing an reduction in milk production [4]-[7]. However, it is important to notice that correlation and causality do not mean the same thing and that the legislation related with power quality and electric installations is stricter in Western Europe than in North America. Moreover, the measurements also show that the neutral current is all returning to the transformer neutral point through the neutral wire connecting the transformer to the farm. Without neutral wire there would be a larger current flowing in the ground, which would be highly problematic, yet, in the existing layout there should not be any problem, in principle. However, when there are considered the possible presence of leakage currents, it is possible to speculate a relation between high harmonics and the stress of the animals. A set of measurements showed that in one part of the farm there is an electric connection between the phases/neutral and the ground. It is true that there was a high impedance electric connection, but considering that the impedance should in theory tend to infinite, the value is of concern. It is possible that the current flowing in the neutral or in the phases flows to the ground or to metal structures that are connected to the ground and from there to the pigs. Another possibility, but more remote, is to have a neutral wire inside the farm connected to metal structures at two or more points, resulting in the current flowing from the neutral wire into the structures in some areas and then return to the neutral wire. Such situation would not be noticed in the measurements made and it only is possible to check it by having a full schematic of the farm electric system. However, in this situation, very little current would flow into to animals, because of the large impedance of that path when compared with the other possible paths. The neutral-to-ground voltage, which is an indicator of stray voltage, was also larger than the ideal, but still smaller than the value taken as acceptable in other countries. The problem is that there is not a constant relation between the magnitude of neutral-to-ground voltages and stray voltages, as it depends on several factors, especially the installation layout. Again, the existence of leakage currents would make the phenomenon worse. Measurements made by Lars and Kirsten also showed a larger neutral-to-ground voltage in the same days where problems were detected, even if not at the same time. However, the short duration of a stray voltage, makes it impossible to statistically analyse the measured data and it is not possible to point out the existence/non-existence of a relation between stray voltage and the pig behaviour. Recommendations The large harmonic currents and possible stray-voltages should not be an issue if there is not a connection between the phases/neutral and the ground. Thus, the main recommendation is to check the existence of leakage currents in more detail The measurements done by us can point out the existence of the problem, but not its exactly magnitude and location. Therefore, an electrician should go to the farm and verify if there is any connection between the ground and the phases/neutral inside the farm.
17
V. References [1] R. G. Winfield and JA. Munroe, “Stray Voltage – Plan M-9611”, Canada Plan Service [2] M. A. O. Schroeder, M. M. Afonso, T. A. S. Oliveira, S. C. Assis, “Computer Analysis of
Electromagnetic Transients in Grounding Systems Considering Variation of Soil Parameters with Frequency”, Journal of Electromagnetic Analysis and Applications, 2012
[3] C. M. Portela, J. B. Gertrudes, M. C. Tavares, J. Pissolato, “Earth conductivity and permittivity data measurements: Influence in transmission line transient performance”, Electric Power Systems Research, 2006
[4] Donald Hillman, Charles L. Goeke, Richard Moser, “Electric and Magnetic Field (EMF) Affect Milk Production and Behavior of Cows; Results Using Shielded Neutral Isolation Transformer”, 12th International Conference of Production Diseases in Farm Animals, 2004
[5] Donald Hillman, Dave Stetzer, Charles L. Goeke, Kurt E. Mathson, Harold H. VanHorn, Charles J. Wilcox, “Relationship of Electric Power Quality to Milk Production of Dairy Herds”, International Meeting of the American Society of Agricultural Engineers, 2003
[6] Ave M. Bie, Joseph P. Mettner, John H. Farrow, “Power Quality Guidelines”, Public Service Commission of Wisconsin, 1999
[7] D. Hillman, D. Stetzer, M. Graham, C. L. Goeke, K. E. Mathson, H. H. VanHorn, C. J. Wilcox, ”Relationship of Electric Power Quality to Milk Production of Dairy Herds”, The Canadian society for engineering in agricultural, for, and biological systems, 2003
[8] Jian Jiang, “Elevated Neutral-to-earth voltage in distribution systems including harmonics”, PhD Thesis, Clemson University, 2006
[9] Agricultural Handbook No. 696, “Effect of Electrical Voltage/Current on Farm Animals”, United States Department of Agriculture and Agricultural Research Service, 1991
[10] IEEE Standards, “Standard C95.6 – IEEE Standard for Safety Levels with Respect to Human Exposure to Electromagnetic Field, 0-3kHz”, 2002
[11] A. Charette, G, Simard, “Stray Voltage at a Farm Site Utilities Practice & Review”, IEEE-PES Transmission and Distribution Conference and Exhibition, 2006
[12] L. H. Soutwich, P. B. English, P. M. Sears, “Association Between Neutral-to-Earth and Cow Contact Voltage on New York Dairy Farms”, Journal Dairy Science, 1989
[13] Hydro-Quebec, “Guide pratique – Les tensions parasites à la ferme”, 2005 (in french) [14] Suzanne Robert, L. Godcharles, J. J. Matte, J. Bertin-Mahieux, G. P. Martineau, “Les
Tensions Parasites chez le Porc D’engrasissment”, Journés Rech. Porcine en France, 1993 (in french)
[15] http://www.lexpressmontcalm.com/Societe/Mieux-etre/2009-07-06/article-1119861/Tensions-parasites/1 (in french - March 2013)
[16] Commission de l’énergie de l’Ontario, “La tension parasite dans les explotations agricoles: Enjeux et options en matière de réglementation”, 2008 (in French)