Aalborg Universitet NMR-Based Metabolomics in Kidney and Lung Disease investigating metabolite biomarkers in a rat chronic kidney disease model and in human lung injury Hanifa, Munsoor Ali Publication date: 2020 Document Version Publisher's PDF, also known as Version of record Link to publication from Aalborg University Citation for published version (APA): Hanifa, M. A. (2020). NMR-Based Metabolomics in Kidney and Lung Disease: investigating metabolite biomarkers in a rat chronic kidney disease model and in human lung injury. Aalborg Universitetsforlag. Ph.d.- serien for Det Ingeniør- og Naturvidenskabelige Fakultet, Aalborg Universitet General rights Copyright and moral rights for the publications made accessible in the public portal are retained by the authors and/or other copyright owners and it is a condition of accessing publications that users recognise and abide by the legal requirements associated with these rights. - Users may download and print one copy of any publication from the public portal for the purpose of private study or research. - You may not further distribute the material or use it for any profit-making activity or commercial gain - You may freely distribute the URL identifying the publication in the public portal - Take down policy If you believe that this document breaches copyright please contact us at [email protected] providing details, and we will remove access to the work immediately and investigate your claim. Downloaded from vbn.aau.dk on: January 30, 2022
Transcript
Aalborg Universitet
NMR-Based Metabolomics in Kidney and Lung Disease
investigating metabolite biomarkers in a rat chronic kidney disease model and in human lunginjuryHanifa, Munsoor Ali
Publication date:2020
Document VersionPublisher's PDF, also known as Version of record
Link to publication from Aalborg University
Citation for published version (APA):Hanifa, M. A. (2020). NMR-Based Metabolomics in Kidney and Lung Disease: investigating metabolitebiomarkers in a rat chronic kidney disease model and in human lung injury. Aalborg Universitetsforlag. Ph.d.-serien for Det Ingeniør- og Naturvidenskabelige Fakultet, Aalborg Universitet
General rightsCopyright and moral rights for the publications made accessible in the public portal are retained by the authors and/or other copyright ownersand it is a condition of accessing publications that users recognise and abide by the legal requirements associated with these rights.
- Users may download and print one copy of any publication from the public portal for the purpose of private study or research. - You may not further distribute the material or use it for any profit-making activity or commercial gain - You may freely distribute the URL identifying the publication in the public portal -
Take down policyIf you believe that this document breaches copyright please contact us at [email protected] providing details, and we will remove access tothe work immediately and investigate your claim.
INVESTIGATING METABOLITE BIOMARKERS IN ARAT CHRONIC KIDNEY DISEASE MODEL
AND IN HUMAN LUNG INJURY
BYMUNSOOR HANIFA
DISSERTATION SUBMITTED 2020
NMR-BASED METABOLOMICS IN KIDNEY AND LUNG DISEASE
INVESTIGATING METABOLITE BIOMARKERS IN A RAT CHRONIC KIDNEY DISEASE MODEL
AND IN HUMAN LUNG INJURY
by
Munsoor Hanifa
Dissertation submitted
July 2020
.
Dissertation submitted: July 2020
PhD supervisor: Professor MSO Reinhard Wimmer, Department of Chemistry and Bioscience, Aalborg University
Assistant PhD supervisors: Dr Troels Ring, Department of Biomedicine, Aarhus University. The Center for Critical Care Nephrology, University of Pittsburgh
Professor Bodil Steen Rasmussen, Department of Clinical Medicine, Aalborg University. Department of Anesthesia and Intensive Care Medicine, Aalborg University Hospital
PhD committee: Anders Olsen, Associate Professor (chairman) Aalborg University
Anders Öhman, Associate Professor Umeå University
ChristofferLaustsen,AssociateProfessor Aarhus University
PhD Series: Faculty of Engineering and Science, Aalborg University
Department: Department of Chemistry and Bioscience
ISSN (online): 2446-1636 ISBN (online): 978-87-7210-666-3
Published by:Aalborg University PressKroghstræde 3DK – 9220 Aalborg ØPhone: +45 [email protected]
This thesis is submitted in partial fulfilment of the PhD program at The Doctoral School of Engineering and Science, Aalborg University. It is based upon work carried out at The Department of Chemistry and Bioscience, Aalborg University, together with: The Department of Anaesthesia and Intensive Care Medicine, Aalborg University Hospital; The Department of Nephrology, Aalborg University Hospital; The Department of Clinical Medicine, Aalborg University; The Department of Clinical Medicine, Aarhus University; and The Water and Salt Research Centre, Aarhus University.
I would like to thank all the people who have supported this project at the beginning, in the middle, and at the end. My supervisors, Reinhard Wimmer, Troels Ring and Bodil Steen Rasmussen have been extremely kind and very patient through the entire process – thank you all. Martin Skøtt, whose surgical skills were responsible for the rat model, Søren Nielsen and Jørgen Frøkiær were instrumental in setting up the rat studies in Aarhus. Technical help for this project was provided by Gitte Skou, Gitte Kall, and Mogens Koed in Aarhus, and by Anette Godsk and Kirsten Kolind in Aalborg. I am also grateful to have been allowed to analyse samples collected at the Department of Cardiothoracic Anaesthesiology, Copenhagen University Hospital, by Katrine Buggeskov, and Hanne Ravn. Others who have been involved in establishing metabolomics in Aalborg, and to whom I am also grateful, are Helmut Meyer-Hofmann, Sergey Kucheryavskiy, Kim Esbensen, Søren Risom Kristensen and Shona Pedersen.
I am extremely grateful to Raluca Maltesen, for access to data, kind support, and critical feedback. I owe many other colleagues thanks for help with everything from science and IT to humour and sanity, both at The Section of Biotechnology and The Research Unit of Anaesthesia and Intensive Care Medicine, especially Tina Jørgensen, Lars Erik Uggerhøj, Gunnsteinn Agnar Jakobsson, Anja Sloth Nielsen, Magnus Franzmann, Edith Buchinger, and Simon Arnold Mortensen.
Finally, thank you to my family in London (please come and visit when the coronavirus pandemic and Brexit are over) and Aalborg (Ann – thank you for letting me share this journey with you).
NMR-BASED METABOLOMICS IN KIDNEY AND LUNG DISEASE
iv
ENGLISH SUMMARY
Chronic kidney disease (CKD) is a growing problem across the world. It has a potentially long and asymptomatic early stage, increased morbidity and mortality during the later stages, and requires invasive and expensive treatment for end-stage disease. Diagnosis, currently mainly based upon serum creatinine concentrations, is not precise during the early stages, and does not encompass important kidney functions. Screening could be cost-effective, at least in specific populations, but several gaps present in our understanding of CKD must first be filled.
Acute respiratory distress syndrome (ARDS) affects the lungs, either after a direct or indirect insult, resulting in low blood oxygen concentrations (hypoxaemia). Pathological mechanisms are being discovered, but are still not fully understood. The syndrome carries a high mortality, clinical recognition is suboptimal, and treatment options are limited. Therefore, there are many areas where improvements in knowledge could improve patient care.
Nuclear magnetic resonance (NMR) -based metabolomics combines NMR spectroscopy and multivariate analysis to enable simultaneous analysis of multiple metabolites in blood, urine, tissues, and other biological samples. By applying these methods to samples from a rat model of CKD, and to samples from humans following cardiac surgery with the use of cardiopulmonary bypass, differences between cases and controls were investigated.
In the CKD project, NMR spectra revealed striking differences between the CKD model and the control group. Multivariate analysis was able to differentiate the groups, and quantification of metabolites enabled the investigation of individual metabolites. Allantoin was significantly altered in all analysed compartments, whilst other significant metabolites included: asparagine, benzoate, citrate, creatine, dimethylamine, dimethylglycine, fumarate, guanidinoacetate, hippurate, malate, myo-inositol, oxoglutarate, trigonelline and trimethylamine. Many of these are known to be affected by CKD, but simultaneous analysis of urine and multiple organs is relatively unique, and will hopefully enable pathological mechanisms to be further explored in human disease.
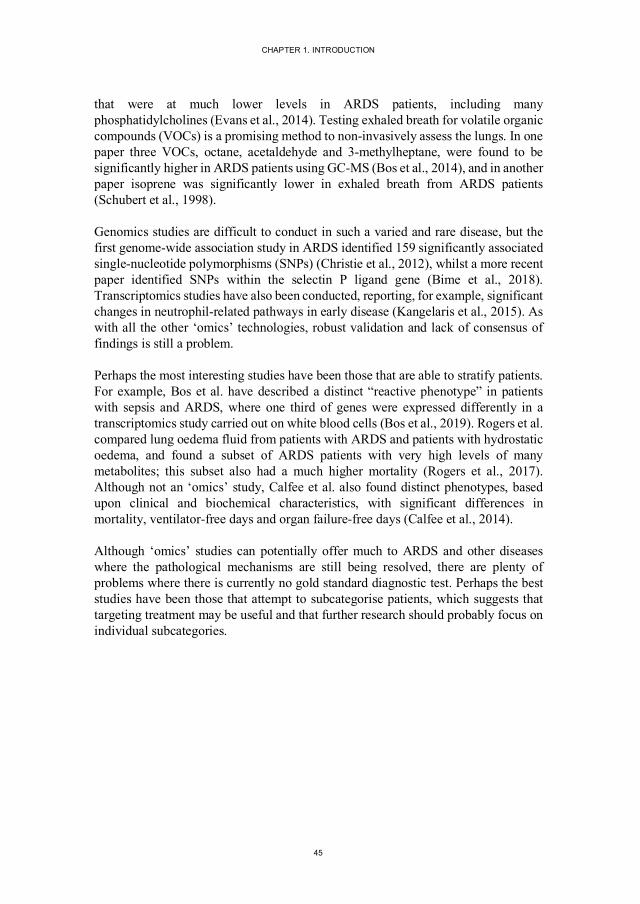
In the ARDS project, 19% of patients suffered severe hypoxaemia and 49% suffered mild hypoxaemia. Using blood samples taken 16 hours postoperatively, it was possible to predict oxygenation status three days postoperatively. Integration identified several metabolites that were significantly different between groups, including: amino acids such as glycine, lysine, alanine and phenylalanine; energy intermediates such as citrate, pyruvate, acetate, acetoacetate, 3-hydroxybutyrate and carnitine; and lipids and lipoproteins. After validation, these findings could help
v
target resources to those at high risk of postoperative hypoxaemia, as well as suggesting areas for further investigation.
A third project investigated the effect of repeated NMR acquisition, using serum and plasma spectra collected for other studies. Although most repeated acquisitions were not significantly different, there was a clear and consistent difference in citrate peaks in a few serum spectra. No clear pattern could be discerned in plasma, but accurate integration was difficult due to the overlapping anticoagulant peaks. There was also a clear decrease in the lipoprotein signal in both repeated serum and plasma samples. These changes should be considered when interpreting significant metabolites, and also emphasise the importance of validating scientific findings.
In conclusion, NMR-based metabolomics can contribute much to medical research, and potentially improve the diagnosis and treatment of many diseases. However, some challenges remain, both technical and statistical, and validation of results is extremely important.
NMR-BASED METABOLOMICS IN KIDNEY AND LUNG DISEASE
vi
DANSK RESUME
Kronisk nyresygdom (CKD) er et voksende globalt problem. CKD har et potentielt langt og asymptomatisk tidligt stadie, øget morbiditet og dødelighed i de senere stadier, og kræver invasiv og dyr behandling i sidste stadie af sygdommen. Diagnosen, i øjeblikket primært baseret på serum kreatinin koncentrationer, er ikke præcis i de tidlige stadier, og omfatter ikke vigtige nyrefunktioner. Screening kan være omkostningseffektiv, i det mindste i bestemte populationer, men flere huller i vores forståelse af CKD skal først udfyldes.
Akut lungesvigt (ARDS) påvirker lungerne, enten efter direkte eller indirekte skade, hvilket resulterer i lave iltkoncentrationer i blodet (hypoxæmi). De patologiske mekanismer er ved at blive opklarede, men er stadig ikke fuldt forstået. Syndromet er forbundet med en høj dødelighed, klinisk anerkendelse er suboptimal, og behandlingsmuligheder er begrænsede. Derfor er der mange områder, hvor bedre viden kan forbedre patientbehandlingen.
Nuklear magnetisk resonans (NMR) -baseret metabolomics kombinerer NMR spektroskopi og multivariat analyse for at muliggøre samtidig analyse af flere metabolitter i blod, urin, væv og andre biologiske prøver. Ved at anvende disse metoder på prøver fra en rottemodel af CKD og på prøver fra mennesker efter hjertekirurgi med brug af kardiopulmonal bypass blev forskelle mellem syge og kontroller undersøgt.
I CKD-projektet var der markante forskelle i NMR-spektre mellem CKD-modellen og kontrolgruppen. Multivariat analyse var i stand til at differentiere grupperne, og kvantificering af metabolitter muliggjorde undersøgelsen af individuelle metabolitter. Allantoin blev væsentligt ændret i alle analyserede prøvetyper, mens andre signifikante metabolitter omfattede: asparagin, benzoat, citrat, kreatin, dimetylamin, dimetylglycin, fumarat, guanidinoacetat, hippurat, malat, myoinositol, oxoglutarat, trigonellin og trimetylamin. Mange af disse er allerede kendt for at være påvirket af CKD, men samtidig analyse af urin og flere organer er relativt unik, og vil forhåbentlig gøre det muligt at undersøge patologiske mekanismer i sygdommen hos mennesker yderlige.
I ARDS-projektet udviklede 19 % af patienterne alvorlig hypoxæmi, mens 49 % udviklede mild hypoxæmi. Ved hjælp af blodprøver opsamlet 16 timer postoperativt, var det muligt at forudsige iltstatus på tredje postoperative dag. Integration identificerede flere metabolitter, der var signifikant forskellige mellem grupper, herunder: aminosyrer såsom glycin, lysin, alanin og phenylalanin; mellemprodukter i energistofskiftet såsom citrat, pyruvat, acetat, acetoacetat, 3-hydroxybutyrat og carnitin; og lipider og lipoproteiner. Efter validering kan disse resultater hjælpe med
vii
at målrette ressourcerne mod dem, der har høj risiko for postoperativ hypoxæmi, samt foreslå områder, der kan undersøges nærmere.
Et tredje projekt undersøgte effekten af gentagne NMR analyser ved hjælp af serum- og plasmaspektre indsamlet til andre undersøgelser. Selv om de fleste gentagne analyser ikke var signifikant forskellige, var der en klar og konsekvent ændring i citrattoppe i nogle få serumspektre. Der kunne ikke skelnes noget klart mønster i plasma, men nøjagtig integration var vanskelig på grund af de overlappende antikoagulerende toppe. Der var også et klart fald i lipoproteinsignalet i både gentagne serum- og plasmaprøver. Disse ændringer bør tages i betragtning ved fortolkningen af signifikante metabolitter, og der understreges betydningen af validering af videnskabelige resultater.
Afslutningsvis, NMR-baserede metabolomics kan bidrage meget til medicinsk forskning, og potentielt forbedre diagnosticering og behandling af mange sygdomme. Der er imidlertid stadig udfordringer, både tekniske og statistiske, og validering af resultater er yderst vigtig.
NMR-BASED METABOLOMICS IN KIDNEY AND LUNG DISEASE
viii
LIST OF PAPERS
PAPER I
Hanifa, M. A., Skott, M., Maltesen, R. G., Rasmussen, B. S., Nielsen, S., Frøkiær, J., Ring, T., & Wimmer, R. (2019). Tissue, urine and blood metabolite signatures of chronic kidney disease in the 5/6 nephrectomy rat model. Metabolomics, 15, 112. doi:10.1007/s11306-019-1569-3
PAPER II
Hanifa, M. A., Maltesen, R. G., Rasmussen, B. S., Buggeskov, K. B., Ravn, H. B., Skott, M., Nielsen, S., Frøkiær, J., Ring, T., & Wimmer, R. (2020). Citrate NMR peak irreproducibility in blood samples after reacquisition of spectra. Metabolomics, 16, 7. doi:10.1007/s11306-019-1629-8
PAPER III
Maltesen, R. G., Hanifa, M. A., Kucheryavskiy, S., Pedersen, S., Kristensen, S. R., Rasmussen, B. S., & Wimmer, R. (2016). Predictive biomarkers and metabolic hallmark of postoperative hypoxaemia. Metabolomics, 12, 87. doi:10.1007/s11306-016-1018-5
PAPER IV
Hanifa, M. A., Skott, M., Maltesen, R. G., Rasmussen, B. S., Nielsen, S., Frøkiær, J., Ring, T., & Wimmer, R. Tissue, urine and serum NMR metabolomics dataset from a 5/6 nephrectomy rat model of chronic kidney disease. DRAFT MANUSCRIPT
Chapter 2. Aims ..................................................................................................53 Chapter 3. Materials and Methods .....................................................................55
3.1. Papers I + IV – Tissue, Urine and Blood Metabolite Signatures of Chronic Kidney Disease in the 5/6 Nephrectomy Rat Model .......................................... 55
3.1.1. Animal Model and Sample Collection ................................................. 55
NMR-BASED METABOLOMICS IN KIDNEY AND LUNG DISEASE
x
3.1.2. Sample Preparation and NMR Analysis............................................... 56 3.1.3. Multivariate and Univariate Analysis .................................................. 58
3.2. Paper II – Citrate NMR Peak Irreproducibility in Blood Samples After Reacquisition of Spectra .................................................................................. 59
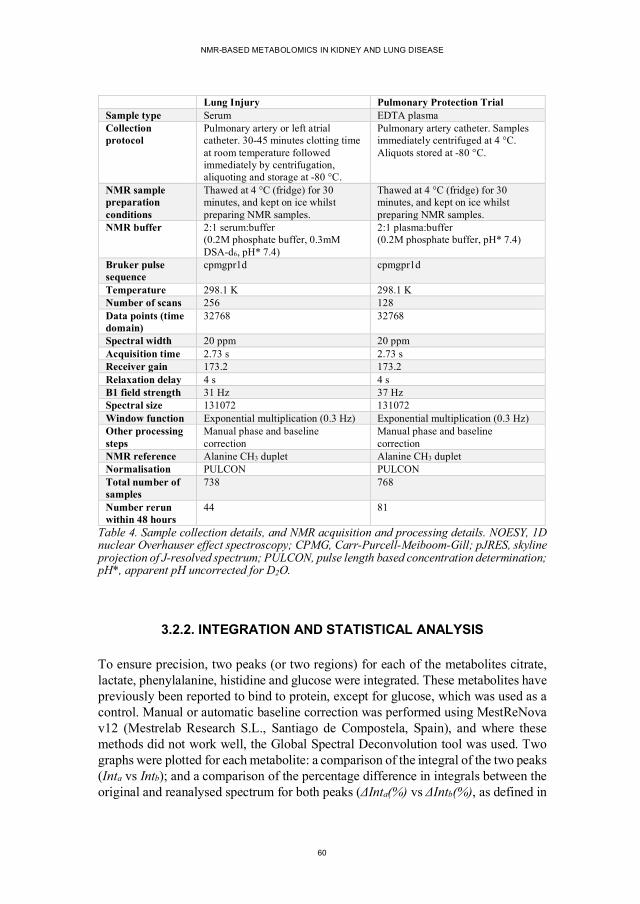
3.2.1. Sample Characteristics and NMR Analysis.......................................... 59 3.2.2. Integration and Statistical Analysis ..................................................... 60
3.3. Paper III – Predictive Biomarkers and Metabolic Hallmark of Postoperative Hypoxaemia .................................................................................................... 61
3.3.1. Patient and Sample Characteristics ...................................................... 61 3.3.2. Sample Preparation and NMR Analysis............................................... 62 3.3.3. Multivariate and Univariate Analysis .................................................. 63
Chapter 4. Results and Discussion......................................................................65 4.1. Papers I + IV – Tissue, Urine and Blood Metabolite Signatures of Chronic Kidney Disease in the 5/6 Nephrectomy Rat Model .......................................... 65
4.1.1. Summary of Results ............................................................................ 65 4.1.2. Allantoin and Oxidative Stress ............................................................ 67 4.1.3. The Gut-Kidney Axis.......................................................................... 70 4.1.4. Acid-Base Balance ............................................................................. 72 4.1.5. Creatine and Energy Metabolites......................................................... 74 4.1.6. Other Significant Metabolites.............................................................. 75 4.1.7. Interactions Between Metabolite Pathways .......................................... 76 4.1.8. New Treatment Options ...................................................................... 79 4.1.9. Strengths and Limitations ................................................................... 80 4.1.10. Future Work ..................................................................................... 81
4.2. Paper II – Citrate NMR Peak Irreproducibility in Blood Samples After Reacquisition of Spectra .................................................................................. 82
4.2.1. Summary of Results ............................................................................ 82 4.2.2. Citrate Peak Integral Changes ............................................................. 84 4.2.3. Methodological Issues ........................................................................ 85 4.2.4. Connections to Papers I and III ........................................................... 86 4.2.5. Future Work ....................................................................................... 87 4.2.6. Implications for Biomarker Validation ................................................ 87
xi
4.3. Paper III – Predictive Biomarkers and Metabolic Hallmark of Postoperative Hypoxaemia .................................................................................................... 88
4.3.1. Summary of Results ............................................................................ 88 4.3.2. Significant Metabolites ....................................................................... 90 4.3.3. Connections to Papers I and II............................................................. 92 4.3.4. Future Work ....................................................................................... 93
Chapter 5. Conclusions .......................................................................................95 Literature List ....................................................................................................97
NMR-BASED METABOLOMICS IN KIDNEY AND LUNG DISEASE
xii
TABLE OF FIGURES
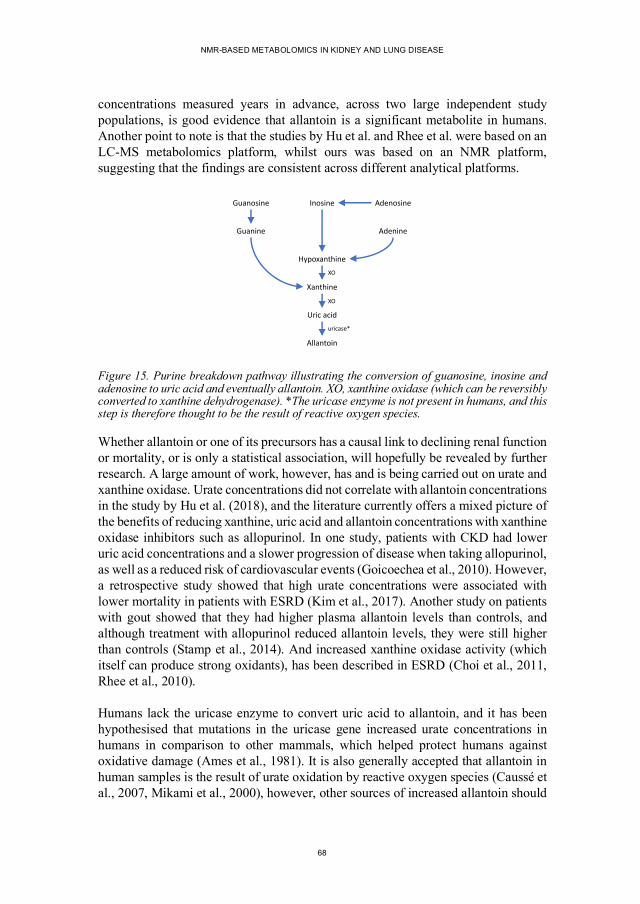
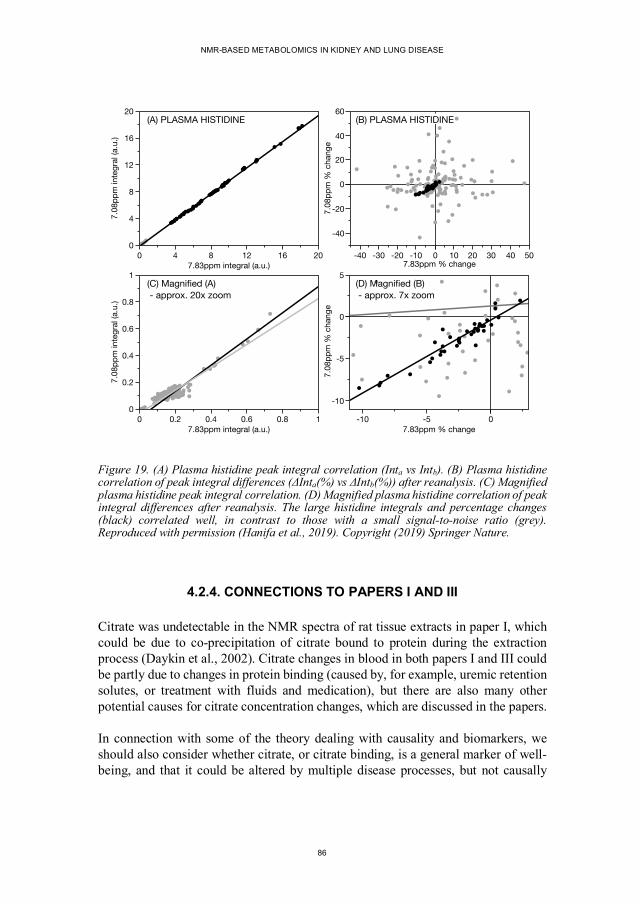
Figure 1. The decline of kidney function with and without treatment ....................16 Figure 2. The nephron (the functional unit of the kidney)......................................18 Figure 3. Comparison of the CKD-EPI and MDRD equations for eGFR ...............19 Figure 4. Relative risks of various complications of CKD .....................................21 Figure 5. Staging CKD ........................................................................................22 Figure 6. Illustration of the airways in the lung .....................................................27 Figure 7. A simplified diagram to illustrate the ‘omics’ fields ...............................31 Figure 8. Proton NMR spectrum of ethanol ..........................................................35 Figure 9. Basic NMR pulse sequences ..................................................................37 Figure 10. Example NMR spectra of a single serum sample ..................................38 Figure 11. Using PCA to produce scores and loadings plots ..................................40 Figure 12. Representation of different relationships between causes and disease ...48 Figure 13. The 5/6 nephrectomy sample collection protocol..................................56 Figure 14. Example NMR spectra and PCA scores plots of urine samples from sham-operated and 5/6 nephrectomy rats .............................................66 Figure 15. The purine breakdown pathway ...........................................................68 Figure 16. Hippurate and benzoate urine concentrations in 5/6 nephrectomy and sham-operated rats ..............................................................................71 Figure 17. Pathways linked to one-carbon metabolism ..........................................77 Figure 18. Serum and plasma citrate peak correlations in reanalysed samples........83 Figure 19. Plasma histidine peak correlations in reanalysed samples .....................86 Figure 20. The prediction of postoperative oxygenation using NMR spectra of serum samples.....................................................................................88 Figure 21. Representative NMR spectra of serum samples ....................................89
xiii
LIST OF ABBREVIATIONS
ACR albumin-to-creatinine ratio AKI acute kidney injury ARDS acute respiratory distress syndrome ATP adenosine triphosphate CABG coronary artery bypass graft CKD chronic kidney disease COSY correlated spectroscopy CPB cardiopulmonary bypass CPMG Carr-Purcell-Meiboom-Gill DMG dimethylglycine DMSO2 dimethylsulfone eGFR estimated glomerular filtration rate ESRD end-stage renal disease GAA guanidinoacetate GFR glomerular filtration rate FiO2 fraction of oxygen inspired HMDB Human Metabolome Database HSQC heteronuclear single quantum coherence MS mass spectrometry NMR nuclear magnetic resonance spectroscopy NOESY nuclear Overhauser effect spectroscopy Nx nephrectomy OAT organic anion transporter OCT organic cation transporter PaO2 partial pressure of arterial oxygen PCA principal component analysis PLS partial least squares regression (or projection to latent structures) PLS-DA PLS-discriminant analysis ROC receiver operating characteristic ROS reactive oxygen species TMA trimethylamine TMAO trimethylamine oxide TOCSY total correlation spectroscopy VIP variable importance in projection
“when a man is capable of being in uncertainties, mysteries, doubts, without any irritable reaching after fact and reason”
John Keats, 1817, ‘On Negative Capability’
15
CHAPTER 1. INTRODUCTION
1.1. CHRONIC KIDNEY DISEASE (CKD)
1.1.1. BACKGROUND
Kidney disease has a long history, reaching back thousands of years. Uroscopy, visual examination of the urine, has evolved into modern clinical urinalysis, but there are still common features. Proteinuria, for example, was the probable cause of bubbles in urine described by Hippocrates (Diamantis et al., 2008), and proteinuria has come into focus again as an important biomarker in chronic kidney disease (Klahr et al., 1994). Diabetes was one of the first diseases described and is referred to in an Egyptian manuscript as, “too great emptying of the urine,” whilst “honey urine,” which would attract ants, was likely to be a description of diabetes mellitus from ancient India (Sanders, 2002). Aristotle suggested that the kidney had two functions: to separate surplus liquid from the blood, and to modify this liquid, which will eventually be eliminated (Marandola et al., 1994). There was a long period of uncertainty about whether the mechanism for urine production in the glomerulus was filtration or secretion, and this was only conclusively resolved in 1924 (Jamison, 2014). However, the functions of the sections of the kidney after the glomerulus have been more difficult to investigate. Research has been limited because of less focus on these processes, and their importance has only recently been rediscovered (Lowenstein and Grantham, 2016).
1.1.2. IMPACT OF CKD
Chronic kidney disease (CKD) is a global problem, with an increasing cost to society (GBD 2016 Causes of Death Collaborators, 2017). The prevalence varies by country in Europe, between 3% and 17% (Brück et al., 2016), and the global incidence and prevalence have both been increasing, again with marked differences across countries (Xie et al., 2018). In addition, the numbers surviving to end-stage renal disease (ESRD) and requiring life prolonging but costly dialysis or transplant, are also increasing. The problems associated with CKD are also expected to affect low-income countries disproportionately in the near future, and the costs of dialysis, which are already a burden in the USA and Europe, cannot be borne by these countries or the affected individuals (Liyanage et al., 2015).
The two systemic diseases, diabetes mellitus and hypertension, are the most common causes of CKD. The global prevalence of both conditions is increasing and, together with ageing populations, is driving the increases in CKD (Xie et al., 2018). Diabetes,
NMR-BASED METABOLOMICS IN KIDNEY AND LUNG DISEASE
16
hypertension and CKD itself can be asymptomatic in the early stages, and even when they are treated renal function can still deteriorate slowly. This inexorable decline of kidney function is known as CKD progression. Therefore, early diagnosis could help immensely, by enabling early treatment of the underlying cause, preventing further damage to the kidneys, and because early intervention can reduce the rate of functional decline and therefore delay ESRD (Figure 1).
Although the mechanisms are still not fully elucidated, the effects of CKD are clear and include an increased risk of other diseases. The major consequence of CKD is cardiovascular disease, with an increased risk even in the early stages of CKD (Levey et al., 2011), whilst the risks of cancer are also increased (Stengel, 2010). Problems directly related to the deterioration of the physiological functions of the kidney, which generally manifest themselves in later disease, include: acidosis, as the kidney is unable to excrete excess acid; mineral and bone disorder, as the kidney is unable to produce the hormone calcitriol (activated vitamin D) and remove excess phosphorus from the blood; sodium and volume overload, due to problems excreting sodium; high potassium levels, as the kidney loses the ability to regulate potassium concentrations; high blood pressure, due to volume overload and renin production; and anaemia due to reduced production of the hormone erythropoietin.
Figure 1. The decline of kidney function with and without treatment. Early diagnosis can potentially slow decline and therefore delay end stage renal disease. GFR, glomerular filtration rate (see section 1.1.4.1).
Time (years)0
20
40
60
80
100
120
End stage renal disease
GFR
(m
l/m
in)
No treatmentNormal diagnosisEarly diagnosisPrevention
CHAPTER 1. INTRODUCTION
17
1.1.3. TREATMENT OF CKD
Once CKD has been diagnosed, treatment consists of finding and removing reversible causes, trying to slow progression, and minimising and treating complications. As mentioned earlier, high blood pressure and diabetes are the biggest risk factors for CKD, whilst cardiovascular disease is the largest cause of death in CKD. Therefore, controlling cardiovascular risk factors is of the utmost importance. This involves blood pressure control, antiplatelet agents and statins, as well as lifestyle changes such as smoking cessation, exercise and a healthy diet. In patients with diabetes, glycaemic control is also important.
For the kidneys specifically, blood pressure and proteinuria control using angiotensin converting enzyme inhibitors or angiotensin II receptor antagonists are often helpful. Specific complications have to be treated with medication, such as anaemia with erythropoietin, and mineral and bone disorder with dietary changes as well as phosphate binders and calcitriol. Acid-base problems can be treated with bicarbonate or citrate. Specific dietary recommendations depend upon individual circumstances, and generally include reducing phosphate, potassium, and sodium intake (Rosenberg, 2019).
When symptoms cannot be controlled by lifestyle changes and medication alone, renal replacement therapy has to be considered. The most common form of renal replacement is haemodialysis, where blood is filtered using an artificial dialysis membrane outside the body. However, although dialysis techniques and technology have developed, there is still excess morbidity and mortality related to haemodialysis, with symptoms such as increased susceptibility to infection and subtle cognitive impairment, which are called the residual syndrome (Depner, 2001). Starting dialysis is a difficult decision, and the balance of benefits and risks has to be considered. This reminds us not only of the limits of dialysis, but also of our knowledge of uremic retention solutes and their mechanisms of toxicity. Peritoneal dialysis, where the peritoneum is used as the dialysis membrane, is an alternative; however, renal transplantation offers the best outcomes with regards to quality of life and mortality.
1.1.4. ASSESSMENT OF KIDNEY FUNCTION
The kidneys have multiple diverse functions, and how kidney function is measured today has a basis in how the understanding of kidney function has developed historically. As mentioned above, the early theories of urine formation were divided between filtration processes and tubular secretion, and glomerular filtration was first demonstrated decisively in 1924 (Jamison, 2014). Urea, which has the highest blood concentration of all uremic retention solutes, was first isolated in 1727 by Boerhaave, and improvements in urea measurement led to the discovery of urea retention in
NMR-BASED METABOLOMICS IN KIDNEY AND LUNG DISEASE
18
animals after nephrectomy in 1823. Creatinine was discovered by Liebig in 1847, and although both urea and creatinine are freely filtered in the glomerulus, they are both affected by tubular secretion, and processes outside the kidneys (Duranton et al., 2014, Narayanan and Appleton, 1980). Research in kidney disease has therefore been mainly based upon the filtration function of the kidneys and estimating filtration with urea and creatinine. However, given the important role of the kidneys in removing and processing other endogenous and exogenous compounds, there are many metabolites which are affected by CKD. Other aspects of kidney function are also becoming more important, as the limits of measuring filtration for diagnosis and of haemodialysis for treatment are becoming more apparent, and these will be discussed in the following subsections.
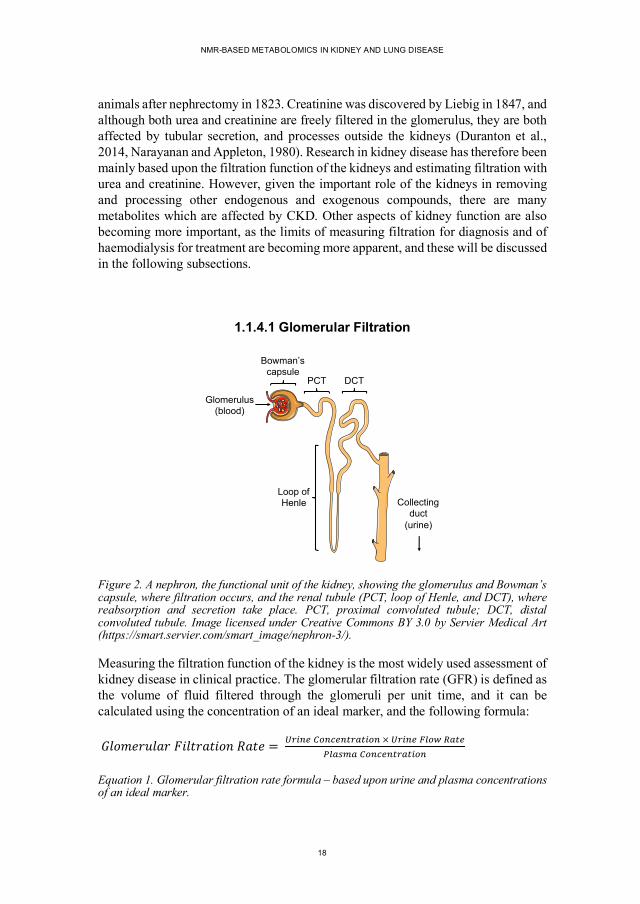
1.1.4.1 Glomerular Filtration
Figure 2. A nephron, the functional unit of the kidney, showing the glomerulus and Bowman’s capsule, where filtration occurs, and the renal tubule (PCT, loop of Henle, and DCT), where reabsorption and secretion take place. PCT, proximal convoluted tubule; DCT, distal convoluted tubule. Image licensed under Creative Commons BY 3.0 by Servier Medical Art (https://smart.servier.com/smart_image/nephron-3/).
Measuring the filtration function of the kidney is the most widely used assessment of kidney disease in clinical practice. The glomerular filtration rate (GFR) is defined as the volume of fluid filtered through the glomeruli per unit time, and it can be calculated using the concentration of an ideal marker, and the following formula:
Equation 1. Glomerular filtration rate formula – based upon urine and plasma concentrations of an ideal marker.
Glomerulus(blood)
Loop ofHenle Collecting
duct(urine)
Bowman’scapsule
PCT DCT
CHAPTER 1. INTRODUCTION
19
Measuring GFR is technically difficult, as an ideal marker of GFR should be freely filtered in the glomerulus, not secreted or reabsorbed by the tubules, and neither synthesised nor metabolised by the kidney. Markers such as inulin, iothalamate, iohexol, DTPA or EDTA are difficult to use, and therefore measuring GFR is most often substituted with an estimated GFR (eGFR) based on the endogenous metabolite creatinine. Creatinine is generated from the breakdown of creatine (mostly in muscle), and its concentrations depend upon multiple factors, such as muscle mass, diet, gender and race. Equations for estimating GFR from creatinine concentrations, to control for these factors have developed over time, the original Cockcroft-Gault formula dates back to 1973 and incorporates weight and age (Cockcroft and Gault, 1976). Subsequent improvements include the Modification of Diet in Renal Disease (MDRD) study equation (Levey et al., 1999), and the CKD Epidemiology Collaboration (CKD-EPI) equation (Levey et al., 2009).
Unfortunately, creatinine does not meet the assumptions required to be an ideal marker of GFR. Firstly, blood creatinine concentrations can be variable, for example, eating meat will increase serum concentrations transiently. Perhaps most importantly, early kidney disease will be compensated for by an increased tubular secretion, leading to artificially high estimates of GFR (Shemesh et al., 1985). The comparison of GFR and eGFR illustrated in Figure 3 clearly shows that precision decreases as eGFR increases, which leads to delays in diagnosis and limits early intervention.
Figure 3. Comparison of the CKD-EPI and MDRD equations for estimating GFR. Although the CKD-EPI equation is more accurate overall, both equations are less precise as eGFR increases. The lines represent a smoothed regression line (solid) and 95% confidence interval (dashed). Reproduced with permission (Levey et al., 2009). Copyright (2009) The American College of Physicians.
NMR-BASED METABOLOMICS IN KIDNEY AND LUNG DISEASE
20
1.1.4.2 Uremic Retention Solutes
Urea and creatinine are the classical examples of metabolites which are not removed effectively from the circulation by failing kidneys, but long lists of compounds that are retained in CKD exist, and are continuingly being updated (Duranton et al., 2012). Criteria have been proposed to help find those that are toxic, such as Bergstom’s criteria (Bergstrom, 1997):
1. Concentrations should be higher in uremic patients. 2. Specific symptoms should be present, which are improved when
concentrations are reduced. 3. Symptoms should be reproducible in a control group exposed to increased
concentrations.
Unfortunately, no uremic retention solute has satisfied these criteria so far (Abramowitz et al., 2010). Urea concentrations rise more than any other solute in CKD, however, high concentrations of urea are well tolerated (Duranton et al., 2014). On the other hand, urea could potentially be toxic via protein modification, reactive oxygen species, ammonia production in the gut, or in combination with other uremic toxins (Abramowitz et al., 2010). Given the long list of uremic symptoms, and the multitude of possible interactions with other uremic solutes, finding metabolites that fulfil Bergstrom’s criteria can only get more difficult.
The European Uremic Toxin (EUTox) group have published several reviews of uremic toxins, and have divided the solutes into three categories: free water-soluble low molecular mass compounds (<0.5 kDa), protein-bound solutes, and middle molecules (0.5-60 kDa) (Duranton et al., 2012). These categories are based upon molecular weight and protein binding, the significance being the links to how the compounds are processed by the kidney, and also to how they can be analysed. This also gives us some insight into the complexity of the transport systems present in the kidney, and that glomerular filtration is only one part of the process.
1.1.4.3 Proteinuria – A Distinct Axis of Kidney Function
Normal urine contains small amounts of a large variety of proteins. Larger plasma proteins are not filtered, because of the size and negative charge of the filtration barrier in the glomerulus, and the proteins that are filtered are normally efficiently reabsorbed. Proteinuria has been linked to disease for centuries (Diamantis et al., 2008), and it is perhaps surprising that its role in CKD is still developing. Multiple studies have shown that higher levels of baseline proteinuria are linked to steeper declines in GFR, that proteinuria reduction slows progression of CKD, and the interaction of blood pressure and proteinuria, for example the landmark MDRD study
CHAPTER 1. INTRODUCTION
21
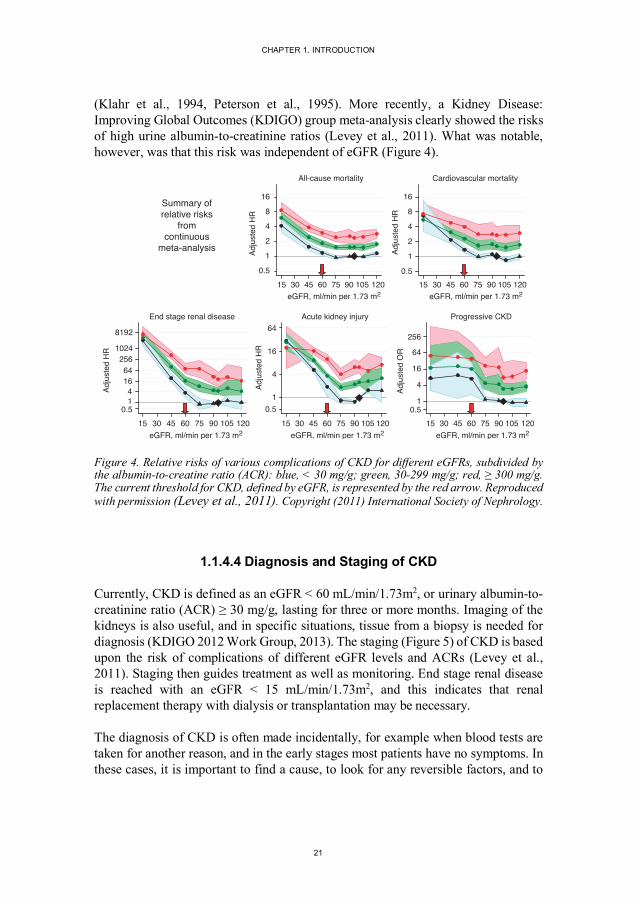
(Klahr et al., 1994, Peterson et al., 1995). More recently, a Kidney Disease: Improving Global Outcomes (KDIGO) group meta-analysis clearly showed the risks of high urine albumin-to-creatinine ratios (Levey et al., 2011). What was notable, however, was that this risk was independent of eGFR (Figure 4).
Figure 4. Relative risks of various complications of CKD for different eGFRs, subdivided by the albumin-to-creatine ratio (ACR): blue, < 30 mg/g; green, 30-299 mg/g; red, ≥ 300 mg/g. The current threshold for CKD, defined by eGFR, is represented by the red arrow. Reproduced with permission (Levey et al., 2011). Copyright (2011) International Society of Nephrology.
1.1.4.4 Diagnosis and Staging of CKD
Currently, CKD is defined as an eGFR < 60 mL/min/1.73m2, or urinary albumin-to-creatinine ratio (ACR) ≥ 30 mg/g, lasting for three or more months. Imaging of the kidneys is also useful, and in specific situations, tissue from a biopsy is needed for diagnosis (KDIGO 2012 Work Group, 2013). The staging (Figure 5) of CKD is based upon the risk of complications of different eGFR levels and ACRs (Levey et al., 2011). Staging then guides treatment as well as monitoring. End stage renal disease is reached with an eGFR < 15 mL/min/1.73m2, and this indicates that renal replacement therapy with dialysis or transplantation may be necessary.
The diagnosis of CKD is often made incidentally, for example when blood tests are taken for another reason, and in the early stages most patients have no symptoms. In these cases, it is important to find a cause, to look for any reversible factors, and to
0.5
1
2
4
8
16
Adju
sted
HR
15 30 45 60 75 90 105 120eGFR, ml/min per 1.73 m2
All-cause mortality
0.5
1
2
4
8
16
Adju
sted
HR
15 30 45 60 75 90 105 120eGFR, ml/min per 1.73 m2
Cardiovascular mortality
Summary ofrelative risks
fromcontinuous
meta-analysis
0.514
1664
2561024
8192
Adju
sted
HR
15 30 45 60 75 90 105 120eGFR, ml/min per 1.73 m2
End stage renal disease
0.51
4
16
64
Adju
sted
HR
15 30 45 60 75 90 105 120eGFR, ml/min per 1.73 m2
Acute kidney injury
0.51
4
16
64
256
Adju
sted
OR
15 30 45 60 75 90 105 120eGFR, ml/min per 1.73 m2
Progressive CKD
NMR-BASED METABOLOMICS IN KIDNEY AND LUNG DISEASE
22
treat any risk factors. This naturally leads to the suggestion that screening may be useful, and this is discussed further in the following section.
Figure 5. Staging of CKD using GFR and ACR according to the KDIGO 2012 Clinical Practice Guideline. Colours represent prognosis: green, low risk; yellow, moderately increased risk; orange, high risk; red, very high risk. Reproduced with permission (KDIGO 2012 Work Group, 2013). Copyright (2013) International Society of Nephrology.
1.1.4.5 Screening for CKD
In Figure 5 above, the groups with an eGFR ≥ 60 ml/min/1.73m2 are especially interesting. Firstly, it is possible to slow GFR decline and delay end stage renal disease (Figure 1) with lifestyle changes and medication. Secondly, although the eGFR is in the “normal” range, there is still an increased risk when combined with other risk factors, in this case albuminuria. Therefore, screening could reduce the direct costs of renal replacement therapy over the long-term; reduce the indirect costs related to the increased risk of other diseases, especially cardiovascular disease; and improve quality of life parameters. Together with prevention, early detection and intervention are probably the most cost-effective methods of dealing with CKD, however, general screening for CKD has not been proven to be effective (Wouters et al., 2015). The widely accepted criteria for screening programs were developed by
Persistent albuminuria categories Description and range
A1 A2 A3
Normal to mildly
increasedModerately increased
Severely increased
<30 mg/g <3 mg/mmol
30-300 mg/g 3-30 mg/mmol
>300 mg/g >30 mg/mmol
GFR
cat
egor
ies
(ml/m
in/ 1
.73
m2 )
Des
crip
tion
and
rang
e
G1 Normal or high ≥90
G2 Mildly decreased 60-89
G3a Mildly to moderately decreased 45-59
G3b Moderately to severely decreased 30-44
G4 Severely decreased 15-29
G5 Kidney failure <15
CHAPTER 1. INTRODUCTION
23
Wilson and Jungner, and include balancing the costs of diagnosis and treatment, having a suitable test, and facilities for diagnosis and treatment (Wilson and Jungner, 1968). Unfortunately, eGFR is not a suitable test, because it is not precise enough when eGFR ≥ 60 ml/min/1.73m2.
Because population-based screening does not currently fulfil the criteria for screening, current research is based on screening high risk groups, for example individuals with hypertension, diabetes or a relevant family history (Brown et al., 2003, Komenda et al., 2014). Other groups that are at a higher risk of CKD or faster progression of CKD, where screening may also be cost-effective, include African Americans and south Asians (Hoerger et al., 2012). In low- and middle-income countries where development is happening rapidly, such as India, the rates of diabetes and hypertension are also rapidly increasing. Although only a minority of these patients will reach end stage renal disease, targeted screening could improve the quality of life for many who cannot afford expensive healthcare, and cannot afford not to work (Varma, 2015).
1.1.5. PROGRESSION OF CKD
Even if the main cause of damage to the kidneys can be treated, kidney function often continues to deteriorate, and progression of CKD is thought to be inevitable. Bricker et al. proposed the “intact nephron hypothesis” in 1960, suggesting that a reduction in the number of functioning nephrons was an important part of chronic kidney disease (Bricker et al., 1960). They theorised that adaptation to reduced renal function leads to the remaining functioning nephrons having to increase their workload, and that this adaptation, although helping to maintain homeostasis in the short-term, can be maladaptive in the long-term (Bricker, 1972).
One of the candidate maladaptive mechanisms is hyperfiltration, where there is an increase in intraglomerular pressure and glomerular hypertrophy to try to maintain GFR in individual nephrons, which eventually leads to secondary glomerulosclerosis (formation of scar tissue). In a similar way, high blood pressure may cause intraglomerular hypertension, where systemic hypertension is transmitted to the glomerulus, or via specific glomerular haemodynamic factors. Reducing proteinuria can delay progression, and the interaction between proteinuria and blood pressure is also important (Brenner et al., 1982, Klahr et al., 1994, Peterson et al., 1995).
Acidosis occurs when the ability of the kidneys to excrete acid is overwhelmed. In the remaining functional nephrons, increased ammonium excretion is used to transport the excess acid, which leads to complement activation and is thought to be part of the mechanism that leads to further kidney damage (Nath et al., 1985, Simpson, 1971). Buffers are an important mitigating process, for example,
NMR-BASED METABOLOMICS IN KIDNEY AND LUNG DISEASE
24
bicarbonate, phosphate and proteins. Bicarbonate concentrations are known to decrease as CKD progresses, and lower plasma bicarbonate concentrations are also linked to a greater risk of CKD progression in early disease (eGFR > 60 mL/min/1.73 m2) (Driver et al., 2014).
Healthy humans without CKD also lose about 4500 nephrons per year per kidney (Nyengaard and Bendtsen, 1992), and GFR falls by approximately 10 ml/min per decade (Davies and Shock, 1950). In common with many chronic diseases, changes associated with aging are observed at increased rates in the dialysis population, such as telomere loss, advanced glycation end products, oxidative stress and chronic inflammation (Kooman et al., 2013). It is therefore plausible to think of CKD as a form of accelerated aging in the kidney, and also to consider the number of nephrons at birth as a risk factor.
1.1.6. PARTIAL NEPHRECTOMY ANIMAL MODELS OF CKD
The 5/6 nephrectomy procedure has been used since the 1950s as a model for chronic kidney disease. It is based on the hypothesis that chronic renal disease can be represented as a decrease in the number of functional units of the kidney, leaving the rest of the nephrons to attempt to compensate for the functional loss (Platt et al., 1952). There are many articles describing this model and the similarity it has to human CKD clinically, such as progressive GFR loss and proteinuria, as well as histopathological changes, including glomerulosclerosis and tubulointerstitial fibrosis (Kwon et al., 1998, Maddox et al., 1986, Morrison and Howard, 1966, Shimamura and Morrison, 1975).
Various partial nephrectomy models are used experimentally, such as uninephrectomy, 2/3 nephrectomy and 5/6 nephrectomy, and there are also different methods of achieving renal mass reduction, for example, ligation of renal artery branches, or excision of the poles of the kidney. There are marked difference between these various models, and also between different strains and species. For example, GFR has been measured after 5/6 nephrectomy and uninephrectomy, and the maximal GFR increases were approximately 300% and 50%, respectively (Chamberlain and Shirley, 2007). Using infarction, as opposed to excision, to reduce renal mass seems to cause hypertension and more glomerular injury (Griffin et al., 1994). An example of strain and gender effects is the male Sprague Dawley rat, which is particularly susceptible to ageing, with proteinuria in more than 50% at 12 months of age, over 90% by 24 months of age, and GFR decline after this (Goldstein et al., 1988).
Animal experiments allow us to conduct experiments in a highly controlled environment, thus helping to remove extra sources of variation. This is especially
CHAPTER 1. INTRODUCTION
25
important in ‘omics’ work, to reduce the risk of false positive findings when testing hundreds or thousands of variables. Animal models are also an important tool in testing possible interventions. However, the simplification has to be considered when discussing the relevance of findings to human disease. Human CKD is multifactorial, and although some animal models do involve multiple disease mechanisms, it will never be possible to capture all of the complexity. The genetics of inbred animal strains could also be markedly different to that of human disease, and the physiology of animals is different to humans, though some species are closer than others to humans.
1.1.7. SUMMARY
CKD is an important global problem, the societal costs of CKD are still growing, and the future burden will disproportionately affect low- and middle-income countries. Prevention and early treatment could potentially save lives and costs, however early CKD is often missed, because early disease is asymptomatic and current methods based upon creatinine and eGFR are less precise in the early stages.
Screening has not yet proven to be cost-effective, especially when based on population screening, but a test that could diagnose CKD at an earlier stage might change the balance of the argument. Early detection would make it possible to treat risk factors quickly, slow progression and prevent complications such as cardiovascular disease. Delaying end stage renal disease would not only improve quality of life, but would also reduce healthcare costs.
Early detection, however, requires new biomarkers of kidney function that can be detected before serum creatinine rises and eGFR falls. Looking at other axes of kidney function, such as tubular secretion, could be helpful, and new markers of disease could eventually lead to a better understanding of the disease processes involved in triggering CKD, the progression of CKD, and the complications of CKD.
NMR-BASED METABOLOMICS IN KIDNEY AND LUNG DISEASE
26
1.2. ACUTE RESPIRATORY DISTRESS SYNDROME (ARDS)
1.2.1. BACKGROUND
Acute respiratory distress syndrome (ARDS) is a clinical syndrome which results in difficulty breathing after an insult to the lungs. There is no specific lung test or blood test, the insults causing it are varied, and only a minority of patients will get the illness after an insult. These issues make clinical suspicion of ARDS lower than it should be, which results in the syndrome being overlooked (Bellani et al., 2016). ARDS was first described in 1967 in a small group of critically ill patients, but it lacked an easy to use diagnostic scheme, which made studying and diagnosing the syndrome difficult (Ashbaugh et al., 1967). Diagnostic criteria were published in 1994, with four key components: an acute presentation; a low PaO2/FiO2 (ratio of partial pressure of oxygen in the blood to fraction of inspired oxygen); lung imaging changes; and the exclusion of heart failure or volume overload as a cause (Bernard et al., 1994). The criteria were updated in 2012 to improve clarity and reliability, although diagnostic issues still remain (ARDS Definition Task Force, 2012).
The incidence of ARDS has been reported as approximately 80 per 100,000 person-years by a study conducted in the USA, and the mortality rate here was estimated at 40% (Rubenfeld et al., 2005). In a more recent study, over 10% of all ICU patients fulfilled the ARDS criteria, but clinical recognition was suboptimal (Bellani et al., 2016). There are a large number of predisposing factors and, together with factors such as age and race, there is a large variation in the risk of ARDS and subsequent mortality (Rubenfeld et al., 2005). However, there seems to be a common inflammatory pathway which affects the smallest functional units of the lung, the alveoli (Figure 6). This disrupts both the endothelial (blood - alveolus) barrier and the epithelial (alveolus - air) barrier, as well as the interstitium in between, and this reduces gas exchange in the lung (Ware and Matthay, 2000). There is no treatment for ARDS itself, only supportive measures such as lung-protective mechanical ventilation and treatment of the underlying cause.
Because of these diagnostic problems, there are some unresolved issues surrounding ARDS: is it possible to diagnose ARDS earlier or subclassify patients? Is it possible to treat ARDS more effectively, or event prevent ARDS? Can ARDS also occur outside of the intensive care unit? All of these issues require further research, and an effective diagnostic test.
CHAPTER 1. INTRODUCTION
27
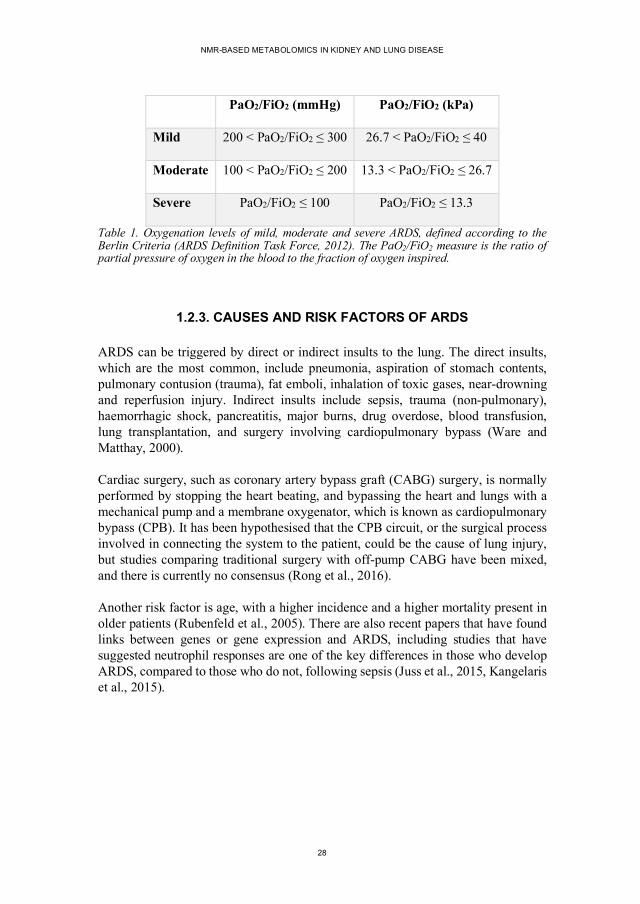
Figure 6. Illustration of the airways in the lung. The alveoli are the smallest functional unit of the lung, where gas exchange between the blood and air occurs. Illustration: Colourbox.com.
1.2.2. DIAGNOSING ARDS
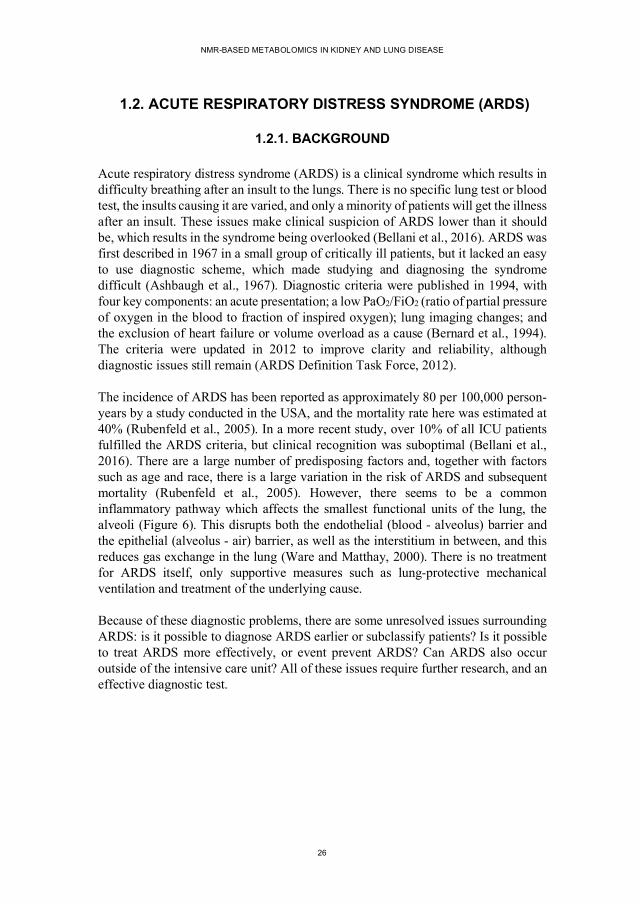
Diagnostic criteria for ARDS, known as the Berlin definition, have been developed, and require four conditions to be met: the condition has to occur within one week of a known clinical insult; blood oxygen levels must be low (Table 1); imaging must be consistent with ARDS; and cardiac failure or fluid overload must be (at least partially) excluded (ARDS Definition Task Force, 2012). The difficulties with these diagnostic criteria include: chest x-ray interpretation can be subjective, cardiac function may be difficult to assess, and the inhaled oxygen partial pressure (and the PaO2/FiO2 ratio) may be difficult to measure. Even lung biopsy is not a reliable diagnostic test in less severe disease (Cardinal-Fernández et al., 2016). In short, there is no definitive gold standard test for ARDS.
Table 1. Oxygenation levels of mild, moderate and severe ARDS, defined according to the Berlin Criteria (ARDS Definition Task Force, 2012). The PaO2/FiO2 measure is the ratio of partial pressure of oxygen in the blood to the fraction of oxygen inspired.
1.2.3. CAUSES AND RISK FACTORS OF ARDS
ARDS can be triggered by direct or indirect insults to the lung. The direct insults, which are the most common, include pneumonia, aspiration of stomach contents, pulmonary contusion (trauma), fat emboli, inhalation of toxic gases, near-drowning and reperfusion injury. Indirect insults include sepsis, trauma (non-pulmonary), haemorrhagic shock, pancreatitis, major burns, drug overdose, blood transfusion, lung transplantation, and surgery involving cardiopulmonary bypass (Ware and Matthay, 2000).
Cardiac surgery, such as coronary artery bypass graft (CABG) surgery, is normally performed by stopping the heart beating, and bypassing the heart and lungs with a mechanical pump and a membrane oxygenator, which is known as cardiopulmonary bypass (CPB). It has been hypothesised that the CPB circuit, or the surgical process involved in connecting the system to the patient, could be the cause of lung injury, but studies comparing traditional surgery with off-pump CABG have been mixed, and there is currently no consensus (Rong et al., 2016).
Another risk factor is age, with a higher incidence and a higher mortality present in older patients (Rubenfeld et al., 2005). There are also recent papers that have found links between genes or gene expression and ARDS, including studies that have suggested neutrophil responses are one of the key differences in those who develop ARDS, compared to those who do not, following sepsis (Juss et al., 2015, Kangelaris et al., 2015).
CHAPTER 1. INTRODUCTION
29
1.2.4. MECHANISMS OF ARDS
The blood-air interface in the lungs is a unique structure which has evolved to ensure efficient gas exchange. There are multiple mechanisms to keep the extremely small airspaces open and the distance between the airspace and the blood short. The alveolus, the smallest functional unit of the lungs, are lined by type I cells, which are thin and flat, and type II cells, which secrete surfactant to stop the alveoli from collapsing. The blood capillaries are lined by vascular endothelial cells, and between these surfaces is a thin interstitial space. The entire blood-air barrier is only a few micrometres thick, which is essential to allow oxygen and carbon dioxide to diffuse across efficiently (Matthay et al., 2019).
In ARDS, the lining of the blood vessels becomes more permeable, and fluid and protein are pushed into the lung tissue and into the airspace of the alveoli. Fluid in the airspace and inflammatory processes in the tissue make it more difficult for gasses to diffuse across. This leads to respiratory failure, with low oxygen concentrations and high carbon dioxide concentrations in the blood. In addition to the cells lining the airspaces and blood vessels, immune cells are also important in the disease process, especially in the continuation or exacerbation of injury, and also in resolving the damage during the healing process (Matthay et al., 2019).
There appear to be multiple phases in ARDS, for example an acute exudative phase which is followed by a proliferative phase, but histopathological changes show a great deal of heterogeneity. For example, there appears to be a hyperinflammatory subtype with different clinical features and different outcomes (Calfee et al., 2014). Apart from differences in the inflammatory response, many other mechanisms are also thought to play a role, such as mechanical damage from ventilation, ischaemia and reperfusion, and fluid balance. Connecting multiple, very different, risk factors to different pathological mechanisms is perhaps one of the reasons that ARDS mechanisms have been difficult to study, and treatment strategies hard to find.
1.2.5. TREATMENT AND OUTCOMES OF ARDS
Unfortunately, there is no effective pharmacotherapy for ARDS to date, and management consists of treating the cause or risk factors and supportive treatment. The role medical interventions play in causing or prolonging injury is the focus of much research, especially with regards to ventilation strategies. The lung-protective ventilation strategy uses a lower tidal volume than traditionally used, and has been shown to result in a lower mortality (Acute Respiratory Distress Syndrome Network, 2000); and a conservative fluid management strategy has been shown to improve lung function, and shorten the duration of ventilation and intensive care treatment (National Heart, Lung, and Blood Institute Acute Respiratory Distress Syndrome
NMR-BASED METABOLOMICS IN KIDNEY AND LUNG DISEASE
30
(ARDS) Clinical Trials Network, 2006). Research studies have unsuccessfully trialled statins, corticosteroids and even aspirin in prevention, and although the results have all been negative, there have been interesting results involving subgroups of the data (Abdulnour et al., 2018, Matthay et al., 2019).
As mentioned earlier, mortality following ARDS is extremely high, over 35 % in ventilated patients (Bellani et al., 2016). Pulmonary function, in those who survive, takes months to return to near normal levels, and there are multiple long-term problems, such as reduced quality of life and difficulty in returning to work (Davidson et al., 1999). These issues also suggest that treatment or prevention would be meaningful, and potentially cost-effective.
1.2.6. SUMMARY
ARDS can be a result of various diverse insults, which either directly or indirectly affect the lungs. There are various predisposing factors, different subtypes, different responses to treatment strategies, and heterogeneity in the time course, all making study of the disease difficult. As mentioned previously in connection to CKD, it is easier to study and treat an illness when it can be measured simply and objectively. Therefore, a diagnostic biomarker would be immensely useful, and in such a diverse syndrome, a biomarker that could subcategorise patients could help simplify research into the disease.
CHAPTER 1. INTRODUCTION
31
1.3. METABOLOMICS
1.3.1. BACKGROUND
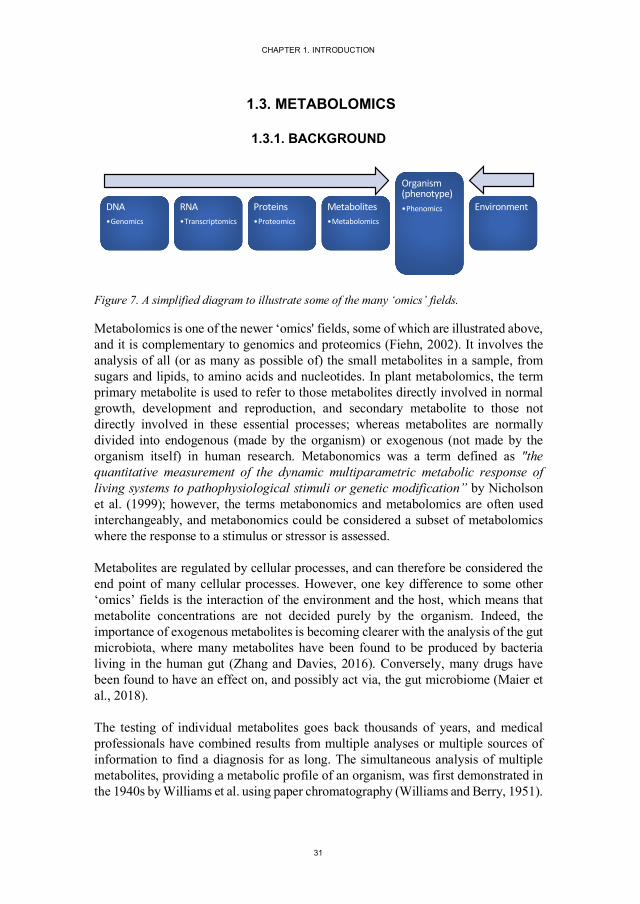
Figure 7. A simplified diagram to illustrate some of the many ‘omics’ fields.
Metabolomics is one of the newer ‘omics' fields, some of which are illustrated above, and it is complementary to genomics and proteomics (Fiehn, 2002). It involves the analysis of all (or as many as possible of) the small metabolites in a sample, from sugars and lipids, to amino acids and nucleotides. In plant metabolomics, the term primary metabolite is used to refer to those metabolites directly involved in normal growth, development and reproduction, and secondary metabolite to those not directly involved in these essential processes; whereas metabolites are normally divided into endogenous (made by the organism) or exogenous (not made by the organism itself) in human research. Metabonomics was a term defined as "the quantitative measurement of the dynamic multiparametric metabolic response of living systems to pathophysiological stimuli or genetic modification” by Nicholson et al. (1999); however, the terms metabonomics and metabolomics are often used interchangeably, and metabonomics could be considered a subset of metabolomics where the response to a stimulus or stressor is assessed.
Metabolites are regulated by cellular processes, and can therefore be considered the end point of many cellular processes. However, one key difference to some other ‘omics’ fields is the interaction of the environment and the host, which means that metabolite concentrations are not decided purely by the organism. Indeed, the importance of exogenous metabolites is becoming clearer with the analysis of the gut microbiota, where many metabolites have been found to be produced by bacteria living in the human gut (Zhang and Davies, 2016). Conversely, many drugs have been found to have an effect on, and possibly act via, the gut microbiome (Maier et al., 2018).
The testing of individual metabolites goes back thousands of years, and medical professionals have combined results from multiple analyses or multiple sources of information to find a diagnosis for as long. The simultaneous analysis of multiple metabolites, providing a metabolic profile of an organism, was first demonstrated in the 1940s by Williams et al. using paper chromatography (Williams and Berry, 1951).
DNA•Genomics
RNA•Transcriptomics
Proteins•Proteomics
Metabolites•Metabolomics
Organism (phenotype)•Phenomics Environment
NMR-BASED METABOLOMICS IN KIDNEY AND LUNG DISEASE
32
Horning et al. put forward the term "metabolic profile" in 1971 (Horning and Horning, 1971). Testing multiple metabolites simultaneously has evolved rapidly, not just in the field of metabolomics, but the large amounts of data produced have required new analysis methods and computing power, and the development of these started to take off in the 1970s and 1980s in the field known as chemometrics. Chemometrics developed in parallel with psychometrics and econometrics, as mathematical and statistical methods were used to analyse data in chemistry, psychology and economics (Wold, 1995). In the following sections I will briefly discuss both the methods used in chemical analysis to generate the data, and the methods used to analyse the large amounts of data.
1.3.2. CHEMICAL ANALYSIS
Chemical analysis, to quantify and identify metabolites, is a challenging process compared to other ‘omics’ fields, because metabolites have a wide variety of chemical composition, as well as a range of sizes, charges and concentrations. This means that no single chemical analysis method can cover the entire metabolome. Nuclear magnetic resonance spectroscopy (NMR) and mass spectrometry (MS) are the two most commonly used metabolomics platforms, and they have different metabolite coverages and sensitivities, and different strengths and weaknesses. Other methods include Raman spectroscopy and infrared spectroscopy, and all of these methods can be used in parallel to extract more chemical information.
NMR is based upon the detection of NMR sensitive nuclei, and is described in detail below. Advantages of NMR over MS include better reproducibility, simpler sample preparation (which generally translates to faster analysis), the possibility of in-vivo studies using magnetic resonance spectroscopy (MRS), and the possibility of studying intact tissue samples using high-resolution magic-angle spinning (HRMAS) NMR spectroscopy (Bezabeh et al., 2014, Markley et al., 2017). Simpler sample preparation is also important in minimising variability at this experimental stage, which helps to reduce false positive or false negative results. NMR spectra can also be used directly to deduce metabolite structure and identity, even of unknown or new compounds.
MS is normally used in combination with a chromatography step, for example gas or liquid chromatography (GC or LC), which separates the metabolites via differing physicochemical properties, such as polarity or volatility. MS involves the detection of ions, so metabolites must first be ionised, and different processes can be used to achieve ionisation, although not all metabolites can be ionised equally well. Once metabolites are ionised, a detector can then register their mass-to-charge ratio. Coupling different chromatography steps with different ionisation methods, and using different MS detection methods, means that there is a large variety of different
CHAPTER 1. INTRODUCTION
33
combinations which can be used in parallel to gain better coverage of the metabolome.
Advantages of MS over NMR, dependent upon which chromatography method is used, include the higher sensitivity and higher specificity possible, which means that smaller sample volumes are needed and more metabolites can be detected. Targeted analysis is also possible, again depending upon the type of equipment used, and start-up costs are also potentially much smaller. Because of these advantages, the number of MS-based publications is growing faster than NMR-based publications, however, as discussed earlier, NMR still offers advantages that are important and relevant.
The identification of metabolites found in the spectra normally requires a database of metabolites, for example, METLIN or HMDB (Guijas et al., 2018, Wishart et al., 2018). The number of known metabolites is constantly increasing, for example, the Human Metabolome Database (HMDB) contained about 2180 human metabolites in version 1 (2007), 6408 in version 2 (2009), 40153 in version 3 (2013), and 114100 in version 4 (2018) (Wishart et al., 2018). METLIN contains over one million compounds (Guijas et al., 2018). These huge numbers illustrate how complex metabolomics is becoming, especially metabolite identification and pathway analysis.
1.3.2.1 Fundamentals of NMR Spectroscopy
The theoretical basis of NMR spectroscopy can be described using either classical mechanics or quantum mechanics. Although classical mechanics has limitations, it is easier to conceptualise, and therefore the following explanation of the principles of NMR spectroscopy will be based on classical mechanics.
Spin is a property of elementary particles and is a form of angular momentum. Nuclei with an odd number of protons and/or neutrons have a non-zero nuclear spin and possess the properties of a magnetic dipole, known as the nuclear magnetic moment. The most common nuclei used for NMR are 1H, 13C, 15N and 31P, which all have a spin quantum number of ½. With a spin quantum number of ½, the simplest case for NMR-sensitive nuclei, when the nuclei are placed in a constant magnetic field (B0) they will have two possible states, either parallel (spin-up), or anti-parallel (spin-down), to the magnetic field. There is a difference in energy between these two states, given by Equation 2.
NMR-BASED METABOLOMICS IN KIDNEY AND LUNG DISEASE
34
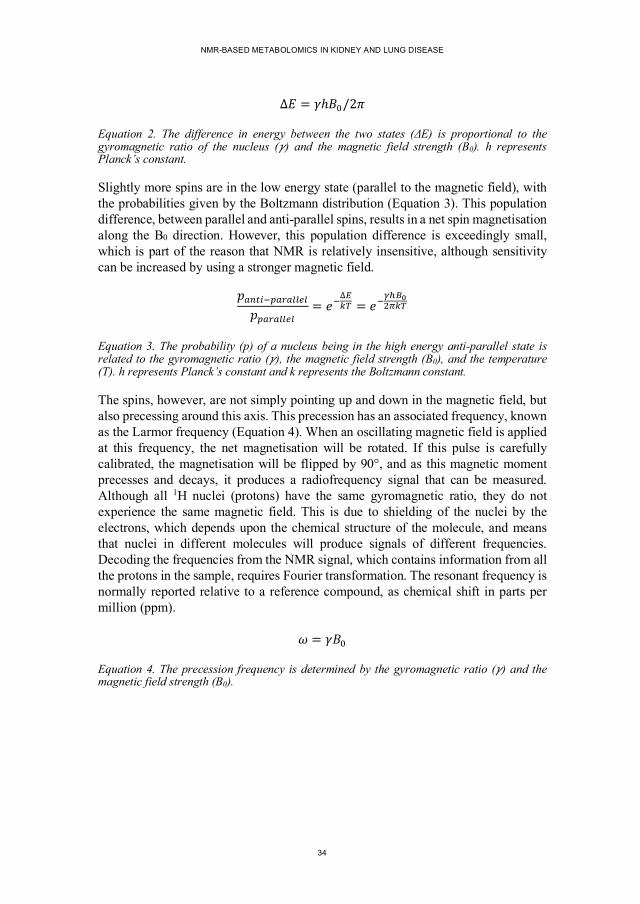
∆𝐸 = 𝛾ℎ𝐵G/2𝜋
Equation 2. The difference in energy between the two states (ΔE) is proportional to the gyromagnetic ratio of the nucleus (𝛾) and the magnetic field strength (B0). h represents Planck’s constant.
Slightly more spins are in the low energy state (parallel to the magnetic field), with the probabilities given by the Boltzmann distribution (Equation 3). This population difference, between parallel and anti-parallel spins, results in a net spin magnetisation along the B0 direction. However, this population difference is exceedingly small, which is part of the reason that NMR is relatively insensitive, although sensitivity can be increased by using a stronger magnetic field.
𝑝9382LM919<<4<𝑝M919<<4<
= 𝑒L∆NOP = 𝑒L
QRSTUVOP
Equation 3. The probability (p) of a nucleus being in the high energy anti-parallel state is related to the gyromagnetic ratio (𝛾), the magnetic field strength (B0), and the temperature (T). h represents Planck’s constant and k represents the Boltzmann constant.
The spins, however, are not simply pointing up and down in the magnetic field, but also precessing around this axis. This precession has an associated frequency, known as the Larmor frequency (Equation 4). When an oscillating magnetic field is applied at this frequency, the net magnetisation will be rotated. If this pulse is carefully calibrated, the magnetisation will be flipped by 90°, and as this magnetic moment precesses and decays, it produces a radiofrequency signal that can be measured. Although all 1H nuclei (protons) have the same gyromagnetic ratio, they do not experience the same magnetic field. This is due to shielding of the nuclei by the electrons, which depends upon the chemical structure of the molecule, and means that nuclei in different molecules will produce signals of different frequencies. Decoding the frequencies from the NMR signal, which contains information from all the protons in the sample, requires Fourier transformation. The resonant frequency is normally reported relative to a reference compound, as chemical shift in parts per million (ppm).
𝜔 = 𝛾𝐵G
Equation 4. The precession frequency is determined by the gyromagnetic ratio (𝛾) and the magnetic field strength (B0).
CHAPTER 1. INTRODUCTION
35
1.3.2.2 Extracting Information From NMR Spectra
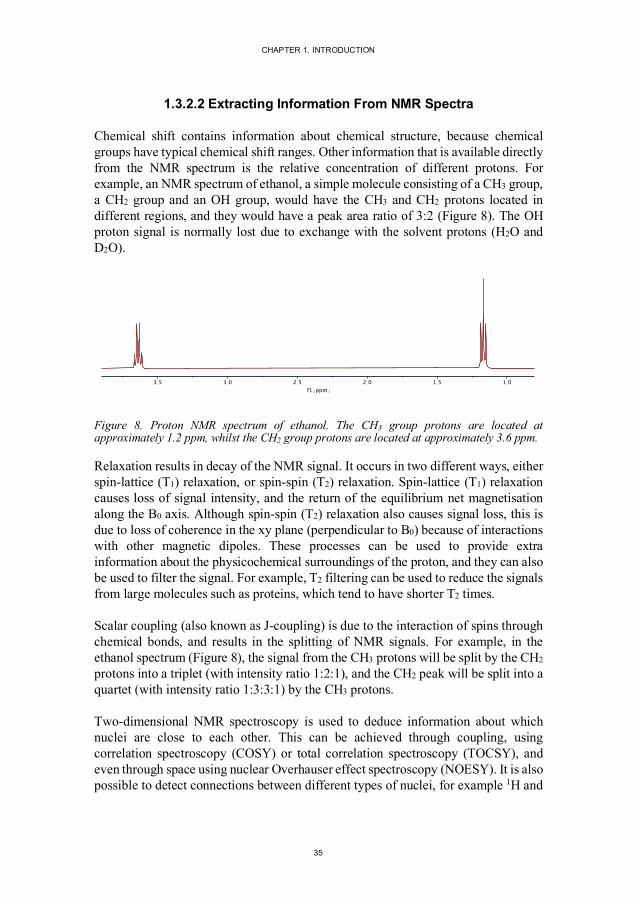
Chemical shift contains information about chemical structure, because chemical groups have typical chemical shift ranges. Other information that is available directly from the NMR spectrum is the relative concentration of different protons. For example, an NMR spectrum of ethanol, a simple molecule consisting of a CH3 group, a CH2 group and an OH group, would have the CH3 and CH2 protons located in different regions, and they would have a peak area ratio of 3:2 (Figure 8). The OH proton signal is normally lost due to exchange with the solvent protons (H2O and D2O).
Figure 8. Proton NMR spectrum of ethanol. The CH3 group protons are located at approximately 1.2 ppm, whilst the CH2 group protons are located at approximately 3.6 ppm.
Relaxation results in decay of the NMR signal. It occurs in two different ways, either spin-lattice (T1) relaxation, or spin-spin (T2) relaxation. Spin-lattice (T1) relaxation causes loss of signal intensity, and the return of the equilibrium net magnetisation along the B0 axis. Although spin-spin (T2) relaxation also causes signal loss, this is due to loss of coherence in the xy plane (perpendicular to B0) because of interactions with other magnetic dipoles. These processes can be used to provide extra information about the physicochemical surroundings of the proton, and they can also be used to filter the signal. For example, T2 filtering can be used to reduce the signals from large molecules such as proteins, which tend to have shorter T2 times.
Scalar coupling (also known as J-coupling) is due to the interaction of spins through chemical bonds, and results in the splitting of NMR signals. For example, in the ethanol spectrum (Figure 8), the signal from the CH3 protons will be split by the CH2 protons into a triplet (with intensity ratio 1:2:1), and the CH2 peak will be split into a quartet (with intensity ratio 1:3:3:1) by the CH3 protons.
Two-dimensional NMR spectroscopy is used to deduce information about which nuclei are close to each other. This can be achieved through coupling, using correlation spectroscopy (COSY) or total correlation spectroscopy (TOCSY), and even through space using nuclear Overhauser effect spectroscopy (NOESY). It is also possible to detect connections between different types of nuclei, for example 1H and
1.01.52.02.53.03.5
f1(ppm)
pdata/1
NMR-BASED METABOLOMICS IN KIDNEY AND LUNG DISEASE
36
13C, using heteronuclear correlation experiments such as heteronuclear single-quantum correlation spectroscopy (HSQC) or heteronuclear multiple-bond correlation spectroscopy (HMBC). Two-dimensional spectra can also be generated by using other types of information along the second axis. The J-coupling information mentioned earlier can be moved onto the y-axis to construct simpler spectra, with less peak overlap along the x-axis. Diffusion coefficients can also be measured with NMR experiments, and plotted on the y-axis, resulting in diffusion ordered spectroscopy (DOSY).
By combining information from two or more of these different experiments, peaks in the NMR spectra can be identified, and by integrating NMR peaks, metabolites can be quantified. However, care has to be taken to ensure that certain assumptions have been met, and if these assumptions cannot be met, relative quantitation can be used instead of absolute quantitation.
1.3.2.3 NMR Pulse Sequences
Although a simple 90° pulse would result in an NMR signal, called a free induction decay (Figure 9A), most modern pulse sequences are a combination of multiple pulses. These pulse sequences are designed to: alleviate experimental problems, such as magnetic field inhomogeneity or the large concentration of protons in water; simplify complex and crowded spectra; or obtain extra information about the metabolites (as discussed above). The simplest addition is called presaturation, where irradiation at the specific frequency of an unwanted signal, such as the solvent signal, at a low power for a relatively long duration will cause the solvent signals to become saturated. This results in a minimisation of the difference in the number of nuclei in the high and low energy states, and the resulting NMR signal. Presaturation is normally applied during the delay between repetitions of the pulse sequence.
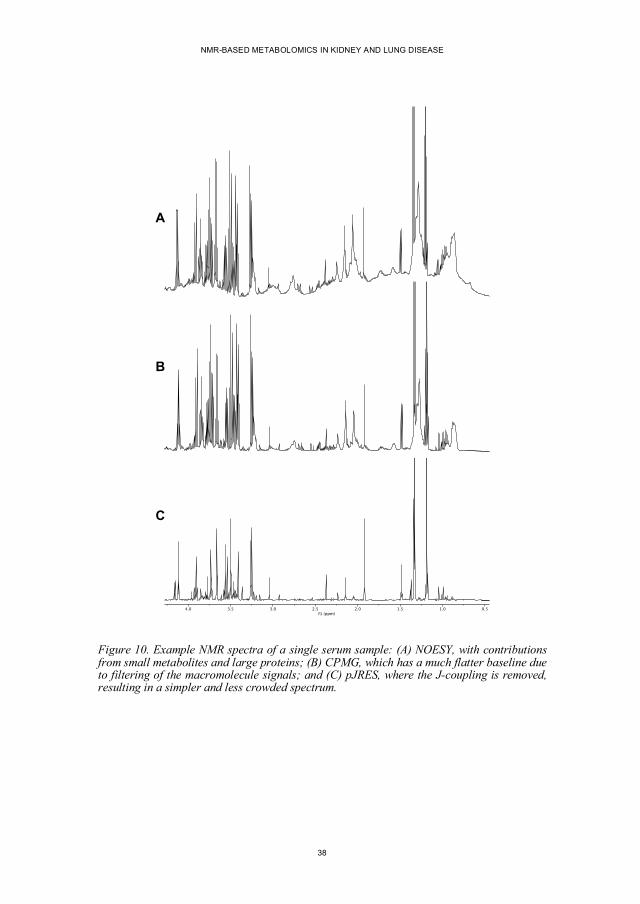
In the 1D NOESY experiment (Figure 9B), the single 90° pulse is replaced by three 90° pulses. Together with phase cycling, this has the effect of reducing problems caused by the edges of the sample, which are in a less homogenous region of the magnetic field. A typical serum NOESY spectrum is illustrated in Figure 10A. In the Carr-Purcell-Meiboom-Gill (CPMG) experiment (Figure 9C), a repeated 180° pulse with associated delays is added to the 90° pulse. This addition has the ability to attenuate signals based upon their T2 relaxation times, and because large molecules such as proteins have shorter T2 times, their signals will be lost more quickly than small metabolites. This method is known as T2 filtering, and results in an improved baseline in protein-rich samples (Figure 10B). This filtering, however, can also attenuate signals from metabolites with longer T2 times and therefore alters the quantitative nature of the NMR spectra.
CHAPTER 1. INTRODUCTION
37
Figure 9. (A) Basic 90° NMR pulse followed by signal acquisition of the free induction decay (FID). (B) 1D NOESY NMR pulse sequence with two extra 90° pulses. (C) CPMG NMR pulse sequence, where the bracketed 180° pulse is repeated n times. (D) J-resolved NMR pulse sequence, recorded with varying delays (𝜏) to enable J-coupling to be analysed in a two-dimensional spectrum.
The J-resolved experiment (Figure 9D) is a two-dimensional NMR experiment, where the J-coupling (mentioned earlier) is moved into the second dimension. This is achieved by a spin echo pulse sequence (90° pulse followed by a 180° pulse) with varying delays (𝜏). During these delays, the J-coupling continues to evolve, whilst the chemical shift evolution is refocused. This type of spectrum is often “projected” into one dimension, so that multivariate analysis can be performed on a simplified spectrum, with less crowding and less overlapping peaks (Figure 10C).
90°
90°90°90°
m
180°90°
� �
{ }n
180°90°
� �
� �
B
A
C
D
NMR-BASED METABOLOMICS IN KIDNEY AND LUNG DISEASE
38
Figure 10. Example NMR spectra of a single serum sample: (A) NOESY, with contributions from small metabolites and large proteins; (B) CPMG, which has a much flatter baseline due to filtering of the macromolecule signals; and (C) pJRES, where the J-coupling is removed, resulting in a simpler and less crowded spectrum.
0.51.01.52.02.53.03.54.0f1 (ppm)
B
A
C
CHAPTER 1. INTRODUCTION
39
1.3.3. MULTIVARIATE ANALYSIS (CHEMOMETRICS)
Chemical analysis results in a table of data, ideally a list of concentrations of different metabolites in different samples. However, the table is often a list of the response of the chemical detector at different positions on a separation scale, for example frequency in parts per million (ppm) for NMR or mass-to-charge ratio for MS. Often there is more than one separation scale, such as the chromatography axis, and often there are multiple samples per individual. This results in a messy data structure, where much of it contains no information (noise), and some regions contain overlapping metabolite signals. Differences between individuals which are unrelated to the specific study are an additional layer of complexity, and there may also be missing data. To find the relevant patterns in these complex datasets, it is necessary to turn to algorithms and computer processing power.
Algorithms used in metabolomics include principal component analysis (PCA), partial least squares regression (PLS), and partial least squares discriminant analysis (PLS-DA), which were used in this thesis. Other algorithms include factor analysis, K-means clustering, artificial neural networks, support vector machines, and Bayesian networks. Some of these methods are based upon statistical methods, whilst others are based upon geometric methods, although there is overlap, and the term data science is possibly flexible enough to cover the various and widely differing approaches.
1.3.3.1 Principal Component Analysis and Partial Least Squares Regression
PCA was developed at the beginning of the 20th century by Karl Pearson (1901). It is an orthogonal linear transformation, which expresses the data (the X matrix) in a new coordinate system in order to maximise the variance on the first axis. The subsequent axes are found by removing the contribution of the first axis, and finding the next orthogonal axis with the next largest variance. By finding the maximum variance in the data, it is hoped that interesting or relevant patterns can be found. The first few principal components (the new coordinate system) offer a simplified view of the data, and PCA is often used to reduce the dimensionality of large data sets, although there is no guarantee that the first components will contain the grouping that is of interest to the study. The data can be visualised in the new coordinate system, which is called a scores plot, whilst the contribution of the original variables to the new coordinates system is known as a loadings plot (illustrated in Figure 11).
NMR-BASED METABOLOMICS IN KIDNEY AND LUNG DISEASE
40
Figure 11. Using PCA on a dataset to produce scores and loadings plots. Three variables (x1, x2 and x3) can be transformed onto two principal components (t1 and t2), which reveals a difference between the two groups. Reproduced with permission (Trygg et al., 2007). Copyright (2007) American Chemical Society.
Whereas PCA is an unsupervised method, PLS is a supervised method where extra information (the Y matrix), such as treatment group or outcome, is used to find the relationship between the two sets of data. In a similar way to PCA, new axes are found, but these axes try to capture the variance in both the data (the X matrix) and the extra information (the Y matrix). PLS-DA is simply PLS where the Y matrix consists of categorical information.
1.3.3.2 Pre-processing
As alluded to above, PCA and PLS do not always find new axes that are relevant to the study. This can be due to patterns and groupings that are significant, but not immediately interesting, but this can also be due to variation in the data that is irrelevant. The most obvious source of unwanted differences is in sample concentration. This can be dealt with by normalising the data, ideally with information about the original sample size or concentration. If this is unknown, other normalisation procedures can be tried, for example by using: signals in the sample which are thought to be constant; the total intensity of all signals; an internal standard, added after sample collection; and if the analytical system is stable enough, an external standard. If none of these methods are suitable, different algorithms can be used to make the samples more comparable (Emwas et al., 2018).
CHAPTER 1. INTRODUCTION
41
Another source of unwanted variation relates to the magnitude of individual variables, because the relative size of the variables affects the magnitude of the variance, and therefore, variables of larger intensity will generally dominate the model. This can be useful, as noise is normally present at a much smaller magnitude than signal, but it can also be a problem when unimportant signals are larger than important signals. This problem can be mitigated by scaling the data, where variables are divided by a scaling factor such as the standard deviation, or the square root of the standard deviation, of the particular variable. Other pre-processing steps that are used include mean centring, used to remove the average from the data, and log transformation, which can be helpful in reducing heteroscedasticity (van den Berg et al., 2006).
Data can also suffer from alignment problems, also known as the correspondence problem, where peaks corresponding to the same metabolite do not appear in the same position (Aberg et al., 2009). In NMR, this can be due to small differences in sample pH, temperature, or metal ion concentration, and some alignment problems can be improved with algorithms such as icoshift (Savorani et al., 2010). However, whilst this can cause difficulties in data analysis, it can also be an extra source of information, especially in urine NMR-based metabolomics, where recent studies have highlighted the possibility of predicting the concentration of NMR invisible ions from the chemical shift of NMR visible metabolites (Takis et al., 2017, Tredwell et al., 2016).
1.3.3.3 Outliers, Overfitting and Validation
During model building, the complexity of the model has to be determined, and whether or not outlying samples should be excluded from the process. The most serious problem, however, is over-fitting the data, i.e. making the model so complex that it only fits the data that has been used to train it. In a similar way, outlying samples can dominate the model, and therefore make it less generalisable. Validation is a term for a number of techniques which can be used to decide on the appropriate level of model complexity, to decide which outlying samples need to be removed, and to assess the model performance. One of the simplest methods is cross-validation, which is accomplished by leaving a small number of samples out, building the model on the remaining data, and then testing how well the model predicts the samples that have been left out. This can be repeated to use different samples, and arrive at a cumulative result for the whole dataset.
Other methods to assess the model include permutation testing, jackknifing or bootstrapping. Unfortunately, even after these validation steps, models can be over optimistic, or important variables can be missed. Testing the model on an independent dataset, a completely new block of data which has not been used to build
NMR-BASED METABOLOMICS IN KIDNEY AND LUNG DISEASE
42
and optimise the model, is extremely important and is the best way to critically assess a model and to avoid bias. These problems are discussed further below in section 1.3.6.
1.3.4. ‘OMICS’ STUDIES IN CKD
‘Omics’ studies have many possible roles in medicine. For example, they can be used to better subclassify disease, or even reclassify diseases, which can result in more effective and personalised treatments. New biomarkers can also be useful for diagnosing disease, monitoring disease and monitoring treatment, whilst new findings can lead to a better understanding of the mechanisms of disease.
Genomics has been successfully used to find some of the genetic causes of kidney diseases, such as autosomal dominant polycystic kidney disease and Alport syndrome. Although relatively common monogenic disorders are the easiest to investigate, there have also been some findings linking genes to the risk of kidney disease, and others estimating the heritability of GFR (Nadkarni and Horowitz, 2016). One example is the APOL1 gene risk alleles, which have been found to lead to a greater risk of focal segmental glomerulosclerosis or hypertensive end-stage kidney disease, and which are common amongst African Americans (Friedman and Pollak, 2011).
Proteomics has been used extensively in CKD, and has, for example, led to the discovery and validation of CKD273, a panel of 273 urinary peptides which was better at detecting and predicting progression of CKD than albuminuria and baseline eGFR (Schanstra et al., 2015). Other protein markers (not necessarily discovered by proteomics studies) such as kidney injury molecule-1 (KIM-1), neutrophil gelatinase-associated lipocalin (NGAL), N-acetyl-ß-D-glucosaminidase (NAG) and liver fatty acid binding protein (L-FABP) have been assessed, and do not seem to improve on the predictive values of eGFR and ACR (Hsu et al., 2017). Cystatin C, a protein produced by all nucleated cells, which is freely filtered in the glomerulus and then reabsorbed and catabolised in the kidney, is the only new biomarker that is close to clinical use. It has been used to estimate GFR, and when used in combination with creatinine, has proven to be more accurate and more precise than either marker alone (Inker et al., 2012). Studies have also shown that cystatin C levels are a better predictor of morbidity and mortality in the elderly than eGFR (Shlipak et al., 2005).
Much research has been published using metabolomics methods in kidney disease. Most early studies looked at acute kidney injury (AKI) after an insult to the kidneys, often in animal models, but metabolomics articles about CKD in humans are increasing in number. One of the first uses of GC-MS in CKD was an analysis of serum (Niwa et al., 1979), whilst one of the first NMR papers was published later
CHAPTER 1. INTRODUCTION
43
(Bell et al., 1991). Examples of metabolites that have been confirmed to be altered in CKD by metabolomics studies include amino acid derivatives, such as the tryptophan metabolites indoxyl sulfate and p-cresyl sulfate; the arginine metabolites, symmetric and asymmetric dimethylarginine (SDMA and ADMA); and phenylacetylglycine, a glycine conjugate of phenylacetic acid (Zhao, 2013). Purine metabolites such as hypoxanthine, xanthine, uric acid and allantoin have also been found to be significantly different in animal models of CKD (Zhao et al., 2011, Zhao et al., 2013). And a comparison of haemodialysis patients, peritoneal dialysis patients and controls revealed that hypoxanthine and inosine were only detected in the haemodialysis group (Choi et al., 2011). Plasma concentrations of carnitine and acylcarnitines have been found to be inversely correlated with eGFR in a large population study (Goek et al., 2012), but carnitine was found to positively correlate with eGFR in another study (Yu et al., 2014). Many fatty acids have also been described to be affected by CKD in metabolomics studies (Rhee et al., 2010, Zhao et al., 2013).
The difficulty using metabolomics in CKD is trying to distinguish between metabolites that accumulate because of reduced kidney function and those that are toxic and actually cause morbidity and mortality. It is relatively easy to apply new metabolomics techniques to find new metabolites affected by CKD, but it is more difficult to connect these metabolites to disease processes or outcome. However, there has been some recent progress in large-scale studies looking at biomarkers that can predict incident CKD, or that are linked to future morbidity or mortality. For example, Rhee et al. applied LC-MS-based metabolomics to 1434 participants from the Framingham Heart Study who did not have CKD, and found 16 metabolites to be significantly different in those who went on to develop CKD during follow up (Rhee et al., 2013). Goek et al. followed 1104 participants in the Cooperative Health Research in the Region of Augsburg (KORA) cohort and found a significant association between the annual change in eGFR and baseline levels of three metabolites or metabolite ratios; and they also found a link between the kynurenine-to-tryptophan ratio and a subsequent new diagnosis of CKD (Goek et al., 2013). Yu et al. used GC-MS and LC-MS metabolomics on serum from 1921 participants in the Atherosclerosis Risk in Communities (ARIC) study and found that baseline 5-oxoproline and 1,5-anhydroglucitol levels were significantly associated with new cases of CKD. But the predictions based upon these metabolites did not improve on clinical models based upon traditional risk factors, such as blood pressure, diabetes, cholesterol and smoking (Yu et al., 2014).
In the only large-scale study to be validated in a completely independent test set, Hu et al. investigated the relationship between serum metabolites and all-cause mortality (up to 19 years later) in 299 patients from the Modification of Diet in Renal Disease (MDRD) cohort, and then validated their findings using data from 963 patients in the African American Study of Kidney Disease and Hypertension (AASK) cohort. Three metabolites were significant in both cohorts: ribonate, fumarate and allantoin (Hu et al., 2018).
NMR-BASED METABOLOMICS IN KIDNEY AND LUNG DISEASE
44
In summary, there have been many interesting findings, and metabolomics has found many metabolites that have altered concentrations in CKD. However, a consensus is lacking, connecting findings to disease mechanisms is problematic, and focusing on eGFR ignores losses of other important kidney functions. Furthermore, large-scale and adequately validated research is only appearing slowly.
1.3.5. ‘OMICS’ STUDIES IN ARDS
There is not as much literature on ARDS compared to CKD, presumably because ARDS has not existed for as long as CKD, but also because it is more heterogenous, and therefore more difficult to study. The role of the kidneys in removing substances from the blood also makes it easier to find metabolites that are significantly affected in CKD. Most ‘omics’ studies on lung diseases are based on the chronic diseases asthma and COPD, and currently most research in ARDS has been conducted on protein markers. For example, serum lipopolysaccharide binding protein (LBP) concentrations were found to be higher in septic patients who subsequently developed ARDS (Villar et al., 2009). Another protein, the soluble receptor for advanced glycation end-products (sRAGE), is highly expressed in the lung epithelium. Studies have shown that blood levels of sRAGE are associated with the severity of lung injury or mortality (Calfee et al., 2008, Uchida et al., 2006), and plasma levels of sRAGE have been linked to respiratory failure after cardiac surgery (Uchida et al., 2013). Interleukin-8 (IL-8), which is a pro-inflammatory cytokine, has also been associated with mortality and the risk of developing ARDS (Donnelly et al., 1993, Parsons et al., 2005). Other proteins that have been studied include angiopoietin-2, surfactant protein D and procollagen peptides. None of these markers are in routine clinical use and, because of the limited individual predictive value of these biomarkers, research has been carried out on combinations of them. For example, a panel of seven biomarkers including RAGE, procollagen peptide III, brain natriuretic peptide, angiopoietin-2, tumour necrosis factor alpha, IL-8 and IL-10 produced a predictive model with an area under the receiver operating characteristic (AUROC) curve of 0.86 (Fremont et al., 2010).
Plasma free fatty acids have been studied by Shi et al., and higher concentrations were associated with lower PaO2/FiO2 ratios postoperatively (Shi et al., 2015). Stringer et al. compared plasma from patients with sepsis-induced ARDS and healthy controls, and found significant differences in glutathione, adenosine, phosphatidylserine and sphingomyelin concentrations (Stringer et al., 2011). Evans et al. analysed bronchoalveolar lavage fluid (BALF) from ARDS patients and healthy controls, and found much higher concentrations of many metabolites, including: hypoxanthine, guanosine, uridine, xanthine, hippurate, leucine, proline, glutamate, phenylalanine, threonate, tyrosine, tryptophan, creatinine, creatine, acetylcarnitine, citrate, lactate, cis-aconitate, and 2-oxoglutarate; whereas it was mostly fatty acids
CHAPTER 1. INTRODUCTION
45
that were at much lower levels in ARDS patients, including many phosphatidylcholines (Evans et al., 2014). Testing exhaled breath for volatile organic compounds (VOCs) is a promising method to non-invasively assess the lungs. In one paper three VOCs, octane, acetaldehyde and 3-methylheptane, were found to be significantly higher in ARDS patients using GC-MS (Bos et al., 2014), and in another paper isoprene was significantly lower in exhaled breath from ARDS patients (Schubert et al., 1998).
Genomics studies are difficult to conduct in such a varied and rare disease, but the first genome-wide association study in ARDS identified 159 significantly associated single-nucleotide polymorphisms (SNPs) (Christie et al., 2012), whilst a more recent paper identified SNPs within the selectin P ligand gene (Bime et al., 2018). Transcriptomics studies have also been conducted, reporting, for example, significant changes in neutrophil-related pathways in early disease (Kangelaris et al., 2015). As with all the other ‘omics’ technologies, robust validation and lack of consensus of findings is still a problem.
Perhaps the most interesting studies have been those that are able to stratify patients. For example, Bos et al. have described a distinct “reactive phenotype” in patients with sepsis and ARDS, where one third of genes were expressed differently in a transcriptomics study carried out on white blood cells (Bos et al., 2019). Rogers et al. compared lung oedema fluid from patients with ARDS and patients with hydrostatic oedema, and found a subset of ARDS patients with very high levels of many metabolites; this subset also had a much higher mortality (Rogers et al., 2017). Although not an ‘omics’ study, Calfee et al. also found distinct phenotypes, based upon clinical and biochemical characteristics, with significant differences in mortality, ventilator-free days and organ failure-free days (Calfee et al., 2014).
Although ‘omics’ studies can potentially offer much to ARDS and other diseases where the pathological mechanisms are still being resolved, there are plenty of problems where there is currently no gold standard diagnostic test. Perhaps the best studies have been those that attempt to subcategorise patients, which suggests that targeting treatment may be useful and that further research should probably focus on individual subcategories.
NMR-BASED METABOLOMICS IN KIDNEY AND LUNG DISEASE
46
1.3.6. ISSUES SURROUNDING ‘OMICS’ STUDIES
Many of the limitations of metabolomics are shared with the other ‘omics’ fields because of the statistical problems caused by a large number of variables and a relatively small number of samples. Metabolomics has some advantages over proteomics and genomics, for example, because metabolites are the end products of gene and protein regulation they can represent variation as a result of gene and protein differences as well as a result of responses to environmental factors. Another advantage is that there are a smaller number of metabolites than genes or proteins, which makes data analysis easier, although this is more than overwhelmed by the complexity of the multiple chemistries involved (Weiss and Kim, 2011). Some specific issues affecting ‘omics’ studies will be discussed in the following subsections.
1.3.6.1 Reproducibility
Many papers have reported on the reproducibility problems in science (Begley and Ioannidis, 2015). All of the ‘omics’ fields suffer from these problems because of the huge amount of data generated. Firstly, the data is noisy, either due to experimental issues or because of variation in the subject group, which can lead to misleading results. Secondly, in what has been described as the “fishing expedition” problem (Ning and Lo, 2010), many articles are small-scale discovery-mode studies based upon this unavoidably noisy data, and large-scale validation studies are rare.
Reproducibility is also a problem due to the use of univariate statistical methods after multivariate analysis. With such a large number of variables and a relatively small number of samples, all ‘omics’ experiments suffer from the “curse of dimensionality” (Altman and Krzywinski, 2018). This “large p small n” problem causes problems for traditional statistical methods, and can lead to type 1 errors (false positives, or finding something significant by chance alone), and type 2 errors (false negatives, or rejecting something that is actually significant), because sample sizes are small, and therefore the power of the study is small. Also, the requirement to keep the data used for validation separate from the data used to build the model also holds for the data used for statistical testing. In other words, using the same data to generate hypotheses and statistically test these hypotheses will result in more type 1 errors (false positives). This has been described as “post-hoc theorising”. Testing potentially useful biomarkers with satisfactory validation studies in a sufficiently large and independent group is necessary to avoid these problems.
Other problems with validation arise because models based upon one group cannot necessarily be used on another group, for example, models based on patients from one part of the world or one gender may not be applicable to patients from another
CHAPTER 1. INTRODUCTION
47
part of the world or another gender. Confirmation of results may also be difficult if different analytical techniques are used, which do not necessarily cover the same metabolites. These issues are a particular problem in heterogenous diseases, such as ARDS, where there are a variety of initial insults, for example, some studies are based upon ARDS following sepsis whilst others are based upon ARDS following trauma. Another problem with ARDS is the lack of a gold standard diagnostic test, with differences in diagnosis potentially adding to the complexity of validation studies.
These problems are clearly seen in the ‘omics’ in CKD and ARDS sections above (sections 1.3.4 and 1.3.5), where there is a lack of consensus about which metabolites, proteins and genes are significant across the various studies. Sometimes the problems occur because the different groups are not comparable, or because of different analytical methods; but incorrect metabolite identification of metabolites, and false positive findings are also potential reasons (Scalbert et al., 2009). We must also remember that this variability, and the amount of detail that ‘omics’ technologies provide, is a source of information. For example, there are many potential sources of variability that have not been analysed in these studies, such as diet, exercise, and diurnal rhythm. Also, as mentioned previously, diseases can have very different manifestations at different stages, and can be, or have been historically, subdivided in many different ways. And although we may not currently have the ability to deal with this complexity now, computational and mathematical methods are developing and will be able to solve these problems in the future. Other ways of handling this complexity include: carefully designed temporal, or crossover studies, where subjects are their own controls; animal experiments, where some sources of variability can be controlled; and meta-analysis of data sets to find common metabolites affected across multiple studies (Scalbert et al., 2009).
1.3.6.2 Correlation, Causality and Surrogate Markers
Metabolomics and multivariate analysis, in their simplest forms, can only find correlations between two variables and cannot find a causal link between the variables. This is reasonable for ‘omics’ studies, which are generally hypothesis generating, but proving causality is also important. The subject of causality, however, is more complex than it seems. The “causal pie model” was developed by Rothman (1976) and tries to explain the complexity of multifactorial situations, where more than one combination of factors can cause a particular disease (Figure 12). There may be one common factor in all of these combinations (a component necessary cause), or one factor may only be present in one combination (a component cause), or one factor on its own may be enough to cause the illness (a sufficient cause). Investigating complex multifactorial disease is difficult, and Ghezzi et al. have suggested that "conventional statistical analysis and study design will favour the identification of a causally irrelevant prognostic biomarker” (Ghezzi et al., 2018).
NMR-BASED METABOLOMICS IN KIDNEY AND LUNG DISEASE
48
Figure 12. Representation of different relationships between causes and disease. Oxidative stress (OS, red slices), for example, can be: a component necessary cause (A); a component, but not necessary, cause (B); or a sufficient cause (C). Reproduced with permission (Ghezzi et al., 2018). Copyright (2018) National Academy of Sciences.
This ties into the reproducibility problems mentioned earlier, as a factor that causes illness in one group may not be important in another group, and therefore may not be able to be validated using traditional statistical methods on the entire group. And ‘omics’ studies on real patients with multifactorial diseases may tend to pick up the common downstream events, which are not directly related to the disease.
Surrogate markers are another complicating issue in CKD and ARDS. CKD is a disease that develops slowly and the initial phase, which is often asymptomatic, can last for many years (Stevens et al., 2006). Even after symptoms occur, it can take many years before hard endpoints are reached, for example death or ESRD. This makes it difficult to conduct research on biomarkers and treatments, as patient follow up over years or decades would be necessary, and even then, many patients die of other causes before reaching ESRD. In ARDS, symptoms develop over days, however, there is no gold standard diagnostic test and therefore statistical tests for association to ARDS will not be entirely accurate. In an attempt to work around these problems, surrogate markers or surrogate endpoints are often used. These markers are either easier to measure or they can be measured earlier in the disease process. In the study of CKD treatment, proteinuria is often used but proteinuria describes only one aspect of kidney function; and using eGFR decline as an outcome may be problematic where some subjects are already progressing faster than others (Stevens et al., 2006). In ARDS, using mortality or ventilator-free days as an outcome may be easier than an ARDS diagnosis because of the difficulties in reaching a diagnosis, as discussed earlier (section 1.2.2).
CHAPTER 1. INTRODUCTION
49
1.3.6.3 Other Issues
NMR is generally assumed to be more reproducible than LC-MS, but the situation may not be as simple as previously thought. Sample preparation is simpler in NMR, and this should lead to less variability, but because enzymes can potentially still be active in serum and plasma samples, changes can still occur. In untreated serum and plasma samples, proteins bind specific metabolites, including, lactate, citrate, phenylalanine, tyrosine, histidine and pyruvate (Jupin et al., 2013, Nicholson and Gartland, 1989). However, research has shown that this binding can be changed by fatty acids, simple dilution, and even TSP (Barrilero et al., 2017, Jupin et al., 2014). Much NMR-based metabolomics work is now carried out in samples after protein extraction, or after ultrafiltration, to remove baseline problems, and although metabolites are also lost during this process, the simplification may be worthwhile.
In metabolomics, the identification of peaks in NMR or MS spectra is extremely time consuming. This results in significant peaks being labelled as unknowns, or worse, in incorrect labelling of peaks, which then leads to even more problems in validating results and replicating findings.
Finally, general sampling issues can be as problematic here as in other areas of medical research. Serum or plasma may not be able to differentiate between groups, and other biofluids could be tested. If research is based upon samples taken at one specific timepoint, they may not be comparable to samples taken at a different point in the disease process.
1.3.6.4 Potential Solutions
There are many statistical problems with ‘omics’ studies. A simple method to reduce false positive findings would be to lower the p-value, for example, simply lowering the p-value to 0.005 would reduce the chance of type I errors (Ioannidis, 2018). But this would also increase the risk of false negatives (type II errors), and would probably be better handled with other statistical methods, such as the false discovery rate (Benjamini and Hochberg, 1995) or Bayesian methods. Following up untargeted studies with targeted studies is also a way to address these issues, and larger studies or meta-analyses can also help can also help validate findings.
Elucidating causal mechanisms and biological meaning is a logical next step to ‘omics’ studies, which can help to evaluate research findings, and this can be carried out in many ways. Pathway analysis can be used to fit multiple metabolites, or findings from different ‘omics’ methodologies, together. One of the methods used here is known as enrichment analysis, where algorithms are given the list of up- and down-regulated metabolites, and attempt to find the affected pathways. One
NMR-BASED METABOLOMICS IN KIDNEY AND LUNG DISEASE
50
limitation of this approach is that metabolite pathways have to be known in advance, which makes it impossible to find new pathways, whilst another is that it is difficult to use across species. Examples of tools that include enrichment analysis are Metscape and MetaboAnalyst (Karnovsky et al., 2012, Xia and Wishart, 2011). Another method is to use isotopic labelling of metabolites to trace the route of a metabolite of interest, and elucidate which pathways are affected. The pathways found through these experiments are often more complex than initially thought (Baverel et al., 2003).
It is also possible to use the spectra for classification with no knowledge of the metabolites or pathways involved, and in our data-driven age, perhaps this will become the predominant method. This would, however, require extremely well validated models and rigorous statistical testing.
1.3.7. SUMMARY
Technologies such as NMR and MS, combined with statistical approaches and computer processing, have enabled metabolomics to be applied in many different areas. Much recent work has been focused on identifying biomarkers of early disease, so that diagnosis can be made earlier, or progression can be tracked, and so that treatment can be targeted.
In CKD, there are many articles that have attempted to identify as many uremic retention solutes as possible using the new techniques, but these compounds may or may not be related to disease progression, and may or may not be a result of reduced kidney function. The sheer number of metabolomics articles appearing, along with the huge number of significant metabolites open up the ‘omics’ fields to valid criticism. The lack of consensus and small number of replication studies is disheartening, which suggests that biochemical pathways are more complex than currently understood, that there are more sources of variability than we can currently measure, and that conventional statistics has difficulties when applied to ‘omics’ studies.
In ARDS, most ‘omics’ studies have been based on proteomics. However, more metabolomics studies are emerging, including some based upon exhaled breath. As with CKD, there is still a lack of consensus, and the heterogeneity of ARDS is partly responsible for this. This issue could be resolved with a suitable biomarker which, if validated, could help to subcategorise patients clinically, as well as improving ARDS research.
Statistical issues are a major problem for all ‘omics’ fields, and several experimental problems have to be considered. However, ‘omics’ studies are generally hypothesis
CHAPTER 1. INTRODUCTION
51
generating, and most will still require validation in a suitably large and independent cohort.
53
CHAPTER 2. AIMS
The aim of the main study (papers I and IV) was to apply NMR-based metabolomics methods to a 5/6 nephrectomy rat model of CKD established at Aarhus University. A pilot project allowed Dr Martin Skøtt and myself to establish and test protocols, especially in relation to urine collection in cooled vials and the organs it was possible to obtain. Thus, the aim of the main experiment was to find metabolite differences in urine, serum and tissue between the 5/6 nephrectomy rat model of CKD and sham-operated rats. The analysis of different types of samples was expected to be beneficial in explaining the origin of the metabolite changes and the underlying pathological mechanisms.
As the 5/6 nephrectomy experiment progressed, and particularly after examining spectra where repeated spectral acquisition was necessary, we realised that the repeated spectra occasionally had marked differences to the original spectra. This led us to investigate all reanalysed samples in two of the large experiments carried out by Dr Raluca Maltesen (Buggeskov et al., 2018, Maltesen et al., 2017). The aim of this study, presented in paper II, was to characterise some of the spectral differences in reanalysed samples.
A metabolomics study on lung injury (paper III) was started prior to the rat CKD experiments. This was based upon serum samples collected by Professor Bodil Steen Rasmussen from a cohort of patients undergoing elective coronary artery bypass grafting with cardiopulmonary bypass. Working in collaboration with Dr Raluca Maltesen, the aim here was to detect early metabolite differences in patients that went on to develop hypoxaemia, to investigate the underlying processes, and to test whether it was possible to predict hypoxaemia.
55
CHAPTER 3. MATERIALS AND METHODS
The following sections will describe the methods in detail and attempt to make sample and NMR details easily comparable. The 5/6 nephrectomy rat CKD model is the subject of papers I and IV, whilst papers II and III are based upon samples taken from humans at risk of hypoxaemia following cardiac surgery.
3.1. PAPERS I + IV – TISSUE, URINE AND BLOOD METABOLITE SIGNATURES OF CHRONIC KIDNEY DISEASE IN THE 5/6
NEPHRECTOMY RAT MODEL
3.1.1. ANIMAL MODEL AND SAMPLE COLLECTION
The 5/6 nephrectomy model was used because of extensive local expertise at The Water and Salt Research Centre, Aarhus University (Kwon et al., 1998). As described in the introduction (section 1.1.6), the 5/6 nephrectomy model is known to suffer from progressive chronic kidney disease, with clinical and histopathological similarities to human CKD. An addition to this model was the implantation of a suprapubic catheter, to enable the intermittent collection of urine for short durations, without using metabolic cages. Animal experiments were approved by the Danish Ministry of Justice, and conducted in accordance with the National Institute of Health “Guide for the Care and Use of Laboratory Animals” (8th edition).
Thirty male Wistar rats (Taconic, Ejby, Denmark) were randomised to either 5/6 nephrectomy (Nx) or sham operation. More rats were randomised to the nephrectomy group (n=17), compared to the sham operation group (n=13), as more nephrectomy rats were expected to die due to the more extensive surgical procedure. On day -7 (week -1 in Figure 13), rats were anaesthetised with isoflurane (Abbott Scandinavia, Solna, Sweden), placed on a heating pad to maintain body temperature, and after shaving and disinfection, a midline incision was made. Dissection and bimanual manipulation were used to reveal the left kidney, and after dissecting the kidney capsule carefully, without damaging the adrenal gland, the two poles were tied off. Sham-operated rats did not have the kidney poles removed. Haemostasis was aided with swabs, the muscle and skin layers were closed separately, and buprenorphine (Reckitt Benckiser, Slough, UK) was administered subcutaneously for pain control. Buprenorphine was also administered in the drinking water for three days. On day 0, rats were anaesthetised, the midline incision was reopened, and dissection was directed towards the right flank. The right kidney was exposed, dissected free from
NMR-BASED METABOLOMICS IN KIDNEY AND LUNG DISEASE
56
the capsule, being careful not to damage the adrenal gland, and then the renal artery and vein were tied off. Sham-operated rats did not have the right kidney removed. Closure and analgesia were performed as described above.
Figure 13. Sample collection protocol illustrating when urine (U), serum (S), and tissue (T) samples were obtained in relation to surgery.
Urine samples were collected by attaching the implanted catheter to a silicone tube, the other end of which was attached to an Eppendorf tube suspended in a container of ice and water. The rats were placed in restraining cages for approximately two hours, with free access to water, whilst urine was collected. The restraining cages were made at Aarhus University by Mogens Koed, and were used instead of metabolic cages (which require three days of isolation, and where urine is easily contaminated by faeces). Another advantage of the restraining cage was that urine could be collected and cooled immediately, to reduce bacterial metabolism and evaporation. Urine was then centrifuged to remove precipitate, before aliquoting, freezing in liquid nitrogen, and storage at -80 °C.
Blood samples were collected from the tail veins, or cardiac puncture at sacrifice. Samples were left to clot at room temperature for 30 minutes before being spun down. Serum was then aliquoted and snap frozen in liquid nitrogen. Tissue samples were collected after sacrifice, weighed, placed in cryo-tubes and snap frozen in liquid nitrogen. Both serum and tissue samples were stored at -80 °C.
3.1.2. SAMPLE PREPARATION AND NMR ANALYSIS
Urine and blood samples were defrosted at 4 °C. They were then vortexed briefly before centrifuging (at 14000 x g and 4 °C for 5 minutes), to remove precipitate. Samples were mixed with buffer, 9:1 urine:buffer (1.5 M KH2PO4, 2 mM NaN3, 0.1% TSP, pH* 7.4) or 1:1 serum:buffer (0.075 M NaH2PO4, 0.04% NaN3, 0.08% TSP, pH* 7.4), to keep the pH stable, and to provide a lock signal for the NMR spectrometer. Because rat urine samples often suffered from precipitation after the addition of buffer, samples were re-centrifuged before transferring to an NMR tube.
-1 6543210U U U U U U US S S
T
Week:Samplecollection:
Left 2/3 nephrectomy+ catheter implantation
Right total nephrectomy
CHAPTER 3. MATERIALS AND METHODS
57
Tissue samples were freeze-dried (lyophilised) and then homogenised using a Precellys bead homogeniser (Bertin Instruments, Montigny-le-Bretonneux, France). 50 mg or 100 mg of the homogenised tissue was extracted using ice-cold methanol, chloroform and water in a 2:2:1.8 ratio (Bligh and Dyer, 1959, Lin et al., 2007). The hydrophilic phase was transferred to a clean vial, lyophilised, and then dissolved in 0.1 M imidazole-d4 buffer (0.02% NaN3, 1 mM TSP, pH* 7.4).
NMR spectra were recorded on a Bruker 600 MHz Avance DRX-600 equipped with a TXI probe (Bruker BioSpin, Rheinstetten, Germany). Serum spectra were acquired with the 1D nuclear Overhauser effect spectroscopy (NOESY), Carr-Purcell-Meiboom-Gill (CPMG) (Carr and Purcell, 1954, Meiboom and Gill, 1958), and skyline projection of J-resolved (pJRES) (Aue et al., 1976) pulse sequences. NMR spectra of urine and tissue samples were also acquired using the NOESY, CPMG and pJRES pulse sequence, but because quantification of metabolites was one of the aims, a quantitative 1D NOESY spectrum was also run using a long relaxation delay. NMR experimental details are listed in Table 2.
1D NOESY 1D CPMG J-resolved Bruker pulse sequence
noesygppr1d cpmgpr1d jresgpprqf
Temperature 310 K (serum) 298 K (urine + tissue)
310 K (serum) 298 K (urine)
310 K (serum) 298 K (urine + tissue)
Number of scans 128 64 (qNOESY)
128 4 (per increment)
Data points (time domain)
98304 (serum) 65536 (urine + tissue)
65536 Direct dimension: 16384 Indirect dimension: 42
Two-dimensional NMR spectra were also acquired, to enable metabolite identification, using the 1H,13C-HSQC (heteronuclear single quantum coherence) and 1H,1H-TOCSY (total correlation spectroscopy) pulse sequences.
3.1.3. MULTIVARIATE AND UNIVARIATE ANALYSIS
Urine NMR spectra were either normalised to the creatinine integral or to total intensity, because of large concentration differences between the nephrectomy and sham-operated rats. Regional alignment was also necessary in the urine spectra, presumably because of divalent cation concentration differences, and was performed using the icoshift algorithm (Savorani et al., 2010). Blood and tissue NMR spectra were normalised to an external PULCON (pulse length based concentration determination) signal (Wider and Dreier, 2006). Processing steps are described in Table 3.
Urine Serum Tissue Spectra used for multivariate analysis
CPMG (NOESY spectra baselines poor due to proteinuria) and pJRES
CPMG and pJRES NOESY and pJRES
Reference TSP-d4 α-Glucose TSP-d4 Water region removed
4.6-5.0 ppm 4.5-4.9 ppm Not performed
icoshift regions 58 4 Not performed Normalisation Total intensity or
creatinine integral normalisation
PULCON TSP and extracted freeze-dried tissue mass
Bin width 0.001 ppm 0.001 ppm 0.001 ppm Centring Mean centring Mean centring Mean centring Scaling Pareto scaling Pareto scaling Pareto scaling Cross validation Random 10 segment cross
validation with 10 iterations
Random 10 segment cross validation with 10 iterations
Random 10 segment cross validation with 10 iterations
Table 3. Processing details for NMR spectra. NOESY, 1D nuclear Overhauser effect spectroscopy; CPMG, Carr-Purcell-Meiboom-Gill; pJRES, skyline projection of J-resolved spectrum; PULCON, pulse length based concentration determination.
Principal component analysis (PCA) and partial least squares discriminant analysis (PLSDA) were carried out using PLS-Toolbox v6.5 (Eigenvector Research, Washington, USA) and MATLAB v8.3 (Mathworks, Massachusetts, USA). Cross validation was performed, with 10 iterations of 10 random segments, to ensure that models were robust, to select model parameters, and to identify outlying samples. Significant peaks were identified using the loadings plots and Variable Importance in Projection (VIP) scores (Chong and Jun, 2005). These were then integrated, after local baseline correction, using peak fitting methods on the quantitative spectra in MestReNova v8.1 (Mestrelab Research, Santiago de Compostela, Spain). Where peak overlap was problematic, an alternative peak for the same metabolite was used,
CHAPTER 3. MATERIALS AND METHODS
59
or pJRES spectra were used. No quantitative spectra were recorded for serum samples, because of the lipoprotein baseline, and all integrals obtained from non-quantitative spectra are reported as concentration relative to the largest measured value.
Univariate analysis was carried out in SPSS v23 (IBM Corporation, New York, USA), with linear mixed-effects models to analyse urine metabolites over the entire testing period; t-tests or Mann-Whitney U tests for the final tissue and serum samples; and ANOVA for the final kidney samples, where there were two sham operation kidneys, but only one 5/6 nephrectomy kidney. A Holm-Bonferroni corrected p-value threshold of 0.05 was used for multiple testing.
3.2. PAPER II – CITRATE NMR PEAK IRREPRODUCIBILITY IN BLOOD SAMPLES AFTER REACQUISITION OF SPECTRA
3.2.1. SAMPLE CHARACTERISTICS AND NMR ANALYSIS
On a few occasions during the first experiment, we noticed that some metabolite integrals, and in particular the citrate signals, had a different intensity in the repeated NMR spectrum. This led us to an investigation of all the repeated spectra in two large metabolomics studies carried out by Dr Raluca Maltesen, one on serum samples, and the other on plasma samples. Both experiments had already received ethical approval from the local ethics committees. The serum samples were collected as part of an experiment looking at lung injury following coronary artery bypass graft surgery (see section 3.3 below), and the plasma samples were collected during a randomised controlled trial of lung protection strategies during surgery involving cardiopulmonary bypass (Buggeskov et al., 2018, Maltesen et al., 2016, Maltesen et al., 2017). Sample preparation and NMR analysis were almost identical for both projects, the only difference being that the serum buffer included 1,1,2,2,3,3-hexadeutero-4,4-dimethyl-4-silapentane-1-ammonium trifluoroacetate (DSA-d6) as an internal standard (details in Table 4). There were over 700 samples for each experiment, and a total of 44 serum and 81 plasma samples were reanalysed within 48 hours of the original spectrum being acquired.
Pulmonary artery or left atrial catheter. 30-45 minutes clotting time at room temperature followed immediately by centrifugation, aliquoting and storage at -80 °C.
Pulmonary artery catheter. Samples immediately centrifuged at 4 °C. Aliquots stored at -80 °C.
NMR sample preparation conditions
Thawed at 4 °C (fridge) for 30 minutes, and kept on ice whilst preparing NMR samples.
Thawed at 4 °C (fridge) for 30 minutes, and kept on ice whilst preparing NMR samples.
Temperature 298.1 K 298.1 K Number of scans 256 128 Data points (time domain)
32768 32768
Spectral width 20 ppm 20 ppm Acquisition time 2.73 s 2.73 s Receiver gain 173.2 173.2 Relaxation delay 4 s 4 s B1 field strength 31 Hz 37 Hz Spectral size 131072 131072 Window function Exponential multiplication (0.3 Hz) Exponential multiplication (0.3 Hz) Other processing steps
Manual phase and baseline correction
Manual phase and baseline correction
NMR reference Alanine CH3 duplet Alanine CH3 duplet Normalisation PULCON PULCON Total number of samples
738 768
Number rerun within 48 hours
44 81
Table 4. Sample collection details, and NMR acquisition and processing details. NOESY, 1D nuclear Overhauser effect spectroscopy; CPMG, Carr-Purcell-Meiboom-Gill; pJRES, skyline projection of J-resolved spectrum; PULCON, pulse length based concentration determination; pH*, apparent pH uncorrected for D2O.
3.2.2. INTEGRATION AND STATISTICAL ANALYSIS
To ensure precision, two peaks (or two regions) for each of the metabolites citrate, lactate, phenylalanine, histidine and glucose were integrated. These metabolites have previously been reported to bind to protein, except for glucose, which was used as a control. Manual or automatic baseline correction was performed using MestReNova v12 (Mestrelab Research S.L., Santiago de Compostela, Spain), and where these methods did not work well, the Global Spectral Deconvolution tool was used. Two graphs were plotted for each metabolite: a comparison of the integral of the two peaks (Inta vs Intb); and a comparison of the percentage difference in integrals between the original and reanalysed spectrum for both peaks (ΔInta(%) vs ΔIntb(%), as defined in
CHAPTER 3. MATERIALS AND METHODS
61
Equation 5). These comparisons were made to find changes that occurred reproducibly in both peaks for each metabolite. ANOVA was used to assess the statistical significance of linear fitting, and a p-value of less than 0.05 was considered significant. Graphs were plotted in JMP v14.1 (SAS Institute, North Carolina, USA).
∆𝐼𝑛𝑡961Z(%) =𝐼𝑛𝑡961Z(14M498) − 𝐼𝑛𝑡961Z(612_239<)
𝐼𝑛𝑡961Z(612_239<)× 100
Equation 5. Integral percentage difference formula.
To investigate some of the possible causes of these changes, clinical factors, lipoprotein integrals and EDTA integrals were analysed and plotted against metabolite percentage changes.
3.3. PAPER III – PREDICTIVE BIOMARKERS AND METABOLIC HALLMARK OF POSTOPERATIVE HYPOXAEMIA
3.3.1. PATIENT AND SAMPLE CHARACTERISTICS
The patient group studied were originally part of a study of the effects of coronary artery bypass grafting (CABG) involving cardiopulmonary bypass (on-pump CABG) on post-operative oxygenation. The research was approved by the local ethics committee, and patients provided informed consent. All patients underwent elective (i.e. non-emergency) CABG surgery and serum samples were collected from two catheters, one ‘before’ the lungs in the pulmonary artery (PA) and the other ‘after’ the lungs in the left atrium (LA). Serum samples were obtained at seven different timepoints: before CPB (but after sternotomy) and at 0, 2, 4, 8, 16 and 20 hours after weaning from CPB. We decided to concentrate on the samples taken 16 hours after weaning from CPB, as this would be far enough from surgery, but before ARDS is normally diagnosed, and a total of 47 patients had both LA and PA samples at this point. All blood samples were taken and prepared by the same person, Professor Bodil Steen Rasmussen, and serum samples were allowed to clot at room temperature for 30 minutes before centrifugation at 3000 rpm for 10 minutes. Aliquots were stored at -80 °C.
All patients were being treated with statins (one of the inclusion criteria) and were over 18 years old, whilst treatment with immune suppressors or steroids were exclusion criteria. All patients had decreased blood oxygen levels on the second and third postoperative days. Arterial blood gas (ABG) measurements at 72 hours, which were carefully controlled and taken after breathing atmospheric air for 10 minutes, were used to classify patients into a severely hypoxaemic group (PaO2/FiO2 < 30
NMR-BASED METABOLOMICS IN KIDNEY AND LUNG DISEASE
62
kPa), a mildly hypoxaemic group (30 kPa ≤ PaO2/FiO2 ratio < 40 kPa) and an unaffected group (PaO2/FiO2 ratio ≥ 40 kPa). Patient details are listed in Table 5.
Table 5. Patient characteristics reported as mean ± standard deviation, or number in group. BMI, body mass index; COPD, chronic obstructive pulmonary disease; PaO2, partial pressure of oxygen in blood; FiO2, percentage of oxygen in inspired air.
3.3.2. SAMPLE PREPARATION AND NMR ANALYSIS
As for the CKD experiment, serum samples were thawed at 4 °C before vortexing and centrifuging to remove precipitate. Samples were mixed with 0.2M phosphate buffer (pH* 7.4 in D2O) in a 2:1 (sample:buffer) ratio before transferring to a 5mm NMR tube. NMR spectra were recorded on a Bruker 600 MHz Avance DRX-600 equipped with a TXI probe (Bruker BioSpin, Rheinstetten, Germany).
1D CPMG Bruker pulse sequence cpmgpr1d Temperature 310.1 K Number of scans 128 Data points (time domain) 32768 Spectral width 12 ppm Acquisition time 2.28 s Relaxation delay 2 s B1 field strength 26.6 Hz Spectral size 65536 Window function Exponential multiplication (0.3 Hz) Other processing steps Manual phase and baseline correction NMR Reference Lactate duplet
Table 6. NMR acquisition and processing details. CPMG, Carr-Purcell-Meiboom-Gill.
Two-dimensional spectra were also recorded on representative samples to enable identification of metabolites. Three types of spectra were acquired: 1H,13C-HSQC (heteronuclear single quantum coherence), 1H,1H-TOCSY (total correlation spectroscopy), and J-resolved spectra.
CHAPTER 3. MATERIALS AND METHODS
63
3.3.3. MULTIVARIATE AND UNIVARIATE ANALYSIS
NMR spectra were normalised using the lactate peak area and lactate concentration measured at the same timepoint in another sample. The water region (4.5-4.8 ppm) was removed, before dividing the spectra into 0.001 ppm width bins, and two scaling methods were tested, log transformation and auto-scaling.
PCA, PLS and PLS-DA modelling were carried out using PLS-Toolbox v6.5 (Eigenvector Research, Washington, USA) and MATLAB v7.13 (Mathworks, Massachusetts, USA). PLS models were built using the 72 hour (day 3) postoperative PaO2 values, and PLS-DA models were constructed using mild vs unaffected and severe vs unaffected comparison groups. Both Monte Carlo cross validation and permutation testing were used, with 5000 iterations of cross validation where 70% of the data was used to train the model, and 30% to assess the model; and 500 permutations of group labels. Receiver operating characteristic (ROC) curve analysis was also used to assess the potential diagnostic performance of the PLS-DA models. Significant metabolites were identified using the loadings plots and VIP scores. Peaks were integrated using the multi-integration tool in AMIX v 3.9.10 (Bruker BioSpin, Rheinstetten, Germany)
Univariate analysis was carried out in SPSS v22 (IBM Corporation, New York, USA), with Shapiro-Wilk normality testing followed by either t-tests or Mann-Whitney U tests, when comparing two groups, and ANOVA or Kruskal-Wallis H tests, when comparing three groups. The significance threshold was set at p < 0.05.
65
CHAPTER 4. RESULTS AND DISCUSSION
This thesis is comprised of four papers, based upon the 5/6 nephrectomy rat model of CKD, and human studies on patients suffering from hypoxaemia following cardiac surgery. In this section the results will be briefly presented, and the discussion presented in the papers will be expanded, concentrating on the following areas: possible pathways and pathological mechanisms, limitations of the studies, statistical and ‘omics’ issues, and potential further work.
4.1. PAPERS I + IV – TISSUE, URINE AND BLOOD METABOLITE SIGNATURES OF CHRONIC KIDNEY DISEASE IN THE 5/6
NEPHRECTOMY RAT MODEL
There are two aspects of the experimental work in this paper that should be noted. Firstly, lung, heart, liver, spleen and kidney tissues, as well as urine and serum, were analysed. Although the analysis of tissue is difficult in humans, it is also relatively rare in animal models, and connecting serum and urine changes with tissue changes allowed us to investigate some of the origins of the altered metabolites and suggest hypotheses of disease mechanisms. Secondly, we analysed urine from multiple timepoints using mixed models, with the aim of being able to analyse differences due to 5/6 nephrectomy, whilst also handling the variability between individuals.
4.1.1. SUMMARY OF RESULTS
Hospital laboratory measurements confirmed that serum urea and creatinine concentrations were higher in the 5/6 nephrectomy rats, in keeping with CKD, and other articles have shown that histological, urine and blood changes in the 5/6 nephrectomy kidney are also similar to human CKD (Gadola et al., 2004, Maddox et al., 1986). We expected more rats from the 5/6 nephrectomy group to suffer surgical complications, because of the more extensive surgery, but three rats from each group passed away before the experiment could be completed. Polyuria was also evident in the 5/6 nephrectomy rats, although timed urine volume was not measured.
NMR-BASED METABOLOMICS IN KIDNEY AND LUNG DISEASE
66
Figure 14. (A) Example NMR spectra of urine. (B) PCA scores plot showing sham-operated and 5/6 nephrectomy (Nx) urine spectra. (C) PCA scores plot (same as panel B) coloured by sample week. Metabolite annotations are as follows: 1, lactate; 2, alanine; 3, acetate; 4, succinate; 5, oxoglutarate; 6, citrate; 7, dimethylamine; 8, dimethylglycine; 9, creatinine; 10, taurine; 11, betaine; 12, trimethylamine oxide; 13, hippurate; 14, allantoin; 15, urea; 16, formate. Reproduced with permission (Hanifa et al., 2019). Copyright (2019) Springer Nature.
NMR spectra revealed differences between 5/6 nephrectomy and sham-operated rats, but were very complex when examined visually. This was especially true for urine spectra, where peaks were shifted due to differences in divalent cation concentrations
(Figure 14A). Multivariate analysis was able to differentiate sham-operated and nephrectomy rats, using unsupervised PCA modelling on urine (from week 1 onwards, Figure 14B+C), and supervised PLS-DA on tissue and serum (week 6 samples). Quantification enabled the investigation of individual metabolites, and allantoin was the most widely affected metabolite, being significant in all compartments. In tissues, significant metabolites included: asparagine, creatine, dimethylamine, dimethylglycine, hippurate, trigonelline and trimethylamine. Whilst in urine or serum, benzoate, citrate, dimethylglycine, fumarate, guanidinoacetate, malate, myo-inositol and oxoglutarate were significant.
Whereas all of these metabolites have previously been found to be significant in animal models of CKD, or small-scale human studies, not all are generally accepted as CKD metabolites in humans, for example allantoin and citrate are not listed in the EuTox database (Duranton et al., 2012). However, one of the difficulties with a long list of statistically significant metabolites is finding the connections and pathways linking different metabolites. This is not a simple task given the multitude of biochemical pathways and our current limited, but growing, knowledge of these pathways. The following subsections will attempt to put some of these findings into context and discuss the possible connections between them.
4.1.2. ALLANTOIN AND OXIDATIVE STRESS
As discussed in the 5/6 nephrectomy paper, allantoin concentrations were significantly higher in serum and all sampled tissues from 5/6 nephrectomy rats. Urine concentrations were also higher, although this was not significant after correction for multiple testing. Allantoin has been mentioned sporadically in the CKD literature for almost a century, for example early research in rats found that both the liver and kidneys were required for production of allantoin from urate, and the subsequent excretion of allantoin in the urine (Byers et al., 1947). But, whereas the review written by Zhao (Zhao, 2013) reports allantoin as a CKD biomarker, based upon rat studies, the EUTOX review from 2012 (Duranton et al., 2012), based on human studies, does not mention it. The lack of early human studies finding allantoin as significant could be due to the fact that humans lack the urate oxidase (uricase) enzyme, which converts uric acid to allantoin (Figure 15), but there have been more recent positive findings in human studies. For example, in a study by Kand’ar and Zakova (2008), increased allantoin levels were found in red blood cells (erythrocytes) and plasma from human patients with CKD, and in another paper, increased allantoin concentrations in patients with ESRD were linked to oxidative stress or bacterial metabolism (Rhee et al., 2010). The most compelling evidence is the link to mortality in human CKD found in the 2018 paper by Hu et al., where allantoin was one of three metabolites (the others being fumarate and ribonate) associated with mortality in human CKD (Hu et al., 2018). The link between mortality and allantoin
NMR-BASED METABOLOMICS IN KIDNEY AND LUNG DISEASE
68
concentrations measured years in advance, across two large independent study populations, is good evidence that allantoin is a significant metabolite in humans. Another point to note is that the studies by Hu et al. and Rhee et al. were based on an LC-MS metabolomics platform, whilst ours was based on an NMR platform, suggesting that the findings are consistent across different analytical platforms.
Figure 15. Purine breakdown pathway illustrating the conversion of guanosine, inosine and adenosine to uric acid and eventually allantoin. XO, xanthine oxidase (which can be reversibly converted to xanthine dehydrogenase). *The uricase enzyme is not present in humans, and this step is therefore thought to be the result of reactive oxygen species.
Whether allantoin or one of its precursors has a causal link to declining renal function or mortality, or is only a statistical association, will hopefully be revealed by further research. A large amount of work, however, has and is being carried out on urate and xanthine oxidase. Urate concentrations did not correlate with allantoin concentrations in the study by Hu et al. (2018), and the literature currently offers a mixed picture of the benefits of reducing xanthine, uric acid and allantoin concentrations with xanthine oxidase inhibitors such as allopurinol. In one study, patients with CKD had lower uric acid concentrations and a slower progression of disease when taking allopurinol, as well as a reduced risk of cardiovascular events (Goicoechea et al., 2010). However, a retrospective study showed that high urate concentrations were associated with lower mortality in patients with ESRD (Kim et al., 2017). Another study on patients with gout showed that they had higher plasma allantoin levels than controls, and although treatment with allopurinol reduced allantoin levels, they were still higher than controls (Stamp et al., 2014). And increased xanthine oxidase activity (which itself can produce strong oxidants), has been described in ESRD (Choi et al., 2011, Rhee et al., 2010).
Humans lack the uricase enzyme to convert uric acid to allantoin, and it has been hypothesised that mutations in the uricase gene increased urate concentrations in humans in comparison to other mammals, which helped protect humans against oxidative damage (Ames et al., 1981). It is also generally accepted that allantoin in human samples is the result of urate oxidation by reactive oxygen species (Caussé et al., 2007, Mikami et al., 2000), however, other sources of increased allantoin should
Inosine
Hypoxanthine
Xanthine
Adenosine
Adenine
Uric acid
Allantoin
Guanosine
Guanine
XO
XO
uricase*
CHAPTER 4. RESULTS AND DISCUSSION
69
also be considered, and the most obvious is accumulation due to reduced renal function. Greger et al. stated that allantoin is handled similarly to inulin, and therefore increased serum concentrations are, at least partly, due to retention after nephrectomy (Greger et al., 1975). However, Pordy et al. stated that allantoin could not simply diffuse across lipid bilayers, and Kand’ár and Záková showed that red blood cell and plasma allantoin levels did not correlate in patients with CKD, both suggesting that the elevated levels we found in all tested organs were not simply due to diffusion down concentration gradients (Kand'ár and Záková, 2008, Pordy et al., 1987). Increased uricase activity could also be a cause in rats, but uricase is mainly located in the liver and would not explain the changes in other tissues. Increased purine turnover, not necessarily due to oxidative stress, could also lead to higher concentrations of allantoin (Fisher-Wellman and Bloomer, 2009, Johnson et al., 1989). Dietary sources should also be considered, as uric acid levels have been linked to high-fructose diets and metabolic syndrome (Nakagawa et al., 2006), though this is not likely to be relevant in animal experiments. And changes in the gut microbiome could also been be linked, via altered uricase activity, to allantoin concentrations (Wong et al., 2014).
Oxidative stress is a very difficult subject to study because the reactive oxygen species (ROS) have very short half-lives, reacting with cell components and causing damage very quickly, and they are therefore very difficult to quantify directly. This leads to many proxy markers being used in the literature, such as antioxidants, e.g. glutathione and vitamin C; or damaged cell components, e.g. lipid peroxides or DNA base oxidation products. Also, many of these biomarkers are new, and therefore normal concentration ranges have not yet been developed. Ideally, it would be possible to quantify multiple proxy markers to find a better measure of oxidative stress. In our study we found that glutathione concentrations were slightly higher in the heart tissue of CKD rats, and although this was not statistically significant, it could be evidence of oxidative stress in the heart. In an adenine-induced rat model of CKD, glutathione was also found to be increased in the CKD heart, but decreased in the CKD kidney (Velenosi et al., 2016); whilst a study in humans found reduced levels of glutathione in more advanced stages of CKD (Ceballos-Picot et al., 1996). Together with the allantoin findings, changes in glutathione could suggest that ROS may be a factor in the development of the consequences of CKD in diverse organs.
In summary, oxidative stress is a recognised pathological mechanism in CKD, and could be an important link between the kidney and other organ systems, for example, it is potentially a risk factor for cardiovascular disease (Ling and Kuo, 2018). If allantoin can be measured in blood or urine at an early stage of human CKD, and the connection to later morbidity and mortality made, it could prove to be an important biomarker.
NMR-BASED METABOLOMICS IN KIDNEY AND LUNG DISEASE
70
4.1.3. THE GUT-KIDNEY AXIS
Many metabolites derived from the diet or via gut bacteria have been implicated in CKD. Indoxyl sulfate, a metabolite produced from dietary tryptophan, and p-cresyl sulfate, produced from dietary tyrosine, have been widely investigated as uremic retention solutes. Benzoate is a natural part of the diet which is also produced by gut bacteria, and converted to hippurate in the liver. Indoxyl sulfate, p-cresyl sulfate and hippurate accumulate in CKD and all are difficult to control with conventional haemodialysis, because they are highly protein bound (Sirich et al., 2014). Tubular transport mechanisms, as opposed to glomerular filtration, are therefore required to clear these metabolites from the circulation. As mentioned previously, GFR measurement only assesses one aspect of kidney function, and these metabolites could therefore be used to assess tubular function. Unfortunately, although the shortcomings of GFR assessment are widely known, it has been difficult to move the focus of measurement and diagnosis elsewhere. Assessing others axes of kidney function could help to detect disease earlier, subdivide kidney disease, risk stratify patients, and suggest new treatment targets. Several of these metabolites are also known to accumulate in kidney tissue via the organic anion transporters (OATs), and this is thought to be part of the mechanism causing further damage to the kidneys (Enomoto and Niwa, 2007, Wikoff et al., 2011).
In paper I, we found higher concentrations of hippurate in 5/6 nephrectomy kidneys, and lower concentrations of benzoate in 5/6 nephrectomy urine. Hippurate concentrations in 5/6 nephrectomy urine were also increased, although this was not statistically significant. Because both metabolites are in the same pathway, but seem to react differently to 5/6 nephrectomy, we proposed that a ratio of hippurate and benzoate in the urine could be a sensitive biomarker. We could not test this on the samples in the study because benzoate levels were often below the limit of detection, especially in the 5/6 nephrectomy rats, but it could be worth exploring (Figure 16). In a similar study to ours, elevated concentrations of all three metabolites (indoxyl sulfate, p-cresyl sulfate and hippurate) were reported in tissue and plasma in an adenine-induced rat CKD model (Velenosi et al., 2016). These metabolites are also clinically important, for example, hippurate has been shown to accumulate in human ESRD (Rhee et al., 2010), and reduced hippurate or p-cresyl sulfate clearance has been linked to mortality risk, independent of eGFR (Suchy-Dicey et al., 2016).
CHAPTER 4. RESULTS AND DISCUSSION
71
Figure 16. Hippurate and benzoate urine concentrations, normalised to urine creatinine concentration, in 5/6 nephrectomy (Nx) and sham-operated rats. Reproduced with permission (Hanifa et al., 2019). Copyright (2019) Springer Nature.
Dimethylglycine (DMG), betaine (trimethylglycine) and sarcosine (N-methylglycine) are all dietary choline derivatives (McGregor et al., 2001). We found increased concentrations of these metabolites in 5/6 nephrectomy tissues, although only DMG increases were statistically significant. DMG is produced when betaine is used as a methyl donor in the methylation cycle, for example to convert homocysteine to methionine (Bertolo and McBreairty, 2013). DMG is also a known uremic retention solute and has been mentioned in several CKD articles, for example, McGregor et al. linked DMG and homocysteine concentrations in CKD (McGregor et al., 2001). DMG was also elevated in the study by Rhee et al. looking at patients with ESRD (Rhee et al., 2010); and in the study by Mutsaers et al., both DMG and betaine were elevated in the plasma of patients with stage 3 and 4 CKD (Mutsaers et al., 2013). In a contradictory finding to ours, betaine was decreased in 5/6 nephrectomy rat kidneys (Zhong et al., 2012), and in another paper, plasma betaine decreased with CKD stage in humans, and both betaine and choline increased significantly after renal transplantation (Missailidis et al., 2016). The picture is complex, and although the dietary sources are important, the links to homocysteine metabolism and creatine metabolism via one-carbon metabolism are also important, and are discussed in detail in section 4.1.7.2 below.
Other metabolites absorbed via the gut include dimethylsulfone (DMSO2), trimethylamine (TMA), trimethylamine oxide (TMAO), dimethylamine and trigonelline. The sources of these metabolites include both the diet and bacterial
Benzoate
Hippurate
NMR-BASED METABOLOMICS IN KIDNEY AND LUNG DISEASE
72
metabolism (Engelke et al., 2005, Winning et al., 2009, Zhang, A. Q. et al., 1999). DMSO2 concentrations were slightly higher in 5/6 nephrectomy serum in our CKD model, though these differences were not statistically significant, and we found higher TMA levels in the 5/6 nephrectomy kidney and spleen. TMAO could not be quantified in serum or tissues due to peak overlap, but dimethylamine, a metabolite of TMAO, had higher concentrations in 5/6 nephrectomy heart and spleen tissues. Mutsaers et al. measured DMSO2 in humans with CKD, and demonstrated higher concentrations in plasma compared to controls, and they also reported the negative effects of DMSO2 on kidney proximal tubule cells (Mutsaers et al., 2013). Many other articles have found that TMA or TMAO accumulate in CKD (Bain et al., 2006, Bell et al., 1991, Fujiwara et al., 2009, Kim et al., 2014, Missailidis et al., 2016, Rhee et al., 2013). Trigonelline, a metabolite of dietary niacin, had higher concentrations in kidney and liver tissues, and it has also been discussed as a potential biomarker of human CKD (Kimura et al., 2016).
To sum up, the diet and bacteria living in the gut are hugely important sources of metabolites for humans. Many of these metabolites are useful nutrients, whilst others are harmful, and the role of the gut in diverse diseases is being slowly uncovered. Tubular secretion, as opposed to glomerular filtration, is the main transport mechanism for these metabolites in the kidney, because of protein binding. Dietary changes may be the easiest way to alter the concentration of these metabolites, and this will be discussed further in section 4.1.8.
4.1.4. ACID-BASE BALANCE
CKD and 5/6 nephrectomy are known to eventually cause metabolic acidosis (Gadola et al., 2004, Maddox et al., 1986). This is partly due to the limit of nephrons to excrete protons in the form of ammonium (Simpson, 1971). One of the first hypotheses to suggest that adaptation to CKD and a reduced number of nephrons could cause long-term problems, even whilst solving the short-term lack of nephrons, was the "intact nephron hypothesis” (Bricker et al., 1960, Platt, 1952). Increased ammoniagenesis in the remaining nephrons is thought to help maintain acid excretion, but is also thought to trigger tubulointerstitial injury, which eventually leads to further loss of nephrons (Nath et al., 1985).
Acid-base balance is also maintained by reabsorbing filtered base, or base-equivalents. For example, the kidneys play an important role in reabsorbing bicarbonate and maintaining serum concentrations, and this function is known to decrease in the later stages of CKD. Citrate is the most abundant organic anion in urine, and its reabsorption has an important role in maintaining acid-base balance (Curthoys and Moe, 2014, Unwin et al., 2004). In our experiment, citrate was not significantly affected in urine and we could not quantify citrate in tissues, probably
CHAPTER 4. RESULTS AND DISCUSSION
73
due to loss during the extraction process. Serum citrate concentrations, however, were significantly higher in 5/6 nephrectomy rats, potentially indicating base reclamation to counter metabolic acidosis. Other studies using the 5/6 nephrectomy rat have also found higher levels of citrate in blood (Kim et al., 2014). In humans, blood citrate concentrations were also higher in haemodialysis and peritoneal dialysis patients compared to controls (Choi et al., 2011); and higher in patients with mild CKD in comparison to both patients with moderate-severe CKD and healthy controls (Marangella et al., 1991). An article looking at human urine found lower citrate integrals in urine of patients with stage 3-5 CKD compared to healthy controls, which also fits the acid-base role (Posada-Ayala et al., 2014).
Acid-base changes are difficult to monitor, because the body has an extremely large capacity to buffer changes. This means that serum bicarbonate levels (the current method used to assess acid-base balance in conjunction with pH) may be normal until late CKD. Extensive research is being carried out into early treatment of acid-base imbalance, and the possible role of treatment in slowing progression. For example, Wesson et al. have shown that although 2/3 nephrectomised rats (as opposed to the 5/6 nephrectomy we performed) have a progressive GFR loss and a high tissue acid content, the changes could be ameliorated by dietary alkali (Wesson and Simoni, 2009, Wesson et al., 2017). Gadola et al. have treated 5/6 nephrectomy rats with citrate, which resulted in a better inulin clearance and lower proteinuria (Gadola et al., 2004). There is also increasing evidence for the treatment of acidosis (or acid-retention without overt acidosis) in humans, for example, treatment with citrate for two years led to a slower GFR decline (Phisitkul et al., 2010), whilst treatment with bicarbonate for two years slowed the rate of progression and improved nutritional status (de Brito-Ashurst et al., 2009). Even early (stage 2) CKD in humans may be associated with acid retention, suggesting the potential benefit of early treatment (Wesson et al., 2011).
The key to successful treatment of acid retention in CKD would be a straightforward diagnostic test, and urine citrate excretion has recently been suggested to be just such a test. Because citrate reabsorption in the kidney is equivalent to base gain, Goraya et al. hypothesised that citrate excretion in urine after a dose of bicarbonate would be different in patients with CKD retaining acid. In their experiments they confirmed that patients with stage 2 CKD had a higher estimated acid retention than those with stage 1 CKD, and that the estimated acid retention improved after a change to a more base-producing diet (Goraya et al., 2019).
Other organic anions such as oxoglutarate (alpha-ketoglutarate) and succinate also have a role in acid-base balance, as excretion has been shown to change in response to acid-producing and base-producing diets (Packer et al., 1995). NaDC-1 is the sodium dependent dicarboxylic acid cotransporter, and its preferred substrates include citrate, succinate, fumarate and oxoglutarate (Curthoys and Moe, 2014). In our experiments, urine concentrations of many of these organic anions were affected.
NMR-BASED METABOLOMICS IN KIDNEY AND LUNG DISEASE
74
Oxoglutarate dropped significantly in the 5/6 nephrectomy rats, although sham-operated rat urine concentrations were decreasing throughout the experiment, and there was a similar picture for fumarate and malate, but not succinate. Changes were still occurring in the sham-operated rats at the end of the experiment, and it is possible that they would eventually match the 5/6 nephrectomy urine concentrations. Oxoglutarate, fumarate and malate, but not succinate or citrate, were also associated with mortality in the study by Hu et al., discussed earlier in relation to allantoin (Hu et al., 2018).
Acid-base balance also involves many other different metabolites, for example, glutamine is used in the kidneys to generate ammonium ions and excrete acid (Nath et al., 1985). In our study we found 5/6 nephrectomy rats had higher glutamine concentrations in kidney tissue, and lower concentrations in serum, compared to sham-operated rats, although neither finding was statistically significant. Glutamine was also associated with mortality in the study by Hu et al. (2018). Whether or not these changes are a part of acid-base balance remains to be seen, but the response of glutamine to dietary acid-base intervention would be interesting.
To summarise, acid-base balance is a very complex homeostatic mechanism, involving multiple organs and many different metabolites. Current measures of acid-base balance in arterial blood may not be able to assess buffering systems and tissue acid levels adequately. Even early CKD is associated with acid-base changes, and it may be possible to use urine metabolites to assess this, and to guide treatment.
4.1.5. CREATINE AND ENERGY METABOLITES
Creatine concentrations were lower in 5/6 nephrectomy rats in serum and tissue, being especially pronounced in the liver where creatine is generated. The creatine-phosphocreatine system is an important energy buffer in the cell, used to replenish ATP supplies (Wallimann et al., 1992), and lower muscle mass in 5/6 nephrectomy rats could partly be responsible for these differences, as muscle contains most of the creatine in the body. However, concentrations of guanidinoacetate (GAA), the precursor for creatine, were not altered in kidney tissue, suggesting that the problem was located in the liver where GAA is converted to creatine (methyl-GAA). This step is also a part of one-carbon metabolism and consumes a large proportion of all the methyl groups used in the body, suggesting that methylation in the liver could be disturbed in CKD (Brosnan et al., 2011). One-carbon metabolism is discussed further in section 4.1.7.2 below.
There was an interesting strong negative correlation between creatine and allantoin in several tissues, and between creatine and urea, creatine and creatinine, and creatine and allantoin in serum. This suggests that there could be a higher rate of creatine
CHAPTER 4. RESULTS AND DISCUSSION
75
breakdown, in a similar fate to purine degradation. Other studies have reported creatine changes, for example, in a study by Yu et al. on humans without CKD at entry to the study, serum creatine concentrations correlated with eGFR, although potential causes were not discussed (Yu et al., 2014). In another 5/6 nephrectomy rat study, creatine was found to be lower in kidney tissue, and this change was effectively prevented by a herbal treatment (Zhong et al., 2012). In a rat model of diabetic nephropathy caused by streptozotocin, creatine levels were also reduced in kidney extracts and urine, and many possible causes were listed (Zhao et al., 2011). Creatine concentration changes have been implicated in a wide range of diseases, and organ changes have led to suggestions for creatine supplementation, but without knowing why creatine levels are reduced, or the mechanisms linking creatine and allantoin concentrations, it is difficult to recommend before further research is carried out.
The citric acid cycle intermediates, citrate, fumarate, and oxoglutarate have been discussed above in relation to acid-base balance, and although citric acid cycle changes could have been a potential cause, we found no significant changes in tissue succinate, fumarate, glucose, lactate or 3-hydroxybutyrate. Carnitine is an important transport molecule that is needed to move long chain fatty acids into the mitochondria, where they can be converted into acetyl coenzyme A and enter the citric acid cycle. Carnitine levels tended to be lower in 5/6 nephrectomy lung and heart tissues, but this was not statistically significant. Multiple papers have found carnitine or acyl-carnitines to be affected by CKD, which could suggest mitochondrial dysfunction (Goek et al., 2012, Rhee et al., 2010, Velenosi et al., 2016).
Many metabolites involved in energetic processes are affected by CKD, although the picture is complicated by other pathways that also involve these metabolites. Evidence is accumulating that creatine and carnitine metabolites are altered in blood and tissues, but whether this causes CKD, or is an effect of CKD, remains to be seen.
4.1.6. OTHER SIGNIFICANT METABOLITES
Asparagine was significantly higher in 5/6 nephrectomy kidneys, with no changes in tissue and serum. There are only a few papers that mention asparagine in relation to CKD, for example, melamine and cyanuric acid renal toxicity resulted in increased asparagine concentrations in the medulla (Kim et al., 2012). Our findings could be spurious, but would probably be worth further investigation.
Myo-inositol, which is a known uremic retention solute, was not affected in tissues but was significantly higher in 5/6 nephrectomy serum. This is slightly surprising considering its role in osmoregulation in the kidney, and in contrast to allantoin and DMG, which both had increased serum and tissue concentrations. Other articles have
NMR-BASED METABOLOMICS IN KIDNEY AND LUNG DISEASE
76
shown significant myo-inositol concentration changes in kidney tissue in animal models (Zhao et al., 2011, Zhong et al., 2012), and in blood from patients with CKD (Mutsaers et al., 2013, Rhee et al., 2013).
4.1.7. INTERACTIONS BETWEEN METABOLITE PATHWAYS
Although it is tempting to take each pathway discussed above individually, the mechanisms are probably more complex than they initially appear. There are many potential reasons, for example: different reactions may be located in different parts of the cell or in different organs, therefore requiring transport mechanisms; there are numerous feedback loops; and there are interactions between the different pathways. In addition, several metabolites have multiple roles. Some of these issues are discussed below.
4.1.7.1 Acid-Base Connections to the Diet and Gut
Many of the gut-derived uremic retention solutes, such as indoxyl sulfate, p-cresyl sulfate, kynurenine and hippurate are excreted via organic anion transporters (OATs), which are also involved in acid-base regulation via the transport of organic anions such as citrate (Nigam et al., 2015). And indoxyl sulfate, which is transported by OAT1 into the tubular cells of the kidney, has been shown to accumulate in and damage these cells, further disturbing the acid-base regulatory ability of the kidney (Enomoto and Niwa, 2007). Another interesting aspect of the OAT family of transporters is that they are widely distributed in the body, and it is hypothesised that they could act as a sensing and signalling network between organs via the metabolites they transport (this is discussed further in section 4.1.7.3 below).
As mentioned earlier, diet is an important factor in acid-base balance, and has been under investigation for decades. For example, base-producing diets led to increasing excretion of citrate, oxoglutarate and succinate in rats in a paper from 1995 (Packer et al., 1995). Although the relationship between diet and CKD has been extensively investigated, mostly in relation to dietary protein, there has been a renewed interest in dietary acid and long-term outcomes in CKD. For example, higher dietary acid loads were associated with an increased risk of ESRD in a human population with CKD, and especially in those with albuminuria (Banerjee et al., 2015). Oral treatment with bicarbonate or citrate has been shown to slow the progression of CKD (de Brito-Ashurst et al., 2009, Gadola et al., 2004, Phisitkul et al., 2010), and in the absence of overt metabolic acidosis, as measured in arterial blood gas analysis, the mechanisms probably include acid retention in tissues (Wesson and Simoni, 2009, Wesson et al., 2017).
CHAPTER 4. RESULTS AND DISCUSSION
77
Difficulties remain in measuring acid retention, or dietary acid load, and without a straightforward test it will be difficult to assess the clinical significance of acid retention, or the effect of dietary modification. Research is being carried out on a potential test, and there have been promising trials showing that increasing base intake with extra fruit and vegetables can slow the decline of kidney function (Goraya et al., 2014, Goraya et al., 2019).
4.1.7.2 One-Carbon Metabolism
Figure 17. Pathways linked to one-carbon metabolism. S-Adenosylmethionine (SAM) is an important methyl donor, which is converted to S-adenosylhomocysteine (SAH) during methyl donation. SAM can be (re)generated in multiple ways, using different metabolites. THF, tetrahydrofolate; DHF, dihydrofolate; DMG, dimethylglycine, Met, methionine; Hcy, homocysteine; GSH, glutathione. Adapted from (Dahlhoff et al., 2013) under the Creative Commons BY 4.0 license. Copyright (2013) Dahlhoff et al., (https://doi.org/10.1371/journal.pone.0057387.g001).
One-carbon units are required in many synthetic pathways, for example, carnitine, creatine, amino acid, and phosphatidylcholine synthesis; and of course DNA, RNA and protein methylation (Bertolo and McBreairty, 2013). One of the key enzymes involved is betaine homocysteine methyltransferase (BHMT), which is particularly
NMR-BASED METABOLOMICS IN KIDNEY AND LUNG DISEASE
78
active in the kidney and liver. The sources of methyl groups include methionine, folate, betaine and choline, which are used to generate S-adenosylmethionine (SAM) in the methylation cycle (Figure 17). The wide range of reactions requiring methylation, and the large amount used for creatine synthesis, could suggest that competition for methyl groups can have effects on multiple pathways, especially in the liver where the creatine precursor is methylated. As discussed above, creatine concentrations were lower in serum and tissues in 5/6 nephrectomy rats, and the serum findings are in agreement with a human study, which found serum creatine correlated with eGFR (Yu et al., 2014).
The knock-on effect on other metabolites could include dimethylglycine (DMG), betaine and sarcosine levels, with important medical implications. For example, the plasma levels of DMG, which is produced when betaine has donated its methyl group, were elevated and correlated with homocysteine levels in human CKD (McGregor et al., 2001). Yu et al. found that serum concentrations of carnitine and betaine, as well as the creatine levels discussed earlier, correlated with eGFR (Yu et al., 2014). Consequences include the link between plasma DMG and risk of acute myocardial infarction, which was reported to be independent of traditional risk factors (Svingen et al., 2013). Lastly, there have been many attempts to reduce homocysteine levels to reduce cardiovascular disease, but these have not been successful, suggesting that other one-carbon sources are also important or that homocysteine concentrations are not a causal factor (Martí-Carvajal et al., 2017).
4.1.7.3 Remote Sensing and Signalling
As mentioned above, the OAT family of transporters has been hypothesised to be part of an inter-organ network which enables metabolism to be coordinated across the entire body. This “remote sensing and signalling” hypothesis was developed as the complexity of the SLC22 transporter family (which includes the OAT and OCT transporter families) was being discovered. The key points of this hypothesis are that the transporters are present on multiple organs and that they have overlapping substrate specificities, some of which are important rate-limiting metabolites (Ahn and Nigam, 2009). This hypothesis could explain crosstalk between organs, such as the cardiovascular effects of chronic kidney disease; the effect of the gut microbiome on the kidney and other organs; and the interaction between uremic retention solutes and other metabolites. Substrates that have been implicated in these interactions include known uremic toxins such as indoxyl sulfate, and also key metabolic intermediates (Ahn and Nigam, 2009, Wikoff et al., 2011).
In a similar fashion to the OAT substrates, it has been suggested that other metabolites are also remote sensing intermediates. For example, oxoglutarate is a key cofactor for the 2-oxoglutarate (alpha-ketoglutarate) dependent dioxygenases (2-
CHAPTER 4. RESULTS AND DISCUSSION
79
OGDO), which have a wide range of functions in the body. These enzymes are controlled by the availability of oxoglutarate, oxygen and iron, and given that oxoglutarate is an intermediate of the citric acid cycle, it has been postulated that these enzymes are sensitive to changes in energy metabolism (Salminen et al., 2015).
4.1.8. NEW TREATMENT OPTIONS
Although the main focus of this work is diagnosis, some of the metabolic pathways discussed above could suggest potential treatment options. Dietary interventions can be simple and effective, and especially in the case of acid retention discussed above, evidence is accumulating for treatment with citrate, bicarbonate or a base-producing diet earlier than is currently recommended (Goraya et al., 2014). More evidence is needed before this becomes accepted practice, and also a validated diagnostic test for acid retention, but it is not difficult to recommend eating more fruit and vegetables.
Because of the link between CKD and uric acid concentrations, xanthine oxidase inhibitors such as allopurinol have been suggested to be useful. Small-scale trials have had positive results (Goicoechea et al., 2010, Siu et al., 2006), and large-scale trials are underway (Maahs et al., 2013). Weight loss and calorie restriction can help patients with gout to lower uric acid concentrations (Dessein et al., 2000), and calorie restriction could help renal outcomes in patients with obesity and diabetes (Ruggenenti et al., 2017).
The gut microbiota has been implicated as a source of uremic toxins, and it is receiving more and more attention for its role in many diseases. But although it is an accessible target for treatment, changing the gut microbiota is difficult, for example needing an extensive and long-term change of diet, or transplantation. Other options include binding metabolites in the gut using adsorbents, such as AST-120, or targeting bacterial species or specific pathways with drugs (Zhang and Davies, 2016). Even intermittent fasting and calorie restriction could have positive effects by modifying the gut microbiome (Li et al., 2017).
Finally, the ability to measure more uremic toxins, and especially those which represent tubular function, could help to compare the effectiveness of different dialysis modalities, improve dialysis methods, and eventually, permit more personalised dialysis and treatment.
NMR-BASED METABOLOMICS IN KIDNEY AND LUNG DISEASE
80
4.1.9. STRENGTHS AND LIMITATIONS
Perhaps the most unique part of this work is that multiple tissues were analysed together with serum and urine. This helps us in several ways, such as providing some evidence for the origin of the metabolites, the mechanisms of inter-organ crosstalk, and whether urine and serum can reflect organ processes.
Although we originally thought that we could use metabolomics to describe the 5/6 nephrectomy model, we realised that time constraints and limited coverage would mean that a full characterisation was not possible. Ideally, we would have followed the rats until death, and analysed blood, urine and tissue at various points along the trajectory. This would have enabled a better organ localisation of the origin of the significant metabolites, as well as enabling us to differentiate which metabolites were important in different stages of CKD. Following the rats until death would also have allowed us to compare the ageing profiles of 5/6 nephrectomy and sham-operated rats, which is one of the theories of CKD.
Although we have attempted to put the individual metabolites into the context of biochemical pathways, this is difficult because of the sparse coverage of these pathways. In addition, the cause of increased metabolite concentrations is difficult to tease apart from the effects of reduced removal after 5/6 nephrectomy. Also, the complex web of metabolite pathways, and the crosstalk between organs adds another layer of complexity.
Animal models cannot fully represent human disease, partly because of metabolic differences, for example, humans do not possess the uricase enzyme to convert uric acid into allantoin. Although this could mean that our findings in rats are not applicable to humans, research in humans has also found some of the same metabolite changes, including increased allantoin concentrations, in CKD. Another difference between animal models and human disease, is that human diseases are generally multifactorial. This simplification, however, makes animal research easier and requires less subjects, because of reduced genetic and environmental variation.
Statistical power is another limitation in this work, and larger numbers in each group could have helped to find more significant metabolites. This experiment was, however, set up as a hypothesis generating approach, and we hope that the metabolites found in this study can be explored further.
CHAPTER 4. RESULTS AND DISCUSSION
81
4.1.10. FUTURE WORK
Other sources of information, such as proteomics or transcriptomics, would be extremely helpful in pinning down pathways for investigation or even treatment targets. Genomics may also help to find out why different patients can have such different outcomes. Another way of improving metabolite coverage would be to use other chemical analysis methods, such as mass spectrometry, which could also validate the NMR findings whilst simultaneously providing more information for metabolite identification. Other analytical methods that could be used to probe specific pathways include labelling of metabolites, such as isotopic labelling (e.g. 14C labelling), or hyperpolarisation. Hyperpolarisation is a relatively new technique that increases the signal of NMR-sensitive nuclei, and it has already been used to create labelled metabolites that can be followed using magnetic resonance spectroscopy (MRS) in vivo (Mikkelsen et al., 2017, Zacharias et al., 2012).
However, it is clear that CKD in humans is a complex disease process, with complex causes, and complex multi-organ results. There is probably no single pathway or single biomarker that can be used to diagnose or explain the diverse facets of the disease. One way forward would be to try and subcategorise CKD using these metabolites, along with clinical information. For example, it seems reasonable that CKD secondary to diabetes could result in a different biomarker profile to CKD secondary to high blood pressure (Kimura et al., 2016), but it could also be possible to subcategorise by gut flora phenotype. It is also important to consider the statistical models, which are not able to fully accommodate the complex multi-factorial nature of human disease. More work needs to be done to develop these statistical models and make them easy to use (Ghezzi et al., 2018).
Finally, chemical shifts in urine also contain valuable information, for example it is well known that metabolite peaks in NMR spectra of urine move in response to differing pH and ion concentrations. This has led to difficulty in analysing urine with NMR, and attempts to control the matrix with different buffers. In more recent work, the pH and NMR-invisible ion concentrations’ effects on chemical shift have been explored, resulting in the possibility to estimate these concentrations via the chemical shift of NMR-visible metabolites. In the future, this could be an extremely powerful method to analyse urine using NMR (Takis et al., 2017, Tredwell et al., 2016).
NMR-BASED METABOLOMICS IN KIDNEY AND LUNG DISEASE
82
4.2. PAPER II – CITRATE NMR PEAK IRREPRODUCIBILITY IN BLOOD SAMPLES AFTER REACQUISITION OF SPECTRA
During the serum analyses of the 5/6 nephrectomy paper, a number of serum spectra had to be reanalysed, normally because of lineshape problems which required repeated shimming, but also for routine reanalysis before two-dimensional spectra were acquired. On a few occasions we noticed that some metabolite integrals, and in particular the citrate signals, had a different intensity in the repeated NMR spectrum. Therefore, in this paper we attempted to describe the changes in citrate, lactate, glucose, phenylalanine and histidine peak integrals in NMR spectra from serum and plasma samples subjected to repeated NMR acquisition. Two parts of this work are important, firstly, there are general issues surrounding integration of peaks and quantification of metabolites, which affect all metabolomics studies. Secondly, peak integrals were occasionally different in the repeated NMR spectra, which could have important consequences.
4.2.1. SUMMARY OF RESULTS
With regards to general integration issues, two peaks for each metabolite were integrated to check precision in this study, and although all serum integral correlations (Inta vs Intb) were reasonable (citrate and lactate R2 > 0.98; glucose R2 = 0.85; phenylalanine and histidine R2 ≥ 0.70), the corresponding correlations of percentage changes (ΔInta(%) vs ΔIntb(%)) were not as good (citrate R2 = 0.93; lactate R2 = 0.66, glucose R2 = 0.23; phenylalanine R2 = 0.30; histidine R2 = 0.05). Plasma peak integral correlations (Inta vs Intb) were generally worse than serum (citrate R2 = 0.83; lactate, glucose and histidine R2 > 0.95; phenylalanine R2 = 0.58), and the correlations of percentage changes (ΔInta(%) vs ΔIntb(%)) were very weak (all R2 ≤ 0.13; with citrate and histidine R2 ≤ 0.02).
CHAPTER 4. RESULTS AND DISCUSSION
83
Figure 18. (A) Serum citrate peak integral correlation (Inta vs Intb). (B) Serum citrate correlation of peak integral differences (ΔInta(%) vs ΔIntb(%)) after reanalysis. (C) Plasma peak integral correlation (Inta vs Intb). (D) Plasma citrate correlation of peak integral differences (ΔInta(%) vs ΔIntb(%)) after reanalysis. Reproduced with permission (Hanifa et al., 2019). Copyright (2019) Springer Nature.
With regards to changes in the repeated spectra, although most repeated acquisitions were not significantly different, there was a clear and consistent difference in citrate peaks in a few serum spectra. Out of 44 repeated serum samples, 11 spectra had a significant citrate percentage reduction (≤ -5%), whilst 4 samples had a significant percentage increase (≥ +5%). Serum lactate and glucose peak integrals were larger in a small minority of these spectra, and there were no consistent changes in plasma samples for lactate or glucose. In plasma, because of the close proximity of the large EDTA peaks, and other overlapping peaks, accurate integration of the small citrate peaks was difficult, and no clear pattern could be discerned. There was a clear decrease in the lipoprotein signal in both repeated serum and plasma samples, however, this loss did not correlate with changes in the other signals. The lower intensity phenylalanine and histidine peaks were also investigated, and there was no clear pattern in the change of either, though issues with the signal-to-noise ratio may have obscured any structure (discussed further in section 4.2.3 below).
2.52
ppm
inte
gral
(a.u
.)
0
0.5
1
1.5
2
2.5
3
0 0.5 1 1.5 2 2.5 32.67ppm integral (a.u.)
2.52
ppm
% c
hang
e
-20
0
20
40
60
80
100
-60 -40 -20 0 20 40 602.67ppm % change
2.52
ppm
inte
gral
(a.u
.)
0
1
2
3
4
5
0 1 2 3 4 5 6 72.54ppm integral (a.u.)
2.52
ppm
% c
hang
e
-45
-30
-15
0
15
30
-40 -30 -20 -10 0 10 20 302.54ppm % change
(A) SERUM CITRATE
(C) PLASMA CITRATE
(B) SERUM CITRATE
(D) PLASMA CITRATE
NMR-BASED METABOLOMICS IN KIDNEY AND LUNG DISEASE
84
4.2.2. CITRATE PEAK INTEGRAL CHANGES
Although citrate binding to protein has been discussed in the literature, the changes occurring when NMR spectral acquisition has to be repeated have not been previously reported. Although only a small number of samples have to be repeated, and only a small minority of these suffer problems, it could lead to misinterpretation of results. Perhaps the biggest problem is that the timing of these changes after sample collection is unknown, and that these changes may have already taken place before the first NMR acquisition. Citrate is a key metabolite in the citric acid cycle and in acid-base balance in the kidney. In metabolomics studies, changes in blood concentrations are often suggested to imply citric acid cycle problems, and citrate was also a significant metabolite in the other papers in this thesis.
We were not, however, able to identify the cause of these changes. Other groups have described NMR invisible fractions of metabolites such as citrate, lactate, phenylalanine and histidine (Bell et al., 1988, Nicholson and Gartland, 1989). Possible causes of the bound proportion changing include external factors, such as heating and cooling during NMR measurement, and internal factors, for example it is possible that enzymes are still present and active. Methods for reducing this binding include using ammonium chloride, sodium chloride, SDS, perchloric acid and higher temperatures (Bell et al., 1988); whilst Nicholson and Gartland (1989) found that acidification reduced binding.
As mentioned in paper II, there is also the possibility that different metabolites compete for binding sites. For example, addition of fatty acids, or citrate, to a mixture of metabolites and human serum albumin has been shown to release some of the bound metabolites from albumin (Jupin et al., 2013). In a similar manner, TSP has been shown to release bound metabolites, including isoleucine, leucine and phenylalanine, in human plasma samples (Barrilero et al., 2017). TSP was part of the buffer in paper I, whilst DSA was used in the human serum samples in paper II, and no internal reference was used in the human plasma in paper II or the serum samples in paper III. Even dilution has been shown to change the fraction of metabolite bound to protein (Barrilero et al., 2017, Jupin et al., 2014).
However, none of the articles discussed above can explain why changes occurred after the first NMR acquisition, when temperature changes were minimal and nothing was added to the sample. Only one article, to the best of our knowledge, has discussed changes over time, reporting decreased lipoprotein signal intensity after 24 hours (Dona et al., 2014). This change was partially reversed by mixing the sample, and the authors suggested that settling of lipoproteins below the active region of the NMR coils was responsible. We also found a lipoprotein signal loss in the repeated spectra, but this did not correlate with the citrate changes.
CHAPTER 4. RESULTS AND DISCUSSION
85
4.2.3. METHODOLOGICAL ISSUES
The technical side of reproducibility is an important factor, and is often overlooked in metabolomics articles. Although NMR is generally regarded as more reproducible but less sensitive than MS, it is difficult to quantify overlapping NMR peaks accurately. We found this to be a problem when analysing the small citrate signals sitting on the large EDTA peaks in the plasma samples. Although the integrals correlated well (Figure 18C), the percentage changes did not (Figure 18D). Deconvolution, peak fitting and baseline correction are some of the methods which can be employed to separate overlapping peak integrals, but none are currently capable of the accuracy required. In addition, if human input is required, it can be subjective and reduce reproducibility.
Another reason that the percentage changes did not necessarily correlate is because of the propagation of uncertainty. This is where the uncertainty is amplified when calculations are performed on measurements which have an associated imprecision. Formulae exist to combine or adjust these uncertainties, and always lead to a larger uncertainty for the result than for the original measurements (Ku, 1966). This would apply when dividing one metabolite concentration by another, such as when calculating concentrations relative to another metabolite concentration (for example creatinine in urine, or percentage change); and because of the smaller signal-to-noise ratio, this affects the smaller peaks more than the larger peaks. This was clearly seen in the plasma histidine graphs, where large histidine peaks in the samples from patients who received histidine had an excellent correlation for both peak area and percentage change (Figure 19A+D, peak integral R2 = 1.00, percentage change R2 = 0.91). But although the small peaks, which were closer to the noise level, had an acceptable correlation (Figure 19C, R2 = 0.90), their percentage changes were not at all correlated (Figure 19B, R2 = 0.01).
NMR-BASED METABOLOMICS IN KIDNEY AND LUNG DISEASE
86
Figure 19. (A) Plasma histidine peak integral correlation (Inta vs Intb). (B) Plasma histidine correlation of peak integral differences (ΔInta(%) vs ΔIntb(%)) after reanalysis. (C) Magnified plasma histidine peak integral correlation. (D) Magnified plasma histidine correlation of peak integral differences after reanalysis. The large histidine integrals and percentage changes (black) correlated well, in contrast to those with a small signal-to-noise ratio (grey). Reproduced with permission (Hanifa et al., 2019). Copyright (2019) Springer Nature.
4.2.4. CONNECTIONS TO PAPERS I AND III
Citrate was undetectable in the NMR spectra of rat tissue extracts in paper I, which could be due to co-precipitation of citrate bound to protein during the extraction process (Daykin et al., 2002). Citrate changes in blood in both papers I and III could be partly due to changes in protein binding (caused by, for example, uremic retention solutes, or treatment with fluids and medication), but there are also many other potential causes for citrate concentration changes, which are discussed in the papers.
In connection with some of the theory dealing with causality and biomarkers, we should also consider whether citrate, or citrate binding, is a general marker of well-being, and that it could be altered by multiple disease processes, but not causally
-40
-20
0
20
40
60
-40 -30 -20 -10 0 10 20 30 40 500
4
8
12
16
20
0 4 8 12 16 20
7.08
ppm
inte
gral
(a.u
.)
7.83ppm integral (a.u.)
(A) PLASMA HISTIDINE (B) PLASMA HISTIDINE
7.08
ppm
% c
hang
e
7.83ppm % change
0
0.2
0.4
0.6
0.8
1
7.08
ppm
inte
gral
(a.u
.)
0 0.2 0.4 0.6 0.8 17.83ppm integral (a.u.)
(C) Magnified (A) - approx. 20x zoom
-10
-5
0
5
7.08
ppm
% c
hang
e
-10 -5 07.83ppm % change
(D) Magnified (B) - approx. 7x zoom
CHAPTER 4. RESULTS AND DISCUSSION
87
related (Ghezzi et al., 2018). If this is the case, it would be worth investigating in larger groups, for example all intensive care patients.
Complex interactions between metabolites and proteins could also explain why most uremic retention solutes do not fulfil Bergstom’s criteria. There are, of course, many things that we cannot measure in tissues and blood, and also long-term effects of exposure that we cannot define or measure easily at the moment, which could describe uremic symptoms better.
4.2.5. FUTURE WORK
The first step would be to confirm that protein binding of citrate is the cause of the change, and why this changes after repeated acquisition. This could be done, for example, by using NMR to measure diffusion coefficients. If confirmed, it would be interesting to consider whether this is useful, for example, pharmaceutical modelling of dosing uses knowledge of protein or lipid binding, and drug interactions are immensely important for patient safety. NMR could be used to assess the changes in the proportion of bound metabolite under different conditions, for example: after illness, after medication, during dialysis, or even after something as simple as intravenous fluid administration during surgery. NMR could also be used to more accurately dose medicines that are strongly protein bound. As suggested in the paper, NMR is in a unique position to assess protein-metabolite interactions, and “interactive/interaction metabolomics” has been suggested as a window into this complexity (Daykin et al., 2012).
Perhaps the simplest solution to accurately quantify protein bound metabolites would be to remove protein first, but protein removal could also lead to removal of these metabolites. There are, however, many different extraction and filtration methods, and investigating the amount of metabolite lost would be potentially useful work.
4.2.6. IMPLICATIONS FOR BIOMARKER VALIDATION
Because of the issues discussed above, and because of the lack of translation from laboratory to clinical use in many ‘omics’ fields, it is becoming more and more important to validate any biomarkers that have been discovered. Validation should include testing on an independent group, and not relying on internal (cross) validation; but validation should also include different analytical methods, or different sample types, or even different sample preparation techniques. These are necessary to avoid statistical pitfalls, but also to avoid experimental problems caused by the analytical methods themselves.
NMR-BASED METABOLOMICS IN KIDNEY AND LUNG DISEASE
88
The Metabolomics Standards Initiative guidelines suggest a minimum signal-to-noise ratio (SNR) of 10 for quantification (Sumner et al., 2007). It may be helpful to report the SNR for each metabolite, and use the SNR to calculate an uncertainty for derived quantities, such as percentage change. It would also be useful to integrate more than one peak area per metabolite and evaluate the correlation, to ensure precise integration.
4.3. PAPER III – PREDICTIVE BIOMARKERS AND METABOLIC HALLMARK OF POSTOPERATIVE HYPOXAEMIA
When lung function is impaired, the exchange of oxygen and carbon dioxide through the lungs is compromised, which has consequences for all other organs in the body. One of the causes is acute respiratory distress syndrome, which occurs after an insult to the lungs. These insults can be very different, which suggests a multifactorial illness, but there seems to be some common pathological mechanisms.
4.3.1. SUMMARY OF RESULTS
Figure 20. Prediction of oxygenation on the third postoperative day using NMR spectra of blood samples taken 16 hours after the end of the operation. Reproduced with permission (Maltesen et al., 2016). Copyright (2016) Springer Nature.
Out of the 47 patients where samples were available, 32 (68%) suffered hypoxaemia post-operatively, of which 9 (19%) suffered severe hypoxaemia, and 23 (49%) suffered mild hypoxaemia. As discussed in paper III, it was possible to predict oxygenation status three days postoperatively with NMR spectra of blood samples
CHAPTER 4. RESULTS AND DISCUSSION
89
taken 16 hours postoperatively (Figure 20). This was an interesting result, with real implications for clinical practice. In parallel to the CKD discussions, earlier diagnosis or finding patients at risk of hypoxaemia before they have the disease, would allow resources to be focussed on the patients that need it. This could save money, by allowing low risk patients to be moved from intensive care at an earlier stage, or enable earlier intervention in those at high risk, potentially reducing the severity of disease.
Integration of the significant peaks identified a large number of different metabolites that were significantly different between groups, including: amino acids such as glycine, lysine, alanine and phenylalanine; energy intermediates such as citrate, pyruvate, acetate, acetoacetate, 3-hydroxybutyrate and carnitine; and lipids and lipoproteins. These will be summarised and discussed in the following section.
Figure 21. Representative NMR spectra of serum samples taken 16 hours postoperatively from: one patient that did not develop hypoxaemia (black spectrum); and one patient who subsequently developed hypoxaemia (red spectrum). The spectral difference (unaffected – hypoxaemic) illustrates the scale of the changes. Reproduced with permission (Maltesen et al., 2016). Copyright (2016) Springer Nature.
GlutamateGlutamine
FAglucoproteins
FA
alanine
ValLeuIle
MainlyVLDL,LDL,HDL
3-HBA
lactate
PUFAGPC
Glucose, carbohydrates
PhenylalanineTyrosine
Histidine
NMR-BASED METABOLOMICS IN KIDNEY AND LUNG DISEASE
90
4.3.2. SIGNIFICANT METABOLITES
To help understand the changes that occur after surgery, and the differences between the three groups (severe, mild and unaffected), the significant metabolites will be discussed in three groups: energy intermediates, stress responses, and oxidative stress. These groups, however, overlap a great deal, both in terms of metabolites and processes.
4.3.2.1 Energy Intermediates
Important intermediates in energy metabolism include: citrate, pyruvate, lactate, acetate, carnitine, alanine and ketone bodies. Increased citrate, pyruvate and acetate concentrations in the hypoxaemic groups, especially in the left atrial (LA) samples, suggest that there was less consumption of these metabolites, or increased production. This could be because oxidative phosphorylation was limited, possibly because of a low PaO2, or because of increased production of intermediates from glycolysis which were not able to be further metabolised as quickly as they were produced (Garcia-Alvarez et al., 2014). Citrate, however, was administered during surgery as a component of the cardioplegic solution used to stop the heart beating and, as discussed in paper II, the citrate peak in NMR spectra is also affected by protein binding. Therefore, citrate peak changes may reflect other processes that occurred during surgery, such as fluid administration.
Other sources of energy intermediates include protein catabolism, which releases alanine, and alanine concentrations were higher in the hypoxaemic patients (Levy, 2006). Ketone bodies such as acetoacetate and 3-hydroxybutyrate also had higher concentrations in the hypoxaemic patients. Carnitine, which is an important transport molecule in fatty acid metabolism to generate acetyl-CoA for the citric acid cycle, also had a higher concentration in the hypoxaemic groups. Different organs can use different metabolites as energy sources, for example, the heart is especially flexible and can use fatty acids, lactate and amino acids, as well as glucose, to generate ATP; whilst ketone bodies are important sources of energy for the brain, heart and muscle (Lopaschuk, 2018). When under stress, lactate can be a greater source of pyruvate than glucose, and the lungs are thought to be a major source of lactate during sepsis (Garcia-Alvarez et al., 2014). Lactate concentrations were not significantly different between groups, which would be expected with hypoxaemia, and therefore the reasons for these changes are not entirely clear, although lactate concentrations had probably normalised by the time blood samples were taken (on the day after surgery).
CHAPTER 4. RESULTS AND DISCUSSION
91
4.3.2.2 Stress Response to Surgery
There were also many lipid and lipoprotein changes, including increased polyunsaturated fatty acids (PUFA), cholesterol and lipoproteins. Many are markers of cell damage and mediators of inflammation and the stress response, and could have been released during surgery, or during subsequent lung injury (Desborough, 2000). For example, free fatty acids and cholesterol were affected, potentially suggesting release as a result of cell membrane damage. Specific fatty acids are inflammatory mediators, and these could also be part of the PUFA signal increase.
Metabolites involved in energy processes are also altered by the stress response. For example, epinephrine (adrenaline) stimulates lactate production and is associated with a positive prognosis, which suggests that it is an adaptive response (Wutrich et al., 2010). Alanine concentrations can also change due to protein catabolism, as mentioned above, which is thought to be a stress response. Activation of the pituitary-adrenal stress response has been suggested to be mediated by the nervous system, and drugs that target these systems could be worth studying (Desborough, 2000).
4.3.2.3 Oxidative Stress
Oxidative stress could be considered as part of the overall stress response to surgery, but it has some unique metabolite features, and is generally considered separately. Hypoxanthine, a purine degradation metabolite of inosine or adenine, is oxidised to xanthine and uric acid (Figure 15 in section 4.1.2). It had a significantly lower concentration in the hypoxaemic group, which could suggest increased oxidative stress. However, the findings do not match previous publications, which have suggested that hypoxanthine increases after ischemia and reperfusion. Quinlan et al. found higher plasma concentrations in patients with ARDS, and they also found a significant difference in concentrations between survivors and non-survivors (Quinlan et al., 1997). In another paper, Evans et al. found higher concentrations of hypoxanthine in bronchoalveolar lavage fluid (BALF) from patients with ARDS (Evans et al., 2014). These differences, however, could be due to sample timing differences, or sample type differences.
A major source of oxidative stress in lung injury is thought to be due to neutrophils and macrophages, which are cells involved in the responses to infection and inflammation. The role of inflammation could be extremely important, because it can be targeted by medication. This has led to the trial of steroids and aspirin, which modify the inflammatory response, and also medications such as propofol and statins, whose main action is not modulating inflammation, although they possess antioxidant or anti-inflammatory properties (Altintas et al., 2011, Balyasnikova et al., 2005). Unfortunately, the results of multiple trials have been disappointing, although
NMR-BASED METABOLOMICS IN KIDNEY AND LUNG DISEASE
92
subgroup analysis has occasionally led to interesting findings (Abdulnour et al., 2018, Kor et al., 2016).
Oxidative stress is a complex subject, it is very difficult to measure, and it should also be noted that it is extremely difficult to localise which organ the metabolic changes originate from. Since surgery involved stopping the heart beating, stopping breathing, and taking over these two processes, oxidative stress could be primarily located in the heart rather than the lungs, or even in other organs which are not receiving an adequate supply of oxygen or blood.
4.3.3. CONNECTIONS TO PAPERS I AND II
One of the links between the kidney and lung research papers is oxidative stress. As mentioned above, hypoxanthine concentrations were lower in patients that developed hypoxaemia, but hypoxanthine was not found in the 5/6 nephrectomy experiment (paper I), possibly due to peak overlap or peak shift. However, allantoin, which is further downstream in purine breakdown, was identified in paper I, but although allantoin has a relatively isolated signal in the NMR spectrum, it was not at all visible in the human blood samples. It is known that humans do not possess the enzyme to convert uric acid to allantoin, and this could therefore represent species differences, however, as discussed in paper I, it has been shown that allantoin is present in humans subjects, and it is presumed that this is due to oxidative stress. It could be that allantoin is only present at large enough concentrations in chronic oxidative states, rather than acute injury. Or allantoin production could require a larger concentration of uric acid, which itself is dependent upon the breakdown of purines. And perhaps a more sensitive analytical method would have been able to detect allantoin in these samples.
In a similar fashion to the subdivision of patients with CKD, there seems to be a stratification of patients with lung injury into groups with either a high inflammatory status or a low inflammatory status (Calfee et al., 2014). These subgroups appear to be important not only for patient outcome, but also for research success (Acosta-Herrera et al., 2014). If this can be confirmed, and testing can be performed easily and cheaply, it could lead to better risk stratification, more focused research, and better targeting of treatment.
CHAPTER 4. RESULTS AND DISCUSSION
93
4.3.4. FUTURE WORK
Further experiments are in progress to test these findings in new datasets and other types of sample, for example tissue samples or bronchoalveolar fluid could prove to be useful to pinpoint the sources of changes. Some of these metabolites are excreted in urine, and it may therefore be worth investigating urine metabolites as well. Comparison with other endpoints, such as mortality, duration of ventilatory support, or length of admission may be worth investigating. As discussed previously, it may also be possible to subcategorise patients, and investigate metabolic differences in those with different levels of inflammation. In the future, it may be possible to tell who will mount a larger stress response or inflammatory response before surgery, which could allow resources to be efficiently targeted, and even preventative measures that could be used before surgery (Wynter-Blyth and Moorthy, 2017).
95
CHAPTER 5. CONCLUSIONS
Metabolomics and other ‘omics’ fields hold great promise for understanding disease mechanisms, early diagnosis and monitoring treatment. There is also the possibility that improved understanding leads to more specific diagnoses, improved risk stratification, new treatment options, and even new preventative measures.
However, there are still problems that need to be overcome and limitations to be understood. Large scale validation studies are needed to confirm findings, but there is also a need for studies that can examine relevant pathways, investigate the multifactorial nature of diseases, and find ways to tailor treatments to individual risk profiles.
Dealing with uncertainty is difficult, and the ‘omics’ fields come with plenty of uncertainty. Until we have the ability to deal with this, we will have to learn to live with it.
97
LITERATURE LIST Abdulnour, R.-E. E., Gunderson, T., Barkas, I., Timmons, J. Y., Barnig, C., Gong, M., et al. (2018). Early Intravascular Events Are Associated with Development of Acute Respiratory Distress Syndrome. A Substudy of the LIPS-A Clinical Trial. American journal of respiratory and critical care medicine, 197(12), 1575–1585. doi:10.1164/rccm.201712-2530OC
Aberg, K. M., Alm, E., & Torgrip, R. J. O. (2009). The correspondence problem for metabonomics datasets. Analytical and bioanalytical chemistry, 394(1), 151–62. doi:10.1007/s00216-009-2628-9
Abramowitz, M. K., Meyer, T. W., & Hostetter, T. H. (2010). Chapter 18 - The Pathophysiology of Uremia. In J. Himmelfarb & M. H. Sayegh (Eds.), Chronic Kidney Disease, Dialysis, and Transplantation (Third Edition) (Third Edit., pp. 251–264). Philadelphia: W.B. Saunders. doi:10.1016/B978-1-4377-0987-2.00018-2
Acosta-Herrera, M., Pino-Yanes, M., Perez-Mendez, L., Villar, J., & Flores, C. (2014). Assessing the quality of studies supporting genetic susceptibility and outcomes of ARDS. Frontiers in genetics, 5, 20. doi:10.3389/fgene.2014.00020
Acute Respiratory Distress Syndrome Network, Brower, R. G., Matthay, M. A., Morris, A., Schoenfeld, D., Thompson, B. T., & Wheeler, A. (2000). Ventilation with lower tidal volumes as compared with traditional tidal volumes for acute lung injury and the acute respiratory distress syndrome. The New England journal of medicine, 342(18), 1301–8. doi:10.1056/NEJM200005043421801
Ahn, S.-Y., & Nigam, S. K. (2009). Toward a systems level understanding of organic anion and other multispecific drug transporters: a remote sensing and signaling hypothesis. Molecular pharmacology, 76(3), 481–90. doi:10.1124/mol.109.056564
Altintas, N. D., Atilla, P., Iskit, A. B., & Topeli, A. (2011). Long-term simvastatin attenuates lung injury and oxidative stress in murine acute lung injury models induced by oleic acid and endotoxin. Respiratory care, 56(8), 1156–63. doi:10.4187/respcare.00770
Altman, N., & Krzywinski, M. (2018). The curse(s) of dimensionality. Nature methods, 15(6), 399–400. doi:10.1038/s41592-018-0019-x
Ames, B. N., Cathcart, R., Schwiers, E., & Hochstein, P. (1981). Uric acid provides an antioxidant defense in humans against oxidant- and radical-caused aging and cancer: a hypothesis. Proceedings of the National Academy of Sciences of the United States of America, 78(11), 6858–62. doi:10.1073/pnas.78.11.6858
ARDS Definition Task Force, Ranieri, V. M., Rubenfeld, G. D., Thompson, B. T., Ferguson, N. D., Caldwell, E., et al. (2012). Acute respiratory distress syndrome: the Berlin Definition. JAMA, 307(23), 2526–33. doi:10.1001/jama.2012.5669
NMR-BASED METABOLOMICS IN KIDNEY AND LUNG DISEASE
98
Ashbaugh, D. G., Bigelow, D. B., Petty, T. L., & Levine, B. E. (1967). Acute respiratory distress in adults. Lancet (London, England), 2(7511), 319–23. doi:10.1016/s0140-6736(67)90168-7
Aue, W. P., Karhan, J., & Ernst, R. R. (1976). Homonuclear broad band decoupling and two-dimensional J-resolved NMR spectroscopy. The Journal of Chemical Physics, 64(10), 4226–4227. doi:10.1063/1.431994
Bain, M. A., Faull, R., Fornasini, G., Milne, R. W., & Evans, A. M. (2006). Accumulation of trimethylamine and trimethylamine-N-oxide in end-stage renal disease patients undergoing haemodialysis. Nephrology Dialysis Transplantation, 21(5), 1300–4. doi:10.1093/ndt/gfk056
Balyasnikova, I. V., Visintine, D. J., Gunnerson, H. B., Paisansathan, C., Baughman, V. L., Minshall, R. D., & Danilov, S. M. (2005). Propofol attenuates lung endothelial injury induced by ischemia-reperfusion and oxidative stress. Anesthesia and analgesia, 100(4), 929–36. doi:10.1213/01.ANE.0000147707.49192.88
Banerjee, T., Crews, D. C., Wesson, D. E., Tilea, A. M., Saran, R., Ríos-Burrows, N., et al. (2015). High Dietary Acid Load Predicts ESRD among Adults with CKD. Journal of the American Society of Nephrology : JASN, 26(7), 1693–700. doi:10.1681/ASN.2014040332
Barrilero, R., Ramírez, N., Vallvé, J. C., Taverner, D., Fuertes, R., Amigó, N., & Correig, X. (2017). Unravelling and Quantifying the “NMR-Invisible” Metabolites Interacting with Human Serum Albumin by Binding Competition and T2 Relaxation-Based Decomposition Analysis. Journal of proteome research, 16(5), 1847–1856. doi:10.1021/acs.jproteome.6b00814
Baverel, G., Conjard, A., Chauvin, M.-F., Vercoutere, B., Vittorelli, A., Dubourg, L., et al. (2003). Carbon 13 NMR spectroscopy: a powerful tool for studying renal metabolism. Biochimie, 85(9), 863–71. doi:10.1016/j.biochi.2003.10.001
Begley, C. G., & Ioannidis, J. P. A. (2015). Reproducibility in science: improving the standard for basic and preclinical research. Circulation research, 116(1), 116–26. doi:10.1161/CIRCRESAHA.114.303819
Bell, J. D., Lee, J. A., Lee, H. A., Sadler, P. J., Wilkie, D. R., & Woodham, R. H. (1991). Nuclear magnetic resonance studies of blood plasma and urine from subjects with chronic renal failure: identification of trimethylamine-N-oxide. Biochimica et Biophysica Acta (BBA) - Molecular Basis of Disease, 1096(2), 101–107. doi:10.1016/0925-4439(91)90046-C
Bell, J. D., Brown, J. C. C., Kubal, G., & Sadler, P. J. (1988). NMR-invisible lactate in blood plasma. FEBS letters, 235(1–2), 81–6. doi:10.1016/0014-5793(88)81238-9
Bellani, G., Laffey, J. G., Pham, T., Fan, E., Brochard, L., Esteban, A., et al. (2016). Epidemiology, Patterns of Care, and Mortality for Patients With Acute Respiratory
LITERATURE LIST
99
Distress Syndrome in Intensive Care Units in 50 Countries. JAMA, 315(8), 788–800. doi:10.1001/jama.2016.0291
Benjamini, Y., & Hochberg, Y. (1995). Controlling the False Discovery Rate: A Practical and Powerful Approach to Multiple Testing. Journal of the Royal Statistical Society: Series B (Methodological), 57(1), 289–300. doi:10.1111/j.2517-6161.1995.tb02031.x
Bergstrom, J. (1997). Uremic toxicity. In Nutritional management of renal disease (pp. 97–190). Baltimore, Md.: Williams & Wilkins, c1997.
Bernard, G. R., Artigas, A., Brigham, K. L., Carlet, J., Falke, K., Hudson, L., et al. (1994). The American-European Consensus Conference on ARDS. Definitions, mechanisms, relevant outcomes, and clinical trial coordination. American journal of respiratory and critical care medicine, 149(3 Pt 1), 818–24. doi:10.1164/ajrccm.149.3.7509706
Bertolo, R. F., & McBreairty, L. E. (2013). The nutritional burden of methylation reactions. Current opinion in clinical nutrition and metabolic care, 16(1), 102–8. doi:10.1097/MCO.0b013e32835ad2ee
Bezabeh, T., Ijare, O. B., Nikulin, A. E., Somorjai, R. L., & Smith, I. C. P. (2014). MRS-based Metabolomics in Cancer Research. Magnetic resonance insights, 7, 1–14. doi:10.4137/MRI.S13755
Bime, C., Pouladi, N., Sammani, S., Batai, K., Casanova, N., Zhou, T., et al. (2018). Genome-Wide Association Study in African Americans with Acute Respiratory Distress Syndrome Identifies the Selectin P Ligand Gene as a Risk Factor. American journal of respiratory and critical care medicine, 197(11), 1421–1432. doi:10.1164/rccm.201705-0961OC
Bligh, E. G., & Dyer, W. J. (1959). A rapid method of total lipid extraction and purification. Canadian journal of biochemistry and physiology, 37(8), 911–7. doi:10.1139/o59-099
Bos, L. D. J., Scicluna, B. P., Ong, D. S. Y., Cremer, O., van der Poll, T., & Schultz, M. J. (2019). Understanding Heterogeneity in Biologic Phenotypes of Acute Respiratory Distress Syndrome by Leukocyte Expression Profiles. American journal of respiratory and critical care medicine, 200(1), 42–50. doi:10.1164/rccm.201809-1808OC
Bos, L. D. J., Weda, H., Wang, Y., Knobel, H. H., Nijsen, T. M. E., Vink, T. J., et al. (2014). Exhaled breath metabolomics as a noninvasive diagnostic tool for acute respiratory distress syndrome. The European respiratory journal, 44(1), 188–97. doi:10.1183/09031936.00005614
Brenner, B. M., Meyer, T. W., & Hostetter, T. H. (1982). Dietary protein intake and the progressive nature of kidney disease: the role of hemodynamically mediated glomerular injury in the pathogenesis of progressive glomerular sclerosis in aging,
NMR-BASED METABOLOMICS IN KIDNEY AND LUNG DISEASE
100
renal ablation, and intrinsic renal disease. The New England journal of medicine, 307(11), 652–9. doi:10.1056/NEJM198209093071104
Bricker, N. S., Morrin, P. A., & Kime, S. W. (1960). The pathologic physiology of chronic Bright’s disease. An exposition of the “intact nephron hypothesis”. The American journal of medicine, 28(1), 77–98. doi:10.1016/0002-9343(60)90225-4
Bricker, N. S. (1972). On the pathogenesis of the uremic state. An exposition of the “trade-off hypothesis”. The New England journal of medicine, 286(20), 1093–9. doi:10.1056/NEJM197205182862009
Brosnan, J. T., da Silva, R. P., & Brosnan, M. E. (2011). The metabolic burden of creatine synthesis. Amino acids, 40(5), 1325–31. doi:10.1007/s00726-011-0853-y
Brown, W. W., Peters, R. M., Ohmit, S. E., Keane, W. F., Collins, A., Chen, S.-C., et al. (2003). Early detection of kidney disease in community settings: the Kidney Early Evaluation Program (KEEP). American journal of kidney diseases, 42(1), 22–35. doi:10.1016/s0272-6386(03)00405-0
Brück, K., Stel, V. S., Gambaro, G., Hallan, S., Völzke, H., Ärnlöv, J., et al. (2016). CKD Prevalence Varies across the European General Population. Journal of the American Society of Nephrology : JASN, 27(7), 2135–47. doi:10.1681/ASN.2015050542
Buggeskov, K., Maltesen, R., Rasmussen, B., Hanifa, M., Lund, M., Wimmer, R., & Ravn, H. (2018). Lung Protection Strategies during Cardiopulmonary Bypass Affect the Composition of Blood Electrolytes and Metabolites—A Randomized Controlled Trial. Journal of Clinical Medicine, 7(11), 462. doi:10.3390/jcm7110462
Byers, S. O., Friedman, M., & Garfield, M. M. (1947). The blood uric acid and allantoin of the rat after nephrectomy and hepatectomy. The American journal of physiology, 150(4), 677–81. doi:10.1152/ajplegacy.1947.150.4.677
Calfee, C. S., Ware, L. B., Eisner, M. D., Parsons, P. E., Thompson, B. T., Wickersham, N., et al. (2008). Plasma receptor for advanced glycation end products and clinical outcomes in acute lung injury. Thorax, 63(12), 1083–9. doi:10.1136/thx.2008.095588
Calfee, C. S., Delucchi, K., Parsons, P. E., Thompson, B. T., Ware, L. B., Matthay, M. A., & NHLBI ARDS Network. (2014). Subphenotypes in acute respiratory distress syndrome: latent class analysis of data from two randomised controlled trials. The Lancet. Respiratory medicine, 2(8), 611–20. doi:10.1016/S2213-2600(14)70097-9
Cardinal-Fernández, P., Bajwa, E. K., Dominguez-Calvo, A., Menéndez, J. M., Papazian, L., & Thompson, B. T. (2016). The Presence of Diffuse Alveolar Damage on Open Lung Biopsy Is Associated With Mortality in Patients With Acute Respiratory Distress Syndrome: A Systematic Review and Meta-Analysis. Chest, 149(5), 1155–64. doi:10.1016/j.chest.2016.02.635
LITERATURE LIST
101
Carr, H. Y., & Purcell, E. M. (1954). Effects of Diffusion on Free Precession in Nuclear Magnetic Resonance Experiments. Physical Review, 94(3), 630–638. doi:10.1103/PhysRev.94.630
Caussé, E., Pradelles, A., Dirat, B., Negre-Salvayre, A., Salvayre, R., & Couderc, F. (2007). Simultaneous determination of allantoin, hypoxanthine, xanthine, and uric acid in serum/plasma by CE. Electrophoresis, 28(3), 381–7. doi:10.1002/elps.200600205
Ceballos-Picot, I., Witko-Sarsat, V., Merad-Boudia, M., Nguyen, A. T., Thévenin, M., Jaudon, M. C., et al. (1996). Glutathione antioxidant system as a marker of oxidative stress in chronic renal failure. Free Radical Biology and Medicine, 21(6), 845–853. doi:10.1016/0891-5849(96)00233-X
Chamberlain, R. M., & Shirley, D. G. (2007). Time course of the renal functional response to partial nephrectomy: measurements in conscious rats. Experimental physiology, 92(1), 251–62. doi:10.1113/expphysiol.2006.034751
Choi, J.-Y., Yoon, Y. J., Choi, H.-J., Park, S.-H., Kim, C.-D., Kim, I.-S., et al. (2011). Dialysis modality-dependent changes in serum metabolites: accumulation of inosine and hypoxanthine in patients on haemodialysis. Nephrology Dialysis Transplantation, 26(4), 1304–1313. doi:10.1093/ndt/gfq554
Chong, I.-G., & Jun, C.-H. (2005). Performance of some variable selection methods when multicollinearity is present. Chemometrics and Intelligent Laboratory Systems, 78(1–2), 103–112. doi:10.1016/j.chemolab.2004.12.011
Christie, J. D., Wurfel, M. M., Feng, R., O’Keefe, G. E., Bradfield, J., Ware, L. B., et al. (2012). Genome wide association identifies PPFIA1 as a candidate gene for acute lung injury risk following major trauma. PloS one, 7(1), e28268. doi:10.1371/journal.pone.0028268
Cockcroft, D. W., & Gault, M. H. (1976). Prediction of creatinine clearance from serum creatinine. Nephron, 16(1), 31–41. doi:10.1159/000180580
Curthoys, N. P., & Moe, O. W. (2014). Proximal tubule function and response to acidosis. Clinical journal of the American Society of Nephrology : CJASN, 9(9), 1627–38. doi:10.2215/CJN.10391012
Dahlhoff, C., Desmarchelier, C., Sailer, M., Fürst, R. W., Haag, A., Ulbrich, S. E., et al. (2013). Hepatic methionine homeostasis is conserved in C57BL/6N mice on high-fat diet despite major changes in hepatic one-carbon metabolism. PloS one, 8(3), e57387. doi:10.1371/journal.pone.0057387
Davidson, T. A., Caldwell, E. S., Curtis, J. R., Hudson, L. D., & Steinberg, K. P. (1999). Reduced quality of life in survivors of acute respiratory distress syndrome compared with critically ill control patients. JAMA, 281(4), 354–60. doi:10.1001/jama.281.4.354
NMR-BASED METABOLOMICS IN KIDNEY AND LUNG DISEASE
102
Davies, D. F., & Shock, N. W. (1950). Age changes in glomerular filtration rate, effective renal plasma flow, and tubular excretory capacity in adult males. The Journal of clinical investigation, 29(5), 496–507. doi:10.1172/JCI102286
Daykin, C. A., Bro, R., & Wulfert, F. (2012). Data handling for interactive metabolomics: tools for studying the dynamics of metabolome-macromolecule interactions. Metabolomics, 8(S1), 52–63. doi:10.1007/s11306-011-0359-3
Daykin, C. A., Foxall, P. J. D., Connor, S. C., Lindon, J. C., & Nicholson, J. K. (2002). The comparison of plasma deproteinization methods for the detection of low-molecular-weight metabolites by (1)H nuclear magnetic resonance spectroscopy. Analytical biochemistry, 304(2), 220–30. doi:10.1006/abio.2002.5637
de Brito-Ashurst, I., Varagunam, M., Raftery, M. J., & Yaqoob, M. M. (2009). Bicarbonate supplementation slows progression of CKD and improves nutritional status. Journal of the American Society of Nephrology : JASN, 20(9), 2075–84. doi:10.1681/ASN.2008111205
Depner, T. A. (2001). Uremic toxicity: urea and beyond. Seminars in dialysis, 14(4), 246–51. doi:10.1046/j.1525-139X.2001.00072.x
Desborough, J. P. (2000). The stress response to trauma and surgery. British journal of anaesthesia, 85(1), 109–17. doi:10.1093/bja/85.1.109
Dessein, P. H., Shipton, E. A., Stanwix, A. E., Joffe, B. I., & Ramokgadi, J. (2000). Beneficial effects of weight loss associated with moderate calorie/carbohydrate restriction, and increased proportional intake of protein and unsaturated fat on serum urate and lipoprotein levels in gout: a pilot study. Annals of the rheumatic diseases, 59(7), 539–43. doi:10.1136/ard.59.7.539
Diamantis, A., Magiorkinis, E., & Androutsos, G. (2008). Proteinuria: from ancient observation to 19th century scientific study. The Journal of urology, 180(6), 2330–2; discussion 2322. doi:10.1016/j.juro.2008.08.043
Dona, A. C., Jiménez, B., Schäfer, H., Humpfer, E., Spraul, M., Lewis, M. R., et al. (2014). Precision high-throughput proton NMR spectroscopy of human urine, serum, and plasma for large-scale metabolic phenotyping. Analytical chemistry, 86(19), 9887–94. doi:10.1021/ac5025039
Donnelly, S. C., Strieter, R. M., Kunkel, S. L., Walz, A., Robertson, C. R., Carter, D. C., et al. (1993). Interleukin-8 and development of adult respiratory distress syndrome in at-risk patient groups. Lancet (London, England), 341(8846), 643–7. doi:10.1016/0140-6736(93)90416-e
Driver, T. H., Shlipak, M. G., Katz, R., Goldenstein, L., Sarnak, M. J., Hoofnagle, A. N., et al. (2014). Low serum bicarbonate and kidney function decline: the Multi-Ethnic Study of Atherosclerosis (MESA). American journal of kidney diseases, 64(4), 534–41. doi:10.1053/j.ajkd.2014.05.008
LITERATURE LIST
103
Duranton, F., Cohen, G., De Smet, R., Rodriguez, M., Jankowski, J., Vanholder, R., et al. (2012). Normal and pathologic concentrations of uremic toxins. Journal of the American Society of Nephrology : JASN, 23(7), 1258–70. doi:10.1681/ASN.2011121175
Duranton, F., Depner, T. A., & Argilés, À. (2014). The Saga of Two Centuries of Urea: Nontoxic Toxin or Vice Versa? Seminars in nephrology, 34(2), 87–96. doi:10.1016/j.semnephrol.2014.02.002
Emwas, A.-H., Saccenti, E., Gao, X., McKay, R. T., Dos Santos, V. A. P. M., Roy, R., & Wishart, D. S. (2018). Recommended strategies for spectral processing and post-processing of 1D 1H-NMR data of biofluids with a particular focus on urine. Metabolomics, 14(3), 31. doi:10.1007/s11306-018-1321-4
Engelke, U. F. H., Tangerman, A., Willemsen, M. A. A. P., Moskau, D., Loss, S., Mudd, S. H., & Wevers, R. A. (2005). Dimethyl sulfone in human cerebrospinal fluid and blood plasma confirmed by one-dimensional (1)H and two-dimensional (1)H-(13)C NMR. NMR in biomedicine, 18(5), 331–6. doi:10.1002/nbm.966
Enomoto, A., & Niwa, T. (2007). Roles of organic anion transporters in the progression of chronic renal failure. Therapeutic apheresis and dialysis, 11 Suppl 1(s1), S27-31. doi:10.1111/j.1744-9987.2007.00515.x
Evans, C. R., Karnovsky, A., Kovach, M. A., Standiford, T. J., Burant, C. F., & Stringer, K. A. (2014). Untargeted LC-MS metabolomics of bronchoalveolar lavage fluid differentiates acute respiratory distress syndrome from health. Journal of proteome research, 13(2), 640–9. doi:10.1021/pr4007624
Fiehn, O. (2002). Metabolomics--the link between genotypes and phenotypes. Plant molecular biology, 48(1–2), 155–71. doi:10.1023/A:1013713905833
Fisher-Wellman, K., & Bloomer, R. J. (2009). Acute exercise and oxidative stress: a 30 year history. Dynamic medicine : DM, 8(1), 1. doi:10.1186/1476-5918-8-1
Fremont, R. D., Koyama, T., Calfee, C. S., Wu, W., Dossett, L. A., Bossert, F. R., et al. (2010). Acute lung injury in patients with traumatic injuries: utility of a panel of biomarkers for diagnosis and pathogenesis. The Journal of trauma, 68(5), 1121–7. doi:10.1097/TA.0b013e3181c40728
Friedman, D. J., & Pollak, M. R. (2011). Genetics of kidney failure and the evolving story of APOL1. The Journal of clinical investigation, 121(9), 3367–74. doi:10.1172/JCI46263
Fujiwara, M., Kobayashi, T., Jomori, T., Maruyama, Y., Oka, Y., Sekino, H., et al. (2009). Pattern recognition analysis for 1H NMR spectra of plasma from hemodialysis patients. Analytical and bioanalytical chemistry, 394(6), 1655–60. doi:10.1007/s00216-009-2830-9
NMR-BASED METABOLOMICS IN KIDNEY AND LUNG DISEASE
104
Gadola, L., Noboa, O., Márquez, M. N., Rodriguez, M. J., Nin, N., Boggia, J., et al. (2004). Calcium citrate ameliorates the progression of chronic renal injury. Kidney international, 65(4), 1224–30. doi:10.1111/j.1523-1755.2004.00496.x
Garcia-Alvarez, M., Marik, P., & Bellomo, R. (2014). Sepsis-associated hyperlactatemia. Critical care (London, England), 18(5), 503. doi:10.1186/s13054-014-0503-3
GBD 2016 Causes of Death Collaborators. (2017). Global, regional, and national age-sex specific mortality for 264 causes of death, 1980-2016: a systematic analysis for the Global Burden of Disease Study 2016. Lancet (London, England), 390(10100), 1151–1210. doi:10.1016/S0140-6736(17)32152-9
Ghezzi, P., Davies, K., Delaney, A., & Floridi, L. (2018). Theory of signs and statistical approach to big data in assessing the relevance of clinical biomarkers of inflammation and oxidative stress. Proceedings of the National Academy of Sciences of the United States of America, 115(10), 2473–2477. doi:10.1073/pnas.1719807115
Goek, O.-N., Döring, A., Gieger, C., Heier, M., Koenig, W., Prehn, C., et al. (2012). Serum metabolite concentrations and decreased GFR in the general population. American journal of kidney diseases, 60(2), 197–206. doi:10.1053/j.ajkd.2012.01.014
Goek, O.-N., Prehn, C., Sekula, P., Römisch-Margl, W., Döring, A., Gieger, C., et al. (2013). Metabolites associate with kidney function decline and incident chronic kidney disease in the general population. Nephrology Dialysis Transplantation, 28(8), 2131–2138. doi:10.1093/ndt/gft217
Goicoechea, M., de Vinuesa, S. G., Verdalles, U., Ruiz-Caro, C., Ampuero, J., Rincón, A., et al. (2010). Effect of allopurinol in chronic kidney disease progression and cardiovascular risk. Clinical journal of the American Society of Nephrology : CJASN, 5(8), 1388–93. doi:10.2215/CJN.01580210
Goldstein, R. S., Tarloff, J. B., & Hook, J. B. (1988). Age-related nephropathy in laboratory rats. FASEB journal, 2(7), 2241–51. doi:10.1096/fasebj.2.7.3280378
Goraya, N., Simoni, J., Jo, C.-H., & Wesson, D. E. (2014). Treatment of metabolic acidosis in patients with stage 3 chronic kidney disease with fruits and vegetables or oral bicarbonate reduces urine angiotensinogen and preserves glomerular filtration rate. Kidney international, 86(5), 1031–8. doi:10.1038/ki.2014.83
Goraya, N., Simoni, J., Sager, L. N., Madias, N. E., & Wesson, D. E. (2019). Urine citrate excretion as a marker of acid retention in patients with chronic kidney disease without overt metabolic acidosis. Kidney international, 95(5), 1190–1196. doi:10.1016/j.kint.2018.11.033
Greger, R., Lang, F., & Deetjen, P. (1975). Handling of allantoin by the rat kidney. Clearance and micropuncture data. Pflugers Archiv : European journal of physiology, 357(3–4), 201–7. doi:10.1007/BF00585975
LITERATURE LIST
105
Griffin, K. A., Picken, M., & Bidani, A. K. (1994). Method of renal mass reduction is a critical modulator of subsequent hypertension and glomerular injury. Journal of the American Society of Nephrology : JASN, 4(12), 2023–31. http://www.ncbi.nlm.nih.gov/pubmed/7919155
Guijas, C., Montenegro-Burke, J. R., Domingo-Almenara, X., Palermo, A., Warth, B., Hermann, G., et al. (2018). METLIN: A Technology Platform for Identifying Knowns and Unknowns. Analytical chemistry, 90(5), 3156–3164. doi:10.1021/acs.analchem.7b04424
Hanifa, M. A., Maltesen, R. G., Rasmussen, B. S., Buggeskov, K. B., Ravn, H. B., Skott, M., et al. (2020). Citrate NMR peak irreproducibility in blood samples after reacquisition of spectra. Metabolomics, 16(1), 7. doi:10.1007/s11306-019-1629-8
Hanifa, M. A., Skott, M., Maltesen, R. G., Rasmussen, B. S., Nielsen, S., Frøkiær, J., et al. (2019). Tissue, urine and blood metabolite signatures of chronic kidney disease in the 5/6 nephrectomy rat model. Metabolomics, 15(8), 112. doi:10.1007/s11306-019-1569-3
Hoerger, T. J., Wittenborn, J. S., Zhuo, X., Pavkov, M. E., Burrows, N. R., Eggers, P., et al. (2012). Cost-effectiveness of screening for microalbuminuria among African Americans. Journal of the American Society of Nephrology : JASN, 23(12), 2035–41. doi:10.1681/ASN.2012040347
Horning, E. C., & Horning, M. G. (1971). Metabolic profiles: gas-phase methods for analysis of metabolites. Clinical chemistry, 17(8), 802–9. http://www.ncbi.nlm.nih.gov/pubmed/5105517
Hsu, C., Xie, D., Waikar, S. S., Bonventre, J. V., Zhang, X., Sabbisetti, V., et al. (2017). Urine biomarkers of tubular injury do not improve on the clinical model predicting chronic kidney disease progression. Kidney international, 91(1), 196–203. doi:10.1016/j.kint.2016.09.003
Hu, J.-R., Coresh, J., Inker, L. A., Levey, A. S., Zheng, Z., Rebholz, C. M., et al. (2018). Serum metabolites are associated with all-cause mortality in chronic kidney disease. Kidney international, 94(2), 381–389. doi:10.1016/j.kint.2018.03.008
Inker, L. A., Schmid, C. H., Tighiouart, H., Eckfeldt, J. H., Feldman, H. I., Greene, T., et al. (2012). Estimating glomerular filtration rate from serum creatinine and cystatin C. The New England journal of medicine, 367(1), 20–9. doi:10.1056/NEJMoa1114248
Ioannidis, J. P. A. (2018). The Proposal to Lower P Value Thresholds to .005. JAMA, 319(14), 1429–1430. doi:10.1001/jama.2018.1536
Jamison, R. L. (2014). Resolving an 80-yr-old controversy: the beginning of the modern era of renal physiology. Advances in physiology education, 38(4), 286–95. doi:10.1152/advan.00105.2014
NMR-BASED METABOLOMICS IN KIDNEY AND LUNG DISEASE
106
Johnson, M. A., Tekkanat, K., Schmaltz, S. P., & Fox, I. H. (1989). Adenosine triphosphate turnover in humans. Decreased degradation during relative hyperphosphatemia. The Journal of clinical investigation, 84(3), 990–5. doi:10.1172/JCI114263
Jupin, M., Michiels, P. J., Girard, F. C., Spraul, M., & Wijmenga, S. S. (2014). NMR metabolomics profiling of blood plasma mimics shows that medium- and long-chain fatty acids differently release metabolites from human serum albumin. Journal of Magnetic Resonance, 239, 34–43. doi:10.1016/j.jmr.2013.11.019
Jupin, M., Michiels, P. J., Girard, F. C., Spraul, M., & Wijmenga, S. S. (2013). NMR identification of endogenous metabolites interacting with fatted and non-fatted human serum albumin in blood plasma: Fatty acids influence the HSA-metabolite interaction. Journal of Magnetic Resonance, 228, 81–94. doi:10.1016/j.jmr.2012.12.010
Juss, J., Herre, J., Begg, M., Bradley, G., Lennon, M., Amour, A., et al. (2015). Genome-wide transcription profiling in neutrophils in acute respiratory distress syndrome. Lancet (London, England), 385 Suppl, S55. doi:10.1016/S0140-6736(15)60370-1
Kand’ár, R., & Záková, P. (2008). Allantoin as a marker of oxidative stress in human erythrocytes. Clinical chemistry and laboratory medicine, 46(9), 1270–4. doi:10.1515/CCLM.2008.244
Kangelaris, K. N., Prakash, A., Liu, K. D., Aouizerat, B., Woodruff, P. G., Erle, D. J., et al. (2015). Increased expression of neutrophil-related genes in patients with early sepsis-induced ARDS. American journal of physiology. Lung cellular and molecular physiology, 308(11), L1102-13. doi:10.1152/ajplung.00380.2014
Karnovsky, A., Weymouth, T., Hull, T., Tarcea, V. G., Scardoni, G., Laudanna, C., et al. (2012). Metscape 2 bioinformatics tool for the analysis and visualization of metabolomics and gene expression data. Bioinformatics (Oxford, England), 28(3), 373–80. doi:10.1093/bioinformatics/btr661
KDIGO 2012 Work Group. (2013). Summary of Recommendation Statements. Kidney international supplements, 3(1), 5–14. doi:10.1038/kisup.2012.77
Kim, C. S., Jin, D.-C., Yun, Y. C., Bae, E. H., Ma, S. K., & Kim, S. W. (2017). Relationship between serum uric acid and mortality among hemodialysis patients: Retrospective analysis of Korean end-stage renal disease registry data. Kidney research and clinical practice, 36(4), 368–376. doi:10.23876/j.krcp.2017.36.4.368
Kim, J.-A., Choi, H.-J., Kwon, Y.-K., Ryu, D. H., Kwon, T.-H., & Hwang, G.-S. (2014). 1H NMR-based metabolite profiling of plasma in a rat model of chronic kidney disease. PloS one, 9(1), e85445. doi:10.1371/journal.pone.0085445
Kim, T. H., Ahn, M. Y., Lim, H. J., Lee, Y. J., Shin, Y. J., De, U., et al. (2012). Evaluation of metabolomic profiling against renal toxicity in Sprague–Dawley rats
LITERATURE LIST
107
treated with melamine and cyanuric acid. Archives of Toxicology, 86(12), 1885–1897. doi:10.1007/s00204-012-0910-7
Kimura, T., Yasuda, K., Yamamoto, R., Soga, T., Rakugi, H., Hayashi, T., & Isaka, Y. (2016). Identification of biomarkers for development of end-stage kidney disease in chronic kidney disease by metabolomic profiling. Scientific reports, 6(1), 26138. doi:10.1038/srep26138
Klahr, S., Levey, A. S., Beck, G. J., Caggiula, A. W., Hunsicker, L., Kusek, J. W., & Striker, G. (1994). The effects of dietary protein restriction and blood-pressure control on the progression of chronic renal disease. Modification of Diet in Renal Disease Study Group. The New England journal of medicine, 330(13), 877–84. doi:10.1056/NEJM199403313301301
Komenda, P., Ferguson, T. W., Macdonald, K., Rigatto, C., Koolage, C., Sood, M. M., & Tangri, N. (2014). Cost-effectiveness of primary screening for CKD: a systematic review. American journal of kidney diseases, 63(5), 789–97. doi:10.1053/j.ajkd.2013.12.012
Kooman, J. P., Broers, N. J. H., Usvyat, L., Thijssen, S., van der Sande, F. M., Cornelis, T., et al. (2013). Out of control: accelerated aging in uremia. Nephrology Dialysis Transplantation, 28(1), 48–54. doi:10.1093/ndt/gfs451
Kor, D. J., Carter, R. E., Park, P. K., Festic, E., Banner-Goodspeed, V. M., Hinds, R., et al. (2016). Effect of Aspirin on Development of ARDS in At-Risk Patients Presenting to the Emergency Department: The LIPS-A Randomized Clinical Trial. JAMA, 315(22), 2406–14. doi:10.1001/jama.2016.6330
Ku, H. H. (1966). Notes on the use of propagation of error formulas. Journal of Research of the National Bureau of Standards, Section C: Engineering and Instrumentation, 70C(4), 263. doi:10.6028/jres.070C.025
Kwon, T. H., Frøkiaer, J., Knepper, M. A., & Nielsen, S. (1998). Reduced AQP1, -2, and -3 levels in kidneys of rats with CRF induced by surgical reduction in renal mass. The American journal of physiology, 275(5 Pt 2), F724-41. doi:10.1152/ajprenal.1998.275.5.F724
Levey, A. S., Stevens, L. A., Schmid, C. H., Zhang, Y. L., Castro, A. F., Feldman, H. I., et al. (2009). A new equation to estimate glomerular filtration rate. Annals of internal medicine, 150(9), 604–12. doi:10.7326/0003-4819-150-9-200905050-00006
Levey, A. S., Bosch, J. P., Lewis, J. B., Greene, T., Rogers, N., & Roth, D. (1999). A more accurate method to estimate glomerular filtration rate from serum creatinine: a new prediction equation. Modification of Diet in Renal Disease Study Group. Annals of internal medicine, 130(6), 461–70. doi:10.7326/0003-4819-130-6-199903160-00002
Levey, A. S., de Jong, P. E., Coresh, J., El Nahas, M., Astor, B. C., Matsushita, K., et al. (2011). The definition, classification, and prognosis of chronic kidney disease:
NMR-BASED METABOLOMICS IN KIDNEY AND LUNG DISEASE
108
a KDIGO Controversies Conference report. Kidney international, 80(1), 17–28. doi:10.1038/ki.2010.483
Levy, B. (2006). Lactate and shock state: the metabolic view. Current opinion in critical care, 12(4), 315–21. doi:10.1097/01.ccx.0000235208.77450.15
Li, G., Xie, C., Lu, S., Nichols, R. G., Tian, Y., Li, L., et al. (2017). Intermittent Fasting Promotes White Adipose Browning and Decreases Obesity by Shaping the Gut Microbiota. Cell metabolism, 26(4), 672-685.e4. doi:10.1016/j.cmet.2017.08.019
Lin, C. Y., Wu, H., Tjeerdema, R. S., & Viant, M. R. (2007). Evaluation of metabolite extraction strategies from tissue samples using NMR metabolomics. Metabolomics, 3(1), 55–67. doi:10.1007/s11306-006-0043-1
Liyanage, T., Ninomiya, T., Jha, V., Neal, B., Patrice, H. M., Okpechi, I., et al. (2015). Worldwide access to treatment for end-stage kidney disease: a systematic review. Lancet (London, England), 385(9981), 1975–82. doi:10.1016/S0140-6736(14)61601-9
Lopaschuk, G. (2018). Cardiac energy metabolism in mild and severe ischemia. Heart and Metabolism, (75), 33–36. doi:10.31887/HM.2018.75/Lopaschuk
Lowenstein, J., & Grantham, J. J. (2016). The rebirth of interest in renal tubular function. American journal of physiology. Renal physiology, 310(11), F1351-5. doi:10.1152/ajprenal.00055.2016
Maahs, D. M., Caramori, L., Cherney, D. Z. I., Galecki, A. T., Gao, C., Jalal, D., et al. (2013). Uric acid lowering to prevent kidney function loss in diabetes: the preventing early renal function loss (PERL) allopurinol study. Current diabetes reports, 13(4), 550–9. doi:10.1007/s11892-013-0381-0
Maddox, D. A., Horn, J. F., Famiano, F. C., & Gennari, F. J. (1986). Load dependence of proximal tubular fluid and bicarbonate reabsorption in the remnant kidney of the Munich-Wistar rat. The Journal of clinical investigation, 77(5), 1639–49. doi:10.1172/JCI112481
Maier, L., Pruteanu, M., Kuhn, M., Zeller, G., Telzerow, A., Anderson, E. E., et al. (2018). Extensive impact of non-antibiotic drugs on human gut bacteria. Nature, 555(7698), 623–628. doi:10.1038/nature25979
Maltesen, R. G., Hanifa, M. A., Kucheryavskiy, S., Pedersen, S., Kristensen, S. R., Rasmussen, B. S., & Wimmer, R. (2016). Predictive biomarkers and metabolic hallmark of postoperative hypoxaemia. Metabolomics, 12(5), 87. doi:10.1007/s11306-016-1018-5
LITERATURE LIST
109
Maltesen, R. G., Rasmussen, B. S., Pedersen, S., Hanifa, M. A., Kucheryavskiy, S., Kristensen, S. R., & Wimmer, R. (2017). Metabotyping Patients’ Journeys Reveals Early Predisposition to Lung Injury after Cardiac Surgery. Scientific reports, 7(1), 40275. doi:10.1038/srep40275
Marandola, P., Musitelli, S., Jallous, H., Speroni, A., & de Bastiani, T. (1994). The Aristotelian kidney. American journal of nephrology, 14(4–6), 302–6. doi:10.1159/000168738
Marangella, M., Vitale, C., Manganaro, M., Cosseddu, D., Martini, C., Petrarulo, M., & Linari, F. (1991). Renal handling of citrate in chronic renal insufficiency. Nephron, 57(4), 439–43. doi:10.1159/000186347
Markley, J. L., Brüschweiler, R., Edison, A. S., Eghbalnia, H. R., Powers, R., Raftery, D., & Wishart, D. S. (2017). The future of NMR-based metabolomics. Current opinion in biotechnology, 43, 34–40. doi:10.1016/j.copbio.2016.08.001
Martí-Carvajal, A. J., Solà, I., Lathyris, D., & Dayer, M. (2017). Homocysteine-lowering interventions for preventing cardiovascular events. The Cochrane database of systematic reviews, 8, CD006612. doi:10.1002/14651858.CD006612.pub5
Matthay, M. A., Zemans, R. L., Zimmerman, G. A., Arabi, Y. M., Beitler, J. R., Mercat, A., et al. (2019). Acute respiratory distress syndrome. Nature reviews. Disease primers, 5(1), 18. doi:10.1038/s41572-019-0069-0
McGregor, D. O., Dellow, W. J., Lever, M., George, P. M., Robson, R. A., & Chambers, S. T. (2001). Dimethylglycine accumulates in uremia and predicts elevated plasma homocysteine concentrations. Kidney international, 59(6), 2267–72. doi:10.1046/j.1523-1755.2001.00743.x
Meiboom, S., & Gill, D. (1958). Modified Spin-Echo Method for Measuring Nuclear Relaxation Times. Review of Scientific Instruments, 29(8), 688–691. doi:10.1063/1.1716296
Mikami, T., Kita, K., Tomita, S., Qu, G. J., Tasaki, Y., & Ito, A. (2000). Is allantoin in serum and urine a useful indicator of exercise-induced oxidative stress in humans? Free radical research, 32(3), 235–44. doi:10.1080/10715760000300241
Mikkelsen, E. F. R., Mariager, C. Ø., Nørlinger, T., Qi, H., Schulte, R. F., Jakobsen, S., et al. (2017). Hyperpolarized [1-13C]-acetate Renal Metabolic Clearance Rate Mapping. Scientific reports, 7(1), 16002. doi:10.1038/s41598-017-15929-x
Missailidis, C., Hällqvist, J., Qureshi, A. R., Barany, P., Heimbürger, O., Lindholm, B., et al. (2016). Serum Trimethylamine-N-Oxide Is Strongly Related to Renal Function and Predicts Outcome in Chronic Kidney Disease. PloS one, 11(1), e0141738. doi:10.1371/journal.pone.0141738
Morrison, A. B., & Howard, R. M. (1966). The functional capacity of hypertrophied nephrons. Effect of partial nephrectomy on the clearance of inulin and PAH in the
NMR-BASED METABOLOMICS IN KIDNEY AND LUNG DISEASE
110
rat. The Journal of experimental medicine, 123(5), 829–44. doi:10.1084/jem.123.5.829
Mutsaers, H. A. M., Engelke, U. F. H., Wilmer, M. J. G., Wetzels, J. F. M., Wevers, R. A., van den Heuvel, L. P., et al. (2013). Optimized metabolomic approach to identify uremic solutes in plasma of stage 3-4 chronic kidney disease patients. PloS one, 8(8), e71199. doi:10.1371/journal.pone.0071199
Nadkarni, G. N., & Horowitz, C. R. (2016). Genomics in CKD: Is This the Path Forward? Advances in chronic kidney disease, 23(2), 120–4. doi:10.1053/j.ackd.2016.01.017
Nakagawa, T., Hu, H., Zharikov, S., Tuttle, K. R., Short, R. A., Glushakova, O., et al. (2006). A causal role for uric acid in fructose-induced metabolic syndrome. American journal of physiology. Renal physiology, 290(3), F625-31. doi:10.1152/ajprenal.00140.2005
Narayanan, S., & Appleton, H. D. (1980). Creatinine: a review. Clinical chemistry, 26(8), 1119–26. http://www.ncbi.nlm.nih.gov/pubmed/6156031
Nath, K. A., Hostetter, M. K., & Hostetter, T. H. (1985). Pathophysiology of chronic tubulo-interstitial disease in rats. Interactions of dietary acid load, ammonia, and complement component C3. The Journal of clinical investigation, 76(2), 667–75. doi:10.1172/JCI112020
National Heart, Lung, and Blood Institute Acute Respiratory Distress Syndrome (ARDS) Clinical Trials Network, Wiedemann, H. P., Wheeler, A. P., Bernard, G. R., Thompson, B. T., Hayden, D., et al. (2006). Comparison of two fluid-management strategies in acute lung injury. The New England journal of medicine, 354(24), 2564–75. doi:10.1056/NEJMoa062200
Nicholson, J. K., Lindon, J. C., & Holmes, E. (1999). “Metabonomics”: understanding the metabolic responses of living systems to pathophysiological stimuli via multivariate statistical analysis of biological NMR spectroscopic data. Xenobiotica; the fate of foreign compounds in biological systems, 29(11), 1181–9. doi:10.1080/004982599238047
Nicholson, J. K., & Gartland, K. P. (1989). 1H NMR studies on protein binding of histidine, tyrosine and phenylalanine in blood plasma. NMR in biomedicine, 2(2), 77–82. doi:10.1002/nbm.1940020207
Nigam, S. K., Bush, K. T., Martovetsky, G., Ahn, S.-Y., Liu, H. C., Richard, E., et al. (2015). The organic anion transporter (OAT) family: a systems biology perspective. Physiological reviews, 95(1), 83–123. doi:10.1152/physrev.00025.2013
Ning, M., & Lo, E. H. (2010). Opportunities and challenges in omics. Translational stroke research, 1(4), 233–7. doi:10.1007/s12975-010-0048-y
Niwa, T., Ohki, T., Maeda, K., Saito, A., Ohta, K., & Kobayashi, K. (1979). A gas chromatographic-mass spectrometric assay for nine hydroxyphenolic acids in uremic
LITERATURE LIST
111
serum. Clinica chimica acta; international journal of clinical chemistry, 96(3), 247–54. doi:10.1016/0009-8981(79)90435-2
Nyengaard, J. R., & Bendtsen, T. F. (1992). Glomerular number and size in relation to age, kidney weight, and body surface in normal man. The Anatomical record, 232(2), 194–201. doi:10.1002/ar.1092320205
Packer, R. K., Curry, C. A., & Brown, K. M. (1995). Urinary organic anion excretion in response to dietary acid and base loading. Journal of the American Society of Nephrology : JASN, 5(8), 1624–9. http://www.ncbi.nlm.nih.gov/pubmed/7756596
Parsons, P. E., Eisner, M. D., Thompson, B. T., Matthay, M. A., Ancukiewicz, M., Bernard, G. R., et al. (2005). Lower tidal volume ventilation and plasma cytokine markers of inflammation in patients with acute lung injury. Critical care medicine, 33(1), 1–6; discussion 230-2. doi:10.1097/01.ccm.0000149854.61192.dc
Pearson, K. (1901). LIII. On lines and planes of closest fit to systems of points in space. The London, Edinburgh, and Dublin Philosophical Magazine and Journal of Science, 2(11), 559–572. doi:10.1080/14786440109462720
Peterson, J. C., Adler, S., Burkart, J. M., Greene, T., Hebert, L. A., Hunsicker, L. G., et al. (1995). Blood pressure control, proteinuria, and the progression of renal disease. The Modification of Diet in Renal Disease Study. Annals of internal medicine, 123(10), 754–62. doi:10.7326/0003-4819-123-10-199511150-00003
Phisitkul, S., Khanna, A., Simoni, J., Broglio, K., Sheather, S., Rajab, M. H., & Wesson, D. E. (2010). Amelioration of metabolic acidosis in patients with low GFR reduced kidney endothelin production and kidney injury, and better preserved GFR. Kidney international, 77(7), 617–23. doi:10.1038/ki.2009.519
Platt, R., Roscoe, M. H., & Smith, F. W. (1952). Experimental renal failure. Clinical science, 11(3), 217–31. http://www.ncbi.nlm.nih.gov/pubmed/12979205
Platt, R. (1952). Structural and Functional Adaptation in Renal Failure. BMJ, 1(4772), 1313–1320. doi:10.1136/bmj.1.4772.1313
Pordy, W. T., Lipkowitz, M. S., & Abramson, R. G. (1987). Evidence for the transport function of uricase, an oxidative enzyme. American Journal of Physiology. Renal Physiology, 253(4), F702–F711. doi:10.1152/ajprenal.1987.253.4.F702
Posada-Ayala, M., Zubiri, I., Martin-Lorenzo, M., Sanz-Maroto, A., Molero, D., Gonzalez-Calero, L., et al. (2014). Identification of a urine metabolomic signature in patients with advanced-stage chronic kidney disease. Kidney international, 85(1), 103–11. doi:10.1038/ki.2013.328
Quinlan, G. J., Lamb, N. J., Tilley, R., Evans, T. W., & Gutteridge, J. M. (1997). Plasma hypoxanthine levels in ARDS: implications for oxidative stress, morbidity, and mortality. American journal of respiratory and critical care medicine, 155(2), 479–84. doi:10.1164/ajrccm.155.2.9032182
NMR-BASED METABOLOMICS IN KIDNEY AND LUNG DISEASE
112
Rhee, E. P., Clish, C. B., Ghorbani, A., Larson, M. G., Elmariah, S., McCabe, E., et al. (2013). A combined epidemiologic and metabolomic approach improves CKD prediction. Journal of the American Society of Nephrology : JASN, 24(8), 1330–8. doi:10.1681/ASN.2012101006
Rhee, E. P., Souza, A., Farrell, L., Pollak, M. R., Lewis, G. D., Steele, D. J. R., et al. (2010). Metabolite profiling identifies markers of uremia. Journal of the American Society of Nephrology : JASN, 21(6), 1041–1051. doi:10.1681/ASN.2009111132
Rogers, A. J., Contrepois, K., Wu, M., Zheng, M., Peltz, G., Ware, L. B., & Matthay, M. A. (2017). Profiling of ARDS pulmonary edema fluid identifies a metabolically distinct subset. American journal of physiology. Lung cellular and molecular physiology, 312(5), L703–L709. doi:10.1152/ajplung.00438.2016
Rong, L. Q., Di Franco, A., & Gaudino, M. (2016). Acute respiratory distress syndrome after cardiac surgery. Journal of thoracic disease, 8(10), E1177–E1186. doi:10.21037/jtd.2016.10.74
Rosenberg, M. (2019). Overview of the management of chronic kidney disease in adults. UpToDate. https://www.uptodate.com/contents/overview-of-the-management-of-chronic-kidney-disease-in-adults. Accessed 17 January 2020
Rothman, K. J. (1976). Causes. American journal of epidemiology, 104(6), 587–92. doi:10.1093/oxfordjournals.aje.a112335
Rubenfeld, G. D., Caldwell, E., Peabody, E., Weaver, J., Martin, D. P., Neff, M., et al. (2005). Incidence and outcomes of acute lung injury. The New England journal of medicine, 353(16), 1685–93. doi:10.1056/NEJMoa050333
Ruggenenti, P., Abbate, M., Ruggiero, B., Rota, S., Trillini, M., Aparicio, C., et al. (2017). Renal and Systemic Effects of Calorie Restriction in Patients With Type 2 Diabetes With Abdominal Obesity: A Randomized Controlled Trial. Diabetes, 66(1), 75–86. doi:10.2337/db16-0607
Salminen, A., Kauppinen, A., & Kaarniranta, K. (2015). 2-Oxoglutarate-dependent dioxygenases are sensors of energy metabolism, oxygen availability, and iron homeostasis: potential role in the regulation of aging process. Cellular and molecular life sciences : CMLS, 72(20), 3897–914. doi:10.1007/s00018-015-1978-z
Sanders, L. J. (2002). From Thebes to Toronto and the 21st Century: An Incredible Journey. Diabetes Spectrum, 15(1), 56–60. doi:10.2337/diaspect.15.1.56
Savorani, F., Tomasi, G., & Engelsen, S. B. (2010). icoshift: A versatile tool for the rapid alignment of 1D NMR spectra. Journal of magnetic resonance (San Diego, Calif. : 1997), 202(2), 190–202. doi:10.1016/j.jmr.2009.11.012
Scalbert, A., Brennan, L., Fiehn, O., Hankemeier, T., Kristal, B. S., van Ommen, B., et al. (2009). Mass-spectrometry-based metabolomics: limitations and recommendations for future progress with particular focus on nutrition research. Metabolomics, 5(4), 435–458. doi:10.1007/s11306-009-0168-0
LITERATURE LIST
113
Schanstra, J. P., Zürbig, P., Alkhalaf, A., Argiles, A., Bakker, S. J. L., Beige, J., et al. (2015). Diagnosis and Prediction of CKD Progression by Assessment of Urinary Peptides. Journal of the American Society of Nephrology : JASN, 26(8), 1999–2010. doi:10.1681/ASN.2014050423
Schubert, J. K., Müller, W. P., Benzing, A., & Geiger, K. (1998). Application of a new method for analysis of exhaled gas in critically ill patients. Intensive care medicine, 24(5), 415–21. doi:10.1007/s001340050589
Shemesh, O., Golbetz, H., Kriss, J. P., & Myers, B. D. (1985). Limitations of creatinine as a filtration marker in glomerulopathic patients. Kidney international, 28(5), 830–8. doi:10.1038/ki.1985.205
Shi, S., Gao, Y., Wang, L., Liu, J., Yuan, Z., & Yu, M. (2015). Elevated free fatty acid level is a risk factor for early postoperative hypoxemia after on-pump coronary artery bypass grafting: association with endothelial activation. Journal of cardiothoracic surgery, 10(1), 122. doi:10.1186/s13019-015-0323-9
Shimamura, T., & Morrison, A. B. (1975). A progressive glomerulosclerosis occurring in partial five-sixths nephrectomized rats. The American journal of pathology, 79(1), 95–106. http://www.ncbi.nlm.nih.gov/pubmed/164779
Shlipak, M. G., Sarnak, M. J., Katz, R., Fried, L. F., Seliger, S. L., Newman, A. B., et al. (2005). Cystatin C and the risk of death and cardiovascular events among elderly persons. The New England journal of medicine, 352(20), 2049–60. doi:10.1056/NEJMoa043161
Simpson, D. P. (1971). Control of hydrogen ion homeostasis and renal acidosis. Medicine, 50(6), 503–41. http://www.ncbi.nlm.nih.gov/pubmed/4942419
Sirich, T. L., Funk, B. A., Plummer, N. S., Hostetter, T. H., & Meyer, T. W. (2014). Prominent accumulation in hemodialysis patients of solutes normally cleared by tubular secretion. Journal of the American Society of Nephrology : JASN, 25(3), 615–22. doi:10.1681/ASN.2013060597
Siu, Y.-P., Leung, K.-T., Tong, M. K.-H., & Kwan, T.-H. (2006). Use of allopurinol in slowing the progression of renal disease through its ability to lower serum uric acid level. American journal of kidney diseases, 47(1), 51–9. doi:10.1053/j.ajkd.2005.10.006
Stamp, L. K., Turner, R., Khalilova, I. S., Zhang, M., Drake, J., Forbes, L. V., & Kettle, A. J. (2014). Myeloperoxidase and oxidation of uric acid in gout: implications for the clinical consequences of hyperuricaemia. Rheumatology (Oxford, England), 53(11), 1958–65. doi:10.1093/rheumatology/keu218
Stengel, B. (2010). Chronic kidney disease and cancer: a troubling connection. Journal of nephrology, 23(3), 253–62. http://www.ncbi.nlm.nih.gov/pubmed/20349418
NMR-BASED METABOLOMICS IN KIDNEY AND LUNG DISEASE
114
Stevens, L. A., Greene, T., & Levey, A. S. (2006). Surrogate end points for clinical trials of kidney disease progression. Clinical journal of the American Society of Nephrology : CJASN, 1(4), 874–84. doi:10.2215/CJN.00600206
Stringer, K. A., Serkova, N. J., Karnovsky, A., Guire, K., Paine, R., & Standiford, T. J. (2011). Metabolic consequences of sepsis-induced acute lung injury revealed by plasma 1H-nuclear magnetic resonance quantitative metabolomics and computational analysis. American journal of physiology. Lung cellular and molecular physiology, 300(1), L4–L11. doi:10.1152/ajplung.00231.2010
Suchy-Dicey, A. M., Laha, T., Hoofnagle, A., Newitt, R., Sirich, T. L., Meyer, T. W., et al. (2016). Tubular Secretion in CKD. Journal of the American Society of Nephrology : JASN, 27(7), 2148–55. doi:10.1681/ASN.2014121193
Sumner, L. W., Amberg, A., Barrett, D., Beale, M. H., Beger, R., Daykin, C. A., et al. (2007). Proposed minimum reporting standards for chemical analysis. Chemical Analysis Working Group (CAWG) Metabolomics Standards Initiative (MSI). Metabolomics, 3(3), 211–221. doi:10.1007/s11306-007-0082-2
Svingen, G. F. T., Ueland, P. M., Pedersen, E. K. R., Schartum-Hansen, H., Seifert, R., Ebbing, M., et al. (2013). Plasma dimethylglycine and risk of incident acute myocardial infarction in patients with stable angina pectoris. Arteriosclerosis, thrombosis, and vascular biology, 33(8), 2041–8. doi:10.1161/ATVBAHA.113.301714
Takis, P. G., Schäfer, H., Spraul, M., & Luchinat, C. (2017). Deconvoluting interrelationships between concentrations and chemical shifts in urine provides a powerful analysis tool. Nature communications, 8(1), 1662. doi:10.1038/s41467-017-01587-0
Tredwell, G. D., Bundy, J. G., De Iorio, M., & Ebbels, T. M. D. (2016). Modelling the acid/base 1H NMR chemical shift limits of metabolites in human urine. Metabolomics, 12(10), 152. doi:10.1007/s11306-016-1101-y
Trygg, J., Holmes, E., & Lundstedt, T. (2007). Chemometrics in metabonomics. Journal of proteome research, 6(2), 469–79. doi:10.1021/pr060594q
Uchida, T., Ohno, N., Asahara, M., Yamada, Y., Yamaguchi, O., Tomita, M., & Makita, K. (2013). Soluble isoform of the receptor for advanced glycation end products as a biomarker for postoperative respiratory failure after cardiac surgery. PloS one, 8(7), e70200. doi:10.1371/journal.pone.0070200
Uchida, T., Shirasawa, M., Ware, L. B., Kojima, K., Hata, Y., Makita, K., et al. (2006). Receptor for advanced glycation end-products is a marker of type I cell injury in acute lung injury. American journal of respiratory and critical care medicine, 173(9), 1008–15. doi:10.1164/rccm.200509-1477OC
LITERATURE LIST
115
Unwin, R. J., Capasso, G., & Shirley, D. G. (2004). An overview of divalent cation and citrate handling by the kidney. Nephron. Physiology, 98(2), p15-20. doi:10.1159/000080259
van den Berg, R. A., Hoefsloot, H. C. J., Westerhuis, J. A., Smilde, A. K., & van der Werf, M. J. (2006). Centering, scaling, and transformations: improving the biological information content of metabolomics data. BMC genomics, 7, 142. doi:10.1186/1471-2164-7-142
Varma, P. P. (2015). Prevalence of chronic kidney disease in India - Where are we heading? Indian journal of nephrology, 25(3), 133–5. http://www.ncbi.nlm.nih.gov/pubmed/26060360
Velenosi, T. J., Hennop, A., Feere, D. A., Tieu, A., Kucey, A. S., Kyriacou, P., et al. (2016). Untargeted plasma and tissue metabolomics in rats with chronic kidney disease given AST-120. Scientific reports, 6(1), 22526. doi:10.1038/srep22526
Villar, J., Pérez-Méndez, L., Espinosa, E., Flores, C., Blanco, J., Muriel, A., et al. (2009). Serum lipopolysaccharide binding protein levels predict severity of lung injury and mortality in patients with severe sepsis. PloS one, 4(8), e6818. doi:10.1371/journal.pone.0006818
Wallimann, T., Wyss, M., Brdiczka, D., Nicolay, K., & Eppenberger, H. M. (1992). Intracellular compartmentation, structure and function of creatine kinase isoenzymes in tissues with high and fluctuating energy demands: the “phosphocreatine circuit” for cellular energy homeostasis. The Biochemical journal, 281(1), 21–40. doi:10.1042/bj2810021
Ware, L. B., & Matthay, M. A. (2000). The acute respiratory distress syndrome. The New England journal of medicine, 342(18), 1334–49. doi:10.1056/NEJM200005043421806
Weiss, R. H., & Kim, K. (2011). Metabolomics in the study of kidney diseases. Nature reviews. Nephrology, 8(1), 22–33. doi:10.1038/nrneph.2011.152
Wesson, D. E., Pruszynski, J., Cai, W., & Simoni, J. (2017). Acid retention with reduced glomerular filtration rate increases urine biomarkers of kidney and bone injury. Kidney international, 91(4), 914–927. doi:10.1016/j.kint.2016.10.023
Wesson, D. E., & Simoni, J. (2009). Increased tissue acid mediates a progressive decline in the glomerular filtration rate of animals with reduced nephron mass. Kidney international, 75(9), 929–35. doi:10.1038/ki.2009.6
Wesson, D. E., Simoni, J., Broglio, K., & Sheather, S. (2011). Acid retention accompanies reduced GFR in humans and increases plasma levels of endothelin and aldosterone. American journal of physiology. Renal physiology, 300(4), F830-7. doi:10.1152/ajprenal.00587.2010
NMR-BASED METABOLOMICS IN KIDNEY AND LUNG DISEASE
116
Wider, G., & Dreier, L. (2006). Measuring protein concentrations by NMR spectroscopy. Journal of the American Chemical Society, 128(8), 2571–6. doi:10.1021/ja055336t
Wikoff, W. R., Nagle, M. A., Kouznetsova, V. L., Tsigelny, I. F., & Nigam, S. K. (2011). Untargeted metabolomics identifies enterobiome metabolites and putative uremic toxins as substrates of organic anion transporter 1 (Oat1). Journal of proteome research, 10(6), 2842–51. doi:10.1021/pr200093w
Williams, R. J., & Berry, H. K. (1951). Individual metabolic patterns and human disease: an exploratory study utilizing predominantly paper chromatographic methods. Austin: Univ. Texas. https://repositories.lib.utexas.edu/handle/2152/7023
Wilson, J. M. G., & Jungner, G. (1968). Principles and practice of screening for disease. (F. A. O. of the UN, Ed.). Geneva, Switzerland: World Health Organization.
Winning, H., Roldán-Marín, E., Dragsted, L. O., Viereck, N., Poulsen, M., Sánchez-Moreno, C., et al. (2009). An exploratory NMR nutri-metabonomic investigation reveals dimethyl sulfone as a dietary biomarker for onion intake. The Analyst, 134(11), 2344–51. doi:10.1039/b918259d
Wishart, D. S., Feunang, Y. D., Marcu, A., Guo, A. C., Liang, K., Vázquez-Fresno, R., et al. (2018). HMDB 4.0: the human metabolome database for 2018. Nucleic Acids Research, 46(D1), D608–D617. doi:10.1093/nar/gkx1089
Wold, S. (1995). Chemometrics; what do we mean with it, and what do we want from it? Chemometrics and Intelligent Laboratory Systems, 30(1), 109–115. doi:10.1016/0169-7439(95)00042-9
Wong, J., Piceno, Y. M., DeSantis, T. Z., Pahl, M., Andersen, G. L., & Vaziri, N. D. (2014). Expansion of urease- and uricase-containing, indole- and p-cresol-forming and contraction of short-chain fatty acid-producing intestinal microbiota in ESRD. American journal of nephrology, 39(3), 230–237. doi:10.1159/000360010
Wouters, O. J., O’Donoghue, D. J., Ritchie, J., Kanavos, P. G., & Narva, A. S. (2015). Early chronic kidney disease: diagnosis, management and models of care. Nature reviews. Nephrology, 11(8), 491–502. doi:10.1038/nrneph.2015.85
Wutrich, Y., Barraud, D., Conrad, M., Cravoisy-Popovic, A., Nace, L., Bollaert, P.-E., et al. (2010). Early increase in arterial lactate concentration under epinephrine infusion is associated with a better prognosis during shock. Shock (Augusta, Ga.), 34(1), 4–9. doi:10.1097/SHK.0b013e3181ce2d23
Wynter-Blyth, V., & Moorthy, K. (2017). Prehabilitation: preparing patients for surgery. BMJ, 358, j3702. doi:10.1136/bmj.j3702
Xia, J., & Wishart, D. S. (2011). Web-based inference of biological patterns, functions and pathways from metabolomic data using MetaboAnalyst. Nature protocols, 6(6), 743–60. doi:10.1038/nprot.2011.319
LITERATURE LIST
117
Xie, Y., Bowe, B., Mokdad, A. H., Xian, H., Yan, Y., Li, T., et al. (2018). Analysis of the Global Burden of Disease study highlights the global, regional, and national trends of chronic kidney disease epidemiology from 1990 to 2016. Kidney international, 94(3), 567–581. doi:10.1016/j.kint.2018.04.011
Yu, B., Zheng, Y., Nettleton, J. A., Alexander, D., Coresh, J., & Boerwinkle, E. (2014). Serum metabolomic profiling and incident CKD among African Americans. Clinical journal of the American Society of Nephrology : CJASN, 9(8), 1410–7. doi:10.2215/CJN.11971113
Zacharias, N. M., Chan, H. R., Sailasuta, N., Ross, B. D., & Bhattacharya, P. (2012). Real-time molecular imaging of tricarboxylic acid cycle metabolism in vivo by hyperpolarized 1-(13)C diethyl succinate. Journal of the American Chemical Society, 134(2), 934–43. doi:10.1021/ja2040865
Zhang, A. Q., Mitchell, S. C., & Smith, R. L. (1999). Dietary precursors of trimethylamine in man: a pilot study. Food and chemical toxicology, 37(5), 515–20. doi:10.1016/s0278-6915(99)00028-9
Zhang, L. S., & Davies, S. S. (2016). Microbial metabolism of dietary components to bioactive metabolites: opportunities for new therapeutic interventions. Genome medicine, 8(1), 46. doi:10.1186/s13073-016-0296-x
Zhao, L., Gao, H., Lian, F., Liu, X., Zhao, Y., & Lin, D. (2011). 1 H-NMR-based metabonomic analysis of metabolic profiling in diabetic nephropathy rats induced by streptozotocin. American Journal of Physiology. Renal Physiology, 300(4), F947–F956. doi:10.1152/ajprenal.00551.2010
Zhao, Y.-Y. (2013). Metabolomics in chronic kidney disease. Clinica chimica acta; international journal of clinical chemistry, 422, 59–69. doi:10.1016/j.cca.2013.03.033
Zhao, Y.-Y., Cheng, X.-L., Wei, F., Bai, X., Tan, X.-J., Lin, R.-C., & Mei, Q. (2013). Intrarenal metabolomic investigation of chronic kidney disease and its TGF-β1 mechanism in induced-adenine rats using UPLC Q-TOF/HSMS/MS(E). Journal of proteome research, 12(2), 692–703. doi:10.1021/pr3007792
Zhong, F., Liu, X., Zhou, Q., Hao, X., Lu, Y., Guo, S., et al. (2012). 1H NMR spectroscopy analysis of metabolites in the kidneys provides new insight into pathophysiological mechanisms: applications for treatment with Cordyceps sinensis. Nephrology Dialysis Transplantation, 27(2), 556–65. doi:10.1093/ndt/gfr368