Aalborg Universitet Validation of Mobility Simulations via Measurement Drive Tests in an Operational Network Gimenez, Lucas Chavarria; Barbera, Simone; Polignano, Michele; Pedersen, Klaus I.; Elling, Jan; Sørensen, Mads Published in: IEEE 81st Vehicular Technology Conference (VTC Spring), 2015 DOI (link to publication from Publisher): 10.1109/VTCSpring.2015.7146156 Publication date: 2015 Document Version Accepted author manuscript, peer reviewed version Link to publication from Aalborg University Citation for published version (APA): Gimenez, L. C., Barbera, S., Polignano, M., Pedersen, K. I., Elling, J., & Sørensen, M. (2015). Validation of Mobility Simulations via Measurement Drive Tests in an Operational Network. In IEEE 81st Vehicular Technology Conference (VTC Spring), 2015 (pp. 1-5). IEEE Press. I E E E V T S Vehicular Technology Conference. Proceedings Vol. 81 https://doi.org/10.1109/VTCSpring.2015.7146156 General rights Copyright and moral rights for the publications made accessible in the public portal are retained by the authors and/or other copyright owners and it is a condition of accessing publications that users recognise and abide by the legal requirements associated with these rights. ? Users may download and print one copy of any publication from the public portal for the purpose of private study or research. ? You may not further distribute the material or use it for any profit-making activity or commercial gain ? You may freely distribute the URL identifying the publication in the public portal ? Take down policy If you believe that this document breaches copyright please contact us at [email protected] providing details, and we will remove access to the work immediately and investigate your claim.
Transcript
Aalborg Universitet
Validation of Mobility Simulations via Measurement Drive Tests in an OperationalNetwork
DOI (link to publication from Publisher):10.1109/VTCSpring.2015.7146156
Publication date:2015
Document VersionAccepted author manuscript, peer reviewed version
Link to publication from Aalborg University
Citation for published version (APA):Gimenez, L. C., Barbera, S., Polignano, M., Pedersen, K. I., Elling, J., & Sørensen, M. (2015). Validation ofMobility Simulations via Measurement Drive Tests in an Operational Network. In IEEE 81st VehicularTechnology Conference (VTC Spring), 2015 (pp. 1-5). IEEE Press. I E E E V T S Vehicular TechnologyConference. Proceedings Vol. 81 https://doi.org/10.1109/VTCSpring.2015.7146156
General rightsCopyright and moral rights for the publications made accessible in the public portal are retained by the authors and/or other copyright ownersand it is a condition of accessing publications that users recognise and abide by the legal requirements associated with these rights.
? Users may download and print one copy of any publication from the public portal for the purpose of private study or research. ? You may not further distribute the material or use it for any profit-making activity or commercial gain ? You may freely distribute the URL identifying the publication in the public portal ?
Take down policyIf you believe that this document breaches copyright please contact us at [email protected] providing details, and we will remove access tothe work immediately and investigate your claim.
Abstract—Simulations play a key role in validating new concepts in cellular networks, since most of the features proposed and introduced into the standards are typically studied by means of simulations. In order to increase the trustworthiness of the simulation results, proper models and settings must be provided as inputs to the simulators. It is therefore crucial to perform a thorough validation of the models used for generating results. The objective of this paper is to compare measured and simulated mobility performance results with the purpose of understanding whether simulation models are close to reality. The presented study is based on drive tests measurements and explicit simulations of an operator network in the city of Aalborg (Denmark) – modelling a real 3D environment and using a commonly accepted dynamic system level simulation methodology. In short, the presented results show that the simulated handover rate, location of handovers, radio link failures, and signal/interference level statistics match well with measurements, giving confidence that the simulations produce realistic performance results.
Keywords—Simulations, Measurements, Drive Tests, Real Scenario, Mobility.
I. INTRODUCTION
Mobility performance and related enhancements are important topics for mobile wireless systems. In research, mobility improvements are typically first assessed by simple analytical considerations, followed by more complex dynamic simulation campaigns, before implementing and testing in the field. As an example, mobility performance and handover parameters optimization have been extensively analyzed by means of simulations for different Radio Access Technologies (RATs) in different studies. Optimized soft and softer handovers parameters for a realistic 3G network have been studied in [1]. Handover performance simulations on a realistic 3G scenario have been conducted in [2]. Examples of theoretical studies of 4G intra-frequency handover performance appears in [3], while [4] presents an algorithm to self-optimize handover parameters in a realistic 4G network. Field measurements of various handover statistics are presented in [5], while a comparison between the measured data interruption time in 3G and 4G is reported in [6]. Needless to say, the mobility performance results and conclusions from theoretical and simulation-based studies depend heavily on the underlying modeling assumptions. However, to the best of our knowledge, there are no studies available that present a one-to-one comparison of mobility performance observed in the field versus mobility performance simulation results for the exact same area. Such a study is needed in order to verify how
accurate current simulation-based models reproduce mobility performance results, as simulation tools are a fundamental pillar in producing performance results for radio research and standardization purposes. The study is conducted for a 3G network, given the maturity and the widespread deployment of this technology. However the findings and working methodology can be extrapolated to other RATs, as the basic simulation methodology and underlying assumptions are to a large extend the same for 3G, 4G, and likely also the upcoming 5G. The experimental part of the study is based on drive tests in the city of Aalborg, Denmark, on the Telenor 3G network. The exact same network and drive tests are reproduced in a dynamic system level simulator by importing the site positions, 3D building map, and using state-of-the-art ray tracing techniques to model the radio propagation effects. Hence, as the simulations and experimental data are from the same exact area, we are able to make a true one-to-one comparison to validate how accurately our simulations reproduce real-life effects. As it will be shown in this study, a good match of performance results is observed, which essential confirms that the performance-determining modeling assumptions in the simulations are in coherence with reality, i.e. leading to trustworthy results.
The paper is organized as follows: In Section II the overall simulation methodology and modeling assumptions for the city of Aalborg are presented. Section III describes how the drive test measurements have been conducted, while Section IV presents the comparison between the simulation and measurements results. Section V presents further discussion to put the findings into perspective. Finally, Section VI summarizes the concluding remarks.
II. SIMULATIONS METHODOLOGY AND MODELING
A. Basic Methodology
The basic simulation methodology follows the approach used in many 3rd Generation Partnership Project (3GPP) dynamic system level simulations characterized by multiple users generating dynamic traffic and moving according to fixed or randomly selected trajectories. For each time-step, the post detection Signal-to-Interference-Noise-Ratio (SINR) for each user is calculated, followed by a mapping to experienced throughput. The SINR to throughput mapping is according to the 3G High-Speed Packet Access (HSPA) performance, and includes the combined effect of scheduling, link adaptation, and hybrid automatic repeat request – also known as abstract physical layer to system level mapping. The downlink SINR is calculated from the base station transmitted powers and the
radio propagation characteristics of all links. Additional details on the former and interference modeling are described in [7]-[11]. The utilized system level simulator has been used in numerous 3GPP simulation studies, and its performance results have been benchmarked against related results from other tools of other companies – both for 3G and 4G simulations. As an example of the former, see the 4G HetNet mobility performance results in [11]. Additional details on the applied modeling assumptions in the current study are outlined in the following subsections.
B. Aalborg Site-Specific Scenario
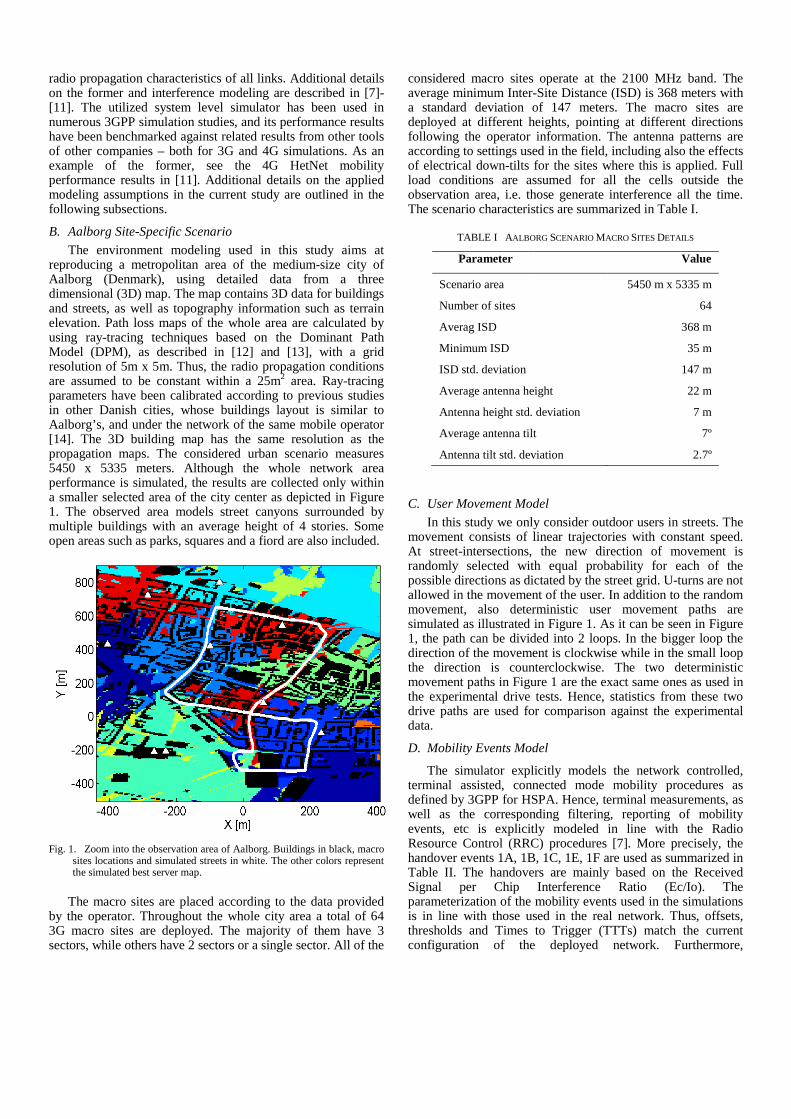
The environment modeling used in this study aims at reproducing a metropolitan area of the medium-size city of Aalborg (Denmark), using detailed data from a three dimensional (3D) map. The map contains 3D data for buildings and streets, as well as topography information such as terrain elevation. Path loss maps of the whole area are calculated by using ray-tracing techniques based on the Dominant Path Model (DPM), as described in [12] and [13], with a grid resolution of 5m x 5m. Thus, the radio propagation conditions are assumed to be constant within a 25m2 area. Ray-tracing parameters have been calibrated according to previous studies in other Danish cities, whose buildings layout is similar to Aalborg’s, and under the network of the same mobile operator [14]. The 3D building map has the same resolution as the propagation maps. The considered urban scenario measures 5450 x 5335 meters. Although the whole network area performance is simulated, the results are collected only within a smaller selected area of the city center as depicted in Figure 1. The observed area models street canyons surrounded by multiple buildings with an average height of 4 stories. Some open areas such as parks, squares and a fiord are also included.
Fig. 1. Zoom into the observation area of Aalborg. Buildings in black, macro
sites locations and simulated streets in white. The other colors represent the simulated best server map.
The macro sites are placed according to the data provided by the operator. Throughout the whole city area a total of 64 3G macro sites are deployed. The majority of them have 3 sectors, while others have 2 sectors or a single sector. All of the
considered macro sites operate at the 2100 MHz band. The average minimum Inter-Site Distance (ISD) is 368 meters with a standard deviation of 147 meters. The macro sites are deployed at different heights, pointing at different directions following the operator information. The antenna patterns are according to settings used in the field, including also the effects of electrical down-tilts for the sites where this is applied. Full load conditions are assumed for all the cells outside the observation area, i.e. those generate interference all the time. The scenario characteristics are summarized in Table I.
TABLE I AALBORG SCENARIO MACRO SITES DETAILS
Parameter Value
Scenario area 5450 m x 5335 m
Number of sites 64
Averag ISD 368 m
Minimum ISD 35 m
ISD std. deviation 147 m
Average antenna height 22 m
Antenna height std. deviation 7 m
Average antenna tilt 7º
Antenna tilt std. deviation 2.7º
C. User Movement Model
In this study we only consider outdoor users in streets. The movement consists of linear trajectories with constant speed. At street-intersections, the new direction of movement is randomly selected with equal probability for each of the possible directions as dictated by the street grid. U-turns are not allowed in the movement of the user. In addition to the random movement, also deterministic user movement paths are simulated as illustrated in Figure 1. As it can be seen in Figure 1, the path can be divided into 2 loops. In the bigger loop the direction of the movement is clockwise while in the small loop the direction is counterclockwise. The two deterministic movement paths in Figure 1 are the exact same ones as used in the experimental drive tests. Hence, statistics from these two drive paths are used for comparison against the experimental data.
D. Mobility Events Model
The simulator explicitly models the network controlled, terminal assisted, connected mode mobility procedures as defined by 3GPP for HSPA. Hence, terminal measurements, as well as the corresponding filtering, reporting of mobility events, etc is explicitly modeled in line with the Radio Resource Control (RRC) procedures [7]. More precisely, the handover events 1A, 1B, 1C, 1E, 1F are used as summarized in Table II. The handovers are mainly based on the Received Signal per Chip Interference Ratio (Ec/Io). The parameterization of the mobility events used in the simulations is in line with those used in the real network. Thus, offsets, thresholds and Times to Trigger (TTTs) match the current configuration of the deployed network. Furthermore,
declaration of Radio Link Failures (RLFs) in the simulator also follows the 3GPP specifications. In short, RLF is declared if the terminal experienced SINR is too low for certain time-period, see more details in [8]-[11].
TABLE II M OBILITY SETTINGS
Event 1A A Primary CPICH enters the reporting range
Reporting Range Constant 4 dB Hysteresis 0 dB TTT 500 ms
Event 1B A Primary CPICH leaves the reporting range
Reporting Range Constant 6 dB Hysteresis 0 dB TTT 640 ms
Event 1C A non-active primary CPICH becomes better than an active primary CPICH
Offset 2 dB TTT 100 ms
Event 1E A Primary CPICH becomes better than an absolute threshold
Threshold -105 dB TTT 200 ms
Event 1F A Primary CPICH becomes worse than an absolute threshold
Threshold -105 dB TTT 200 ms
III. DRIVE TEST MEASUREMENTS
Terminal drive test measurement campaigns are conducted along the routes pictured in Figure 1. The drive tests are repeated several times without stopping, starting and ending at the same position of the route. In order to emulate the traffic settings from simulations, measurements are taken during normal office working hours, walking or by car. The average speed is 6kmph and 20kmph respectively. Although it is intended to maintain a constant speed during each drive test, traffic conditions, pedestrians and traffic lights do not always allow travelling at the desired speed. Factors such as changes of the speed or different waiting times in traffic lights have an impact on the results. The measured mobility statistics from two drive test on the same path are therefore subject to some variations. These variations are especially evident during the campaign by car, therefore suggesting conducting more than one single campaign and then averaging the results. Hence, a total number of four on-site tests are conducted for each of the two measurement routes depicted in Figure 1: One by walking and 3 by car. The used User Equipment (UE) is a commercial mobile phone Evolved High-Speed Packet Access (HSPA)+ 850MHz/900MHz/2100MHz and Long Term Evolution (LTE) 800MHz/1800MHz/2600MHz capable – Model Samsung Galaxy III. The phone is forced to operate with HSPA+ at 2100MHz. The Wi-Fi is disabled during the measurements. The phone is equipped with proprietary software that enables extraction of information from the modem such as e.g. RRC message data. The phone is programmed to periodically download a 100 MB file, which contains random generated data from a FTP server. When the download finishes, the UE waits 2 seconds to initiate a new download session. The UE location is recorded by the Global Positioning System (GPS)
device of the phone. Assisted GPS information is not utilized. Different statistics are extracted by post-processing the measurement files with the software provided by the developer of the measurement software. Serving cell IDs, active set tables, Received Signal Code Power (RSCP), Received Signal Strength Indicator (RSSI), Ec/Io, Layer 3 messages, locations and time stamps constitute the selected extracted data for these studies.
IV. PERFORMANCE RESULTS
Table III shows the average number of handovers per minute occurring in real measurements and in simulations. The main observation is that the number of measured handovers always is higher in the measurement drive tests as compared to statistics from the simulations. The three measurements by car show on average 1.37 handovers per minute, with a standard deviation of 0.24, while the statistics from the simulations show 1.06 handovers per minute.
TABLE III H ANDOVERS PER MINUTE IN REAL MEASUREMENTS AND SIMULATIONS
The differences in the number of handovers can be explained by multiple factors. First, the measurement campaigns are affected by localized variations in radio propagation conditions caused by e.g. movement of surrounding cars, buses, and trucks, which occasionally can cause additional handovers and are not explicitly reproduced in the simulator. Secondly, traffic conditions and traffic lights make it difficult to maintain a constant drive speed during the measurements. Moreover, despite mobility parameterization has been aligned with the deployed network, the UE measurements model of the simulator cannot exactly reproduce the same results. Additionally, few mobility events are missing from the simulations due to the map resolution of 5 x 5 meters. In order to get a better full understanding of the handover count statistics, Figure 2 illustrates where the handovers happen in simulations and in the drive tests. The solid circles in Figure 2 mark the areas where handovers take place in both the simulations and drive test, while the area marked with the dashed circle marks the location of handovers that are only observed in the drive test (i.e. not observed from the simulations). A closer inspection of the area marked with dashed circle in Figure 2 reveals that the reason for not being able to reproduce the same handover behavior in this area is primarily due to the limited 5x5 meters resolution of the used propagation data. If removing the data from the problematic area in Figure 2 (i.e. the area marked with the dashed circle), the average numbers of handovers observed from the simulations and drive tests match better, as drive tests at 6kmph and 20kmph then result in 0.6 and 1.29 handovers per minute on average.
Fig. 2. Handovers location and zoom of an area where a building’s footprint crosses a street due to the 5x5m map resolution.
Figure 3 shows the location of RLFs. Here it is worth noticing that the UE typically recovers from the RLF (reestablishment) such that call dropping is seldom experienced. Out of 7 identified areas where RLF are detectedobserved from both simulations and measurementssimulations show an additional area where RLFsthis is again primarily due to the limited propagation map resolution used in the simulations. As a second effect, there is a tendency towards having the RLFs occur a bit later simulations as compared to the drive tests. However, for most RLF occurrences, the offset in the location of the RLFs from the simulations and drive tests are within the accuracy of the GPS location data.
Fig. 3. Radio Link Failures in simulations, identified by the black comparison with measurements.
In addition, it is worth high-lighting the effect of the socalled “corner effect” as also observed in other studies [15]short, the corner effect refers to the case where the UE is turning a corner, resulting in a decline of the received signal strength from the serving cell due to the change
Also in Real Measurements ONLY after turning the corner (corner effect)Resolution issues in the sims mapSlightly delayed compared to Real MeasurementsPerfect Match between Real Measurements and Simulations
area where a building’s footprint
location of RLFs. Here it is worth noticing that the UE typically recovers from the RLF (re-establishment) such that call dropping is seldom experienced.
where RLF are detected, 6 of them are surements. However,
RLFs happen, and the limited propagation map
As a second effect, there is a tendency towards having the RLFs occur a bit later in the simulations as compared to the drive tests. However, for most RLF occurrences, the offset in the location of the RLFs from the simulations and drive tests are within the accuracy of the
fied by the black dots, and
lighting the effect of the so-observed in other studies [15]. In
short, the corner effect refers to the case where the UE is the received signal
strength from the serving cell due to the change from Line of
Sight (LOS) conditions to non LOS (NLOS)signal strength from the target (interfering) cell has a tendency to increase, resulting in a decrease of the experienced SINR if timely handover is not made at the correct moment. it may also occur that when turningarea of a new base station that it previously did not discoverthe new base station is too close to the junction, the signal strength at the UE may be too interference perceived by the UE.processed fast enough or the interference levels make impossible to exchange handover messages, example of the “corner effect” the received power from the serving cell and the transmitted power by the UE are shown for directions in the same intersectionFigure 3). The time instants when the UE enters and leaves the junction are marked with a solid and dashed line respectively. The dash-dotted line marks the time instant when a handover towards a new cell is completed. from east to south in the intersection Danmarksgade Boulevarden, it can be seen howthe junction and performing the turn around the cornerRSCP from the serving cell dropmaintain the connection the UEthis effect by increasing the transmitted power in the uplink with the same amount. This situation continuesUE has left the intersection, power fluctuates around the same levels. seconds later, the HO towards RSCP and transmitted power levels go back to normality.this example, the handover is successfully performedHowever, in other measurementOn the other hand, Figure 4 depicts as well how, when turning from north to west (direction Boulevarden the same intersection, this effect is not present and the RSCP softly decays with the travelled disthe serving cell is identical in both directions.
Fig. 4. Corner effect example: RSCP vs
Sims and Meas
Only Meas
to non LOS (NLOS). Similarly, the signal strength from the target (interfering) cell has a tendency
decrease of the experienced SINR if timely handover is not made at the correct moment. In addition,
that when turning a corner, the UE enters an that it previously did not discover. If
w base station is too close to the junction, the signal high causing an increase in the
interference perceived by the UE. If the handover is not processed fast enough or the interference levels make
over messages, RLF occurs. An is illustrated in Figure 4, where
the received power from the serving cell and the transmitted for two turns following different
in the same intersection (indicated with an ‘x’ sign in The time instants when the UE enters and leaves the
junction are marked with a solid and dashed line respectively. dotted line marks the time instant when a handover
towards a new cell is completed. Analyzing the case of turning from east to south in the intersection Danmarksgade –
it can be seen how, some seconds after entering and performing the turn around the corner, the
RSCP from the serving cell drops down 20dB. In order to UE link power control combats
the transmitted power in the uplink situation continues even after the
UE has left the intersection, as both RSCP and transmitted s around the same levels. Afterwards, 14
HO towards a new cell is performed and the and transmitted power levels go back to normality. In
this example, the handover is successfully performed. in other measurements RLFs have been observed.
4 depicts as well how, when turning from north to west (direction Boulevarden – Danmarksgade) in the same intersection, this effect is not present and the RSCP softly decays with the travelled distance. During the turning,
s identical in both directions.
Corner effect example: RSCP vs. Transmitted Power.
Besides the “corner effect”, RLFs occur primarily due to either high interference or low coverage. Figure 5 shows the critical areas in terms of coverage or interference detected in simulations and in on-site measurements. Solid circles represent the areas where the signal strength from the serving cell is low whereas the dash circles mark the areas with high interference levels. Comparing these results with the ones illustrated in Figure 3, it can be seen how areas where RLFs occur match with the areas where either low signal strength or high interference is perceived by the UE. The areas pointed by both simulations and measurements are aligned. Hence, only a general overview of these locations is depicted in the figure.
Fig. 5. Areas with low signal strength or quality.
It is worth noticing that although the presented comparison of mobility simulation results and drive tests are for a 3G setting with HSPA+, the results are also useful for other RATs. The latter is the case because the basic simulation methodology used for 3G in this study is also applied for 4G and 5G investigations. As an example, modeling of propagation characteristics, interference footprint, UE movement and other features are RAT independent. This essentially means that the findings in this paper also give confidence for 4G/5G mobility simulations that are based on the same methodology. The former naturally assumes that the simulator is explicitly modeling the 4G/5G mobility procedures at the same level of details as assumed in this study for 3G.
V. CONCLUSIONS
In this paper we have presented a comparison of mobility statistics from advanced dynamic system level simulations of a realistic 3D modeled scenario and field measurement results from drive tests. The study is based on real data from the metropolitan city center area of Aalborg, Denmark. As a general conclusion, good alignment between the measurements and the simulations results are observed. The positions in which handovers and radio link failures take place match quite well. In fact, out of the 7 localized areas where RLFs are detected from the drive tests, the same RLF behavior is observed in 6 of those locations from the simulations. The main reason for having this modest mismatch is due to the limited propagation map resolution of 5x5 meters in the
simulations. All in all, the critical areas in terms of coverage or interference are rather consistent. It is also found that both simulations and measurements confirm the so-called “corner effect” that is particularly challenging for performing handovers at the exact right point. As future work, it is suggested to perform additional measurement vs. simulator comparisons for other scenarios and terrain types, using a finer resolution of the propagation maps.
REFERENCES [1] Schinnenburg, M.; Forkel, I.; Haverkamp, B., "Realization and
optimization of soft and softer handover in UMTS networks," Personal Mobile Communications Conference, 2003. 5th European (Conf. Publ. No. 492) , vol., no., pp.603,607, 22-25 April 2003.
[2] Forkel, I.; Schinnenburg, M.; Wouters, B., "Performance evaluation of soft handover in a realistic UMTS network," Vehicular Technology Conference, 2003. VTC 2003-Spring. The 57th IEEE Semiannual , vol.3, no., pp.1979,1983 vol.3, 22-25 April 2003.
[3] Legg, P.; Gao Hui; Johansson, J., "A Simulation Study of LTE Intra-Frequency Handover Performance," Vehicular Technology Conference Fall (VTC 2010-Fall), 2010 IEEE 72nd , vol., no., pp.1,5, 6-9 Sept. 2010.
[5] J. Lacki, J. Niemelä, J. Lempiäinen, “Optimization of Soft Handover Parameters for UMTS Network in Indoor Environment”, The 9th International Simposium on Wireless Personal Multimedia Communications (WPMC 2006), September 2006.
[6] Elnashar, A.; El-Saidny, M.A., "Looking at LTE in Practice: A Performance Analysis of the LTE System Based on Field Test Results," Vehicular Technology Magazine, IEEE , vol.8, no.3, pp.81,92, Sept. 2013.
[7] 3GPP Technical Specification (TS) 25.331 “Universal Mobile Telecommunications Systems (UMTS); Radio Resource Control (RRC); Protocol specification”, March 2014, Available at www.3gpp.org.
[8] Viering, I.; Dottling, M.; Lobinger, A., "A Mathematical Perspective of Self-Optimizing Wireless Networks," Communications, 2009. ICC '09. IEEE International Conference on , vol., no., pp.1,6, 14-18 June 2009.
[9] Fehske, A.J.; Viering, I.; Voigt, J.; Sartori, C.; Redana, S.; Fettweis, G.P., "Small-Cell Self-Organizing Wireless Networks," Proceedings of the IEEE , vol.102, no.3, pp.334,350, March 2014.
[11] Barbera, S.; Michaelsen, P.H.; Saily, M.; Pedersen, K., "Mobility performance of LTE co-channel deployment of macro and pico cells," Wireless Communications and Networking Conference (WCNC), 2012 IEEE , vol., no., pp.2863,2868, 1-4 April 2012.
[12] Wahl, R.; Wolfle, G., "Combined urban and indoor network planning using the dominant path propagation model," Antennas and Propagation, 2006. EuCAP 2006. First European Conference on , vol., no., pp.1,6, 6-10 Nov. 2006.
[13] R. Wahl, G. Woelfle, P. Wertz, P. Wildbolz., “Dominant Path Prediction Model for Urban Scenarios”, 14th IST Mobile and Wireless Communications Summit, Dresden (Germany), 2005.
[14] Rodriguez, I.; Nguyen, H.C.; Sørensen, T.B.; Elling, J.; Gentsch, M.B.; Sørensen, M.; Kuru, L.; Mogensen, P., "A Geometrical-Based Vertical Gain Correction for Signal Strength Prediction of Downtilted Base Station Antennas in Urban Areas," Vehicular Technology Conference (VTC Fall), 2012 IEEE , vol., no., pp.1,5, 3-6 Sept. 2012.
[15] “UMTS Handover Performance Optimization Guide”. R1.0. ZTE Corporation. 2014. Available in www.slideshare.net. Accessed August 2014.