+ All Categories
Home > Documents > Aaron van Donkelaar 1 , Randall Martin 1,2 , Ralph Kahn 3 and Robert Levy 3 AGU Fall Meeting

Aaron van Donkelaar 1 , Randall Martin 1,2 , Ralph Kahn 3 and Robert Levy 3 AGU Fall Meeting

Date post: 04-Feb-2016
Category:
Upload: hop
View: 41 times
Download: 0 times
Share this document with a friend
Description:
Global Climatology of Fine Particulate Matter Concentrations Estimated from Remote-Sensed Aerosol Optical Depth. Aaron van Donkelaar 1 , Randall Martin 1,2 , Ralph Kahn 3 and Robert Levy 3 AGU Fall Meeting December 13-18, 2009 1 Dalhousie University 2 Harvard-Smithsonian 3 NASA Goddard. - PowerPoint PPT Presentation
Popular Tags:
9
Global Climatology of Fine Particulate Matter Concentrations Estimated from Remote-Sensed Aerosol Optical Depth Aaron van Donkelaar 1 , Randall Martin 1,2 , Ralph Kahn 3 and Robert Levy 3 AGU Fall Meeting December 13-18, 2009 1 Dalhousie University 2 Harvard-Smithsonian 3 NASA Goddard
Transcript

Global Climatology of Fine Particulate Matter Concentrations Estimated from Remote-Sensed

Aerosol Optical Depth

Aaron van Donkelaar1, Randall Martin1,2, Ralph Kahn3 and Robert Levy3

AGU Fall MeetingDecember 13-18, 2009

1Dalhousie University 2Harvard-Smithsonian 3NASA Goddard

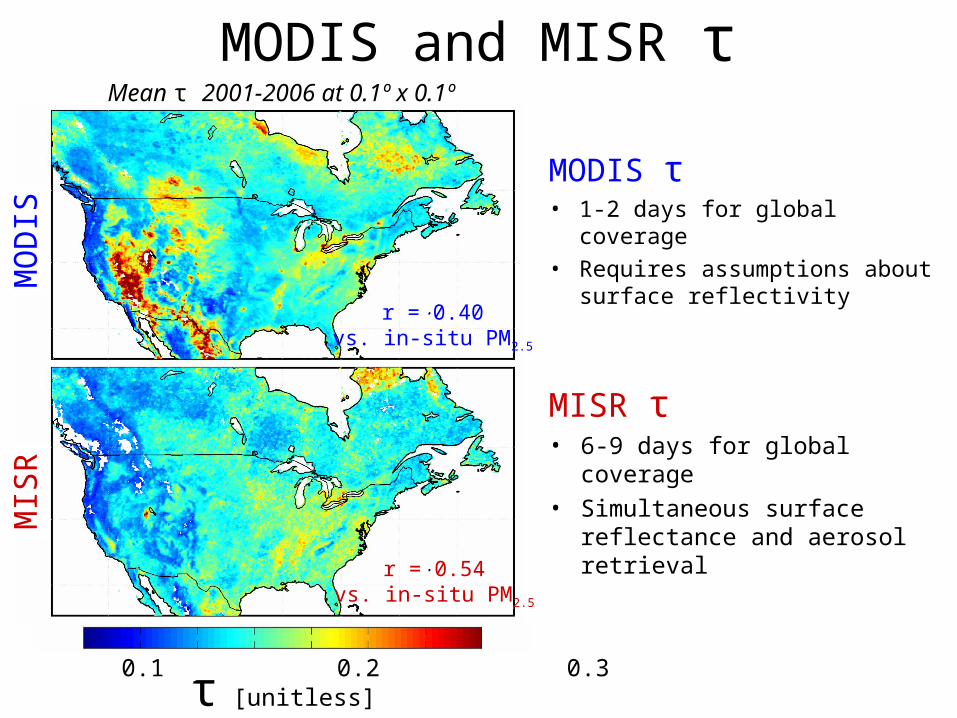
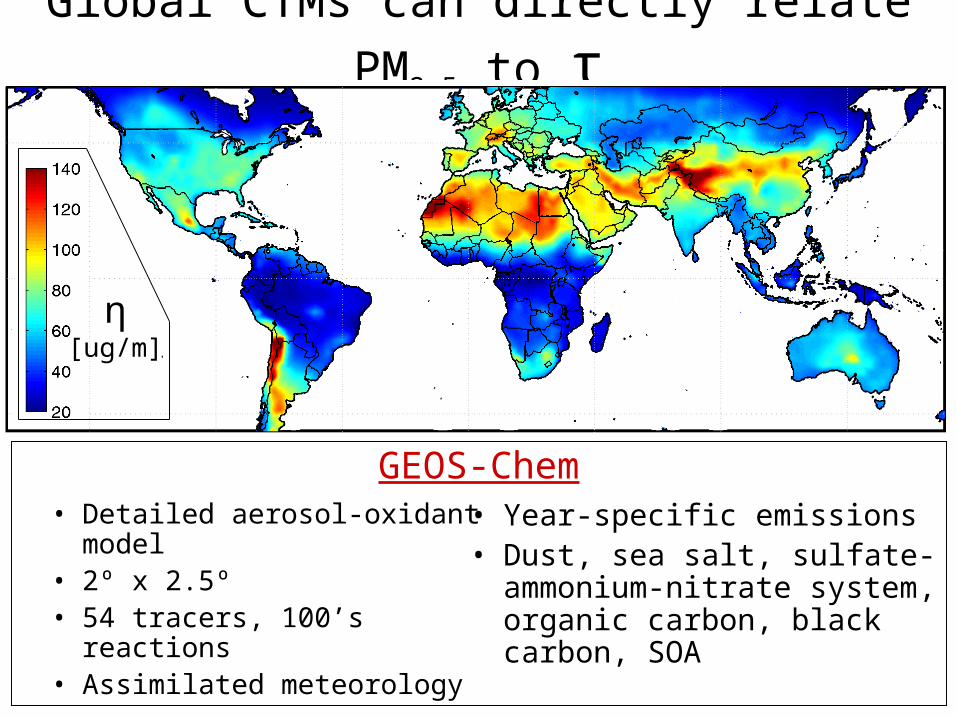
We relate satellite-based measurements of aerosol optical depth to PM2.5 using a global chemical transport model

Approach

Estimated PM2.5 = η· τ Combined MODIS/MISRAerosol Optical Depth

GEOS-Chem

Following Liu et al., 2004:

• vertical structure• aerosol type• meteorological effects• meteorology• diurnal effects

η

MODIS and MISR τ

MODIS τ• 1-2 days for global coverage• Requires assumptions about

surface reflectivity

MISR τ• 6-9 days for global coverage• Simultaneous surface

reflectance and aerosol retrieval

Mean τ 2001-2006 at 0.1º x 0.1º

0 0.1 0.2 0.3τ [unitless]

MIS

RM

OD

IS

r = 0.40vs. in-situ PM2.5

r = 0.54vs. in-situ PM2.5

Agreement varies with surface type

9 surface types, defined by monthly mean surface albedo ratios,evaluation against AERONET AOD

MODIS

MISR

Jul

y

Combining MODIS and MISR improves agreement

MODISr = 0.40

(vs. in-situ PM2.5)

MISRr = 0.54

(vs. in-situ PM2.5)

CombinedMODIS/MISR

r = 0.63 (vs. in-situ PM2.5)

0.3

0.25

0.2

0.15

0.1

0.05

0

τ [u

nitle

ss]

Global CTMs can directly relate PM2.5 to τ

• Detailed aerosol-oxidant model

• 2º x 2.5º• 54 tracers, 100’s reactions• Assimilated meteorology

• Year-specific emissions• Dust, sea salt, sulfate-

ammonium-nitrate system, organic carbon, black carbon, SOA

GEOS-Chem

η[ug/m]

Significant agreement with coincident ground measurements over NA

SatelliteDerived

In-situ

Sat

ellit

e-D

eriv

ed

[μg/

m3]

In-situ PM2.5 [μg/m3]

Ann

ual M

ean

PM

2.5 [

μg/

m3]

(200

1-20

06)

r

MODIS τ 0.40

MISR τ 0.54

Combined τ 0.63

Combined PM2.5 0.78

• Annual mean measurements– Outside Canada/US– 244 sites (84 non-EU)

• r = 0.83 (0.91)• slope = 0.86 (0.84)• bias = 1.15 (-2.52) μg/m3

Method is globally applicable

• Satellite-PM2.5 + population map → exposure

• 80% of world population exceeds WHO guideline of 10 μg/m3

• 49% of eastern Asia exceeds 35 μg/m3

WHO Guideline

PM2.5 Exposure [μg/m3]

Pop

ulat

ion

[%]

High global PM2.5 exposure

5 10 15 25 35 50 100

100

90

80

70

60

50

40

30

20

10

0

AQG IT-3 IT-2 IT-1


Recommended