Methods for Odor Evaluation of Textiles and other Materials Michael A. McGinley, P.E., St. Croix Sensory, Inc. Charles M. McGinley, P.E., St. Croix Sensory, Inc. Abstract Sensory evaluation practices with trained panels of human assessors have been used for decades to assess taste, odor, and texture of foods and beverages. Several presentation and measurement techniques are commonly used for assessment of odors. Olfactometry is utilized to quantify odor strength based on dilution to threshold, while direct sniff procedures allow for assessors to rate the whole odor intensity or conduct descriptive analysis techniques through rating multiple attributes (i.e. character descriptors). This presentation will outline current sensory evaluation techniques with real-world case study examples related to: 1) general odor quality of textiles or other materials such as adhesives, 2) performance testing for sweat odor control, 3) performance testing of odor removal by detergents or other household care products. Introduction Sensory testing is commonly conducted on products and materials for making critical business decisions. More recently, odor has been found to be a key marketable attribute of products and materials. Textiles and related materials are often evaluated for tactile properties, e.g. softness, smoothness. Additionally, product attributes such as characterization of the fabric odor and minimization of offensive body odors have specialized interest in product development, claim substantiation, and quality control. Sensory evaluation techniques involve the use of trained human assessors using standard methodologies to observe and rate odor parameters. 1 Odor threshold values (OTVs) provide a measure of odor strength based on dilution to threshold; odor intensity rates the odor based on overall perceived odor level; and odor characterization provides a profile description of the odors. One or more parameters define product odors and provide differentiation between products. This paper presents three case studies as examples of how sensory evaluation is utilized in the textile industry. The first case study describes complaints received regarding odors emitted from clothing wet after laundering. The clothing odors are quantified and the complaints are verified and fully defined. A second case study involves documenting performance of fabric treatments to minimize body odors linked to extended wear times. Quantification of body odors on the fabrics allows comparison of treatments. A third case study investigates the efficacy of reducing cigarette smoke on cotton swatches treated with fabric freshening home care products. Sensory Assessors Quantitative sensory testing methods described in this paper are conducted with assessors who are trained and experienced at the specific methods chosen. These assessors evaluate the samples objectively using defined scaling techniques and do not allow their opinion of the product samples or odors to bias their responses. Conversely, for market research or affective sensory testing (pleasantness and liking), consumers are used.
Transcript
Methods for Odor Evaluation of Textiles and other Materials
Michael A. McGinley, P.E., St. Croix Sensory, Inc. Charles M. McGinley, P.E., St. Croix Sensory, Inc.
Abstract Sensory evaluation practices with trained panels of human assessors have been used for decades to assess taste, odor, and texture of foods and beverages. Several presentation and measurement techniques are commonly used for assessment of odors. Olfactometry is utilized to quantify odor strength based on dilution to threshold, while direct sniff procedures allow for assessors to rate the whole odor intensity or conduct descriptive analysis techniques through rating multiple attributes (i.e. character descriptors). This presentation will outline current sensory evaluation techniques with real-world case study examples related to: 1) general odor quality of textiles or other materials such as adhesives, 2) performance testing for sweat odor control, 3) performance testing of odor removal by detergents or other household care products.
Introduction
Sensory testing is commonly conducted on products and materials for making critical business decisions. More recently, odor has been found to be a key marketable attribute of products and materials. Textiles and related materials are often evaluated for tactile properties, e.g. softness, smoothness. Additionally, product attributes such as characterization of the fabric odor and minimization of offensive body odors have specialized interest in product development, claim substantiation, and quality control. Sensory evaluation techniques involve the use of trained human assessors using standard methodologies to observe and rate odor parameters.1 Odor threshold values (OTVs) provide a measure of odor strength based on dilution to threshold; odor intensity rates the odor based on overall perceived odor level; and odor characterization provides a profile description of the odors. One or more parameters define product odors and provide differentiation between products. This paper presents three case studies as examples of how sensory evaluation is utilized in the textile industry. The first case study describes complaints received regarding odors emitted from clothing wet after laundering. The clothing odors are quantified and the complaints are verified and fully defined. A second case study involves documenting performance of fabric treatments to minimize body odors linked to extended wear times. Quantification of body odors on the fabrics allows comparison of treatments. A third case study investigates the efficacy of reducing cigarette smoke on cotton swatches treated with fabric freshening home care products.
Sensory Assessors Quantitative sensory testing methods described in this paper are conducted with assessors who are trained and experienced at the specific methods chosen. These assessors evaluate the samples objectively using defined scaling techniques and do not allow their opinion of the product samples or odors to bias their responses. Conversely, for market research or affective sensory testing (pleasantness and liking), consumers are used.
Odor assessors for quantitative sensory testing are initially recruited from the community at large and trained following guidelines presented in ASTM Special Technical Publication 758, Guidelines for Selection and Training of Sensory Panel Members.2 For example, each odor assessor is tested to determine their individual olfactory sensitivity using standard odorants, e.g. n-butanol. The assessors receive training that consists of olfactory awareness, sniffing techniques, standardized descriptor terminology, and olfactory response. With proper training of the odor assessors, the communication between the assessors and the test administrator is clear, concise and efficient. A well-organized, effectively conducted odor panel ensures quality odor evaluation work. The number of assessors utilized for test sessions, typically 10-20, varies depending on the project’s statistical needs. Assessors are not provided information about the odor samples being presented, including the sample type or sample properties. Standard odor test session rules are part of the assessor’s agreement to participate in odor testing, e.g. free of colds and allergies, no eating 30-minutes before test session, being fragrance free, etc. The assessors are not permitted to eat, chew gum or drink beverages other than water during a testing session. Additionally, assessors are provided informed consent information to provide clear understanding that they may stop participation during a test session for any reason without repercussions. Attention to the assessors’ comfort and working environment nurtures their commitment and dedication to quality performance. The waiting area of the assessors is nearby, but separated from the testing areas. A comfortable and relaxing waiting area enhances a low stress environment for the assessors. Figure 1 is an example waiting area with comfortable spaces, ventilation, lighting, etc. When planning testing protocol, it is important to consider assessor fatigue during evaluation. This is both sensory fatigue, where excessive numbers of samples can begin to affect the assessors’ ability to observe the odors, as well as mental fatigue, where the assessors become tired or mentally distracted. Limiting test session length and number of samples minimizes assessor fatigue.
Figure 1. Assessor waiting area at St. Croix Sensory.
Assessors have a comfortable space to wait and rest between sample evaluations. Testing laboratory spaces are located adjacent to the waiting area.
Odor Quantification There are three main odor parameters for quantifying odors of products and materials: odor threshold, odor intensity, and odor descriptor profiling. Each of these parameters provides different information about an odor. In some cases, one parameter is enough to define a problem or differentiate comparisons of samples; however, in most cases, more than one parameter is needed to tell the entire story. Odor Threshold Values Odor threshold values (OTVs) are also referred to as the odor concentration of a sample. The OTV is quantified as the amount of dilution needed to bring the odorous air sample to its threshold. The higher the value, the more dilution needed to bring the odor to threshold, thus the stronger the odor. Detection and recognition thresholds are determined by trained assessors observing presentations of the odorous air sample dynamically diluted with an olfactometer. The testing procedures follow ASTM E679, Standard Practice for Determination of Odor and Taste Thresholds by a Forced-Choice Ascending Concentration Series Method of Limits, and EN13725:2003, Air Quality – Determination of Odour Concentration by Dynamic Olfactometry.3,4 These testing standards utilize a presentation method called 3-Alternative Forced-Choice (3-AFC). Each assessor performs the odor evaluation task sniffing three presentations; one contains the diluted odor while the other two are blank, odor-free air. The assessor is required, or forced, to choose one of the three presentations and acknowledge their choice as a “guess”, “detection”, or “recognition”. The assessor is then presented the next dilution level. The assessor is again presented with the three sample choices, one of which is the diluted odor sample. However, this next dilution level presents the odor at a higher concentration (e.g. two times higher). The assessor proceeds to higher levels of sample presentations following these methods. The detection threshold is defined as the average number of dilutions needed to make the odor just detectable. The recognition threshold is defined as the average number of dilutions needed to make the odor just recognizable. The detection and recognition thresholds are directly related to the concentration of odorants present. When the same odorants are involved in multiple samples, a higher threshold value means a higher concentration of the odorants were present. Odor Intensity Whole odor intensity evaluations (suprathreshold intensity) utilize n-butanol as a reference odorant following ASTM E544, Standard Practice for Referencing Suprathreshold odor Intensity.5 A commonly utilized presentation scale is an 8-point scale with a range of n-butanol concentrations from 12-ppm n-butanol to 1550-ppm n-butanol. The assessors assess the odor sample and compare the presentation to the butanol reference scale. They are trained and calibrated to match the sample odor intensity to a reference level on this butanol scale. This standard odor intensity referencing scale (OIRS) allows for consistent comparison between laboratories and across testing sessions.
Odor Descriptor Profiling Descriptive analysis is a sensory science term that includes the action of a panel of trained assessors describing attributes about a product sample (qualitative) and scaling the relative strength of these attributes (quantitative). Odors can be characterized using reference vocabulary. Standard practice is to provide assessors with a standard list of descriptor terms, which are organized with like terms in groups. Similarly, terms with negative connotation (unpleasant) tend to be grouped together and positive (pleasant) terms with other positive terms. One example of such lists is the ASTM International publication DS-61, Atlas of Odor Character Profiles.6 Figure 2 is an odor descriptor wheel developed by St. Croix Sensory, Inc. for use with character profiling of products and materials. The ten main odor categories include: naturally offensive (e.g. decay and fecal), marine (e.g. fish), animal (e.g. body odors, urine), chemical (e.g. petroleum, plastics), earth, vegetation, naturally pleasant (e.g. fruity and floral), culinary (e.g. herbal, spice, dairy), as well as taste and trigeminal experiences. Character descriptors can be customized to meet the needs of specific projects.
Odor descriptor terms from general to specific moving outward on the wheel.
Presentation Methods Standards for sensory evaluation of products and materials utilize several methods for sample presentation, including: direct sniffing of the material, evaluation of chamber headspace, and evaluation through presentation devices. Direct Sniffing The most basic method of presentation involves directly sniffing the material, shown in Figure 3. Ideally, this involves a test administrator presenting the samples in uniform presentation for all assessors. The item is held in a steady position and the assessor is instructed if they are to sniff a specific area of the garment or the entire available section. Disadvantages of this method include potential visual bias seeing the different samples and dilution of the odors from the space between the material and the assessor’s nose.
Figure 3. Assessor evaluating a textile sample with direct sniffing technique.
Test Chambers A second method for presentation is to prepare the odorous samples in test chambers. This could include large chambers, such as the stainless steel chambers shown in Figure 4. These larger chambers are less common for evaluating garment samples and are more conducive to testing of materials with stronger odors or where visual bias is high risk. Smaller chambers, such as 0.5-2L glass jars with Teflon-lined lids, shown in Figure 5 are more common for smaller materials such as garments, plastics, or adhesives. Testing the same sample by multiple assessors requires separate samples for each assessor or providing sufficient time between samples for the headspace to redevelop. Visual bias can be minimized by covering the jar, utilizing amber glass jars, or with laboratory lighting changes.
Figure 4. Stainless steel chambers at St. Croix Sensory. These 2m3 chambers can be prepared with one or more material samples for a large evaluation headspace.
Figure 5. Assessor evaluating plastic material in a small jar headspace.
Presentation Devices Presentation devices provide a way to present an odorous air stream to the assessors for evaluation. This requires a third test chamber option. Figure 6 shows an example of cotton towels in 10-L air bag samples before evaluation. The towels are placed inside air sample bags, the bags are closed, and then filled with zero-air to create the headspace. Once the air sample bag is prepared, there are two options for presentation to the assessors. An olfactometer, shown in Figure 7, is utilized for odor threshold determination. The olfactometer can additionally be used to present multiple dilutions above threshold for the assessor to make ratings of intensity or odor characterization for the presented diluted odors.
Figure 6. Air sample bag headspace. This photo shows cotton
towels placed into 10-L air sample bags.
Figure 7. Assessor sniffing from sniffing mask of AC'SCENT® laboratory olfactometer.
Figures 8 shows a second presentation method. The PureSniff™ device (Olfasense, GmbH) is a pressure vessel that applies pressure to the sample bag to present the odorous air from the bag in consistent 2-3 second puffs for the assessors to evaluate the headspace of the material at full strength.
Figure 8. PureSniff™ presentation device (Olfasense, GmbH). The pressure vessel
provides a consistent 2-3sec sniff of the material headspace in a prepared air sample bag.
Case Studies Real-world case study examples provide stories to understand how sensory evaluation techniques can provide key information to understand a problem or confirm product performance. Three case studies will be presented: 1) odor strength and odor characterization utilized to understand a complaint in odor of wet garments after washing, 2) body-odor control performance testing for shirts worn multiple times without washing, 3) performance testing of malodor removal by fabric freshening household care products. These case studies are based on actual project work and provide data representative of actual results; however, due to the proprietary nature of the testing, some facts are omitted or adjusted to protect client confidentiality. Case Study I: Unpleasant Odor in Wet Fabric A manufacturer of dress pants made of a polyester-wool blend received complaints of unpleasant odors on freshly washed pairs of slacks. Interestingly, the complaints were all linked to the beige colored garments. Multiple pairs of several colors of slacks were provided for testing. Some pairs were tested as received and others were washed using a standard wash cycle. The garments were sealed into air sample test bags, held for two-hours and evaluated by a panel of ten trained assessors for odor threshold values, odor intensity, and odor character descriptors. Results from three representative samples are presented for this case study. Figure 9 shows the results of the odor threshold testing for three representative samples from the testing. In repeated testing, all wet garments had higher odor threshold values than the dry garments. In comparing the wet garments, the beige colored slacks had significantly higher odor threshold values. In this example, the prepared headspace of the dry navy blue colored garment needed only 30 dilutions to bring the headspace odor to threshold level, while the wetted charcoal garment and the wetted beige garments required 150 and 500 dilutions to threshold, respectively.
Figure 9. Odor threshold value results for three pairs of dress pant samples, one
pair was tested dry as received and the other two garments are presented for results of wetted samples. The wet beige-colored pair had a significantly higher
odor level than other wetted garments.
The odor intensity results, shown in Figure 10, had a similar trend in results. The navy blue dry garment had an odor intensity of 17ppm n-butanol equivalent, which is near level 1 (faint) on the butanol intensity referencing scale. The wet charcoal sample had significantly higher odor intensity, with a value of 50ppm n-butanol equivalent. This is a slightly moderate odor near level 3 on the butanol 8-point reference scale. Finally, the wet beige sample had even higher odor intensity, with a result of 90ppm n-butanol equivalent, which is a more moderate odor near level 4 on the butanol 8-point reference scale.
Figure 10. Perceived whole odor intensity results for three pairs of dress pant samples, one pair was tested dry as received and the other two garments are
presented for results of wetted samples. The wet beige-colored pair had significantly higher odor intensity than other wetted garments.
30
150
500
---
100
200
300
400
500
600
NavyBlue-Dry Charcoal-Wet Beige-Wet
Detec
tion
Thres
holdValue
(Dilu
tion
Ratio)
17
50
90
---
10
20
30
40
50
60
70
80
90
100
NavyBlue-Dry Charcoal-Wet Beige-Wet
Perceive
dOve
rallOdo
rInt
ensity(p
pmn-butan
ol)
Figure 11 shows the histogram results for frequency the assessors reported odor descriptors for the wet charcoal garment (left) and the wet beige garment (right). The most frequently reported characters for the charcoal garment were fruity and floral, with four of ten assessors reporting each. Assessors also reported relatively higher responses of chemical and earth characters. The wet beige garment had a significant reporting of animal characters by 8 of 10 assessors, as well as high reporting of earthy character and minimal reporting of fruity/floral characters.
Figure 11. Histograms of assessor responses to odor characterization of two test samples: A. (Left graph) frequency of odor descriptors reported for wet charcoal colored garment. B. (Right graph) frequency of odor descriptors reported for wet beige colored garment.
Figure 12 shows the relative strength results for the identified odor desciptors for the wet charcoal garment. While the histogram in Figure 11 shows the same number of assessors reporting fruity and floral, this graphic shows a slightly higher relative strength of fruit character. All characters reported had average relative strengths near 1.0 (faint) on the 5-point scale. Figure 13 shows the relative strength results for the idenfitied odor descriptors for the wet beige colored garment. This data shows the animal odor character was at a near moderate level, with a significant level of earthy character also noted.
Figure 12. Odor character profile for wet charcoal colored garment,
showing the relative strength of identified odor descriptors.
Figure 13. Odor character profile for wet beige colored garment, showing
the relative strength of identified odor descriptors.
The odor evaluation testing on the polyester-wool blend garments confirmed the complaints. The results show the wet beige colored garment had a higher odor threshold value and higher odor intensity, as well as higher reporting of animal and earthy odor descriptors. In this case, the animal character was most specifically described as odor of wet dog or animal fur. Results also confirm the odors were limited to the beige colored dress pants and further investigation would focus on how the beige garment is different in a way that would lead to the unpleasant odors when wet.
Case Study II: Sweat Odor Minimization A dress shirt manufacturer wanted to test the effectiveness of treatments to reduce body-odor on the garment. Ten subjects were recruited to wear four dress shirts, Product A was a control shirt with no treatment, Products B, C, and D contained three different body odor control treatments. The dress shirts were each worn for two consecutive days without washing. The subjects did not wear deodorant but were allowed to shower normally with unscented products. The shirts were submitted for testing and evaluated by a panel of ten trained assessors during four testing sessions. The assessors sniffed the shirts directly and evaluated the garments for overall odor intensity as well as malodor strength.7 Figure 14 shows the average overall odor intensity reported for the four shirts. The control shirt, Product A, did have the highest overall odor intensity with a result of 50ppm n-butanol; however, this was not statistically higher in intensity than Product B, which had an intensity of 35ppm n-butanol. Product C had the lowest overall odor intensity, with a result of 10ppm n-butanol, which was statistically lower than the other samples.
Figure 14. Average perceived whole odor intensity results for four dress shirt
samples, worn by ten subjects for two consecutive days without deodorant. Figure 15 provides the average malodor intensity ratings for the ten subject shirts. The control shirt, Product A, had the highest average malodor rating, which was moderately strong at 6.6. This was statistically higher than all other samples. Product C had the lowest malodor rating near faint at 1.7, which was statistically different from Products A and B, but not Product D. Products B and D had malodor ratings of 4.7 and 3.2, respectively, which were not statistically different from each other. Figure 16 provides the results for each of the ten subjects scores for all four shirts. These results show Product A had the highest malodor rating for 9 of the 10 subjects. Further, the results for Product C are lower than other samples for almost all subjects.
50
35
10
22
0
10
20
30
40
50
60
70
80
90
100
ProductA ProductB ProductC ProductD
Perceive
dOve
rallOdo
rInt
ensity(p
pmn-butan
ol)
Figure 15. Average malodor rating for four dress shirt samples, worn by ten
subjects for two consecutive days without deodorant.7 Each score is an average of the ten subject scores from ten assessor responses.
Figure 16. Malodor ratings for four dress shirt samples worn by ten subjects for two
consecutive days without deodorant.7 Each score is an average of ten assessor responses. The malodor control performance testing results showed all product treatments lowered malodors on the shirts; however, Product C was the best performing treatment under the conditions of this test.
6.6
4.7
1.7
3.2
0
1
2
3
4
5
6
7
8
9
10
ProductA ProductB ProductC ProductD
Malod
orRating
0
1
2
3
4
5
6
7
8
9
10
ProductA ProductB ProductC ProductD
Malod
orRating
1
2
3
4
5
6
7
8
9
10
Case Study III: Malodor Reduction on Fabric A home care product company was developing a fabric refreshing spray product. Three product formulations were tested to compare cigarette smoke odor reduction performance and long-lasting effectiveness. Square foot cotton swatches were exposed to cigarette smoke malodors in a test chamber. The cotton swatches were then treated with three product formulations. Product A is a formulation with odor control chemistry, but not fragrance components. Product B is the same odor control chemistry plus fragrance. Product C is a competing fragranced product. Twenty trained assessors evaluated the cotton swatches 15-minutes after product application, and again at 12-hours, 24-hours, and 48-hours. The assessors rated the malodor reduction on the swatches by comparing to a reference sample (ASTM E1697), as well as the overall odor intensity, and odor characterization.8 Figure 17 summarizes the malodor relative to reference scores by the assessors.8 These values can be interpreted as percent of malodor remaining. The untreated samples had scores near 100 through 24-hours and near 90 at 48-hours. The three test products all significantly reduced malodor within the first 15-minutes of application. By 12-hours, Product C was performing less than the other two products and continued to have decreasing performance through the 48-hours. Products A and B, with the same odor control ingredient, performed well through 24-hours, but then Product A’s performance decreased to show a malodor score of 40% of the reference at 48-hours. Figure 18 shows the odor intensity scores for these samples. The untreated product sample has odor intensity decreasing with time, from a value near 200ppm n-butanol at 15-minutes to closer to 100ppm n-butanol at 48-hours. These test result data show Product A, without a fragrance component, has significantly lower odor intensity than the other products across the 48-hour test. Products B and C have odor intensity similar to the untreated sample; however, relative to reference malodor results from Figure 17 confirm that this odor intensity is due to a fragrance and not malodor. The intensity with these products continues to decrease with time at a rate similar to the untreated control sample.
Figure 17. Rating of cigarette smoke malodor remaining on cotton swatches, based on relative to reference score (ASTM E1697).8 Samples evaluated at 15-minutes, 12-hours, 24-hours, and 48-hours after application of fabric freshening product.
swatches after treatment with fabric freshening product formulations. Samples evaluated at 15-minutes, 12-hours, 24-hours, and 48-hours after application
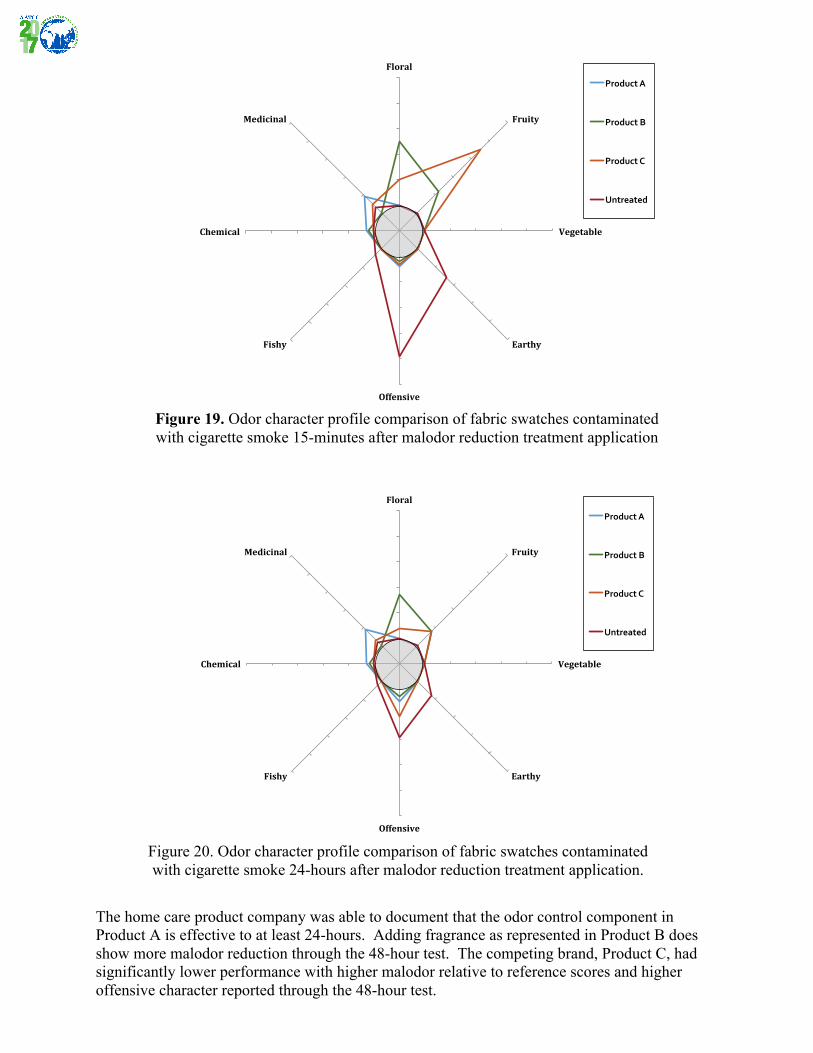
Figures 19 and 20 show the odor characterization results at 15-minutes and at 24-hours as examples, respectively. At 15-minutes, these results show the untreated sample with predominantly offensive and earthy character representative of the cigarette smoke. Product A has low levels of odor characters reported, with only medicinal character significantly reported. Products B and C have predominantly floral and fruity characters from the fragrance component. At 24-hours, there are some changes to the samples. The overall levels of offensive and earthy characters are decreased in the untreated control sample. Product A is now showing some offensive character and continued presentation of medicinal character. The fragrance components of Products B and C are now reduced and both exhibit some cigarette smoke malodor, with Product C showing the highest level of offensive character for the three products.
0
50
100
150
200
250
300
15-minutes 12-hours 24-hours 48-hours
Perceive
dOve
rallOdo
rInt
ensity(p
pmn-butan
ol)
ProductA
ProductB
ProductC
Untreated
Figure 19. Odor character profile comparison of fabric swatches contaminated with cigarette smoke 15-minutes after malodor reduction treatment application
Figure 20. Odor character profile comparison of fabric swatches contaminated with cigarette smoke 24-hours after malodor reduction treatment application.
The home care product company was able to document that the odor control component in Product A is effective to at least 24-hours. Adding fragrance as represented in Product B does show more malodor reduction through the 48-hour test. The competing brand, Product C, had significantly lower performance with higher malodor relative to reference scores and higher offensive character reported through the 48-hour test.
Floral
Fruity
Vegetable
Earthy
Offensive
Fishy
Chemical
Medicinal
ProductA
ProductB
ProductC
Untreated
Floral
Fruity
Vegetable
Earthy
Offensive
Fishy
Chemical
Medicinal
ProductA
ProductB
ProductC
Untreated
Discussion This paper presents background information for understanding sensory evaluation techniques for quantification of odors in textiles and related products. Standard sensory testing methods are available from organizations such as ASTM International, CEN, and ISO. The case studies highlighted in this paper illustrate three common types of applications for these methods. The first case study provides an example of quantification of fabric odors through threshold values, overall intensity, as well as characterization. Case study two outlines an example of a body-odor malodor rating to quantify performance of garments to minimize unpleasant body-odors after extended wear time. Case study three demonstrates how malodor rating techniques can be used to document efficacy of products to reduce malodors on a garment. These case studies illustrate the use of several evaluation method/techniques or hybrid methods are often needed to quantify odors and reach a comprehensive understanding of the product. Proper selection of standards and methodology are needed to collect sensory data that will provide the user with answers to the research questions of interest. With a well-planned and focused project, odor evaluation testing can provide key data for product development, claim support and quality control for textile and related products.
References 1. ASTM E253-16, Standard Terminology Relating to Sensory Evaluation of Materials and Products, Annual Book of ASTM Standards, Vol. 15.8, West Conshohocken, PA, USA, 2016. 2. STP758, Guidelines for the Selection and Training of Sensory Panel Members, ASTM International, Philadelphia, PA, USA, 1981. 3. ASTM E679-04, Standard practice for Determination of Odor and Taste Threshold by a Forced-Choice Ascending Concentration Series Method of Limits, Annual Book of ASTM Standards, Vol. 15.8, West Conshohocken, PA, USA, 2011. 4. EN13725:2003, Air Quality – Determination of Odour Concentration by Dynamic Olfactometry, Committee for European Normalization (CEN), Brussels, Belgium, 2003. 5. ASTM E544-10, Standard Practice for Referencing Suprathreshold Odor Intensity, Annual Book of ASTM Standards, Vol. 15.8, West Conshohocken, PA, USA, 2010. 6. Dravnieks, A. DS-61, Atlas of Odor Character Profiles, ASTM International, Philadelphia, PA, USA, 1985. 7. ASTM E1207-14, Standard Guide for Sensory Evaluation of Axillary Deodorancy, Annual Book of ASTM Standards, Vol. 15.8, West Conshohocken, PA, USA, 2014. 8. ASTM E1697-05, Standard Test Method for Unipolar Magnitude Estimation of Sensory Attributes, Annual Book of ASTM Standards, Vol. 15.8, West Conshohocken, PA, USA, 2012. Contact Author: Michael A. McGinley, St. Croix Sensory, Inc., 1150 Stillwater Blvd N, Stillwater, MN 55082, [email protected], 651-439-0177 ext.16.