THE REGIONAL DEVELOPMENT COMPANY MACROPLAN AUSTRALIA PTY LTD ABN 38 657 106 626 PO Box 4, Chiltern, Vic 3683 Level 4, 107-109 Flinders Lane, Melbourne, Vic. 3000 TEL: 03 5726 1180 FAX: 03 5726 1174 TEL: 03 9663 6826 FAX: 03 9663 2896 Email: [email protected]E-MAIL: [email protected]Reference: 81297 North East Victoria Regional Agribusiness Agribusiness Profile of the region PREPARED FOR THE AUSTRALIAN ALPINE VALLEYS AGRIBUSINESS FORUM (AAVAF) December 2004 FINAL DRAFT FINAL DRAFT FINAL DRAFT FINAL DRAFT MacroPlan Australia
Transcript
THE REGIONAL DEVELOPMENT COMPANY MACROPLAN AUSTRALIA PTY LTD ABN 38 657 106 626
Stage One: Scoping and Inception ............................................................................................... 13 Stage Two: Data Collection and Consultation ............................................................................. 13 Stage Three: Data and Industry Analysis ........................................................................................ 2 Stage Four: Business Plan, including recommendations for a Marketing Plan ............................ 3
ANALYSIS OF REGIONAL CONTEXT AND ISSUES .................................................................. 4
Alpine Shire ..................................................................................................................................... 8 Benalla Rural City ......................................................................................................................... 10 Contact: ......................................................................................................................................... 11 Indigo Shire ................................................................................................................................... 12 Contact: ......................................................................................................................................... 13 Towong Shire ................................................................................................................................. 14 Contact: ......................................................................................................................................... 15 Rural City of Wangaratta .............................................................................................................. 16 Contact: ......................................................................................................................................... 18 Rural City of Wodonga .................................................................................................................. 19 Contact: ......................................................................................................................................... 21
AGRIBUSINESS EMPLOYMENT AND REGIONAL IMPACT .................................................................... 22 FREIGHT ............................................................................................................................................. 26 AGRITOURISM .................................................................................................................................... 27 THE TREND IN TOURISM VISITATION FOR THE REGION ...................................................................... 27 ACTIVITIES UNDERTAKEN BY DAY TRIP VISITORS ............................................................................. 29 THE PROMOTION OF AGRITOURISM WITHIN THE REGION .................................................................. 32 REGIONAL SWOT ANALYSIS ............................................................................................................ 37
INDUSTRY PROFILES ..................................................................................................................... 39
Appendix A – Data Definition ..................................................................................................... 172 Appendix B – Communication Strategy ....................................................................................... 172 Appendix C – Evaluation Plan .................................................................................................... 172 Appendix D - ABS process of determining the value of production and number of establishments
..................................................................................................................................................... 172 Appendix E - Surveys ................................................................................................................... 172 Appendix F - A list of interviewees .............................................................................................. 172 Full bibliography ......................................................................................................................... 172
This report has been commissioned by the Australian Alpine Valleys Agribusiness Forum (AAVAF) to update a 1996 Study known as the Bright Report.
The primary aim of the 2004 AlpValleys Regional Agribusiness Profile is to develop a comprehensive inventory of North East agribusiness and identify competitive advantages and opportunities for agribusiness development, along with any
restrictions likely to impede growth.
The report study area covers the six shires of the North East of Victoria: Alpine Shire, Indigo Shire, Towong Shire and the Rural Cities of Benalla, Wangaratta and
Wodonga. This is an area of 19,974 km2 (nearly 2 million hectares), with a population of 107,285 (ABS, 2001).
This report has found that the value of agriculture to the regional economy is $285 million, excluding forestry and forestry products, and viticulture.
Using standard ABS multipliers, the full flow on to the economy from agriculture and
value adding is $731 million, with a total employment impact of 6,275 jobs.
A recent study for Plantations North East1 identified the total value of goods
produced in forestry and forestry products at $246 million. The study area was larger than that for this study, and cannot be directly compared. Total timber industry employment for the North East was 3,434 with a further 1,500 direct and indirect jobs
in secondary processing.
The North East Wine Zone Strategic Study (2003) concluded that the wine industry
makes a total contribution of $244.6 million, with an employment impact of 689 full time equivalent jobs.
1 The Timber Industry in North East Victoria: A Socio-economic Assessment (2002)
Regional Impact
Contribution to economic base
Total employment impact
Agriculture $ 731 m 6,275
Forestry $ 246 m 4,934
Viticulture $ 245 m 689
AlpValleys Agribusiness Profile 2004
Page 5 of 188
Using ABS data (2001) for the gross value of production, the largest agricultural
industry in the study area was Beef and Veal production with a value of $ 105.6 m. This was also the industry with the most number of individual farms identified as production units (1, 753 of the region’s 2,365 farms).
The key agricultural industries for the AlpValleys region are:
Beef and veal production $105.6 m
Dairy farming $ 69.2 m
Tobacco $ 22.9 m
Grape production (for crushing) $ 17.6 m
Hay from crops $ 11.5 m
Lamb and sheep meat $ 10.1 m
Wool $ 9.6 m
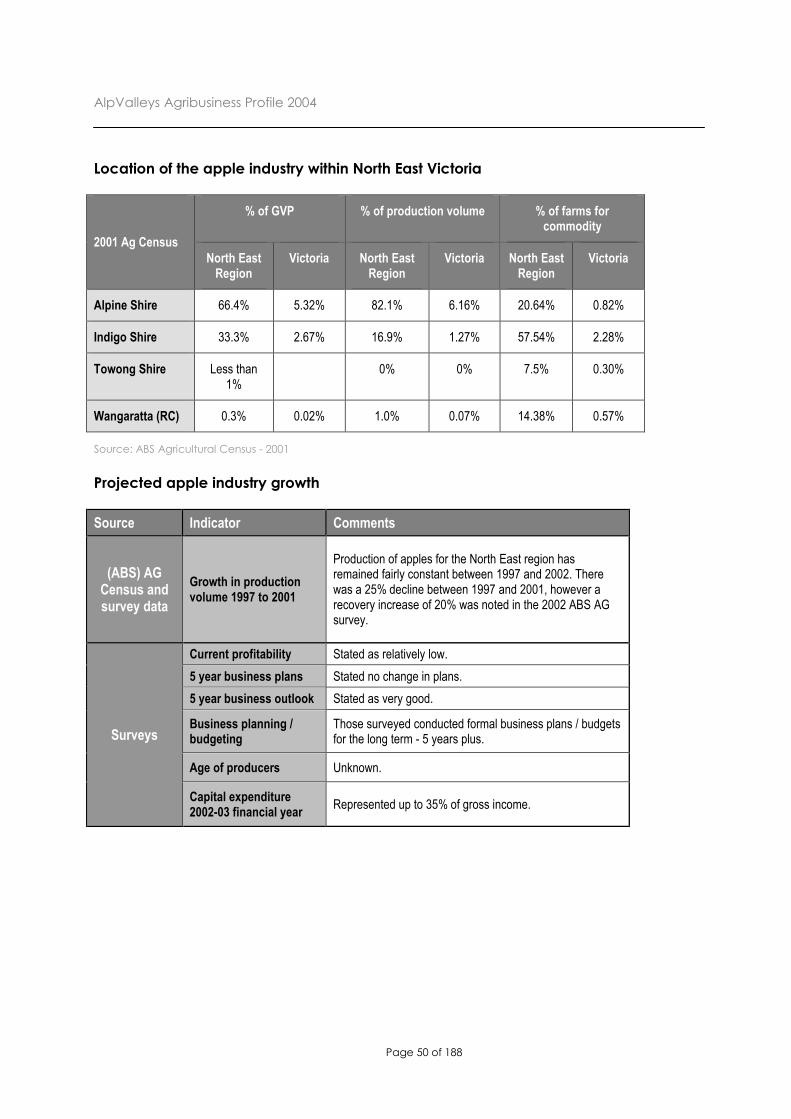
Apples $ 8.2 m
Cereals for grain $ 7.6 m
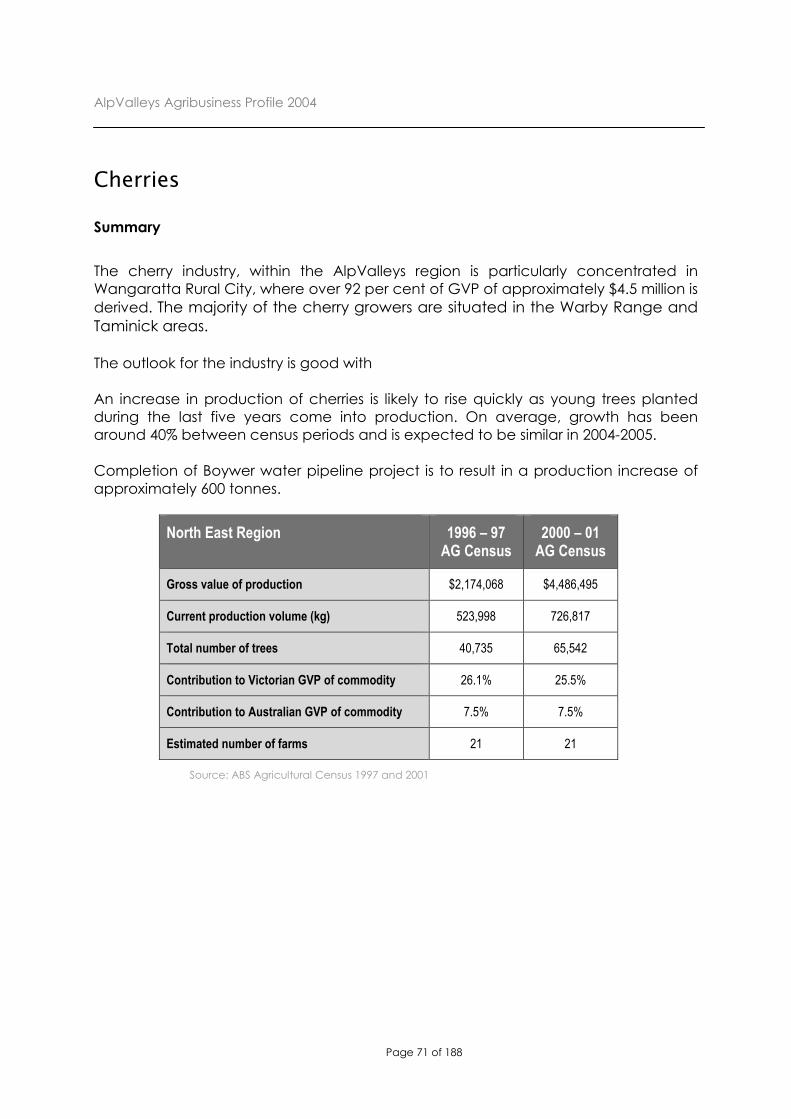
Cherries $ 4.5 m
Some agricultural commodities in the AlpValleys region contribute a significant proportion of total Victorian production.
Industry % Victorian
Production
Tobacco 100 %
Hops 100 %
Blueberries 25.7 %
Cherries 25.5 %
Capsicums, chillies and peppers 22.1 %
Kiwifruit 18 %
Apiculture (honey) 16.6 %
Industries showing the largest growth during the period 1997 to 2001 include:
AlpValleys Agribusiness Profile 2004
Page 6 of 188
Industry GVP 1997 GVP 2001 % change
Grapes for crushing $ 5.3 m $ 17.6 m 232 %
Cherries $ 2.17 m $ 4.5 m 107 %
Nuts, including chestnuts $ 0.5 m $ 1.8 m 260 %
Capsicums, chillies and peppers $ 0.45 m $ 1.08 m 140 %
Blueberries $ 0.19 m $ 0.86 m 352 %
Oilseeds $ 0.25 m $ 0.85 m 240 %
Raspberries $ 0.16 m $ 0.49 m 206 %
Citrus fruit $ 0.17 m $ 0.4 m 135 %
Olives $ 0.05 m $ 0.13 m 160 %
Source: ABS Census Data 1997 and 2001
Industries which grew between 50-100% from 1997 to 2001 include:
• beef and veal
• sheep and lamb meat
• strawberries
• peppermint
Other industries which experienced growth between 10 and 50% in gross value of production between 1997 and 2001 include:
• apiculture (honey)
• hay
• cereals for grain
• kiwi fruit
• dairy farming
AlpValleys Agribusiness Profile 2004
Page 7 of 188
Not all growth industries grew as a proportion of the state’s commodity production,
however oilseeds, olives, capsicums, honey, nuts, wool, kiwi fruit and citrus fruit have increased comparatively.
Of these, the most significant growth in contribution to the state’s production was for
capsicums, chillies and peppers which increased from nearly 9% of production in 1997 to 22.1% of Victoria’s production in 2001. Honey has increased its share from
9.6% in 1997 to 16.6% in 2001.
Since the 2001 census, green tea has shifted from being a trial crop to commercial production. Japanese green tea was first processed in the region in late 2004. The
green tea processor estimates that within 10 years, the production in the AlpValleys region will be 1000 tonnes with an estimated value of $10 million.
Significant growth in the gross value of production is also occurring in the olive industry, with the full production GVP estimated at between $11.4 million and $14.6 million.
Increased plantings of cherries also indicate continued and strong growth.
Industries such as emu farming, pig farming and peppermint have changed
considerably since the Bright Report. Emu farming no longer exists in the region, and the peppermint industry has reduced from a value of $ 0.5 m to nil production for 2002 to 2004. New plantings of peppermint have recently been undertaken. Pig
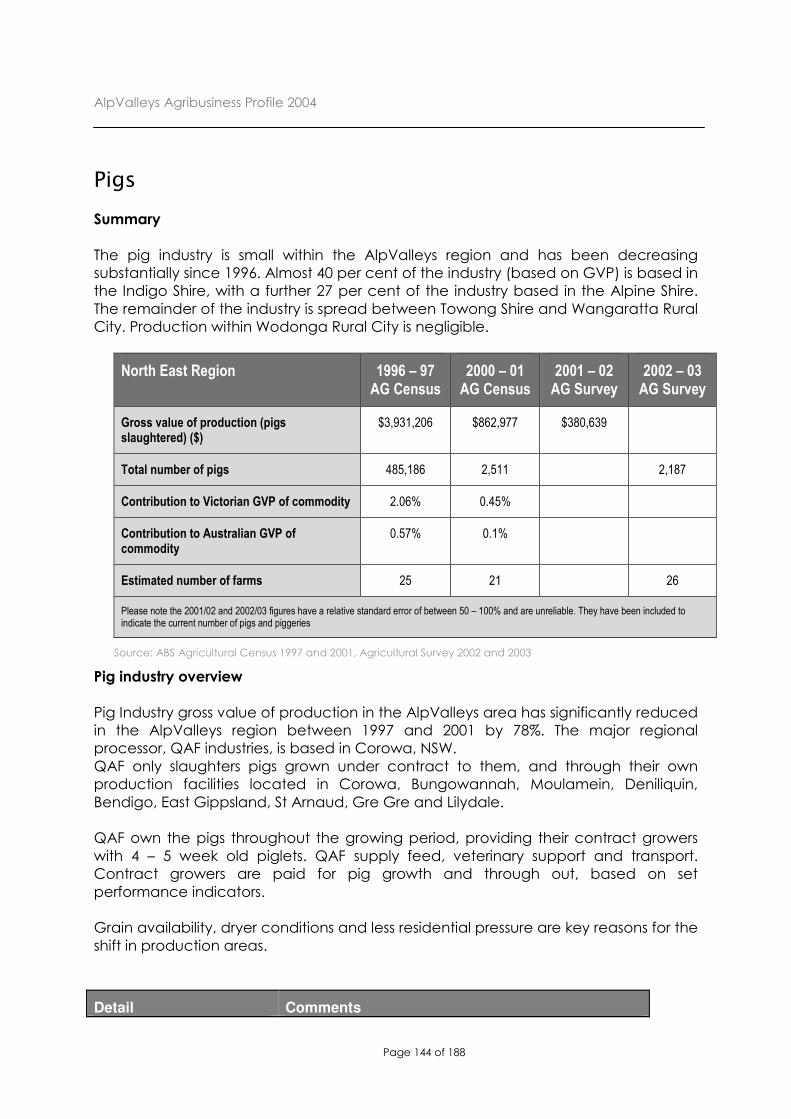
industry production has decreased by 78% between 1997 and 2001, and is unlikely to increase
The main export oriented industries are green tea (100% of production), dairy (60 –
90% of production), beef (50% - 95% of production) and hops (60% of production).
Agriculture is very important to the economy of each of the local government areas
of the AlpValleys. The greatest contribution to agricultural GVP for the region is from Wangaratta Rural City contributing $ 89 m in 2001 (31% of the region’s GVP, and 1.1% of Victoria’s gross value of production.)
AlpValleys Agribusiness Profile 2004
Page 8 of 188
2001 AG CENSUS
GVP
$ % OF North East % of Victoria
Alpine Shire 55,373,777 19.4% 0.7%
Benalla (RC) 6,478,737 2.3% 0.1%
Indigo Shire 58,982,746 20.7% 0.7%
Towong Shire 66,168,029 23.2% 0.8%
Wangaratta (RC) 89,113,575 31.2% 1.1%
Wodonga (RC) 9,121,248 3.2% 0.1%
North East Victoria 285,227,578 100% 3.4%
Victoria 8,301,249,631 100%
Australia 34,236,728,168
Farm numbers were also higher in Wangaratta, with 35.6% of the region’s farms in 2001 (842 farms). This was followed by Indigo (503), Towong (491), Alpine Shire (346),
with Benalla (90 farms) and Wodonga (93 farms).
The processing sector in the AlpValleys region includes significant value adding to
forestry products, wine production, meat processing, and dairy processing.
The land of the AlpValleys region has been assessed for its productive capacity2, and it was found that 40,000 ha are classified as high capability (equating to 5.9% of
freehold land in the area). This high capability category of agricultural land supports enterprises such as irrigated horticulture, irrigated broad acre cropping, dairying non
irrigated broad acre cropping, broad acre grazing, viticulture and forestry. The areas identified with the highest capability in the study area are predominantly the alluvial deposits along the river valleys and the recent alluvium of the riverine plains.
Water and its availability to support both agricultural production and value adding is of prime concern to the AlpValleys region. Water is recognised as the scarcest resource for the further development of the region.
2 Land Resource Assessment for the North East Catchment Region (2002)
AlpValleys Agribusiness Profile 2004
Page 9 of 188
Significant changes in government policy have occurred since the Bright Report.
Securing Our Water Future Together, the Victorian state government White Paper and Action Plan was released in June 2004. Draft Stream Flow management plans have been developed for both the Kiewa and Ovens Valleys, and farm dam
licensing has been introduced. Trading of water rights both permanently and temporarily has been established, but this study has found that trading appears to
not be widely understood or used.
Marketing of produce varies with the type of commodity being produced. Newer industries such as olives, and green tea appeared to have a culture of developing
and implementing both longer term and shorter term business plans and marketing plans. This is in marked contrast to the region’s larger and more established
industries. Farmer’s markets within the region, and in Melbourne, are a key sales vehicles for many horticultural and poultry products.
Several changes and trends in land use and farming practises were reported during
this study, and borne out by other research papers:
• There is an increasing trend for sub-division of rural land closer to the growth
centres of Wodonga, Wangaratta and Benalla, with higher land values throughout the region, mainly driven by lifestyle farmers or people paying a higher price for ‘landscape amenity’3
• This trend has caused some concerns about loss of agricultural land, and ‘right to farm’ issues.
• There is a general aging of the farming population, more notable in the
region’s beef industry, and sheep and lamb production.
• Consolidation or fragmentation of rural land is dependent on the location
within the study area. Land appears to be more tightly held in the Upper Murray, with purchasers likely to be neighbouring farmers consolidating their properties. As noted earlier, fragmentation and an increase in smaller
holdings is occurring around the larger population centres.
• Most farming enterprises in the AlpValleys have multiple forms of agricultural
production eg beef and peppermint, cherries and cattle.
• Whilst the statistical information gathered did not show the relationship between smaller farms and more niche enterprises, anecdotally it was stated
that smaller farms with off farm income were more likely to produce niche market products eg nuts or herbs.
• Off farm incomes are prevalent throughout the region, with the farming enterprise producing increasingly smaller portion of household income
3 Dr Neil Barr, Agri-Futures Workshop, Beechworth, 2004
AlpValleys Agribusiness Profile 2004
Page 10 of 188
Overall, there was strong optimism for the AlpValleys region and its future as an
agribusiness area.
Key strengths of the region most frequently cited were:
• favourable climate, including rainfall and suitable soils (high capability
agricultural land)
• proximity to markets, with sound road infrastructure
• access to skills, support services and service industries
• access to research facilities, and education providers
• diversity in agricultural production
Perceived weaknesses most frequently cited were:
• water availability and changes in access to water
• unmet demand for both seasonal labour, and “quality, appropriate and cost effective labour”
• market forces and globalisation, pressures on terms of trade
• fragmentation of high quality land, and competition for land (eg amenity vs. agriculture)
• high capital costs to enter certain industries, which may preclude younger farmers
• age of farmers in certain industries
Opportunities were in the areas of:
• greater value adding to local produce (eg an additional large scale abattoir)
• building stronger links between food and wine production and tourism
• the greater provision of pollination services to agriculture
• tailoring agricultural, marketing and enterprise education to lifestyle and
Australian Alpine Valleys Agribusiness Forum (AlpValleys) is the Regional Agribusiness Committee located in Victoria’s North East. AlpValleys, and the regional agribusiness
and industries it supports, have identified a need to increase the understanding of the key drivers of Agribusiness in North East Victoria, and have commissioned this report.
This project has gained support from the Department of Primary Industries Victorian Agribusiness Networks (VAN) Program.
A report conducted in 1996 entitled “North East Agribusiness Forum Regional Profile”
(often referred to as the “Bright Report”) was the catalyst for the development of the Australian Alpine Valleys Agribusiness Forum (AAVAF). This profile investigated the
region’s key agribusiness sectors. It looked at the needs and issues facing the sustainable development of industries and businesses, and made a series of recommendations to address these problems.
Despite changes since it was written, the 1996 regional profile continues to be used widely and has been the foundation for many projects in the region. It is for this
reason information needs to be updated. Planners and those making decisions on behalf of regional businesses require current information on the size, diversity and contribution agriculture makes to regional economy.
The aim of the 2004 AlpValleys Regional Agribusiness Profile is to develop a comprehensive inventory of North East agribusiness and identify competitive
advantages and opportunities along with any restrictions likely to impede growth.
The outcomes of the project will:
• Provide relevant support for existing regional agribusinesses, helping them to fine-tune their operations.
• Provide greater understanding of the issues facing agribusiness in the
region, increase employment opportunities, direct resources and look
to new markets with products of critical mass. • Provide potential investors with current information to assist with
decisions about investing in the region.
• Result in a business plan that will enable a region-wide approach to developing and marketing agribusiness across the Shires of Indigo, Towong and Alpine, plus the rural cities of Benalla, Wangaratta and
Wodonga.
AlpValleys Agribusiness Profile 2004
Page 12 of 188
Additionally, the strengths, weaknesses, opportunities and threats identified by
regional agribusiness groups will be addressed in the Australian Alpine Valleys Agribusiness Forum business plan and form a basis for action. The Forum wishes to be a major contributor to the development of Agribusiness in the Alpine Valleys.
The 2004 Agribusiness Profile covers the Shires of Alpine, Indigo, Towong, and the Rural Cities of Benalla, Wangaratta, and Wodonga.
The project engaged key stakeholders involved in various facets of agribusiness within these Shires through face to face interviews, phone interviews, meetings and a regional survey.
Both the consultants and AlpValleys would like to thank all those contributors for assisting in the development of this updated profile of agribusiness industries and
identification of opportunities within the region.
In July 2004, The Regional Development Company and MacroPlan Australia were appointed to undertake research to develop the 2004 AlpValleys Agribusiness Profile.
They were also engaged to use the profile to assist AAVAF to develop its own business plan and determine marketing directions.
This report presents the overview of agribusiness in the AlpValleys region, and
analyses the key drivers, the current issues and the potential opportunities.
AAVAF prepared a comprehensive brief for the project, and the agreed methodology followed five stages:
Stage One Scoping and Inception
Stage Two Data Collection and Consultation
Stage Three Data and Industry Analysis
Stage Four Business Plan, including recommendations for a Marketing Plan
Stage Five Reporting
This section describes the agreed objectives for each Stage, and briefly explains the methods used to meet the objectives.
Stage One: Scoping and Inception
Objectives:
To agree on the methodology, review existing data and literature, and develop a
communications plan.
The methodology was agreed upon following several iterations of the ‘data
definitions’ (Appendix A). A communications strategy was developed and adopted by the steering committee on 12 August 2004 (Appendix B). An evaluation plan was
also developed and presented to the steering committee (Appendix C).
Stage Two: Data Collection and Consultation
Objectives:
To collect, research and ground truth data to be able to accurately profile the range
of agricultural products of the AlpValleys region.
To produce an accurate picture of current marketing strategies), impediments to
growth, direct and indirect employment, value of the sector by municipality, and the
relativity of the top ten industries to the national agricultural output (by industry).
AlpValleys Agribusiness Profile 2004
Page 14 of 188
A decision was made to use standard and repeatable data to ensure that follow-up
analyses and reports would be able to compare data with some confidence.
Consultation was a key tool to “ground truth” the data from statistical and report research. It also assisted in building awareness of the project and obtaining “buy-in”
from key agribusiness groups, business and influencers.
For this report, the data is presented in key commodity groupings. The classification
(or groupings) was based on ABS data, previous reports and survey results.
This profile is based on data and information collected from the following sources:
1. Australian Bureau of Statistics (ABS) Agricultural Census – 1997 and
2001
2. ABS Agricultural Survey – 2002 and 2003.
3. Survey responses to a mail out undertaken on behalf of the AAVAF, 2004.
4. Key person interviews including government agencies, agribusiness
and agribusiness groups.
5. Follow up calls to survey respondents.
6. Existing agricultural, industry and region reports.
7. Alpine Valleys Agri Futures Workshop, November 2004
The ABS Agricultural Census – 1997 and 2001
The Agricultural Census asks questions relating to crops, livestock and livestock products, land management and characteristics of farms.
The census considers all establishments undertaking agricultural activity with an estimated value of agricultural operations (EVAO) of $5,000 or more.
The 1997 Agricultural Census was complete and is free of any statistical errors.
For the 2001 Agricultural Census, the ABS advises that Relative Standard Errors (RSE) of between 25 – 50% may apply to certain commodities where there is a low level of
production. This report uses the data available, but highlights those figures to be used with caution:
^ Indicates an RSE between 10% and 25%
* Indicates an RSE between 25% and 50%
AlpValleys Agribusiness Profile 2004
Page 15 of 188
Data utilised for this report
This report utilises four key commodity indicators provided by the ABS Census 1997
and 2001 ABS Agricultural Surveys
• Volume of production
• Value of agricultural commodities produced,
• Estimate of the number of establishments that produce the commodity,
• Area of production where it was provided for the commodity.
The ABS process of determining the value of production and number of establishments is outlined in Appendix D.
Value of agricultural commodities produced (VACP)
The census questionnaire itself does not ask any financial questions of farmers, however the ABS calculates the value of agricultural commodities produced (VACP)
by multiplying the determined average domestic price of the commodity with the estimated total production of the commodity, for the specified region.
Most price information is obtained from non-ABS sources such as marketing boards,
marketing reports, wholesalers, brokers and auctioneers.
It should be noted that caution should be used when comparing VACP figures across
census or surveys periods, as they have not been adjusted for inflation or fluctuations in commodity prices.
Agricultural establishments defined
For the Agricultural Census, an establishment covers all operations at a physical
location, but may consist of a group of locations provided they are within the same state or territory. The majority of establishments operate at one location only.
The raw data received from the ABS was from the 1997 and 2001 Agricultural Census, by commodity type and region, with information given on:
� Production volumes
� Total production values � Estimated number of establishments
� Area of production (only provided for certain commodities)
The data was sorted by first determining set groups of commodities, based on
information obtained from previous reports and from received surveys. This original classification was undertaken to provide a tailored set of data to suit the proportion
and range of commodities produced within the North East Region. For example, a commodity grouping of ‘berries’ was created that grouped strawberries, blueberries and raspberries, based on prior reports. Then, after analysing the values and
AlpValleys Agribusiness Profile 2004
Page 16 of 188
proportions, these commodities were reported by grouping ‘blueberries and
raspberries’, and ‘strawberries’ alone due to size of the strawberry industry warranting its own commodity group within the profile.
ABS Agricultural Survey – 2002 and 2003.
The ABS Agricultural survey is conducted annually from a sample of primary
producers. The national sample size in 2002 was 28,000 and 35,000 for 2003 out of a possible 135,377 establishments.
The most recent ABS Agricultural Survey data has been included for certain
commodities where statistically valid production data was available, in order to provide a current overview of the commodity.
This was undertaken for the Ovens Murray Statistical Division only, which incorporates five of the six regions for the North East Region (Benalla Rural City falls within another statistical division and therefore statistics from the rural city were not included in these
estimates).
Production figures, Value Agricultural Commodities Production and business counts
data used from the 2002 and 2003 Agricultural surveys have a relative standard error (RSE) of between 10% and 50%.
Survey responses to the mail out undertaken on behalf of the AAVAF, 2004
There were approximately 2,400 surveys sent to farmers within the six shires defined as the AlpValleys region for this project.
The aim of the survey, and interviews, was to fill information gaps and to provide qualitative data to complement the statistical data from ABS and ABARE and
industry sources.
The surveys (see Appendix E) sought information in the following areas.
Details of location
Indicative age of respondent
Land Use and Production
Growth and profitability
Employment Market value of products
Resource Usage
Use of services
Value adding
Business Communication and Processes
Council Rates and other Taxes
Returned surveys were analysed for their descriptive responses, to obtain an overall understanding, by commodity, of the current situation of primary producers in the
region.
AlpValleys Agribusiness Profile 2004
Page 8 of 188
Key person interviews
Over 40 interviews were conducted face to face, or by telephone with the key industry and government agency personnel.
The interviews sought information on the commodity, production strengths and
weaknesses, industry trends, value adding services and were used to ground truth statistical and survey findings.
Interviewees were also asked about regional strengths, weaknesses, opportunities and trends.
Government agency interviews particularly focused on regional land use, water use, regional trends and overviews.
The following commodity groups, or key issue areas were covered during the
interview process: Agritourism
Alpacas Apples Aquaculture
Beef Cherries
Chestnuts Cut flowers Dairy processing
Dairy production Essential oils
Green tea Hazelnuts Honey
Lamb
Livestock processing
Mushrooms Oilseeds Olives
Pigs Poultry
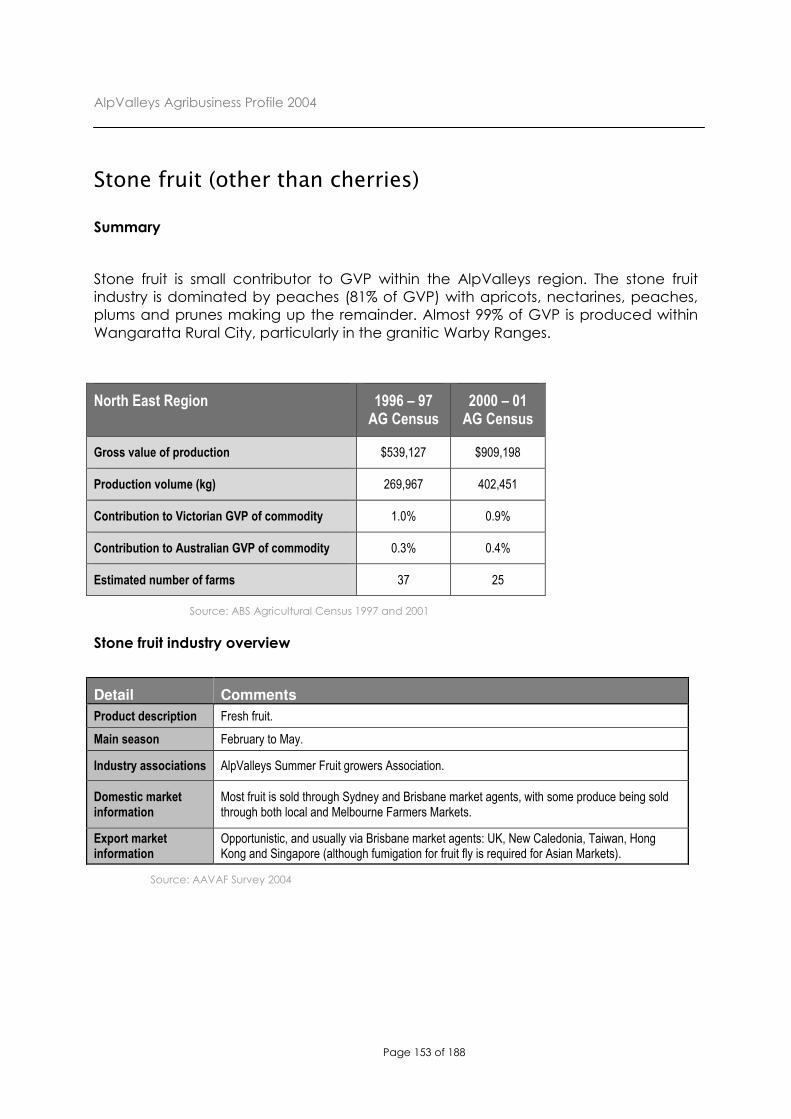
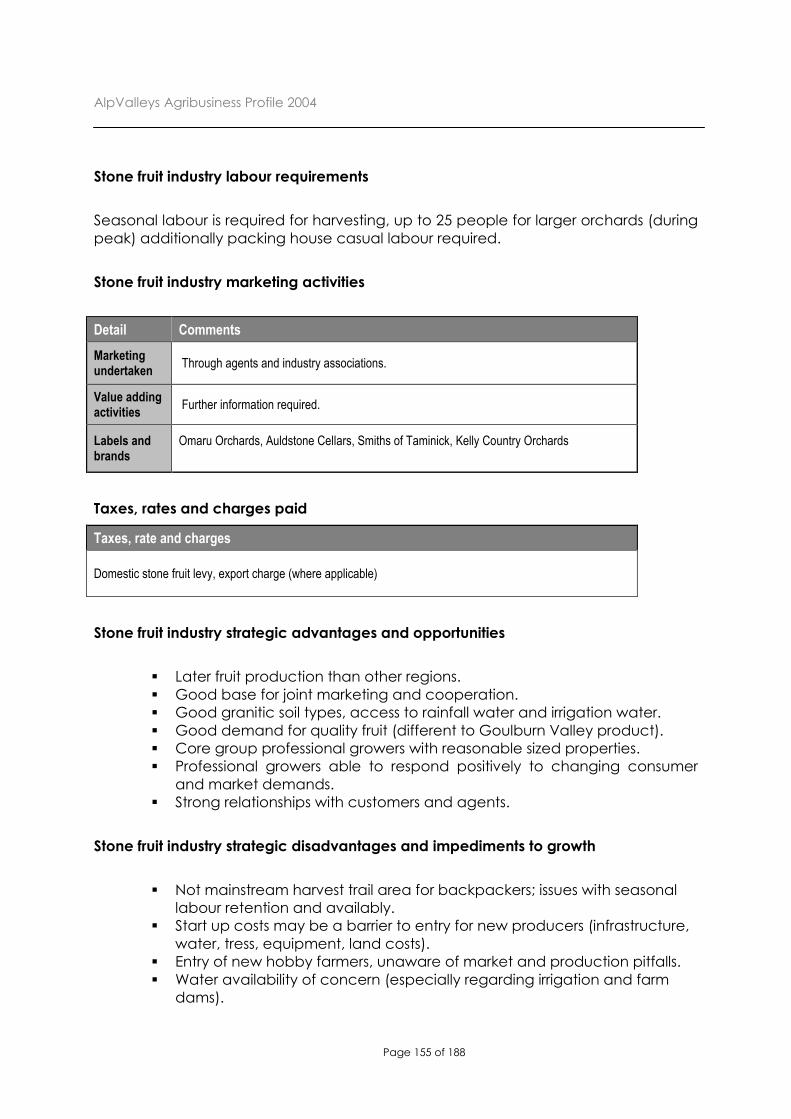
Production horticulture Seed production Stone fruits (other than cherries)
Timber freight Timber value adding
Tobacco Walnuts Wool
Issues
Land use
Water use Finance Marketing
Land prices and trends
A list of interviewees is appended (Appendix F)
AlpValleys Agribusiness Profile 2004
Page 2 of 188
Existing reports
Previous industry and regional studies were used to provide a more detailed overview of large industries within the region as well as key issues.
Previous detailed investigations were undertaken of the forest and wine industries for Plantations North East and Australian Alpine Valleys Agribusiness Forum respectively. The Timber Industry in North East Victoria (2002) and North East Wine Zone Strategic
Research Project (2003) were used as the basis for assessment of these industries.
A full bibliography is provided with this report. Additionally, each commodity section
contains a reference to the reports used and key contact people.
Alpine Valleys Agri futures Workshop 2004
To ground truth the data, and add additional vital information to the report a
regional Agri Futures Forum was held in Beechworth on 10 November 2004.
40 forum attendees represented a wide range of producer groups, commodities,
government agencies, local government areas and value adding industries.
The keynote presentation was on “Future Agricultural Landscapes” by Dr Neil Barr of the Department of Primary Industries. This was followed by a brief overview of key
findings of the research conducted for this study.
Mind maps of each industry were provided to participants who were asked to add
information, expert knowledge and comments to the data.
This information was most valuable and has aided both the commentary on the ABS and survey data as well as “ground truthing” trends, opportunities and futures for this
region.
Stage Three: Data and Industry Analysis
Objectives:
To undertake in depth analysis and research (on both an industry and sectoral basis)
of the issues and opportunities, limitations (land, water, environment) for the region’s
agribusiness future resulting in the development of a Regional Agribusiness Profile.
The data analysis was undertaken from both an economic perspective and to gain
an understanding of regional issues. This report presents the results of that extensive analysis.
The draft report will be discussed in detail with the Steering Committee through a
facilitated workshop process.
Modification to the final report will incorporate such feedback.
AlpValleys Agribusiness Profile 2004
Page 3 of 188
Stage Four: Business Plan, including recommendations for a Marketing Plan
Objectives:
To prepare a draft and final Business Plan in conjunction with the AlpValleys Board
following analysis of the Regional Agribusiness Profile.
AlpValleys Agribusiness Profile 2004
Page 4 of 188
Analysis of Regional Context and IssuesAnalysis of Regional Context and IssuesAnalysis of Regional Context and IssuesAnalysis of Regional Context and Issues
Regional Overview
The study area is the footprint of the Australian Alpine Valleys Agribusiness Forum covering the local government areas of:
� Alpine Shire � Benalla Rural City � Indigo Shire
� Towong Shire � Rural City of Wangaratta
� Rural City of Wodonga
This is a geographic area of 19,974 km2 (nearly 2 million hectares), with a population of 107,285 (ABS, 2001).
Key characteristics of AlpValleys region Source: Victoria in Future 2004
Local Govt Area
Area km2 2001 population
Population density
Persons/km2
Predicted Av. Annual Change Population 2001 - 2003
Major Centres
Alpine
4,832
13,067
2.7
+ 0.4%
Bright
Myrtleford Mt Beauty
Benalla
2,353
14,071
6.0
+ 0.4%
Benalla
Indigo
2,044
14,716
7.2
+ 0.6%
Beechworth Chiltern
Rutherglen
Towong
6,673
6,311
0.9
- 0.2%
Corryong Tallangatta
Wangaratta
3,639
26,664
7.3
+ 0.3
Glenrowan Wangaratta
Wodonga
433
32,456
75.0
+ 1.7%
Wodonga Baranduda
Totals 19,974 107,285
AlpValleys Agribusiness Profile 2004
Page 5 of 188
The study region includes the Upper Murray River basin, the Mitta Mitta River Valley, the Kiewa River basin, and the Ovens and King River basins.
These fertile valleys and riverine plains, combined with a reliable rainfall, produce a
diverse range of agricultural commodities.
The region is well placed geographically by main transport linkages between Melbourne, Sydney, Canberra and Brisbane.
The region is economically diverse specialising in high quality agribusiness industries, a growing market, and a varied manufacturing base.
Commercial forestry is a major industry with plantations predominantly on public land managed under perpetual lease.
The North East Regional Plan (2003) shows the key growth industry sectors are tourism,
logistics and distribution, and manufacturing. These growth sectors are underpinned by agriculture, horticulture, viticulture and forestry, along with infrastructure (such as
the Hume Highway Corridor) and education and training.
The region’s resources – its high quality land, water resources and people - are the base on which the region has been founded.
Australian Alpine Valleys Region Economic Framework
Growth Industries
Tourism
Logistics/Distribution Manufacturing/Processing
Source: MacroPlan Australia and The Regional Development Company – Adapted from North East Plan
Resources
Land, Water, People
Key Drivers
Education, Infrastructure, Agriculture/Forestry
AlpValleys Agribusiness Profile 2004
Page 6 of 188
There is a strong sense of growth and optimism in the overall regional economy. A ten year vision developed and adopted for the region as part of the North East Regional Plan 2003. It states (inter alia)
“It is 2013 and the North East Region of Victoria has established a viable
reputation as a leading inland region of Australia in terms of economic, social,
lifestyle and environmental well-being.
The North East Region has achieved this by concentrating on excellence and
environmental sustainability; and using its outstanding landscapes and skilled
workforce to sustain world-class wine and food production, a diverse and
smart manufacturing sector; and using its natural resources and tourism
attractions to develop strong domestic and international visitation. The focus
has been linked with investment in education and training sustaining long-
term employment in all age groups and a resilient, highly skilled workforce.
The ease of accessibility to the eastern Australia seaboard and major markets
has been enhanced by the continued development of sound road, rail and
telecommunications infrastructure. The critical positioning of the region along
the Hume Corridor will be enhanced by nationally significant freight and
distribution hubs, the completed duplication of the Goulburn Valley Highway,
high speed rail access to Sydney and Melbourne and extensive metropolitan
equivalent telecommunication services.
Unique Alpine landscapes will be sustainably developed for year round
access, and, along with the North East Region’s history and food and wine
production, will provide the basis for the significant contribution of tourism to
the regions economy.
Three focal sectors of the economy are manufacturing, transport and storage
and tourism. Underpinning these sectors are a diverse agricultural and forestry
base; a responsive post secondary education sector, and core, well
maintained and competitively priced infrastructure. People, land and water
are vital foundation elements.
The focal sectors are competitively based around processing much of the
region’s agricultural and raw material output; accessing input goods and
services via efficient transport linkages; and exports from the region.”
AlpValleys Agribusiness Profile 2004
Page 7 of 188
Shire Profiles
For the purpose of this study, the six shires of the study area have been assessed for agricultural production, agribusiness industries and the contribution of agribusiness to
the shires economic base.
For each shire, a brief overview is provided, along with key commodity production data and major agribusinesses within the shire.
An assessment of the direct and indirect contributions of agribusiness to each shire, including multiplier effects and employment impacts, is summarised in the section of
this report entitled Agribusiness Employment and Regional Impact (page X).
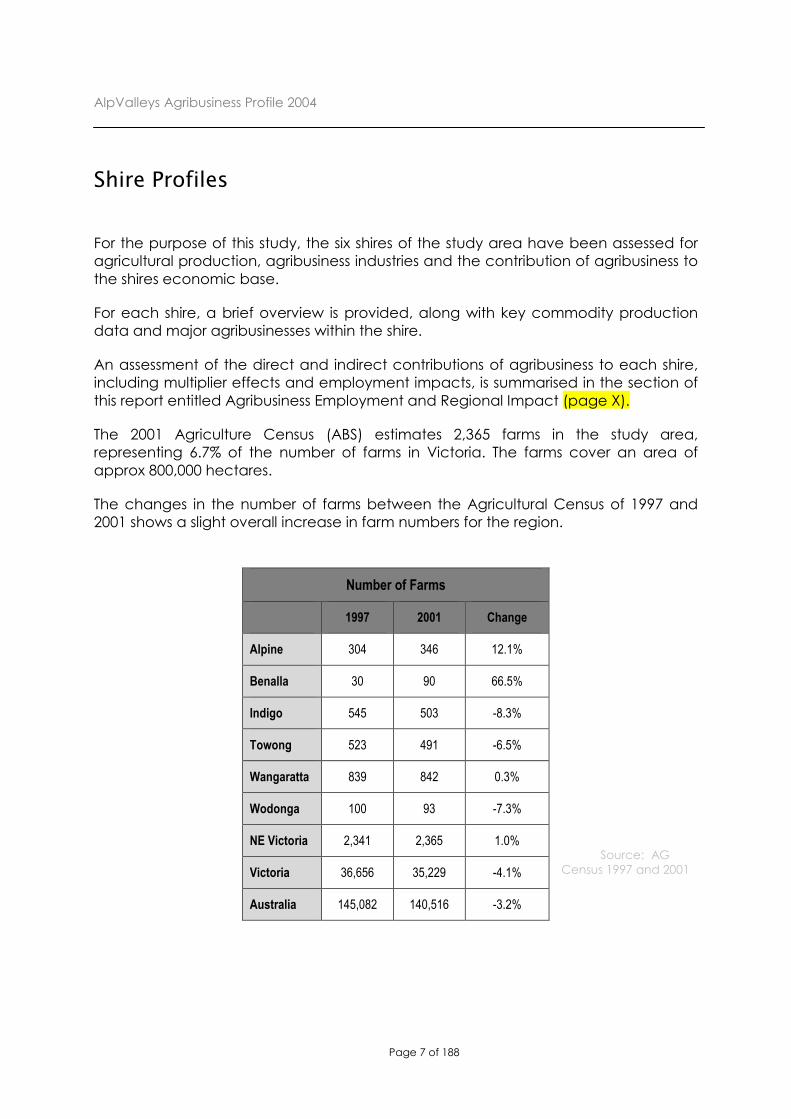
The 2001 Agriculture Census (ABS) estimates 2,365 farms in the study area, representing 6.7% of the number of farms in Victoria. The farms cover an area of
approx 800,000 hectares.
The changes in the number of farms between the Agricultural Census of 1997 and 2001 shows a slight overall increase in farm numbers for the region.
Source: AG
Census 1997 and 2001
Number of Farms
1997 2001 Change
Alpine 304 346 12.1%
Benalla 30 90 66.5%
Indigo 545 503 -8.3%
Towong 523 491 -6.5%
Wangaratta 839 842 0.3%
Wodonga 100 93 -7.3%
NE Victoria 2,341 2,365 1.0%
Victoria 36,656 35,229 -4.1%
Australia 145,082 140,516 -3.2%
AlpValleys Agribusiness Profile 2004
Page 8 of 188
Alpine Shire
Alpine Shire has a diverse industry base covering manufacturing, agriculture, retail, property and business services, health and community services, and accommodation and restaurants4.
Alpine Shire has a population of 13,067 people (ABS, 2001) and is located about 270km from Melbourne, and 70km from Albury/Wodonga.
The major towns in the Shire are Bright, Myrtleford, Mount Beauty and Dinner Plain.
The Shire boasts a number of natural features including the Bogong High Plains, The Kiewa Valley, Ovens Valley and Buffalo River Valley. The Shire also contains some of
Victoria’s major ski resorts at Mt Hotham and Falls Creek, and supports key tourism products such as the Murray to the Mountains Rail Trail and the Great Alpine Road.
.
Service industries account for 40% (or 2,030 people) of those employed.
“Goods producing industries” of agriculture, manufacturing and construction
provided 31% of employment (or 1,690 people). “Goods related services” of wholesale and retail trade, transport and storage
accounted for 18.7% of employment (1,004 people). Timber logging and processing are important activities for the shire, with significant
saw milling facility at Myrtleford, and substantial soft wood timber plantations throughout the shire.
Horticulture and viticulture are significant and expanding activities. Alpine Shire dominates the study area in the production of:
• raspberries and strawberries (62%) The number of farms in 2001 was 346, or 14.6% of the farms in the study area.
The gross value of agriculture production in Alpine Shire is $54 million (ABS 2001). This is an increase of 19.6% on the 1997 GVP of $44.5 million.
4 Source: ABS 2001 and Alpine Shire Information Paper, the Regional Economy (June 2003)
AlpValleys Agribusiness Profile 2004
Page 9 of 188
Using national multiplier effects for agriculture, hunting and fishing (ABS), it is estimated that the total effective contribution of agribusiness to the economic base of Alpine Shire is $142.1 million, with direct employment of 664, and a total
employment impact of 1,218.5
Alpine Shire Key Figures:
Agriculture contribution to economic base $55.4 million
Multiplier effect $86.7 million
Total effect $142.1 million
Employment generated Direct Multiplier effect
664 554
Total employment impact 1,218
Source: AG Census 2001
Agribusinesses located in the shire include:
5 Note: this does not include forestry
Alpine Produce Anapurna Winery
Australian Chestnut Company Australian Hop Marketers Carter Holt Harvey
Gapsted Winery (Victorian Alps Wine) GFM Meats
Greenfreight Hancock Plantations
Hotham Freight John Rouse Transport Michelini Wines
Tobacco Growers Cooperative
Contact:
Dave Barry Economic Development Officer Alpine Shire Council
Phone: 03 5755 0555
AlpValleys Agribusiness Profile 2004
Page 10 of 188
Benalla Rural City6
Benalla Rural City is located approximately 170 km north of Melbourne, and has an area of 2,353 square kilometres.
The population is 14,071 persons according to the 2001 ABS census. The major urban area is Benalla, with about 8,500 people. Township settlements throughout the municipality are Baddaginnie, Devenish, Goorambat, Lima, Lurg, Molyullah,
Swanpool, Tatong, Thoona, Warrenbayne and Winton.
Manufacturing and retail trade are the largest employment sectors in Benalla. The top five industry sectors by employment are:
• Wholesale and retail trade 20% • Manufacturing 19%
• Agriculture, forestry and fishing 12% • Health, education and community services 10% • Education 12%
An economic development strategy completed for the former Delatite Shire Council
identified that manufacturing provided the greatest opportunity for future employment. Between the 1996 and 2001 Census periods, the manufacturing industry sector increased significantly by three percentage points. Value adding to
the regions timber is a major element of the manufacturing sector. The gross value of agriculture production in Benalla Rural City Council area is $6.5
million (ABS 2001). This is a contribution of 0.7% of the AlpValleys region agricultural base.
Benalla dominates the study region’s production of mushrooms.
Using the ABS standard multiplier effects for agriculture, hunting and fishing, it is estimated that the total effective contribution of agribusiness to the economic base
of Benalla Rural City is $16.6 million, with direct employment in the sector of 78 persons and a total employment impact of 1437
6 Source: ABS 2001, Victoria in Future 2004, and Benalla Rural City website;
www.benalla.vic.gov.au
7 Note: this does not include forestry or forestry value adding
AlpValleys Agribusiness Profile 2004
Page 11 of 188
Benalla Rural City Key Figures:
Agriculture contribution to economic base $6.5 million
Multiplier effect $10.1 million
Total effect $16.6 million
Employment generated Direct Multiplier effect
78 65
Total employment impact 143
Source: AG Census 2001
Agribusinesses within the shire include: Auldstone Cellars
Fox and Lillie Wool Buyers HJT Vineyards Kelly Country Orchards
Lambkin Products
Mildara Blass – Baileys of Glenrowan
Monsbent Pty Ltd Mt Bruno Orchards
North Eastern Produce Ryan and McNulty MJ Smyth and Sons Seeds
Smith’s of Taminick Tech Wool Trading
Taminick Cellars Wandin Valley Farms
Contact:
Gerry Fitzpatrick Business Development Officer Benalla Rural City Council
Phone: 03 5760 2600
AlpValleys Agribusiness Profile 2004
Page 12 of 188
Indigo Shire
Indigo Shire is located about 270 north east of Melbourne, and borders the Murray River, the Australian Alps and the Municipalities of Wodonga, Wangaratta, Towong, Alpine and Moira.
It is 2,044 square kilometres with a population of 14,716 (ABS, 2001). Towns within the shire include Barnawartha, Beechworth, Chiltern, Rutherglen, Stanley,
Tangambalanga and Yackandandah.
The shire’s economy is strongly influenced by tourism, as well as value adding to the primary products (beef, sheep, dairy, fruit and viticulture).
The Rutherglen area is world renown for wine production. Significant food and dairy processing occurs at Wahgunyah and Tangambalanga respectively.
The eastern parts of the shire are sub-alpine terrain. The western end of the shire is more open and flatter, suitable for broad acre cropping.
Indigo dominates the study area in the production of:
• cropping (51% of AlpValleys production) • olives (66%)
• pears (98%) • pigs (39%)
The number of farms in 2001 was 503 representing 21% of the farms in the study area. This is slightly down from the 1997 figure of 545 farms.
The gross value of agricultural production in Indigo Shire is $59 million (ABS 2001). This is an increase of 20.3% on the 1997 GVP of $47 million.
Using the ABS standard multiplier effects for agriculture, hunting and fishing, it is
estimated that the total effective contribution of agribusiness to the economic base of Indigo Shire is $151.3 million, with direct employment in the sector of 708 persons and a total employment impact of 1,2988
8 Note: this does not include forestry or forestry value adding
AlpValleys Agribusiness Profile 2004
Page 13 of 188
Indigo Shire Key Figures:
Agriculture contribution to economic base $6.5 million
Multiplier effect $10.1 million
Total effect $16.6 million
Employment generated Direct Multiplier effect
78 65
Total employment impact 143
Source: AG Census 2001
Agribusinesses in Indigo Shire include: All Saints Estate Winery
Anderson Winery Baker Brothers Seeds
Bintara Breweries R Buller and Son Campbell Wines
Chambers Rosewood Winery Cofield Wines
Doolans Timber Gehrig Estate Wines Giaconda Wines
Fairfield Winery HiCountry Fruits
Highgrove Orchard Indigo Valley Processors Jones Winery
Morris Wines Murray Breweries
Murray Goulburn Cooperative
Nightingale Brothers Pfeiffer Wines
Premium Chestnuts Australia Lucas Portable Mills Uncle Toby’s
Rutherglen Estates Schmidt Strawberry Winery
Southcorp Snowline Fruits St Leonards Winery
Stanley Apple Juice Stanton and Killeen Wines
Sutherland Smith Wines Taylors Transport Warrabilla Wines
Yackandandah Jam and Preserving Company
Contact:
Tammy Atkins
Economic Development Officer Indigo Shire Phone: 03 5728 8000
AlpValleys Agribusiness Profile 2004
Page 14 of 188
Towong Shire
Towong Shire is situated in the north-east corner of Victoria, 120km east of Albury/Wodonga on the Murray Valley Highway at the headwaters of the Murray River, and about 350 km north east of Melbourne.
The shire is 6,673 square kilometres, with a population of 6,311 (ABS 2001). Towong is the largest shire in the study area, with the lowest population density.
The shire is bordered by the Murray River (upper reaches) and contains the Mitta
Mitta River and the Kiewa River. Dartmouth Dam and Hume Dam are two key water storages for the study area, and are located in the Towong Shire. Fertile river valleys and spectacular scenery are a feature of the Shire.
The major centres are Tallangatta and Corryong with smaller centres of Bellbridge,
Bethanga, Dartmouth, Eskdale, Granya, Koetong, Mitta Valley, Nariel Valley, Tintaldra and Walwa.
The area is traditionally known for its agricultural industry, primarily beef production and dairying. It also supports a strong timber industry. Alternative enterprises include
essential oil production, cropping and seed production. The fastest growing industry in the region is tourism building on a ‘pure’ clean green
image. There has been a concerted effort to build the Shire’s agri-tourism as a key product of the area.
Towong Shire dominates the AlpValleys study area in the production of the more traditional agricultural industries:
• beef (30% of AlpValleys production) • dairy (70%)
• pasture seeds (51%) • forestry (28%)
Until 2002, peppermint production in the shire was 99% of Victorian production and about 60% of Australian production. Production ceased in 2002, but new plantings
have been undertaken during 2004.
Trial plantings of pyrethrum, potatoes for seed production and onion seed production are currently underway. Five years of research has gone into alternative cropping ventures like these. Essential oil plantings are also underway with thyme,
rosemary, lemon balm and lavender being further investigated.
The number of farms in Towong Shire is 491, or 21% of the AlpValleys study area. There has been a decrease in the number of farms since 1997 by 6.5%. Anecdotally, this appears to have been through consolidation of existing farms in the shire.
AlpValleys Agribusiness Profile 2004
Page 15 of 188
The gross value of agricultural production in the Towong Shire was $66.2 million (ABS 2001). This is a 22% increase on the 1997 GVP of $51.9 million.
Using the ABS standard multiplier effects for agriculture, hunting and fishing, it is estimated that the total effective contribution of agribusiness to the economic base of Towong Shire is $169.8 million, with direct employment in the sector of 794 persons
and a total employment impact of 1,4569. In the AlpValleys study area, Towong Shire has the highest agriculture GVP per head of population.
Towong Shire Key Figures:
Agriculture contribution to economic base $66.2 million
Multiplier effect $103.6 million
Total effect $169.8 million
Employment generated Direct Multiplier effect
794 662
Total employment impact 1,456
Source: AG Census 2001
Agribusinesses in Towong Shire include:
9 Note: this does not include forestry or forestry value adding
Upper Murray Seeds Upper Murray Farming Systems Group Walker Sawmills
Whiteley’s transport
Contact:
Aron Van Egmond
Economic Development Officer Towong Shire Phone: 02 6071 5100
AlpValleys Agribusiness Profile 2004
Page 16 of 188
Rural City of Wangaratta
The Rural City of Wangaratta is located in Victoria, Australia and lies 235 kilometres north east of Melbourne and 647km south of Sydney.
The Rural City of Wangaratta’s website10 states that it is “widely recognised as a
municipality that offers a premier provincial lifestyle. The region is famous for world
class wine and gourmet food. It is the gateway to Victoria's major ski fields. With its
spectacular scenery, the region is viewed by tourists as the 'hub' from which to
explore North East Victoria and Southern New South Wales.”
Larger towns within the Rural City boundaries are Everton, Glenrowan, Oxley, Milawa, Moyhu, Peechelba, Springhurst, Whitfield, Whorouly and Eldorado.
The famous gourmet food and wine areas of Milawa and the King Valley are in
Wangaratta Rural City. The Warby Range has good granitic soils, especially suitable for stone fruit production.
Wangaratta is primarily a manufacturing and commercial centre for the north east. Manufacturing strengths are in clothing and textile production, timber processing
and value adding, and wine processing. Several large transport and freight companies are located in Wangaratta. A new green tea processing plant ($15.5 million investment) was opened in Wangaratta in November 2004, processing green
tea produced solely within the Alpine Shire. The employment by industry in 2001 (ABS Census) shows the relative importance of
the manufacturing industry:
• Manufacturing 2,180 persons employed 19.0% of total employment (compared to an average of 13% for regional Victoria)
• Retail trade 1,812 persons employed 15.8% of total employment
• Health and community services 1,457 persons employed 12.7% of total employment
• Agriculture, forestry and fishing 1,211 persons employed 10.6 of total employment
Despite the lower importance of agriculture to the Rural City’s economy, agricultural production in the Wangaratta area has a considerable impact on the AlpValleys
regional production.
10 www.wangaratta.vic.gov.au
AlpValleys Agribusiness Profile 2004
Page 17 of 188
Using 2001 AG census data, Wangaratta was dominant in the following sectors of agricultural production in the AlpValleys region:
• Apiculture (honey) 58% of total AlpValleys production
• Beef 30%
• Blueberries 69%
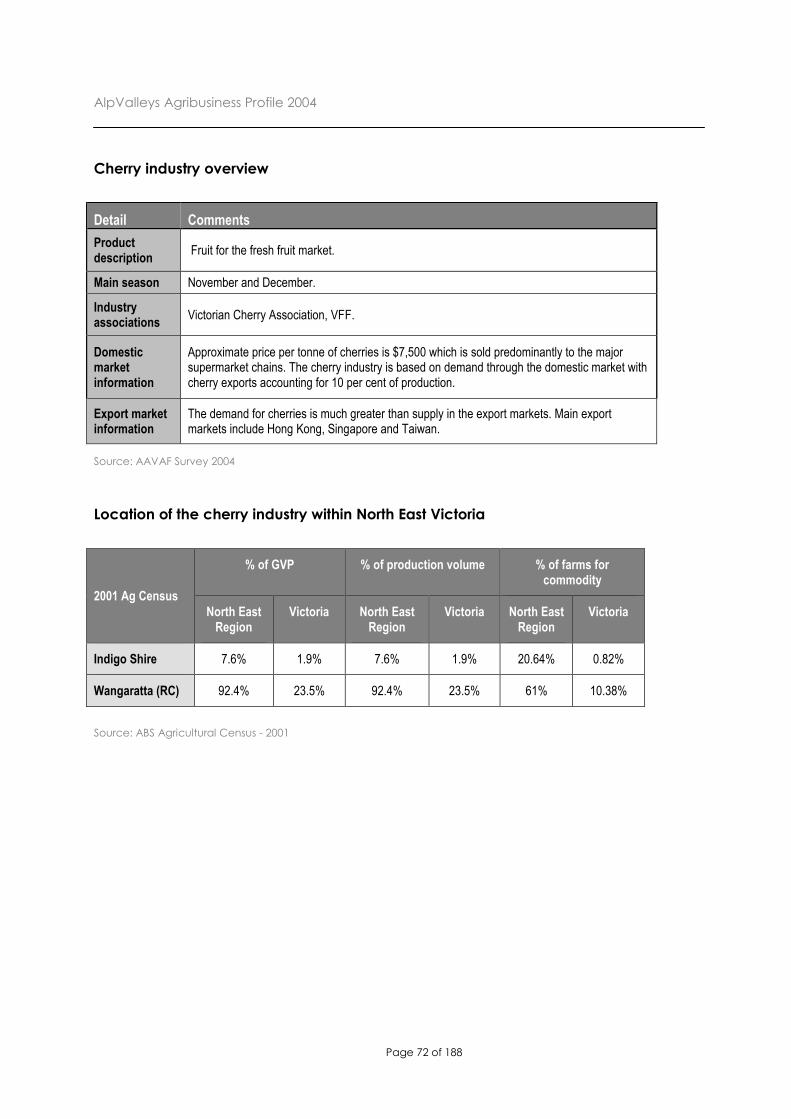
• Cherries 92%
• Citrus 100%
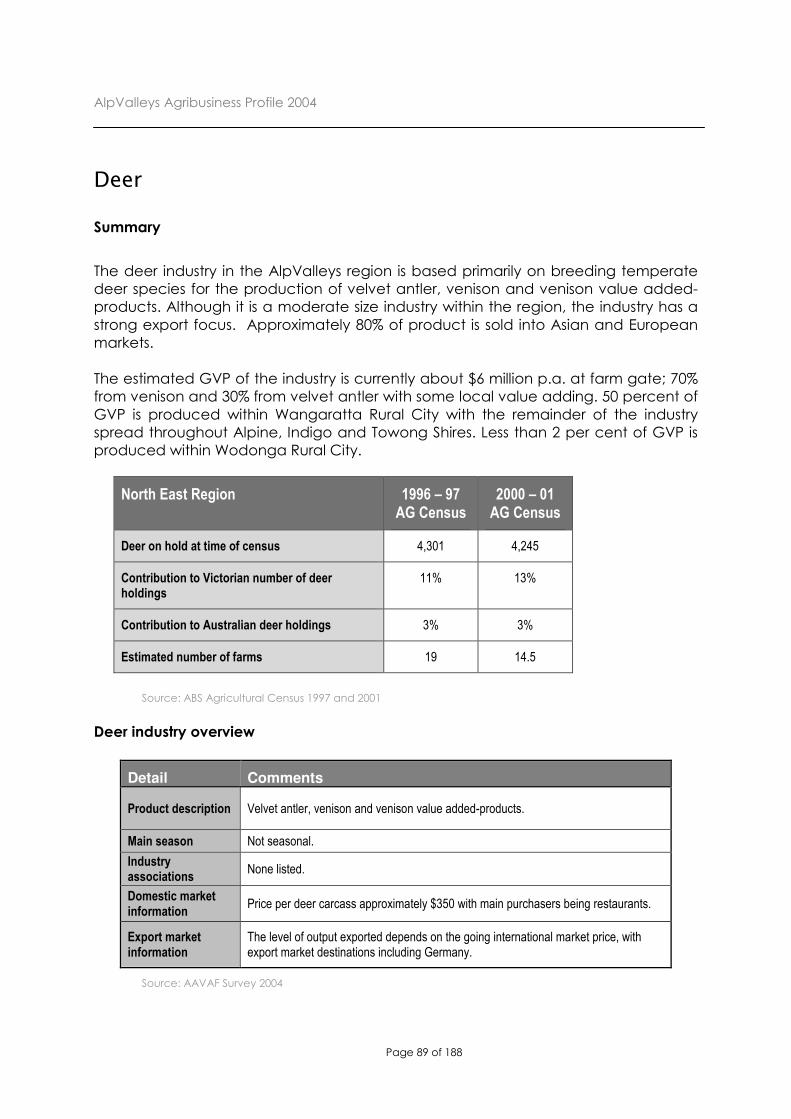
• Deer 50%
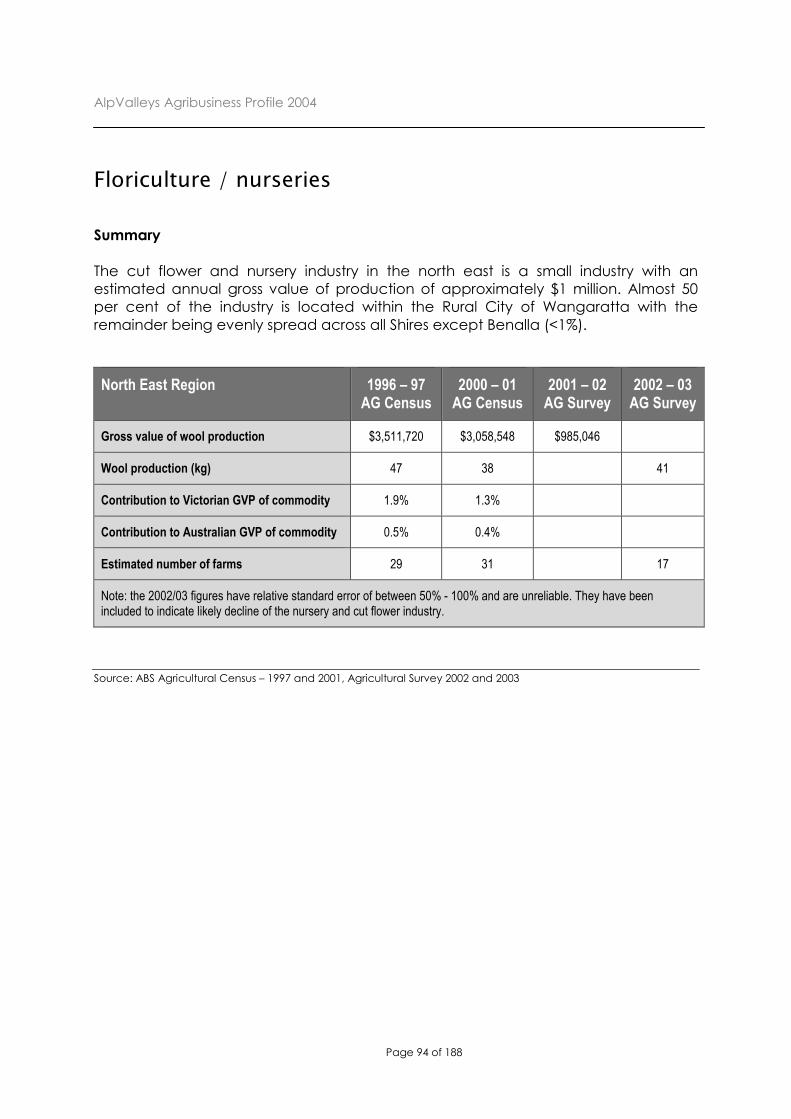
• Floriculture/nurseries 50%
• Herbs (culinary) 100%
• Kiwi fruit 100%
• Hay 35%
• Oilseeds (canola) 32%
• Poultry and eggs 95%
• Sheep and lambs 36%
• Stone fruit 98%
• Wool 38%
There were 842 farms in the Rural City of Wangaratta in 2001, representing 36% of the farms of the study area. The number of farms was only slightly higher than in 1997.
The gross value of agricultural production in Wangaratta is $ 89.1 million (ABS 2001). This is a significant increase by 34% on the GVP in 1997, which was $58.5 million.
Using the ABS standard multiplier effects for agriculture, hunting and fishing, it is
estimated that the total effective contribution of agribusiness to the economic base of Wangaratta Rural City is $228.7 million, with direct employment in the sector of 1,069 persons and a total employment impact of 1,96011
11 Note: this does not include forestry or forestry value adding
AlpValleys Agribusiness Profile 2004
Page 18 of 188
Wangaratta Rural City Key Figures:
Agriculture contribution to economic base $89.1 million
Multiplier effect $139.5 million
Total effect $228.7 million
Employment generated Direct Multiplier effect
1,069 891
Total employment impact 1,960
Source: AG Census 2001
Agribusinesses in Wangaratta Rural City include: Australian Country Spinners
Ross Smith Economic Development Officer Wangaratta Unlimited
Rural City of Wangaratta Phone: 03 5722 0771
AlpValleys Agribusiness Profile 2004
Page 19 of 188
Rural City of Wodonga12
Wodonga is by far the largest centre within the AlpValleys study area. Wodonga has a population of 32,456 (ABS 2001) in a shire area of 433 square kilometres. This also gives the City the distinction of being the most densely populated in the north east at
75 persons per square kilometre. The projected growth rate of 1.7% average per annum is well above the Victorian average.
Wodonga is a major growth centre which serves the whole north east region for jobs
and services. Value adding is a key component of the manufacturing sector, and significant value is added to the timber, beef, dairy, fruit, vegetables, viticulture and
crops of the AlpValleys region.
Manufacturing is the largest industry sector, providing 18.6% of jobs in the City. Other major sectors include:
• Retail sales 14.2%
• Government and defence 12.3%
• Health and community services 11.4%
• Education 11.2%
The local region, including Albury, has 7,000 businesses employing 50,00 people. The
Wodonga workforce is about 17,000 people, with an unemployment rate of 3.8% (2004).
The Wodonga Saleyards have the highest throughput of cattle in Australia. Much of the Alp Valley’s beef production goes through these saleyards.
The Exhibition, Equestrian and Stud Stock Centre is the venue for most of the major
and national breed society shows and sales.
Investment in the manufacturing and processing centre is strong with major projects expected to provide over 4,000 new jobs in the next five years. Recent additions
included a $60 m Visy Industries box manufacturing plant, National Foods Vita Soy plant, and a $90 m Woolworths Distribution Centre. The Woolworths Distribution
Centre will form the basis of a transport and logistics hub – LOGIC, further strengthening to transport and warehousing sectors.
The value of agricultural production within the Wodonga City boundaries is relatively
low in the study area.
12 Source; ABS Census 2001, Victoria in Future 2004, Wodonga Rural City Council
AlpValleys Agribusiness Profile 2004
Page 20 of 188
There were only 93 farms in the Rural City of Wodonga in 2001, representing 3.9% of the farms of the study area. The number of farms was 7% lower than in 1997. This
trend can be expected to continue as residential and industrial developments increase.
The gross value of agricultural production in Wangaratta is $ 9.1 million (ABS 2001). This is a slight increase by 3% on the GVP in 1997, which was $6.8 million.
Using the ABS standard multiplier effects for agriculture, hunting and fishing, it is estimated that the total effective contribution of the City’s limited agribusiness to the
economic base of Wodonga Rural City is $23.4 million, with direct employment generated by the production of 109 persons and a total employment impact of
201.13 These figures demonstrate the limits of using flow-on effects. The figures indicate the extent to which expenditure in the agriculture sector can
flow through the rest of the economy. For both expenditure and employment effects, the flow on effects are not necessarily captured within the local government
economy. Figures used for other shires in this region could indicate flow on effects that may accumulate in Wodonga, Wangaratta, and elsewhere in Victoria, or in, indeed, other states.
Rural City of Wodonga Key Figures:
Agriculture contribution to economic base $9.1 million
Multiplier effect $14.3 million
Total effect $23.4 million
Employment generated Direct Multiplier effect
109 91
Total employment impact 201
Source: AG Census 2001
13 Note: this does not include forestry or forestry value adding
AlpValleys Agribusiness Profile 2004
Page 21 of 188
Agribusinesses in Rural City of Wodonga include: Aussie Woolsulation
Arnolds CFD B&B Joinery Belvoir Sheepskins
Dahlsen’s Timber Supplies Dare’s Fruit and Vegetables
Greenfreight Transport Hume Weir Trout Farm Holloways Timber
Larsen Dairy Systems Australia Lewington’s Transport
National Foods - Vitasoy
Norvic Meat Processing Parmalat Simpson’s Livestock Transport
Wodonga Pallet and Packaging Tumbetin Broad Acre Herbs
Tressider Transport Uncle Ben’s of Australia Wodonga Cold Storage
Woolworths Distribution
Contact:
Economic Development Officer
Rural City of Wodonga
Phone: 03 5722 0771
AlpValleys Agribusiness Profile 2004
Page 22 of 188
Agribusiness Employment and Regional Impact
For the purpose of this study, data on agribusiness employment was sourced from the AAVAF Regional Survey, and the AG Census for 2001.
The gross value of production by shire is summarised below. The total GVP of
agriculture in the AlpValleys region contributes 3.5% to Victoria’s economy.
Region Contribution to the economic base GVP (in $millions)
% of North East % of Victoria % of Australia
Alpine Shire
$55.4
21.2%
0.7%
0.2%
Benalla (RC)
$6.5
0.7%
0%
0%
Indigo Shire
$59.0
22.3%
0.8%
0.2%
Towong Shire
$66.2
24.7%
0.9%
0.2%
Wangaratta (RC)
$89.1
27.8%
1.0%
0.2%
Wodonga(RC)
$9.1
3.2%
0.1%
0%
North East Victoria
$285.2
100%
3.5%
0.7%
This report details labour requirements by industry in the industry profiles, but data
was obtained by survey and interview and was found to be too inconsistent to amalgamate for a regional assessment.
Standard ABS multiplier figures were applied to 2001 ABS data by industry. The calculation indicates the flow on effect of expenditures in the AlpValleys region.
Given that these figures are based on calculations, it is advisable to use them with appropriate caution.
However, using the ABS 2001 data, the contribution of agriculture to the regions
economic base is $731.9 million. The following table indicates the contribution of agriculture to the economic base of
the region, and the employment generated.
AlpValleys Agribusiness Profile 2004
Page 23 of 188
Region
Contribution to the
economic base
($millions)
Multiplier effect
($millions)
Total effect ($millions)
Employment generated
Direct Multiplier effect
Total employment Impact
Alpine Shire 55.4 86.7 142.1 664 554 1,218
Benalla (RC) 6.5 10.1 16.6 78 65 143
Indigo Shire 59.0 92.4 151.3 708 590 1,298
Towong Shire 66.2 103.6 169.8 794 662 1,456
Wangaratta (RC) 89.1 139.5 228.7 1,069 891 1,960
Wodonga (RC) 9.1 14.3 23.4 109 91 201
North East Vic 285.2 446.7 731.9 3,423 2,852 6,275
Additionally, the Prospect Consulting Study undertaken for Plantations North East
(2002) showed a gross value of production of $246 million for the forest industry study area ins not directly comparable, being larger than the AlpValleys region.
The following table demonstrates the timber industry employment derived for the AlpValleys area, from the Prospect Consulting Report.
Municipality
Aggregate Employment
% Timber of Industries
Timber Industry Total All Industries
Forestry and Logging
Wood and Paper Manufacturing
Alpine 106 441 4,465 12.3
Delatite 68 314 7,090 5,4
Indigo n.p 21 4,307 -
Towong 94 n.p 1,689 -
Wangaratta 59 35 10,339 0.9
Wodonga n.p 31 11,193 -
Source: ABS Catalogue 9941.0, September 1998
AlpValleys Agribusiness Profile 2004
Page 24 of 188
Employment figures are not published (n.p) when fewer that five business locations are in a particular shire. However, the employment figures are aggregated and included within the total employment numbers.
Based on this table, the employment in the timber industry is most to employment in the Alpine Shire.
The North East Wine Zone Industry Report (2003) shows a total economic contribution
by the wine industry of $244.6 million, with 698 full time jobs.
AlpValleys Agribusiness Profile 2004
Page 25 of 188
Land Use
The North East Catchment Management Authority covers a similar footprint to the
study area. The North East Regional Catchment Strategy states that approximately 55% of the region consists of public land, wilderness areas, nature reserves, plantation
forests (on long term lease to the private sector for softwood production), crown land and Alpine resorts. The remaining land is privately owned.
Land Use Area
Hectares %
Broad acre cropping and crop pasture 91,000 4.6%
Pasture – dryland and irrigated 560,000 28.2%
Horticulture 7,000 0.4%
Remnant native vegetation 171,000 8.6%
Other private land 9,000 0.4%
Public Land 1,1000,000 55.5%
Forestry – softwood plantations 41,000 2.1%
Total 1,979,000 100%
Source: North East Regional Catchment Strategy (2002)
Land useMap to be inserted (awaiting DPI)
There are 2,365 farms (ABS 2001) in the AlpValleys region, covering a total area for
829,000 h.a. The North East Regional Catchment Strategy shows that livestock grazings the
primary agricultural pursuit by land area, and that pastures represent more than half of the regions agricultural land.
AlpValleys Agribusiness Profile 2004
Page 26 of 188
Freight
AlpValleys Agribusiness Profile 2004
Page 27 of 188
Agritourism
Tourism makes up one of the three focal industries for the economy of the North East region. The strength of the industry is underpinned by the vast number and variety of
natural assets, along with the diverse agricultural and forestry base, which combine to create a strong regional economy.
The link between the tourism and agriculture industries exists within North East Victoria
through typical avenues such as wineries, and to a lesser extent, farm tourism. These existing links and emerging opportunities can be further investigated and promoted
to farmers and tourism operators within the region, to increase the earning capacity of farmers and further strengthen the economic base of the region.
This section will provide an overview of the trends of visitors to the region in terms of
the number of tourists to the region between 1999 and 2004, followed by an analysis of current activities undertaken by domestic day trip visitors and their possible link to the agricultural industry.
Finally, the movement towards establishing agritourism within regional areas is discussed, and insights provided into the opportunities and challenges the
development is likely to unleash to farmers of the region.
The trend in tourism visitation for the region
The National Visitor Survey (NVS) conducted by Tourism Australia is the key indicator of domestic inbound tourism activity, at all regional levels across Australia. A time
series analysis has been conducted for the six regions and for the North East as a whole to provide an insight into the most popular tourist regions of the area, and the relative proportions of each.
Table XX(2) compares North East Victoria with the whole of Victoria for the number of visitor nights spent in the region, and the number of day trips to the region
undertaken by domestic visitors.
The North East region share of visitor nights for the state total has held constant at between 5% - 6% between 1999 and 2004. Actual numbers for both the state and
the region also remained constant, at between 2.76 and 3.09 million for the North East, and between 51.91 and 57 million for Victoria.
Day trip visitation to the region as a proportion of total day trips within Victoria was a constant 4% between 1999 and 2001, while actual day trip numbers followed the same trend within the three year period. In 2002, day trip numbers declined for both,
but more heavily for the region as it took only a 3% share of the total for the state.
AlpValleys Agribusiness Profile 2004
Page 28 of 188
The latest results, June 2004 show North East Victoria has increased its share of day trip number for the state to 6%, which appears the result of an increase in actual numbers for the region by 281,000 over the year. This is despite the total number for
the state declining by 2.42 million for the same period. This recent increase represents a positive indication of the current relative strength of the tourism industry of the region.
Table 1. Comparing domestic visitation numbers of the region with
Victoria
Year Ending:-North East
VictoriaVictoria
NE as % of
Vic Total
North East
VictoriaVictoria
NE as % of
Vic Total
June-99 2,958 55,372 5% 1,094 27,581 4%
June-00 3,089 51,908 6% 1,271 28,856 4%
June-01 2,726 54,575 5% 1,183 27,531 4%
June-02 3,154 55,272 6% 782 24,525 3%
June-03 2,815 57,001 5% 1,066 24,779 4%
June-04 2,828 55,826 5% 1,347 22,359 6%
Visitor nights (in 000's) Day trips (in 000's)
Source: Tourism Australia – National Visitor Survey & MacroPlan Australia
Table 3 shows day trip visitation broken down by the six local government areas within North East Victoria. The most popular destination of the region across the time
series is consistently Wangaratta at between 28% and 37% of the total.
Alpine Shire was the second most popular destination except for the year ending
June 2001 (only 10%), when otherwise it held between 20% and 25%. Indigo Shire followed with a share of between 12% and 24%. Wodonga and Benalla held similar proportions of between 6% and 18%. The Shire of Towong attracted a marginal
proportion of the region’s day trip visitors, ranging from between 2% and 9% for the 6 year period.
Table 2. Time series of North East Victoria regions by day trip visitor
numbers
Sum of day trip visitors (in '000s)
number % number % number % number % number % number %
North East Victoria 1,094 100% 1,271 100% 1,183 100% 782 100% 1,066 100% 1,347 100%
Jun-99For year ending:-
Jun-04Jun-02Jun-00 Jun-03Jun-01
Source: Tourism Australia – National Visitor Survey & MacroPlan Australia
AlpValleys Agribusiness Profile 2004
Page 29 of 188
Table XX(4) displays the number of visitor nights stayed within each of the six local government areas, and serves to highlight those regions that attract longer term stays from tourists as a result of activities and accommodation available.
The Alpine Shire dominates the number of visitor nights stayed within the region, averaging at 50% of the total across the six-year time frame. This corresponds with the diversity of tourism activities on offer, higher level of promotion of the region as a
tourist destination and amenities available to tourists such as quality commercial accommodation. The Alpine Shire has a broad range of activities available to visitors,
and is clearly the tourist drawcard of the region in terms of attracting longer-term visitation.
Table 3. Time series of North East Victoria regions by visitor nights stayed
Sum of visitor nights (in '000s)
number % number % number % number % number % number %
North East Victoria 2,958 100% 3,089 100% 2,726 100% 3,154 100% 2,815 100% 2,828 100%
Jun-99 Jun-00 Jun-01 Jun-02 Jun-03 Jun-04For year ending:-
Source: Tourism Australia – National Visitor Survey & MacroPlan Australia
Activities undertaken by day trip visitors
The NVS results were also used to determine what types of activities are currently popular amongst day trip visitors to the region. This will enable links to be established between the tourism and agricultural industries to identify agritourism opportunities
for the region. The survey groups all activities under broad categories that include:
• outdoor and nature
• sports / active • arts / heritage / festival • local/tourist attractions
• social and other day trip activities
The following breakdown of activities was undertaken by grouping certain regions together on the basis of the number and type of tourists attracted, and by grouping smaller tourist destination regions to ensure the statistical validity of the data
extracted from the NVS. Alpine Shire, being the drawcard of the region was analysed on its own, while the remaining regions were grouped into two as Wangaratta and
Benalla, and Indigo, Towong and Wodonga.
AlpValleys Agribusiness Profile 2004
Page 30 of 188
Comparison of Figures 1, 2 and 3 highlights the similarities and differences of types of activities undertaken on day trips to the three defined grouped regions. Social activities form the basis of most activities undertaken across all grouped regions,
particularly for Indigo, Towong and Wodonga (68%). Alpine Shire – Day trip activities for year ending June 2004
Alpine Shire - visitor day trip activities
Social
53%
Outdoor / nature
18%None of these
3%
Arts/ heritage /
festival
4%
Sports / active
12%
Local / tourist
attractions
10%
Source: Tourism Australia – National Visitor Survey & MacroPlan Australia
Figure 1. Wangaratta & Benalla – Day trip activities for year ending June 2004
Wangaratta & Benalla - visitor day trip activities
Arts/ heritage /
festival
3%
Sports / active
5%Outdoor / nature
8%None of these
24%
Social
55%
Local / tourist
attractions
5%
Source: Tourism Australia – National Visitor Survey & MacroPlan Australia
AlpValleys Agribusiness Profile 2004
Page 31 of 188
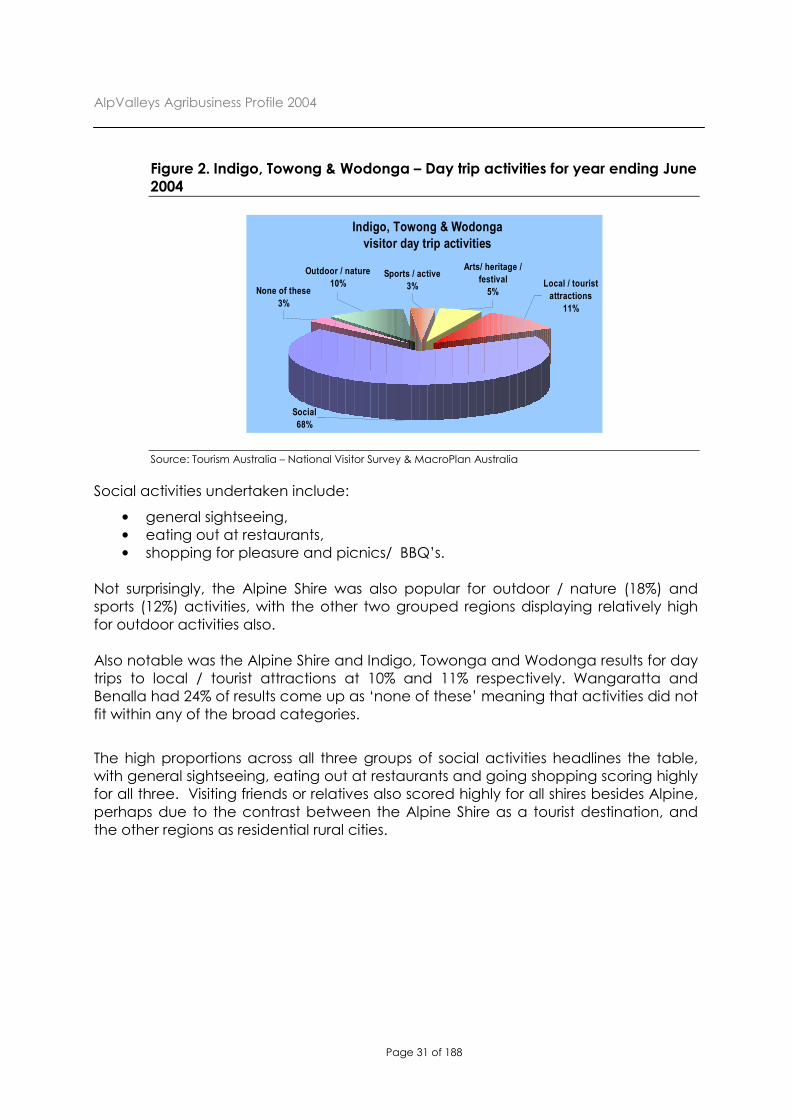
Figure 2. Indigo, Towong & Wodonga – Day trip activities for year ending June
2004
Indigo, Towong & Wodonga
visitor day trip activities
Social
68%
Local / tourist
attractions
11%
None of these
3%
Outdoor / nature
10%Sports / active
3%
Arts/ heritage /
festival
5%
Source: Tourism Australia – National Visitor Survey & MacroPlan Australia
Social activities undertaken include:
• general sightseeing, • eating out at restaurants, • shopping for pleasure and picnics/ BBQ’s.
Not surprisingly, the Alpine Shire was also popular for outdoor / nature (18%) and sports (12%) activities, with the other two grouped regions displaying relatively high
for outdoor activities also.
Also notable was the Alpine Shire and Indigo, Towonga and Wodonga results for day trips to local / tourist attractions at 10% and 11% respectively. Wangaratta and Benalla had 24% of results come up as ‘none of these’ meaning that activities did not
fit within any of the broad categories.
The high proportions across all three groups of social activities headlines the table, with general sightseeing, eating out at restaurants and going shopping scoring highly for all three. Visiting friends or relatives also scored highly for all shires besides Alpine,
perhaps due to the contrast between the Alpine Shire as a tourist destination, and the other regions as residential rural cities.
AlpValleys Agribusiness Profile 2004
Page 32 of 188
Table 4. Day trip activities undertaken by domestic visitors to North East
Victoria
Number % Number % Number %
General sight seeing 182 20% 48 6% 136 13%Eat out at restaurants 169 19% 183 22% 213 20%Go shopping (pleasure) 120 13% 94 11% 141 13%Visit national parks or State parks 50 6% 20 2% 17 2%Picnics or BBQs 48 5% 40 5% 32 3%Visit friends and relatives 48 5% 120 14% 227 21%Bushwalking or rainforest walks 45 5% 15 2% 44 4%Visit wineries 45 5% 12 1% 54 5%Pubs clubs discos etc 29 3% 30 4% 17 2%Visit botanical or other public gardens 29 3% 18 2% 9 1%Skiing 27 3% - 0% - 0%
Other outdoor activities (e.g. horse riding, rock climbing,
Visit history, heritage buildings sites or monuments 23 3% - 0% - 0%None of these 15 2% 154 18% 17 2%Exercise, gym or swimming at a local pool, river or creek 14 2% - 0% 10 1%Visit art or craft workshops or studios 12 1% - 0% - 0%Going to markets (street, weekend or art craft) 11 1% 0% 5 0%Go to the beach (including swimming) 8 1% 0% 0%Attend an organised sporting event - 0% 26 3% - 0%Attend festivals or fairs or cultural events - 0% 22 3% 19 2%Go fishing - 0% 11 1% 10 1%Go on guided tours or excursions - 0% 17 2% - 0%Play other sports - 0% 9 1% - 0%Visit farms - 0% 7 1% 11 1%Visit industrial tourism attractions (eg breweries mines) - 0% 3 0% 20 2%Visit museums or art galleries 0% 0% 15 1%
Water activities / sports (e.g. sailing, windsurfing, kayaking,
water skiing, white water rafting etc.) - 0% 6 1% 10 1%
Total day trip activities 898 100% 849 100% 1,062 100%
Day trip activity (in 000's)Alpine Shire Wangaratta & Benalla Indigo, Towong & Wodonga
Source: Tourism Australia – National Visitor Survey June 2004
Certain tourist day trip activities that featured for the year ending June 2004 relate either directly or indirectly with the agricultural industry of the region. Those
highlighted in ascending order of activity undertaken include ‘visiting wineries’, ‘going to markets’, ‘visit farms’ and ‘visit industrial tourism attractions’. These results
confirm the presence of direct and indirect agritourism within the region, and provide a basis for further enhancement and promotion of the region in terms of identifying and harnessing those agritourism opportunities.
The promotion of agritourism within the region
The term ‘agritourism’ has been coined from agricultural tourism and is used to describe the link between the tourism and agricultural industries, which can be defined as recreational travel undertaken to agricultural areas to participate in
agricultural activities. It generally relates to tourists visiting or staying on farms to experience rural life and or learn about different farming activities, and represents a
potential source of supplementary income to farmers. More broadly, it is also used to describe a host of different rural experiences whether active or passive in the farming experience.
AlpValleys Agribusiness Profile 2004
Page 33 of 188
Examples of Agritourism include, but are not limited to the following:-
Direct
� Farm visits � Longer-term farm stays
� Farm-related bed and breakfast � Tours throughout a farming region
� Agricultural fairs and festival (B & B) accommodations
Indirect
� Retail sales of locally-grown produce � Restaurants serving regional cuisine
� Farmers' markets
The Shires and Rural Cities within the North East attract tourists and visitors for
different purposes and activities, and the tourist drawcards of each need to be recognised and harnessed for their potential involvement with the diverse agribusinesses of the region. The Alpine region for example is known for its
national parks and ski destinations and as discussed attracts longer term visitors to the region – which could be harnessed into agritourism
opportunities through farm day trips and overnight stays.
North East Victoria is home to such a broad mix of agricultural pursuits that would serve to sustain a year round farm tourism industry. The seasonality of
peak periods in agriculture and tourism could serve to compliment each other through agritourism to the benefit of the economic base of the region,
by overcoming the lull periods of each. Agritourism can be marketed across many segments of the community, from school groups to city couples – to ensure an ongoing and sustainable flow of visitors is attained.
According to a report on Agriculture and Nature (Eco) Tourism conducted in March 2002 for the Albury Wodonga Regional Tourism Forum, there is a
demand for more farmers to provide all-inclusive farm stays for domestic and overseas visitors who wish to have a real Australian farm experience. Self-contained accommodation on farms for Australian families is also in
demand.
Tourism represents a service industry, and is clearly different to the business of farming. Therefore, planning, researching and training should be undertaken
prior to commencing an agritourism business. Some areas for considerations for developing agribusiness include:-
For the collective region
AlpValleys Agribusiness Profile 2004
Page 34 of 188
� Consult with State government departments, farm industry tourism associations,
tour companies, visitor information centres and local tourism associations to
learn about the opportunities available and required marketing / promotion.
The Department of Agriculture in Victoria for example was interested in
developing agritourism while Tourism Victoria may also include it in a future
marketing strategy
� Combine forces with existing tourism bodies such as North east Valleys Food and Wine, Albury Wodonga Regional Tourism Forum, Tourism Victoria and local
council tourism arms, to work towards establishing the sub industry
� Consult with local councils on what public amenities are required as
infrastructure for agritourism visitors - such as suitable shelter for tour groups,
public toilets etc.
� Conduct workshops and information sessions on agritourism, highlighting the
benefits to the farmer and providing relevant examples of success stories
� Create a support network for the farmers involved in agritourism and develop a
standardised strategic marketing plan and manual for potential entrants to the
industry
For the individual farmer
� Network with existing operators to find out the time and effort involved in
undertaking the type of activity they wish to pursue
� Consider the seasonal nature of agricultural activity– determine how the
tourism operation can effectively be incorporated into the core farming
business
� Investigate marketing costs and develop a business and marketing plan
� Consider the implications of loss of privacy and disruption to family and farm
life
� Look into the extension of existing public liability policy required to become an
agritourism operators
� Location and Access to the property – is it suitable for different types of visitors?
� Consult with the Department of Small Business for a broad overview of what is
involved in setting up a tourism operation
The Agriculture and Nature (Eco) Tourism report identified the burgeoning olive
industry of the Murray as an example of a potential source of agritourism, that could involve holding festivals to celebrate harvesting, olive walkabouts, cooking
demonstrations, pickling classes, olive oil schools, marketing products such as soaps, creams etc.
AlpValleys Agribusiness Profile 2004
Page 35 of 188
Real life examples of agritourism initiatives both in rural Australia and overseas, relevant to North East Victoria include:-
� ‘Tizzana’ - Blue Mountains, NSW
Tizzani is a unique agribusiness located on the doorstep of Sydney and within easy reach of the famous Greater Blue Mountains World Heritage Listed Area and the magnificent Wollemi Wilderness. Situated in the historic Hawkesbury,
Tizzani offers a complete agritourism experience with its own vineyard, olive grove and five star bed and breakfast accommodation.
� NSW State Government initiative:-
The New South Wales Government has committed $2 million towards promoting the outback culture and its unique tourism experience. The far
west of NSW is traditionally known for its mining and agriculture, is now home to some of the State's most flourishing tourism enterprises. To assist the growth
of tourism, the state government has targeted agritourism as one main areas for future development.
The NSW Government recently conducted workshops on agritourism and
developing a regional property stay network. These workshops were run by industry professionals and established farm stay owners, and covered
practical topics on how to get started as a agritourism operator. The workshops were held in Bourke, Condobolin and Euston. As a result of the workshops, a significant number of participants indicated serious interest in
setting up farm stay properties as a result of attending these workshops. The Government has also assisted the community of Lockhart to develop a brochure promoting the town as an agritourism centre.
� Capital Country Agritourism Network project – NSW:-
Capital Country is located between Canberra and Sydney and is one of the
oldest established areas in the country, and contains a fascinating mix of heritage towns and villages. To further enhance the tourism potential of the region, the Federal Government’s Department of Transport and Regional
Services (DOTAR) funded the application for a Capital Country Agritourism Network project worth $61,600.
AlpValleys Agribusiness Profile 2004
Page 36 of 188
� Agritourism in New Zealand:-
Farm stays are popular in New Zealand, so much that interested visitors can make arrangements to stay with farm families through a central reservation
number on short notice. Farmers all across the country are also actively involved in coalface marketing of New Zealand products, such as a farm tour of a kiwi orchard or feeding of deer raised for foreign export markets.
� Ag-Tourism in Hawaii – ‘from farmer to visitor’
Hawaii places a strong emphasis on developing its ‘Agtourism’ industry,
which it considers to be inclusive of regional cuisine, rural culture and agriculture. Besides its obvious tourism industry, Hawaii is renowned for its agricultural products such as coffee, macadamia nuts, flowers and tropical
fruits. The Hawaiian government views agritourism as a sustainable contribution to the agricultural industry. Visitors to the island are increasingly
interested in learning about the region they are visiting, and agritourism offers them a unique opportunity to look behind the scenes at local traditions and farming practices.
AlpValleys Agribusiness Profile 2004
Page 37 of 188
Regional SWOT Analysis
AlpValleys Agribusiness Profile 2004
Page 38 of 188
AlpValleys Agribusiness Profile 2004
Page 39 of 188
Industry ProfilesIndustry ProfilesIndustry ProfilesIndustry Profiles
Alpacas
Summary
The alpaca industry in the AlpsValley Region had a GVP of $321,000 for the 2003/04
financial year (based on survey responses). In the regional context it is a small contributor to the agribusiness economy.
Although it is developing in the region but is most often a secondary activity to other
farming. No major strategic advantages or opportunities, which would project the industry into a major contributor in the region, have been identified.
The Victorian Eastern Region has the largest membership of Alpaca Breeders in the Australian Alpaca Association. Within the North East region, there are approximately 20 growers/breeders distributed evenly throughout.
Generally 80 % of alpacas are in herds of less than ten animals. Many owners are small breeders who want to be part of a young, new industry.
Industry overview
Detail Comments
Product description
The alpaca industry in the North East is currently in a phase of breeding with the intention of developing a fibre industry from alpaca fleece production. It is a farming activity that can be conducted complementary to primary farming activity such as beef livestock, or on a large scale as the sole agribusiness activity if the producer is well educated and has the correct setup and contact network.
Main season Not seasonal.
Industry associations
Australian Alpaca Fibre Ltd, Australian Alpaca Association (AAA), Australian Alpaca Fibre Marketing Organisation (AAFMO).
Domestic market information
The average per unit price last financial year was $8,000 per alpaca. Main purchasers include other breeders and new generation farmers.
Export market information
Around 5% of total output for Alpaca farmers surveyed was exported to New Zealand, at the same domestic price of $8,000.
Source: AAVAF Survey 2004
AlpValleys Agribusiness Profile 2004
Page 40 of 188
Projected alpaca industry growth
Source Indicator Comments
Surveys
Current profitability The larger establishments reported very high profitability, while those on a smaller scale reported very low profitability.
5 year business plans No change.
5 year business outlook
Business outlook varied depending on the size of the Alpaca farm. Larger farms stated their outlook was very good, while smaller scale producers that farmed alpacas as a secondary activity stated a satisfactory outlook.
Business planning / budgeting Business planning varied from no planning to planning for the next 2 to 3 years.
Age of producers Ranged from 40 to 59.
Capital expenditure 2002-03 financial year
None.
Source: AAVAF Survey 2004
Alpaca Industry labour requirements
Detail Comment
Estimate of labour employed directly As a small scale industry, it was noted that usually owners were not fully employed in the business. Survey responses indicated that 2 casual employees were recorded for the seasons of spring and winter for a large scale producer.
Areas of indirect employment Transport contractors are used on occasion.
Labour market issues It appears that there is limited requirement for labour beyond casual positions in spring and winter. Education in fleecing is vital to the quality of alpaca fibre produced.
Source: AAVAF Survey 2004
AlpValleys Agribusiness Profile 2004
Page 41 of 188
Alpaca industry marketing activities
Source Detail Comments
Surveys
Marketing undertaken Marketing is mostly done through the growers’ networks and associations.
Value adding activities
As part of the Australian Alpaca Fibre Limited (AAFL) cooperative, some producers in the region undertake the manufacturing of clothing and household goods.
Labels and brands ‘Uniquely Alpaca’, ‘Australian Alpaca’.
There is a very strong market for alpaca product both in Australia and internationally. Supply falls well short of demand. Australia has already developed past the cottage
industry stage and now has the facilities and infrastructure in place to value-add to the local clip.
Taxes, rates and charges
Taxes, rate and charges
None stated other than council rates.
Alpaca industry strategic advantages and opportunities
• The long-term prospects of the Australian alpaca industry will depend on the production and marketing of a high value fibre, which meets processors and consumers requirements. Australia's alpaca industry has a herd of
approximately 30,000, the largest Alpaca herd outside of South America.
• A growing industry with a relatively strong support network at a national level.
• Survey comments regarding the advantages of alpaca farming in North East Victoria included the good climate of the region and proximity to major markets such as NSW.
Alpaca industry strategic disadvantages and impediments to growth
• Education is a key concern for the industry as a whole, as being able to assess and prepare alpaca fibre is becoming increasingly important, due to animal
values being increasingly tied to the quality of their fleece.
• There is now both a demand and a need for specialised training in alpaca
clip preparation.
• The AAA provides training sessions in every state for members sporadically, and is looking to increase these services.
AlpValleys Agribusiness Profile 2004
Page 42 of 188
Apiculture – honey and pollination services
Summary
Honey and associated processing is the largest product class from apiculture in the
North East region (see Table below), however pollination services are increasing in significance for apiculturalists. Dry conditions and recent fires in the North East have significantly reduced honey production. A reduction in suitable forest types as a
result of the fires will continue to affect the industry.
Whilst there are about 20 commercial honey producers, the industry mainly consists
of small individual producers, marketing on the back of the region’s clean and green image, and appealing to the tourist and passing traffic trade.
Producers are generally older persons with minimal recruitment of new producers.
North East Region 1996 – 97 AG Census
2000 – 01 AG Census
Gross value of production $890,127 $1,158,494
Contribution to Victorian GVP of commodity 11.2% 16.6%
Contribution to Australian GVP of commodity 1.8% 3.1%
Estimated number of farms - -
Source: ABS Agricultural Census – 1997 and 2001
AlpValleys Agribusiness Profile 2004
Page 43 of 188
Apiculture industry overview
Detail Comments
Product description
Honey, beeswax, live bees (queen and package bees), pollen, royal jelly, and pollination services for horticultural crops within the region. Estimates of the production of honey in the region are complicated by the transient nature of the industry.
Main season Not seasonal however slower months of the year are May, June, July and August depending on the producer.
Industry associations
Crop Pollination Association (Victoria) Victorian Apiarist Association North East Apiarist Association Australian Honey Bee Industry Council Honey Packers and Marketers Association National Council of Pollination Associations Australian Queen Bee Breeders Association Federal Council of Australian Apiarists Associations
Domestic market information
Ranges from between $3 to $4 per kilogram, or approximately $4,500 per tonne. Main purchasers of honey include manufacturers / honey packers and the general public through gate sales and markets.
Export market information
Those surveyed stated their produce was not exported to the best of their knowledge, however honey manufacturers may export for international retail markets.
Source: AAVAF Survey 2004
Location of the apiculture industry within AlpValleys region
Approximately 20 growers considered commercial/mainstream (having more than
200 hives) are located in the Benalla, Wangaratta and Chiltern areas. There are considerably more beekeepers within the North East region contributing to honey production who are amateur beekeepers (1 to 40 hives).
Honey production across the North East is expected to significantly increase in the next five years due to greater demand for pollination services. An estimated 17% of honey produced in Victoria was generated in the North East, placing the region in a
good position for securing a share of the forecast industry growth.
Concurrently, farm gate prices for honey have also significantly risen over the past 2 years with the dry conditions contributing to a 100 % increase in the gross value of
production (although actual production volume data is not provided by ABS).
Source Indicator Comments
(ABS) AG Census and survey data
Growth in production volume 1997 to 2001
Production data unavailable.
Current profitability Ranged from satisfactory to low.
5 year business plans Reported mainly as no change, with one producer planning to increase production slightly and expand pollination services by 100%.
Surveys
5 year business outlook Ranged from good to satisfactory.
Business planning / budgeting
Formal planning undertaken varied from no planning, to 1 year plans, to 5 year plans.
Age of producers Ranged between the age brackets of 40 to 59 years.
Capital expenditure 2002-03 financial year
Represented between 38% and 60% of gross income, and ranged between $64,000 and $80,000.
The sustainability of the industry includes access to native flora and competition in both export and domestic markets. With many of the hives in the North East on State
reserves and forests there is likely to be greater pressure to use Crown land.
The industry within the region needs to maintain its competitiveness and comparative advantage as a supplier of high quality honey.
AlpValleys Agribusiness Profile 2004
Page 45 of 188
Apiculture industry labour requirements
Apiculture industry marketing activities
Beekeepers in Northeast Victoria tend to sell most of their honey to one single packer. A number of producers may sell to independent packers in their immediate
locality.
Taxes, rates and charges paid
Taxes, rate and charges
Farmer's Market fees, licence fees on public land, research levy on honey production (Federal).
Detail
Labour requirements, if any, are low and tend to be limited to part time and casual employment of between 1 to 2 employees per farm. A more centralised approach to production has seen a slight increase in casual labour employed in the region centred on the towns. Approximately, the number of people employed within the industry is 50 persons. The majority of honey production in the region occurs between September and April.
Areas of indirect employment
Suppliers, transport providers, buyers - manufacturers.
Labour market issues
Labour costs make up between 0% and 25% of total costs of those beekeepers
responding to the survey.
Detail Comments
Marketing undertaken
Is usually by the producer to promote their brand within the region and encourage gate sales using farmgate signage, and advertising (on occasion) in local papers.
Value adding activities
Bottling and labelling of honey - particularly for gate sales, and mead production.
Labels and brands Walkabout Apiaries, Whitehead's Mead, Beechworth Honey
AlpValleys Agribusiness Profile 2004
Page 46 of 188
Apiculture industry strategic advantages and opportunities
• Central to a variety of floral sources and pollination crops.
• Position in prime tourist area and proximity to highway/transport infrastructure.
• Access to forest sites and usually a reliable rainfall zone.
• Honey production will increase in the next five years because of increased
demand for pollination services. Pollination will continue to be critical to the GVP of many horticultural enterprises within the region and indeed the state. The impetus for more bees is being supported by research, which has found
crop yields can be improved by 15 to 20 percent as a result of pollination.
Apiculture industry strategic disadvantages and impediments to growth
• Lack of knowledge and training for replacement beekeepers or assistants, i.e.
formal qualification. The aging of current beekeepers without any sign of new generation beekeepers entering into production.
• Entry of new growers affected by lack of information in respect to physical,
financial and socio-economic characteristics of honey production.
• Competing with imported product in the retail market.
• Access to unburnt bee sites. The damage to Peppermint Blue Gums and other
eucalypts from the recent bushfires in the North East will continue to impact on the industry for the next ten years.
• Adverse seasonal conditions – particularly the recent years of low rainfall. This has lead to some beekeepers in the region turning to various value adding and subsidiary activities such as pollination services and mead production in
National Workshop on Economic Viability of the Australian Beekeeping Industry (HBRDC, 1991) - various papers relating to production costs.
Investing in Commercial Honey production: The 4th. Mansfield report (1996), Tamworth branch, NSWAA
Gibbs M.H. & Muirhead, I.F. 1998 The Economic Value and Environmental Impact of
the Australian Beekeeping Industry
AlpValleys Agribusiness Profile 2004
Page 48 of 188
Apples
Summary
Apples are a significant industry within the Alps Valley region, having over $11 million in GVP.
Over two thirds (66%) of the industry in the North East is located within Alpine Shire whilst 33% is contained within Indigo Shire. Apple growing takes place in the
Buckland, Wandiligong, and Stanley areas as well as the Ovens Valley. There are approximately 16 growers. Victoria is the major grower of apples and pears in
Australia. In 2003 it produced 36 per cent of Australia's apples and 87 per cent of the nation's pears.
The main varieties of apples grown in the North East during 2003 were Pink Lady (26% of total tree numbers), Granny Smith (16%), Galas (14%) and Delicious (10%). Most
farms are characterised as a family owned and operated business with up to date, medium density, first-class orchards.
Recent trends have seen smaller family-farming entities exiting the industry and the amalgamation of orchards into larger specialised enterprises. The industry has a positive outlook although affected by national crop trends and exposure to world
markets. Labour availability and peri urban development are the main issues facing the industry.
North East Region 1996 – 97 AG Census
2000 – 01 AG Census
2001 – 02 AG Survey
Gross value of production $10,074,304 $8,157,137 $11,027,666*
Production volume (kg) 9,637,716 7,196,330 8,611,375*
Total number of trees 231,108 243,551
Contribution to Victorian GVP of commodity 8.1% 8%
Contribution to Australian GVP of commodity 2.7% 2.9%
Estimated number of farms 19 16
Source: ABS Agricultural Census 1997 and 2001, Agricultural Survey 2002
* ABS Advises that Relative Standard Error (RSE) between 25 – 25%: use data with caution
AlpValleys Agribusiness Profile 2004
Page 49 of 188
Apple industry overview
Source AAVAF Survey 2004
Most orchards in the region are owner operated, and many growers have other enterprises on their properties. These will include other horticultural crops such as
cherries and other stone fruits and complementary livestock enterprises based on availability of suitable land.
Production is highly concentrated within the growing areas with estimates that the largest establishments account for over half the production, and that 75% of production comes from 25% of orchards.
Apple growers in the region have adopted more sustainable orchard management practices through the implementation of a system called Integrated Fruit Production
(IFP). The main focus of IFP is to balance crop production with safeguarding of natural vegetation and biodiversity in the regions orchards. Issues such as orchard nutrition, weed control and irrigation are managed in such a way so as to ensure
there is a minimal impact on the environment.
The growers in the region operate under continual competition from domestic and international markets and in recent years they have been affected by lower grower
returns due to a higher national crop level and a greater exposure to world market developments.
Detail Comments
Product description Apples for the fresh fruit market, with some juice production.
Main season March to May.
Industry associations Northern Victorian Fruitgrowers Association, Australian Fresh Fruit Co., Australian Pear and Apple Ltd, Victorian Apple and Pear Growers Council, Australian Pome Fruit Improvement Program.
Domestic market information
Price received by growers is approximately $25 per 12 kilogram box, though price received varies heavily on the variety of apple.
Export market information
Those surveyed stated that none of their apples were exported.
AlpValleys Agribusiness Profile 2004
Page 50 of 188
Location of the apple industry within North East Victoria
Source: ABS Agricultural Census - 2001
Projected apple industry growth
Source Indicator Comments
(ABS) AG Census and survey data
Growth in production volume 1997 to 2001
Production of apples for the North East region has remained fairly constant between 1997 and 2002. There was a 25% decline between 1997 and 2001, however a recovery increase of 20% was noted in the 2002 ABS AG survey.
Surveys
Current profitability Stated as relatively low.
5 year business plans Stated no change in plans.
5 year business outlook Stated as very good.
Business planning / budgeting
Those surveyed conducted formal business plans / budgets for the long term - 5 years plus.
Age of producers Unknown.
Capital expenditure 2002-03 financial year
Represented up to 35% of gross income.
2001 Ag Census
% of GVP % of production volume % of farms for commodity
Labour requirements are for most of the year for thinning, pruning and packing, with large numbers of casual labour required for the picking season (approximately 2 months). Nightingale Brothers Wandiligong Apple & chestnut orchard employ 28 fulltime persons and 260 persons during harvest and seasonal labour periods.
Areas of indirect employment Suppliers, transport providers, buyers - namely cooperatives.
Labour market issues Finding and maintaining sufficient numbers of casual labour at picking time proves an ongoing issue for apple growers.
Apple industry marketing activities
Detail Comments
Marketing undertaken
Most regional growers have established private marketing arrangements. They also use agents nationally as well as supply local wholesalers and retailers. Some individual growers conduct their own marketing activities such as print media, brochures, gate sales and signage.
Marketing activity through local farmer markets is also used in conjunction with growers own farm marketing or collective regional grower marketing. The Hume Murray Food Bowl farmers market is also an important form of direct marketing.
Value adding activities
Producers engage in value adding activities such as packaging and juicing of apples.
Labels and brands
Snowline Fruits (not unique to apples),Alpine Apples, HiCountry Fruits
Taxes, rates and charges paid
Taxes, rate and charges Levy funds collected from growers on sales of apples (1.53 cents/kg) and pears (1.64 cents/kg) are managed by the apple and pear Industry Advisory Committee (IAC). The funds are used for marketing, market promotion and research and development programs.
AlpValleys Agribusiness Profile 2004
Page 52 of 188
Apple industry strategic advantages and opportunities
• Integrated Fruit Production (IFP) is aimed at providing Victorian apple producers with a competitive edge in the export market. The program
provides growers with a “clean, green” international marketing advantage and is used as a key benchmark for quality in many countries growers will currently or potentially export to. Major export opportunities for the industry are
for Pink Lady and Sundowner apples.
• The opportunity to work with the tourism industry is a desire of some producers
in the region, perhaps through the development of agritourism operations.
• The climate, aside from recent drought conditions, allows for production of a superior product.
Apple industry strategic disadvantages and impediments to growth
• Recent weather conditions that resulted in a poorer quality of produce.
• Urban encroachment and lifestyles impacting on the right to farm.
Contacts
HiCountry Fruits
Henry Hilton Main Road Stanley, 3747
Phone: 03 5728 6584 Northern Victoria Fruitgrowers' Association Ltd
Apple & Pear Australia Limited. Strategic Plan Review: Annual Investment Priorities
2005/06 Horticulture Australia Ltd. Apple and Pear Industry Report 2003-04
AlpValleys Agribusiness Profile 2004
Page 54 of 188
Aquaculture
Summary
There are 6 producers in the north east region. Predominantly, salmonid species
(trout) are being grown in stream fed outside production. One producer is growing Murray Cod, and another is producing Australian Blackworms in shedded production for both the aquaculture and aquarium trade.
The industry is characterised by high levels of value adding at the individual farm level with operations commonly incorporating both production and tourism.
Key areas for production of Salmonid species in Victoria are in the shires neighbouring the southern boundaries of the AlpValleys region – Mansfield and Seymour. Estimations of the current gross value of production of salmonids in Victoria
is $10.66 m.14
Production has decreased in the AlpValleys region over the past few years due to increased licensing and water fees, smaller operators exiting the industry and one
farm burnt out during the 2002 bushfires.
14 Hugh Meggit, pers.comm
North East Region
1996-97 AG Census
2000-01 AG Census
2001-02 AG Survey
Gross value of production n/a n/a $ 1.5 - 2.0 m
Current production volume (measurement in brackets)
n/a n/a 200 (tonnes) 2004
Total area of production n/a n/a Production area
Approx 9.2 ha
Contribution to Victorian output of commodity
n/a n/a Approx
Contribution to Australian output of commodity
n/a n/a Approx 40%
AlpValleys Agribusiness Profile 2004
Page 55 of 188
Aquaculture industry overview
Product description
The industry produces fresh table trout, fresh table salmon, frozen and smoked product, value added fresh trout and salmon products and agri-tourism fish out activities.
Main season N/A
Industry associations
Victorian Trout Association, The Australian Trout and Salmon Farmers. Association, Victorian Warm Water Aquaculture
Domestic market information
97% produced for the domestic market.
Export market information
3% of product exported.
Source: AAVAF Survey 2004
Location of the aquaculture industry within North East Victoria
Two trout farms are in the Alpine Shire, one at Edi Upper in the Wangaratta Council, one in the Towong Shire. Two aquaculture producers are in the Indigo Shire
producing Murray Cod at Brimin (near Rutherglen) and Australian Blackworms at Beechworth.
Projected aquaculture industry growth
The industry in the region features a high level of value adding on both intensive commercial small-scale farms and smaller integrated tourist ventures. Assuming that
the worst of the recent drought conditions pass, a projected growth rate of 5% is achievable.
The trout and salmon growers are developing best practice environmental
management strategies to make certain minimal environmental impact occurs to the freshwater ecosystems within the catchments.
Environmental improvements and sustainable industry expansion, will continue through the use of high quality extruded feed diets, computer managed feeding, and investment in waste reduction technologies
The aquaculture industry is poised for rapid, sustainable expansion through achieving ecologically, socially and economically sustainable industry practices, implementing environmental management systems and further expansion of value-adding
activities.
AlpValleys Agribusiness Profile 2004
Page 56 of 188
Trout farms need high volumes of good quality cold water. Minimal amounts of land are required, around 10 hectares with access to cool pristine quality flow-through water. A constant flow of water is maintained through the races, and recirculating
water does not usually clean the water enough, and pumping tends to be too expensive. After passing through the trout farm the water is discharged as effluent back into the same waterway.
Aquaculture industry labour requirements
Usually, a trout and salmon aquaculture enterprises employ 1 owner/manager and 1 other person with some seasonal/holiday casual labour hours.
Aquaculture industry marketing activities
The wholesale and retail network for farmed trout usually involves the sale of the product by the farmer to a wholesaler, the fish market or to frozen food distributors, or
directly to the local hospitality industry.
Small trout farmer enterprises can obtain better prices by developing local niche markets with restaurants or supermarkets, currently quoted at $7.50 per kg. On-farm sales to tourists, incorporating catch and eat, can increase prices to between $8.50
and $9,00 per kg. Value adding is done through smoking, or pate production.
Aquaculture industry strategic advantages and opportunities
• The North East has a reputation for clean and healthy aquatic environments with good running water supply. This image fits well with a perception of high quality fish from a “clean” environment
• Most farms are integrated, doing their own breeding, growing, processing and smoking of fish. Value adding is high.
• Opportunities for expansion include supplying disease-free stock to supply future farms expanding the range of value-added products and new national
and export markets.
• Opportunities for use of recycled water will need to be explored.
Aquaculture industry strategic disadvantages and impediments to growth
AlpValleys Agribusiness Profile 2004
Page 57 of 188
• Small farmers may have to co-operate with processing and transport to make trout farming a viable option.
• Restrictions on water diversion and the environmental constraints on discharge
may impact on further increases in production.
• Difficulty accessing greater volumes of water to increase production.
• The regions trout industry is competing with other significant trout and salmon
production and processing facilities in adjoining shires. Strong domestic
competition has streamlined production efficiency.
• The major impediment to further development is the limited water resource, and stringent conditions on water condition. Aquaculture operators are now required to have a consumptive use licence, not a diversion licence as
previously required.
AlpValleys Agribusiness Profile 2004
Page 58 of 188
Beef and Veal
Summary
The beef industry is the 3rd largest contributor of GVP to the Alps Valley region with a
herd size of approximately 345,000, and total GVP of $105.6 million (see Table below). Beef operations in the Towong Shire and Wangaratta Rural City contribute approximately 30% each of the total GVP derived from beef. Indigo Shire is the next
largest generating approximately 20% of GVP. Regional producers supply store cattle to feedlots, as well as to abattoirs. The beef industry also has significant indirect
employment benefits through meat processors, brokers and buyers, livestock agents, grain providers and transport service providers.
The Alp Valley region is seeing a fragmentation of larger herds as lifestyle producers
increase within the industry. However, it is estimated that about 20% of producers still control about 80% of cattle numbers.
North East Region 1996 – 97 AG Census
2000 – 01 AG Census
2001 – 02 AG Survey
2002 – 03 AG Survey
Gross value of production ($) (cattle and calves slaughtered)
$62,424,005 $105,661,837 $123,254,010
Current size of herd (no of cattle) 315,729 315,730 344,632 294,517
Contribution to Victorian GVP of commodity 9.42% 9.60%
Contribution to Australian GVP of commodity
1.84% 1.64%
Estimated number of farms 1,948 1,839 1,753 1,753
Source: ABS Agricultural Census – 1997 and 2001, Agricultural Survey 2002 and 2003
AlpValleys Agribusiness Profile 2004
Page 59 of 188
Industry overview
Source: AAVAF Survey 2004
Location of the industry within North East Victoria
Source: ABS Agricultural Census - 2001
Detail Comments
Product description
Fresh meat for local and export market, offal
Main season The majority of survey respondents stated the main season as being over spring and summer.
Industry associations
VFF, Meat Standards Australia, Australia Meat Holdings, Meat and Livestock Assoc, Beef Improvement Assoc, Murray Grey Beef Cattle Society, Beefcheque.
Domestic market information
The price per head of cattle reported ranged from between $400 - $850. Per kilogram of meat the range was between $1.40 - $5.50. The main destinations of beef from the region are the Melbourne, Sydney and Wodonga Saleyards.
Export market information
Quite a large proportion of beef from the region is exported overseas, with producers stating between 50% to 95% being exported. Export destinations include Japan, USA, Malaysia, Iraq, China, South Korea and Italy.
2001 Ag Census
% of GVP % of production volume % of farms for commodity
North East Region
Victoria North East Region
Victoria North East Region
Victoria
Alpine Shire 11.4% 0.2% 10.2% 1.3% 13% 1.40%
Benalla (RC) 2.9% 0.0% 4.4% 0.6% 3% 0.39%
Indigo Shire 20.4% 0.3% 17.3% 2.2% 21% 2.37%
Towong shire 30.3% 0.5% 33.7% 4.4% 23% 2.59%
Wangaratta (RC) 29.5% 0.5% 29.9% 3.9% 35% 3.91%
Wodonga (RC) 5.5% 0.1% 4.6% 0.6% 4% 0.47%
AlpValleys Agribusiness Profile 2004
Page 60 of 188
Projected beef industry growth
Source Indicator Comments
(ABS) AG Census and survey data
Growth in production volume 1997 to 2001
Production levels between 1997 and 2001 were relatively constant.
Surveys
Current profitability 12.5% reported high profitability, 30% satisfactory, 32.5% low and 25% very low profitability.
5 year business plans
45% stated no change in plans, 32% planned to increase production / improve beef quality, 7% wanted to change from leasing their land / running an agistment to running their own herd, 7% wanted to change from running their own herd to running an agistment, 6% wanted to switch to other products, and 3% wanted to decrease production.
5 year business outlook
Producers overall were quite optimistic about the future, with 34% stating a good outlook, 52% satisfactory and only 14% as poor. No respondents stated a very poor or very good outlook.
Business planning / budgeting
50% conducted a formal business plan or budget with an even spread planning for 1 year, 2-3 years and 5 years in advance.
Age of producers 36% of producers were aged between 40 - 49 years, 24% between 50 - 59, and 40% stated being over 60 years of age.
Capital expenditure 2002-03 financial year
The average capital expenditure as a percentage of gross income was a high 72%, with expenditure ranging from as low as $10,000 for smaller farms, to $410,000.
AlpValleys Agribusiness Profile 2004
Page 61 of 188
Beef industry labour requirements
Beef industry marketing activities
Taxes, rates and charges paid
Taxes, rate and charges
Council rates, Bovine Johnes Disease fees, National Livestock Identification Scheme tags, water licence / permits, Dept of Health certificates, chemical users licence, Cattle Care audit, Cattle Transaction Levy
Detail Comments
Estimate of labour employed directly:- (based on 46 survey responses)
Full time 11 (between 0 and 4 full time employees required depending on the size of the operation)
Part time 5 (between 0 and 2 part time employees required)
Casual 63 (between 0 and 12 casual employees required)
Areas of indirect employment
Meat processors / abattoirs and manufacturers, brokers / buyers (supermarket, feedlots), stockyards / sale yards, livestock agents, grain providers, transport service providers.
Labour market issues
Casual employment is the predominant form of employment offered by producers, with the main seasons being spring, summer and autumn depending on the producer. Some farmers stated difficulty in finding experienced casual labour.
Detail Comments
Marketing undertaken
Most producers rely on their produce being marketed by their livestock agents or buyers. Larger scale operations initiate their own marketing such as web, print media, brochures and signage. Direct marketing opportunities also exist at open days, farm expos and shows.
Value adding activities
18% of respondents stated they were involved in value adding activities. These activities involved the butchering and packaging of beef for consumers, with one respondent operating their own butchers to sell their meat direct to the public.
Labels and brands Snowy Mountain Tender Meat, King Valley Beef.
AlpValleys Agribusiness Profile 2004
Page 62 of 188
Beef industry strategic advantages and opportunities
� The North East is viewed by producers as being a good central location
to the major markets of Melbourne and Sydney and to cattle sale yards.
� Proximity to major road networks and good transport linkages to saleyards, suppliers, and freighters is also viewed as advantageous to
beef producers.
� Excellent soils and moderate climate, usually high and predictable rainfall
in comparison to other regions and a permanent water supply with adequate irrigation. One beef producer stated the region was “one of the safest farming and rainfall areas in the country with good access to
strong regional centres”.
� Versatility of land use and diversity of farming activities undertaken within
the region.
� ‘Clean and green’ image of region.
� An increased emphasis on government and farming industry support for
beef farmers.
Beef industry strategic disadvantages and impediments to growth
� High cost of operation, and capital investment required as land values and beef cattle prices both increase (can be a barrier to new entrants).
� Security of export markets given the high volume of beef that is exported from the region, and also the threat of beef imports on the strength of the domestic market.
� Current size of farms limits the opportunity for expansion, along with dramatic land value increases due to rural living subdividing farmland
into smaller hobby farm lots.
� The aging of beef producers within the industry and the difficulty in obtaining experienced labour – particularly casual labour.
� Perceived lack of farming skills amongst lifestyle farmers is causing concern about weed management, disease management and overall
risk management.
� Continuing future decline of US dollar and increase of Australian dollar
� Some beef producers stated lack of knowledge as a concern. Particular
areas that were identified as education opportunities include pasture and water management, improving herd genetics and maintaining
The gross value of production for berries, comprising blueberries, strawberries and raspberries, is approximately $1.7 million per annum for the AlpValleys region. Berry production is spread throughout Alpine and Indigo Shires and Wangaratta Rural City
and its location is dependent upon the berry type.
There is a shift toward a smaller number of growers producing larger volumes of fruit
and creating farm sizes that can be managed as a commercially viable business. Smaller and marginal producers are leaving the industry.
Blueberries
North East Region 1996 – 97 AG Census
2000 – 01 AG Census
Gross value of production $193,720 $864,291
Production volume (kg) 29,000 40,749
Total area of production (ha) 7 9
Contribution to Victorian GVP of commodity 29.6% 27.5%
Contribution to Australian GVP of commodity 2.4% 2.5%
Estimated number of farms 3 6
Source: ABS Agricultural Census 1997 and 2001
Raspberries and strawberries combined
Gross value of production $132,876 $797,785
Production volume (kg) 57,430 71,801
Total area of production (ha) 17 29
Contribution to Victorian GVP of commodity 2.1% 2.0%
Contribution to Australian GVP of commodity 0.5% 0.8%
Estimated number of farms 7 5
Source: ABS Agricultural Census 1997 and 2001
AlpValleys Agribusiness Profile 2004
Page 65 of 188
Berry industry overview
Detail Comments
Product description Fresh and frozen raspberries, blueberries, blackberries, strawberries and other berries, jams, syrups and fruit wines.
Main season November to mid June.
Industry associations Robus Growers Association.
Domestic market information
The main segments of the industry are fresh fruit for market, processed fruit and pick your own fruit.
Export market information
Small scale
Source: AAVAF Survey 2004
Location of the berry industry within North East Victoria
Blueberries
Source: ABS Agricultural Census - 2001
Raspberries and strawberries combined
Source: ABS Agricultural Census - 2001
2001 Ag Census
% of GVP % of farms for commodity
North East Region
Victoria North East Region
Victoria
Alpine Shire 30.9% 8.5% 60% 8.65%
Wangaratta (RC) 69.1% 19.0% 40% 5.85%
2001 Ag Census
% of GVP % of farms for commodity
North East Region
Victoria North East Region
Victoria
Alpine Shire 61.9% 1.2% 50% 1.75%
Indigo Shire 34.7% 0.7% 25% 0.91%
Wangaratta (RC) 3.5% 0.1% 25% 0.91%
AlpValleys Agribusiness Profile 2004
Page 66 of 188
Projected berry industry growth
Source Indicator Comments
(ABS) AG Census and survey data
Growth in production volume 1997 to 2001
Production of blueberries increased from 29 tonnes in 1997 to 40.7 tonnes in 2001 - growth of 41%. Raspberries and strawberries also experienced growth in production of 25% from 57 tonnes to 71.8 tonnes.
Surveys
Current profitability Marginal for all but large producers.
5 year business plans Not specified.
5 year business outlook
Not specified.
Business planning / budgeting
Not specified.
Age of producers Not specified.
Capital expenditure 2002-03 financial year
Not specified.
Berry industry labour requirements
Most growers maintain and manage their production as owner/operators with a few larger growers employing permanent and casual employees. Approximately 130
casual staff are required during harvest.
Berry industry marketing activities
Growers expressed a need to continue marketing product towards replacing imports
of processed fruit, and increasing exports of fresh fruit and products. Co-operative marketing is being used to increase size of supply and certainty of
supply.
Taxes, rates and charges paid
Taxes, rate and charges
Levy paid to Horticulture Australia.
AlpValleys Agribusiness Profile 2004
Page 67 of 188
Berry industry strategic advantages and opportunities
� Export within the industry is occurring on a small scale and potential exists
for co-coordinated growth in fresh fruit export sales. The export of fresh produce is supported by stable prices for the product and a consistent demand. Varieties have been developed that are suited to the rigours of
extended transportation.
� North East Victoria is a location that has an opportunity to provide export fruit in the off-season to the United Kingdom and Europe, and all year to Asia.
� The industry does not currently compete with imported fresh fruit.
� The growers in the region are dedicated to quality assurance and growth and are keen adapt to new technologies.
� The regions “clean, green” environment image lends itself well to the product and is complemented by the health aspects associated with the
consumption of rubus fruit i.e.(antioxidants). � Further opportunity may exist for organic production.
� The industry is investigating varieties that have autumn-fruiting selection,
which ripens at a similar time to the industry’s standard varieties, and another variety that is a late summer-fruiting fruit, which fills a void between summer and early autumn production.
� If this is adapted in the North East region, it may provide a greater ability
for growers to increase the production window. Both offer commercial growers advantages over existing cultivars and will assist regional growers to deliver a more stable supply of quality fruit.
Berry industry strategic disadvantages and impediments to growth
• There is a lack of skilled pickers available during harvest.
• There are problems with post farm gate handling of produce in terms of transportation and perishability. Critical mass is a major factor to achieve cost efficient transport to market.
• Growers believe that there are significant risks associated with rubus
production. As a result there are fewer large enterprises that commit solely to rubus growing. Consequently there is a lack of marketing.
AlpValleys Agribusiness Profile 2004
Page 68 of 188
• The processed rubus fruit market has limited opportunities due to competition from imports and sustainable contract terms of trade. Access to large and cheaper volumes of imported product is available at prices
that local growers cannot sustainably match.
Contacts
Australian Blueberry Growers Association Phone: 03 5967 4413
Australian Rubus Growers Association Inc. Strategic Plan for the Rubus Industry 2000-
2004
AlpValleys Agribusiness Profile 2004
Page 69 of 188
Capsicums, chillies and peppers
Summary
Capsicums, chillies and peppers are a very small industry from a handful of farms within the AlpValleys region. 98 percent of production is within Alpine Shire.
North East Region 1996 – 97 AG Census
2000 – 01 AG Census
Gross value of production $454,206 $1,076,034
Production volume (kg) 446,000 528,478
Contribution to Victorian GVP of commodity 13.30% 22.12%
Contribution to Australian GVP of commodity 1.12% 1.56%
Estimated number of farms 3 2
Source: ABS Agricultural Census 1997 and 2001
Industry overview
Further information is being sort from both Horticulture Australia and the Ovens
Research Station.
Location of capsicums, chillies and peppers
Source: ABS Agricultural Census - 2001
Projected capsicums, chillies and peppers industry growth
Further information required.
2001 Ag Census
% of GVP % of production volume % of farms for commodity
North East Region
Victoria North East Region
Victoria North East Region
Victoria
Alpine Shire 97.8% 21.6% 97.8% 21.6% 52% 1.77%
Wangaratta (RC) 2.2% 0.5% 2.2% 0.5% 52% 1.77%
AlpValleys Agribusiness Profile 2004
Page 70 of 188
Capsicums, chillies and peppers Labour requirements
Further information required
Capsicums, chillies and peppers marketing activities
Further information required
Taxes, rates and charges paid
Taxes, rate and charges
Further information required
Capsicums, chillies and peppers strategic advantages and opportunities
Further information required
Capsicums, chillies and peppers strategic disadvantages and impediments to growth
Further information required
AlpValleys Agribusiness Profile 2004
Page 71 of 188
Cherries
Summary
The cherry industry, within the AlpValleys region is particularly concentrated in Wangaratta Rural City, where over 92 per cent of GVP of approximately $4.5 million is
derived. The majority of the cherry growers are situated in the Warby Range and
Taminick areas. The outlook for the industry is good with
An increase in production of cherries is likely to rise quickly as young trees planted during the last five years come into production. On average, growth has been around 40% between census periods and is expected to be similar in 2004-2005.
Completion of Boywer water pipeline project is to result in a production increase of
approximately 600 tonnes.
North East Region 1996 – 97 AG Census
2000 – 01 AG Census
Gross value of production $2,174,068 $4,486,495
Current production volume (kg) 523,998 726,817
Total number of trees 40,735 65,542
Contribution to Victorian GVP of commodity 26.1% 25.5%
Contribution to Australian GVP of commodity 7.5% 7.5%
Estimated number of farms 21 21
Source: ABS Agricultural Census 1997 and 2001
AlpValleys Agribusiness Profile 2004
Page 72 of 188
Cherry industry overview
Source: AAVAF Survey 2004
Location of the cherry industry within North East Victoria
Source: ABS Agricultural Census - 2001
Detail Comments
Product description
Fruit for the fresh fruit market.
Main season November and December.
Industry associations
Victorian Cherry Association, VFF.
Domestic market information
Approximate price per tonne of cherries is $7,500 which is sold predominantly to the major supermarket chains. The cherry industry is based on demand through the domestic market with cherry exports accounting for 10 per cent of production.
Export market information
The demand for cherries is much greater than supply in the export markets. Main export markets include Hong Kong, Singapore and Taiwan.
2001 Ag Census
% of GVP % of production volume % of farms for commodity
Production grew by 39% or 200,000 tonnes between the 1997 and 2001 census periods..
Surveys
Current profitability Was stated as either high or satisfactory.
5 year business plans Are optimistic with cherry farmers surveyed planning to increase production by between 100% and 150%.
5 year business outlook
Was described as good.
Business planning / budgeting
Surveyed cherry farmers conduct formal business plans / budgets for the long term - 5 years plus.
Age of producers Fell within the 50 to 59 year age bracket.
Capital expenditure 2002-03 financial year
Not stated.
The North East regions volatile spring weathers have over past years plagued the
industry, often sending prices on a significant price spiral. Cooler seasonal October temperatures have at times delayed cherry picking by up to a month and severe
frosts in September have wiped out trees. However, new cherry varieties are being selected for resistance to rain-induced
cracking, a larger size (greater than 25 mm in diameter) and self-fertility. Self-fertile varieties will be more consistent in respect of cropping from season to season. The
market is demanding a more consistent grade of fruit and the introduction of new varieties is seen as being able to provide consistency of production. Trials and research into select varieties that extend the current harvest season either later or
earlier will also help meet fruit demand.
The completion of an 11km pipeline, enabling the Boweya cherry orchard, on Wandin Valley Farm, to access 50 megalitres of water each month for production is a major initiative in commitment to growing in the region. The $750,000 project was
developed to secure additional water resource that was not available from the orchard’s existing water catchment reserve at Boweya. Significant new plantings have resulted.
AlpValleys Agribusiness Profile 2004
Page 74 of 188
Cherry industry labour requirements
Cherry industry marketing activities
Taxes, rates and charges paid
Taxes, rate and charges Growers contribute to a research and development levy through Horticulture Australia Limited, which was a combined $70,455 for 2003-2004 industry wide.
Detail Comments
Estimate of labour employed directly:- (based on 2 survey responses)
Full time 6
Part time 1
Casual 195
Areas of indirect employment
Brokers / buyers (major supermarkets), suppliers, transport service providers.
Labour market issues Large numbers of casual labour is a major requirement of producers for between November and December. Some farmers stated difficulty in finding casual labour, despite the low skills required of labourers.
Detail Comments
Marketing undertaken
Regional growers sell direct from the farm gate, and through the Melbourne, Sydney and Brisbane wholesale markets, and direct to retail outlets. Wandin Valley Farms, near Wangaratta, supplies Coles supermarkets.
Value adding activities
Some minor value adding through cherry wine productions, and drying. Predominately improvement in product.
Labels and brands
Cherrybrook Cherry Farm, Wandin Valley Farms, Hotson’s Cherries.
AlpValleys Agribusiness Profile 2004
Page 75 of 188
Cherry industry strategic advantages and opportunities
� The area around the Warby Ranges is ideal for growing, as cherries
require non-waterlogged soils and a period of winter chilling for the fruit to set.
� The industry maintains a competitive advantage in export and domestic
markets through superior varieties. The development of improved rootstocks and new cherry varieties should provide opportunity for
increased returns to regional cherry growers based on current markets.
� Cherries have potential for greater development in the region if the crop can establish a late season production advantage both within Australia
and overseas.
� Access to infrastructure for transport to market.
� Wandin Valley Farms is one of the top five producers in Australia.
Cherry industry strategic disadvantages and impediments to growth
� Growers find cherries a difficult crop to grow as they are extremely vulnerable to the changes of nature and are prone to many pests.
� The cherry industry grows varieties with three issues that significantly
constrain the ability of the industry to regularly deliver large quantities of high quality fruit to the overseas and domestic markets, i.e. cracking, size and cross pollination.
� Cherries are a capital-intensive industry with establishment costs per hectare varying from $40,000 to $60,000 including trees, irrigation, land preparation and machinery. Additional costs include bird-proof netting,
rain-protective covers, and packing sheds with grading and cool room facilities.
� The availability of seasonal labour for harvesting is becoming an issue and will become more urgent as production levels increase. A shortage of casual labour at picking time being the most significant impediment to
growth.
� Food safety and quality assurance guarantees are increasingly important
to the market, especially European markets. Assurances that fruit have been produced in an environmentally sustainable manner as well as incorporating worker health and safety and waste control.
� Water storage and availability will remain a problem for smaller growers.
AlpValleys Agribusiness Profile 2004
Page 76 of 188
� Access to productive agricultural land for future production of all stone fruits.
� Vulnerability to fruit fly outbreaks in neighbouring centres eg. Wangaratta.
� Access to US markets has been limited for export, however US cherries from California and Washington are imported between May – August.
� Other exports eg. China and Taiwan may open up, but currently tight on quarantine requirements
� Export markets require consistency in product supply with a strong domestic market considered a weakness to export development.
Contacts
Hotson Cherries
Bill and Lois Hoston Old Cemetery Road
Chiltern, 3683 Phone: 03 5726 1358
Wandin Valley Farms Boweya Road
Boweya, 3677 Phone: 03 5765 2257
Cherry Growers of Australia Inc (CGA) Phone: 08 8349 4556 Fax: 08 8349 5316
Horticulture Australia Cherry Annual Industry Report 2002 -2003
AlpValleys Agribusiness Profile 2004
Page 77 of 188
Citrus
Summary
The citrus industry in the AlpValleys region is small and often undertaken as a
secondary farming activity. Almost exclusively the industry is based within Wangaratta Rural City.
North East Region 1996 – 97 AG Census
2000 – 01 AG Census
Gross value of production $175,932 $411,846
Production volume (kg) 316,044 652,915
Total number of trees* 15,538 13,410
Contribution to Victorian GVP of commodity 0.29% 0.59%
Contribution to Australian GVP of commodity 0.05% 0.10%
Estimated number of farms 10 7
Source: ABS Agricultural Census 1997 and 2001
Location of the citrus industry within Alps Valley region
Source: ABS Agricultural Census - 2001
2001 Ag Census
% of GVP % of production volume % of farms for commodity
North East Region
Victoria North East Region
Victoria North East Region
Victoria
Alpine Shire Less than 0.1%
0% Less than 0.1%
0% 17% 0.30%
Towong Shire Less than 0.1%
0% Less than 0.1%
0% 34% 0.59%
Wangaratta (RC) 100% 0.6% 100% 0.7% 50% 0.86%
AlpValleys Agribusiness Profile 2004
Page 78 of 188
Projected citrus industry growth
Source Indicator Comments
(ABS AG Census and Survey data
Growth in production volume 1997 to 2001
Production of citrus in North East Victoria increased by 107% between 1997 and 2001, from 316 tonnes to 653 tonnes. The total number of trees declined for the same period by 14%, from 15,538 in 1997 down to 13,410 in 2001. The increased product output per tree from 1997 is possibly the result of seasonal variation – i.e. weather, plant lifecycle and farm management.
Citrus industry labour requirements
Casual labour seems the only requirement for citrus growers, of between 1-2 per farm.
Citrus industry marketing activities
Detail Comments
Labels and brands
Warby range Non-irrigated Citrus, River Grove.
Taxes, rates and charges paid
Taxes, rate and charges
National citrus R&D levy ($2.00/tonne), Marketing levy ($0.75/tonne).
Citrus industry strategic advantages and opportunities
� Increasing overseas and domestic demand.
� Decreasing wide swings in supply and demand.
� Southern hemisphere position to take advantage of northern hemisphere markets.
AlpValleys Agribusiness Profile 2004
Page 79 of 188
� Expanding markets in Asia due to increasing levels of disposable income
� Freedom from many serious pests and diseases is maintained through Auscitrus budwood scheme.
� Rigorous import quarantine requirements.
Citrus industry strategic disadvantages and impediments to growth
� Lack of regional cooperatives and accessibility to processing facilities.
� Very small volumes of citrus produced compared to other Victorian regions.
� Little firm knowledge of short term and long term supply and demand
relationships and how to control them, leading to wide swings in prices.
� Very little working together between growers, packers and juice
processors.
� Declining base of technical expertise for citrus in research agencies.
Contacts
Australian Citrus Growers (also Murray Valley Citrus Board) 51 Deakin Avenue, Mildura, Vic PO Box 5091
Citrus Industry Advisory Committee. Strategic Investment Plan 2002-2007
AlpValleys Agribusiness Profile 2004
Page 80 of 188
Cropping
Cereals for grain
Summary
Cropping is one of the larger industries undertaken in the region. It is commonly
undertaken in dry agriculture mixed farming systems. Based on availability of suitable land the majority of cropping is undertaken in Indigo Shire and the Rural City of
Wangaratta. The Alp Valleys region does not contain any significant advantages or impediments to cropping and the issues facing the industry are common to the whole of the industry.
North East Region 1996 – 97 AG Census
2000 – 01 AG Census
2001 – 02 AG Survey
2002 -03 AG Survey
Gross value of production $5,344,852 $7,556,085 $7,348,807*
Production volume (tonnes) 9,637,716 7,196,330 32,932* 17,963*
Total area of production (ha) 13,088 14,236 11,571* 12,531*
Contribution to Victorian GVP of commodity 0.7% 0.6%
Contribution to Australian GVP of commodity
0.1% 0.1%
Estimated number of farms 247 158 145 151*
Source: ABS Agricultural Census – 1997 and 2001, Agricultural Survey 2002 and 2003
Cropping industry overview
Cereal grains produced within the region include wheat, oats, barley, rice, millet, corn maize, sorghum and triticale. The majority of farmers surveyed grew cereals in
conjunction with other farming activities such as livestock production.
* ABS Advises that Relative Standard Error (RSE) between 25 – 25%: use data with caution
AlpValleys Agribusiness Profile 2004
Page 81 of 188
Detail Comments
Product description Cereal grains produced within the region include wheat, oats, barley, millet, corn maize, sorghum and triticale. A lot of farmers surveyed grew cereals in conjunction with another farming activity such as livestock.
Main season Predominantly winter crops involving sowing in Autumn – Winter and Sowing in November - January
Industry associations TopCrop, Vic. Farmers Federation,
Domestic market information
As there are no receival centres within the north east, all grain crops are transported outside of the region. Prices change regularly. The major buyers are Graincorp and Cargills.
Export market information
Location of the Cropping industry in the AlpValleys region
Source: ABS Agricultural Census - 2001
Cropping industry labour requirements
The major labour requirement for cropping occurs at harvest time. Contract harvest or casual employees are required and are expected to avarge 1 employee per
farm. Crop receival centres also employ seasonal workers. However there are no receival centres within the North East region.
Cropping industry marketing activities
There is no marketing of grain which is specific to the north east region. Grain accumulation services, GrainCorp and Cargill all market grain without particular reference to the north east.
2001 Ag Census
% of GVP % of production volume % of farms for commodity
Cropping industry strategic advantages and opportunities
� Increased productivity from slightly reduced area.
� Alternate Crops, e.g. linseed.
� Producing high quality feed grain to specification for local feedlots (chicken, beef, lamb, dairy).
Cropping industry strategic disadvantages and impediments to growth
� Climate variability.
� Short growing seasons.
� Peri urban and lifestyle development.
� "Right to farm issues" - tractors, scare guns etc, and operating outside "business hours".
AlpValleys Agribusiness Profile 2004
Page 83 of 188
Dairy
Summary
Dairy farming is a major industry within the AlpValleys region and the 4th largest, based on a GVP over $70 million, on over 1,700 farms in the region. Towong Shire contains the largest component of the industry (37 %) with Indigo Shire, Wangaratta
Rural City and Alpine Shire sharing a further 60%. The industry, whilst strong, is strongly affected by market and climatic conditions.
North East Region 1996 – 97 AG Census
2000 – 01 AG Census
2001 – 02 AG Survey
2203 -03 Ag Survey
Gross value of production ($) (milk) $57,708,741 $69,204,106 $79,828,348*
Volume of Milk Produced (litres) 9,637,716 230,760,667 266,195,718*
Current herd size (number of milk cows) 66,573 73,237 43,958 46,438
Contribution to Victorian GVP of commodity 3.8% 3.5%
Contribution to Australian GVP of commodity
2.1% 2.3%
Estimated number of farms 390 316 1,753 1,723
Source: ABS Agricultural Census 1997 and 2001, Agricultural Survey 2002
Dairy industry overview
Dairy Australia recently completed the Dairy 2004 Situation and Outlook report. The
report made the following key findings for the whole of the diary industry and are relevant to the AlpValleys region:
� The dairy industry has faced enormous challenges in recent years and many farmers are cautious about future prospects
� Cash flows and confidence have been significantly weakened, recovery may be slow
� There are signs of recovery and reasons for optimism
� The external fundamentals of the industry environment are sound
� Many farmers are “watching and waiting” for better seasonal or price conditions
* ABS Advises that Relative Standard Error (RSE) between 25 – 25%: use data with caution
AlpValleys Agribusiness Profile 2004
Page 84 of 188
� It is important for the industry to work together to address the key issues raised in the report
Detail Comments
Product description
Products including milk, cheese, cream, yoghurt, ice cream, butter for local and export markets
Main season Not considered seasonal, though April and May are viewed as slower periods.
Industry associations
Dairy Australia Limited, Australian Dairy Industry Council, Australian Dairy Products Federation United Dairyfarmers of Victoria, Murray Goulburn Co-op.
Domestic market information
Dairyfarmers in the region reported selling a litre of milk from anywhere between $0.20 and $1.30. Milk is transported from dairyfarmers to the Murray Goulburn Co-op where it is processed and distributed.
Export market information
Dairyfarmers reported that a large share of their milk is exported - between 60% and 90%; mainly to Asian countries like Japan.
Source: AAVAF Survey 2004
Location of the dairy industry within North East Victoria
Source: ABS Agricultural Census – 2001
2001 Ag Census
% of GVP % of production volume % of farms for commodity
North East Region
Victoria North East Region
Victoria North East Region
Victoria
Alpine Shire 15.2% 0.5% 14.3% 0.5% 18.0% 0.9%
Benalla (RC) 0.6% 0.0% 0.7% 0.0% 1.7% 0.1%
Indigo Shire 25.0% 0.9% 24.8% 0.9% 22.3% 1.1%
Towong Shire 37.8% 1.3% 37.1% 1.4% 36.8% 1.7%
Wangaratta (RC) 19.6% 0.7% 21.0% 0.8% 18.5% 0.9%
Wodonga (RC) 1.9% 0.1% 2.1% 0.1% 2.7% 0.1%
AlpValleys Agribusiness Profile 2004
Page 85 of 188
Projected dairy industry growth
Source Indicator Comments
(ABS) AG Census and survey data
Growth in production volume 1997 to 2001
Milk production has increased significantly during this period.
Surveys
Current profitability
Responses ranged from satisfactory to very low.
5 year business plans
Some dairy farmers reported no change in plans while others were looking into switching to beef farming, or increasing their current beef herd. Some were also interested in increasing production.
5 year business outlook
Ranged between satisfactory and poor.
Business planning / budgeting
The majority of respondents stated they drafted formal business plans / budgets, mostly for 1 year ahead.
Age of producers Dairyfarmers surveyed were mainly in the age bracket of 50 to 59 years, with a couple either 40 to 49 years or 60 years plus.
Capital expenditure 2002-03 financial year
Ranged from $18,000 to $184,000, and from between 9.7% to 16.8% of gross income.
Those who are the owned larger dairy herd numbers, or who are new entrants or younger generation dairy farmers held a more positive outlook, based on a
combination of reliable seasonal conditions and stable milk pricing, at the time of survey.
Dairy industry labour requirements
Detail Comments
Estimate of labour employed directly:- (based on 46 survey responses)
There seems to be a balance between the number of full time, part time and casual employees required for dairy farming - as a result of the year round work required. Dairy farmers employee between 1 and 4 full time staff, 1 - 2 part time staff and 1 -2 casual staff.
Areas of indirect employment
Murray Goulburn Co-op, suppliers, transport providers, vet care.
Labour market issues The majority of dairy farmers surveyed stated there was a lack of suitable labour within the region to meet their requirements.
AlpValleys Agribusiness Profile 2004
Page 86 of 188
Dairy industry marketing activities
Detail Comments
Marketing undertaken
None was stated, and in fact some dairy farmers stated that none was required, as a result of the Murray Goulburn cooperative being responsible for selling and distribution of milk produced.
Value adding activities
A large percentage of Victorian milk goes to manufacturing and export..
Labels and brands
Murray Goulburn, Devondale, and Gundowring Fine Ice cream.
Taxes, rates and charges paid
Taxes, rate and charges
Australian Dairy Corporation (ADC) Levy, United Dairy Farmers levy, vet costs.
Dairy industry strategic advantages and opportunities
� The North East regions climatic conditions provide for a pasture-based
dairy industry that keeps milk production costs relatively low. The industry in North East Victoria is located in regions that provide a suitable climate
in terms of rainfall being generally predictable for 6 months of the year, providing necessary pasture growth for food supply and on farm storage water availability. Supplementary grain feed costs are also regionally
accessible in market and transport terms, reducing costs associated with these as a farm input.
� Usually good climate conditions, good rainfall and rich soils. Central
location to milk processors such as the Murray Goulburn Coop, and to saleyards.
� Good infrastructure, including sound road network.
� Many producers have direct control over production and manufacturing through their association with co-operatives. In effect, farmers have
access to an efficient production system and processing infrastructure within the region, creating a close connectivity between farm gate and
final product.
� Processing facilities located in the North East region provide a strategic advantage in gaining access to major metropolitan markets through a
well-located and serviced transport infrastructure.
AlpValleys Agribusiness Profile 2004
Page 87 of 188
� Enhancing the skill base of the industry to help maximise farm and resource performance for individuals, and therefore more efficient dairy farms.
� More dairy farmers are opening up land for agistment to beef cattle as opposed to dairy cattle, creating a shift in herd numbers and on farm production as often this practice allows for less intensive land and farm
management practices.
Dairy industries strategic disadvantages and impediments to growth
� Some concerns about low profitability of business due to lack of selling power and the low price received for milk, coupled with rising input costs
such as capital infrastructure requirements, government fees and charges, and vet costs.
� Age of dairy farmers and lack of new generation dairy farmers coming
into the industry.
� Overseas market prices and fluctuating exchange rates affecting
certainty of prices domestically.
� Lack of suitable labour.
� Unfavourable weather conditions over the past few years leading to
water shortages for a number of dairy farmers in the region.
� Increasing price and availability of water for irrigated pasture production.
� Land values are increasing through urban encroachment creating a
demand for “rural lifestyle living”, which in turn makes land acquisition
more costly to the industry.
� The dairy industry is mostly comprised of farming operations that are traditionally structured and managed within the family unit, using little outside labour. This reduces opportunities for generational change and
industry opportunity for younger persons to enter the industry, possibly restricting a “mindset” change toward industry and on farm practices.
� Increasing pressure and costs from the cost of farm business and market
compliance, in such areas as government taxes, rates and charges, on
farm dairy factory quality assurance requirements, animal welfare, animal health and biosecurity requirements. Many farmers are also experiencing
greater pressure for environmental compliance.
� The diary industry in the AlpValleys region is reasonably conservative, and
Dairy Australia. Dairy 2004: Situation and Outlook,
AlpValleys Agribusiness Profile 2004
Page 89 of 188
Deer
Summary
The deer industry in the AlpValleys region is based primarily on breeding temperate deer species for the production of velvet antler, venison and venison value added-products. Although it is a moderate size industry within the region, the industry has a
strong export focus. Approximately 80% of product is sold into Asian and European markets.
The estimated GVP of the industry is currently about $6 million p.a. at farm gate; 70% from venison and 30% from velvet antler with some local value adding. 50 percent of
GVP is produced within Wangaratta Rural City with the remainder of the industry spread throughout Alpine, Indigo and Towong Shires. Less than 2 per cent of GVP is produced within Wodonga Rural City.
North East Region 1996 – 97 AG Census
2000 – 01 AG Census
Deer on hold at time of census 4,301 4,245
Contribution to Victorian number of deer holdings
11% 13%
Contribution to Australian deer holdings 3% 3%
Estimated number of farms 19 14.5
Source: ABS Agricultural Census 1997 and 2001
Deer industry overview
Source: AAVAF Survey 2004
Detail Comments
Product description Velvet antler, venison and venison value added-products.
Main season Not seasonal.
Industry associations
None listed.
Domestic market information
Price per deer carcass approximately $350 with main purchasers being restaurants.
Export market information
The level of output exported depends on the going international market price, with export market destinations including Germany.
AlpValleys Agribusiness Profile 2004
Page 90 of 188
Location of the deer industry within North East Victoria
Source: ABS Agricultural Census - 2001
Projected deer industry growth
2001 Ag Census
% of production volume
North East Region
Victoria
Alpine Shire 10.2% 1.3%
Indigo Shire 20.6% 2.7%
Towong Shire 11.2% 1.5%
Wangaratta (RC) 56.5% 7.5%
Wodonga (RC) 1.6% 0.2%
Source Indicator Comments
(ABS) AG Census and survey data
Growth in production volume 1997 to 2001
The stock of deer remained steady over the two census periods. Stocks declined by 1.3% from 4,301 in 1997 to 4,245 deer in 2001.
Surveys
Current profitability Was stated as very low by respondents.
5 year business plans Seem unfavourable with respondents looking to change agricultural pursuits.
5 year business outlook Stated as poor.
Business planning / budgeting
Not conducted.
Age of producers Those surveyed were in the higher aged brackets of 50 years plus.
Capital expenditure 2002-03 financial year
Represented approximately 50% of gross income of those surveyed.
AlpValleys Agribusiness Profile 2004
Page 91 of 188
The 2001/2002 season saw record average venison prices. However the industry was unable to exploit prices fully because it was unable to supply the market.
The 2002/2003 season provided two major difficulties for the Australian deer industry:
1. An increase in the relative international value of the Australian dollar, and
2. Drought resulting in a lack of feed and very high prices of supplementary feed. As a result, many stock were underfed and production costs increased
sharply.
In 2002/2003 the price for venison fell dramatically from an average of $4.24 to $2.11
per kilogram.
The deer industry is forecast to have a moderate average annualised growth rate over the next five years.
Deer industry labour requirements
Detail Comments
Estimate of labour employed directly:-
Full time Predominately owner operators with little outside employment used.
Part time
Casual
Areas of indirect employment
Meat processors and restaurants, brokers, suppliers, transport service providers.
Labour market issues No labour required as deer farmers tend to be small scale operations within the region.
Labour for deer farming is generally an owner producer relationship.
The deer industry in the region is based on farms that were profitable enterprises during the speculative expansion phase of the industry.
Many small farmers are unlikely to be able to continue if venison prices remain low
and production costs relatively high. As a result the national herd is likely shrink again. The future of the current industry will depend on demand from international markets
and the industries ability to produce and market quality assured products that consistently meet consumer specifications.
AlpValleys Agribusiness Profile 2004
Page 92 of 188
Deer industry marketing activities
Detail Comments
Marketing undertaken
Simple marketing activities conducted by business operator.
Value adding activities
Undertaken by one respondent who works with a manufacturer to butcher bone and pack meat for restaurant purchase.
Labels and brands
Waterfall Creek Venison, Eurobin.
The Deer Industry Association of Australia Ltd (DIAA) has established two product development and marketing companies,
1. Australian Deer Horn and Co products Pty Ltd (ADH), and
2. Deer Industry Projects and Development Pty Ltd.
Boutique marketing in high value markets is matched to the scale of production.
Taxes, rates and charges paid
Taxes, rate and charges
National Residue Survey levy on slaughtered animals ($0.025/kilo).
The deer industries research and development programs are funded by statutory levies on the sale of animals for venison, velvet antler sales and the sale of live
animals into export markets. The majority of these funds are collected from levies raised by the deer slaughter levy (venison).
Deer industry strategic advantages and opportunities
� Continue to develop initiatives for "cooperative farms" to improve economics of scale
� Processing of meat at Norvic Pty Ltd, Wodonga. Norvic is an accredited Halal abattoir so opportunity to increase exports to Muslim countries is a
possibility.
� There are well-established markets both locally and overseas for venison, velvet antler, and the sale of live deer for breeding.
� Deer are largely disease free, very low maintenance, and easy to farm.
AlpValleys Agribusiness Profile 2004
Page 93 of 188
Deer industry strategic disadvantages and impediments to growth
� Lack of domestic promotion for venison and limited response from chefs purchasing the venison.
� Approximately 85% of the commodities produced from deer farming are sold to export markets, which expose the industry to the fluctuations of international market forces.
� There is strong competition from New Zealand producers who are the worlds leading producer of deer products.
� The industry competes heavily for the processing and marketing of limited product volumes of venison.
� Most farmers don’t have a background in livestock management and
don’t rely on their deer enterprises as the primary source of income from the farm. As a result the deer farming Industry in the region is
characterised by small, non-commercial scale, enterprises.
The cut flower and nursery industry in the north east is a small industry with an estimated annual gross value of production of approximately $1 million. Almost 50 per cent of the industry is located within the Rural City of Wangaratta with the
remainder being evenly spread across all Shires except Benalla (<1%).
North East Region 1996 – 97 AG Census
2000 – 01 AG Census
2001 – 02 AG Survey
2002 – 03 AG Survey
Gross value of wool production $3,511,720 $3,058,548 $985,046
Wool production (kg) 47 38 41
Contribution to Victorian GVP of commodity 1.9% 1.3%
Contribution to Australian GVP of commodity 0.5% 0.4%
Estimated number of farms 29 31 17
Note: the 2002/03 figures have relative standard error of between 50% - 100% and are unreliable. They have been included to indicate likely decline of the nursery and cut flower industry.
Source: ABS Agricultural Census – 1997 and 2001, Agricultural Survey 2002 and 2003
AlpValleys Agribusiness Profile 2004
Page 95 of 188
Flower and nursery industry overview
Product description
Flowers grown and sold for the cut flower market. Native and indigenous plants for the wholesale market, retail market, home gardens and land rehabilitation.
Main season From October through to June for most types of cut flowers Major production in nurseries is over Autumn – Spring period
Industry associations
Victorian Cut Flower Association, VFF,
Domestic market information
Approximately $3.50 per bunch of cut flowers was reported by one floriculturalist surveyed. Cut flowers are purchased by wholesalers and are transported to major markets such as Melbourne. Native and indigenous plants supplied to regional authorities and agencies
Export market information
Respondents stated none of their produce / plants were exported.
Source: AVAAF Survey 2004
Location of the Flower and nursery industry within the AlpValleys region
Source: ABS Agricultural Census – 2001
2001 Ag Census
% of GVP % of production volume % of farms for commodity
The production area for nurseries and cut flowers in North East Victoria has remained relatively constant between 1997 and 2003. In hectares, 1997 recorded 46.6, 2001 - 38.3 and the 2003 estimate was 40.9.
Surveys
Current profitability Reported as satisfactory or high.
5 year business plans Stated as either no change or increasing level of cut flower production and variety of flowers grown.
5 year business outlook Reported as good or very good.
Business planning / budgeting
Of those surveyed that conducted planning activities, it was for 1 year in advance.
Age of producers Fell between the ages 40 to 59 years.
Capital expenditure 2002-03 financial year
Ranged from $80,000 to $120,000, and represented between 37% and 42% of gross income.
Flower and nursery industry labour requirements
Labour requirements are generally part time and casual employment for both the cut flower and nursery industry. Up to 20 full time people employed during plant propagations and raising over winter period.
Detail Comments Areas of indirect employment
Suppliers, transport providers, buyers - brokers and wholesalers. Major regional producer transports its own plants
Flower and nursery industry marketing activities
Detail Comments
Marketing undertaken
Producers of cut flowers market and sell their flowers mainly to wholesalers and also to local florists. Nurseries for the retail market advertise their outlet in local papers / chronicles within the region.
Value adding activities
For cut flowers, value adding activities undertaken include packaging and labelling of flowers. For nurseries, value adding revolves around potting of grown plants / flowers.
Labels and brands
Sandy Creek Trees
AlpValleys Agribusiness Profile 2004
Page 97 of 188
Taxes, rates and charges paid
Taxes, rate and charges
Nursery products levy, market fees for selling cut flowers at wholesale markets.
Flower and nursery industry strategic advantages and opportunities
� Climate and consistent weather patterns
� Demand for native plants as gardener’s tastes change. This presents an
opportunity for nurseries to focus more heavily on supplying native plants and providing new native plant varieties.
� Proximity to dry areas enables the supply of plants to these areas eg.
Saltbush
� Supply of plants for low water use gardens
� Landholders are not waiting for Government subsidies for tree planting. Just getting on with tree establishment.
Flower and nursery industry strategic disadvantages and impediments to growth
� Perception of marketing logistics as difficult due to most product being sold at distant major markets such as the Melbourne flower market.
� Future availability of water and the impacts of drought although this is
being offset by a switch to low water use gardens
� Decline in government funding for farmers for revegetation
AlpValleys Agribusiness Profile 2004
Page 98 of 188
Contacts
Flowers Victoria
John Osmelak 621 Burwood Highway Knoxfield Vic 3176
Postal - Private Bag 15, Scoresby Business Centre Vic 3176
Horticulture Australia Ltd. Nursery Industry Report 2003-04.
AlpValleys Agribusiness Profile 2004
Page 99 of 188
Forestry – hardwood and softwood timber
Summary
“The Timber Industry in North East Victoria” report prepared by Prospect Consulting
(2002) provides the clearest overview of forestry in the North East. The report included Shires outside of the AlpValleys region making it difficult to provide direct comparisons. However, the estimated GVP of $226 million means that this is the
largest agribusiness sector in the North East
The North East region of Victoria has a significant logging and timber processing
industry. There are approximately 65,000 hectares of privately owned softwood and hardwood plantations in the region. Major operators include five softwood processing plants (timber processing, panel board, pulp and paper), one log
exporter, and several small general processors.
The log intake to these operations is around 1 million m3 of softwood log, being 650,000 m3 of saw and peeler logs, and around 339,000 tonnes of pulp logs (Prospect
Consulting, Report, February 2002).
Most plantations in the region are dominated by softwood Radiata Pine, with
productive plantations of this species covering around 62,500 hectares (NRE estimates 1999). These plantations are concentrated in Alpine, Mansfield, Benalla and Towong Shires, which together account for approximately 70% of the total area
of softwood plantations.
The timber industry is also a major employer in the region.
The total level of direct employment from logging and haulage, sawmilling and residual log processing industries is estimated to be around 1,717 jobs (Forest Management Plan for the North East DNRE 2001). The estimated value of turnover of
this industry is approximately $40 million (DNRE 2001).
Being close to the major rural centres of Wangaratta and Albury/Wodonga creates
a demand for other timber products including firewood and farm timbers (posts and poles).
There is also a small demand for other minor forest products including: eucalypt seed,
Industry associations National Association of Forest Industries.
Domestic market information
All products above.
Export market information
Pulpwood for chipping, sawmill and processing residues for chipping.
AlpValleys Agribusiness Profile 2004
Page 101 of 188
Forestry industry labour requirements
Municipality Total
Alpine 547
Indigo 21
Benalla unknown
Wangaratta 94
Towong 94
Wodonga 31
Forestry industry marketing activities
Marketing is aimed at a national and international market. Marketing is not particular to the AlpValleys region.
Taxes, rates and charges paid
Taxes, rate and charges
Royalties
Forestry industry strategic advantages and opportunities
� Skilled labour force.
� Leasing of land to generate consistent farm income.
� Can be located on small areas of land.
� Value adding of products and associated industry.
Forestry industry strategic disadvantages and impediments to growth
� Lack of land.
� Perception of timber products as expensive.
� Weed management in plantations.
� Aesthetically unpleasant following harvesting.
AlpValleys Agribusiness Profile 2004
Page 102 of 188
References
Wareing, Pigdon, Poynter, Caruthers and Baker, May 2002. Timber industry in North East Victoria – a socio-economic assessment.
AlpValleys Agribusiness Profile 2004
Page 103 of 188
Green tea
Summary
The green tea industry in the North East is fledgling but undergoing rapid development driven by the Japanese beverage marketing company Ito En. They perceive a rapid and continued increase in the demand for prepared green tea
sold in bottles or cans in Japan. There is approximately 50 hectares established in the North East all within the Alpine Shire. The first harvest was undertaken in November
2004 with an expected yield of 5 tonnes. There are initially 11 growers with contracts for green tea production.
Green tea Industry overview
The green tea industry has been established in the AlpValleys region after a number
of years of trials and testing.
Japan is the main market for green tea with a demand of 110,000 tonnes per annum. About 90,000 tonnes are produced domestically in Japan, with the remaining 20,000 tonnes currently sourced from China.
The green tea trials conducted in the North East have yielded much higher quality
that the being grown in China, paving the way for industry development. Japanese green tea consumption is increasing in Australia, the United States and
Europe, as well as in Japan, with estimates of an increase of 50% over current demand.
Ito-En estimate that AlpValleys production will increase to 100 tonnes by 2008. By 2014, they further predict 1000 tonnes of production with a value of $10 million per
annum15.
The recent investment of $15.5 million in Australia’s first green tea processing plant based in Wangaratta bodes will for the future and confidence in this industry.
Detail Comments
Product description Green tea leaf.
Main season Harvest season is to run from November to April.
Industry associations Growers – AGTGA – Certificate IV in horticulture. VFF – Looking to set up QA program – OHS strategy being implemented.
15 Ito En media release, November 2004
AlpValleys Agribusiness Profile 2004
Page 104 of 188
Domestic market information No market currently.
Export market information 100% growers under contract with Ito En.
Source: AAVAF Survey 2004
Location of the Green tea industry within AlpValleys region
Source: ABS Agricultural Census - 2001
Projected Green tea industry growth
Projected growth for green tea will be influenced by contract arrangements with Ito
En Japan. Demand to increase plantings to 250 hectares by the end of 2006 and projection of
requirement for 10,000 hectares required in next 10 years.
There is considerable optimism about the future of this industry within the North East.
Green tea industry labour requirements
Seasonal labour will be employed for the purpose of weed control, but is not
significant. Approximately 2 per persons per 12 hectares are engaged.
The processing facility based in Wangaratta will employ 4-6 people initially and it is envisaged the plant will operate three shifts over 24 hours per day, employing eight
people on each shift, when running at full capacity.
Green tea industry strategic advantages and opportunities
� Regional access to infrastructure, transport, access to market/processing
facility is “central” to the growing zones of Ovens, King, Kiewa and Corryong.
� Land management practices among the growers from previous agribusiness enterprises have been well maintained and there is
confidence about the ability to transfer these knowledge skills and incorporate new management techniques to green tea production.
� The climatic conditions and water resource availability allow the region to produce high quality “Japanese style” green tea and builds on the
regions “clean green” image.
2001 Ag Census
% of GVP % of production volume North East Region
Victoria North East Region
Victoria
Alpine Shire 100% 100% 100% 100%
AlpValleys Agribusiness Profile 2004
Page 105 of 188
� The region provides adequate volumes and assured supplies of good
quality irrigation water.
� Opportunities in the future may exist for the further development of value
adding and health related green tea derivative products.
� The ability to process green tea immediately (within hours) after
processing at the newly developed Wangaratta processing facility, allows leaf quality to be maintained.
� Opportunity for a tourism benefit in the long term.
Green tea industry strategic disadvantages and impediments to growth
� Concerns regarding the financial profitability over time (yet to be
proven).
Contact
Dr Audrey Gerber
Primary Industries Research Victoria PO Box 235 Myrtleford, 3737
Rural Industries Research and Development Corporation 2004. The New Crop Industries Handbook.
AlpValleys Agribusiness Profile 2004
Page 106 of 188
Hay
Summary
Hay production is a large industry within the region with a gross value of production around $11 million per annum. Production is greatest in the Rural City of Wangaratta (approx. 35%) with the industry evenly spread throughout the local government
areas with the exception of Benalla and Wodonga. As with other cropping the industry does not have any significant advantages or impediments particular to the
region.
North East Region 1996 – 97 AG Census
2000 – 01 AG Census
2001 – 02 AG Survey
2002 – 03 AG Survey
Gross value of production $8,196,419 11,456,447 $8,547,177*
Production volume (tonnes) 65,281 81,778 61,301* 41,216*
Total area of production (ha) 17,323 18,966 17,504* 14,130*
Contribution to Victorian GVP of commodity 3.9% 2.9%
Contribution to Australian GVP of commodity
1.4% 1.3%
Estimated number of farms 976 990 892* 812*
Source: ABS Agricultural Census 1997 and 2001, Agricultural Survey 2002 and 2003
* ABS Advises that Relative Standard Error (RSE) between 25 – 25%: use data with caution
AlpValleys Agribusiness Profile 2004
Page 107 of 188
Industry overview
Detail Comments
Product description Clover hay, rye hay and lucerne hay.
Main season Harvest mid October to early November
Industry associations Australian Fodder Industry Association.
Domestic market information Producers will only cut hay if they can sell at good price, use it themselves or there is a surplus due to good conditions. Most Commonly, hay will go to a region experiencing drought or be used locally.
Export market information
The major exporter of hay is based it Tocumwal. The volume of hay from the AlpValleys region which goes to Tocumwal is unknown. However it li likely to be relatively small as most hay for export comes from irrigated areas in New South Wales.
Location of hay industry within AlpValleys region
Source: ABS Agricultural Census - 2001
2001 Ag Census
% of GVP % of production volume % of farms for commodity
North East Region
Victoria North East Region
Victoria North East Region
Victoria
Alpine Shire 17.3% 0.5% 17.5% 0.5% 12% 0.76%
Benalla (RC) 4.3% 0.1% 4.4% 0.1% 1% 0.06%
Indigo Shire 20.6% 0.6% 20.5% 0.6% 20% 1.25%
Towong Shire 19.8% 0.6% 19.8% 0.6% 24% 1.48%
Wangaratta (RC) 35.5% 1.0% 35.5% 1.0% 39% 2.42%
Wodonga (RC) 2.4% 0.1% 2.2% 0.1% 4% 0.26%
AlpValleys Agribusiness Profile 2004
Page 108 of 188
Projected hay industry growth
No opportunities for expanding hay growth have been identified. Hay production is
expected to remain constant and is dependent on seasonal conditions. Hay labour requirements
Most hay production is based on large bales and is highly mechanised. Contract
harvesters abound and are well known within the industry. A shortage of contractors does not appear to be a problem at harvest time.
Hay marketing activities
There are no regional specific marketing activities. The industry is largely based on large bales. Local marketing of small bales is through newspaper advertisements and roadside signage.
Taxes, rates and charges paid
Taxes, rate and charges
Further information required
Contacts
Australian Fodder Industry Association Inc.
P.O Box 4022 Balwyn, 3103
Whitty’s Produce Hume Highway
Wangaratta South, 3677 Phone: 03 5721 6588
AlpValleys Agribusiness Profile 2004
Page 109 of 188
Herbs
Summary
The region has a small number of individual producers supplying a range of fresh
culinary herbs and 'herbal products'. In most cases, herbs provide a supplement to, rather than the main source of income, with small returns.
North East Region 1996 – 97 AG Census
2000 – 01 AG Census
Gross value of production 1,467
No prod
uction of herbs recorde
d
Production volume (kg) 326
Total area of productions
Contribution to Victorian GVP of commodity Less than 1%
Contribution to Australian GVP of commodity Less than 1%
Estimated number of farms 1
Note: Wodonga is the location of the only recorded producer of herbs in the North East Region
Source: ABS Agricultural Census 1997 and 2001, Agricultural Survey 2002
Industry overview
The Australian market for culinary herbs falls into two major categories, being fresh
and dried. There are specialist organic growers in the region and there is a strengthening in the growth of herbs for the medicinal market as well as herbal teas. The production of herbs is usually in conjunction to other vegetable production. Most
growers are currently involved at the cottage industry level (averaging in size between a backyard and a hectare).
Herb grower success in the region will depend on long-term commitment, flexibility and investment in the development of information resources, agronomic understanding, minimal chemical intervention farming and prediction of market
trends and early identification of niche markets.
Demand drove a growing number of people to enter the industry often for lifestyle
reasons but as recently as four years ago, the industry had a 95 per cent drop out rate.
The Australian herb growing industry is relatively small in comparison to world
production.
AlpValleys Agribusiness Profile 2004
Page 110 of 188
Location of the industry within North East Victoria
Source: ABS Agricultural Census - 2001
Labour requirements
The grower and one other person provide labour for herb growing.
Marketing activities
The Organic Herb Growers of Australia Inc. are the major herb industry grower
association. Strategic advantages & opportunities
� Potential to grow toward import replacement of product and conversely
a greater export potential.
• Opportunities exist for increasing market share domestically and internationally
� A greater number of new entrant growers may be able to grow broad acre herbs for specific on-sale or for self-processing markets
� Opportunity for regional growers will include domestic fresh-cut and dried
culinary herbs, fresh-cut herbs for the overseas culinary and catering market particularly for the Asian market and the alternate growing
season in the US and Europe.
� Opportunity for specialised production in essential oils and medicinal crops, as well as identified new herbs in the medicinal area.
� Herb product value adding and down-stream processing ventures in the areas of tea blends, and gourmet products, plant medicines and other
herb extractives
� Major growers and processors have formed a new industry association to be known as the Australian Herb and Spice Industry Association Limited
(AHSIA). The principal purpose of the association is to implement national strategies for the industry to gain continued access to chemicals for
current and future needs.
2001 Ag Census
% of GVP % of production volume
North East Region
Victoria North East Region
Victoria
Wodonga (RC) 100% 0.6% 100% 0.6%
AlpValleys Agribusiness Profile 2004
Page 111 of 188
� The small hectares needed for the enterprise allows grower better farm diversification, and also allows existing farmers to enter the industry.
� Niche markets to local food industries
Strategic disadvantages and impediments to growth
� To further develop and commercially expand the herb industry, growers will need to access impartial technical support.
� The herb industry is still highly fragmented and poorly organised and the returns are low and the work is often labour intensive.
� A major impediment for the herb industry was that the temporary permits
issued for pesticides and herbicides expired in April 2004. No money to fund the research necessary to have the permits renewed. A peak body
to ensure that public health and safety standards are met and do not impede potential export trade is essential.
� Potential growers struggle with the uncertainty of returns where supply
and quality are not guaranteed and the market in respect of this creates unstable price and quantity.
� The lack of recognition of Australia's ability to grow and supply quality herbs in quantity.
� The lack of industry intelligence means there is insufficient accurate data
on existing and potential domestic and international markets and the unavailability of agronomic information on a range of herb crops to regional growing conditions create apprehension for growers.
� Growers also expressed concern regarding a lack of comprehensive industry networking and a widespread reluctance within the industry to
share information and knowledge.
AlpValleys Agribusiness Profile 2004
Page 112 of 188
Hops
Summary
Anecdotal evidence suggests the industry profile has changed little since the
previous profile compiled in 1996, however AG Census data shows the number of farms has decreased from 12 to 6 and production has significantly decreased. According to Australian Hop Marketers, there are 6 growers in the
region. The largest is Rostrevor Hop Gardens with 140 ha of hops. The remaining 5 growers have a total of 60 ha of hops.
North East Region 1996-97 AG Census 2000-01 AG Census 2001-02 AG Survey
Gross value of production $2,057,418 $2,202,249 $2,454,198
Current production volume (measurement in brackets)
648,823 480,431 520,332.0
Total area of production 288 170 154
Contribution to Victorian GVP of commodity
100% 100%
Contribution to Australian GVP of commodity
18.3% 19.5%
Estimated number of farms 12 6 2
Source: ABS Agricultural Census – 1997 and 2001, Agricultural Survey 2002
Hops industry overview
The primary product is the hop cone or flower that contains yellow lupulin - the active ingredient used for the production of beer. The hops are pelleted at
several sites in the region.
AlpValleys Agribusiness Profile 2004
Page 113 of 188
Location of the hops industry within the AlpValleys region
Source: ABS Agricultural Census – 2001
Projected hops industry growth
Source Indicator Comments
(ABS) AG Census and survey data
Growth in production volume 1997 to 2001
Production declined by 7% from 1997 to 2001, but the Agriculture survey data for 2001 – 02 indicates that production increased since then, by 11%.
Source: ABS Agricultural Census – 1997 and 2001, Agricultural Survey 2002
Hops strategic advantages and opportunities
� Ideal growing conditions, with mild to warm summers, cool to cold winters, and deep, fertile soils close to major rivers for irrigation
� Boutique beers
Hops strategic disadvantages and impediments to growth
� Approx 60% is exported. Therefore the industry is very dependent on world markets which are currently experiencing a decline.
Kiwifruit is a small industry within the region located solely within the Rural City of Wangaratta. The majority of growers are near Whorouly and Moyhu. No opportunities for significant development within the AlpValleys region were identified,
however the industry has some advantages regarding timing of fruit production that could be further utilised.
Source: ABS Agricultural Census 1997 and 2001
Kiwi fruit industry overview
Detail Comments Product description
Fresh fruit.
Main season April to May.
Industry associations
None listed.
Domestic market information
Prices received by kiwifruit producers are in the order of approximately $18 per 10 kilogram box of produce.
Export market information
None provided.
Source AAVAF Survey 2004
North East Region 1996 – 97 AG Census
2000 – 01 AG Census
Gross value of production $616,237 $720,191
Production volume (kg) 383,900 383,611
Total are of production (ha) 21.3 36.8
Contribution to Victorian GVP of commodity 17% 18%
Contribution to Australian GVP of commodity 10.4% 10.2%
Estimated number of farms 5 5.8
AlpValleys Agribusiness Profile 2004
Page 116 of 188
Location of the kiwi fruit industry within North East Victoria
Source: ABS Agricultural Census - 2001
Projected kiwi fruit industry growth
Source Indicator Comments
(ABS) AG Census and survey data
Growth in production volume 1997 to 2001
There was a very small decline in production volume from 1997 to 2001.
Surveys
Current profitability
Respondents stated their current profitability as very low.
5 year business plans
Those surveyed plan to increase production to a larger scale operation.
5 year business outlook
Stated as satisfactory.
Business planning / budgeting
Respondents undertook formal business plans for 5 plus years in advance.
Age of producers Kiwi farmers surveyed were between 40 and 49 years.
Capital expenditure 2002-03 financial year
Was between $0 and $20,000.
This industry is forecast to have a very strong average annualised growth rate over the next five years, but from a relatively small base.
Kiwi fruit industry labour requirements
Detail
Based on the total area under production, approximately 18 persons would be employed on a regular basis. Labour intensive periods are April and May for harvest and pruning in early June. Generally another 18 persons per 5 hectares are required during harvest for a 4-week period, while 2 persons per 5 hectares attend to pruning for a 6 to 8 week period. For other periods at training and bud thinning an extra person
may be required for a 4-week period.
Areas of indirect employment
Suppliers, transport providers, buyers.
2001 Ag Census
% of GVP % of production volume
North East Region
Victoria North East Region
Victoria
Wangaratta (RC) 100% 18% 100% 18%
AlpValleys Agribusiness Profile 2004
Page 117 of 188
Kiwi fruit industry marketing activities
Detail Comments
Marketing undertaken
None currently undertaken on a large or collective scale, due to the small size of the industry in the region. Growers market through local wholesalers and city markets, on a partnered basis or individually.
Value adding activities
None identified
Labels and brands
Lesuti Organic Kiwi Fruit.
Taxes, rates and charges paid
Taxes, rate and charges
Council rates, NASAA charges.
Kiwi fruit industry strategic advantages and opportunities
� Usually reliable climate that is suitable to kiwi production, and water
accessibility during non-drought periods.
� Accessibility to key markets.
� Given the relatively small nature of the kiwi industry within the North East, there exists the opportunity for it to expand (more producers and increasing the size of current operations).
� Some opportunity exists for the industry to reverse recent declines and establish a greater share of the fresh export kiwifruit markets by taking advantage of the regions counter seasonal supply, appealing varieties
and the reputation for clean, quality horticultural produce.
� Strong pollen flows allowing for consistent bee pollination.
� Maintaining grower networks allowing better access to export
opportunities.
Kiwi fruit industry strategic disadvantages and impediments to growth
� Financial limitations on the ability to expand kiwi production to larger scale operations.
� The strength of the import market of kiwi fruit from New Zealand, which is representative of an advanced industry in terms of the number of
producers and subsequent networking and distribution infrastructure.
AlpValleys Agribusiness Profile 2004
Page 118 of 188
� The growing region in and around the Ovens Valley area is susceptible to out of season frost.
� Growers need access to seasonal labour in a very small window of time.
� A restrictive opportunity to supply the markets outside a 3-4 week period
in the year means growers must have all variables working to their advantage to maximize the supply opportunity.
� Regulations governing movement of fresh produce from a fruit fly region to domestic and export destinations.
� There appears to be a lack of market promotion of Australian kiwifruit
other than promotion and marketing through collective fruit associations.
� Industry research is minimal other than that undertaken by growers.
AlpValleys Agribusiness Profile 2004
Page 119 of 188
Mushrooms
Summary
Similar to other vegetable industries, mushrooms are a small industry within the region with production around $1.4 million.
There are two mushroom farms in the region. One in Benalla, and one in Kergunyah (Indigo Shire).
The AAVAF survey response for mushrooms was 100%, giving a high degree of confidence in the figures used.
North East Region 1996 – 97 AG Census
2000 – 01 AG Census
2004 AAVAF Survey Results
Gross value of production $436,301 $401,905 $1,360,000
Production volume (kg) 104,000* 91,812* 166,000
Total area of production (ha) 0.50 0.42 0.66
Contribution to Victorian GVP of commodity 0.7% 0.7%
Contribution to Australian GVP of commodity 0.3% 0.2%
Estimated number of farms 1 1.18 2
Source: ABS Agricultural Census 1997 and 2001, AAVAF Survey 2004
Mushroom industry overview
Mushrooms are grown in air-conditioned coolrooms, with no particular advantage or disadvantages for location in the AlpValleys.
* ABS Advises that Relative Standard Error (RSE) between 25 – 25%: use data with caution
AlpValleys Agribusiness Profile 2004
Page 120 of 188
Detail Comments Product description
Fresh mushrooms.
Main season Not seasonal.
Industry associations
Australian Mushroom Growers Association.
Domestic market information
Mushrooms sell for approximately $16.70 per 1 kilogram box, or $13,300 per tonne, and are sold through intermediaries such as agents and wholesalers.
Export market information
Those surveyed indicated that a small percentage of their mushrooms were exported to Asia.
Source: AAVAF Survey 2004
The mushroom industry has been identified as one of the three fastest crop growing
industries established in Australia since the 1950’s. Domestic production expanded at an average annual rate of 10% per annum between the 1970’s and the 1990’s.
The Australian industry overall is still growing, with 3 – 5% growth rates predicted over the next four years (Source: State of the Mushroom Industry: AMGA 2004). However,
supply is being dominated by large producers (eg. Chiquita) who have been buying out smaller growers throughout Australia.
Projected mushroom industry growth
Source
Indicator Comments
(ABS) AG Census and survey data
Growth in production volume 1997 to 2001
Mushroom production decreased by 11.7% during this period based on ABS Survey data. However, producers contact directly indicated slow but steady growth in production.
Surveys
Current profitability Survey responses varied between high and low levels of profitability.
5 year business plans No change reported.
5 year business outlook Stated as satisfactory.
Business planning / budgeting
Was not undertaken by those surveyed.
Age of producers Were in the age brackets 40 to 49 and 60 plus years.
Capital expenditure 2002-03 financial year
Was very high at between $100,000 and $375,000, representing an average of 80% of gross income.
The predicated growth in the AlpValleys region is below expectations for the Australian industry as a whole.
AlpValleys Agribusiness Profile 2004
Page 121 of 188
Mushroom industry labour requirements
Mushroom industry marketing activities
Detail Comments
Marketing undertaken
Little marketing required to be undertaken by growers individually. The Australian Mushroom Growers Association represents growers by preparing brochures.
Value adding activities
Some growers undertake prepackaging of mushrooms for the domestic market on premises.
Labels and brands
Kergunyah Mushrooms, Benalla Mushrooms
Taxes, rates and charges paid
Taxes, rate and charges
Council rates, Spawn levy - 10%, Sales levy - 1%.
Mushroom industry strategic advantages and opportunities
� Close access and good relationships with fresh distributors in Wodonga,
Wangaratta and Benalla. � Established growers with well established markets.
Detail
Large scale mushroom growers make use of full time, part time and particularly casual labour. Up to 20 casual employees may be required for large scale operations, and from between 1-8 full and part time staff. Smaller operations have a small casual labour requirement if at all.
Areas of indirect employment
Suppliers, transport providers, buyers - agents and wholesalers.
Labour market issues
Labour costs represent approximately 25% of gross income of those surveyed. Respondents stated there was a lack of suitable labour for their operations.
AlpValleys Agribusiness Profile 2004
Page 122 of 188
Mushroom industry strategic disadvantages and impediments to growth
� The cost of complying with local, state, and federal regulations.
� Labour availability.
� Over production that leads to a flooding of the market and lower price received by mushroom growers.
� Access to key markets and competing against large industry players.
Contact
Australian Mushroom Growers' Association (AMGA) Phone: 02 4577 6877 Fax: 02 4577 5830 www.mushroom.net.au
David Wallace Kergunyah Mushrooms 932 Gundowring Rd
Kergunyah, 3691 Phone: 02 6027 5224
AlpValleys Agribusiness Profile 2004
Page 123 of 188
Nuts – including chestnuts
Summary
Nuts are a medium sized industry in the region dominated by chestnuts. Alpine Shire produces approximately 70% of the regions nuts with Indigo Shire producing almost all the remainder. The nut industry is favoured by the ideal growing conditions in the
region. Labour shortages have prompted an increase in mechanical harvesting.
North East Region 1996 – 97 AG Census
2000 – 01 AG Census
2001 – 02 AG Survey
2002 – 03 AG Survey
Gross value of production
1997
data inconclusive
$1,825,324 $3,384,465
Production volume (kernel weight kg) 121,781 288,925
Total number of trees 66,226 135,237 130,087
Contribution to Victorian GVP of commodity 6.8%
Contribution to Australian GVP of commodity
3.2% 107 93
Estimated number of farms 58 72 107* 93*
Source: ABS Agricultural Census 1997 and 2001, Agricultural Survey 2002 and 2003
Nut industry overview
Seventy to eighty percent of Australian chestnut production is in the North East of Victoria in Bright, Myrtleford, Buckland Valley, Harrietville, Beechworth and Stanley,
the Kiewa Valley, Buffalo River and King Valley.
Most of the chestnut crop is sold fresh through the wholesale marketing system, while smaller growers sell quantities direct to fruit and vegetable vendors and larger
supermarket chains. A lesser quantity is sold at the farm gate throughout the region. The average wholesale price for chestnuts at both the Sydney and Melbourne
wholesale markets was between $3.00/kg and $6.00/kg in 2003.
The region produces fresh chestnuts, walnuts, pecans, pistachio and hazelnuts for domestic consumption as well as frozen chestnuts for export. Frozen chestnut meal is
also a newly development product for the domestic restaurant market.
The pistachio industry is new to the region and at present is still very small.
* ABS Advises that Relative Standard Error (RSE) between 25 – 25%: use data with caution
AlpValleys Agribusiness Profile 2004
Page 124 of 188
Detail Comments
Product description Chestnuts, hazelnuts, walnuts and pecans
Main season Within the first six months of the year, mainly between February and May.
Industry associations
Chestnut Growers Australia (CGA), Premium Chestnuts Australia (PCA), Hazelnut Growers of Australia, Australian Walnut Association (AWA) and Australian Walnut Growers Industry Association, VFF.
Domestic market information
Chestnuts are sold for between $5 and $5.40 per kilogram, or $4,000 per tonne. Walnuts sell for approximately $5.00 per kilogram and walnut oil for $15 per bottle. Chestnuts are sold to wholesale agents in Sydney for sale to supermarkets, greengrocers and roasters. All other nuts are sold via farmers markets or through nut wholesalers.
Export market information
All respondents stated they were not aware of whether their produce was ultimately exported, however chestnuts are exported to China, Japan and Singapore.
Source: AAVAF Survey 2004
Location of the nut industry within North East Victoria
Source: ABS Agricultural Census - 2001
Projected nut industry growth
Tree nut production is increasing at a rate greater than 10 per cent per annum.
Chestnut production is expected to increase 50 per cent over the next five years as existing non-bearing trees reach production.
2001 Ag Census
% of GVP % of production volume
North East Region
Victoria North East Region
Victoria
Alpine Shire 68% 4.6% 69.3% 1.7%
Benalla (RC) 1.0% 3.4% 0.1%
Indigo Shire 29.1% 2% 26.5% 0.6%
Towong Shire 0.4% 0% 0% 0%
Wangaratta (RC) 1.6% 0.1% 0.8% 0.02%
AlpValleys Agribusiness Profile 2004
Page 125 of 188
Source Indicator Comments
(ABS) AG Census and survey data
Growth in production volume 1997 to 2001
1997 ABS data is inconclusive and was insufficient to make comparisons
Current profitability All respondents stated they experienced either low or very low levels of profitability.
5 year business plans
Several chestnut growers stated plans to increase the number of trees, with one walnut producer planning to process their own nuts on site.
Surveys
5 year business outlook
Was optimistic in comparison to current levels of profitability with responses ranging from satisfactory to very good.
Business planning / budgeting
Around half of all respondents stated that they drafted a formal business plan / budget - with all stating a 5 year plan had been undertaken. This highlights the relatively young age of the industry.
Age of producers Most producers surveyed were aged between 50 to 59 years, with the remainder aged between 40 and 49 years, and 60 years plus.
Capital expenditure 2002-03 financial year
Ranged from $10,000 to $120,000 and represented an average of 36% of gross income.
Nut industry labour requirements
Chestnuts in Australia are harvested from March to May.
Seasonal labour requirements are increasingly difficult to meet, so a shift to mechanised harvesting in the long term is an important cost reducing possibility. Labour requirements during an eight-week period for chestnut harvesting requires
330 seasonal workers, while approximately 35 are employed in a full time capacity. It should be noted that for many growers this is a secondary agricultural pursuit.
The hazelnut harvest is by nature extremely nature intensive from drying, cracking to
packaging and while in the region most plantings are small, this labour is supplied by extended family and friends.
AlpValleys Agribusiness Profile 2004
Page 126 of 188
Detail Comments
Estimate of labour employed directly:- (based on 8 survey responses)
Full time 1
Part time 15
Casual 13
Areas of indirect employment
Brokers / wholesale buyers, transport service providers.
Labour market issues
The majority of labour required is casual labour required seasonally in Autumn. Survey respondents stated a shortage of labour during harvest.
Nut industry marketing activities
Chestnut varieties are very difficult to identify based just on their physical
characteristics, yet the identification of chestnut varieties is critical to successfully marketing chestnuts, ensuring quality and protecting breeders’ rights.
The Chestnut Growers of Australia have established a DNA library and testing service which growers will be able to access to determine the varieties they are growing. As
a result of certainly of identification, growers will be able to market their product according to variety. The industry concentrates on marketing four varieties: Buffalo Queen, Purdons Pride, DiCoppi Marone and Red Spanish.
The Premium Chestnuts of Australia co-operative members have their own chestnut
grading and packaging facilities so that packaging can be easily tailored to suit the needs of the customer.
Developing market awareness and promoting North East region grown hazelnuts remains primarily the responsibility of the grower in conjunction with the Hazelnut Growers Association.
Detail Comments
Marketing undertaken
Is minimal and more direct, such as through the Hume Murray Food Bowl, Footscray Market and other farmers markets. Farm gate sales cater to business groups and tourists.
Value adding activities
Most respondents do not undertake value-adding activities. However, one chestnut grower worked with a cooperative to package their produce, and a walnut grower prepared pickled walnuts from green fruit and packaging walnut kernel.
Labels and brands
Silver Creek Chestnuts, Premium Chestnuts Australia (cooperative of 12 growers), and Valley Nut Growers.
Taxes, rates and charges paid
AlpValleys Agribusiness Profile 2004
Page 127 of 188
Taxes, rate and charges
Council rates, water charges and cost of licences.
Nut industry Strategic advantages and opportunities
� Climate and soil suitable to nut growing allow for the production of a superior product when for most nuts.
� Opportunity to work with the tourism industry and the clean green image of the region.
� Central to Sydney and Melbourne markets.
� Nut farmers surveyed stated a need for modern processing and harvesting equipment, which on an individual scale represents significant
capital costs. This highlights the opportunity of developing a nut processing facility / plant within the region to service the needs of producers.
� Further promotion of benefits of eating nuts to create broad public awareness would serve to benefit the industry.
� There exists niche sub industries such as walnut oil that need to be promoted in order to create demand for the product.
� The North East Victoria region has rich fertile soils, hot dry summers and
cold wet winters as characteristics of the area. These conditions provide the ideal environment for growing sweet full flavoured chestnuts.
� These climate conditions and reliable rainfall or irrigation are important for
good tree growth and the production of high quality walnuts and hazelnuts. The preferred climate is characterised by a mild summer and
cool winter.
� A number of potential marketing alternatives are available for hazelnut growers with new plantings, particularly with small production. These
include potential sales through grower cooperatives (The Premium Chestnuts of Australia Co-Operative), specialised nut retailers,
manufacturers - confectionery, baking, health foods, bakeries, commission agents in the wholesale produce markets, wineries (as an addition to cellar door sales), local fruit and vegetable outlets, street stalls
and farmer markets, further development in contacting and supplying large wholesalers and direct sales from the farm gate may occur.
� The region’s hazelnut industry has an opportunity for input into the import replacement for 1500 tonne of imported product.
AlpValleys Agribusiness Profile 2004
Page 128 of 188
� The nut industry in North East Victoria remains relatively free from pests and disease.
� Opportunities exist to determine the most suitable varieties for growing
specific types of chestnuts and hazelnuts in the North East Victoria region. This will be helped with the advancement of the DNA fingerprinting of species of chestnuts.
� Value adding to existing production of chestnuts and hazelnuts and continue to commercially develop all aspects of hazelnut and chestnut
products including the kernel, shell or casing and waste.
� More specifically the chestnuts grown in North East Victoria have the advantages and the opportunity to brand themselves as being
produced as high quality, clean chestnuts free of insect pests and produced in an environmentally sustainable manner. To complement this,
quality assurance and flexible packaging are achievable deliverables from the nut industry in North East Victoria. The Premium Chestnut Cooperative is currently exploring the majority of these initiatives for both the export and the domestic market.
� The Australian Chestnut Company Pty Ltd, in Myrtleford, has received a
national grant develop and design a process to commercially produce frozen roasted chestnuts, with the Japanese export market as the target market.
Nut industry Strategic disadvantages and impediments to growth
� The time it takes for trees to grow to maturity given the relative high associated establishment costs.
� Labour shortages during harvest (Autumn).
� The relatively small size of industry in comparison to the presence of new multinational players.
� Slow take up of the benefits of a national approach in the development
of the hazelnut industry.
� There are minimum numbers of large commercial undertakings within the
region to take advantage of possible economies of scale.
� There is limited access to processing facilities available.
� The capacity to produce, handle and process quality hazelnuts is limited
by the small size of the plantings and quantities of nuts available.
AlpValleys Agribusiness Profile 2004
Page 129 of 188
� As a supplementary form of farm income there is often a reluctance or affordability of capital input toward developing plantings to create a viable and sustainable industry.
� As a result of the extensive range of horticulture enterprises undertaken in the North East, competition for resources is at a premium.
� It is expected that there will be future limits on the use of water.
Protection of this ‘clean, green image’ and sustainability of the industry.
� Particularly in the case of hazelnuts, global overproduction and cheap
imports could affect the industry.
� Fragmentation between growers in different regional locations involved in the development of the Australian hazelnut industry slows the
introduction of knowledge and initiatives that would be of benefit to all growers and regions.
Chestnut Growers of Australia. Chestnut Industry Strategic Plan 2001-2006
Chestnut Growers of Australia. Chestnut Annual Industry Report
Australian Nut Industry Council. Annual Industry Report 2002-03
AlpValleys Agribusiness Profile 2004
Page 130 of 188
Oilseeds
Summary
Oilseed production in the north east is restricted almost exclusively to Canola. The
industry is a relatively small contributor to GVP and very small within a state context. Production is greatest in the Rural City of Wangaratta (approx. 35%) with the industry evenly spread throughout the remaining Rural cities and shires except Indigo and
Wodonga. The Grains Research and Development Corporation includes the north east in its southern grain growing region. The southern region is characterised by:
• temperate climate; • relatively infertile soils; • yield depends upon reliable spring rainfall;
• smaller enterprise size; • diverse production patterns and opportunities; • large and diverse domestic market;
• phase farming innovator; and • shift in intensive livestock production and demand for feed grains to
this region. Oilseeds – Canola
North East Region 1996 – 97 AG Census
2000 – 01 AG Census
2001 – 02 AG Survey
2002 -03 AG Survey
Gross value of production $249,940 $850,331 $666,996*
Production volume (tonnes) 684 2,753 1,743 755*
Total area of production (ha) 455 1,565 986* 984*
Contribution to Victorian GVP of commodity 0.5% 0.7%
Contribution to Australian GVP of commodity
0.1% 0.1%
Estimated number of farms 10 15 22*
Source: ABS Agricultural Census 1997 and 2001, Agricultural Survey 2002 and 2003
* ABS Advises that Relative Standard Error (RSE) between 25 – 25%: use data with caution
AlpValleys Agribusiness Profile 2004
Page 131 of 188
Industry overview
Detail Comments
Product description Canola seed.
Main season Sowing in Autumn with cropping in December – January depending on seasonal conditions
Industry associations Grains Research and Development Corporation
Domestic market information
The price for canola, in 2000, dipped to $275/tonne in the face of a large world supply. Farmers contend that a minimum price of $300/tonne is needed to offset risk and higher production costs. For 2000, a two tonne per hectare canola crop was estimated to return a gross margin of $400 per hectare compared to $230 per hectare for a 2.5 tonne per hectare wheat crop.
Export market information
Exports of canola from the north east is unknown with most canola joining the pool of accumulation services. ($321/tonne as at 08/12/2004)
Location of the industry within AlpValleys region
Oilseeds – Canola
Source: ABS Agricultural Census – 2001
2001 Ag Census
% of GVP % of production volume % of farms for commodity
North East Region
Victoria North East Region
Victoria North East Region
Victoria
Alpine Shire 17.3% 0.5% 17.5% 0.5% 12% 0.76%
Benalla (RC) 4.3% 0.1% 4.4% 0.1% 1% 0.06%
Indigo Shire 20.6% 0.6% 20.5% 0.6% 20% 1.25%
Towong Shire 19.8% 0.6% 19.8% 0.6% 24% 1.48%
Wangaratta (RC) 35.5% 1.0% 35.5% 1.0% 39% 2.42%
Wodonga (RC) 2.4% 0.1% 2.2% 0.1% 4% 0.26%
AlpValleys Agribusiness Profile 2004
Page 132 of 188
Projected oilseeds industry growth
Whilst GVP for oilseed has increased markedly between 1997 – 2002, the industry is
not expected to grow rapidly. Oilseeds fits well with cereals and pulses in crop rotations. Yields are dependent upon seasonal conditions.
Oilseeds labour requirements
Labour requirements are similar to other cropping activities and undertaken as part of many integrated mix farming enterprises. High fertiliser requirements, weed control and windrowing make for higher input costs however whether that translates into
additional labour requirements from off farm is difficult to determine.
Oilseeds marketing activities
There is no marketing of oilseeds which is specific to the north east region. grain accumulation services, GrainCorp and Cargill all market canola without particular
reference to the north east.
Taxes, rates and charges paid
Taxes, rate and charges
Further information required.
Oilseeds strategic advantages and opportunities
• Processing services are relatively close by (Numurkah and Wagga
Wagga Reliable climate although offset by short growing season.
Oilseeds strategic disadvantages and impediments to growth
• Growing season is too short for much of north east region.
AlpValleys Agribusiness Profile 2004
Page 133 of 188
Olives
Summary
Based on the ABS data, Gross Value of Production figures for olives, a very small industry within the region. However the number of farms indicates a rapidly growing industry which will contribute significantly to the agribusiness base of the AlpValleys.
Respondents to the AAVAF Survey 2004 who indicated large expansions of existing plantings confirming this.
Two thirds (66%) of production is within Indigo Shire, with a further 20 percent in the Benalla Shire.
The North East Victorian Olive Industry 5 Year Strategic Marketing Plan: 2002 – 2006 provides a comprehensive assessment of the future of the industry. In summary, the
total retail value of forecast olive production (at full production) is forecast to be between $11.4 million and $14.6 million. The report indicates there are currently
119,000 trees planted with plans to plant a further 50,500 trees.
North East Region 1996 – 97 AG Census
2000 – 01 AG Census
2002 – 03 AG Survey
Gross value of production $477 $13,711 $11,027,666
Production volume (kg) 61 846 8,611,375
Total number of trees 140 Unavailable 20,817
Contribution to Victorian GVP of commodity 0.1% 1.3%
Contribution to Australian GVP of commodity 0.02% 0.2%
Estimated number of farms 1 4 21
Please note that the 2002/03 figures have a Relative Standard Error of 50 – 100% and are unreliable. They have been included to indicate likely growth of the olive industry
Source: ABS Agricultural Census 1997 and 2001, Agricultural Survey 2002and 2003
Olive industry overview
The industry is highly fragmented, with the majority of trees managed by a small number of project development groves. Approximately 200-250 hectares are currently under production with between 200-300 trees planted per hectare.
AlpValleys Agribusiness Profile 2004
Page 134 of 188
Detail Comments Product description
Fruit and olive oil.
Main season May, June and July.
Industry associations
North East Olives Association, Olive Producers North East Victoria Inc., Australian Olive Growers.
Domestic market information
Olive growers receive approximately $7.50 per kilogram of olives produced, and $25 per litre of olive oil.
Export market information
Respondents surveyed stated that none of their produce was exported at this stage
Source: AAVAF Survey 2004
Location of the olive industry within the AlpValleys region
Source: ABS Agricultural Census – 2001
Projected olive industry growth
The conditions appear ideal for substantial tree growth and substantial yields for the
2004 harvest.
Tree planting numbers have declined after initial plantation investment impetus created large initial plantings. However, in the industry production, the growth and yields from current plantings will increase with the age of the tree. The Industry will go
through a consolidation phase. It is important to recognise that olive growers in the region are considered as part-time producers. The returns on olive oil production will
increase with table olives remaining static.
2001 Ag Census
% of GVP % of production volume
North East Region
Victoria North East Region
Victoria
Benalla (RC) 22.4% 0.3% 22.4% 0.3%
Indigo Shire 67.7% 0.9% 67.7% 0.9%
Wangaratta (RC) 9.8% 0.1% 9.8% 0.1%
AlpValleys Agribusiness Profile 2004
Page 135 of 188
Source Indicator Comments
(ABS) AG Census and survey data
Growth in production volume 1997 to 2001
Significant production increase during this period, with continued strong growth
Current profitability Responses ranged from satisfactory to very low.
5 year business plans Significant plans for expansion across the industry with most respondents stating plans to increase olive production - some stated by up to 500% and 1000%.
Surveys
5 year business outlook
Was more favourable than current profitability responses with most stating a satisfactory or good outlook for the future. This correlates with many growers being in the investment stage of their business.
Business planning / budgeting
All olive grower respondents drafted a formal business plan or budget - mostly being 5 year plus plans - again due to the young nature of the industry.
Age of producers Ranged evenly across all age brackets of those surveyed, from 30 years to 60 plus years.
Capital expenditure 2002-03 financial year
Considering incomes of olive farmers is currently low due to the early stage of operations, it was not surprising to find that capital expenditure was relatively low - ranging from between $0 to $14,000.
Olive industry labour requirements
Harvesting season occurs in April, May and June with harvest labour requirements
being intensive, while processing is less labour intensive. It is important to note that most labour for harvesting, brining and processing of the olive industry in the region is
done by family or friends on a non-commercial basis.
Detail Comments
Estimate of labour employed directly:- (based on 46 survey responses)
Full time None.
Part time None.
Casual None.
Areas of indirect employment
Brokers / buyers, suppliers, transport service providers and in the near future there is likely to be a need for marketing services.
Labour market issues
None.
AlpValleys Agribusiness Profile 2004
Page 136 of 188
Olive industry marketing activities
Detail Comments
Marketing undertaken
None, though it is recognised that marketing of the olive industry will be required to create an image of North East Victoria as an olive growing region.
Value adding activities
Several survey respondents undertake their own processing or as a joint venture with a manufacturer, processing olives into oil.
Labels and brands
Alpine Olives, The Wicked Virgin, Lync Olive Oil, Gooramadda Olives, EV Olives.
Growers do not generally enter into marketing the farm gate product with the
exception of one or two complementary agritourism growers. Marketing is seen as a non-core or time-consuming activity contributing little to the
bottom line. Growers perceive their marketing of the product not to be cost efficient and rarely enter into further down the chain of production marketing activities
Brand building is seen as the responsibility of individual enterprises.
Basic industry intelligence, generic promotion and the progression of innovation in olive products and market development are mainly seen as issues that should be
addressed through a wider industry network.
Taxes, rates and charges paid
Taxes, rate and charges
Council rates and other relevant state and federal government charges / levies / compliance costs.
Olive industry strategic advantages and opportunities
� The North East Region is renowned for its good gourmet food and wine and has an established reputation that could support the growth of the
olive industry.
� The excellent tourism / visitor potential of the region is advantageous to olive producers who wish to pursue farm gate sales – similar to those
undertaken by wine producers in the region.
� High rainfall, good quality soil and hours of sunlight make the region ideal
for growing olives.
AlpValleys Agribusiness Profile 2004
Page 137 of 188
� Suitable well-drained land is essential to continued yield consistency and was vital in establishing the current plantings.
� Reliable water storage is available for poly pipe and micro jet irrigation for
the peak watering periods of November to January.
� Good access exists for transport to market by road and rail.
� Regional branding and increased economies of scale.
� Olive growers in the region are literate and well educated and source information regularly, and are willing to learn about growers’ issues and
other peripheral issues affecting their industry. This is critical in forming proactive grower involvement in all facets of the industry from farm gate to consumption.
Olive industry strategic disadvantages and impediments to growth
� The long lead-time to production-olives reduces the ability of olive producers to fund or obtain finance to invest in the future of their
business. The return on any personal investment is therefore long term.
� It takes approximately 7 years for trees to produce and grow to maturity
while producers still face operation costs.
� Availability of cheap olive and olive oil imports.
� There is currently no critical mass of product that allows for any cost
advantages associated with selling to wholesalers i.e. (individual growers spend 10-15% on wholesaling agent fees.)
� The ability to secure reliable casual labour is a concern for the industry.
Soil type and attention to the problems of acidic soils is of significance to the olive industry, and soils of the North East Region in general.
� Inconsistent rainfall within the two predominant olive producing shires also creates fluctuating production yields.
� A greater effort needs to be given to acquiring and disseminating
knowledge to producers in competencies of basic growing and processing practices.
� Managing the transition from the early speculative phase of the development of the olive industry in the region to a more fully commercialized industry is critical.
� Urban encroachment/peri-urban problems will impact on the availability of productive land and possibly poor land management practices.
North East Victorian Olive Industry. 5-Year Strategic Marketing Plan: 2002 – 2006
AlpValleys Agribusiness Profile 2004
Page 139 of 188
Pears
Summary
Pear production is a minor activity within the AlpValleys region. The industry is mostly conducted within the Indigo Shire, in conjunction with apple production around the Stanley area.
North East Region 1996 – 97 AG Census
2000 – 01 AG Census
Gross value of production $58,567 $24,060
Production volume (kg) 36,656 8,937
Total number of trees 17,965 1,461
Contribution to Victorian GVP of commodity 0.06% 0.03%
Contribution to Australian GVP of commodity 0.05% 0.02%
Estimated number of farms 3 9
Source: ABS Agricultural Census 1997 and 2001
Pear industry overview
Pear production in the AlpValley region is at a very small scale, with a very minor
contribution to Victorian State GVP of pear production.
Source: ABS Agricultural Census - 2001
Projected pear industry growth
2001 Ag Census
% of GVP % of production volume % of farms for commodity
Pear production within the AlpValleys is not predicted to grow.
Pear industry marketing activities
Gourmet pear operation part of gourmet trail.
Contacts
Apple & Pear Australia Limited (APAL) Phone: 03 9329 3511
Fax: 03 9329 3522
References
Apple and Pear Industry Strategic Plan 2002-2007
AlpValleys Agribusiness Profile 2004
Page 141 of 188
Peppermint
Summary
The peppermint industry was the North East is dominated by two producers and occupied an area of approximately 400 hectares until 2002. Both key producers in Corryong (Towong Shire) and Moyhu (Wangaratta Rural City) ceased production
due to changes in market demand, falling yields and falling returns.
The Corryong – based producer is re-entering the market with new plantings (2004) although production levels will not reach their former peaks.
Peppermint oil produced from the plantings has been sold from stock until 2004. River valleys of the North East provide ideal growing conditions for peppermint.
North East Region 1996 – 97 AG Census
2000 – 01 AG Census
Gross value of production $267,967 506,138*
Production volume (kg) 6,038 12,051 kg raw oil*
Total area of production (ha) 127 398*
Contribution to Victorian GVP of commodity 99.9% 99.9%
Contribution to Australian GVP of commodity 57.8% 99%
Estimated number of farms 9 2
Source: ABS Agricultural Census 1997 and 2001, Agricultural Survey 2002
Peppermint industry overview
The peppermint industry of the AlpValleys still continues to provide 100% of the
Victorian production, albeit a much smaller volume.
Peppermint is a perennial crop, irrigated by the centre pivot, and sown over 30 – 40 ha of Upper Murray River flats near Corryong.
After 2 years out of production, the introduction of new plant tissue and planting of a new property has renewed confidence in likely returns.
* ABS Advises that Relative Standard Error (RSE) between 25 – 25%: use data with caution
AlpValleys Agribusiness Profile 2004
Page 142 of 188
Location of the peppermint industry in the AlpValleys region
Source: ABS Agricultural Census - 2001
This location data was correct at the time of the census, however all peppermint in the AlpValleys region is now produced in Towong Shire.
Projected peppermint industry growth
Source Indicator Comments
(ABS) AG Census and survey data
Growth in production volume 1997 to 2001
Value, area and volume of production increased over the period, although the number of farms declined. Only 4 farms in Victoria and 8 in Australia in 2001 census. The region produced 99% of Victorian output by volume, area and value and comprises around half of Australian production. Note: production ceased 2002 until 2004.
Source: ABS Agricultural Census – 1997 and 2001, Agricultural Survey 2002
Peppermint industry labour requirements
One person can effectively manage plantings of peppermint up to 100ha. For the
production of oil, 4 – 5 people are required for mowing, carting, chopping and boiling (the processing phase).
Peppermint industry marketing activities
Established relationships with wholesale buying are used to sell the peppermint oil produced in the AlpValleys. Currently production is targeted at an “Australian Made” market for better confectionary and cosmetics.
There is strong competition from producers in China and India.
Some AlpValleys production is also sold to the US – again via established relationships with US specialist oil companies.
2001 Ag Census
% of GVP % of production volume % of farms for commodity
Peppermint industry strategic advantages and opportunities
� Excellent climate, soils and production capability.
� Clean, green image positive for marketing purposes. � Can be difficult to produce, but this gives competitive advantage to
experienced producers.
Peppermint industry strategic disadvantages and impediments to growth
� Water availability. � Distance from markets (for very fresh produce, but not an issue for oil)
� Fluctuating terms of trade
Contact
Peter Nankervis Corryong Essential Oil
Colac Colac
AlpValleys Agribusiness Profile 2004
Page 144 of 188
Pigs
Summary
The pig industry is small within the AlpValleys region and has been decreasing substantially since 1996. Almost 40 per cent of the industry (based on GVP) is based in the Indigo Shire, with a further 27 per cent of the industry based in the Alpine Shire.
The remainder of the industry is spread between Towong Shire and Wangaratta Rural City. Production within Wodonga Rural City is negligible.
North East Region 1996 – 97 AG Census
2000 – 01 AG Census
2001 – 02 AG Survey
2002 – 03 AG Survey
Gross value of production (pigs slaughtered) ($)
$3,931,206 $862,977 $380,639
Total number of pigs 485,186 2,511 2,187
Contribution to Victorian GVP of commodity 2.06% 0.45%
Contribution to Australian GVP of commodity
0.57% 0.1%
Estimated number of farms 25 21 26
Please note the 2001/02 and 2002/03 figures have a relative standard error of between 50 – 100% and are unreliable. They have been included to indicate the current number of pigs and piggeries
Source: ABS Agricultural Census 1997 and 2001, Agricultural Survey 2002 and 2003
Pig industry overview
Pig Industry gross value of production in the AlpValleys area has significantly reduced in the AlpValleys region between 1997 and 2001 by 78%. The major regional processor, QAF industries, is based in Corowa, NSW.
QAF only slaughters pigs grown under contract to them, and through their own production facilities located in Corowa, Bungowannah, Moulamein, Deniliquin,
Bendigo, East Gippsland, St Arnaud, Gre Gre and Lilydale. QAF own the pigs throughout the growing period, providing their contract growers
with 4 – 5 week old piglets. QAF supply feed, veterinary support and transport. Contract growers are paid for pig growth and through out, based on set
performance indicators. Grain availability, dryer conditions and less residential pressure are key reasons for the
shift in production areas.
Detail Comments
AlpValleys Agribusiness Profile 2004
Page 145 of 188
Product description Meat for local and export market, offal and associated products.
Main season Non-seasonal.
Industry associations VFF, Landcare.
Domestic market information Domestic market consumption growing, but facing subsided import challenges.
Export market information -
Source: ABS Agricultural Location of the pig industry within North East Victoria
Source: ABS Agricultural Census - 2001
Projected pig industry growth
Pig industry strategic advantages and opportunities
2001 Ag Census
% of GVP % of production volume
North East Region
Victoria North East Region
Victoria
Alpine Shire 27.3% 0.1% 34.2% 0.2%
Indigo Shire 39.1% 0.2% 41.9% 0.2%
Towong Shire 15.8% 0.1% 10.6% 0%
Wangaratta (RC) 17.8% 0.1% 12.9% 0.1%
Wodonga (RC) 0% 0% 0.3% 0%
Source Indicator Comments
(ABS) AG Census and survey data
Growth in production volume 1997 to 2001
Considerable decrease in regional production.
Surveys
Current profitability Reduced, in challenging competitive environment.
5 year business plans Not provided.
5 year business outlook Not positive for local non-contract production.
AlpValleys Agribusiness Profile 2004
Page 146 of 188
� Generic improvements.
� Optimism as world trade organisation works to overcome barriers.
� Fresh pork advantage in Australian market.
� Program being developed to push “100% Home Grown” product for both fresh and processed (ham and bacon) market.
Pig industry strategic disadvantages and impediments to growth
� Regionally, unable to compete with company owned and contracted growers in NSW and Central Victoria.
� Subsidised imports from Canada and Denmark.
� Subdivision of land, urban encroachment and “right to farm” issues.
Contact
Australian Pork Limited West Wing, Level 1 43-49 Geils Court
Deakin, 2600 PO Box 148 Deakin West, 2600
Phone: 02 6285 2200 Free call: 1800 789 099
Fax: 02 6285 2288 Nigel Smith
QAF Meat Industries Redlands Road
Corowa Phone: 02 6033 8333
Reference
Australian Pork Limited. Strategic Plan 2002-2005
AlpValleys Agribusiness Profile 2004
Page 147 of 188
Poultry
Summary
Within the AlpValleys region, poultry is a small industry. Chicken production is based on one farm based in Milawa (Wangaratta Rural City) with egg production in Alpine Shire at Porepunkah.
The meat chicken production in Milawa is accredited free range, in the process of
becoming organically certified. At one time, about 8 – 9,000 birds are held, with birds being sent for processing at about 8 weeks of age. Day old specialised meat birds are sourced from Queensland.
Processing occurs at Coburg, with the plant meeting all required industry standards for particular organic, free range production niche. Stock is carried live to the
processor from Milawa by the producer with loads being sent twice per week.
The product goes to equally specialised butchers and restaurateurs and is distributed throughout Melbourne, Victoria and interstate.
Source: ABS Agricultural Census 1997 and 2001, Agricultural Survey 2002 and 2003
North East Region 1996 – 97 AG Census
2000 – 01 AG Census
2001 – 02 AG Survey
2002 -03 AG Survey
2004 AAVAF Survey
Poultry - Gross value of production ($) $45,264 $345,789 $500,000
Total poultry stock on hand at time of census
9,637,716 7,196,330 8,611,375*
Total poultry slaughtered 145,462 97,606 78,521
Eggs - Gross value of production $1,451,371 $29,991 $300,000
Eggs for human consumption 44,670,320 12,902
Contribution to Victorian GVP of commodity 2.5% (eggs only)
0.1273%
Contribution to Australian GVP of commodity
0.5% (eggs only)
0.0341%
Estimated number of farms – poultry and eggs
3 6 1 1 2
AlpValleys Agribusiness Profile 2004
Page 148 of 188
Poultry industry overview
Source AAVAF Survey 2004
Location of the poultry industry within AlpValleys region
Source AAVAF Survey 2004
Free range eggs production on a commercial scale is undertaken near Porepunkah. Production by Pace Farms at Mount Beauty ceased early in 2004.
Projected poultry industry growth
Organic and free range poultry appears to be a growing, but still small niche market. The most likely industry growth for the region will come through existing growers, as
significant barriers now exist (planning, permits, right to farm issues, high establishment costs).
Product description The poultry and egg industry within the North East is very small, with a couple of major producers. There is a free-range chicken farmer operating in the region looking to expand production.
Main season Not seasonal.
Industry associations Hume Murray Food Bowl, FREPA – Free Range Egg and Poultry Australia, VFF.
Domestic market information
Retailers and restaurants represent the major purchasers of the region’s poultry.
Labels/Brands Milawa Free Range Poultry, Bright and Happy Free Range Eggs.
2001 Ag Census
% of GVP
North East Region
Victoria
Alpine Shire 3.6% 0.005%
Indigo Shire 0.3% 0%
Towong Shire 1.4% 0.002%
Wangaratta (RC) 94.8% 0.121%
AlpValleys Agribusiness Profile 2004
Page 149 of 188
Poultry industry labour requirements
Two families are involved with the free range poultry production, with one full time
employee and a requirement for 2 – 3 casuals.
Poultry industry marketing activities
Marketing is undertaken through developing relationships directly with chefs, and
accredited suppliers. Membership of Milawa gourmet region assists through works with other producers
and builds the areas gourmet reputation.
Direct sales occur via Farmers Markets in Wodonga, Collingwood, Hawthorn, St Kilda, Kensington and occasionally Wagga Wagga are an important component of overall sales.
Taxes, rates and charges paid
Taxes, rate and charges
Membership of organisations, normal council rates.
Poultry industry strategic advantages and opportunities
� The free range poultry grower has been established for over 5 years in an industry where only 2 – 3 growers are accredited and operating within
Victoria.
� Niche market production, and accreditation are strategic advantages.
� Relationships with high profile chefs have been important for market
establishment and ongoing success.
� Limited complaints as production meat birds do not have the noise
problems of laying hens, nor roosters.
� Production turnout is relatively quick- 8 weeks.
AlpValleys Agribusiness Profile 2004
Page 150 of 188
Poultry industry strategic disadvantages and impediments to growth
� Set up costs are very high, with an increasing emphasis on meeting EPA and council regulations.
� Local council and neighbours perceptions of industry can be barriers to new establishments.
Contacts
Tony Quinn Milawa Free Range Chicken Kerrs Road
Milawa Phone: 03 5724 3659
Rob Fillisch Baroni Lane
Porepunkah Phone: 03 5756 2715
AlpValleys Agribusiness Profile 2004
Page 151 of 188
Seed production – pasture seeds
Summary
Relatively small amounts of seed are grown in the AlpValleys Region. Major growing
regions are located in New South Wales. Larger share of GVP comes from processing, rather than production.
North East Region (Total Pasture Seeds) 1996 – 97 AG Census
2000 – 01 AG Census
Gross value of production $1,809,509 $818,037
Contribution to Victorian GVP of commodity 8.2% 3.8%
Contribution to Australian GVP of commodity 3.3% 1.4%
Source: ABS Agricultural Census 1997 and 2001, Agricultural Survey 2002
Industry associations Grains Research Development Corporation, Australian Oil Seeds Federation.
Domestic market information
Processors in the region handle large volumes of seed which is produced outside of the region. Most seed is grown under contract and is subject to plant breeders rights.
Labels/Brands Processors in the region handle large volumes of seed which is produced outside of the region and goes to export markets.
AlpValleys Agribusiness Profile 2004
Page 152 of 188
Location of the seed production industry within AlpValleys region
Source: ABS Agricultural Census - 2001
Projected seed production industry growth
Seed production within the region has limited growth potential and is highly
dependent on seasonal conditions.
Seed production industry marketing activities
As most seed is grown under contract there is little regional marketing.
Taxes, rates and charges paid
Taxes, rate and charges
Grains Research and Development Corporation Levy.
Seed production industry strategic advantages and opportunities
Opportunities are dependent on seasonal conditions.
Seed production industry strategic disadvantages and impediments to growth
Most seeds are grown in dry land conditions compared to seed grown in irrigated systems to the north.
2001 Ag Census
% of GVP
North East Region
Victoria
Benalla (RC) 2.27% 0.9%
Indigo Shire 21.6% 0.8%
Towong Shire 51% 1.9%
Wangaratta (RC) 25.2% 1.0%
AlpValleys Agribusiness Profile 2004
Page 153 of 188
Stone fruit (other than cherries)
Summary
Stone fruit is small contributor to GVP within the AlpValleys region. The stone fruit industry is dominated by peaches (81% of GVP) with apricots, nectarines, peaches, plums and prunes making up the remainder. Almost 99% of GVP is produced within
Wangaratta Rural City, particularly in the granitic Warby Ranges.
North East Region 1996 – 97 AG Census
2000 – 01 AG Census
Gross value of production $539,127 $909,198
Production volume (kg) 269,967 402,451
Contribution to Victorian GVP of commodity 1.0% 0.9%
Contribution to Australian GVP of commodity 0.3% 0.4%
Estimated number of farms 37 25
Source: ABS Agricultural Census 1997 and 2001
Stone fruit industry overview
Detail Comments
Product description Fresh fruit.
Main season February to May.
Industry associations AlpValleys Summer Fruit growers Association.
Domestic market information
Most fruit is sold through Sydney and Brisbane market agents, with some produce being sold through both local and Melbourne Farmers Markets.
Export market information
Opportunistic, and usually via Brisbane market agents: UK, New Caledonia, Taiwan, Hong Kong and Singapore (although fumigation for fruit fly is required for Asian Markets).
Source: AAVAF Survey 2004
AlpValleys Agribusiness Profile 2004
Page 154 of 188
Stone fruit grown in the AlpValleys is mostly grown in conjunction with cherries. About 28 growers produce stone fruit with 3 – 4 growers operating at a fully commercial scale.
Regional Produce is predominantly sold through the Brisbane markets, with some export occurring from there. Stone fruit producers are competing against some other southern hemisphere producers – primarily Chile and South Africa.
The main production area sits within a fruit fly exclusive zone, with minor outbreaks controlled locally.
The AlpValleys Summer Fruit Growers Association has led targeted approaches to the reduction of fruit fly outbreaks in nearby Wangaratta.
Oman Orchards have developed packing facilities which are used by 4 – 5 other
growers for both cherries and stone fruit. This allows for fruit sales through single agents with shared transport and handling costs.
Location of the stone fruit industry within North East Victoria
Source: ABS Agricultural Census - 2001
Projected stone fruit industry growth
New plantings of stone fruit are continuing, as well as replacement of varieties top meet consumer demand for dessert peaches and nectarines.
Production volumes are continuing to increase with about 3 – 4 growers operating fully commercially.
2001 Ag Census
% of GVP % of farms for commodity (1997)
North East Region
Victoria North East Region
Victoria
Alpine Shire Less than 1% 14.0% 0.30%
Indigo Shire 1.0% 0% 18.3% 0.39%
Towong Shire 0% 0% 4.7% 0.10%
Wangaratta (RC) 98.5% 0.8% 63.0% 1.33%
AlpValleys Agribusiness Profile 2004
Page 155 of 188
Stone fruit industry labour requirements
Seasonal labour is required for harvesting, up to 25 people for larger orchards (during
peak) additionally packing house casual labour required.
Stone fruit industry marketing activities
Detail Comments
Marketing undertaken
Through agents and industry associations.
Value adding activities
Further information required.
Labels and brands
Omaru Orchards, Auldstone Cellars, Smiths of Taminick, Kelly Country Orchards
Taxes, rates and charges paid
Taxes, rate and charges
Domestic stone fruit levy, export charge (where applicable)
Stone fruit industry strategic advantages and opportunities
� Later fruit production than other regions.
� Good base for joint marketing and cooperation. � Good granitic soil types, access to rainfall water and irrigation water.
� Good demand for quality fruit (different to Goulburn Valley product). � Core group professional growers with reasonable sized properties. � Professional growers able to respond positively to changing consumer
and market demands. � Strong relationships with customers and agents.
Stone fruit industry strategic disadvantages and impediments to growth
� Not mainstream harvest trail area for backpackers; issues with seasonal labour retention and availably.
� Start up costs may be a barrier to entry for new producers (infrastructure,
water, tress, equipment, land costs). � Entry of new hobby farmers, unaware of market and production pitfalls.
� Water availability of concern (especially regarding irrigation and farm dams).
AlpValleys Agribusiness Profile 2004
Page 156 of 188
Contact
Alpine Valleys Summer Fruit Growers Association
Bill Scott (President) Kelly Country Orchards Warby Range Road
Mt Bruno Phone: 03 5766 2248
Andrew Smith Smiths of Taminick
Gravel Pit Rd Taminick
Phone: 03 5725 7217
AlpValleys Agribusiness Profile 2004
Page 157 of 188
Sheep and Lamb
Summary
Of the 26.4 million sheep in Victoria, approximately 21% are in north east Victoria. The sheep industry is the 6th largest in the AlpValleys region. Over one third of the industry
(based on GVP) is based in Wangaratta Rural City. Towong and Indigo Shires contain a further 47 per cent of the industry. As is similar to the beef industry, the sheep industry has significant indirect employment benefits through meat processors, wool
buyers and sellers, brokers and buyers, livestock agents, grain providers and transport service providers.
North East Region 1996 – 97 AG Census
2000 – 01 AG Census
2001 – 02 AG Survey
2003 – 03 AG Survey
Gross value of production $6,538,348 $10,142,883 $16,663,541^ -
Production volume (kg) 378,002 452,725 3,790,006.1 3,98,970^
Total area of production 1,665.2 1,329 $421,137 359,924^
Contribution to Victorian GVP of commodity 1.69% 2.03%
Contribution to Australian GVP of commodity
0.31% 0.41%
Estimated number of farms 551 513 500^ 479^
Source: ABS Agricultural Census – 1997 and 2001, Agricultural Survey 2002 and 2003
Sheep industry overview
Detail Comments
Product description Fresh meat for local and export market, live sheep for export, offal and associated products
Main season The majority of survey respondents stated the main season as being over spring and summer.
Industry associations VFF, North East Sheep Breeders, Landcare.
Domestic market information
Prices received for lamb ranged from $60 to $110 per lamb. These lamb are sold at stockyards within the North East Region or freighted directly to the major city markets of Melbourne and Sydney
AlpValleys Agribusiness Profile 2004
Page 158 of 188
Export market information A number of survey respondents stated their lamb was exported to countries such as the USA, Japan and China by brokers like Elders, Casticombs, Rodwells and Wesfarmers.
Source: AVAAF Survey 2004
Location of the sheep industry within North East Victoria
Source: ABS Agricultural Census – 2001
Projected sheep industry growth
Source Indicator Comments
(ABS) AG
Census and survey data
Growth in production volume 1997 to 2001
Stock of sheep and lambs was 378,002 in 1997 and grew by 16.5% to 452,725 in 2001 for the North East region
Surveys
Current profitability Responses ranged evenly between very low, low, satisfactory and high.
5 year business plans Most reported no change in plans with the rest holding plans to increase stocking rate of lambs.
5 year business outlook
The majority of respondents reported a satisfactory business outlook, followed by a poor outlook and a small porportion stated having a good or very good 5 year outlook.
2001 Ag Census
% of GVP % of production volume % of farms for commodity
North East Region
Victoria North East Region
Victoria North East Region
Victoria
Alpine Shire 1.2% 0.03% 1.9% 0.04% 2% 0.09%
Wangaratta (RC) 805% 0.18% 8.8% 0.18% 8% 0.32%
Indigo Shire 27.5% 0.59% 23.2% 0.47% 47% 0.99%
Towong Shire 20.1% 0.43% 22.5% 0.46% 23% 0.93%
Wangaratta (RC) 36.3% 0.78% 37.9% 0.77% 39% 1.57%
Wodonga (RC) 6.3% 0.13% 5.7% 0.12% 4% 0.15%
AlpValleys Agribusiness Profile 2004
Page 159 of 188
Business planning / budgeting
50% of respondents stated they conducted a formal business plan or budget that ranged evenly between 1 year plans and 2-3 year plans. A couple stated they undertook 5+ year formal plans.
Age of producers The majority surveyed fell within the older age brackets of 50 to 59 years and 60 years plus. Around 16% were aged between 30 and 39 years and 16% aged between 40 and 49 years.
Capital expenditure 2002-03 financial year
Capital expenditure was undertaken by nearly all respondents and ranged from $2,000 to $200,000 for the financial year. The median level of capital expenditure as a percentage of gross income was 13.5%.
5Sheep industry labour requirements
Detail Comments
Areas of indirect employment
Meat processors / abattoirs and manufacturers, brokers / buyers, stockyards / sale yards, livestock agents, suppliers, transport service providers.
Labour market issues
Seasonal casual labour is the main type of labour required by producers, with the main seasons being spring, summer and autumn depending on the producer. Some farmers stated difficulty in finding experienced casual labour at peak times.
Sheep industry marketing activities
Detail Comments
Marketing undertaken
Mailouts, sales trips, trade shows and market information management.
Value adding activities
Were only conducted by a couple of respondents, with one stating they were involved in an integrated business for lamb producing and finishing.
Labels and brands None stated.
Taxes, rates and charges paid
AlpValleys Agribusiness Profile 2004
Page 160 of 188
Taxes, rate and charges
Council rates, yard fees, AG advisory Service, broker charges, livestock levies .
Sheep industry strategic advantages and opportunities
� The central location of the North East allows for accessibility and proximity
to key major markets in Melbourne and Sydney – and for product to be shipped overseas.
� Versatility of land use, moderate climate, reasonable rainfall, and a strong farming infrastructure base such as transport networks and local stock markets.
� Green and clean image of the region- provided water supplies remain healthy.
� Prime lamb has further growth potential
� More intensive production through feed lotting
� Contracting of lifestyle properties
� Sheep milking
Sheep industry strategic disadvantages and impediments to growth
� The huge variation in market prices throughout the year, especially where seasonal conditions are adverse. The possible over supply / market
saturation within the lamb industry.
� Drought, input costs, council rates, capital costs, interest rates, fluctuating exchange rate and government regulations.
� Lack of land and adequate capital / machinery as well as personal time constraints.
� Lack of suitable casual or seasonal labour for peak periods.
� Peri urban development
� Animal rights pressures
AlpValleys Agribusiness Profile 2004
Page 161 of 188
Tobacco
Summary
Tobacco growing in the North East occurs mainly around Myrtleford and along the river valleys of the Ovens, King and Kiewa Rivers. The Tobacco Cooperative of Victoria operates Australia’s only threshing plant in Myrtleford.
The industry has significant value to the region (approximately $24 million per annum
in GVP) through both production and employment. The industry in the North East is undergoing significant change as domestic consumption falls, new industries begin to occupy land where tobacco was once gown and tighter smoking regulations are
implemented. On a more positive note the North East has become the main tobacco growing region of Australia.
North East Region 1996 – 97 AG Census
2000 – 01 AG Census
2001 – 02 AG Survey
2003 – 03 AG Survey
Gross value of production $24,765,924 $22,883,796 $24,256,039^
Production volume (kg) 4,127,654 3509,785 3,790,006.1 3,98,970^
Total area of production 1,665.2 1,329 1,418.5 1,405^
Contribution to Victorian GVP of commodity 99.7% 100%
Contribution to Australian GVP of commodity
46.2% 22.3%
Estimated number of farms 114 111 115 121^
Source: ABS Agricultural Census 1997 and 2001, Agricultural Survey 2002 and 2003
Current production for the 2003-2004 year is approximately at 3.8 million kg, following
average production between 3.7-3.9 million kg per year for the last few years. Gross value of production is $23-25 million per annum average. There are currently 135 growers. The closing price for 2003 was $6.579/kilogram.
AlpValleys Agribusiness Profile 2004
Page 162 of 188
Tobacco industry overview
Detail Comments
Product description North East Victoria represents the only tobacco growing region in Victoria.
Main season Main activity is primarily from November through to June.
Industry associations Tobacco Growers of Victoria (TGV), Tobacco co-op.
Domestic market information
Main purchaser of the product is cigarette manufacturers.
Export market information
Tobacco growers surveyed stated that none of their tobacco was exported.
Location of the Tobacco industry within AlpValleys region
Source: ABS Agricultural Census - 2001 Of the 135 growers in the region, approximately 25 are located in the Wangaratta
Rural City.
Projected Tobacco industry growth
With a large number of laws and regulations impacting on the tobacco industry, it is
subjected to a highly controlled, regulatory environment. Contracts with Phillip Morris and British American Tobacco Australia are current until 2007 with static growth throughout this period. North East Victorian growers continue to have a medium term
contract, with both manufacturers, to grow around four million kilos a year.
2001 Ag Census
% of GVP % of production volume % of farms for commodity
Production declined by 15% over the period from 1997 to 2001, although the data from the Agriculture surveys for 2001-02 and 2002-03 indicate that production has stabilised at the 2001 level.
Surveys
Current profitability Was reported as very low.
5 year business plans
No change for those surveyed.
5 year business outlook
Was reported as poor.
Business planning / budgeting
Planning was undertaken by one tobacco grower, for 1 year in advance.
Age of producers Those surveyed fell within the age bracket 50 to 59 years.
Capital expenditure 2002-03 financial year
Ranged from between 80% and 90% of gross income, and ranged from between $100,000 and $300,000.
Tobacco industry labour requirements
Tobacco farming is a significant employer in the Shire, with up to 270 families attributing income to the growing of tobacco. During the harvesting season each
farm employs on average 5 persons, including members of the grower’s family. The seasonal employment period is between February and early May, with casual
and itinerant workers providing this labour. At the peak of season approximately 680-700 persons are employed as labour on tobacco farms.
As this tobacco is manufactured domestically there is a resultant multiplier effect on employment and manufacturing investment.
Detail
Full time and part time staff was employed by tobacco growers surveyed, with no casual employment required. Each farm required 2-5 full time employees, and 2-3 part time staff.
Areas of indirect employment Suppliers, transport providers, buyers - cigarette manufacturers.
Labour market issues None stated
AlpValleys Agribusiness Profile 2004
Page 164 of 188
Tobacco industry marketing activities
Marketing is not a requirement for tobacco growers due to their produce being directly purchased by cigarette manufacturers. No value adding is required either.
Growers have no on farm marketing for tobacco, and business planning is heavily linked to shares. Tobacco growers in Victoria are all shareholders of the Tobacco Cooperative of Victoria (TCV), and can produce for sale an amount of tobacco,
which equates with the number of shares held. This share arrangement has replaced the quota system, which operated under the TLMB. The Tobacco Cooperative of
Victoria not market tobacco.
Taxes, rates and charges paid
Taxes, rate and charges
Council rates and applicable government taxes on tobacco.
Tobacco industry strategic advantages and opportunities
• The level of the Australian dollar and improvement in leaf quality has assisted the competitive position.
• Consolidation of North East Victoria as the major production region for
tobacco in Australia.
• Suitable microclimate, particularly soil type and water availability at
critical growing periods.
• Access to transport infrastructure, the availability of a green leaf threshing plant and cost of storage for tobacco is significantly cheaper in Myrtleford than in a metropolitan location.
• With tobacco being manufactured domestically there is a follow on multiplier effect on employment and manufacturing investment within
the region.
• One of the last research projects funded by the Tobacco Research Development Corporation (TRDC), before its incorporation into
Horticulture Australia Limited (HAL) and which has received ongoing funding for the 2002/03 financial year, is a study evaluating the potential
non-smoking uses of tobacco leaf grown in Northern Queensland. This project has the potential to deliver long-term markets for tobacco growers in North East Victoria.
AlpValleys Agribusiness Profile 2004
Page 165 of 188
Tobacco industry strategic disadvantages and impediments to growth
• Government taxes on tobacco
• With Australian tobacco consumption still declining and a reduction in
manufacturing companies’ sourcing local tobacco, North East Victoria
production has consolidated. Contributing to the consumption decline will be the introduction of the States tighter smoking regulations within public places
from 2007. • • Rationalisation among manufacturers as well as the growing industry is
occurring at an increasing rate. There are now only two Australian manufacturers operating in Australia, Philip Morris and British American
Tobacco Australasia.
• The continuing need to provide high quality tobacco to manufacturers requires increasingly greater capital and resource inputs to make sure
tobacco leaf meets exacting quality requirements.
• Adjustment pressures from deregulation of the tobacco industry have seen
new horticultural enterprises developing in the traditional tobacco growing areas. Restructuring and deregulation has reduced the number of tobacco producers in NE river valleys from 194 to 135.
AlpValleys Agribusiness Profile 2004
Page 166 of 188
Wool
Summary
90 per cent of the wool industry, in the AlpValleys region, is located within the Shires of Towong and Indigo and the Rural City of Wangaratta. The industry is the 9th largest in the region contributing through the production of wool and having significant flow
on effects in employment and associated industries. Whilst flock sizes and production fluctuates annually with climatic and market conditions there are no major
opportunities or impediments within or outside of the region, threatening significant change within the industry.
North East Region 1996 – 97 AG Census
2000 – 01 AG Census
2001 – 02 AG Survey
Gross value of wool production $8,902,397 $9,603,909 $10,576,801
Wool production (kg) 1,585,803 1,663,801 1,557,266
Contribution to Victorian GVP of commodity 1.7% 1.9%
Contribution to Australian GVP of commodity 0.3% 0.4%
Estimated number of farms 524 477
Source: ABS Agricultural Census 1997 and 2001, Agricultural Survey 2002 and 2003
Wool industry overview
Detail Comments Product description
Unprocessed wool.
Main season Peaks in the season fall between the months of October to March.
Industry associations
Best Wool, VFF, Australian Wool Services Ltd, Australian Wool Processors Council.
Domestic market information
Producer's wool sells from anywhere between $5 and $32 per kilogram.
Export market information
Respondents stated that anywhere between 30% and 100% of their wool was exported to Asian countries including China, Japan and Singapore.
Source: AAVAF Survey 2004
AlpValleys Agribusiness Profile 2004
Page 167 of 188
Location of the wool industry within the AlpValleys region
Source: ABS Agricultural Census - 2001
Projected wool industry growth
Source Indicator Comments
(ABS) AG Census and survey data
Growth in production volume 1997 to 2001
Output of wool has increased over the two census periods by 5% from 1, 585 tonnes in 1997 to 1,664 tonnes in 2001.
Surveys
Current profitability Ranged from satisfactory to very low with one response stating very high profitability who undertook a substantial secondary horticultural activity.
5 year business plans
Most reported little or no change in plans.
5 year business outlook
Almost all respondents stated they expect a satisfactory 5 year outlook.
Business planning / budgeting
More than half of the shearers surveyed draft formal business plans, ranging from 1 year plans to 5 plus years.
Age of producers Ranged evenly between the age brackets: 40 to 49, 50 to 59 and 60 plus years.
Capital expenditure 2002-03 financial year
Represented between 0% and 90% of gross income, and ranged from between $1,000 to $300,000.
2001 Ag Census
% of GVP % of production volume % of farms for commodity
Labour requirements of those shearers surveyed lean towards part time and casual labour, with between 1-6 part time and 1-5 casual employees. Two respondents required one full time employee each.
Areas of indirect employment
Suppliers, transport providers, buyers - brokers and wholesalers.
Labour market issues
One respondent from Benalla stated a difficulty in obtaining a shearer or shed hand.
Wool industry marketing activities
Taxes, rates and charges paid
Taxes, rate and charges
Council rates, broker charges wool sales, wool tax (IWS).
Wool industry strategic advantages and opportunities
� Transport infrastructure and road network, accessibility to markets and
major cities, proximity to most services and strong telecommunications.
� Reasonably reliable rainfall and good climate.
� Capital gain on land, excellent tourism/visitor potential.
� Respondents stated marketing for wool as an area in need of improvement.
Wool industry strategic disadvantages and impediments to growth
Detail Comments
Marketing undertaken
Stock agents are a key source to of market information to wool producers, such as Homes Y Sackett and Corcoran Parker.
Value adding activities
None.
Labels and brands
Quendatte Wool, EH Strathbogie.
AlpValleys Agribusiness Profile 2004
Page 169 of 188
� Price of wool and reliance on unpredictable export markets, couple with high running costs result in generally low levels of profitability for wool producers.
� Lack of education programs suitable to the needs of individual farmers, with some farmers surveyed reporting their skills base as a limitation in the development of their agribusiness.
� Labour availability (shearer/shedhand).
� Level of government regulation and charges placed on wool producers.
Contact
AlpValleys Agribusiness Profile 2004
Page 170 of 188
GlossaryGlossaryGlossaryGlossary
AlpValleys Agribusiness Profile 2004
Page 171 of 188
BibliographyBibliographyBibliographyBibliography
AlpValleys Agribusiness Profile 2004
Page 172 of 188
AppendicesAppendicesAppendicesAppendices
Appendix A – Data Definition
Appendix B – Communication Strategy
Appendix C – Evaluation Plan
Appendix D - ABS process of determining the value of production and number