232
Financial Report 2004 ab

Financial Report 2004
ab


Introduction 1UBS financial highlights 2UBS at a glance 3Sources of information 4Contacts 6
Presentation of Financial Information 7UBS reporting structure 8Measurement and analysis of performance 9Changes in accounting and presentation in 2005 10
UBS 15Results 16Risk factors 16
UBS Targets 19
Financial Businesses 23Results 24Wealth Management & Business Banking 32Global Asset Management 41Investment Bank 47Wealth Management USA 52Corporate Center 58
Industrial Holdings 65
Balance Sheet and Cash Flows 67Balance sheet and off-balance sheet 68Cash flows 71
Accounting Standards and Policies 73Accounting principles 74Critical accounting policies 76
Financial Statements 81
UBS AG (Parent Bank) 191
Additional Disclosure Required under SEC Regulations 205
Our Financial Report forms an essential part of our annualreporting portfolio. It includes the audited financial statementsof UBS for 2004 and 2003, prepared according to Interna-tional Financial Reporting Standards (IFRS) and reconciled tothe United States’ Generally Accepted Accounting Principles(US GAAP), and the audited financial statements of UBS AG(the “Parent Bank”) for 2004 and 2003, prepared accordingto Swiss Banking Law requirements. It also contains a discus-sion and analysis of the financial and business performanceof UBS and its Business Groups, and additional disclosuresrequired under Swiss and US regulations.
The Financial Report should be read in conjunction with theother information published by UBS, described on page 4.
We sincerely hope that you will find our annual reports useful and informative. We believe that UBS is one of theleaders in corporate disclosure, although we would be veryinterested to hear your views on how we might improvethe content, information and presentation of the reportingproducts that we publish.
Mark BransonChief Communication OfficerUBS
1
Introduction

Introduction
UBS Income Statement
For the year ended % change from
CHF million, except where indicated 31.12.04 31.12.03 31.12.02 31.12.03
Net profit 8,089 6,239 3,530 30
Basic earnings per share (CHF) 1 7.68 5.59 2.92 37
Diluted earnings per share (CHF) 1 7.47 5.48 2.87 36
Return on shareholders’ equity (%) 2 24.7 17.8 8.9
KPI’s adjusted for significant financial events and pre-goodwill 3, 4
Basic earnings per share (CHF) 5 8.60 6.43 4.57 34
Return on shareholders’ equity (%) 6 27.7 20.5 13.9
Financial Businesses7
Operating income 37,402 33,790 34,107 11
Operating expenses 26,935 25,613 29,570 5
Net profit 8,044 6,239 3,530 29
Cost / income ratio (%) 8 72.6 75.6 86.4
Net new money, wealth management businesses (CHF billion) 9 59.4 50.8 36.2
Headcount (full-time equivalents) 67,424 65,929 69,061 2
Earnings adjusted for significant financial events and pre-goodwill 3, 4
Operating income 37,402 33,629 33,880 11
Operating expenses 26,048 24,670 27,110 6
Net profit 8,931 7,180 5,524 24
Cost / income ratio (%) 8 70.2 73.2 79.7
UBS balance sheet and capital management
As at % change from
CHF million, except where indicated 31.12.04 31.12.03 31.12.02 31.12.03
Balance sheet key figures
Total assets 1,734,784 1,550,056 1,346,678 12
Shareholders’ equity 34,978 35,310 38,952 (1 )
Market capitalization 103,638 95,401 79,448 9
BIS capital ratios
Tier 1 (%) 10 11.8 11.8 11.3
Total BIS (%) 13.6 13.3 13.8
Risk-weighted assets 264,125 251,901 238,790 5
Invested assets (CHF billion) 2,250 2,133 1,959 5
Long-term ratings
Fitch, London AA+ AA+ AAA
Moody’s, New York Aa2 Aa2 Aa2
Standard & Poor’s, New York AA+ AA+ AA+
1 For the EPS calculation, see note 8 to the financial statements. 2 Net profit / average shareholders’ equity less dividends. 3 Excludes the amortization of goodwill and other intangible assets.4 Details of significant financial events can be found in the measurement and analysis of performance section on page 9. 5 Net profit less the amortization of goodwill and other intangible assets andsignificant financial events (after-tax) /weighted average shares outstanding. 6 Net profit less the amortization of goodwill and other intangible assets and significant financial events (after-tax) /average shareholders’ equity less dividends. 7 Excludes results from Industrial Holdings. 8 Operating expenses / operating income less credit loss expense or recovery. 9 Includes WealthManagement and Wealth Management USA. Excludes interest and dividend income. 10 Includes hybrid Tier 1 capital, please refer to note 29 to the financial statements.
From third quarter 2004 onwards, Motor-Columbus has been fully consolidated in UBS’s Financial Statements. The reportingstructure is split into two components: Financial Businesses and Industrial Holdings.
2
UBS financial highlights

UBS is one of the world’s leading financial firms, serving adiscerning global client base. As an organization, it combinesfinancial strength with a global culture that embraces change.As an integrated firm, UBS creates added value for clients bydrawing on the combined resources and expertise of all itsbusinesses.
UBS is present in all major financial centers worldwide, withoffices in 50 countries. UBS employs 67,424 people, 39% inthe Americas, 38% in Switzerland, 16% in Europe and 7%in the Asia Pacific time zone.
UBS is one of the best-capitalized financial institutions in the world, with a BIS Tier 1 ratio of 11.8%, invested assets ofCHF 2.25 trillion, shareholders’ equity of CHF 35.0 billion andmarket capitalization of CHF 103.6 billion on 31 December 2004.
Businesses
Wealth managementWith more than 140 years of experience, an extensive globalnetwork of around 180 offices and almost CHF 800 billion ininvested assets, UBS is the world’s leading wealth managementbusiness. Some 3,700 client advisors provide a comprehensiverange of services customized for wealthy individuals, rangingfrom asset management to estate planning and from corporatefinance to art banking. In the US, UBS is one of the biggest pri-vate client businesses with a client base of nearly 2 million. ItsAmerican network of around 7,500 financial advisors managesroughly CHF 640 billion in invested assets and provides sophis-ticated services to affluent and high net worth clients.
Investment banking and securitiesUBS is a global investment banking and securities firm witha strong institutional and corporate client franchise. Consis-
tently placed in the top tiers of major industry rankings, it isa leading player in the global primary and secondary marketsfor equity, equity-linked and equity derivative products. Infixed income, it is a first-rate global player. In foreign ex-change, it places first in many key industry rankings. In invest-ment banking, it provides first-class advice and executioncapabilities to its corporate client base worldwide. All itsbusinesses are sharply client-focused, providing innovativeproducts, top-quality research and comprehensive access tothe world’s capital markets.
Asset managementUBS, a leading asset manager with invested assets of slightlymore than CHF 600 billion, provides a broad base of inno-vative capabilities stretching from traditional to alternativeinvestment solutions for, among other clients, financial inter-mediaries and institutional investors across the world.
Swiss corporate and individual clientsDepending on segment, UBS holds roughly a quarter and athird of the Swiss banking market. It offers comprehen-sive banking and securities services for approximately 3.5 mil-lion individual and around 143,000 corporate clients,including institutional investors, public entities and foun-dations based in Switzerland, as well as 3,000 financial insti-tutions worldwide. With a total loan book of nearly CHF140 billion, UBS leads the Swiss lending and retail mortgagemarkets.
Corporate CenterThe Corporate Center partners with the businesses, ensuringthat the firm operates as a coherent and integrated wholewith a common vision and set of values.
3
UBS at a glance

Introduction
Publications
This Financial Report is available in English and German. (SAP no. 80531-0501).
Annual Review 2004Our Annual Review contains a description of UBS and ourBusiness Groups, as well as a summary review of our per-formance in 2004. It is available in English, German, French,Italian, Spanish and Japanese. (SAP no. 80530-0501).
Handbook 2004 /2005The Handbook 2004 /2005 contains a detailed descriptionof UBS, our strategy, organization, and businesses, as wellas our financial management including credit, market andoperational risk, our capital management approach anddetails of our corporate governance. It is available in Englishand German. (SAP no. 80532-0501).
Quarterly reportsWe provide detailed quarterly financial reporting and analy-sis, including comment on the progress of our businesses andkey strategic initiatives. These quarterly reports are availablein English.
The compensation reportOur compensation report provides detailed information onthe compensation paid in 2004 to the members of UBS’sBoard of Directors (BoD) and the Group Executive Board(GEB). The report is available in English and German. (SAP no. 82307-0501). The same information can also be read inthe Corporate Governance chapter of the Handbook 2004 /2005.
The making of UBSA brochure published in early 2005 outlines the series of trans-formational mergers and acquisitions that created today’sUBS. It also includes brief profiles of the firm’s antecedentcompanies and their historical roots. It is available in Englishand German. (SAP no. 82252).
How to order reportsEach of these reports is available on the internet at:www.ubs.com/investors, in the Financials section. Alterna-tively, printed copies can be ordered, quoting the SAP num-
ber and the language preference where applicable, from UBS AG, Information Center, P.O. Box, CH-8098 Zurich,Switzerland.
Information tools for investors
WebsiteOur Analysts and Investors website at www.ubs.com/investorsoffers a wide range of information about UBS, financial infor-mation (including SEC filings), corporate information, shareprice graphs and data, an event calendar, dividend informa-tion and recent presentations given by senior management toinvestors at external conferences. Our information on the in-ternet is available in English and German, with some sectionsin French and Italian as well.
Messaging serviceOn the Analysts and Investors website, you can register toreceive news alerts about UBS via Short Messaging System(SMS) or e-mail. Messages are sent in either English or German and users are able to state their preferences for thetopics of the alerts received.
Results presentationsSenior management presents UBS’s results every quarter.These presentations are broadcast live over the internet, andcan be downloaded on demand. The most recent resultwebcasts can be found in the Financials section of ourInvestors and Analysts website.
Form 20-F and other submissions to the US Securitiesand Exchange Commission
We file periodic reports and submit other information aboutUBS to the US Securities and Exchange Commission (SEC).Principal among these filings is Form 20-F; our Annual Reportfiled pursuant to the US Securities Exchange Act of 1934.
Our Form 20-F filing is structured as a “wrap-around”document. Most sections of the filing are satisfied by referring to parts of the Handbook 2004 / 2005 or to partsof this Financial Report 2004. However, there is a smallamount of additional information in Form 20-F which is notpresented elsewhere, and is particularly targeted at readersin the US. You are encouraged to refer to this additionaldisclosure.
4
Sources of information
This Financial Report contains our audited financial statements for the year 2004 and the related detailedanalysis. You can find out more about UBS from the sources shown below.

You may read and copy any document that we file withthe SEC on the SEC’s website, www.sec.gov, or at the SEC’spublic reference room at 450 Fifth Street NW, Washington, DC,20549. Please call the SEC at 1-800-SEC-0330 (in the US) orat +1 202 942 8088 (outside the US) for further informationon the operation of its public reference room. You may also
inspect our SEC reports and other information at the New YorkStock Exchange, Inc., 20 Broad Street, New York, NY 10005.Much of this additional information may also be found on theUBS website at www.ubs.com/investors, and copies of docu-ments filed with the SEC may be obtained from UBS’s InvestorRelations team, at the addresses shown on the next page.
5
The legal and commercial name of thecompany is UBS AG. The company wasformed on 29 June 1998, when UnionBank of Switzerland (founded 1862)and Swiss Bank Corporation (founded1872) merged to form UBS.UBS AG is incorporated and domiciledin Switzerland and operates underSwiss Company Law and Swiss Federal
Banking Law as an Aktiengesellschaft,a corporation that has issued shares ofcommon stock to investors.The addresses and telephone numbersof our two registered offices are:Bahnhofstrasse 45, CH-8098 Zurich, Switzerland,telephone +41-44-234 11 11;and Aeschenvorstadt 1,
CH-4051 Basel, Switzerland, telephone +41-61-288 20 20.UBS AG shares are listed on the SWXSwiss Exchange (traded through itstrading platform virt-x), on the New York Stock Exchange and on the Tokyo Stock Exchange.
Corporate information

Introduction
6
Contacts
Switchboards
For all general queries. Zurich +41-44-234 1111
London +44-20-7568 0000
New York +1-212-821 3000
Hong Kong +852-2971 8888
Media Relations
Our Media Relations team supportsglobal media and journalists fromoffices in Zurich, London, New Yorkand Hong Kong.
www.ubs.com/media
Zurich +41-44-234 8500 [email protected]
London +44-20-7567 4714 [email protected]
New York +1-212-882 5857 [email protected]
Hong Kong +852-2971 8200 [email protected]
Shareholder Services
UBS Shareholder Services, a unitof the Company Secretary, isresponsible for the registration ofthe Global Registered Shares.
Hotline +41-44-235 6202 UBS AG
Fax +41-44-235 3154 Shareholder Services
P.O. Box
CH-8098 Zurich, Switzerland
US Transfer Agent
For all Global Registered Share-related queries in the US.
www.melloninvestor.com
Calls from the US +1-866-541 9689 Mellon Investor Services
Calls outside the US +1-201-329 8451 Overpeck Centre
Fax +1-201-296 4801 85 Challenger Road
Ridgefield Park, NJ 07660, USA
Investor Relations
Our Investor Relations team supportsinstitutional, professional and retail investors from our office in Zurich.
www.ubs.com/investors
Zurich
Hotline +41-44-2344100 UBS AG
Matthew Miller +41-44-234 4360 Investor Relations
Patrick Zuppiger +41-44-234 3614 P.O. Box
Caroline Ryton +41-44-234 2281 CH-8098 Zurich, Switzerland
Fax +41-44-234 3415 [email protected]

Presentation of Financial Information

Presentation of Financial Information
Changes to reporting structure in 2004
We implemented a new reporting structure during 2004, un-der which we separate the analysis of our financial businessesfrom the impact of our industrial holdings. We adopted this newreporting structure on assuming majority ownership of theholding company Motor-Columbus after purchasing an addi-tional 20% stake on 1 July 2004. Motor-Columbus’s onlysignificant asset is a 59.3% interest in the Atel Group. Atel,based in Olten, Switzerland, is an energy provider focused ondomestic and international power generation, electricity trans-mission, energy services as well as electricity trading and mar-keting. Due to the increased complexity that the consolidationof this energy utility adds to our financial reporting, we havesplit the commentary of our results into two parts. We have pro-vided commentary and analysis of our financial businesses –which include all our pre-existing business units – separatelyfrom the new industrial holdings unit, housing Motor-Columbus. In this way, we aim for complete continuity in thepresentation and analysis of our core businesses. The newreporting structure is shown in detail in the diagram below.
We also decided in 2004 to increase the transparency ofour Corporate Center by splitting it into two business units:Corporate Functions and Private Banks & GAM, showingseparately the performance of the holding company whichcontains our independently branded private banks and thespecialist asset manager GAM.
None of the above changes had an impact on our consoli-dated financial statements, but we have restated our segmentreporting for prior periods for all business units affected toreflect these changes.
Changes to accounting in 2004
At the start of 2004, we implemented the following changesin accounting:– early adoption of revised IAS 32 Financial Instruments:
Disclosure and Presentation and revised IAS 39 FinancialInstruments: Recognition and Measurement.
– change in the accounting for investment property from his-torical cost less accumulated depreciation to the fair valuemethod.
– change in accounting for credit losses on over-the-counter (OTC) derivatives which are now reported as incurred in net trading income and no longer chargedto credit loss expense (and deferred over three years for internal management reporting and in the resultsdiscussion).
– exclusion from invested assets of corporate client assets inthe Business Banking Switzerland unit (except for pensionfund assets).These changes lowered 2003 and 2002 net profit by
CHF 146 million and CHF 5 million respectively. All figuresand results presented in this report reflect these changes.
Other new disclosures
As part of our continuing effort to improve the transparencyof our financial reporting and provide the best possibleunderstanding of our business, we have made a number ofenhancements to our disclosure.
In the results discussion, we split our underwriting feeresults to show equity and fixed income contributionsseparately.
In our Business Banking Switzerland unit, we split ourrevenues to show the breakdown between interest incomeand non-interest income, giving a more distinct picture of theunit’s sources of revenue.
In the Wealth Management USA Business Group, wenow indicate the split between private client and municipalfinance revenues, better explaining the performance of thebusiness. To that end, we have also introduced a new keyperformance indicator (KPI) that shows the productivity perfinancial advisor.
With the launch of our IT infrastructure unit (ITI), we havealso started to show a new line called ‘Services to / from other business units’. This line is a net figure consisting of allinter-business services, the majority of which relate to ITI.
8
UBS reporting structure
UBS Reporting Structure
Financial Businesses
Wealth Management Private Banks & GAM
Business BankingSwitzerland
Corporate Functions
Wealth Management & Business Banking
Global Asset Management
Investment Bank Wealth Management USA
Corporate Center Motor-Columbus
Industrial Holdings

UBS’s performance is reported in accordance with Interna-
tional Financial Reporting Standards (IFRS). Additionally, forseveral years, we have provided comments and analysis on anadjusted basis which excludes from the reported amountscertain items we term significant financial events (SFEs). Anadditional adjustment we have used in our results discussionis the exclusion of the amortization of goodwill and otheracquired intangible assets.
We will in future change this approach as accountingstandards no longer require the amortization of goodwill, byfar the largest adjustment we have been making. From 2005onwards, we will no longer present current results on thisadjusted basis.
The adjustments we have made up to and including this2004 report reflect our internal approach to analyzing our re-sults and managing the company, in which SFE-adjustedfigures before the amortization of goodwill and intangibleshave been used to assess performance against peers and toestimate future growth potential. In particular, our financialtargets have been set in terms of adjusted results, excludingSFEs and the amortization of goodwill and intangibles. All theanalysis provided in our internal management accounting hasbeen based on operational SFE-adjusted performance. Thishas helped us to illustrate the underlying operational perform-ance of our business, insulated from the impact of individualgain or loss items that are not relevant to our management’sbusiness planning decisions. A policy approved by the GroupExecutive Board (GEB) defines which items have been classi-fied as SFEs.
Items have been treated as SFEs when they are event-specific, significant for the consolidated financial statementsof UBS, UBS-specific, rather than industry-wide, and not in-dicative of or relevant for future performance.
Reflecting that definition, we had no SFEs in 2004, one in2003, and three in 2002. The relevant SFEs were:– A net gain of CHF 2 million (pre-tax CHF 161 million)
in second quarter 2003 from the sale of the Wealth Management USA Business Group’s CorrespondentServices Corporation (CSC) clearing business. A substan-tial portion of CSC’s net assets comprised goodwillstemming from the PaineWebber acquisition. After de-ducting taxes of CHF 159 million (based on the purchaseprice) and the writedown of the goodwill associated withCSC, the net gain from the transaction was CHF 2 mil-lion.
– In fourth quarter 2002, a non-cash writedown of CHF953 million (pre-tax CHF 1,234 million) relating to the value of the PaineWebber brand that was held as anintangible asset on our balance sheet.
– In fourth quarter 2002, a net gain of CHF 60 million (pre-tax CHF 72 million) from the sale of Klinik Hirslanden,a private hospital group.
– In first quarter 2002, a net gain of CHF 125 million (pre-tax CHF 155 million) from the sale of private bankHyposwiss.
Seasonal characteristics
Our main businesses do not generally show significant sea-sonal patterns – except for the Investment Bank BusinessGroup, where revenues are impacted by the seasonal charac-teristics of general financial market activity and deal flows ininvestment banking.
When discussing quarterly performance, we thereforecompare the Investment Bank’s results of the reported quar-ter with those achieved in the same period of the previousyear. Similarly, when considering the impact of the InvestmentBank’s performance on UBS’s financial statements, we discussour overall quarterly performance on a year-on-year basis –comparing the actual quarter with the same quarter in theprevious year. For all other Business Groups, results are com-pared with the previous quarter as they are only slightlyimpacted by seasonal components (e. g. asset withdrawals in fourth quarter or lower client activity levels during theholiday season).
Targets and performance measures
UBS targetsAt UBS we focus on a consistent set of four long-term finan-cial targets defined across periods of varying market condi-tions and designed to ensure that we deliver continuouslyimproving returns to our shareholders. We report our per-formance against these targets each quarter:– We seek to increase the value of UBS by achieving a
sustainable, after-tax return on equity of 15–20%, acrossperiods of varying market conditions.
– We aim to increase shareholder value through double-digit average annual percentage growth in basic earningsper share (EPS), across periods of varying market condi-tions.
– Through cost reduction and earnings enhancement initia-tives, we aim to reduce UBS’s cost / income ratio to a levelthat compares positively with best-in-class competitors.
– We aim to achieve a clear growth trend in net newmoney in our wealth management units.The first three targets are all reported pre-goodwill amorti-
zation, and adjusted for significant financial events.
9
Measurement and analysis of performance

Presentation of Financial Information
10
Key performance indicators
Business Key performance indicators Definition
Financial businesses Cost / income ratio Total operating expenses / total operating income before adjusted expected credit loss.
Cost / income ratio before goodwill Total operating expenses excluding amortization of goodwill and intangible assets / total operating income before adjusted expected credit loss.
Wealth and asset management businesses Invested assets Assets managed by or deposited with UBS for investment purposes only and Business Banking Switzerland (for further details please refer to page 11).
Net new money Inflow of invested assets from new clients– outflows due to client defection+/– inflows /outflows from existing clients.(for further details please refer to page 11).
Wealth and asset management businesses Gross margin on invested assets Operating income before adjusted expected credit loss / average invested assets.
Wealth Management Client advisors (CAs) Expressed in full-time equivalents.
Business Banking Switzerland Non-performing loans (%) Non-performing loans / gross loans.
Impaired loans (%) Impaired loans / gross loans.
Investment Bank Compensation ratio (%) Personnel expenses / operating income before adjusted expected credit loss.
Non-performing loans (%) Non-performing loans / gross loans.
Impaired loans (%) Impaired loans / gross loans.
Average VaR (10-day 99%) VaR expresses the potential loss on a trading portfolio assuming a 10-day time horizon before positions can be adjusted, and measured to a 99% level of confidence.
Value creation (private equity) Value creation adds the increase in the unrealized portfolio gains / (losses) to realized gains / (losses) for the period.
Investment (private equity) Historical cost of investment made, less divestments and impairments.
Portfolio fair value (private equity) The fair value of a portfolio is the estimated amount for which the assets could be exchanged between willing buyers and willing sellers in an arm’s length transaction after an orderly sale process where the parties each act knowledgeably, prudently and without compulsion.
Wealth Management USA Recurring fees Asset-based fees for portfolio management and fund distribution, account-based and advisory fees (as opposed to transactional fees).
Financial advisor productivity Private client revenues divided by average number of financial advisors.
Effective 2005, we will make a numberof changes in accounting and disclo-sure – some are driven by changes inaccounting standards, others concernthe presentation of our financialresults.The International Accounting Stan-dards Board (IASB) issued revisions to15 of its 32 International AccountingStandards (IAS) in December 2003 inan effort to clarify and simplify themand make them more compatible withother accounting standards, notablyUS GAAP. All 15 revisions became ef-fective on 1 January 2005. We decidedto adopt two of the revisions, IAS 32and 39, early, at the beginning of 2004.
Together these two revisions providecomprehensive guidance on recogni-tion, measurement, presentation anddisclosure of financial instruments.We adopted the remaining revisions atthe beginning of 2005. As a result,we will make a number of changes toour accounting, presentation anddisclosure in 2005. The IASB now callsnew standards International FinancialReporting Standards (IFRS).Several of the changes will require usto restate comparative prior periods,although not all of them will have aneffect on net profit or shareholders’equity. We will release restatedinterim and annual financial state-
ment figures for 2004 and 2003before we publish our first quarter2005 report.
Accounting treatment and presenta-tion of private equity investmentsIn the past we treated all our privateequity investments as “Financialinvestments available-for-sale”. Therevised IAS 27 and 28 will require us to change this approach, withsome investments no longer exemptfrom consolidation.Depending on the size of our stake,these investments will have to betreated according to one of the threefollowing methods:
Changes in accounting and presentation in 2005

Business Group key performance indicatorsAt the Business Group or business unit level, performance ismeasured with carefully chosen key performance indicators(KPIs). These do not carry explicit targets, but are indicatorsof the business units’ success in creating value for share-holders. They reflect the key drivers of each unit’s core busi-ness activities and include both financial metrics, such as thecost / income ratio, and non-financial metrics, such as invest-ed assets or the number of client advisors.
These KPIs are used for internal performance measurementand planning as well as external reporting. This ensures thatmanagement has a clear responsibility to lead businessestowards achieving success in the externally reported valuedrivers, avoiding the risk of management to purely internalperformance measures.
Client / invested assets reportingSince 2001, we have reported two distinct metrics for clientfunds:– Client assets are all client assets managed by or deposited
with UBS including custody-only assets and assets held forpurely transactional purposes.
– Invested assets is a more restrictive term and includes allclient assets managed by or deposited with UBS for invest-ment purposes.Invested assets is our central measure and excludes all
assets held for purely transactional and or custody-onlypurposes. It includes, for example, discretionary and advisorywealth management portfolios, managed institutional assets,managed fund assets and wealth management securities orbrokerage accounts, but excludes custody-only assets, and
transactional cash or current accounts. Since 1 January 2004,corporate client assets (other than pension funds) depositedwith the Business Banking Switzerland unit have beenexcluded, as we have a minimal advisory role for such clientsand as asset flows are driven more by liquidity requirementsthan investment reasons. Non-bankable assets (e. g. art col-lections) and deposits from third-party banks for funding ortrading purposes are excluded from both measures.
Net new money is defined as the sum of the acquisition ofinvested assets from new clients, the loss of invested assetsdue to client defection and inflows and outflows of investedassets from existing clients. Interest and dividend income, theeffects of market or currency movements as well as acqui-sitions and divestments are excluded from net new money.The use of invested assets to fund interest expense on clients’loans results in net new money outflows.
When products are managed in one Business Group andsold in another, they are counted in both the investmentmanagement unit and the distribution unit. This results indouble counting in UBS’s total invested assets as both unitsprovide an independent service to their respective client, addvalue and generate revenues. Most double counting ariseswhere mutual funds are managed by the Global Asset Man-agement business or GAM and sold by a wealth managementbusiness (Wealth Management or Wealth Management USA).Both businesses involved count these funds as invested assets.This approach is in line with industry practice and our openarchitecture strategy and allows us to accurately reflect theperformance of each individual business. Overall, CHF 294 bil-lion of invested assets were double counted in 2004 (CHF283 billion in 2003).
11
– full consolidation (according toIAS 27) for investments in whichwe have a controlling interest
– equity method accounting (accord-ing to IAS 28) for investments inwhich we have significant influence
– treatment as “Financial investmentsavailable-for-sale” for all remainingprivate equity investments.
Under the old method, all investmentswere accounted for as “available-for-sale”. That means that even if thevalue of an investment rose or fell,corresponding gains or losses wereonly recognized in the income state-ment on sale, unless an impairmentoccurred. Changes in the fair value of
the investment were booked directly inequity for the time that we held it.Once an investment was sold, the gainor loss recognized was the differencebetween the value of the investmentat the time that it was purchased(adjusted for any impairments) and itsselling price. The introduction ofrevised IAS 27 and 28 requires that weadopt a new approach. Now, for aninvestment where we have a control-ling interest or a significant influence,we will record our share of its netprofit or loss directly through ourincome statement. Doing that willprompt corresponding changes to thecarrying value of the investment –
meaning its value on the balance sheetwill be updated according to the accu-mulated profits and losses. Then, atthe time of sale, any gain or loss werecord will be based on the differencebetween the latest carrying value andthe selling price.
Full consolidation according to IAS 27The revision of IAS 27 requires compa-nies to fully consolidate subsidiarieseven when control over them is onlytemporary. As a result, from 2005onwards we will consolidate line by linethose private equity investments inwhich we have a controlling interest –in total 12 investments. As a conse-
12
quence, we will debit approximatelyCHF 723 million to our equity (includ-ing minority interests) as at 1 January2003. The move will add CHF 1.7 bil-lion and CHF 2.9 billion in assets to ourbalance sheet for year-end 2004 and2003 respectively. It will increase totaloperating income in 2004 and 2003by approximately CHF 3.8 billion andCHF 4.1 billion respectively. It willalso add approximately CHF 92 millionand CHF 86 million to 2004 and 2003in operating net profit.In our restatement for 2004 and 2003,we will also have to reflect the impacton the sale of these types of invest-ments in accordance with IFRS 5(explained in detail below). Seven ofthe private equity investments in whichwe had a controlling interest on 1 Jan-uary 2003 were sold during 2003 or2004 and will therefore be presentedas discontinued operations in therestated financial results for theseyears. Under the revised accountingmethod, the additional net profit / (loss)from these exits, which is not includedin the changes to operating profit men-tioned above, totaled CHF 55 million in2004 and CHF (8) million in 2003.Under the old method, the correspond-ing figures were CHF 90 million andCHF 194 million.
Equity method according to IAS 28Investments in companies in which wehave a significant influence must nowbe accounted for under the equitymethod, even if they are held exclu-
sively for future sale. From 2005onwards we will therefore account for15 private equity investments in whichwe have a stake between 20% and50% using the equity method. As aconsequence, we will debit CHF266 million to our equity as at 1 Janu-ary 2003. That debit is the differencebetween the carrying value of thoseprivate equity investments under thenew and the old methods. The restat-ed carrying values will be CHF 248 mil-lion and CHF 393 million on 31 De-cember 2004 and 2003 respectively,which include equity in income ofCHF (55) million and CHF 10 millionrecognized in the income statement in2004 and 2003 respectively.During 2004 and 2003, we exited fiveof these private equity investmentsaccounted for using the equitymethod. Under the new accountingmethod, the gains on sale were CHF 1 million and zero in 2004 and2003 respectively, compared toCHF 70 million and CHF 34 millionin 2004 and 2003 respectively underthe old method.
Changes in presentationFrom first quarter 2005, our privateequity business including all its invest-ments will be reported as part of theIndustrial Holdings segment. This is inline with our ongoing strategy of dis-continuing this business. The fair valueof the private equity portfolio wasCHF 2.7 billion at end-December 2004,compared to CHF 6.9 billion at the end
of 2000 – when it was at its highest.Current management will continue tolook after the portfolio.
IFRS 2 Share-based paymentIFRS 2 will require entities to recognizethe fair value of share-based paymentsmade to employees as compensationexpense, recognized over the serviceperiod, which is generally equal to thevesting period. The new treatmentdiffers from our current practice in twoways. First, option awards will beexpensed over their vesting periodwhereas currently UBS discloses thepro-forma impact of expensing the fairvalue of such awards at grant. Second,share awards, which are currentlyexpensed in the performance year(generally the year before grant), willin future be expensed from the date ofgrant over the vesting period. We willapply the new requirements to all priorperiod awards that impact incomestatements from 2003 onwards. Thisincludes all unvested or outstandingawards as at 1 January 2003. Theopening balance of retained earningson 1 January 2003 will be adjustedby a credit of CHF 559 million after-taxfor the effects these awards have onincome statements prior to 2003. Withregard to our income statement, wewill record zero and CHF 558 million asadditional compensation expense for2004 and 2003 respectively. The sig-nificantly lower impact on the 2004income statement is due to the factthat we have substantially raised the
Changes in accounting and presentation in 2005 (continued)

proportion of bonus payments madein the form of restricted stock ratherthan cash. The CHF 1,406 millionexpense related to these stock awardsshifts under IFRS 2 from 2004 tothe vesting period starting in 2005,and significantly exceeds the impactof prior year stock grants on 2004expenses.We will also introduce an updatedoption valuation model to determinethe fair value of share options grantedin 2005 and beyond. The new modelwill better reflect observed exercisebehavior. This will reduce the valueof an option and accordingly the newmodel will result in lower averagevalues per option – other factors beingequal. The new model will not affectthe valuation of share options grantedin 2004 and earlier.UBS also has employee benefit truststhat are used in connection withshare-based payment arrangementsand deferred compensation schemes.Henceforth, we will be required toconsolidate these trusts. This willresult in us recognizing assets of CHF1.1 billion and CHF 1.3 billion andliabilities of CHF 1.1 billion and CHF1.3 billion on our year-end 2004and 2003 balance sheets respectively.The weighted average number oftreasury shares held by these trustswas 22,995,954 in 2004 and30,792,147 in 2003. The new stan-dard will lower the weighted averagenumber of shares outstanding usedto calculate basic earnings per share.
There will be no impact on dilutedearnings per share.The net impact of IFRS 2 and the trustconsolidation on shareholder’s equityis a debit of CHF 166 million as at31 December 2004 and a debit ofCHF 674 million as at 31 December2003.
IFRS 3 Business Combinations, IAS 36 Impairment of Assets and IAS 38 Intangible AssetsIFRS 3 requires that all business com-binations be accounted for underthe purchase method. The pooling-of-interests method is eliminated. Underthe new accounting standard, we willcease to amortize existing goodwillbeginning in 2005 and will insteadconduct annual impairment tests.Goodwill from business combinationsentered into on or after 31 March2004 – including, for UBS, the Motor-Columbus transaction – has alreadybeen accounted for under the newguidance and has not been amortizedduring 2004. Goodwill from businesscombinations closed prior to 31 March2004 continued to be amortizeduntil 31 December 2004. We recordedgoodwill amortization expense ofCHF 713 million in 2004, and CHF756 million in 2003. There will be norestatement of prior years with regardto this standard.Following the new standard, we havealso reclassified the net book valueof the former PaineWebber trainedworkforce intangible asset to goodwill
(book value CHF 1.0 billion). On 1 Jan-uary 2005, we held CHF 2.3 billionin total intangible assets and we antici-pate recording approximately CHF300 million in related amortizationexpense in 2005.
IFRS 5 Non-current Assets Held forSale and Discontinued OperationsThe IASB issued this new standard on31 March 2004. It requires that sub-sidiaries that are acquired exclusivelyfor future sale be presented as discon-tinued operations at the time a saleis highly likely to occur. As certain ofour private equity investments meetthe criteria as discontinued opera-tions, we will reclassify them accord-ingly. Although the impact from IFRS 5on our financial statements will notbe material, our income statementwill be divided into two sections – netincome from continuing operationsand net income from discontinuedoperations.
Minority interestsBeginning in 2005, the revision ofIAS 1 will require the presentationof net profit and equity to includeminority interests. Net profit will beallocated to net profit attributableto UBS shareholders and net profitattributable to minority interests.Earnings per share and all our analysisof UBS performance will continueto be presented based on net profitattributable to UBS shareholders.
13

14

UBS

UBS
In 2004, UBS reported net profit of CHF 8,089 million, up30% from CHF 6,239 million a year earlier and up 129% fromCHF 3,530 million in 2002.
Our financial businesses achieved a record result in 2004,contributing CHF 8,044 million to net profit, up 29% fromCHF 6,239 million a year earlier. Our industrial holdings madea CHF 45 million contribution to 2004 net profit.
Dividend
The Board of Directors will recommend at the Annual GeneralMeeting on 21 April 2005 that UBS should pay a dividend ofCHF 3.00 per share for the 2004 financial year, an increase of15% or CHF 0.40 from the CHF 2.60 dividend paid for the2003 financial year and up 50% or CHF 1.00 from the CHF2.00 dividend paid for the 2002 financial year.
If the dividend is approved, the ex-dividend date will be 22 April 2005, with payment on 26 April 2005 for share-holders of record on 21 April 2005.
16
Results
As a global financial services firm, weare affected by the factors drivingthe markets in which we operate. Dif-ferent risk factors can impact our abil-ity to effectively carry out our businessstrategies and can directly affect ourearnings. The factors described below,as well as other influences beyond ourcontrol, mean that our revenues andoperating profit have been and arelikely to continue to be subject to ameasure of variability from period toperiod. Our revenues and operatingprofit for any particular period maynot, therefore, be indicative of sustain-able results, they may vary from yearto year and may affect our ability toachieve UBS’s strategic objectives.
Interest rates, equity prices, foreignexchange levels and other marketfluctuations may affect earningsA substantial part of our business con-sists in taking trading positions in theinterest rate, debt, currency, equity,precious metal and energy markets.The value of these assets and liabilitiescan be adversely affected by fluctua-tions in financial markets. Our marketrisks are subject to a control frame-work and to portfolio and concentra-tion limits. We avoid undue concentra-tions of risk and, where appropriate,
hedge exposure to stress events.Nevertheless, in the event of sudden,severe or unexpected market move-ments, we might suffer significantlosses. A description of our controlsand limits, including limits on ourexposure to a range of market stressevents, is provided on page 43 of ourHandbook 2004 /2005.Because we prepare our accounts inSwiss francs while assets, liabilities,revenues and expenses from certainbusinesses are denominated in othercurrencies, changes in foreign ex-change rates, particularly between theSwiss franc and the US dollar (US dol-lar income representing the major partof our non-Swiss franc income), mayhave an effect on our reported earn-ings. Our approach to currency man-agement is explained on page 64 ofour Handbook 2004 /2005.Regulatory or political changes impact-ing financial market structures canaffect our earnings – an example wasthe introduction of the euro in 1999,which affected European foreignexchange markets by reducing thevolume of foreign exchange business,and prompted greater harmonizationbetween financial products. Move-ments in interest rates can affect ournet interest income and the value of
our fixed income trading portfolio,while movements in equity marketscan affect the value of our equitytrading portfolio. Changes in both canaffect the investment performanceof our asset management businesses.Our fixed income and equity tradingportfolios and our asset managementbusinesses may also be impacted bycredit events, including defaults, relat-ed to the issuers of bonds and equi-ties. Our private equity and commer-cial real estate investments can beadversely affected by economic, busi-ness and general market conditions.Furthermore, income in businessessuch as investment banking, andwealth and asset management is oftendirectly related to client activity levels.As a result, our income can be suscep-tible to adverse effects from sustainedmarket downturns as well as any sig-nificant deterioration of investor senti-ment. Asset-based revenues generatedin our wealth and asset managementbusinesses depend on the levels ofclient assets which can, in themselves,be adversely affected by deterioratingmarket valuations.Market levels and trading volumesmay be affected by a broad range ofgeopolitical or regional issues orevents beyond our control, such as
Risk factors
the possibility of war, terrorism, oreconomic developments such aslow growth, inflation, recession ordepression.
Counterparty failure may lead tocredit lossCredit is an integral part of many ofour business activities. The results ofour credit-related activities (includingloans, commitments to lend, contin-gent liabilities such as letters of credit,and derivative products such as swapsand options) would be adversely af-fected by any deterioration in thecreditworthiness of our counterpartiesand the ability of clients to meet theirobligations. The credit quality of ourcounterparties may be affected byvarious factors, such as an economicdownturn, lack of liquidity, or anunexpected political event. Any ofthese events could lead us to incurlosses. We believe that impairmentsin the portfolio at the balance sheetdate are adequately covered by ourallowances and provisions. In general,we aim to avoid risk concentrationsin our credit portfolio and we makeactive use of credit protection. If ourrisk management and control measuresprove inadequate or ineffective, thenany credit losses sustained might havea material adverse effect on both ourincome and the value of our assets.A discussion of our approach to man-aging credit risk can be found onpage 47 of our Handbook 2004 /2005.
Operational risk may increase costsand impact revenuesAll our businesses are dependent onour ability to process a large numberof complex transactions across manyand diverse markets in different cur-rencies and subject to many different
legal and regulatory regimes. Oursystems and processes are designed toensure that the risks associated withour activities, including those arisingfrom process error, failed execution,fraud, systems failure, and failure ofsecurity and physical protection, areappropriately controlled. However,if our system of internal controls isineffective in identifying and remedy-ing such risks, we will be exposed tooperational failures that might result inlosses. A discussion of our approachto the management and control ofoperational risks is provided on page 67 of our Handbook 2004 /2005.
Legal claims may arise in the conductof our businessDue to the nature of our business, weare involved in various claims, disputesand legal proceedings in Switzerlandand in a number of jurisdictions out-side Switzerland, including the UnitedStates, arising in the ordinary courseof business. Such legal proceedingsmay expose us to substantial monetarydamages and legal defense costs,injunctive relief and criminal and civilpenalties.
Competitive forces may influencebusiness directionWe face intense competition in allaspects of our business. In our variouslines of business we compete, bothdomestically and internationally, withasset managers, retail and commer-cial banks, and private banking, invest-ment banking, brokerage and otherinvestment services firms. We faceintense competition not only fromfirms competing locally in particularlines of business, but also from globalfinancial institutions that are compa-rable to us in size and breadth.
In addition, the trend towards consoli-dation in the global financial servicesindustry is creating competitors withbroad ranges of product and serviceofferings, increased access to capital,and greater efficiency and pricingpower. We expect these trends to con-tinue and competition to increase inthe future. Our competitive strengthwill depend on the ability of our busi-nesses to adapt quickly to significantmarket and industry trends.
Our global presence exposes us toother risksWe operate in over 50 countries, earnincome and hold assets and liabilitiesin many different currencies and aresubject to many different legal andregulatory regimes. Changes in localtax or legal regulations may affect ourclients’ ability or willingness to dobusiness with us. Country, regionaland political risks may increase marketand credit risk. Political, economicand social deterioration in a countryor region, including local market dis-ruptions, currency crises, the break-down of monetary controls or ter-rorism, may adversely affect the abilityof clients or counterparties locatedin that country or region to obtainforeign exchange or credit and, there-fore, to satisfy their obligationstowards us. As a truly global financialservices company, we are also exposedto economic instability in emergingmarkets. We have a system of controlsand procedures to mitigate this risk.A discussion of our country risk con-trols is provided on page 54 of ourHandbook 2004 / 2005. However, ifour controls fail to fully identify andrespond to country risk, we may suffera negative impact on our results andfinancial condition.
17
Risk factors (continued)

18

UBS Targets

Performance against targets For the year ended
31.12.04 31.12.03 31.12.02
RoE (%)
as reported 1 24.7 17.8 8.9
before goodwill and adjusted for significant financial events 2 27.7 20.5 13.9
Basic EPS (CHF)
as reported 3 7.68 5.59 2.92
before goodwill and adjusted for significant financial events 4 8.60 6.43 4.57
Cost / income ratio of the financial businesses (%) 5
as reported 6 72.6 75.6 86.4
before goodwill and adjusted for significant financial events 7 70.2 73.2 79.7
Net new money, wealth management businesses (CHF billion) 8
Wealth Management 42.3 29.7 17.7
Wealth Management USA 17.1 21.1 18.5
Total 59.4 50.8 36.2
UBS Targets
20
RoE
in %
2002 2003 2004
28
21
14
7
0As reported 1 Before goodwill and adjusted for significant financial events 2
13.9
8.9
20.5
17.8
27.7
24.7
Cost / income ratio of the financial businesses 5
in %
2002 2003 2004
90
80
70
60
50As reported 6 Before goodwill and adjusted for significant financial events 7
79.7
86.4
75.6
72.673.2
70.2
Basic EPS
CHF
2002 2003 2004
10.00
7.50
5.00
2.50
0.00As reported 3 Before goodwill and adjusted for significant financial events 4
4.57
2.92
5.59
7.686.43
8.60
Net new money, wealth management businesses 8
CHF billion
2002 2003 2004
60
45
30
15
0
36.2
50.8
59.4
1 Net profit / average shareholders’ equity less dividends. 2 Net profit less the amortization of goodwill and other intangible assets and significant financial events (after-tax) / average shareholders’equity less dividends. 3 Details of the EPS calculation can be found in note 8 to the financial statements. 4 Net profit less the amortization of goodwill and other intangible assets and significantfinancial events (after-tax) /weighted average shares outstanding. 5 Excludes results from Industrial Holdings. 6 Operating expenses / operating income less credit loss expense or recovery.7 Operating expenses less the amortization of goodwill and other intangible assets and significant financial events / operating income less credit loss expense or recovery and significant financial events.8 Excludes interest and dividend income.

2004We focus on four key performance targets, designed to de-liver continually improving returns to our shareholders. Thesetargets are evaluated before goodwill and adjusted for signif-icant financial events.
This is the first time that, on an annual basis, we havesplit the commentary of our results between financial business-es and industrial holdings. The first two of our four targets, re-turn on equity and earnings per share, are calculated on a fullUBS basis. Our cost / income ratio target is limited to our finan-cial businesses, to avoid the distortion from industrial holdings,which operates at a cost / income ratio of around 90%.
Before goodwill and adjusted for significant financialevents:– For full-year 2004, our return on equity was 27.7%, up
from 20.5% in 2003, well above our target range of 15%to 20% and at a record level. The increase, exceeding netprofit growth, reflects the combined effects of our contin-ued buyback programs and dividend outpacing increasedretained earnings.
– Basic earnings per share (EPS) stood at CHF 8.60, up 34%or CHF 2.17 from CHF 6.43 in 2003. This was the highestlevel ever, reflecting the increase in net profit as well as the6% reduction in average number of shares outstandingdue to our continuing repurchase programs.
– The cost / income ratio of our financial businesses stood at70.2% in 2004, an improvement from 73.2% in 2003.Strong asset-based revenues drove fee and commissionincome higher, demonstrating the inherent operating lever-age in our wealth and asset management businesses.Our wealth management businesses continued to show
strong inflows of net new money. For full-year 2004, net newmoney inflows into our wealth management businesses to-taled CHF 59.4 billion, up 17% from CHF 50.8 billion in 2003,corresponding to an annual growth rate of 4.4% of the as-set base at the end of 2003. Wealth Management attractedCHF 42.3 billion in 2004, compared to CHF 29.7 billion in2003. This excellent performance saw gains in all geograph-ical areas, especially from Asian clients, and a particularlystrong CHF 13.7 billion inflow into our European wealth man-agement business. In our Wealth Management USA business,
21
Invested assets
As at % change from
CHF billion 31.12.04 31.12.03 31.12.02 31.12.03
UBS 2,250 2,133 1,959 5
Wealth Management & Business Banking
Wealth Management 778 701 642 11
Business Banking Switzerland 140 136 127 3
Global Asset Management
Institutional 344 313 274 10
Wholesale intermediary 257 261 259 (2 )
Investment Bank 0 4 3 (100 )
Wealth Management USA 639 634 584 1
Corporate Center
Private Banks & GAM 92 84 70 10
Net new money1
For the year ended
CHF billion 31.12.04 31.12.03 31.12.02
UBS 88.9 69.1 36.9
Wealth Management & Business Banking
Wealth Management 42.3 29.7 17.7
Business Banking Switzerland 2.6 2.5 3.7
Global Asset Management
Institutional 23.7 12.7 (1.4 )
Wholesale intermediary (4.5) (5.0 ) (6.3 )
Investment Bank 0.0 0.9 0.5
Wealth Management USA 17.1 21.1 18.5
Corporate Center
Private Banks & GAM 7.7 7.2 4.2
1 Excludes interest and dividend income.

UBS Targets
net new money was CHF 17.1 billion, down from CHF 21.1 bil-lion a year earlier, reflecting a slow asset-gathering perform-ance at the beginning of the year as well as the US dollar’sweakening against the Swiss franc.
2003
Before goodwill and adjusted for significant financial events:– Our return on equity for 2003 was 20.5%, up from 13.9%
a year earlier, and above the target range of 15% to 20%.The increase reflects much improved net profit combinedwith a lower average level of equity resulting from con-tinued buyback programs.
– Basic earnings per share (EPS) were CHF 6.43 in 2003, anincrease of CHF 1.86 or 41% from 2002, reflecting theincrease in profit as well as the 8% reduction in average
number of shares outstanding due to continued buybackactivities. Without the buyback programs, which havebeen in place since 2000, our earnings per share would be14% lower.
– The cost / income ratio was 73.2% in 2003, an improve-ment from 79.7% in 2002. The slight drop in income, re-flecting the difficult market environment in first half 2003,was more than compensated by a 9% decline in operat-ing expenses due to ongoing cost management initiativesand the downward pressure on compensation ratios.In full-year 2003, net new money inflows into our wealth
management businesses totaled CHF 50.8 billion comparedwith CHF 36.2 billion in 2002. This is an increase of 40% andcorresponded to an annual growth rate of 4.2%. Both theWealth Management and Wealth Management USA bus-nesses were able to attract more client money in 2003 thanin 2002.
22

Financial Businesses

Financial BusinessesResults
2004
Results
Our 2004 result was the best ever. The first quarter saw anall-time performance record and the year ended with our best-ever fourth quarter. Net profit in 2004 was CHF 8,044 million,up by 29% from CHF 6,239 million in 2003. Before goodwilland excluding the sale of our Correspondent Services Corpo-ration (CSC) clearing subsidiary, completed in second quarter2003, net profit rose by 24%. The increase was driven byhigher revenues in all categories, clearly outpacing costgrowth. Our asset-based revenues showed particular strength,reflecting improved market valuations as well as strong inflowsof net new money into our wealth and asset managementbusinesses. Overall, we attracted CHF 88.9 billion in net newmoney in 2004, up 29% from CHF 69.1 billion in 2003. As a
result, our invested asset base rose to CHF 2.25 trillion. Wealso saw a strong increase in brokerage, corporate finance andunderwriting fees. Overall fee and commission income nowcontributes 52% to total operating income. Trading incomealso contributed to the growth, as improved market conditionsboosted opportunities, particularly in the first and fourthquarters. We also saw improving results in our private equitybusiness, which recorded positive revenues for the first timein three years on higher divestment gains and lower write-downs. We also reported record credit loss recoveries. Per-formance-related compensation rose in line with revenues.Higher general and administrative expenses were driven byhigher legal provisions, and operational risk costs.
Operating incomeTotal operating income was CHF 37,402 million in 2004, up11% from CHF 33,790 million in 2003. This was the highest
24
Results
Income statement1
For the year ended % change from
CHF million, except where indicated 31.12.04 31.12.03 31.12.02 31.12.03
Operating income
Interest income 39,398 40,159 39,963 (2 )
Interest expense (27,538) (27,860 ) (29,417 ) (1 )
Net interest income 11,860 12,299 10,546 (4 )
Credit loss (expense) / recovery 276 (72 ) (115 )
Net interest income after credit loss expense 12,136 12,227 10,431 (1 )
Net fee and commission income 19,416 17,345 18,221 12
Net trading income 4,972 3,756 5,451 32
Other income 878 462 4 90
Total operating income 37,402 33,790 34,107 11
Operating expenses
Personnel expenses 18,189 17,231 18,524 6
General and administrative expenses 6,577 6,086 7,072 8
Depreciation of property and equipment 1,282 1,353 1,514 (5 )
Amortization of goodwill and other intangible assets 887 943 2,460 (6 )
Total operating expenses 26,935 25,613 29,570 5
Operating profit before tax and minority interests 10,467 8,177 4,537 28
Tax expense 2,086 1,593 676 31
Net profit before minority interests 8,381 6,584 3,861 27
Minority interests (337) (345 ) (331 ) (2 )
Net profit 8,044 6,239 3,530 29
Additional information As at % change from
31.12.04 31.12.03 31.12.02 31.12.03
Headcount (full-time equivalents) 67,424 65,929 69,061 2
1 Excludes results from Industrial Holdings.

level ever. The increase was driven by our ability to captureopportunities in increasingly active financial markets. The in-crease in market levels positively impacted the asset baseof our wealth and asset management businesses, promptingfee-based revenues to rise. Trading and brokerage income also profited from the improved market environment thatboosted institutional and private client transaction activity.Private equity made a positive contribution, reflecting lowerwritedowns and higher divestment gains. We also recordedhigher credit loss recoveries in 2004. The overall rise in 2004’srevenues, however, was partially offset by the weakening ofthe US dollar against the Swiss franc.
Net interest income was CHF 11,860 million in 2004, downfrom CHF 12,299 million in the same period a year earlier. Net trading income was CHF 4,972 million, up from CHF3,756 million in 2003.
As well as income from interest margin-based activities(loans and deposits), net interest income includes incomeearned as a result of trading activities (for example, coupon anddividend income). This component is volatile from period toperiod, depending on the composition of the trading port-folio. In order to provide a better explanation of the movementsin net interest income and net trading income, we analyze thetotal according to the business activities that give rise to theincome, rather than by the type of income generated.
At CHF 5,139 million, net income from interest marginproducts in 2004 was 1% higher than CHF 5,077 million ayear earlier. The increase was driven by the growth in lendingto wealthy US clients through our US bank, UBS Bank USA.Our domestic Swiss mortgage business and wealth manage-ment margin lending business also grew over the year. Thisincrease was nearly offset by lower income from our shrink-ing Swiss recovery portfolio, which dropped by CHF 2.0 bil-
lion compared to year-end 2003, reduced interest margin onclient cash and savings accounts, as well as declining revenuesfrom US dollar-denominated accounts.
Net income from trading activities was CHF 11,102 millionin 2004, up by 4% or CHF 421 million from CHF 10,681 mil-lion a year ago. At CHF 3,098 million, equities trading incomein 2004 was up 27% or CHF 653 million from CHF 2,445 mil-lion in 2003. The increase reflects expansion in market volumesand, hence, improved trading opportunities, especially duringthe particularly strong first quarter and after the US electionsin November. Our proprietary trading strategies performedwell. Equity finance revenues increased strongly, reflecting thesuccessful integration of ABN Amro’s prime brokerage busi-ness. Fixed income trading revenues, at CHF 6,264 million in2004, were down 3% from CHF 6,474 million in 2003. Thedrop was driven by declines in our principal finance, commer-cial real estate and fixed income businesses, partially offset byimproved revenues in our rates business. Compared to 2003,last year’s market environment saw rising interest rates andlower volatility, which drove activity from the market. We re-corded an unrealized loss of CHF 62 million relating to CreditDefault Swaps (CDSs) hedging existing credit exposure in theloan book, against a mark to market loss of CHF 678 milliona year earlier. Foreign exchange trading revenues increased by2% to CHF 1,467 million in 2004 from CHF 1,436 million ayear earlier, reflecting an outstanding performance in ourderivative trading business as well as strong sales volumes.
At CHF 1,298 million, net income from treasury activities in2004 was CHF 119 million or 8% lower than CHF 1,417 millionin 2003. The drop was mainly due to lower returns on investedequity as we continued to repurchase shares. The impact offalling interest rates was partially offset by the diversification ofour invested equity into currencies other than the Swiss franc.
25
Net interest and trading income
For the year ended % change from
CHF million 31.12.04 31.12.03 31.12.02 31.12.03
Net interest income 11,860 12,299 10,546 (4 )
Net trading income 4,972 3,756 5,451 32
Total net interest and trading income 16,832 16,055 15,997 5
Breakdown by business activity
For the year ended % change from
CHF million 31.12.04 31.12.03 31.12.02 31.12.03
Net income from interest margin products 5,139 5,077 5,275 1
Equities 3,098 2,445 2,777 27
Fixed income 6,264 6,474 5,977 (3 )
Foreign exchange 1,467 1,436 1,506 2
Other 273 326 245 (16 )
Net income from trading activities 11,102 10,681 10,505 4
Net income from treasury activities 1,298 1,417 1,646 (8 )
Other 1 (707) (1,120 ) (1,429 ) 37
Total net interest and trading income 16,832 16,055 15,997 5
1 Includes external funding costs of the PaineWebber Group, Inc. acquisition.

Financial BusinessesResults
Other net trading and interest income was negative CHF707 million in 2004 compared to negative CHF 1,120 milliona year earlier. The improvement was due to lower goodwillfunding costs, as well as declining costs for funding our pri-vate equity portfolio.
In 2004, we experienced a net credit loss recovery ofCHF 276 million, compared to net credit loss expense of CHF72 million in 2003 and CHF 115 million in 2002. This favor-able result was achieved in a period which saw a very sanguineenvironment for credit markets globally. Economic expansionin the US provided a strong stimulus for growth worldwide.Almost without exception, credit spreads contracted in allthe major developed and emerging capital markets, as healthyexpansion of cash flows allowed the corporate sector to de-leverage and build liquidity.
Net credit loss recovery at Wealth Management & BusinessBanking amounted to CHF 91 million in 2004 compared tonet credit loss expenses of CHF 67 million in 2003 and CHF238 million in 2002. Our domestic credit portfolio demon-strated strong resilience in a Swiss economic environmentwhich saw a 9.2% increase in corporate bankruptcies com-pared to 2003. The measures taken in recent years to improvethe quality of our credit portfolio have resulted in lower levels of new defaults and our success in managing theimpaired portfolio has resulted in a higher than anticipatedlevel of recoveries.
The Investment Bank experienced a net credit loss recov-ery of CHF 240 million in 2004, compared to net credit lossexpense of CHF 4 million in 2003 and credit loss recovery ofCHF 126 million in 2002. This continued strong performancewas the result of minimal exposure to new defaults and strongrecoveries of previously established allowances and provi-sions. Releases in country allowances and provisions were duepartly to exposure reductions in the affected countries andpartly to a more favorable outlook for emerging marketeconomies. There was also a partial release of a sizeableallowance for a corporate counterparty which managed aturnaround during 2004.
For further details on our risk management approach, howwe measure credit risk and the development of our credit risk
exposures, please see the “Financial Management” chapterof our Handbook 2004/2005.
In 2004, net fee and commission income was CHF 19,416million, up 12% from CHF 17,345 million a year earlier. Theincrease was driven by a strong contribution from recurringasset-based fees, higher net brokerage fees, rising corporatefinance fees as well as an increase in underwriting fees.Underwriting fees, at their highest level ever, were CHF 2,544 million in 2004, up 8% from CHF 2,354 million in2003. Both equity and fixed income underwriting feesincreased. Fixed income underwriting was CHF 1,114 millionin 2004, up 3% from CHF 1,084 million in 2003. Equityunderwriting increased 13% to CHF 1,430 million in thesame period. At CHF 1,078 million, corporate finance fees in2004 were up 42% from CHF 761 million a year earlier. Wewere able to benefit from the pick-up in merger and acqui-sition activity, and our strengthened advisory business, par-ticularly in the US. Net brokerage fees were CHF 4,517 mil-lion in 2004, up 10% or CHF 392 million from CHF 4,125million in 2003, reflecting the improved markets and the re-sulting higher institutional and individual client activity – es-pecially in the first and fourth quarters of 2004. Investmentfund fees, at their highest level ever, were CHF 4,588 millionin 2004, up 18% from CHF 3,895 million in 2003, mainlyreflecting higher asset-based fees for our wealth and assetmanagement businesses. At CHF 1,261 million, custodianfees in 2004 were up 5% from CHF 1,201 million in 2003.This increase was entirely due to an enlarged asset base. In-surance-related and other fees, at CHF 342 million in 2004,decreased by 4% from a year earlier. Excluding the effect ofthe weakening dollar, insurance-related and other fees wereactually slightly higher compared to 2003. Credit-relatedfees and commissions increased by 7% to CHF 266 millionin 2004 from CHF 249 million in 2003, reflecting improvedmarket conditions which brought higher volumes. Portfolioand other management and advisory fees increased by 20%to CHF 4,611 million in 2004 from CHF 3,855 million in 2003.The increase is again the result of rising invested asset levels driven by market valuations and strong net new moneyinflows, as well as an increase in performance fees.
26
Credit loss (expense) / recovery
For the year ended
CHF million 31.12.04 31.12.03 31.12.02
Wealth Management & Business Banking 91 (67 ) (238 )
Wealth Management (1) 4 1
Business Banking Switzerland 92 (71 ) (239 )
Investment Bank 240 (4 ) 126
Wealth Management USA 3 (3 ) (15 )
Corporate Center (58) 2 12
Private Banks & GAM (58) 2 (3 )
Corporate Functions 0 0 15
UBS 276 (72 ) (115 )

Other income increased by 90% to CHF 878 million in 2004from CHF 462 million in 2003. The increase was driven by high-er disposal gains from private equity investments (up CHF 205million) and lower impairment charges (down CHF 318 million).This was partially offset by lower gains from the divestment ofassociates and subsidiaries which dropped by nearly 50% toCHF 84 million in 2004 (the major disposal being the NogaHilton hotel in Geneva) from CHF 162 million in 2003 (the ma-jor disposal being Correspondent Services Corporation (CSC)).
Operating expensesWe continue to tightly manage our cost base with a clear focus on improving the efficiency of our businesses. Totaloperating expenses increased by 5% to CHF 26,935 millionin 2004 from CHF 25,613 million in 2003.
Personnel expenses increased by CHF 958 million or 6%to CHF 18,189 million in 2004 from CHF 17,231 million in2003. The rise was driven by higher performance-relatedcompensation reflecting the better performance in most ofour businesses. Personnel expenses are managed on a full-yearbasis with final fixing of annual performance-related paymentsin fourth quarter. Salary expenses rose due to the 2% increasein headcount over the year. Contractor’s expenses increasedto CHF 572 million in 2004, up 6% from CHF 539 million in2003, reflecting higher usage, mainly in our Investment Bankin support of increased business flows. At CHF 1,299 millionin 2004, other personnel expenses dropped CHF 271 millionfrom CHF 1,570 million in 2003 due to the end of retentionpayments in the Wealth Management USA business and lower severance payments. For 2004, approximately 49% ofpersonnel expenses took the form of bonus or variable com-
pensation, up from 44% in 2003. Average variable compen-sation per head in 2004 was 17% higher than in 2003.
At CHF 6,577 million in 2004, general and administrativeexpenses increased CHF 491 million from CHF 6,086 millionin the same period a year ago. The increase was driven byhigher provisions (up CHF 252 million) which rose due tospecific operational and legal provisions (including the civilpenalty levied by the Federal Reserve Board relating to ourbanknote trading business), higher IT and other outsourcingexpenses as well as professional fees, the latter due to higherlegal and project costs. This was partially offset by savings intelecommunication, rent and maintenance expenses.
Depreciation was CHF 1,282 million in 2004, down 5%from CHF 1,353 million in 2003. This was the lowest level ever,reflecting falling IT-related charges as well as lower write-downs of equipment.
At CHF 887 million, amortization of goodwill and otherintangible assets was down 6% from CHF 943 million a yearearlier, reflecting lower amortization charges and the weak-ening of the US dollar against the Swiss franc.
Tax
In 2004, we incurred a tax expense of CHF 2,086 million, re-flecting an effective tax rate of 19.9% for full-year 2004, com-pared to last year’s full-year rate of 17.9% (before significantfinancial events). The 2003 tax rate was positively influencedby a favorable regional profit mix. The higher rate for 2004has been driven by an increase in profitability in higher taxjurisdictions, mainly the US. We believe that a similar under-lying tax rate is a reasonable indicator for 2005.
27
Net fee and commission income
For the year ended % change from
CHF million 31.12.04 31.12.03 31.12.02 31.12.03
Equity underwriting fees 1,430 1,270 1,166 13
Bond underwriting fees 1,114 1,084 968 3
Total underwriting fees 2,544 2,354 2,134 8
Corporate finance fees 1,078 761 848 42
Brokerage fees 5,916 5,608 5,987 5
Investment fund fees 4,588 3,895 4,033 18
Fiduciary fees 220 241 300 (9 )
Custodian fees 1,261 1,201 1,302 5
Portfolio and other management and advisory fees 4,611 3,855 4,065 20
Insurance-related and other fees 342 355 417 (4 )
Total securities trading and investment activity fees 20,560 18,270 19,086 13
Credit-related fees and commissions 266 249 275 7
Commission income from other services 988 1,087 1,006 (9 )
Total fee and commission income 21,814 19,606 20,367 11
Brokerage fees paid 1,399 1,483 1,349 (6 )
Other 999 778 797 28
Total fee and commission expense 2,398 2,261 2,146 6
Net fee and commission income 19,416 17,345 18,221 12

Financial BusinessesResults
Business Group tax ratesIndicative Business Group and business unit tax rates are cal-culated on an annual basis based on the results and statuto-ry tax rates of the financial year. These rates are approximatecalculations, based upon the application to the year’s adjust-ed earnings of statutory tax rates for the locations in whichthe Business Groups operated. These tax rates, therefore,give guidance on the tax cost to each Business Group of do-ing business during 2004 on a stand-alone basis, without thebenefit of tax losses brought forward from earlier years.
The indicative tax rates are presented pre-goodwill. Theygive an indication of what the tax rate would have been ifgoodwill were not charged for accounting purposes. It is thesum of the tax expense payable on net profit before tax andgoodwill in each location, calculated on the above basis,divided by the total net profit before tax and goodwill. Taxrates post-goodwill are higher than the pre-goodwill rates,because in some jurisdictions there are limitations on the taxdeductibility of amortization costs.
Please note that these tax rates are not necessarily indica-tive of future tax rates for the businesses or UBS as a whole.
Headcount
Headcount in our financial businesses was 67,424 on 31 De-cember 2004, up 1,495 from 65,929 on 31 December 2003.The increase was driven by the expansion of UBS’s wealthmanagement and securities businesses around the globe.
Fair value disclosure of options
The fair value of options granted in 2004 was CHF 508 mil-lion (pre-tax: CHF 543 million) compared to CHF 439 million
(pre-tax: CHF 576 million) in the same period a year ago. Theafter-tax increase was driven by a higher UBS share price, alower pro-forma tax benefit, and adjusted assumptions for thevaluation of options. In fact, significantly fewer option grantswere made in 2004 (down nearly 40% from 2003), in line withour strategy of granting options more selectively.
Our option valuation model will change for 2005 due towork we are undertaking in connection with the implemen-tation of the new IFRS 2 standard. For further details, pleaserefer to page 12.
Outlook
A record result is always challenging to beat. As every year, ourinvestment banking and securities business will have to contendwith the somewhat unpredictable rise and fall of the world’sfinancial markets. But 2004 showed that our wealth and asset
28
Indicative pre-goodwill tax rates for financial businesses
For the year ended
in % 31.12.04 31.12.03 31.12.02
Wealth Management & Business Banking 18 18 19
Wealth Management 18 16 18
Business Banking Switzerland 19 20 20
Global Asset Management 21 20 22
Investment Bank 30 32 38
Wealth Management USA 37 38 37
Headcount financial businesses
As at % change from
Full-time equivalents 31.12.04 31.12.03 31.12.02 31.12.03
Switzerland 25,990 26,662 27,972 (3 )
Rest of Europe /Africa /Middle East 10,764 9,906 10,009 9
Americas 26,232 25,511 27,350 3
Asia Pacific 4,438 3,850 3,730 15
Total 67,424 65,929 69,061 2
Headcount (in FTE)1: regional distribution
in %, except where indicated
As at 31.12.02 31.12.03 31.12.04
Total1: 69,061 65,929 67,424100
75
50
25
0Switzerland Europe (excluding Switzerland) Americas Asia Pacific
14.5
39.6
5.4
40.5
15.0
38.7
5.8
40.5
16.0
38.9
6.6
38.5
1 Total full-time equivalents (FTE).

management businesses can provide both growth momentumand earnings quality, even if trading conditions fluctuate. Wewill continue re-investing in our growth businesses and expect2005 to be the next exciting step on a journey we believe willbe very rewarding for our long-term investors.
2003
Results
In 2003, all businesses reported stronger results compared to2002. Our net profit in full-year 2003 was CHF 6,239 million,up from CHF 3,530 million in 2002 – an increase of 77%. In2002, our results were negatively influenced by the CHF 953million writedown of the value of the PaineWebber brand. Atthe same time, they benefited from the sale of private bank Hy-poswiss, which resulted in a net gain of CHF 125 million, andthe divestment of Klinik Hirslanden, a private hospital group,which contributed a net gain of CHF 60 million. Excluding theseitems and before the amortization of goodwill and other intan-gibles, net profit increased 30% between 2002 and 2003. Thegain reflected our tight management of costs and ability to buildmarket share and capture revenues as financial markets steadi-ly recovered as the year progressed. In particular, asset-basedrevenues recovered from the lows posted in 2002. Our resultwas further helped by much improved trading opportunities, agradual improvement in investor sentiment and significantlylower writedowns in our private equity business. At the sametime, expenses remained under tight control. We recorded re-ductions in all cost categories compared to 2002, with non-per-sonnel expenses falling below their level in 2000.
Operating incomeTotal operating income, at CHF 33,790 million in 2003, wasdown slightly from CHF 34,107 million in 2002. Excluding the
divestment gains of CHF 227 million from the sale of Hypo-swiss and Klinik Hirslanden in 2002 and CHF 161 million fromthe sale of Correspondent Services Corporation in 2003, to-tal operating income fell 1%. The drop was caused by lowerasset-based revenues, which were impacted by low marketlevels in early 2003 (they only started to recover in secondhalf). Operating income was also affected by the weakeningof major currencies against the Swiss franc, including the 13%drop of the US dollar. This was partially offset by higher rev-enue from fixed income trading and a significant decline inprivate equity writedowns.
Net interest income, at CHF 12,299 million in 2003, was17% higher than the CHF 10,546 million in 2002. Net trad-ing income, at CHF 3,756 million in 2003, declined 31% fromCHF 5,451 million a year earlier.
Net income from interest margin products dropped 4% toCHF 5,077 million in 2003 from CHF 5,275 million in 2002.The result reflected lower interest margins on client savingsand cash accounts, and declining revenues from our dimin-ishing recovery portfolio in Switzerland as well as lower inter-est revenue on margin loans in the US as we sold our Cor-respondent Services Corporation (CSC) clearing business.These effects were partially offset by higher mortgages andsaving accounts volumes in Switzerland.
In 2003, net income from trading activities, at CHF 10,681million, rose 2% from CHF 10,505 million a year earlier.Equity trading income, at CHF 2,445 million, fell 12% fromCHF 2,777 million a year earlier. The drop reflected theweakening of most major currencies against the Swiss franc.Excluding currency fluctuations, equity trading revenuesincreased as the business benefited from improved tradingopportunities following the strong market recovery. Fixedincome trading revenue was CHF 6,474 million in 2003, up8% from CHF 5,977 million in the same period a year earlier. This increase was due to better performances acrossour businesses, with very strong revenues in our principalfinance, mortgage-backed securities and derivatives busi-nesses. However, results were also affected by the US dollar’sdecline against the Swiss franc and negative revenues of CHF678 million relating to Credit Default Swaps (CDSs) hedgingexisting credit exposure in the loan book. In 2002, we record-ed a mark to market gain of CHF 226 million on these CDSpositions. Our use of CDSs as hedging instruments for ourloan book is only one part of our overall management ap-proach to trading credit risk. Over the full year, foreignexchange trading revenues, at CHF 1,436 million, wereslightly lower than CHF 1,506 million in 2002.
Net income from treasury activities, at CHF 1,417 millionin 2003, was down 14% from CHF 1,646 million a year earlier. The drop mainly reflected lower income from ourinvested equity as we continued to buy back shares, as wellas a further decline in interest rates. The impact of fallinginterest rates was partially offset by the diversification of ourinvested equity into currencies other than Swiss francs.
29
Headcount (in FTE1): Business Unit distribution
in %, except where indicated
As at 31.12.02 31.12.03 31.12.04
Total1: 69,061 65,929 67,424100
75
50
25
0Wealth Management USA Business Banking Switzerland Investment Bank
Wealth Management Global Asset Management
Corporate Functions
Private Banks & GAM
24.6
22.9
13.6
27.5
3.92.45.1
24.5
23.2
13.9
26.5
23.0
24.6
15.0
25.8
4.02.55.4
3.92.45.3
1 Total full-time equivalents (FTE).

Financial BusinessesResults
In 2003, other net trading and interest income showednegative revenues of CHF 1,120 million compared to negativeCHF 1,429 million a year earlier. The improvement was mainly due to lower goodwill funding costs related to thewritedown of the value of the PaineWebber brand, and lower funding needs for our private equity portfolio.
Total credit loss expense for UBS in 2003 amounted toCHF 72 million, compared to CHF 115 million in 2002. Netcredit loss expense at Wealth Management & Business Bank-ing amounted to CHF 67 million compared to CHF 238 mil-lion in 2002. This exceptionally strong result was achieved de-spite the negative impact of the Erb Group, a privately heldSwiss conglomerate which defaulted in fourth quarter 2003.Our domestic credit portfolio demonstrated strong resiliencein a Swiss economic environment which saw an increase inthe number of corporate bankruptcies by 13.4% comparedto 2002. Measures taken in recent years to improve the qual-ity of our credit portfolio resulted in lower levels of new de-faults, and our success in managing the impaired portfolioresulted in a higher than anticipated level of recoveries. Be-cause of the improving economic and political environmentin some emerging markets, we released country allowancesrelating to our correspondent banking business. OutsideSwitzerland, the global credit environment gradually im-proved during 2003, especially in the second half of the year,reversing the downward trend observed in the previous twoyears. Although some concerns regarding sustainabilityremained, signs pointing to a global economic recoveryincreased. The Investment Bank experienced net credit lossexpense of CHF 4 million, compared to net credit lossrecoveries of CHF 126 million in 2002 and credit loss expenseof CHF 187 million in 2001. This continued strong perform-ance was the result of minimal exposures to new defaults plusthe recovery of country provisions consistent with the morefavorable outlook for emerging market economies.
At CHF 17,345 million, net fee and commission incomein 2003 was 5% lower than CHF 18,221 million in 2002. Thedrop was mainly due to the weakening of the US dollar andother major currencies against the Swiss franc. Excludingcurrency effects, net fee and commission income actuallyincreased, with a record result in our underwriting activities.However, our asset-based revenues suffered from the lowmarket levels in early 2003 and only started to recover insecond half. Further, our brokerage revenues only started torebound as the year progressed, following the gradual risein market activity levels. Underwriting fees, at their highest level ever, increased 10% from CHF 2,134 million in 2002to CHF 2,354 million in 2003. Fixed income and equitiesunderwriting revenues increased by 12% and 9%, respec-tively, compared to a year earlier, reflecting the improvedmarket conditions. Corporate finance fees dropped by 10%to CHF 761 million in 2003 from CHF 848 million in 2002,reflecting lower market activity and a drop in overall size ofthe global fee pool for mergers and acquisitions, although
we were able to again improve our market share. Net bro-kerage fees dropped 11% to CHF 4,125 million in 2003 fromCHF 4,638 million in 2002. The drop reflects the weaken-ing of the US dollar against the Swiss franc as well as low-er client activity, which only recovered in the second half ofthe year as market activity levels started to improve. Theresult was further impacted by the sale of our Correspon-dent Service Corporation (CSC) business. Investment fundfees dropped just 3% to CHF 3,895 million in 2003 from CHF4,033 million in 2002, reflecting lower asset-based fees. Thiswas partially offset by higher revenues due to the expansionof our alternative and quantitative investment business.Custodian fees, at CHF 1,201 million in 2003, were down8% from CHF 1,302 million in 2002, principally due to low-er market values and, consequently, average asset levels.Portfolio and other management and advisory fees, at CHF3,855 million in 2003, fell 5% from CHF 4,065 million in2002. They mostly reflected the drop of the US dollar againstthe Swiss franc as well as declining management fees fromthe low market levels at the outset of the year. This was par-tially offset by higher performance fees. At CHF 355 millionin 2003, insurance-related and other fees decreased 15%from a year earlier, mainly reflecting the weakening of theUS dollar.
Other income was CHF 462 million in 2003 compared withCHF 4 million a year earlier. The increase was mainly due to adrop in private equity impairment charges, as well as higherdisposal gains from our private equity investments. This waspartially offset by a reduction in divestment gains from otherfinancial investments as well as a decline in gains from dis-posals of associates and subsidiaries and a fall-off in incomefrom Klinik Hirslanden.
Operating expensesIn 2003, we continued to manage our cost base tightly. Strongcost control measures remained in place and we furtherstreamlined processes and structures across the firm. Totaloperating expenses fell below their level in 2000. In full-year2003, they were CHF 25,613 million, down 13% from CHF29,570 million a year earlier. The drop was influenced by thewritedown of the value of the PaineWebber brand in fourthquarter 2002, which resulted in an amortization expense ofCHF 1,234 million. Excluding the writedown, expenses de-clined 10%, with drops recorded in all categories of costs.General and administrative expenses fell 14%, reflecting ourcontinuous cost-cutting initiatives, while personnel expensesdropped by 7%. The weakening of the US dollar against theSwiss franc and last year’s sale of Klinik Hirslanden helpedexpenses to decline.
Personnel expenses dropped by 7% to CHF 17,231 millionin 2003 from CHF 18,524 million in 2002. The drop wasmainly due to the weakening of the US dollar against the Swissfranc. Salary expenses fell due to the 5% reduction in head-count over the period. Lower contractor’s expenses and reten-
30

tion payments accentuated the drop. This was partially offsetby higher performance-related compensation expenses thatincreased in line with our improving revenue, as well as slightly higher contributions to retirement plans. Personnelexpenses are managed on a full-year basis with final fixing ofannual performance-related payments in fourth quarter. Overthe full year, approximately 44% of this year’s personnelexpense was paid as bonus or other variable compensation,up from 42% last year.
In full-year 2003, general and administrative expenses, atCHF 6,086 million, were down 14% from CHF 7,072 milliona year earlier. Strict cost control in all our businesses led to adrop in nearly all cost categories. The biggest falls were in over-all provisions, with major declines in legal and security pro-visions (the 2002 result included the global charge of CHF 111 million (USD 80 million) related to the US equity researchsettlement). Administration, IT and telecommunication ex-penses saw significant drops from our continued cost-savinginitiatives, partially offset by slightly higher rent and mainte-nance expenses as well as professional fees, the latter due tohigher project-related costs.
At CHF 1,353 million in 2003, depreciation fell 11% from1,514 million in 2002, mainly due to lower IT-related charges,
as well as the weakening of the US dollar against the Swissfranc.
Amortization of goodwill and other intangible assets de-creased from CHF 2,460 million in 2002 to CHF 943 millionin 2003. The main reason for the drop was the writedown ofthe value of the PaineWebber brand name. Excluding thatcharge, the drop would have been 23%, reflecting the fullamortization of some businesses, as well as the strengthen-ing of the Swiss franc against the US dollar.
TaxWe incurred a tax expense of CHF 1,593 million in 2003, upfrom CHF 676 million in 2002. This corresponded to aneffective tax rate of 19.5% in 2003. Excluding the effect ofthe sale of CSC (sold in second quarter 2003), our effectivetax rate for the full year was 17.9%, compared to 2002’s full-year rate of 16.5% (before significant financial events). Theparticularly low 2002 rate was driven by lower progressive taxrates in Switzerland, the ability to benefit from tax losses inthe US and UK and a high proportion of earnings generatedin lower tax jurisdictions. The 2003 tax rate was positivelyinfluenced by a continued favorable regional profit mix andthe successful conclusion of tax audits.
31

Financial BusinessesWealth Management & Business Banking
Business Group reporting
For the year ended % change from
CHF million, except where indicated 31.12.04 31.12.03 31.12.02 31.12.03
Income 12,764 12,044 12,184 6
Adjusted expected credit loss 1 (33) (131 ) (312 ) 75
Total operating income 12,731 11,913 11,872 7
Personnel expenses 4,473 4,350 4,338 3
General and administrative expenses 1,706 1,694 1,922 1
Services to / from other business units 862 870 837 (1 )
Depreciation 135 170 198 (21 )
Amortization of goodwill and other intangible assets 75 75 97 0
Total operating expenses 7,251 7,159 7,392 1
Business Group performance before tax 5,480 4,754 4,480 15
Business Group performance before tax and amortization of goodwill and other intangible assets 5,555 4,829 4,577 15
Additional information
Regulatory equity allocated (average) 9,400 8,750 8,600 7
Cost / income ratio (%) 2 56.8 59.4 60.7
Cost / income ratio before goodwill (%) 3 56.2 58.8 59.9
Fair value of employee stock options granted 4 127 64 92 98
1 In management accounts, adjusted expected credit loss rather than credit loss expense is reported for the Business Groups (see note 2 to the financial statements). 2 Operating expenses / income.3 Operating expenses less the amortization of goodwill and other intangible assets / income. 4 For informational purposes only. These pre-tax amounts have not been recorded in the income statement.For details on the fair value calculation, refer to note 32e to the financial statements.
32
Wealth Management & Business Banking
In 2004, Wealth Management’s pre-tax profit was CHF 3,435 million, a 32% increase from 2003. Strong inflows from most markets resulted in net new money rising to CHF 42.3 billion from CHF 29.7 billion a year earlier. Business Banking Switzerland’s 2004 pre-tax profit fell 5% to CHF 2,045 million, reflecting lower interest income.
Marcel Rohner | Chairman & CEO Wealth Management & Business Banking

Business Unit reporting
For the year ended % change from
CHF million, except where indicated 31.12.04 31.12.03 31.12.02 31.12.03
Income 7,701 6,797 6,690 13
Adjusted expected credit loss 1 (8) (4 ) (26 ) (100 )
Total operating income 7,693 6,793 6,664 13
Personnel expenses 2,080 1,944 1,869 7
General and administrative expenses 642 604 617 6
Services to / from other business units 1,395 1,479 1,475 (6 )
Depreciation 66 82 93 (20 )
Amortization of goodwill and other intangible assets 75 75 97 0
Total operating expenses 4,258 4,184 4,151 2
Business Unit performance before tax 3,435 2,609 2,513 32
Business Unit performance before tax and amortization of goodwill and other intangible assets 3,510 2,684 2,610 31
KPIs
Invested assets (CHF billion) 778 701 642 11
Net new money (CHF billion) 2 42.3 29.7 17.7
Gross margin on invested assets (bps) 3 103 101 97 2
Cost / income ratio (%) 4 55.3 61.6 62.0
Cost / income ratio before goodwill (%) 5 54.3 60.5 60.6
Cost / income ratio before goodwill and excluding the European wealth management business (%) 6 46.6 52.1 53.3
Client advisors (full-time equivalents) 3,744 3,300 3,001 13
International clients
Income 5,429 4,734 4,640 15
Invested assets (CHF billion) 562 491 447 14
Net new money (CHF billion) 2 40.4 29.7 20.2
Gross margin on invested assets (bps) 3 102 101 98 1
European wealth management (part of international clients)
Income 437 267 186 64
Invested assets (CHF billion) 82 46 28 78
Net new money (CHF billion) 2 13.7 10.8 7.6
Client advisors (full-time equivalents) 838 672 551 25
Swiss clients
Income 2,272 2,063 2,050 10
Invested assets (CHF billion) 216 210 195 3
Net new money (CHF billion) 2 1.9 0.0 (2.5 )
Gross margin on invested assets (bps) 3 106 102 95 4
Additional information As at or for the year ended % change from
31.12.04 31.12.03 31.12.02 31.12.03
Client assets (CHF billion) 972 884 788 10
Regulatory equity allocated (average) 3,150 2,650 2,900 19
Fair value of employee stock options granted 7 81 37 54 119
Headcount (full-time equivalents) 10,093 9,176 9,399 10
1 In management accounts, adjusted expected credit loss rather than credit loss expense is reported for the Business Groups (see note 2 to the financial statements). 2 Excludes interest and dividendincome. 3 Income /average invested assets. 4 Operating expenses / income. 5 Operating expenses less the amortization of goodwill and other intangible assets / income. 6 Operating expenses lessthe amortization of goodwill and other intangible assets and expenses for the European wealth management business / income less income for the European wealth management business. 7 Forinformational purposes only. These pre-tax amounts have not been recorded in the income statement. For details on the fair value calculation, refer to note 32e to the financial statements.
33
Wealth Management

Financial BusinessesWealth Management & Business Banking
Significant financial events
There were no significant financial events that affected thisbusiness unit in 2004, 2003 or 2002.
2004
Key performance indicators
In 2004, net new money inflows totaled CHF 42.3 billion, up42% from CHF 29.7 billion in 2003, representing an annualgrowth rate of 6% of the underlying invested asset base atend-2003. This excellent performance was driven by gains inall geographical areas, especially from Asian clients, and a par-ticularly strong CHF 13.7 billion inflow into our Europeanwealth management business.
Invested assets, at CHF 778 billion on 31 December 2004,were up 11% from CHF 701 billion a year earlier, mainly reflect-ing the strong inflow of net new money and CHF 22.6 billionin new assets gained from acquisitions we integrated in 2004.Rising equity markets also had a positive impact on asset lev-els, helping to compensate for the negative effect of the US dol-lar’s weakening against the Swiss franc. 35% of invested assetswere denominated in US dollars at the end of 2004.
The gross margin on invested assets was 103 basis pointsin 2004, up 2 basis points from 101 basis points a year earlier, as revenues increased more than the average assetbase. Overall, recurring income made up 76 basis points ofthe margin in 2004, up from 71 basis points in 2003. Non-recurring income comprised 27 basis points of the margin in2004, against 30 basis points in 2003.
The pre-goodwill cost / income ratio improved to 54.3% in2004 from 60.5% a year earlier, reflecting the strong rise intotal operating income, which more than offset the gain inperformance-related compensation. Excluding the European
34
Components of operating income
Wealth Management derives its operating income principally from:– fees for financial planning and wealth management services;– fees for investment management services;– transaction-related fees; and– net interest income.
Wealth Management’s fees are based on the market value of investedassets and the level of transaction-related activity. As a result, operat-ing income is affected by factors such as fluctuations in investedassets, changes in market conditions, investment performance andinflows and outflows of client funds.
Net new money
CHF billion
2002 2003 2004
48
36
24
12
0
17.7
29.7
42.3
Invested assets
CHF billion
31.12.02 31.12.03 31.12.04
800
600
400
200
0Swiss Clients International Clients
447491 562
216
210195
Gross margin on invested assets
bps
2002 2003 2004
110
95
80
65
50
97101 103
Cost / income ratio
in %
2002 2003 2004
65
60
55
50
45As reported Adjusted for goodwill and significant financial events
60.6 60.5
54.3
55.3
61.662.0

wealth management business, the 2004 cost / income ratio fellto 46.6% from 52.1% a year earlier.
European wealth management
Our European wealth management business continued to makesignificant progress. With a particularly good performance inthe UK and Germany, the inflow of net new money in 2004 wasCHF 13.7 billion, up 27% from the previous year’s intake of CHF10.8 billion. The result reflects an annual net new money in-flow rate of 30% of the underlying asset base at year-end 2003.
The level of invested assets was a record CHF 82 billion on31 December 2004, almost double the CHF 46 billion a yearearlier, with the gain reflecting healthy inflows of net new mon-ey, and the integration of acquisitions made during the year.
In 2004, income from our European wealth managementbusiness was CHF 437 million, up 64% from a year earlier,reflecting our growing asset and client base.
In 2004, the number of client advisors increased by 166,including 144 client advisors who joined us through the var-ious acquisitions made during the year.
Results
In 2004, pre-tax profit, at CHF 3,435 million, was up 32%from 2003. This increase reflects the recovery in major finan-
cial markets that started in mid-2003, driving a 13% increasein revenues through higher asset-based fees. Rising interestincome, a reflection of the expansion of our margin lendingactivities, also bolstered revenues. At the same time, ourexpenses, up 2% in 2004 from 2003, were kept under tightcontrol. Personnel expenses, up 7%, rose at a slower pacethan income.
Operating incomeTotal operating income in 2004 was CHF 7,693 million, up13% from CHF 6,793 million a year earlier. This was thehighest level ever, reflecting a rise in recurring as well as in non-recurring revenues. Recurring income increased 19% onrising asset-based fees, benefiting from gains in asset levels.This was accentuated by higher interest income due to theexpansion of our margin lending activities. Non-recurring in-come rose due to higher brokerage fees, reflecting an increasein client activity levels, which were particularly strong in thefirst and fourth quarters of the year. These positive effectswere somewhat offset by the weakening of the US dollaragainst the Swiss franc as well as lower divestment gains (in2003 we sold a stake in Deutsche Börse).
Operating expensesAt CHF 4,258 million, operating expenses in 2004 were up2% from CHF 4,184 million a year earlier, reflecting higherpersonnel expenses as well as the ongoing investment in ourgrowth initiatives. Personnel expenses rose 7% to CHF 2,080million in 2004 compared to CHF 1,944 million a year earlier,reflecting higher performance-related compensation as wellas an increase in salaries due to the expansion of our business.General and administrative expenses, at CHF 642 million,were up 6% in 2004 from CHF 604 million due to higher legal and operational provisions, an increase in travel andentertainment expenses as well as a rise in marketing costs.Expenses for services from other business units, at CHF 1,395million in 2004, were down 6% from CHF 1,479 million theprevious year, mainly due to lower charges for insurance andIT services. Depreciation was CHF 66 million in 2004, down20% from CHF 82 million a year earlier because of lowercharges for information technology equipment. Goodwill
35
Net new money European wealth management
CHF billion
2002 2003 2004
16
12
8
4
0
7.6
10.8
13.7
Invested assets European wealth management
CHF billion
31.12.02 31.12.03 31.12.04
100
75
50
25
0
28
46
82
Performance before tax
CHF million
2002 2003 2004
3,600
2,700
1,800
900
0
2,513 2,609
3,435
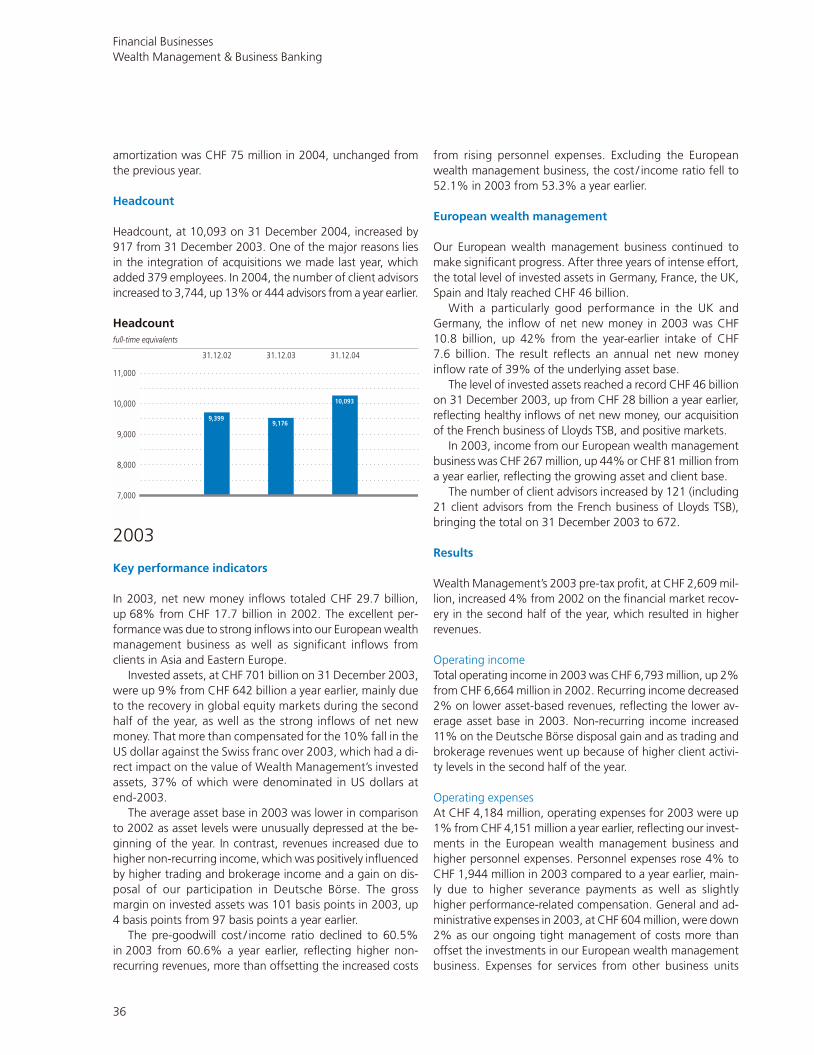
Financial BusinessesWealth Management & Business Banking
amortization was CHF 75 million in 2004, unchanged fromthe previous year.
Headcount
Headcount, at 10,093 on 31 December 2004, increased by917 from 31 December 2003. One of the major reasons liesin the integration of acquisitions we made last year, whichadded 379 employees. In 2004, the number of client advisorsincreased to 3,744, up 13% or 444 advisors from a year earlier.
2003
Key performance indicators
In 2003, net new money inflows totaled CHF 29.7 billion,up 68% from CHF 17.7 billion in 2002. The excellent per-formance was due to strong inflows into our European wealthmanagement business as well as significant inflows fromclients in Asia and Eastern Europe.
Invested assets, at CHF 701 billion on 31 December 2003,were up 9% from CHF 642 billion a year earlier, mainly dueto the recovery in global equity markets during the secondhalf of the year, as well as the strong inflows of net newmoney. That more than compensated for the 10% fall in theUS dollar against the Swiss franc over 2003, which had a di-rect impact on the value of Wealth Management’s investedassets, 37% of which were denominated in US dollars atend-2003.
The average asset base in 2003 was lower in comparisonto 2002 as asset levels were unusually depressed at the be-ginning of the year. In contrast, revenues increased due tohigher non-recurring income, which was positively influencedby higher trading and brokerage income and a gain on dis-posal of our participation in Deutsche Börse. The gross margin on invested assets was 101 basis points in 2003, up4 basis points from 97 basis points a year earlier.
The pre-goodwill cost / income ratio declined to 60.5%in 2003 from 60.6% a year earlier, reflecting higher non-recurring revenues, more than offsetting the increased costs
from rising personnel expenses. Excluding the Europeanwealth management business, the cost / income ratio fell to52.1% in 2003 from 53.3% a year earlier.
European wealth management
Our European wealth management business continued tomake significant progress. After three years of intense effort,the total level of invested assets in Germany, France, the UK,Spain and Italy reached CHF 46 billion.
With a particularly good performance in the UK andGermany, the inflow of net new money in 2003 was CHF 10.8 billion, up 42% from the year-earlier intake of CHF 7.6 billion. The result reflects an annual net new money inflow rate of 39% of the underlying asset base.
The level of invested assets reached a record CHF 46 billionon 31 December 2003, up from CHF 28 billion a year earlier,reflecting healthy inflows of net new money, our acquisitionof the French business of Lloyds TSB, and positive markets.
In 2003, income from our European wealth managementbusiness was CHF 267 million, up 44% or CHF 81 million froma year earlier, reflecting the growing asset and client base.
The number of client advisors increased by 121 (including21 client advisors from the French business of Lloyds TSB),bringing the total on 31 December 2003 to 672.
Results
Wealth Management’s 2003 pre-tax profit, at CHF 2,609 mil-lion, increased 4% from 2002 on the financial market recov-ery in the second half of the year, which resulted in higherrevenues.
Operating incomeTotal operating income in 2003 was CHF 6,793 million, up 2%from CHF 6,664 million in 2002. Recurring income decreased2% on lower asset-based revenues, reflecting the lower av-erage asset base in 2003. Non-recurring income increased11% on the Deutsche Börse disposal gain and as trading andbrokerage revenues went up because of higher client activi-ty levels in the second half of the year.
Operating expensesAt CHF 4,184 million, operating expenses for 2003 were up1% from CHF 4,151 million a year earlier, reflecting our invest-ments in the European wealth management business andhigher personnel expenses. Personnel expenses rose 4% toCHF 1,944 million in 2003 compared to a year earlier, main-ly due to higher severance payments as well as slightly higher performance-related compensation. General and ad-ministrative expenses in 2003, at CHF 604 million, were down2% as our ongoing tight management of costs more thanoffset the investments in our European wealth managementbusiness. Expenses for services from other business units
36
Headcount
full-time equivalents
31.12.02 31.12.03 31.12.04
11,000
10,000
9,000
8,000
7,000
9,3999,176
10,093

remained virtually unchanged at CHF 1,479 million in 2003compared to CHF 1,475 million in 2002. Depreciation wasCHF 82 million in 2003, down 12% from a year earlier be-cause of lower charges for information technology equip-ment, which is increasingly being leased instead of bought.Goodwill amortization was CHF 75 million in 2003, down23% from 2002 mainly due to the weakening of the US dol-lar against the Swiss franc.
Headcount
Headcount, at 9,176 on 31 December 2003, decreased by 223from 31 December 2002. Although we continued to hire clientadvisors, we reduced headcount in non-client facing areas aswe further streamlined processes and structures. In 2003, thenumber of client advisors increased to 3,300, up 10% froma year earlier.
37

Financial BusinessesWealth Management & Business Banking
Business Unit reporting
For the year ended % change from
CHF million, except where indicated 31.12.04 31.12.03 31.12.02 31.12.03
Interest income 3,390 3,542 3,677 (4 )
Non-interest income 1,673 1,705 1,817 (2 )
Income 5,063 5,247 5,494 (4 )
Adjusted expected credit loss 1 (25) (127 ) (286 ) 80
Total operating income 5,038 5,120 5,208 (2 )
Personnel expenses 2,393 2,406 2,469 (1 )
General and administrative expenses 1,064 1,090 1,305 (2 )
Services to / from other business units (533) (609 ) (638 ) 12
Depreciation 69 88 105 (22 )
Amortization of goodwill and other intangible assets 0 0 0
Total operating expenses 2,993 2,975 3,241 1
Business Unit performance before tax 2,045 2,145 1,967 (5 )
Business Unit performance before tax and amortization of goodwill and other intangible assets 2,045 2,145 1,967 (5 )
KPIs
Invested assets (CHF billion) 140 136 127 3
Net new money (CHF billion) 2 2.6 2.5 3.7
Cost / income ratio (%) 3 59.1 56.7 59.0
Cost / income ratio before goodwill (%) 4 59.1 56.7 59.0
Non-performing loans / gross loans (%) 2.3 3.2 3.6
Impaired loans / gross loans (%) 3.0 4.6 6.0
Additional information As at or for the period ended % change from
31.12.04 31.12.03 31.12.02 31.12.03
Deferral (included in adjusted expected credit loss) 411 383 240 7
Client assets (CHF billion) 655 622 494 5
Regulatory equity allocated (average) 6,250 6,100 5,700 2
Fair value of employee stock options granted 5 46 27 38 70
Headcount (full-time equivalents) 15,508 16,181 16,967 (4 )
1 In management accounts, adjusted expected credit loss rather than credit loss expense is reported for the Business Groups (see note 2 to the financial statements). 2 Excludes interest and dividendincome. 3 Operating expenses / income. 4 Operating expenses less the amortization of goodwill and other intangible assets / income. 5 For informational purposes only. These pre-tax amounts havenot been recorded in the income statement. For details on the fair value calculation, refer to note 32e to the financial statements.
38
Business Banking Switzerland
Components of operating income
Business Banking Switzerland derives its operating income principallyfrom:– net interest income from its loan portfolio and customer deposits;– fees for investment management services; and– transaction fees.
As a result, operating income is affected by movements in interestrates, fluctuations in invested assets, client activity levels, investmentperformance, changes in market conditions and the credit environ-ment.

Significant financial events
There were no significant financial events that affected thisbusiness unit in 2004, 2003 or 2002.
2004
Key performance indicators
Net new money was CHF 2.6 billion in 2004, slightly higherthan the inflow of CHF 2.5 billion in 2003.
Invested assets rose to CHF 140 billion in 2004 from CHF136 billion a year earlier as positive market developments andnet new money inflows were only partially offset by the weak-ening of the US dollar against the Swiss franc and the trans-fer of assets to our Wealth Management business. During thecourse of 2004, we transferred CHF 7 billion in assets fromthe Business Banking Switzerland unit to the Wealth Manage-ment unit, reflecting the increasing needs of clients.
The cost / income ratio was 59.1%, 2.4 percentage pointsabove the ratio of 56.7% in 2003, reflecting falling interestincome in the low interest rate environment.
Business Banking Switzerland’s loan portfolio was CHF137 billion on 31 December 2004, down CHF 2 billion fromthe previous year. An increase in volumes of private clientmortgages was offset by lower credit demand from corporate
clients and a further reduction in the recovery portfolio, whichfell to CHF 4.4 billion on 31 December 2004 from CHF 6.4billion a year earlier. This positive development was also re-flected in the key credit quality ratios: the non-performing loanratio improved to 2.3% from 3.2%, while the ratio of impairedloans to gross loans was 3.0% compared to 4.6% in 2003.
Results
Pre-tax profit in 2004 was CHF 2,045 million, only CHF 100million or 5% lower than the record result achieved in 2003.It was achieved despite a CHF 184 million fall in income, driv-en mainly by lower interest income. The result shows thecontinued tight management of our cost base, with lowercredit loss expenses reflecting the structural improvementin our loan portfolio in recent years. In 2004, personnel ex-penses and depreciation reached their lowest levels sincethe UBS-SBC merger in 1998.
Operating incomeTotal operating income in 2004 was CHF 5,038 million, downslightly from 2003’s level of CHF 5,120 million. Interest incomedeclined by 4% to CHF 3,390 million in 2004 from CHF 3,542million in 2003. The decline reflects lower revenues from ourreduced recovery portfolio, as well as lower interest marginson savings and cash accounts. This was partially offset byhigher private client mortgage volumes. Non-interest incomedropped by CHF 32 million to CHF 1,673 million in 2004 fromCHF 1,705 million in 2003, reflecting lower client activitylevels, partially offset by the gain from the sale of a partici-pation in the Noga Hilton hotel. Adjusted expected credit lossexpenses, at CHF 25 million in 2004, decreased by 80% fromCHF 127 million in 2003. This fall reflects the deferred bene-fit of the structural improvement in our loan portfolio in re-cent years.
Operating expensesOperating expenses in 2004 were CHF 2,993 million, up 1%from CHF 2,975 million in 2003. Personnel expenses, at CHF2,393 million, were down 1% from CHF 2,406 million in2003, as falling salary costs reflected the 4% drop in head-
39
Cost / income ratio
in %
2002 2003 2004
60
55
50
45
40
59.0
56.7
59.1
6.0
4.6
3.0
Impaired loans / gross loans
in %
31.12.02 31.12.03 31.12.04
8
6
4
2
0
Performance before tax
CHF million
2002 2003 2004
2,250
2,000
1,750
1,500
1,250
1,967
2,145
2,045

Financial BusinessesWealth Management & Business Banking
count, partly offset by an increase in performance-relatedcompensation. General and administrative expenses, atCHF 1,064 million in 2004, continued to drop and were 2%lower than the CHF 1,090 million recorded in 2003, reflect-ing our continuous tight cost controls. Drops were seen mainly in professional fees. Net charges to other business unitsfell to CHF 533 million in 2004 from CHF 609 million in 2003because of lower charge-outs for IT services. Depreciationin 2004 dropped to CHF 69 million from CHF 88 million in2003 due to lower expenses for information technologyequipment.
Headcount
Business Banking Switzerland’s headcount was 15,508 on 31December 2004, a decline of 673 from 31 December 2003,reflecting our continued investment in technology and au-tomation, as well as the ongoing streamlining of processesand structures.
2003
Key performance indicators
Net new money was CHF 2.5 billion in 2003 compared withan inflow of CHF 3.7 billion in 2002.
Invested assets rose to CHF 136 billion in 2003 from CHF127 billion a year earlier as positive market developments andpositive inflows of net new money were only partially offsetby the weakening of the US dollar against the Swiss franc.
In 2003, the cost / income ratio was 56.7%, 2.3 percent-age points below the ratio of 59.0% in 2002, reflecting low-er total operating expenses.
Business Banking Switzerland’s loan portfolio was CHF139 billion on 31 December 2003, unchanged from a yearearlier. An increase in volumes of private client mortgages wasoffset by declining volumes in the corporate clients area anda further reduction in the recovery portfolio, which fell to CHF
6.4 billion on 31 December 2003 from CHF 8.6 billion a yearearlier. This positive development was also reflected in the keycredit quality ratios: the non-performing loan ratio improvedto 3.2% from 3.6%, while the ratio of impaired loans to grossloans was 4.6% compared with 6.0% in 2002.
Results
Pre-tax profit in 2003 was CHF 2,145 million, up 9% from2002. The result was achieved despite slightly lower revenuesin difficult market conditions. This performance is also evi-dence of the continued tight management of our cost base,and lower credit loss expenses reflecting the deferred bene-fit of the structural improvement in our loan portfolio in re-cent years.
Operating incomeOperating income was CHF 5,120 million in 2003, downslightly from 2002’s level of CHF 5,208 million. Interest incomedeclined by 4% to CHF 3,542 million in 2003 from CHF 3,677million in 2002. The decline reflects lower interest margins onsavings and cash accounts as well as lower revenues fromour reduced recovery portfolio. This was partially offset byhigher mortgage and saving account volumes. Non-interestincome dropped by CHF 112 million to CHF 1,705 million in2003 from CHF 1,817 million in 2002, reflecting the difficultmarket environment at the beginning of the year. This waspartially offset by lower adjusted expected credit loss ex-penses, which fell to CHF 127 million in 2003, down 56%from CHF 286 million in 2002.
Operating expensesOperating expenses in 2003 were CHF 2,975 million, down 8%from CHF 3,241 million in 2002. Personnel expenses, at CHF2,406 million, were down 3% from CHF 2,469 million in2002, mainly due to lower salary costs reflecting the 5% dropin headcount. General and administrative expenses, at CHF1,090 million in 2003, continued to drop and were 16% low-er than the CHF 1,305 million recorded in 2002. This reflectsour continuous efforts to control our costs tightly. Net chargesto other business units dropped to CHF 609 million in 2003from CHF 638 million in 2002 due to lower charge-outs to oth-er business units. Depreciation for 2003 dropped to CHF 88million from CHF 105 million in 2002 as information technol-ogy equipment is increasingly being leased instead of bought.
Headcount
Business Banking Switzerland’s headcount was 16,181 on 31December 2003, a decline of 786 from 31 December 2002,reflecting our continued investment in technology and au-tomation, as well as the ongoing streamlining of processesand structures.
40
16,967
16,181
15,508
Headcount
full-time equivalents
31.12.02 31.12.03 31.12.04
17,500
16,500
15,500
14,500
13,500

Business Group reporting
For the year ended % change from
CHF million, except where indicated 31.12.04 31.12.03 31.12.02 31.12.03
Institutional fees 1,085 922 865 18
Wholesale intermediary fees 937 815 790 15
Total operating income 2,022 1,737 1,655 16
Personnel expenses 901 806 763 12
General and administrative expenses 299 265 301 13
Services to / from other business units 126 156 164 (19 )
Depreciation 23 25 22 (8 )
Amortization of goodwill and other intangible assets 129 153 186 (16 )
Total operating expenses 1,478 1,405 1,436 5
Business Group performance before tax 544 332 219 64
Business Group performance before tax and amortization of goodwill and other intangible assets 673 485 405 39
KPIs
Cost / income ratio (%) 1 73.1 80.9 86.8
Cost / income ratio before goodwill (%) 2 66.7 72.1 75.5
Institutional
Invested assets (CHF billion) 344 313 274 10
of which: money market funds 17 14 19 21
Net new money (CHF billion) 3 23.7 12.7 (1.4 )
of which: money market funds (1.2) (5.0 ) (1.8 )
Gross margin on invested assets (bps) 4 32 32 29 0
1 Operating expenses / operating income. 2 Operating expenses less the amortization of goodwill and other intangible assets / operating income. 3 Excludes interest and dividend income.4 Operating income /average invested assets.
41
Pre-tax profit was CHF 544 million, an increase of 64% from the 2003 pre-tax profit of CHF 332 million. Theincrease was driven by higher operating income, which rose 16%, reflecting strong net new money inflows, a continuing change in asset mix towards higher-margin products, and a rise in market valuations resulting in increased asset levels and revenues.
Global Asset Management
Financial BusinessesGlobal Asset Management
John A. Fraser | Chairman and CEO Global Asset Management

Financial BusinessesGlobal Asset Management
Significant financial events
There were no significant financial events that affected thisBusiness Group in 2004, 2003 or 2002.
2004
Key performance indicators
For 2004, the pre-goodwill cost / income ratio was 66.7%, adecrease of 5.4 percentage points from 2003. This was a result of improving operating income combined with modestcost growth. Higher market valuations coupled with strong
net new money inflows resulted in increased invested assetlevels and, subsequently, higher asset-based fees. The con-tinuing change in asset mix towards higher-margin productsincreased operating income and overall profitability.
InstitutionalInstitutional invested assets were CHF 344 billion on 31 De-cember 2004 – at their highest level since 2000, and up 10%from CHF 313 billion on 31 December 2003, reflecting bothstrong net new money and rising financial markets. This in-crease was partly offset by the weakening of the US dollaragainst the Swiss franc.
For full-year 2004, net new money inflows were CHF 23.7billion, up significantly from the CHF 12.7 billion recorded in
42
Global Asset Management (continued)
Wholesale intermediary As at or for the year ended % change from
31.12.04 31.12.03 31.12.02 31.12.03
Invested assets (CHF billion) 257 261 259 (2 )
of which: money market funds 64 87 106 (26 )
Net new money (CHF billion) 1 (4.5) (5.0 ) (6.3 )
of which: money market funds (20.6) (23.0 ) (6.9 )
Gross margin on invested assets (bps) 2 36 31 27 16
Additional information As at or for the year ended % change from
31.12.04 31.12.03 31.12.02 31.12.03
Client assets (CHF billion) 601 574 533 5
Regulatory equity allocated (average) 950 1,000 1,100 (5 )
Fair value of employee stock options granted 3 43 41 43 5
Headcount (full-time equivalents) 2,665 2,627 2,668 1
1 Excludes interest and dividend income. 2 Operating income /average invested assets. 3 For informational purposes only. These pre-tax amounts have not been recorded in the Income statement.For details on the fair value calculation, refer to note 32e to the financial statements.
Components of operating income
Global Asset Management generates its revenue from the assetmanagement and fund administration services it provides to financialintermediaries and institutional investors. Fees charged to institutionalclients and wholesale intermediary clients are based on the market
value of invested assets and on successful investment performance.As a result, revenues are affected by changes in market and currencyvaluation levels, as well as flows of client funds, and relative invest-ment performance.
Invested assets, institutional
CHF billion
31.12.02 31.12.03 31.12.04
400
300
200
100
0Money market funds Invested assets excluding money market funds
255
299327
19
1417
Cost / income ratio
in %
2002 2003 2004
90
80
70
60
50As reported Adjusted for goodwill
75.572.1
66.7
73.1
80.9
86.8

2003. Alternative and quantitative investments, equity andfixed income mandates experienced strong inflows, partiallyoffset by outflows from asset allocation mandates and money market funds.
The gross margin for full-year 2004 was 32 basis points,on a par with full-year 2003.
Wholesale intermediaryInvested assets were CHF 257 billion on 31 December 2004,down by CHF 4 billion from 31 December 2003. For full-year2004, the net new money outflow was CHF 4.5 billion com-pared with a CHF 5.0 billion outflow in 2003.
The money market outflow in 2004 was CHF 20.6 billion.This was partly offset by positive inflows of CHF 16.1 billion,recorded mainly in fixed income mandates (inflow of CHF 7.7billion) and to a lesser extent in asset allocation and equityfunds.
The 2004 gross margin was 36 basis points, up by 5 basispoints from a year earlier, reflecting the significant improve-ment of wholesale intermediary fees as a result of the contin-uing shift to higher-margin products.
Money market sweep accountsSome of the money market fund assets managed by our USwholesale intermediary business represent the cash portion ofprivate client accounts. Before launching UBS Bank USA in2003, the cash balances of private clients in the US were sweptinto our money market funds. Since the bank’s launch, thosecash proceeds have been automatically redirected into itsFDIC-insured deposit accounts. Although there was no one-time bulk transfer of client money market assets to the bank,the funds invested in our sweep accounts are being used tocomplete client transactions and will therefore graduallydeplete over time. Such funds are a low-fee component ofinvested assets. Full-year money market outflows in our USwholesale intermediary business were CHF 13.6 billion, ofwhich approximately CHF 11 billion related to UBS Bank USA.
43
Non-money market funds Money market funds
Net new money, institutional
CHF billion
2002 2003 2004
30
20
10
0
–10
(1.8)
0.4
(5.0)
17.7
24.9
(1.2)
Gross margin on invested assets, institutional
bps
2002 2003 2004
35
30
25
20
15
29
32 32
106
153
87
174
64
193
Invested assets, wholesale intermediary
CHF billion
31.12.02 31.12.03 31.12.04
300
225
150
75
0Money market funds Invested assets excluding money market funds
Non-money market funds Money market funds
Net new money, wholesale intermediary
CHF billion
2002 2003 2004
30
15
0
–15
–30
(6.9)
(23.0)(20.6)
16.118.0
0.6
Gross margin on invested assets,wholesale intermediary
bps
2002 2003 2004
40
30
20
10
0
27
31
36

Financial BusinessesGlobal Asset Management
We do not expect further major outflows from our moneymarket funds into UBS Bank USA in 2005.
Investment capabilities and performance
Financial markets experienced greater volatility in 2004 thanin the previous year due to rising oil prices and continuedgeopolitical instability. Still, equity markets made progress,with strong gains during fourth quarter. Most of our activelymanaged global and regional equity strategies outperformedtheir benchmarks, with particularly strong performances in Eu-ropean and US asset classes. The Global Equity composite per-formed marginally below benchmark (after fees) for the year.
Bond markets in the major industrialized countries weresurprisingly resilient in 2004, posting solid returns. Europeanbonds were the best performers as investors saw the surge inoil prices as a potential drag on economic growth rather thanraising inflationary expectations. A positive economic environ-ment supported corporate bonds and drove spreads to verynarrow levels. Overall, our active interest rate strategies con-tinued to outperform their benchmarks, particularly in the US;however, our Global Bond composite performed just belowits benchmark (after fees) in 2004.
Asset allocation portfolios outperformed their benchmarksby significant amounts, with market allocation providing muchof the added value. Stock selection was positive in US andemerging equities and US bonds. Longer-term returns againstbenchmarks remain positive.
In alternative and quantitative investments, performancewas generally positive in 2004. All key equity-oriented strate-gies recorded positive returns, while a difficult macroeco-nomic environment contributed to slightly negative returns forour core “macro” trading strategy. Despite ongoing politicaland economic uncertainty, the multi-manager teams wereable to generate positive returns from most strategies. Over-all, funds of hedge funds performance was positive, buoyedby strong fourth quarter performance.
Real estate portfolios in the US, UK and Japan continuedto perform strongly during 2004. In publicly traded real es-tate equities, excellent performance was achieved, with assetsdoubling in Europe due to a combination of inflows and per-formance.
Results
We reported a very strong full-year result in 2004. Pre-taxprofit was CHF 544 million, an increase of 64% from the 2003
pre-tax profit of CHF 332 million. The increase was driven byhigher operating income, which rose 16%, reflecting strongnet new money inflows, a continuing change in asset mix to-wards higher-margin products, and a rise in market valuationsresulting in increased asset levels and revenues. This was only partially offset by a slight rise in operating expenses,mainly due to higher incentive-based compensation as a result of the higher revenues.
Operating incomeIn full-year 2004, operating income was CHF 2,022 million,up 16% from CHF 1,737 million a year earlier. The increasereflects higher financial market valuations and strong inflowsinto alternative and quantitative investments, and equities andfixed income mandates, resulting in higher invested assetlevels and, consequently, higher asset-based revenues. Per-formance-related fees, especially in alternative and quantita-tive investments, remained at the strong levels seen in 2003.Institutional revenues increased to CHF 1,085 million in full-year 2004 from CHF 922 million in 2003, driven by both theimproved market environment and strong asset inflows.Wholesale intermediary revenues rose to CHF 937 million in2004 from CHF 815 million in 2003, reflecting higher marketvaluations and an improvement in the asset mix – as low-margin money market outflows were mostly offset by inflowsinto higher-margin products.
Operating expensesIn 2004, operating expenses increased to CHF 1,478 millionfrom CHF 1,405 million in 2003, primarily due to higher in-centive-based compensation as a result of increased profita-bility. Personnel expenses were CHF 901 million in 2004, 12%above 2003. General and administrative expenses increasedby 13% to CHF 299 million in 2004 from CHF 265 million in
44
Annualized
Composite 1 year 3 years 5 years 10 years
Global Equity Composite vs. MSCI World Equity (Free) Index – – + +
Global Bond Composite vs. Citigroup World Government Bond Index – + + +
Global Securities Composite vs. Global Securities Markets Index + + + +
(+) above benchmark; (–) under benchmark. All after fees.
Performance before tax
CHF million
2002 2003 2004
600
450
300
150
0
219
332
544

2003. This increase was mainly due to a restructuring provi-sion in our business in the Americas booked in third quarter2004 and the damage caused by Hurricane Ivan in the Cay-man Islands. Travel and entertainment costs, IT expenses andprofessional fees increased year-on-year. Net charges fromother business units decreased by CHF 30 million to CHF 126million in 2004 from CHF 156 million in 2003, partly due tohigher charge-outs to the wealth management businessesreflecting the increase in the distribution of alternative invest-ment products. Over the same period, depreciation remainedvirtually unchanged at CHF 23 million, down by only CHF 2 million. Amortization of goodwill decreased to CHF 129 mil-lion in 2004 from CHF 153 million a year earlier, due to thefull amortization of the goodwill of some businesses and theUS dollar’s decline against the Swiss franc.
Headcount
Headcount was 2,665 on 31 December 2004, up by 38 from2,627 on 31 December 2003. The increase of 1% is mainlyattributable to our expansion of the European real estate busi-ness as well as our growing businesses in alternative and quan-titative investments and fund services.
2003
Key performance indicators
For 2003, the pre-goodwill cost / income ratio was 72.1%,an improvement of 3.4 percentage points from 2002. This wasa result of improving operating income and operating ex-penses. The recovery in equity markets experienced in thesecond half of 2003 resulted in higher invested asset levelsand, consequently, higher asset-based revenues. Strong in-flows of net new money (excluding lower fee money marketfunds), combined with improved investment performance,especially in the alternative and quantitative platform, helpedrevenues to rise. These developments were supported by on-going cost control initiatives that drove operating expensesdown by 2%.
InstitutionalInstitutional invested assets totaled CHF 313 billion on 31 De-cember 2003, up 14% from CHF 274 billion on 31 Decem-ber 2002, reflecting the strong market development in thesecond half of 2003 and strong inflows of net new money.The increase was partly offset by the weakening of majorcurrencies against the Swiss franc.
For full-year 2003, net new money inflows were CHF 12.7 billion, up significantly from the outflows of CHF 1.4 bil-lion recorded in 2002. Equity mandates and alternative andquantitative investments experienced strong inflows, partial-ly offset by outflows from asset allocation mandates andmoney market funds.
The full-year 2003 gross margin was 32 basis points, upfrom 29 basis points in 2002, reflecting higher performancefees and an improving asset mix.
Wholesale intermediaryInvested assets were CHF 261 billion on 31 December 2003,up by CHF 2 billion from 31 December 2002. The impactof adverse currency movements and the launch of UBSBank USA, which prompted outflows from money marketfunds, nearly offset the positive effect from rising financialmarkets.
For full-year 2003, the net new money outflow amountedto CHF 5.0 billion compared with the CHF 6.3 billion out-flow in 2002. The money market outflow in 2003 was CHF23.0 billion, partially offset by inflows of CHF 17.1 billion in-to higher-margin equity and fixed income mandates. The out-flows in money market funds were primarily in the Americasas a result of the launch of UBS Bank USA.
The gross margin increased to 31 basis points in 2003 from27 basis points in 2002, reflecting the change in the asset mixtowards higher-margin assets.
Results
Global Asset Management reported a pre-tax profit of CHF332 million in 2003, an increase of 52% from 2002’s pre-taxprofit of CHF 219 million. The recovery in the second half of2003 in equity market valuations, coupled with strong inflowsinto alternative investments, equities and fixed income man-dates, resulted in higher invested asset levels and, con-sequently, increased asset-based revenues. Performance-related fees, especially in the alternative and quantitativebusiness, showed significant improvement over 2002. On-going cost control initiatives that systematically reducedoperating expenses contributed significantly to improvedprofitability. Lower IT and premises costs prompted generaland administrative expenses to decline. Amortization ex-penses fell as the goodwill of some assets became fully amor-tized. These developments were partially offset by higherincentive-based compensation resulting from the increase inoperating income.
45
Headcount
full-time equivalents
31.12.02 31.12.03 31.12.04
3,000
2,250
1,500
750
0
2,668 2,627 2,665

Financial BusinessesGlobal Asset Management
Operating incomeIn full-year 2003, operating income was CHF 1,737 million,up 5% from CHF 1,655 million a year earlier. It reflected therecovery in equity market valuations in second half 2003, cou-pled with strong inflows into alternative investments, equitiesand fixed income mandates, resulting in higher invested as-set levels and consequently higher asset-based revenues.Performance-related fees, especially in the alternative andquantitative business, showed significant improvement over2002. Institutional revenues increased to CHF 922 million infull-year 2003 from CHF 865 million in 2002, driven by boththe improved market environment and strong asset inflows,especially in the alternative and quantitative business. For full-year 2003, Wholesale intermediary revenues, at CHF 815 mil-lion, increased from CHF 790 million in 2002, reflecting therecovery in the equity markets and an improvement in the as-set mix, both of which had a positive impact on our asset-based revenues.
Operating expensesFor full-year 2003, operating expenses declined to CHF 1,405million from CHF 1,436 million in 2002, primarily due to cost-
saving initiatives and lower goodwill amortization. Personnelexpenses were CHF 806 million in 2003, 6% above 2002, dueto higher incentive-based compensation reflecting improvedrevenues. General and administrative expenses fell to CHF 265 million in 2003 from CHF 301 million in 2002. The de-crease is a result of ongoing cost-saving initiatives, resultingin a significant reduction of IT and premises expenses. Thesesavings were partly offset by non-recurring operational pro-visions. Charges from other business units decreased by CHF8 million to CHF 156 million in 2003. Depreciation, at CHF 25 million, increased by CHF 3 million from 2002. Amortiza-tion of goodwill decreased to CHF 153 million in 2003 fromCHF 186 million a year earlier. The drop was due both to thefull amortization of the goodwill of some businesses and tothe US dollar’s drop against the Swiss franc.
Headcount
Headcount was 2,627 on 31 December 2003, down by 41from 2,668 on 31 December 2002. The decrease of 2% pri-marily reflects cost-saving efforts in the traditional invest-ments business.
46

Business Group reporting
For the year ended % change from
CHF million, except where indicated 31.12.04 31.12.03 31.12.02 31.12.03
Investment banking 1,909 1,703 1,915 12
Equities 5,906 4,875 5,608 21
Fixed income, rates and currencies 7,912 7,490 6,498 6
Private equity 257 (77 ) (1,602 )
Income 15,984 13,991 12,419 14
Adjusted expected credit loss 1 (7) (55 ) (90 ) 87
Total operating income 15,977 13,936 12,329 15
Personnel expenses 8,156 7,303 7,815 12
General and administrative expenses 2,535 2,074 2,359 22
Services to / from other business units 219 180 140 22
Depreciation 239 246 320 (3 )
Amortization of goodwill and other intangible assets 288 278 364 4
Total operating expenses 11,437 10,081 10,998 13
Business Group performance before tax 4,540 3,855 1,331 18
Business Group performance before tax and amortization of goodwill and other intangible assets 4,828 4,133 1,695 17
KPIs
Compensation ratio (%) 2 51 52 63
Cost / income ratio (%) 3 71.6 72.1 88.6
Cost / income ratio before goodwill (%) 4 69.8 70.1 85.6
Non-performing loans / gross loans (%) 0.6 0.8 1.5
Impaired loans / gross loans (%) 0.8 1.4 2.5
Average VaR (10-day 99%) 358.0 294.8 21
1 In management accounts, adjusted expected credit loss rather than credit loss expense is reported for the Business Groups (see note 2 to the financial statements). 2 Personnel expenses / income.3 Operating expenses / income. 4 Operating expenses less the amortization of goodwill and other intangible assets / income.
47
In 2004, the Investment Bank’s pre-tax profit was CHF 4,540 million, up 18% from a year earlier. Results weredriven by strong performances across all businesses and fueled by a pick-up in market activity.
Investment Bank
John P. Costas | Chairman and CEOInvestment Bank
Financial BusinessesInvestment Bank

Financial BusinessesInvestment Bank
Significant financial events
There were no significant financial events that affected thisBusiness Group in 2004, 2003 or 2002.
2004
Key performance indicators
The pre-goodwill cost / income ratio improved to 69.8% in2004 from 70.1% a year earlier. It reflected a strong revenueperformance in all businesses.
Our compensation ratio in 2004 was 51%, down from52% in 2003, reflecting the completion of our aggressiveinvestment banking hiring program. Payout levels are drivenby the revenue mix across business areas and are managed inline with market levels.
Total loans were CHF 69 billion on 31 December 2004,up 25% from CHF 55 billion a year earlier, reflecting ourstrengthened business franchise. Continued successfulrecovery efforts led the ratio of impaired loans to total loansto fall to 0.8% at the end of 2004 from 1.4% on 31 Decem-ber 2003. The non-performing loans to total loans ratio fellto 0.6% from 0.8% in the same period.
The level of our private equity investments stood at CHF
48
Investment Bank (continued)
Private equity As at or for the year ended % change from
31.12.04 31.12.03 31.12.02 31.12.03
Value creation (CHF billion) 0.6 (0.3 ) (1.4 )
Investment (CHF billion) 1 1.9 2.3 3.1 (17 )
Portfolio fair value (CHF billion) 2.7 2.9 3.8 (7 )
Additional information As at or for the year ended % change from
31.12.04 31.12.03 31.12.02 31.12.03
Deferral (included in adjusted expected credit loss) 85 29 8 193
Client assets (CHF billion) 147 143 133 3
Regulatory equity allocated (average) 14,100 12,700 13,100 11
Fair value of employee stock options granted 2 258 391 582 (34 )
Headcount (full-time equivalents) 16,568 15,277 15,791 8
1 Historical cost of investments made, less divestments and impairments. 2 For informational purposes only. These pre-tax amounts have not been recorded in the income statement. For details on thefair value calculation, refer to note 32e to the financial statements.
Components of operating income
The Investment Bank generates operating income from:– commissions on agency transactions and spreads or markups on
principal transactions;– fees from debt and equity capital markets transactions, leveraged
finance, and the structuring of derivatives and complex transactions;– mergers and acquisitions and other advisory fees;– interest income on principal transactions and from the loan port-
folio; and
– gains and losses on market making, proprietary, and arbitragepositions.
As a result, operating income is affected by movements in marketconditions, interest rate swings, the level of trading activity inprimary and secondary markets and the extent of merger and acqui-sition activity. These and other factors have had, and may in thefuture have, a significant impact on results of operations from year to year.
85.6
70.1 69.8
71.672.1
88.6
Cost / income ratio
in %
2002 2003 2004
90
80
70
60
50As reported Adjusted for goodwill
Compensation ratio
in %
2002 2003 2004
65
60
55
50
45
63
5251

1.9 billion on 31 December 2004, a decline of 17% fromCHF 2.3 billion on 31 December 2003, reflecting writedownsand successful divestments. Unfunded commitments fell by47% to CHF 0.8 billion on 31 December 2004 from CHF 1.5billion a year ago. The fair value of the portfolio on 31 De-cember 2004 was CHF 2.7 billion, down from CHF 2.9 billionon 31 December 2003, driven by exits and revaluations.
Results
Pre-tax profit was CHF 4,540 million in 2004, up 18% froma year earlier and at its highest level since 2000. Our result wasachieved despite the significant weakening of the US dollaragainst the Swiss franc and reflects revenue growth across allour businesses. In particular, our fixed income, rates and cur-
rencies business posted a record result, up 6% from 2003,while the equities business reported a 21% increase in rev-enues on the strong improvement in market conditions. Pri-vate equity also contributed to our result, recording revenuesof CHF 257 million, a significant improvement. At the sametime, costs increased as our businesses continued to expand,with specific operational provisions also a factor.
Operating incomeTotal operating income in 2004 was CHF 15,977 million, up15% from CHF 13,936 million a year earlier, reflecting strongimprovements in all businesses.
Equities revenues, at CHF 5,906 million in 2004, were up21% from CHF 4,875 million in 2003. Growth in revenuesoccurred around the globe, but was particularly strong in theUS and Europe. Significant increases were seen in secondarycash commissions and proprietary trading revenues. Primebrokerage saw an impressive revenue gain following the ac-quisition of ABN Amro’s prime brokerage business in the US.
Fixed income, rates and currencies revenues were CHF7,912 million, up 6% from CHF 7,490 million a year earlier.Strong gains were seen in the rates business, mainly due tothe structured LIBOR and mortgage businesses. Fixed incomewas driven by credit derivatives, emerging markets and glob-al syndicated finance businesses, foreign exchange and cashand collateral trading. The positive result was slightly offsetby negative revenues of CHF 62 million relating to CreditDefault Swaps (CDSs) hedging existing credit exposure in theloan book – significantly lower than 2003’s negative revenuesof CHF 678 million.
Investment banking revenues, at CHF 1,909 million in2004, increased 12% from CHF 1,703 million a year earlier.Excluding currency fluctuations and hedging costs, revenueswere up 32%, reflecting improving corporate activity levels.It was a record year for our global advisory business, with dou-ble-digit growth seen in Europe, the US and Asia. Accordingto a Dealogic survey1, we ranked fifth for investment bank-ing fees in 2004 with a market share of 5.3%, up from sixthand a market share of 5.0% a year earlier.
Private equity also contributed to our result, recording rev-enues of CHF 257 million in 2004, a significant improvementcompared to the negative revenues of CHF 77 million a yearearlier, as market conditions allowed for successful divest-ments and lower writedowns.
Operating expensesHigher personnel costs and general and administrative expens-es prompted total operating expenses in 2004 to rise to CHF11,437 million, a 13% increase from CHF 10,081 million ayear earlier. Personnel expenses, at CHF 8,156 million in 2004,increased 12% from a year earlier, reflecting higher perform-ance-related compensation which rose due to higher rev-
49
Impaired loans / gross loans
in %
31.12.02 31.12.03 31.12.04
2.8
2.1
1.4
0.7
0.0
2.5
1.4
0.8
Investment
CHF billion
31.12.02 31.12.03 31.12.04
4
3
2
1
0
3.1
2.3
1.9
Performance before tax
CHF million
2002 2003 2004
5,000
3,750
2,500
1,250
0
1,331
3,855
4,540
1 Financial Times, 26 January 2005. Table: Global fee ranking 2004

Financial BusinessesInvestment Bank
enues, as well as an increase in salaries reflecting the 8%additional headcount. General and administrative expenseswere CHF 2,535 million in 2004, up 22% from 2003’s CHF2,074 million. The increase reflected higher operational pro-visions, rising professional fees and raised IT spending. Thiswas partially offset by a drop in administration and occupan-cy expenses. Services from other business units increased toCHF 219 million in 2004 from CHF 180 million in 2003. De-preciation eased 3% to CHF 239 million in 2004 from CHF246 million in 2003 on a decline in writeoffs. Amortization ofgoodwill and other intangibles, at CHF 288 million in 2004,was up 4% from CHF 278 million a year earlier, reflecting theABN Amro acquisition.
Headcount
Headcount, at 16,568 on 31 December 2004, was up 8%from a year earlier. Staffing increases were driven by contin-ued business expansion and included the impact of integrat-ing personnel from the Charles Schwab Capital Markets divi-sion and the hiring of additional operational risk managementand compliance staff.
2003
Key performance indicators
The pre-goodwill cost / income ratio decreased to 70.1% in2003 from 85.6% in 2002. The fall reflects an increase in rev-enues, driven by our fixed income, rates and currencies busi-ness and our private equity business, set against the drop inoperating expenses, which reflected our disciplined cost con-trol. Both revenues and expenses were affected by the weak-ening of major currencies, mainly the US dollar, against theSwiss franc.
Our compensation ratio in 2003 was 52%, down from63% in 2002. The payout levels of annual performance-related payments are driven by the revenue mix across busi-ness areas and are managed in line with market levels.
Total loans were CHF 55 billion on 31 December 2003,down 11% from CHF 62 billion a year earlier, mainly dueto the drop in the US dollar against the Swiss franc. Contin-ued successful recovery efforts led the ratio of impaired loansto total loans to fall from 2.5% on 31 December 2002 to1.4% at the end of 2003. The non-performing loans to total loans ratio declined from 1.5% to 0.8% in the sameperiod.
The level of our private equity investments was CHF 2.3 bil-lion on 31 December 2003, down from CHF 3.1 billion a yearearlier. The decrease was mainly due to successful divestmentsalongside further writedowns. The decline in the level ofinvestments was accentuated by exchange rate movements.Driven by exits and revaluations, the fair value of the port-folio decreased to CHF 2.9 billion on 31 December 2003 fromCHF 3.8 billion a year earlier. Unfunded commitments con-tinued to fall, totaling CHF 1.5 billion at end-2003, downfrom CHF 2.1 billion a year earlier.
50
From first quarter 2005, our private equity investments willbe reported within the Industrial Holdings segment. This matches our strategy of de-emphasizing and reducing
exposure to this asset class while capitalizing on orderly exit opportunities when they arise. Current managementwill continue to look after the portfolio.
Shift to industrial holdings
1,915 1,703
1,909
5,906
7,912
257
4,875
7,490
(77)
5,608
6,498
(1,602)
Income by business area
CHF million
2002 2003 2004
16,000
12,000
8,000
4,000
0
–4,000Fixed income, rates and currencies Private equity
Investment banking Equities
15,791
15,277
16,568
Headcount
full-time equivalents
31.12.02 31.12.03 31.12.04
17,000
16,000
15,000
14,000
13,000

Results
Pre-tax profit was CHF 3,855 million in full-year 2003, up190% from a year earlier. This result was achieved despite theweakening of the US dollar against the Swiss franc and reflectsstrong performances in all our businesses. In particular, theprivate equity business showed a marked improvement ofCHF 1.5 billion, reflecting lower levels of writedowns and anumber of successful exits. Writedowns in 2003 totaled CHF353 million, compared to CHF 1.7 billion in 2002. This wasaccentuated by a strong result in our fixed income, rates andcurrencies business, gaining 15% from 2002, reflecting thebreadth of our capabilities and our expanding franchise. Atthe same time, costs were tightly controlled. Both personnelexpenses and general and administrative expenses fell becauseof currency fluctuations. Excluding the impact of currencymovements, personnel expenses rose in 2003, reflecting im-proved revenues, while general and administrative expensesremained largely unchanged from 2002.
Operating incomeFull-year 2003 total operating income was CHF 13,936 mil-lion, up 13% from CHF 12,329 million in 2002. Investmentbanking revenues, at CHF 1,703 million in 2003, dropped11% from CHF 1,915 million a year earlier. Excluding the cur-rency impact, revenues actually rose, reflecting the expansionof our capabilities. Equities revenues in full-year 2003 alsoreflected negative currency impacts, falling to CHF 4,875 mil-lion from CHF 5,608 million in 2002. Excluding currencyfluctuations, equity results improved, reflecting strong per-formances in the equity finance, proprietary and primarybusinesses. In full-year 2003, the fixed income, rates and cur-rencies business posted an excellent result. Revenues, at CHF7,490 million in 2003, were up 15% from CHF 6,498 millionin 2002. Revenues increased in all businesses, but the gainswere particularly strong in fixed income, principal finance,mortgages and foreign exchange. The positive result wassomewhat offset by negative revenues of CHF 678 million re-lating to Credit Default Swaps (CDSs) hedging existing cred-
it exposure in the loan book. Private equity income for 2003was negative CHF 77 million, compared to negative CHF1,602 million in 2002. The significant improvement in per-formance was primarily driven by a sharp fall in investmentwritedowns.
Operating expensesTotal operating expenses dropped 8% to CHF 10,081 millionin 2003, mainly reflecting the weakening of the US dollaragainst the Swiss franc, although our continued tight man-agement of costs helped. Personnel expenses in 2003, at CHF7,303 million, fell 7% from 2002. Excluding currency fluctu-ations, personnel expenses rose, reflecting higher perform-ance-related compensation, which increased along with rev-enues, and higher severance expenses. Full-year general andadministrative expenses were CHF 2,074 million in 2003,down 12% from 2002’s CHF 2,359 million. Excluding the ef-fect of currencies, expenses rose slightly, reflecting provisionsfor vacant space, higher professional fees in all businesses andan increase in administration expenses. Services from otherbusiness units increased to CHF 180 million in 2003 fromCHF 140 million in 2002. Depreciation declined 23% to CHF246 million in 2003 from CHF 320 million in 2002. The de-crease is mainly due to lower depreciation on workstations,servers and other equipment. Amortization of goodwill andother intangibles, at CHF 278 million in 2003, fell 24% fromCHF 364 million a year earlier, reflecting the full amortizationof the goodwill of various businesses in 2003.
Headcount
Headcount, at 15,277 on 31 December 2003, fell 3% from ayear earlier. The drop reflects ongoing, regular reviews of ourcost structure and staffing needs, taking into account produc-tivity gains and the automation of services. That was partial-ly offset by the acquisition of ABN Amro’s prime brokeragebusiness and continued investment in specific areas, includ-ing our US investment banking and fixed income, rates andcurrencies businesses.
51

Financial BusinessesWealth Management USA
Business Group reporting
For the year ended % change from
CHF million, except where indicated 31.12.04 31.12.03 31.12.02 31.12.03
Private client revenues 4,906 4,959 1 5,471 (1 )
Municipal finance revenues 372 462 480 (19 )
Net goodwill funding (180) (231 ) (390 ) 22
Income 5,098 5,190 5,561 (2 )
Adjusted expected credit loss 2 (5) (8 ) (13 ) 38
Total operating income 5,093 5,182 5,548 (2 )
Personnel expenses 3 3,437 3,627 4,158 (5 )
General and administrative expenses 800 719 926 11
Services to / from other business units 302 433 492 (30 )
Depreciation 71 72 81 (1 )
Amortization of goodwill and other intangible assets 304 336 1,691 4 (10 )
Total operating expenses 4,914 5,187 7,348 (5 )
Business Group performance before tax 179 (5 ) (1,800 )
Business Group reporting excluding acquisition costs and significant financial events
For the year ended % change from
CHF million, except where indicated 31.12.04 31.12.03 31.12.02 31.12.03
Total operating income 5,093 5,021 5 5,548 1
Add back: Net goodwill funding 6 180 231 390 (22 )
Operating income excluding acquisition costs 5,273 5,252 5,938 0
Total operating expenses 4,914 5,187 6,114 7 (5 )
Retention payments (99) (263 ) (351 ) 62
Amortization of goodwill and other intangible assets (304) (336 ) (457 ) 10
Operating expenses excluding acquisition costs 4,511 4,588 5,306 (2 )
Business Group performance before tax and acquisition costs 762 664 632 15
1 Includes significant financial event: gain on disposal of Correspondent Services Corporation of CHF 161 million. 2 In management accounts, adjusted expected credit loss rather than credit lossexpense is reported for the Business Groups (see note 2 to the financial statements). 3 Includes retention payments in respect of the PaineWebber acquisition. There have been no further retentionpayments after second quarter 2004. 4 Includes significant financial event: writedown of PaineWebber brand name of CHF 1,234 million. 5 Excludes significant financial event: gain on disposal ofCorrespondent Services Corporation of CHF 161 million. 6 Goodwill and intangible asset-related funding, net of risk-free return on the corresponding equity allocated. 7 Excludes significant financialevent: writedown of PaineWebber brand name of CHF 1,234 million.
52
Wealth Management USA
In 2004, Wealth Management USA reported a pre-tax gain of CHF 179 million compared to a loss of CHF 5 million in 2003. In US dollar terms, operational performance excluding acquisition costs was the best sincePaineWebber became part of UBS, reflecting record recurring fees and increased net interest revenue.
Mark B. Sutton | Chairman and CEOWealth Management USA

53
Business Group reporting excluding acquisition costs and significant financial events (continued)
KPIs As at or for the year ended % change from
31.12.04 31.12.03 31.12.02 31.12.03
Invested assets (CHF billion) 639 634 584 1
Net new money (CHF billion) 1 17.1 21.1 18.5
Interest and dividend income (CHF billion) 2 16.0 15.8 17.9 1
Gross margin on invested assets (bps) 3 79 86 82 (8 )
Gross margin on invested assets excluding acquisition costs and SFEs (bps) 4 81 87 88 (7 )
Cost / income ratio (%) 5 96.4 99.9 132.1
Cost / income ratio excluding acquisition costs and SFEs (%) 6 85.5 87.2 89.2
Recurring fees 7 2,057 1,927 2,199 7
Financial advisor productivity (CHF thousand) 8 655 579 639 13
Additional information As at or for the year ended % change from
31.12.04 31.12.03 31.12.02 31.12.03
Client assets (CHF billion) 679 690 650 (2 )
Regulatory equity allocated (average) 5,100 5,700 7,450 (11 )
Fair value of employee stock options granted 9 101 62 73 63
Headcount (full-time equivalents) 17,388 17,435 19,029 0
Financial advisors (full-time equivalents) 7,519 7,766 8,857 (3 )
1 Excludes interest and dividend income. 2 For purposes of comparison with US peers. 3 Income /average invested assets. 4 Income, add back net goodwill funding and less significant financialevents / average invested assets. 5 Operating expenses / income. 6 Operating expenses less the amortization of goodwill and other intangible assets, retention payments and significant financialevents / income, add back net goodwill funding and less significant financial events. 7 Asset-based fees for portfolio management and fund distribution, account-based and advisory fees. 8 Privateclient revenues less significant financial events / average number of financial advisors. 9 For informational purposes only. These pre-tax amounts have not been recorded in the income statement.For details on the fair value calculation, refer to note 32e to the financial statements.
Components of operating income
Wealth Management USA principally derives its operating incomefrom:– fees for financial planning and wealth management services;– fees for discretionary management services;– transaction-related fees; and– interest income from client loans.
These fees are based on the market value of invested assets, the levelof transaction-related activity and the size of the loan book. As aresult, operating income is affected by such factors as fluctuations in invested assets, changes in market conditions, investment per-formance, inflows and outflows of client funds, and investor activitylevels.

Financial BusinessesWealth Management USA
Significant financial events
There were no significant financial events in 2004. There wasone in 2003 and one in 2002.– In second quarter 2003, a net gain of CHF 2 million (pre-
tax CHF 161 million) from the sale of Wealth ManagementUSA’s Correspondent Services Corporation (CSC) clearingbusiness. A substantial portion of CSC’s net assets com-prised goodwill stemming from the PaineWebber acquisi-tion. After deducting taxes of CHF 159 million (based onthe purchase price) and the writedown of the goodwillassociated with CSC, the net gain from the transactionwas CHF 2 million.
– In fourth quarter 2002, a non-cash writedown of CHF953 million (pre-tax CHF 1,234 million) relating to the value of the PaineWebber brand that was held as anintangible asset on our balance sheet.
2004
Key performance indicators
Wealth Management USA had CHF 639 billion in investedassets on 31 December 2004, up 1% from CHF 634 billionon 31 December 2003. The increase was due to inflows ofnet new money and the effects of market appreciation,partly offset by the weakening of the US dollar against theSwiss franc. In US dollar terms, invested assets were 10%higher on 31 December 2004 than they were on the samedate in 2003.
We continue to report strong inflows of net new moneycompared to peers. In 2004, inflows were CHF 17.1 billion,CHF 4 billion lower than the CHF 21.1 billion reported in 2003.Including interest and dividends, net new money in 2004 wasCHF 33.1 billion, lower than the CHF 36.9 billion reported in2003. The decline in net new money mainly occurred in a slowfirst half-year, when investor confidence lagged.
The gross margin on invested assets was 79 basis points in2004, down from 86 basis points in 2003. The gross margin
on invested assets before acquisition costs (net goodwill fund-ing costs) was 81 basis points, down from 87 basis points in2003. The increase in average invested asset levels (up 7%)outpaced the gain in revenues (up 1% excluding the sale ofCSC) as higher private client revenues were mostly offset bylower municipal finance revenues.
The cost / income ratio before acquisition costs was 85.5%for 2004, compared to 87.2% in 2003. The improvement inthe cost / income ratio reflects our continuous cost control aswell as the excellent performance of our core private clients’business.
54
584
634 639
Invested assets
CHF billion
31.12.02 31.12.03 31.12.04
700
600
500
400
300
+10% in US dollar
18.5
21.1
17.1
Net new money
CHF billion
2002 2003 2004
22
20
18
16
14
–12% in US dollar
88 87
81
79
86
82
Gross margin on invested assets
bps
2002 2003 2004
90
80
70
60
50As reported Adjusted for significant financial events and excluding acquisition costs
89.2 87.2 85.5
96.499.9
132.1
Cost / income ratio
in %
2002 2003 2004
135
120
105
90
75As reported Adjusted for significant financial events and excluding acquisition costs

In 2004, recurring fees were CHF 2,057 million, up 7%from CHF 1,927 million a year earlier. Excluding the impact ofcurrency fluctuations, recurring fees were up 15% in 2004from 2003, mainly due to higher levels of managed accountfees on a record level of invested assets in US dollar terms.Flows into managed account products were USD 12.4 billionin full-year 2004, comparing favorably to the USD 10.2 bil-lion flow for full-year 2003. Recurring fees combined with thenet interest income, principally from our lending business,now represent around half of our total revenues.
Productivity per advisor increased in 2004 to CHF 655,000from CHF 579,000 in 2003 as a lower number of financialadvisors were able to produce roughly the same revenues asa year earlier. The number of financial advisors decreased to7,519 in 2004 from 7,766 a year earlier due to attritionamong less productive financial advisors. In the second halfof 2003, we resumed our trainee program and we continuedto recruit financial advisors throughout 2004, with our focusprimarily on talented and highly productive advisors. As a re-sult, we expect renewed growth in our advisor force.
Results
In 2004, we reported a pre-tax gain of CHF 179 million com-pared to a loss of CHF 5 million in 2003. The 2003 resultsinclude a pre-tax gain of CHF 161 million from the sale of
Correspondent Services Corporation (CSC) in second quarter.After the exclusion of the CSC gain and before acquisitioncosts, operational performance showed profits of CHF 762 mil-lion in 2004 and CHF 664 million in 2003. As our business isalmost entirely conducted in US dollars, comparisons of 2004and 2003 results are affected by the depreciation of the US dol-lar versus the Swiss franc. In US dollar terms, operational per-formance (excluding acquisition costs and SFEs) in 2004 was24% higher than in 2003. This represents the best result sincePaineWebber became part of UBS, reflecting record recurringfees and increased net interest revenue benefiting from the firstfull-year impact of UBS Bank USA. In municipal finance, rev-enues fell due to lower transaction and underwriting volumesand reduced derivative activity. Still, a Bloomberg article report-
ed that we became the top-ranked firm in lead-managed ne-gotiated underwriting volume in 2004 by increasing our mar-ket share to 14.2%, up from last year’s 12.5%.
Operating incomeIn 2004, total operating income was CHF 5,093 million, down2% compared to CHF 5,182 million in 2003. Before acquisi-tion costs and excluding the sale of our CSC business, totaloperating income was largely the same as a year earlier. Onthe same basis and excluding the currency effect, operatingincome increased by 8% from 2003. The increase in operat-ing income is primarily due to higher recurring fees, risingnet interest income due to UBS Bank USA, and higher trans-actional revenue in the private client business. The increase ispartially offset by lower municipal finance revenue due to adrop in secondary trading performance, decreased underwrit-ing volume and lower derivatives activity.
Operating expensesTotal operating expenses decreased 5% to CHF 4,914 millionin 2004 from CHF 5,187 million in 2003. Excluding acquisi-tion costs, the drop was 2%, mainly due to the weakening ofthe US dollar against the Swiss franc. Excluding currencyeffects and acquisition costs, operating expenses were 6%higher, primarily due to an increase in general and adminis-
55
2,199
1,927
2,057
Recurring fees
CHF million
2002 2003 2004
2,250
2,000
1,750
1,500
1,250
+15% in US dollar
8,857
7,766
7,519
Financial advisors
full-time equivalents
31.12.02 31.12.03 31.12.04
9,000
8,500
8,000
7,500
7,000
-2400
-1600
-800
0
800
632 762664
179
(5)
(1,800)
Performance before tax
CHF million
2002 2003 2004
800
0
–800
–1,600
–2,400As reported Adjusted for significant financial events and excluding acquisition costs
+24% in US dollar

Financial BusinessesWealth Management USA
trative expenses as well as higher personnel expenses. Person-nel expenses dropped to CHF 3,437 million in 2004, down 5%from CHF 3,627 million a year earlier. Excluding the effects ofcurrency translation, personnel expenses were slightly higherthan in 2003, reflecting higher bonus and broker compensa-tion, which gained in line with performance, partially offsetby lower retention payments, which ended in June. Non-per-sonnel related expenses dropped 5% to CHF 1,477 million in2004 from CHF 1,560 million in 2003. In US dollar terms, theyactually rose 2%, reflecting higher legal fees and settlementcharges and increased consulting fees related to key initiativesin the private client business. This was partially offset by low-er depreciation due to a drop in infrastructure charges (downCHF 1 million) as well as a decline in goodwill amortizationdue to the sale of CSC (down CHF 32 million).
Headcount
Our headcount decreased by 47 during 2004 to 17,388 asfinancial advisor headcount fell 3% to 7,519, principally re-flecting attrition among lower producing financial advisors.Non-financial advisor headcount increased 200 or 2% in2004 from a year earlier due to additional personnel to sup-port key initiatives within the private clients area.
2003
Key performance indicators
Wealth Management USA had CHF 634 billion in investedassets on 31 December 2003, up 9% from CHF 584 billionon 31 December 2002. The increase was due to inflows of netnew money and the effects of market appreciation. In US dol-lar terms, invested assets were 21% higher on 31 December2003 than they were at the same time in 2002.
We continue to report consistently strong inflows of netnew money. In 2003, inflows were CHF 21.1 billion, 14%above the CHF 18.5 billion result reported for 2002. Includ-ing interest and dividends, net new money in 2003 was CHF36.9 billion, up from CHF 36.4 billion in 2002.
The gross margin on invested assets was 86 basis points for2003, up from 82 basis points in 2002. The gross margin oninvested assets before acquisition costs (net goodwill fundingcosts) was 87 basis points, down from 88 basis points in 2002.
The cost / income ratio before acquisition costs and signif-icant financial events was 87.2% for 2003, compared to89.2% in 2002. The improvement in the cost / income ratioreflects our continuous cost control as well as the excellentperformance of our core private client business.
In 2003, recurring fees were CHF 1,927 million, down fromCHF 2,199 million a year earlier, reflecting the weakening ofthe US dollar against the Swiss franc. Excluding the impact ofcurrency fluctuations, recurring fees were up 1% in 2003 from2002, mainly as a result of increased fees from mutual fundproducts as well as rising asset-based fees that reflected higher asset levels in managed account products. In addition,the gain was accentuated by higher recurring fees in themunicipal securities business.
The number of financial advisors decreased to 7,766 in2003 from 8,857 a year earlier due to the curtailment of ourtraining program and an increase in attrition rates among lessexperienced and less productive financial advisors.
Results
As our business is almost entirely conducted in US dollars,comparisons of 2003 and 2002 results are affected by thedepreciation of the US dollar versus the Swiss franc.
In 2003, Wealth Management USA reported a pre-tax lossof CHF 5 million compared to a loss of CHF 1,800 million ayear earlier. This change includes the writedown of the valueof the PaineWebber brand in 2002 and the CSC disposal in2003. After their exclusion and before acquisition costs, per-formance improved 5%. On this basis and in US dollar terms,performance in 2003 was 21% above that in 2002, reflect-ing higher recurring fee gains and improved transactional rev-enues. Client activity increased, with daily average trades ris-ing 3% above their 2002 level. In addition, conditions in themunicipal securities market remained extremely buoyant, withnew issues hitting an all-time high this year. At the same time,we continued to benefit from cost-saving initiatives startedwhen we became a part of UBS.
Operating incomeIn 2003, total operating income was CHF 5,182 million com-pared to CHF 5,548 million in 2002. Before acquisition costsand excluding the sale of our CSC business, total operatingincome was 12% lower compared to a year earlier. Excludingthe currency effect and acquisition costs, operating incomeactually increased by 2% from 2002. This increase was dueto higher recurring fees as well as higher transactional rev-enue, reflecting the improved market conditions. Further,revenues were accentuated by much stronger revenues fromour municipal securities business.
56
19,029
17,435 17,388
Headcount
full-time equivalents
31.12.02 31.12.03 31.12.04
20,000
19,000
18,000
17,000
16,000

Operating expensesTotal operating expenses decreased 29% to CHF 5,187 mil-lion in 2003 from CHF 7,348 million in 2002. Excluding ac-quisition costs and the writedown of the PaineWebber brandin 2002, the drop was 14%, mainly due to the weakening ofthe US dollar against the Swiss franc. Excluding currencyeffects, operating expenses were 1% lower, reflecting lowergeneral and administrative expenses, which were nearly off-set by higher performance-related compensation. Personnelexpenses dropped 13% from CHF 4,158 million in 2002 toCHF 3,627 million in 2003. Excluding the effects of currencytranslation, personnel expenses were actually slightly higherthan in 2002, reflecting higher performance-related com-pensation due to an increase in revenue partially offset by low-er retention payments. General and administrative expensesfell 22% from CHF 926 million in 2002 to CHF 719 million in2003. Excluding the impact of currency fluctuations, generaland administrative expenses dropped 11% compared to 2002due to the strict cost management discipline that we have ex-erted in the past three years. Operational provisions also fell
as 2002 included the equity research settlement charge ofCHF 21 million. The drop was further accentuated by the saleof the CSC business. Services rendered from other businessunits decreased by 12% to CHF 433 million in 2003 fromCHF 492 million in 2002. Depreciation decreased CHF 9 millionto CHF 72 million in 2003 from CHF 81 million in 2002. Good-will and other intangible amortization decreased from CHF1,691 million in 2002 to CHF 336 million in 2003. This de-crease was due to the writedown of the PaineWebber brandname in 2002, and the sale of CSC. Excluding the writedownand the sale of CSC, amortization charges dropped by 26%as a result of the weakening US dollar against the Swiss franc.
Headcount
Wealth Management USA’s headcount decreased 8% during2003 to 17,435, reflecting continued cost management ini-tiatives, the curtailment of the trainee program, and the saleof CSC. Non-financial advisor headcount was down by 503or 5% compared to the end of 2002.
57

Financial BusinessesCorporate Center
Business Group reporting
For the year ended % change from
CHF million, except where indicated 31.12.04 31.12.03 31.12.02 31.12.03
Income 1,258 900 2,403 1 40
Credit loss (expense) / recovery 2 321 122 300 163
Total operating income 1,579 1,022 2,703 55
Personnel expenses 1,222 1,145 1,450 7
General and administrative expenses 1,237 1,334 1,564 (7 )
Services to / from other business units (1,509) (1,639 ) (1,633 ) 8
Depreciation 814 840 893 (3 )
Amortization of goodwill and other intangible assets 91 101 122 (10 )
Total operating expenses 1,855 1,781 2,396 4
Business Group performance before tax (276) (759 ) 307 64
Business Group performance before tax and amortization of goodwill and other intangible assets (185) (658 ) 429 72
Business Group reporting adjusted for significant financial events
For the year ended % change from
CHF million, except where indicated 31.12.04 31.12.03 31.12.02 31.12.03
Income 1,258 900 2,176 3 40
Credit loss (expense) / recovery 2 321 122 300 163
Total operating income 1,579 1,022 2,476 55
Total operating expenses 1,855 1,781 2,396 4
Business Group performance before tax (276) (759 ) 80 64
Business Group performance before tax and amortization of goodwill and other intangible assets (185) (658 ) 202 72
Additional information For the year ended % change from
31.12.04 31.12.03 31.12.02 31.12.03
Fair value of employee stock options granted 4 14 18 37 (22 )
1 Includes significant financial events: gain on disposal of Hyposwiss of CHF 155 million and gain on disposal of Klinik Hirslanden of CHF 72 million. 2 In order to show the relevant Business Groupperformance over time, adjusted expected credit loss rather than credit loss expense is reported for all Business Groups. The difference between the adjusted expected credit loss and credit loss recordedat Group level is reported in the Corporate Functions (see note 2 to the financial statements). 3 Excludes significant financial events: gain on disposal of Hyposwiss of CHF 155 million and gain ondisposal of Klinik Hirslanden of CHF 72 million. 4 For informational purposes only. These pre-tax amounts have not been recorded in the income statement. For details on the fair value calculation, referto note 32e to the financial statements.
58
Corporate Center
Corporate Center reported a pre-tax loss of CHF 276 million in 2004, compared to a loss of CHF 759 million in 2003.
Clive Standish | UBS Chief Financial OfficerHead, Corporate Center
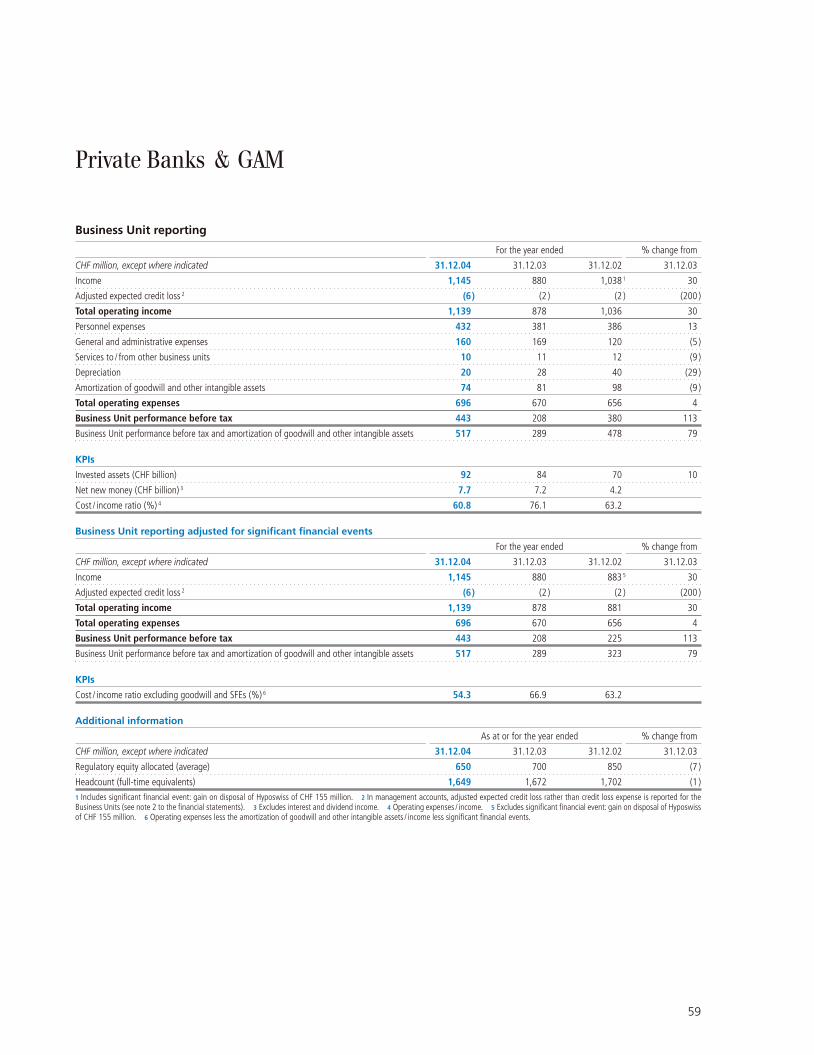
Business Unit reporting
For the year ended % change from
CHF million, except where indicated 31.12.04 31.12.03 31.12.02 31.12.03
Income 1,145 880 1,038 1 30
Adjusted expected credit loss 2 (6) (2 ) (2 ) (200 )
Total operating income 1,139 878 1,036 30
Personnel expenses 432 381 386 13
General and administrative expenses 160 169 120 (5 )
Services to / from other business units 10 11 12 (9 )
Depreciation 20 28 40 (29 )
Amortization of goodwill and other intangible assets 74 81 98 (9 )
Total operating expenses 696 670 656 4
Business Unit performance before tax 443 208 380 113
Business Unit performance before tax and amortization of goodwill and other intangible assets 517 289 478 79
KPIs
Invested assets (CHF billion) 92 84 70 10
Net new money (CHF billion) 3 7.7 7.2 4.2
Cost / income ratio (%) 4 60.8 76.1 63.2
Business Unit reporting adjusted for significant financial events
For the year ended % change from
CHF million, except where indicated 31.12.04 31.12.03 31.12.02 31.12.03
Income 1,145 880 883 5 30
Adjusted expected credit loss 2 (6) (2 ) (2 ) (200 )
Total operating income 1,139 878 881 30
Total operating expenses 696 670 656 4
Business Unit performance before tax 443 208 225 113
Business Unit performance before tax and amortization of goodwill and other intangible assets 517 289 323 79
KPIs
Cost / income ratio excluding goodwill and SFEs (%) 6 54.3 66.9 63.2
Additional information
As at or for the year ended % change from
CHF million, except where indicated 31.12.04 31.12.03 31.12.02 31.12.03
Regulatory equity allocated (average) 650 700 850 (7 )
Headcount (full-time equivalents) 1,649 1,672 1,702 (1 )
1 Includes significant financial event: gain on disposal of Hyposwiss of CHF 155 million. 2 In management accounts, adjusted expected credit loss rather than credit loss expense is reported for theBusiness Units (see note 2 to the financial statements). 3 Excludes interest and dividend income. 4 Operating expenses / income. 5 Excludes significant financial event: gain on disposal of Hyposwissof CHF 155 million. 6 Operating expenses less the amortization of goodwill and other intangible assets / income less significant financial events.
59
Private Banks & GAM

Financial BusinessesCorporate Center
Significant financial events
– In first quarter 2002, we realized a pre-tax gain of CHF 155 million from the sale of the private bank Hyposwiss.There were no significant financial events in Private
Banks & GAM in 2004 or 2003.
2004
Key performance indicators
In 2004, Private Banks & GAM reported a record net newmoney inflow of CHF 7.7 billion, up from the previous recordof CHF 7.2 billion in 2003. Performance was driven by GAM’scontinued business strength.
Invested assets on 31 December 2004 were CHF 92 billion,up by 10% from CHF 84 billion on 31 December 2003, re-flecting the overall market recovery.
Results
Pre-tax profit was a record CHF 443 million in 2004, up 113%from CHF 208 million a year earlier, reflecting improved mar-ket conditions, which produced a 10% growth in the assetbase, and resulted in higher asset-based revenues. Resultswere helped by a 9% decline in non-personnel costs, whichcontinued to be tightly controlled.
Total operating income, at CHF 1,139 million in 2004, in-creased CHF 261 million or 30% from 2003. The result wasdue to record revenues from GAM, alongside growth in theprivate banks’ transactional revenues.
Operating expenses were CHF 696 million in 2004, up 4%from CHF 670 million in 2003. The increase was driven byhigher personnel expenses, up CHF 51 million to CHF 432 mil-lion in 2004 from CHF 381 million in 2003, reflecting higherperformance-related compensation. This was partially offsetby a drop in non-personnel related expenses, down 9%. Gen-eral and administrative expenses dropped 5% to CHF 160 mil-lion in 2004 from CHF 169 million in 2003, reflecting lowerrestructuring costs than in 2003, which saw the merger of thethree private banks Cantrade, Bank Ehinger and Armand vonErnst. Depreciation dropped by 29%, mainly reflecting IT-related declines. Amortization of goodwill fell 9% because ofthe weakening of the US dollar against the Swiss franc.
Headcount
Headcount was 1,649 on 31 December 2004, down 1% from1,672 on 31 December 2003.
2003
Key performance indicators
Invested assets in Private Banks & GAM totaled CHF 84 bil-lion on 31 December 2003, up from CHF 70 billion on 31 De-cember 2002, reflecting strong net new money inflows, andpositive financial markets as well as the acquisition of BanqueNotz Stucki S.A. by Ferrier Lullin & Cie S.A., which was com-pleted in December 2003.
Net new money was CHF 7.2 billion in 2003, up from CHF4.2 billion in 2002, driven by excellent inflows into GAM.
Results
Pre-tax profit, at CHF 208 million in 2003, dropped by 45%from CHF 380 million a year earlier.
Total operating income dropped to CHF 878 million in 2003from CHF 1,036 million in 2002. This was mainly due to thedivestment gain of CHF 155 million due to the sale of Hypo-swiss in 2002. Excluding the sale, total operating incomeremained virtually unchanged.
Total operating expenses increased to CHF 670 million in2003, up 2% from CHF 656 million in 2002. The increasemainly reflected higher legal provisions, as well as restructur-ing costs related to the merger of Cantrade, Bank Ehinger andArmand von Ernst to form Ehinger & Armand von Ernst.
Headcount
Headcount decreased by 30 to 1,672 on 31 December 2003from 1,702 a year earlier, mainly due to the rationalizationwithin the individual private banks. This was partially offsetby the acquisition of Banque Notz Stucki S.A. as well as anincrease in headcount at GAM due to the growth of thebusiness.
60
1,702
1,672
1,649
Headcount
full-time equivalents
31.12.02 31.12.03 31.12.04
1,750
1,700
1,650
1,600
1,550

61
Corporate Functions
Business Unit reporting
For the year ended % change from
CHF million, except where indicated 31.12.04 31.12.03 31.12.02 31.12.03
Income 113 20 1,365 1 465
Credit loss (expense) / recovery 2 327 124 302 164
Total operating income 440 144 1,667 206
Personnel expenses 790 764 1,064 3
General and administrative expenses 1,077 1,165 1,444 (8 )
Services to / from other business units (1,519) (1,650 ) (1,645 ) 8
Depreciation 794 812 853 (2 )
Amortization of goodwill and other intangible assets 17 20 24 (15 )
Total operating expenses 1,159 1,111 1,740 4
Business Unit performance before tax (719) (967 ) (73 ) 26
Business Unit performance before tax and amortization of goodwill and other intangible assets (702) (947 ) (49 ) 26
Business Unit reporting adjusted for significant financial events
For the year ended % change from
CHF million, except where indicated 31.12.04 31.12.03 31.12.02 31.12.03
Income 113 20 1,293 3 465
Credit loss (expense) / recovery 327 124 302 164
Total operating income 440 144 1,595 206
Total operating expenses 1,159 1,111 1,740 4
Business Unit performance before tax (719) (967 ) (145 ) 26
Business Unit performance before tax and amortization of goodwill and other intangible assets (702) (947 ) (121 ) 26
Additional information
As at or for the year ended % change from
CHF million, except where indicated 31.12.04 31.12.03 31.12.02 31.12.03
Regulatory equity allocated (average) 6,950 8,450 9,400 (18 )
Headcount (full-time equivalents) 3,553 3,561 3,505 0
1 Includes significant financial event: gain on disposal of Klinik Hirslanden of CHF 72 million. 2 In order to show the relevant Business Group performance over time, adjusted expected credit loss ratherthan credit loss expense is reported for all Business Groups. The difference between the adjusted expected credit loss and credit loss recorded at Group level is reported in the Corporate Functions (seenote 2 to the financial statements). 3 Excludes significant financial event: gain on disposal of Klinik Hirslanden of CHF 72 million.

Financial BusinessesCorporate Center
Significant financial events
– In fourth quarter 2002, we realized a net gain of CHF 60 million (pre-tax CHF 72 million) from the sale of KlinikHirslanden, a private hospital group.There were no significant financial events in Corporate
Functions in 2004 or 2003.
2004
Results
Corporate Functions recorded a pre-tax loss of CHF 719 mil-lion in full-year 2004, compared to a loss of CHF 967 milliona year earlier. The improvement was driven by a CHF 93 mil-lion rise in income and significantly higher credit loss recov-eries (up CHF 203 million). Operating expenses increased CHF48 million, reflecting higher personnel expenses. There werelower charges to other business units, reflecting cost savingsat the Information Technology Infrastructure unit (ITI) andlower insurance premiums.
Operating incomeTotal operating income increased to CHF 440 million in 2004from CHF 144 million in 2003. The result was driven by higher credit recoveries as well as higher revenues. Incomeincreased by CHF 93 million to CHF 113 million in 2004mainly due to lower writedowns of financial investments (in2003 we recorded a writedown in our stake in Swiss Inter-national Airlines Ltd.). This was partially offset by lower in-terest income from invested equity as we continue to repur-chase shares.
Credit loss recoveries were up in 2004 from 2003. Thecredit loss expense or recovery booked in Corporate Functionsrepresents the difference between the adjusted expectedcredit losses charged to the business units and the credit lossrecognized in the UBS financial statements. In 2004, UBSrecorded a credit loss recovery of CHF 276 million, comparedto a credit loss expense of CHF 72 million in 2003. In bothyears, credit loss expense was lower than the adjusted expect-ed credit loss charged to the business units, resulting in cred-it loss recoveries in Corporate Functions of CHF 327 millionin 2004 and CHF 124 million in 2003.
Operating expensesTotal operating expenses were CHF 1,159 million in 2004,up CHF 48 million from CHF 1,111 million in 2003. At CHF790 million in 2004, personnel expenses were up 3% fromCHF 764 million in 2003, reflecting higher performance-relat-ed compensation. In the same period, general and administra-tive expenses dropped 8% to CHF 1,077 million from CHF1,165 million. This was mainly due to falling IT costs related toinfrastructure cost savings as well as lower legal provisions.
Other business units were charged CHF 1,519 million for serv-ices provided by Corporate Functions in 2004, compared toCHF 1,650 million in 2003. This drop was due to reducedcharges reflecting cost savings at our ITI unit as well as lowerproject-related charges. Depreciation dropped to CHF 794million in 2004 from CHF 812 million in 2003, reflecting low-er IT-related charges, partially offset by higher costs for realestate. Amortization of goodwill and other intangible assetswas CHF 17 million in 2004, down by CHF 3 million from 2003due to the weakening of the US dollar against the Swiss franc.
Headcount
Corporate Functions headcount outside the ITI unit was 1,199 on 31 December 2004, down by 7 from 1,206 on 31 De-cember 2003. Over the same period, ITI headcount dropped1 to 2,354.
2003
Results
Corporate Functions recorded a pre-tax loss of CHF 967 mil-lion in full-year 2003, against a CHF 73 million loss a year earlier.
Operating incomeTotal operating income dropped by 91% from CHF 1,667 mil-lion in 2002 to CHF 144 million in 2003. Excluding the divest-ment gains of CHF 72 million from Hirslanden in 2002, thedrop was 91%. This was mainly due to a fall-off in income ofKlinik Hirslanden, and lower gains from financial investments.It also reflected lower interest income from our treasuryactivities following a decrease in revenues from our investedequity as we continued to buy back shares and experiencedlow interest rates. The impact of falling interest rates was par-tially offset by the diversification of our invested equity intocurrencies other than Swiss francs which led to higher returnsand increased currency hedging revenues. Results also reflect-ed the CHF 178 million fall in credit loss recoveries.
62
3,505
3,561 3,553
Headcount
full-time equivalents
31.12.02 31.12.03 31.12.04
3,600
3,450
3,300
3,150
3,000

The credit loss expense or recovery booked in CorporateFunctions represents the difference between the adjustedexpected credit losses charged to the business units and thecredit loss recognized in the UBS financial statements. Werecorded a credit loss expense of CHF 72 million in 2003, com-pared to a credit loss expense of CHF 115 million in 2002. Inboth periods, credit loss expense was lower than the adjust-ed expected credit loss charged to the business units, leadingto a credit loss recovery of CHF 124 million in 2003 and CHF302 million in 2002 in Corporate Functions.
Operating expensesTotal operating expenses fell to CHF 1,111 million in 2003,down from CHF 1,740 million in 2002. Personnel expenses de-clined 28% from CHF 1,064 million in 2002 to CHF 764 mil-lion in 2003. The drop was due to the deconsolidation of KlinikHirslanden, but was partially offset by higher expenses forperformance-related compensation. In the same period, gen-eral and administrative expenses fell to CHF 1,165 million fromCHF 1,444 million. This was mainly due to lower legal pro-visions, the disposal of Klinik Hirslanden, and lower project-
related expenses, partially offset by higher branding costs.Services rendered to other business units remained virtuallyflat at CHF 1,650 million in 2003, up CHF 5 million from2002. Depreciation dropped from CHF 853 million in 2002to CHF 812 million in 2003. The decrease is mainly due tothe absence of depreciation expenses from Klinik Hirslanden.At CHF 20 million in 2003, amortization of goodwill and other intangibles dropped by 17% from CHF 24 million in2002, reflecting the drop of the US dollar against theSwiss franc.
Headcount
Corporate Functions headcount was 3,561 on 31 December2003, an increase of 56 from the 3,505 on 31 December2002. The increase was mainly due to the first-time consoli-dation of Hotel Widder as well as an increase in our humanresources and risk functions. This was nearly offset by a de-cline in the number of trainees, a transfer of some employeesto the Business Groups, and lower headcount in the ChiefCommunication Officer area.
63

64

Industrial Holdings

Industrial Holdings
Major participations
The Industrial Holdings segment is a new segment, currentlymade up of UBS’s majority stake in Motor-Columbus, a finan-cial holding company whose only significant asset is a 59.3%interest in the Atel Group (Aare-Tessin Ltd. for Electricity). Atel,based in Olten, Switzerland, is a European energy providerfocused on electricity trading and marketing, domestic andinternational power generation, electricity transmission andenergy services. Motor-Columbus also holds several otherfinance and property companies.
Transfer of private equity stakes
In first quarter 2005, our private equity investments, cur-rently part of the Investment Bank, will be reported within theIndustrial Holdings segment. This matches our strategy of de-emphasizing and reducing exposure to this asset class whilecapitalizing on orderly exit opportunities when they arise.Current management will continue to look after the portfolio.
Results
UBS’s consolidation of Motor-Columbus into its accounts atthe beginning of third quarter 2004 resulted in a revaluationof the latter’s assets and liabilities. These are no longer com-parable with those previously published in Motor-Columbus’sseparate consolidated financial statements. The comparativeanalysis provided here is based on unaudited proforma 2003results.
For the six months ending 31 December 2004, our shareof Motor-Columbus’s net profit was CHF 45 million.
Total operating income for the six months ending 31 De-cember 2004 was CHF 3,667 million, significantly higher thanin the same period a year earlier. The gain was due to the first-time availability of production capacity in Southern Europe.Over the same period, total operating expenses, at CHF 3,460million, rose at a slower pace than operating income becausecosts for energy purchased from third parties fell in the periodas internal power production could be run at near full capac-ity. Expense levels also benefited from lower project costs.
66
Industrial Holdings
Income statement1
For the year ended
CHF million, except where indicated 31.12.042
Income 3 3,667
Total operating income 3,667
Personnel expenses 326
General and administrative expenses 126
Depreciation 70
Amortization of goodwill and other intangible assets 77
Goods and materials purchased 2,861
Total operating expenses 3,460
Operating profit before tax and minority interests 207
Tax expense 49
Net profit before minority interests 158
Minority interests 4 (113)
Net profit 45
Additional information As at
31.12.04
Headcount (full-time equivalents) 8,0201 Industrial Holdings consists of Motor-Columbus, a Swiss holding company, whose only significant asset is a 59.3% interest in Atel, a Swiss-based European energy provider. 2 Results shown for thesix month period beginning on 1 July 2004. 3 Includes equity in income of associates of CHF 19 million. 4 Reflects minority interests in Motor-Columbus plus minority interests in Atel.

Balance Sheet and Cash Flows

Balance Sheet and Cash FlowsBalance sheet and off-balance sheet
UBS’s total assets stood at CHF 1,734.8 billion on 31 Decem-ber 2004, up from CHF 1,550.1 billion on 31 December 2003.The increase in total assets was the net result of growth in thetrading portfolio (up CHF 67.6 billion), collateral trading as-sets (up CHF 43.0 billion), derivatives (up CHF 36.4 billion) andthe loan book (up CHF 19.7 billion). Total liabilities rose dueto higher borrowings (up CHF 80.8 billion), derivatives (up CHF48.9 billion), trading portfolio liabilities (up CHF 27.1 billion)and collateral trading liabilities (up CHF 15.0 billion).
Motor-ColumbusThe first-time full consolidation of Motor-Columbus in thirdquarter 2004 had a small net impact on our end of year bal-ance sheet, adding assets of CHF 7.3 billion (0.4% of UBS’stotal assets) and total liabilities of CHF 6.0 billion. The con-solidation also added financial instruments measured at fairvalue of CHF 0.7 billion.
Lending and borrowing
LendingCash increased by CHF 2.5 billion to CHF 6.0 billion on 31 De-cember 2004 from a year earlier as we preferred to keep com-fortable balances with different central banks towards the endof the year.
At CHF 35.3 billion on 31 December 2004 the due frombanks line increased by CHF 3.5 billion, driven by the first timeconsolidation of Motor-Columbus as well as increased bal-ances in the private label banks. Our loans to customers in-creased to CHF 232.4 billion on 31 December 2004, up by CHF19.7 billion from the level on 31 December 2003 as a resultof higher secured lending, mainly in our Wealth Managementbusinesses, both domestic and international. This was furtheraccentuated by an increase in secured lending in our Invest-ment Bank’s mortgage-backed securities and prime brokeragebusinesses.
BorrowingThe due to banks line declined by CHF 8.1 billion due to alower proportion of funding secured through the EuropeanCentral Bank repo market. Total debt issued increased to CHF183.6 billion on 31 December 2004, up by CHF 59.5 billion,reflecting additional outstanding positions in money marketpaper (CHF 21.3 billion, primarily US commercial paper). Thelong-term debt line (including financial instruments designat-ed at fair value) rose by CHF 38.1 billion to CHF 104.1 billion.We issued new long-term debt of CHF 51.2 billion as a con-sequence of attractive market conditions for new issuance ofbonds and structured funding products. This increase was par-
tially offset by early redemptions, repurchases and cancelledbonds totaling CHF 24.7 billion. We believe the maturityprofile of our long-term debt portfolio balances well andmatches the maturity profile of our assets. For further details,please refer to note 18 to the financial statements. The dueto customers line was up CHF 29.4 billion, in connection withboth prime brokerage and wealth management businessgrowth, especially in the US (additional FDIC-insured depositsof CHF 7.7 billion), Europe and Asia.
Repo and securities borrowing / lendingDuring 2004, cash collateral on securities borrowed and re-verse repurchase agreements combined increased by CHF43.0 billion or 8% to CHF 577.4 billion, while the sum of se-curities lent and repos grew by CHF 15.0 billion or 3% to CHF484.1 billion. The matched book (a repo portfolio comprisedof assets and liabilities with equal maturities and equal value,so that substantially all the risks cancel each other out) grew,reflecting a favorable spread environment. Securities borrow-ing and lending increased due to the growth of our primebrokerage business.
Trading portfolioTrading assets increased by CHF 67.6 billion to CHF 529.4 bil-lion on 31 December 2004 from CHF 461.8 billion on 31 De-cember 2003. Over the same period, short trading positionsincreased by CHF 27.1 billion to CHF 171.0 billion. A net in-crease was recorded in structured equity instruments, due tohigher client demand for these products. This was accompa-nied by a net increase in fixed income instruments, mainly incredit derivatives and investment grade bonds.
Replacement valuesIn 2004 positive replacement values (mainly derivative instru-ments) increased by CHF 36.4 billion to CHF 284.6 billion,while negative replacement values increased by CHF 48.9 bil-lion up to CHF 303.7 billion over the same period. Three mainfactors contributed to this development: a decline in long-terminterest rates in all major markets, the appreciation of theSwiss franc against major currencies, and higher trading vol-umes.
Other assets / liabilities and minority interestsInvestment in associates increased by 50% to CHF 2.4 billionon 31 December 2004, while property and equipment was upby 14% to CHF 8.7 billion, both mainly due to the consoli-dation of Motor-Columbus. Goodwill and other intangibleassets at CHF 12.1 billion on 31 December 2004 were upby 5% from the same date a year ago, reflecting the acquisi-
68
Balance sheet and off-balance sheet

tion of several wealth management businesses, the acqui-sition of the capital market business of Charles Schwab aswell as the consolidation of Motor-Columbus. This was onlypartially offset by amortization charges of CHF 964 millionduring 2004.
Minority interests increased by 31% to CHF 5.3 billion on31 December 2004 from CHF 4.1 billion at the same date ayear ago, reflecting the full consolidation of Motor-Columbus.This was partially offset by a currency-driven drop in the val-ue of issued trust preferred securities as well as the full acqui-sition of the previous joint venture UBS Brunswick Moscow.
Shareholders’ equityAt CHF 35.0 billion on 31 December 2004, shareholders’equity declined by CHF 0.3 billion from a year earlier. Thedecline was due to dividend payments, share repurchases,and the weakening of the US dollar against the Swiss franc,mostly offset by strong retained earnings.
Contractual obligations
The table below summarizes our contractual obligations as of31 December 2004. All contracts, with the exception of pur-chase obligations (those where we are committed to purchasedetermined volumes of goods and services), are either recog-nized as liabilities on our balance sheet or, in the case of op-erating leases, are disclosed in note 26 to the financial state-ments.
The following liabilities recognized on the balance sheet areexcluded from the table because we do not consider these ob-ligations as contractual: provisions, current and deferred taxliabilities, liabilities to employees for equity participation plans,settlement and clearing accounts and amounts due to banksand customers.
Within purchase obligations, we have excluded our obli-gation to employees under the mandatory notice period, dur-ing which we are required to pay employees contractuallyagreed salaries.
Off-balance sheet arrangements
In the normal course of business, UBS enters into arrange-ments that, under IFRS, are not recognized on the balance
sheet and do not affect the income statement. These types ofarrangements are kept off-balance sheet as long as UBS doesnot incur an obligation from them or become entitled to anasset itself. As soon as an obligation is incurred, it is recog-nized on the balance sheet, with the resulting loss recordedin the income statement. It should be noted, however, thatthe amount recognized on the balance sheet does not, inmany instances, represent the full loss potential inherent insuch arrangements.
For the most part, the arrangements discussed beloweither meet the financial needs of customers or offer invest-ment opportunities through entities that are not controlledby UBS. The importance of such arrangements to us, withrespect to liquidity, capital resources or market and credit risksupport, is minimal. We do not rely on such arrangements asa major source of revenue nor have we incurred throughthem significant expenses in the past and we do not expectto do so in the future. The following paragraphs discuss threedistinct areas of off-balance sheet arrangements as of 31 De-cember 2004 and any potential obligations that may arisefrom them.
GuaranteesIn the normal course of business, we issue various forms ofguarantees to support our customers. These guarantees, withthe exception of related premiums, are kept off-balance sheetunless a provision is needed to cover probable losses. The con-tingent liabilities arising from these guarantees are disclosedin note 25 to the financial statements. In 2004, our contin-gent liabilities from guarantees are slightly below the levelcompared to a year earlier. Fee income earned from issuingguarantees is not material to our total revenues. Losses in-curred under guarantees were insignificant for each of the lastthree years.
Retained interestsUBS sponsors the creation of Special Purpose Entities (SPEs)that facilitate the securitization of acquired residential andcommercial mortgage loans and related securities. We alsosecuritize customers’ debt obligations in transactions thatinvolve SPEs which issue collateralized debt obligations. Atypical securitization transaction of this kind would involvethe transfer of assets into a trust or corporation in return for
69
Contractual obligations
Payment due by period
CHF million Less than 1 year 1–3 years 3–5 years More than 5 years
Long-term debt 17,847 26,978 23,805 31,402
Capital lease obligations 104 163 44 0
Operating leases 886 1,524 1,231 4,060
Purchase obligations 10,580 5,545 2,075 9,398
Other long term liabilities 173 2 959 0
Total 29,590 34,212 28,114 44,860

Balance Sheet and Cash FlowsBalance sheet and off-balance sheet
beneficial interests in the form of securities. Generally, thebeneficial interests are sold to third parties shortly after the securitization. We do not provide guarantees or otherforms of credit support to these SPEs. Assets are no longerreported in our consolidated financial statements as soon astheir risk or reward is transferred to a third party. For furtherdiscussion of our securitization activities, see note 34 to the financial statements.
Derivative instruments recorded in shareholders’ equityWe have no derivative contracts linked to our own shares thatare accounted for as equity instruments. With the exceptionof physically settled written put options (see note 1 to thefinancial statements), derivative contracts linked to our sharesare accounted for as derivative instruments and are carried atfair value on the balance sheet under positive replacementvalues or negative replacement values.
70

At end-2004, the level of cash and cash equivalents roseto CHF 82.8 billion, up CHF 9.4 billion from 73.4 billion at end-2003.
Operating activitiesNet cash flow from operating activities was negative CHF 27.9billion in 2004 compared to positive CHF 3.4 billion in 2003.Operating cash inflows (before changes in operating assetsand liabilities and income taxes paid) totaled CHF 10.8 billionin 2004, an increase of CHF 1.8 billion from 2003. While ournet profit rose by CHF 1.9 billion between 2004 and 2003,we had considerably higher non-cash expenses in 2003, whichreduce net profit but do not affect cash flows. With our adop-tion of IAS 39 in 2004, we started to account for some of ourdebt issues at fair value, leading to the recognition of an ad-ditional non-cash expense item of CHF 1.2 billion, essentiallycomprising an add-back to operating cash flows.
Cash of CHF 71.4 billion was used to fund the net increasein operating assets, while a net increase in operating liabili-ties generated cash inflows of CHF 34.0 billion. The compar-ative amounts in 2003 were higher, primarily reflecting apick-up in activities in 2003 related to the recovery seen inthe financial markets. Payments to tax authorities were CHF1.3 billion in 2004, up CHF 232 million from a year earlier, re-flecting the increase in net profit between 2003 and 2002.
Investing activitiesInvesting activities generated a cash outflow of CHF 1.5 bil-lion, mainly due to our acquisition of new businesses, whichtotaled CHF 1.7 billion net of disposals. By contrast, in 2003,we saw a net cash inflow of CHF 3.1 billion, mainly fromour divestments of financial investments and the sale of theCorrespondent Services Corporation. Disposals of propertyand equipment were CHF 581 million higher in 2004.
Financing activitiesThe overall increase in cash inflows seen in 2004 is attributa-ble to our financing activities, which generated positive cashflows of CHF 39.8 billion. This reflected the net issuance ofmoney market paper of CHF 21.4 billion and the issuance ofCHF 51.2 billion in long-term debt – the latter significantly out-pacing long-term debt repayments, which totaled CHF 24.7billion. That inflow was partly offset by outflows attributableto net movements in treasury shares and own equity deriva-tive activity (CHF 5.0 billion), and dividend payments (CHF2.8 billion). In contrast, in 2003, we had experienced a neg-ative cash flow of CHF 13.3 billion from our financing activi-ties. The difference between the two years was mainly due tothe fact that long-term debt issuance more than doubled from
2003, and because we issued CHF 21.4 billion in moneymarket paper in 2004 after repaying CHF 14.7 billion a year earlier.
2003
In the full year to 31 December 2003, cash and cash equiva-lents decreased by CHF 9.0 billion, principally as a result offinancing activities, which generated negative cash flows ofCHF 13.3 billion. Significant cash outflows resulted from CHF14.7 billion in repayments of money market paper, CHF 6.8billion from movements in treasury shares and derivative ac-tivity in own equity, and CHF 2.3 billion from dividends paid.Issuance of long-term debt of CHF 23.6 billion and repaymentsof CHF 13.6 billion brought a net cash inflow of CHF 10.0 bil-lion. When compared to 2002, cash outflows from financingactivities fell by approximately CHF 19 billion. The main rea-sons for the reduced outflows were an approximate CHF12 billion decline in repayments of money market paper andhigher net inflows of roughly CHF 8 billion in both issuanceand repayment of long-term debt. Increased buybacks oftreasury shares in 2003, coupled with a higher average pricefor our shares, resulted in a higher cash outflow of approxi-mately CHF 1.2 billion in 2003.
Operating cash inflows (before changes in operating as-sets and liabilities and income taxes paid) amounted to CHF 9.0 billion, an increase of CHF 1.4 billion from 2002. Whilenet profit in 2003 was CHF 2.7 billion higher than a year ear-lier, we had considerably higher non-cash expenses in 2002,which reduce net profit but do not affect cash flow. Notably,amortization of goodwill and intangible assets was CHF 1.5billion higher in 2002 than in 2003. The main reason was thewritedown of the value of the PaineWebber brand name ofCHF 1,234 million, but the US dollar exchange rate, whichwas higher in 2002 against most currencies than it was in2003, also contributed to the difference. The other two sig-nificant items were deferred tax expense and gains or lossesfrom investing activities included in net profit. In 2003, wehad deferred tax expenses of CHF 489 million, attributableto a range of sources generating taxable temporary differ-ences. In 2002, we had a deferred tax benefit of CHF 511 mil-lion, to which the release of deferred tax liabilities related tothe PaineWebber brand name was the largest single contrib-utor.
Cash of CHF 88.1 billion was used to fund the net increasein operating assets, while a net increase in operating liabili-ties generated cash inflows of CHF 83.6 billion. The com-parative amounts in 2002 were much smaller, primarily re-
71
Cash flows
Balance Sheet and Cash FlowsCash flows

Balance Sheet and Cash FlowsCash flows
flecting a pick-up in activities in 2003 related to the reboundof the financial markets. Payments to tax authorities wereCHF 1.1 billion, an increase of CHF 532 million compared to2002.
Investing activities generated cash inflow of CHF 1.5 bil-lion. Divestments of financial investments contributed CHF
2.3 billion while the sale of the CSC clearing business and a few smaller subsidiaries and associates generated CHF 834 million. Purchases of property and equipment amountedto CHF 1.4 billion, of which the largest portion was spent forIT, software and communication equipment. Comparativeamounts in 2002 did not deviate materially from 2003.
72

Accounting Standards and Policies

Accounting Standards and PoliciesAccounting principles
The UBS financial statements have been prepared in accor-dance with International Financial Reporting Standards (IFRS).As a US listed company, we also provide a description in note41 to the financial statements of the significant differenceswhich would arise were our accounts to be presented underthe United States Generally Accepted Accounting Principles(US GAAP), and a detailed reconciliation of IFRS shareholders’equity and net profit to US GAAP.
Except where clearly identified, all of UBS’s financial infor-mation presented in this document is presented on a con-solidated basis under IFRS.
Pages 191 to 203 contain the financial statements for the UBS AG Parent Bank – the Swiss company, includingbranches worldwide, which owns all the UBS companies,directly or indirectly. The Parent Bank’s financial statementsare prepared in order to meet Swiss regulatory require-ments and in compliance with Swiss Banking Law. Exceptin those pages, or where otherwise explicitly stated, all ref-erences to “UBS” refer to the UBS Group and not to theParent Bank.
All references to 2004, 2003 and 2002 refer to the UBSGroup and the Parent Bank’s fiscal years ended 31 December2004, 2003 and 2002. The financial statements for the UBSGroup and the Parent Bank have been audited by Ernst &Young Ltd.
An explanation of the critical accounting policies appliedin the preparation of our financial statements is providedbelow. The basis of our accounting is given in note 1 to thefinancial statements.
Standards for management accounting
Our management reporting systems and policies deter-mine the revenues and expenses directly attributable to each business unit. Internal charges and transfer pricingadjustments are reflected in the performance of each busi-ness unit.
Inter-business unit revenues and expenses. Revenue-sharing agreements are used to allocate external customerrevenues to business units on a reasonable basis. Transactionsbetween business units are conducted at arm’s length. Inter-business unit charges are reported in the line “Services to /from other business units” for both business units concerned.Corporate Functions expenses are allocated to the operatingbusiness units to the extent that it is appropriate.
Net interest income is allocated to each business unit basedon their balance sheet positions. Assets and liabilities of thefinancial businesses are funded through and invested with thecentral treasury departments, with the net margin reflectedin the results of each business unit. To complete the alloca-tion, the financial businesses are credited with a risk-freereturn on the regulatory equity they use.
Commissions are credited to the business unit with the cor-responding customer relationship, with revenue-sharingagreements for the allocation of customer revenues whereseveral business units are involved in value creation.
For internal management reporting purposes and in theresults discussion, we measure credit loss using an expectedloss concept. The table below shows the adjusted expectedcredit loss charged to the Business Groups. Expected credit lossreflects the average annual costs that are expected to ariseover time from positions in the current portfolio that becomeimpaired. The adjusted expected credit loss reported for eachBusiness Group is the expected credit loss on its portfolio plusthe difference between credit loss expense and expectedcredit loss, amortized over a three-year period (shown as ‘de-ferral’ in the table). The difference between these adjusted ex-pected credit loss figures and credit loss expenses recorded atGroup level for financial reporting purposes is booked inCorporate Functions.
Regulatory equity is allocated to business units based ontheir average regulatory capital requirement (per Swiss Feder-al Banking Commission (SFBC) standards) during the period.Only utilized equity is taken into account, although we add an
74
Accounting principles
Credit loss expense charged to the business groups
WealthWealth Management & Investment Management Corporate
Business Banking Bank USA Center
CHF million Wealth Business Private BanksFor the year ended 31.12.04 Management Banking CH & GAM Total
Expected credit loss (45 ) (436 ) (92 ) (8 ) (2 ) (583)
Deferral 37 411 85 3 (4 ) 532
Adjusted expected credit loss (8 ) (25 ) (7 ) (5 ) (6 ) (51)
Credit loss (expense) / recovery (1 ) 92 240 3 (58 ) 276
Balancing item charged as credit loss (expense) / recovery in Corporate Functions 327

additional buffer of 10% above the individually determinedbusiness unit regulatory equity requirement. The remainingequity, which mainly covers real estate, and any other unallo-cated equity, remains reported in the Corporate Functions unit.
Headcount, which is expressed in terms of full-time equiv-alents (FTE), is measured as a percentage of the standard
hours normally worked by permanent full-time staff and isused to track the number of individuals employed by UBS.FTE cannot exceed 1.0 for any particular individual. Head-count includes all staff and trainees other than short-termtemporary workers (hired for less than 90 calendar days) andcontractors.
75

Accounting Standards and PoliciesCritical accounting policies
Basis of preparation and selection of policies
We prepare our financial statements in accordance with IFRS,and provide a reconciliation to US GAAP. The application ofcertain of these accounting principles requires a significantamount of judgment based upon estimates and assumptionsthat involve significant uncertainty at the time they are made.Changes in assumptions may have a significant impact on thefinancial statements in the periods where assumptions arechanged. Accounting treatments where significant assump-tions and estimates are used are discussed in this section, asa guide to understanding how their application affects ourreported results. A broader and more detailed description ofthe accounting policies we employ is shown in note 1 to thefinancial statements.
The application of assumptions and estimates means thatany selection of different assumptions would cause our report-ed results to differ. We believe that the assumptions we havemade are appropriate, and that our financial statements there-fore present our financial position and results fairly, in allmaterial respects. The alternative outcomes discussed beloware presented solely to assist the reader in understanding ourfinancial statements, and are not intended to suggest thatother assumptions would be more appropriate.
Many of the judgements we make when applying ac-counting principles depend on an assumption, which webelieve to be correct, that UBS maintains sufficient liquidity tohold positions or investments until a particular trading strat-egy matures – i. e. that we do not need to realize positionsat unfavorable prices in order to fund immediate cash needs.Liquidity is discussed in more detail on pages 65 to 66 of theHandbook 2004 /2005.
Fair value of financial instruments
Assets and liabilities in our trading portfolio, financial assetsand liabilities designated as held at fair value, and derivativeinstruments are recorded at fair value on the balance sheet,with changes in fair value recorded in net trading income inthe income statement. Key judgments affecting this account-ing policy relate to how we determine fair value for such as-sets and liabilities.
Where no active market exists, or where quoted prices arenot otherwise available, we determine fair value using a vari-ety of valuation techniques. These include present value meth-ods, models based on observable input parameters, and mod-els where some of the input parameters are unobservable.
Valuation models are used primarily to value derivativestransacted in the over-the-counter market, including credit
derivatives and unlisted securities with embedded derivatives.All valuation models are validated before they are used as abasis for financial reporting, and periodically reviewed there-after, by qualified personnel independent of the area thatcreated the model. Wherever possible, we compare valuationsderived from models with quoted prices of similar financialinstruments, and with actual values when realized, in orderto further validate and calibrate our models.
A variety of factors are incorporated into our models,including actual or estimated market prices and rates, suchas time value and volatility, and market depth and liquidity.Where available, we use market observable prices and ratesderived from market verifiable data. Where such factors arenot market observable, changes in assumptions could affectthe reported fair value of financial instruments. We apply ourmodels consistently from one period to the next, ensuringcomparability and continuity of valuations over time, butestimating fair value inherently involves a significant degreeof judgment. Management therefore establishes valuationadjustments to cover the risks associated with the estima-tion of unobservable input parameters and the assumptionswithin the models themselves. Valuation adjustments are al-so made to reflect such elements as aged positions, deteri-orating creditworthiness (including country-specific risks),concentrations in specific types of instruments and marketrisk factors (interest rates, currencies etc), and market depthand liquidity. Although a significant degree of judgment is,in some cases, required in establishing fair values, manage-ment believes the fair values recorded in the balance sheetand the changes in fair values recorded in the income state-ment are prudent and reflective of the underlying econom-ics, based on the controls and procedural safeguards we em-ploy. Nevertheless, we have estimated the effect that achange in assumptions to reasonably possible alternativescould have on fair values where model inputs are not mar-ket observable. To estimate that effect on the financial state-ments, we recalculated the model valuation adjustments athigher and lower confidence levels than originally applied.For all financial instruments carried at fair value which relyon assumptions for their valuation, we estimate that fair value could lie in a range from CHF 579 million lower to CHF 927 million higher than the fair values recognized in thefinancial statements.
Fair value option
We adopted revised IAS 32 and revised IAS 39 early (at 1 Jan-uary 2004). We restated the two comparative prior years.Revised IAS 39 permits an entity to designate any financial
76
Critical accounting policies

asset or financial liability as held at fair value and to recognizefair value changes in profit and loss. We apply the fair valueoption primarily to compound debt instruments, which per-mits us to fair value the entire instrument instead of separat-ing the embedded derivative from the host contract and car-rying the host contract at amortized cost. In addition, financialassets and financial liabilities designated at fair value are pre-sented in the balance sheet in separate lines. At 31 Decem-ber 2004, we carried compound debt instruments designat-ed as held at fair value in the amount of CHF 65,756 millionon the balance sheet. In 2004, the change in fair value of theseinstruments was an expense of CHF 1,203 million, of whichCHF 402 million was attributable to changes in LIBOR andCHF 801 million was due to changes in fair value of embed-ded derivatives.
Recognition of deferred Day 1 Profit and Loss
We have entered into transactions, some of which will ma-ture after more than ten years, where we determine fair val-ue using valuation models for which not all inputs are marketobservable prices or rates. We initially recognize a financial in-strument at the transaction price, which is the best indicatorof fair value, although the value obtained from the relevantvaluation model may differ. Such a difference between thetransaction price and the model value is commonly referredto as “Day 1 profit and loss”. In accordance with applicableaccounting literature, we do not recognize that initial differ-ence, usually a gain, immediately in profit and loss. While ap-plicable accounting literature prohibits immediate recognitionof Day 1 profit and loss, it does not address when it is appro-priate to recognize Day 1 profit in the income statement. Italso does not address subsequent measurement of theseinstruments.
Our decisions regarding recognizing deferred Day 1 prof-it and loss are based on the principle of prudence and aremade after careful consideration of facts and circumstancesto ensure we do not prematurely release a portion of the de-ferred profit to income. For each transaction, we determineindividually the appropriate method of recognizing the Day 1profit and loss amount in the income statement. Deferred Day1 profit and loss is amortized over the life of the transaction,deferred until fair value can be determined using marketobservable inputs, or realized through settlement. In all in-stances, any unrecognized Day 1 profit and loss is immediate-ly released to income if fair value of the financial instrumentin question can be determined either by using market observ-able model inputs or by reference to a quoted price for thesame product in an active market.
After entering into a transaction, we measure the finan-cial instrument at fair value, adjusted for the deferred Day 1profit and loss. Subsequent changes in fair value are recog-nized immediately in the income statement without reversalof deferred Day 1 profits and losses.
Securitizations and Special Purpose Entities
UBS sponsors the formation of Special Purpose Entities (SPEs)primarily to allow clients to hold investments, for asset secu-ritization transactions, and for buying or selling credit protec-tion. In accordance with IFRS we do not consolidate SPEs thatwe do not control. As it can sometimes be difficult to deter-mine whether we exercise control over an SPE, we have tomake judgments about risks and rewards as well as our abil-ity to make operational decisions for the SPE. In many in-stances, elements are present that, considered in isolation,indicate control or lack of control over an SPE, but when con-sidered together make it difficult to reach a clear conclusion.When assessing whether we have to consolidate an SPE weevaluate a range of factors, including whether (a) we willobtain the majority of the benefits of the activities of an SPE,(b) we retain the majority of the residual ownership risksrelated to the assets in order to obtain the benefits from itsactivities, (c) we have decision-making powers to obtain themajority of the benefits, or (d) the activities of the SPE arebeing conducted on our behalf according to our specific busi-ness needs so that we obtain the benefits from the SPE’soperations. We consolidate an SPE if our assessment of therelevant factors indicates that we obtain the majority of thebenefits of its activities.
SPEs used to allow clients to hold investments are struc-tures that allow one or more clients to invest in an asset or setof assets which are generally purchased by the SPE in the openmarket and not transferred from UBS. The risks and rewardsof the assets held by the SPE reside with the clients. Typically,UBS will receive service and commission fees for creation ofthe SPE, or because it acts as investment manager, custodianor in some other function.
These SPEs range from mutual funds to trusts investing inreal estate. As an example, UBS Alternative Portfolio AG pro-vides a vehicle for investors to invest in a diversified range ofalternative investments through a single share. The majorityof our SPEs fall into this category. SPEs created for clientinvestment purposes are not consolidated.
SPEs used for securitization. SPEs for securitization arecreated when UBS has assets (for example a portfolio ofloans) which it sells to an SPE, and the SPE in turn sells inter-ests in the assets as securities to investors. Consolidation ofthese SPEs depends on whether UBS retains the majority ofthe benefits of the assets in the SPE.
We do not consolidate SPEs used for securitization if UBShas no control over the assets and no longer retains any sig-nificant exposure (for gain or loss) to the income or investmentreturns on the assets sold to the SPE or the proceeds of theirliquidation. This type of SPE is a bankruptcy-remote entity –if UBS were to go bankrupt the holders of the securitieswould clearly be owners of the asset, while if the SPE wereto go bankrupt the securities holders would have no recourseto UBS.
77

Accounting Standards and PoliciesCritical accounting policies
In some cases UBS does retain exposure to some of thereturns from the assets sold to the SPE, for example first losson a loan portfolio. In these cases we consolidate the SPE andthen derecognize the assets to the extent that we do not haveexposure.
SPEs for credit protection are set up to allow UBS to sellthe credit risk on portfolios, which may or may not be held byUBS, to investors. They exist primarily to allow UBS to have asingle counterparty (the SPE), which sells credit protection toUBS. The SPE in turn has investors who provide it with capi-tal and participate in the risks and rewards of the credit eventsthat it insures. SPEs used for credit protection are generallyconsolidated.
Financial investments – available-for-sale
UBS has classified some of its financial assets, including invest-ments not held for trading purposes, as available-for-sale,where they are not held for the purpose of generating short-term trading gains, but rather for mid-to-long-term capital ap-preciation. Changes in fair value of these financial assets arereflected in shareholders’ equity rather than income. Theamount of unrealized gains or losses on the balance sheet dateis disclosed in the statement of changes in equity in the finan-cial statements.
Companies held in our private equity portfolio are not cur-rently consolidated in the financial statements. This treatmenthas been determined after considering such matters as liquid-ity, exit strategies and degree and timing of our influence andcontrol over these investments. With the adoption of revisedIAS 27 as of 1 January 2005, majority-owned entities will beconsolidated retrospectively as of 1 January 2003. The effectsof this consolidation on our financial statements are disclosedin note 1(ab).
We currently classify our private equity investments asfinancial investments available-for-sale, and carry them on thebalance sheet at fair value, with changes in fair value beingrecorded directly in equity. However, unrealized losses that arenot expected to be recoverable within a reasonable time pe-riod are recorded in our income statement as impairmentcharges. Since quoted market prices are generally unavailablefor these companies, fair value is determined by applyingrecognized valuation techniques, which require the use ofassumptions and estimates. The valuation of our investmentsis derived by application of our valuation policy in a detailedquarterly investment-by-investment review involving the busi-ness and control functions. Our standard valuation method isto apply multiples of earnings that are observed for compa-rable companies. These multiples depend on a number offactors and may fluctuate over time. The geographic andsector diversity of the investments in the portfolio and theirvarying stages in the investment cycle mean that the valua-tions of these positions may not move in line with the chang-ing economic environment. Although judgement is involved,
we believe that the estimates and assumptions made in de-termining the fair value of each investment are reasonableand supportable.
In addition, the determination of when a decline in fairvalue below cost is not recoverable within a reasonable timeperiod is judgmental by nature, so profit and loss could beaffected by differences in this judgement. We generally con-sider investments as impaired if a significant decline in fairvalue below cost extends beyond the near term, unless it isreadily apparent that an investment is impaired, in which casethis would result in immediate loss recognition.
Allowances and provisions for credit losses
Assets accounted for at amortized cost are evaluated for im-pairment and required allowances and provisions are estimat-ed in accordance with IAS 39. Impairment exists if the book value of a claim or a portfolio of claims exceeds the presentvalue of the cash flows actually expected in future periods.These cash flows include scheduled interest payments, prin-cipal repayments, or other payments due (for example onguarantees), including liquidation of collateral where available.
The total allowance and provision for credit losses consistsof two components: specific counterparty allowances andprovisions, and collectively assessed allowances. The specificcounterparty component applies to claims evaluated individ-ually for impairment and is based upon management’s bestestimate of the present value of the cash flows which are ex-pected to be received. In estimating these cash flows, manage-ment makes judgments about a counterparty’s financial situ-ation and the net realizable value of any underlying collateralor guarantees in our favor. Each impaired asset is assessed onits merits, and the workout strategy and estimate of cash flowsconsidered recoverable are independently approved by theCredit Risk Control function. Collectively assessed credit riskallowances cover credit losses inherent in portfolios of claimswith similar economic characteristics where there is objectiveevidence to suggest that they contain impaired claims but theindividual impaired items cannot yet be identified. A compo-nent of collectively assessed allowances is for country risks. Inassessing the need for collective loan loss allowances, manage-ment considers factors such as credit quality, portfolio size, con-centrations, and economic factors. In order to estimate therequired allowance, we make assumptions both to define theway we model inherent losses and to determine the requiredinput parameters, based on historical experience and currenteconomic conditions.
The accuracy of the allowances and provisions we makedepends on how well we estimate future cash flows forspecific counterparty allowances and provisions and the model assumptions and parameters used in determining col-lective allowances. While this necessarily involves judgment,we believe that our allowances and provisions are reasonableand supportable.
78

Further details on this subject are given in note 1(q) to thefinancial statements and in the risk analysis section of theHandbook 2004 /2005, on pages 47 to 57.
Equity compensation
The IFRS requirements applicable to our financial statementshave not previously specifically addressed the recognition andmeasurement of equity-based compensation plans, includingemployee option plans. IFRS 2, Share-based Payment, ad-dresses the accounting for share-based employee compensa-tion and was adopted by UBS on 1 January 2005 on a fullyretrospective basis. Until the end of 2004, we recognized com-pensation expense for awards issued to employees as part ofannual bonuses during the year of corresponding perform-ance, aligning with the revenue produced. Subsequentchanges in intrinsic value were not recognized. For shareawards, we recognized compensation expense in the amountof the fair value of the share at the grant date. For optionawards granted, the exercise price is generally set either equal
to or slightly higher than the fair value of the underlyingshare at the grant date. Accordingly, these options have no intrinsic value when granted, and therefore, we did notrecognize compensation expense for these awards. Had werecognized the fair value of stock option grants on grant dateas compensation expense, net income would have been low-er by CHF 508 million in 2004, CHF 439 million in 2003, andCHF 690 million in 2002.
IFRS 2 requires recognition of all equity-based awards in thefinancial statements based on the fair value measured at thegrant date. Compensation cost will be recognized over theservice period, which is consistent with the vesting period,starting at grant date of an award. As we are adopting thisstandard on a fully retrospective basis, we will reverse compen-sation expense recognized for share awards in 2003 and 2004and replace it with compensation expense for the fair value ofshare and share option awards determined in accordance withIFRS 2. The effect of applying IFRS 2 is disclosed in note 1 (ab)to the financial statements, and further information on UBSequity compensation plans is disclosed in note 32.
79

80

Financial Statements

Financial StatementsTable of Contents
Report of the Group Auditors 83
Financial Statements 84
Income Statement 84Balance Sheet 85Statement of Changes in Equity 86Statement of Cash Flows 88
Notes to the Financial Statements 90
1 Summary of Significant Accounting Policies 902a Segment Reporting by Business Group 1012b Segment Reporting by Geographic Location 108
Income Statement 1093 Net Interest and Trading Income 1094 Net Fee and Commission Income 1105 Other Income 1116 Personnel Expenses 1117 General and Administrative Expenses 1118 Earnings per Share (EPS) and Shares Outstanding 112
Balance Sheet: Assets 1139a Due from Banks and Loans 1139b Allowances and Provisions for Credit Losses 1149c Impaired Due from Banks and Loans 1149d Non-Performing Due from Banks and Loans 11510 Securities Borrowing, Securities Lending,
Repurchase and Reverse Repurchase Agreements 11611 Trading Portfolio 11712 Financial Investments (available-for-sale) 11813 Investments in Associates 12014 Property and Equipment 12015 Goodwill and Other Intangible Assets 12116 Other Assets 122
Balance Sheet: Liabilities 12317 Due to Banks and Customers 12318 Financial liabilities designated
at fair value and debt issued 12319 Other Liabilities 12520 Provisions 125
21 Income Taxes 12522 Minority Interests 12723 Derivative Instruments 127
Off-Balance Sheet Information 13224 Fiduciary Transactions 13225 Commitments and Contingent Liabilities 13226 Operating Lease Commitments 134
Additional Information 13527 Pledged Assets 13528 Litigation 13529 Financial Instruments Risk Position 135
a) Market Risk 136(a)(i) Overview 136(a)(ii) Interest Rate Risk 136(a)(iii) Currency Risk 138(a)(iv) Equity Risk 138(a)(v) Issuer Risk 138
b) Credit Risk 139c) Liquidity Risk 141d) Capital Adequacy 142e) Financial Instruments Risk Position in
Motor-Columbus 14430 Fair Value of Financial Instruments 14531 Pension and Other Post-Retirement Benefit Plans 15032 Equity Participation Plans 155
a) Equity Participation Plans Offered 155b) UBS Share Awards 156c) UBS Option Awards 157d) Compensation Expense 157e) Pro-Forma Net Income 158
33 Related Parties 15934 Sales of Financial Assets in Securitizations 16135 Post–Balance Sheet Events 16136 Significant Subsidiaries and Associates 16237 Invested Assets and Net New Money 16638 Business Combinations 16739 Currency Translation Rates 17040 Swiss Banking Law Requirements 17141 Reconciliation to US GAAP 17242 Additional Disclosures Required under
US GAAP and SEC Rules 183
82
Financial StatementsTable of Contents

83
Financial StatementsReport of the Group Auditors

Financial Statements
Income Statement
For the year ended % change from
CHF million, except per share data Note 31.12.04 31.12.03 31.12.02 31.12.03
Operating income
Interest income 3 39,398 40,159 39,963 (2 )
Interest expense 3 (27,538) (27,860 ) (29,417 ) (1 )
Net interest income 11,860 12,299 10,546 (4 )
Credit loss (expense) / recovery 276 (72 ) (115 )
Net interest income after credit loss expense 12,136 12,227 10,431 (1 )
Net fee and commission income 4 19,416 17,345 18,221 12
Net trading income 3 4,972 3,756 5,451 32
Other income 5 897 462 4 94
Income from industrial holdings 3,648
Total operating income 41,069 33,790 34,107 22
Operating expenses
Personnel expenses 6 18,515 17,231 18,524 7
General and administrative expenses 7 6,703 6,086 7,072 10
Depreciation of property and equipment 14 1,352 1,353 1,514 0
Amortization of goodwill and other intangible assets 15 964 943 2,460 2
Goods and materials purchased 2,861
Total operating expenses 30,395 25,613 29,570 19
Operating profit before tax and minority interests 10,674 8,177 4,537 31
Tax expense 21 2,135 1,593 676 34
Net profit before minority interests 8,539 6,584 3,861 30
Minority interests 22 (450) (345 ) (331 ) 30
Net profit 8,089 6,239 3,530 30
Basic earnings per share (CHF) 8 7.68 5.59 2.92 37
Diluted earnings per share (CHF) 8 7.47 5.48 2.87 36
84
Financial Statements

Balance Sheet
% change from
CHF million Note 31.12.04 31.12.03 31.12.03
Assets
Cash and balances with central banks 6,036 3,584 68
Due from banks 9 35,264 31,740 11
Cash collateral on securities borrowed 10 220,242 213,932 3
Reverse repurchase agreements 10 357,164 320,499 11
Trading portfolio assets 11 370,259 341,013 9
Trading portfolio assets pledged as collateral 11 159,115 120,759 32
Positive replacement values 23 284,577 248,206 15
Financial assets designated at fair value 653 0
Loans 9 232,387 212,679 9
Financial investments 12 5,049 5,139 (2 )
Accrued income and prepaid expenses 5,876 6,218 (6 )
Investments in associates 13 2,427 1,616 50
Property and equipment 14 8,736 7,683 14
Goodwill and other intangible assets 15 12,149 11,529 5
Other assets 16, 21 34,850 25,459 37
Total assets 1,734,784 1,550,056 12
Liabilities
Due to banks 17 118,901 127,012 (6 )
Cash collateral on securities lent 10 61,545 53,278 16
Repurchase agreements 10 422,587 415,863 2
Trading portfolio liabilities 11 171,033 143,957 19
Negative replacement values 23 303,712 254,768 19
Financial liabilities designated at fair value 18 65,756 35,286 86
Due to customers 17 376,083 346,633 8
Accrued expenses and deferred income 14,685 13,673 7
Debt issued 18 117,828 88,843 33
Other liabilities 19, 20, 21 42,342 31,360 35
Total liabilities 1,694,472 1,510,673 12
Minority interests 22 5,334 4,073 31
Shareholders’ equity
Share capital 901 946 (5 )
Share premium account 7,348 6,935 6
Net gains / (losses) not recognized in the income statement, net of tax (1,644) (983 ) (67 )
Revaluation reserve from step acquisitions 90 0
Retained earnings 37,455 36,641 2
Equity classified as obligation to purchase own shares (96) (49 ) (96 )
Treasury shares (9,076) (8,180 ) (11 )
Total shareholders’ equity 34,978 35,310 (1 )
Total liabilities, minority interests and shareholders’ equity 1,734,784 1,550,056 12
85

Financial Statements
Statement of Changes in Equity
For the year ended
CHF million 31.12.04 31.12.03 31.12.02
Issued and paid up share capital
Balance at the beginning of the year 946 1,005 3,589
Issue of share capital 2 2 6
Capital repayment by par value reduction 1 (2,509 )
Cancellation of second trading line treasury shares (2001 program) (81 )
Cancellation of second trading line treasury shares (2002 program) (61 )
Cancellation of second trading line treasury shares (2003 program) (47)
Balance at the end of the year 901 946 1,005
Share premium
Balance at the beginning of the year, restated 6,935 12,641 14,408
Premium on shares issued and warrants exercised 379 92 157
Net premium / (discount) on treasury share and own equity derivative activity 26 (330 ) 285
Employee stock option plan 8
Cancellation of second trading line treasury shares (2001 program) (2,209 )
Cancellation of second trading line treasury shares (2002 program) (5,468 )
Balance at the end of the year 7,348 6,935 12,641
Net gains / (losses) not recognized in the income statement, net of taxes
Foreign currency translation
Balance at the beginning of the year (1,644) (849 ) (769 )
Movements during the year (818) (795 ) (80 )
Subtotal – balance at the end of the year (2,462) (1,644 ) (849 )
Net unrealized gains / (losses) on available-for-sale investments, net of taxes
Balance at the beginning of the year 805 946 1,035
Net unrealized gains / (losses) on available-for-sale investments 474 (108 ) (144 )
Impairment charges reclassified to the income statement 192 285 635
Realized gains reclassified to the income statement (353) (340 ) (600 )
Realized losses reclassified to the income statement 22 22 20
Subtotal – balance at the end of the year 1,140 805 946
Change in fair value of derivative instruments designated as cash flow hedges, net of taxes
Balance at the beginning of the year (144) (256 ) (459 )
Net unrealized gains / (losses) on the revaluation of cash flow hedges (223) 116 (11 )
Net realized (gains) / losses reclassified to the income statement 45 (4 ) 214
Subtotal – balance at the end of the year (322) (144 ) (256 )
Balance at the end of the year (1,644) (983 ) (159 )
Revaluation reserve from step acquisitions, net of taxes
New acquisitions 90
Balance at the end of the year 90
Retained earnings
Balance at the beginning of the year, restated 36,641 32,700 29,103
Net profit for the year 8,089 6,239 3,597
Dividends paid 1 (2,806) (2,298 )
Cancellation of second trading line treasury shares (2003 program) 2 (4,469)
Balance at the end of the year 37,455 36,641 32,700
Equity classified as obligation to purchase own shares
Balance at the beginning of the year, restated (49) (104 )
Net movements (47) 55 (104 )
Balance at the end of the year (96) (49 ) (104 )
1 On 10 July 2002, UBS made a distribution of CHF 2.00 per share to shareholders which reduced the par value from CHF 2.80 to CHF 0.80 per share. Dividends of CHF 2.00 per share and CHF 2.60 pershare were paid on 23 April 2003 and 20 April 2004, respectively. 2 The cancellation of second trading line treasury shares is now made against retained earnings. In prior years it was made againstthe share premium account.
86

Statement of Changes in Equity (continued)For the year ended
CHF million 31.12.04 31.12.03 31.12.02
Treasury shares, at cost
Balance at the beginning of the year (8,180) (7,131 ) (3,377 )
Acquisitions (8,813) (8,424 ) (8,313 )
Disposals 3,401 1,846 2,269
Cancellation of second trading line treasury shares (2001 program) 2,290
Cancellation of second trading line treasury shares (2002 program) 5,529
Cancellation of second trading line treasury shares (2003 program) 4,516
Balance at the end of the year (9,076) (8,180 ) (7,131 )
Total shareholders’ equity 34,978 35,310 38,952
Shares issued
For the year ended % change from
Number of shares 31.12.04 31.12.03 31.12.02 31.12.03
Balance at the beginning of the year 1,183,046,764 1,256,297,678 1,281,717,499 (6 )
Issue of share capital 3,293,413 2,719,166 3,398,869 21
Cancellation of second trading line treasury shares (2001 program) (28,818,690 )
Cancellation of second trading line treasury shares (2002 program) (75,970,080 )
Cancellation of second trading line treasury shares (2003 program) (59,482,000)
Balance at the end of the year 1,126,858,177 1,183,046,764 1,256,297,678 (5 )
Treasury shares
For the year ended % change from
Number of shares 31.12.04 31.12.03 31.12.02 31.12.03
Balance at the beginning of the year 111,360,692 97,181,094 41,254,951 15
Acquisitions 96,139,004 116,080,976 110,710,741 (17 )
Disposals (44,492,725) (25,931,298 ) (25,965,908 ) (72 )
Cancellation of second trading line treasury shares (2001 program) (28,818,690 )
Cancellation of second trading line treasury shares (2002 program) (75,970,080 ) 100
Cancellation of second trading line treasury shares (2003 program) (59,482,000)
Balance at the end of the year 103,524,971 111,360,692 97,181,094 (7 )
87
During the year a total of 59,482,000 shares acquired underthe second trading line buyback program 2003 were cancelled.On 31 December 2004, a maximum of 3,533,012 sharescan be issued against the exercise of options from formerPaineWebber employee option plans. These shares are shownas conditional share capital in the UBS AG (Parent Bank) dis-closure. Out of the total number of 103,524,971 treasury
shares, 39,935,094 shares (CHF 3,543 million) have been re-purchased for cancellation. The Board of Directors will proposeto the Annual General Meeting on 21 April 2005 to reduce theoutstanding number of shares and the share capital by thenumber of shares purchased for cancellation. All issued sharesare fully paid.

Financial Statements
Statement of Cash Flows
For the year ended
CHF million 31.12.04 31.12.03 31.12.02
Cash flow from / (used in) operating activities
Net profit 8,089 6,239 3,530
Adjustments to reconcile net profit to cash flow from / (used in) operating activities
Non-cash items included in net profit and other adjustments:
Depreciation of property and equipment 1,352 1,353 1,514
Amortization of goodwill and other intangible assets 964 943 2,460
Credit loss expense / (recovery) (276) 72 115
Equity in income of associates (65) (123 ) (7 )
Deferred tax expense / (benefit) 3 489 (511 )
Net loss / (gain) from investing activities (475) (63 ) 986
Net loss / (gain) from financing activities 1,203 115 (446 )
Net (increase) / decrease in operating assets:
Net due from / to banks (11,679) 42,921 (22,382 )
Reverse repurchase agreements and cash collateral on securities borrowed (42,975) (101,381 ) (944 )
Trading portfolio and net replacement values (19,834) (52,197 ) 22,427
Loans / due to customers 10,035 38,638 (11,446 )
Accrued income, prepaid expenses and other assets (6,927) (16,100 ) 2,875
Net increase / (decrease) in operating liabilities:
Repurchase agreements and cash collateral on securities lent 14,991 65,413 4,791
Accrued expenses and other liabilities 19,032 18,188 (4,754 )
Income taxes paid (1,336) (1,104 ) (572 )
Net cash flow from / (used in) operating activities (27,898) 3,403 (2,364 )
Cash flow from / (used in) investing activities
Investments in subsidiaries and associates (2,511) (428 ) (60 )
Disposal of subsidiaries and associates 800 834 984
Purchase of property and equipment (1,149) (1,376 ) (1,763 )
Disposal of property and equipment 704 123 67
Net (investment in) / divestment of financial investments 686 2,317 2,153
Net cash flow from / (used in) investing activities (1,470) 1,470 1,381
88

Statement of Cash Flows (continued)For the year ended
CHF million 31.12.04 31.12.03 31.12.02
Cash flow from / (used in) financing activities
Net money market paper issued / (repaid) 21,379 (14,737 ) (26,206 )
Net movements in treasury shares and own equity derivative activity (4,999) (6,810 ) (5,605 )
Capital issuance 2 2 6
Capital repayment by par value reduction (2,509 )
Dividends paid (2,806) (2,298 )
Issuance of long-term debt, including financial liabilities designated at fair value 51,211 23,644 17,132
Repayment of long-term debt, including financial liabilities designated at fair value (24,717) (13,615 ) (14,911 )
Increase in minority interests 1 102 755
Dividend payments to / purchase from minority interests (332) (278 ) (377 )
Net cash flow from / (used in) financing activities 39,840 (13,337 ) (32,470 )
Effects of exchange rate differences (1,052) (524 ) (462 )
Net increase / (decrease) in cash equivalents 9,420 (8,988 ) (33,915 )
Cash and cash equivalents, beginning of the year 73,356 82,344 116,259
Cash and cash equivalents, end of the year 82,776 73,356 82,344
Cash and cash equivalents comprise:
Cash and balances with central banks 6,036 3,584 4,271
Money market paper 2 45,409 40,599 46,183
Due from banks maturing in less than three months 31,331 29,173 31,890
Total 82,776 73,356 82,344
Significant non-cash investing and financing activities
Hyposwiss, Zurich, deconsolidation
Financial investments 53
Property and equipment 18
Debt issued 63
Hirslanden Holding AG, Zurich, deconsolidation
Financial investments 3
Property and equipment 718
Goodwill and other intangible assets 15
Consolidation of special purpose entities
Debt issued 2,322
Provisions for reinstatement costs
Property and equipment 137
Motor-Columbus, Baden, from valuation at equity to full consolidation
Financial investments 644
Investments in associates 261
Property and equipment 2,083
Goodwill and other intangible assets 1,194
Debt issued 727
Minority interests 1,742
Investment funds transferred to other liabilities according to IAS 32
Minority interests 3361 Includes issuance of trust preferred securities of CHF 372 million for the year ended 31 December 2003. 2 Money market paper is included in the balance sheet under Trading portfolio assets andFinancial investments. CHF 13,242 million, CHF 6,430 million and CHF 10,475 million were pledged at 31 December 2004, 31 December 2003 and 31 December 2002, respectively.
Cash paid for interest during 2004 was CHF 18,614 million.
89

Financial StatementsNotes to the Financial Statements
a) Basis of accountingUBS AG and subsidiaries (“UBS” or the “Group”) provide abroad range of financial services including advisory services,underwriting, financing, market-making, asset management,brokerage, and retail banking on a global level. The Group wasformed on 29 June 1998 when Swiss Bank Corporation andUnion Bank of Switzerland merged. The merger was account-ed for using the uniting of interests method of accounting.
The consolidated financial statements of UBS (the “Finan-cial Statements”) are prepared in accordance with Internation-al Financial Reporting Standards ("IFRS"), issued by the Inter-national Accounting Standards Board (IASB), and stated inSwiss francs (CHF), the currency of the country in which UBSAG is incorporated. On 3 February 2005, the Board of Direc-tors approved them for issue.
b) Use of estimates in the preparation of Financial StatementsIn preparing the Financial Statements, management is re-quired to make estimates and assumptions that affect report-ed income, expenses, assets, liabilities and disclosure of con-tingent assets and liabilities. Use of available information andapplication of judgement are inherent in the formation ofestimates. Actual results in the future could differ from suchestimates and the differences may be material to the Finan-cial Statements.
c) ConsolidationThe Financial Statements comprise those of the parent compa-ny (UBS AG), its subsidiaries and certain special purpose enti-ties, presented as a single economic entity. The effects of intra-group transactions are eliminated in preparing the FinancialStatements. Subsidiaries and special purpose entities which aredirectly or indirectly controlled by the Group are consolidated,with the exception of certain employee benefit trusts (see alsosection ab). Subsidiaries acquired are consolidated from the datecontrol is transferred to the Group. Subsidiaries to be divestedare consolidated up to the date of disposal. Temporarily con-trolled entities that are acquired and held with a view to theirsubsequent disposal, are recorded as Financial investments.
Assets held in an agency or fiduciary capacity are not assetsof the Group and are not reported in the Financial Statements.
Equity and net income attributable to minority interests areshown separately in the balance sheet and income state-ment, respectively.
Investments in associates in which UBS has a significantinfluence are accounted for under the equity method of ac-counting. Significant influence is normally evidenced when
UBS owns 20% or more of a company’s voting rights. Invest-ments in associates are initially recorded at cost and the car-rying amount is increased or decreased to recognize theGroup’s share of the investee’s profits or losses after the dateof acquisition. Investments in associates for which significantinfluence is intended to be temporary because the investmentsare acquired and held exclusively with a view to their subse-quent disposal, are recorded as Financial investments.
The Group sponsors the formation of entities, which mayor may not be directly or indirectly owned subsidiaries, for thepurpose of asset securitization transactions and structureddebt issuance, and to accomplish certain narrow and welldefined objectives. These companies may acquire assetsdirectly or indirectly from UBS or its affiliates. Some of thesecompanies are bankruptcy-remote entities whose assets arenot available to satisfy the claims of creditors of the Group orany of its subsidiaries. Such companies are consolidated in theGroup’s Financial Statements when the substance of therelationship between the Group and the company indicatesthat the company is controlled by the Group. Certain trans-actions of consolidated entities meet the criteria for derecog-nition of financial assets, see section d) below. These trans-actions do not affect the consolidation status of an entity.
d) DerecognitionUBS enters into transactions where it transfers assets recog-nized on its balance sheet, but retains either all risks andrewards of the transferred assets or a portion of them. If all orsubstantially all risks and rewards are retained, the transferredassets are not derecognized from the balance sheet. Transfersof assets with retention of all or substantially all risks andrewards include, for example, securities lending and repurchasetransactions described under paragraphs f) and g) below. An-other example of a transaction where all risks and rewards areretained is where assets are sold to a third party with a con-current total rate of return swap on the transferred assets.These types of transactions are accounted for as securedfinancing transactions similar to repurchase agreements.
In transactions where UBS neither retains nor transfers sub-stantially all the risks and rewards of ownership of a financialasset, it derecognizes the asset if control over the asset is lost.The rights and obligations retained in the transfer are recog-nized separately as assets and liabilities as appropriate. Intransfers where control over the asset is retained, the Groupcontinues to recognize the asset to the extent of its continu-ing involvement, determined by the extent to which it isexposed to changes in the value of the transferred asset.
90
Notes to the Financial Statements
Note 1 Summary of Significant Accounting Policies

In certain transactions, UBS retains rights to service a trans-ferred financial asset for a fee. The transferred asset is dere-cognized in its entirety, if it meets the derecognition criteria.An asset or liability is recognized for the servicing rights, de-pending on whether the servicing fee is more than adequateto cover servicing expenses (asset) or is less than adequate forperforming the servicing (liability).
e) SecuritizationsUBS securitizes various consumer and commercial financialassets, which generally results in the sale of these assets tospecial-purpose entities, which, in turn issue securities toinvestors. Interests in the securitized financial assets may beretained in the form of senior or subordinated tranches,interest-only strips or other residual interests (“retained inter-ests”). Retained interests are primarily recorded in Tradingportfolio assets and carried at fair value. Gains or losses onsecuritization depend in part on the carrying amount of thetransferred financial assets, allocated between the financialassets derecognized and the retained interests based on theirrelative fair values at the date of the transfer. Gains or losseson securitization are recorded in Net trading income.
f) Securities borrowing and lendingSecurities borrowing and securities lending transactions aregenerally entered into on a collateralized basis, with securi-ties predominantly advanced or received as collateral. Trans-fer of the securities themselves, whether in a borrowing / lend-ing transaction or as collateral, is not reflected on the balancesheet unless the risks and rewards of ownership are alsotransferred. If cash collateral is advanced or received, securi-ties borrowing and lending activities are recorded at theamount of cash collateral advanced (Cash collateral on secu-rities borrowed) or received (Cash collateral on securities lent).
UBS monitors the market value of the securities borrowedand lent on a daily basis and provides or requests additionalcollateral in accordance with the underlying agreements.
Fees and interest received or paid are recognized on anaccrual basis and recorded as interest income or interest expense.
g) Repurchase and reverse repurchase transactionsSecurities purchased under agreements to resell (reverse re-purchase agreements) and securities sold under agreementsto repurchase (repurchase agreements) are generally treatedas collateralized financing transactions. In reverse repurchaseagreements, the cash advanced, including accrued interest, isrecognized on the balance sheet as Reverse repurchase agree-ments. In repurchase agreements, the cash received, includ-ing accrued interest, is recognized on the balance sheet asRepurchase agreements.
Securities received under reverse repurchase agreementsand securities delivered under repurchase agreements are notrecognized on or derecognized from the balance sheet, un-less control of the contractual rights that comprise these se-
curities is obtained or relinquished. UBS monitors the marketvalue of the securities received or delivered on a daily basisand provides or requests additional collateral in accordancewith the underlying agreements.
Interest earned on reverse repurchase agreements andinterest incurred on repurchase agreements is recognized as interest income or interest expense over the life of eachagreement.
The Group offsets reverse repurchase agreements andrepurchase agreements with the same counterparty for trans-actions covered by legally enforceable master netting agree-ments when net or simultaneous settlement is intended.
h) Segment reportingUBS’s financial businesses are organized on a worldwide basis into four Business Groups and the Corporate Center.Wealth Management & Business Banking is segregated into twosegments, Wealth Management and Business Banking Switzer-land. The Corporate Center also consists of two segments, Pri-vate Banks & GAM and Corporate Functions. The IndustrialHoldings segment holds all industrial operations controlled bythe Group. In total, UBS now reports eight business segments.
Segment income, segment expenses and segment per-formance include transfers between business segments andbetween geographical segments. Such transfers are conduct-ed at arm’s length.
i) Foreign currency translationForeign currency transactions are recorded at the rate ofexchange on the date of the transaction. At the balance sheetdate, monetary assets and liabilities denominated in foreigncurrencies are reported using the closing exchange rate. Ex-change differences arising on the settlement of transactionsat rates different from those at the date of the transaction,and unrealized foreign exchange differences on unsettledforeign currency monetary assets and liabilities, are recognizedin the income statement.
Unrealized exchange differences on non-monetary financialassets (investments in equity instruments) are a component ofthe change in their entire fair value. For a non-monetary finan-cial asset classified as held for trading, unrealized exchange dif-ferences are recognized in the income statement. For non-monetary Financial investments which are classified asavailable-for-sale, unrealized exchange differences are record-ed directly in Shareholder’s equity until the asset is sold.
When preparing consolidated financial statements, assetsand liabilities of foreign entities are translated at the exchangerates at the balance sheet date, while income and expenseitems are translated at weighted average rates for the period.Differences resulting from the use of closing and weightedaverage exchange rates and from revaluing a foreign entity’sopening net asset balance at closing rate are recognizeddirectly in Foreign currency translation within Shareholders’equity.
91

Financial StatementsNotes to the Financial Statements
j) Cash and cash equivalentsCash and cash equivalents consist of Cash and balances withcentral banks, balances included in Due from banks thatmature in less than three months, and Money market paperincluded in Trading portfolio assets and Financial investments.
k) Fee incomeUBS earns fee income from a diverse range of services it providesto its customers. Fee income can be divided into two broad cat-egories: income earned from services that are provided over acertain period of time, for which customers are generally billedon an annual or semi-annual basis, and income earned from pro-viding transaction-type services. Fees earned from services thatare provided over a certain period of time are recognized ratablyover the service period. Fees earned from providing transaction-type services are recognized when the service has been complet-ed. Fees or components of fees that are performance linked arerecognized when the performance criteria are fulfilled.
The following fee income is predominantly earned fromservices that are provided over a period of time: investmentfund fees, fiduciary fees, custodian fees, portfolio and othermanagement and advisory fees, insurance-related fees, credit-related fees and commission income. Fees predominantlyearned from providing transaction-type services include under-writing fees, corporate finance fees, and brokerage fees.
l) Determination of fair valueThe determination of fair values of financial assets and finan-cial liabilities is based on quoted market prices or dealer pricequotations for financial instruments traded in active markets.For all other financial instruments fair value is determined byusing valuation techniques. Valuation techniques include netpresent value techniques, the discounted cash flow method,comparison to similar instruments for which market observ-able prices exist, and valuation models. UBS uses widely rec-ognized valuation models for determining fair value of com-mon and more simple financial instruments like options andinterest rate and currency swaps. For these financial instru-ments, inputs into models are market observable.
For more complex instruments, UBS uses proprietary mod-els, which usually are developed from recognized valuationmodels. Some or all of the inputs into these models may notbe market observable, and are derived from market prices orrates or estimated based on assumptions. When entering into a transaction, the financial instrument is initially recog-nized at the transaction price, which is the best indicator offair value, although the value obtained from the valuationmodel may differ from the transaction price. This initial dif-ference, usually an increase, in fair value indicated by valua-tion techniques is recognized in income depending upon theindividual facts and circumstances of each transaction and notlater than when the market data becomes observable.
The value produced by a model or other valuation techniqueis adjusted to allow for a number of factors as appropriate, be-
cause valuation techniques cannot appropriately reflect all fac-tors market participants take into account when entering in-to a transaction. Valuation adjustments are recorded to allowfor model risks, bid-ask spreads, liquidity risks, as well as oth-er factors. Management believes that these valuation adjust-ments are necessary and appropriate to fairly state financial in-struments carried at fair value on the balance sheet.
m) Trading portfolioTrading portfolio assets consist of money market paper, other debt instruments, including traded loans, equity instru-ments, precious metals and commodities which are owned bythe Group (“long” positions). Trading portfolio liabilities con-sist of obligations to deliver trading securities such as moneymarket paper, other debt instruments and equity instrumentswhich the Group has sold to third parties but does not own(“short” positions).
The trading portfolio is carried at fair value. Gains andlosses realized on disposal or redemption and unrealized gainsand losses from changes in the fair value of trading portfolioassets or liabilities are reported as Net trading income. Inter-est and dividend income and expense on trading portfolio as-sets or liabilities are included in Interest and dividend incomeor Interest and dividend expense, respectively.
The Group uses settlement date accounting when record-ing trading portfolio transactions. It recognizes from the datethe transaction is entered into (trade date) any unrealized prof-its and losses arising from revaluing that contract to fair value in the income statement. Subsequent to the trade date,when the transaction is consummated (settlement date) aresulting financial asset or liability is recognized on the bal-ance sheet at the fair value of the consideration given orreceived plus or minus the change in fair value of the contractsince the trade date. When the Group becomes party to a salescontract of a financial asset classified in its trading portfolioit derecognizes the asset on the day of its transfer.
n) Financial instruments designated as held at fair value through profit and lossUBS has a substantial portion of its compound debt instru-ments classified as held at fair value through profit and loss.These liabilities are presented in a separate line on the face ofthe balance sheet. A small amount of financial assets has alsobeen classified as held at fair value through profit and loss, andthey are likewise presented in a separate line. A financial in-strument may be designated at inception as held at fair valuethrough profit and loss and can subsequently not be changed.The fair value designation was made possible as part of thetransition to the revised IAS 39, which UBS adopted on 1 Jan-uary 2004. The Group designated approximately CHF 35.3 bil-lion of existing compound debt instruments as held at fair val-ue through profit and loss at 1 January 2004. All fair valuechanges related to financial instruments held at fair valuethrough profit and loss are recognized in Net trading income.
92

o) Derivative instruments and hedgingAll derivative instruments are carried at fair value on the bal-ance sheet and are reported as Positive or Negative replace-ment values. Where the Group enters into derivatives for trad-ing purposes, realized and unrealized gains and losses arerecognized in Net trading income.
The Group also uses derivative instruments as part of its as-set and liability management activities to manage exposures tointerest rate, foreign currency and credit risks, including expo-sures arising from forecast transactions. The Group applies eitherfair value or cash flow hedge accounting when transactions meetthe specified criteria to obtain hedge accounting treatment.
At the time a financial instrument is designated as a hedge,the Group formally documents the relationship between thehedging instrument(s) and hedged item(s). Documentationincludes its risk management objectives and its strategy inundertaking the hedge transaction, together with the methodsthat will be used to assess the effectiveness of the hedging re-lationship. Accordingly, the Group formally assesses, both at theinception of the hedge and on an ongoing basis, whether thehedging derivatives have been “highly effective” in offsettingchanges in the fair value or cash flows of the hedged items. Ahedge is normally regarded as highly effective if, at inception andthroughout its life, the Group can expect, and actual results in-dicate, that changes in the fair value or cash flows of the hedgeditem are effectively offset by the changes in the fair value or cashflows of the hedging instrument, and actual results are within arange of 80% to 125%. In the case of hedging a forecast trans-action, the transaction must have a high probability of occurringand must present an exposure to variations in cash flows thatcould ultimately affect reported net profit or loss. The Group dis-continues hedge accounting when it is determined that: a de-rivative is not, or has ceased to be, highly effective as a hedge;when the derivative expires, or is sold, terminated, or exercised;when the hedged item matures or is sold or repaid; or when aforecast transaction is no longer deemed highly probable.
Hedge ineffectiveness represents the amount by which thechanges in the fair value of the hedging derivative differ fromchanges in the fair value of the hedged item or the amount by which changes in the cash flow of the hedging derivativediffer from changes (or expected changes) in the cash flow ofthe hedged item. Such gains and losses are recorded in currentperiod earnings in Net trading income, as are gains and losseson components of a hedging derivative that are excluded fromassessing hedge effectiveness.
For qualifying fair value hedges, the change in fair value ofthe hedging derivative is recognized in net profit and loss.Those changes in fair value of the hedged item which areattributable to the risks hedged with the derivative instrumentare reflected in an adjustment to the carrying value of thehedged item, which is also recognized in net profit or loss. Ifthe hedge relationship is terminated for reasons other than thederecognition of the hedged item, the difference between thecarrying value of the hedged item at that point and the value
at which it would have been carried had the hedge never ex-isted (the ”unamortized fair value adjustment“), is, in the caseof interest bearing instruments, amortized to net profit or lossover the remaining term of the original hedge, while for non-interest bearing instruments that amount is immediately rec-ognized in earnings. If the hedged instrument is derecog-nized, e.g. is sold or repaid, the unamortized fair valueadjustment is recognized immediately in net profit and loss.
A fair value gain or loss associated with the effective por-tion of a derivative designated as a cash flow hedge is recog-nized initially in Shareholders’ equity. When the cash flowsthat the derivative is hedging materialize, resulting in incomeor expense, then the associated gain or loss on the hedgingderivative is simultaneously transferred from Shareholders’equity to the corresponding income or expense line item.
If a cash flow hedge for a forecast transaction is deemedto be no longer effective, or the hedge relationship is termi-nated, the cumulative gain or loss on the hedging derivativepreviously reported in Shareholders’ equity remains in Share-holders’ equity until the committed or forecast transactionoccurs, at which point it is transferred from Shareholders’equity to the income statement.
Derivative instruments transacted as economic hedges butnot qualifying for hedge accounting are treated in the sameway as derivative instruments used for trading purposes, i. e.realized and unrealized gains and losses are recognized in Nettrading income. In particular, the Group has entered into eco-nomic hedges of credit risk within the loan portfolio using credit default swaps to which it can not apply hedgeaccounting. In the event that the Group recognizes an impair-ment on a loan that is economically hedged in this way, theimpairment is recognized in Credit loss expense whereas anygain on the credit default swap is recorded in Net tradingincome – see Note 23 for additional information.
A derivative may be embedded in a “host contract”. Suchcombinations are known as compound instruments and arisepredominantly from the issuance of certain structured debtinstruments. If the host contract is not carried at fair value withchanges in fair value reported in net profit or loss, the embed-ded derivative is separated from the host contract andaccounted for as a standalone derivative instrument at fair val-ue if, and only if, the economic characteristics and risks of theembedded derivative are not closely related to the economiccharacteristics and risks of the host contract and the embed-ded derivative actually meets the definition of a derivative.
p) LoansLoans include loans originated by the Group where money isprovided directly to the borrower, participation in a loan fromanother lender and purchased loans that are not quoted inan active market and for which no intention of immediate orshort-term resale exists. Originated and purchased loans whichare intended to be sold in the short term are recorded as Trad-ing portfolio assets.
93

Financial StatementsNotes to the Financial Statements
Loans are recognized when cash is advanced to borrow-ers. They are initially recorded at fair value, which is the cashgiven to originate the loan, including any transaction costs,and are subsequently measured at amortized cost using theeffective interest rate method.
Interest on loans is included in Interest earned on loans andadvances and is recognized on an accrual basis. Fees and direct costs relating to loan origination, re-financing or restruc-turing and to loan commitments are deferred and amortizedto Interest earned on loans and advances over the life of theloan using the straight-line method which approximates theeffective interest rate method. Fees received for commitmentswhich are not expected to result in a loan are included in Credit-related fees and commissions over the commitment period.Loan syndication fees where UBS does not retain a portion ofthe syndicated loan are credited to commission income.
q) Allowance and provision for credit lossesAn allowance for credit losses is established if there is objec-tive evidence that the Group will be unable to collect allamounts due on a claim according to the original contrac-tual terms or the equivalent value. A “claim” means a loan,a commitment such as a letter of credit, a guarantee, a com-mitment to extend credit, or other credit product.
An allowance for credit losses is reported as a reduction ofthe carrying value of a claim on the balance sheet, whereasfor an off-balance sheet item such as a commitment a provi-sion for credit loss is reported in Other liabilities. Additions tothe allowances and provisions for credit losses are madethrough credit loss expense.
Allowances and provisions for credit losses are evaluatedat a counterparty-specific level and collectively based on thefollowing principles:
Counterparty-specific: a claim is considered impaired whenmanagement determines that it is probable that the Groupwill not be able to collect all amounts due according to theoriginal contractual terms or the equivalent value.
Individual credit exposures are evaluated based upon theborrower’s character, overall financial condition, resourcesand payment record; the prospects for support from anyfinancially responsible guarantors; and, where applicable, therealizable value of any collateral.
The estimated recoverable amount is the present value,using the loan’s original effective interest rate, of expectedfuture cash flows, which may result from restructuring or liq-uidation. Impairment is measured and allowances for creditlosses are established for the difference between the carryingamount and the estimated recoverable amount.
Upon impairment, the accrual of interest income based onthe original terms of the claim is discontinued, but the increaseof the present value of impaired claims due to the passage oftime is reported as interest income.
All impaired claims are reviewed and analyzed at least an-nually. Any subsequent changes to the amounts and timing
of the expected future cash flows compared to the priorestimates will result in a change in the allowance for creditlosses and be charged or credited to credit loss expense.
An allowance for an impairment is reversed only when thecredit quality has improved such that there is reasonableassurance of timely collection of principal and interest inaccordance with the original contractual terms of the claimagreement.
A write-off is made when all or part of a claim is deemeduncollectible or forgiven. Write-offs are charged againstpreviously established allowances for credit losses or directlyto credit loss expense and reduce the principal amount ofa claim. Recoveries in part or in full of amounts previouslywritten off are credited to credit loss expense.
A loan is classified as non-performing when the paymentof interest, principal or fees is overdue by more than 90 daysand there is no firm evidence that they will be made good bylater payments or the liquidation of collateral, or when insol-vency proceedings have commenced, or when obligationshave been restructured on concessionary terms.
Collectively: all loans for which no impairment is identifiedon a counterparty-specific level are grouped into economical-ly homogeneous portfolios to collectively assess whether im-pairment exists within a portfolio. Allowances from collectiveassessment of impairment are recognized as credit lossexpense and result in an offset to the loan position. As theallowance cannot be allocated to individual loans, interest isaccrued on all loans according to contractual terms.
Where, in management’s opinion, it is probable that someclaims may be affected by systemic crisis, transfer restrictionsor non-enforceability, country allowances and provisions forprobable losses are established. They are based on country-specific scenarios, taking into consideration the nature of theindividual exposures, but excluding those amounts covered bycounterparty-specific allowances and provisions. Such coun-try allowances and provisions are part of the collectively as-sessed loan loss allowances and provisions.
r) Financial investmentsFinancial investments are classified as available-for-sale andrecorded on a settlement date basis. Available-for-sale financialinvestments are instruments which, in management’s opinion,may be sold in response to or in anticipation of needs for liq-uidity or changes in interest rates, foreign exchange rates or eq-uity prices. Financial investments consist of money market pa-per, other debt instruments and equity instruments, includingprivate equity investments.
Available-for-sale financial investments are carried at fairvalue. Unrealized gains or losses on available-for-sale invest-ments are reported in Shareholders’ equity, net of applicableincome taxes, until such investments are sold, collected orotherwise disposed of, or until such investment is determinedto be impaired. On disposal of an available-for-sale invest-ment, the accumulated unrealized gain or loss included in
94

Shareholders’ equity is transferred to net profit or loss for theperiod and reported in Other income. Gains and losses on dis-posal are determined using the average cost method.
Interest and dividend income on available-for-sale financialinvestments is included in Interest and dividend income fromfinancial investments.
If an available-for-sale investment is determined to be im-paired, the cumulative unrealized loss previously recognizedin Shareholders’ equity is included in net profit or loss for theperiod and reported in Other income. A financial investmentis considered impaired if its cost exceeds the recoverableamount. For non-quoted equity investments, the recoverableamount is determined by applying recognized valuation tech-niques. The standard method applied is based on the multipleof earnings observed in the market for comparable compa-nies. Management may adjust valuations determined in thisway based on its judgement. For quoted financial invest-ments, the recoverable amount is determined by reference tothe market price. They are considered impaired if objectiveevidence indicates that the decline in market price has reachedsuch a level that recovery of the cost value cannot be reason-ably expected within the foreseeable future.
s) Property and equipmentProperty and equipment includes own-used properties, invest-ment properties, leasehold improvements, IT, software andcommunication, plant and manufacturing equipment, andother machines and equipment.
Own-used property is defined as property held by the Groupfor use in the supply of services or for administrative purposeswhereas investment property is defined as property held to earnrentals and/or for capital appreciation. If a property of the Groupincludes a portion that is own-used and another portion that isheld to earn rentals or for capital appreciation, the classificationis based on whether or not these portions can be sold separate-ly. If the portions of the property can be sold separately they areaccounted for as own-used property and investment property. Ifthe portions cannot be sold separately, the whole property is clas-sified as own-used property unless the portion used by the bankis minor. The classification of property is reviewed on a regularbasis to account for major changes in its usage.
Leasehold improvements are investments made to cus-tomize buildings and offices occupied under operating leasecontracts to make them suitable for the intended purpose. Thepresent value of estimated reinstatement costs to bring a leasedproperty into its original condition at the end of the lease, if re-quired, is capitalized as part of the total leasehold improvementscosts. At the same time, a corresponding liability is recognizedto reflect the obligation incurred. Reinstatement costs are rec-ognized in profit and loss through depreciation of the capital-ized leasehold improvements over their estimated useful life.
Software development costs are capitalized when theymeet certain criteria relating to identifiability, it is probable thatfuture economic benefits will flow to the enterprise, and the
cost can be measured reliably. Internally developed softwaremeeting these criteria and purchased software are classifiedwithin IT, software and communication.
Plant and manufacturing equipment include primarily ther-mal and hydro power plants and power transmission grids andequipment. The useful life is estimated based on the econom-ic utilization of the asset, or for power plants on the end ofoperating life.
With the exception of investment properties, Property andequipment is carried at cost less accumulated depreciation andaccumulated impairment losses. Property and equipment isperiodically reviewed for impairment.
Property and equipment is depreciated on a straight-linebasis over its estimated useful life as follows:
Properties, excluding land Not exceeding 50 years
Leasehold improvements Residual lease term,but not exceeding 10 years
Other machines and equipment Not exceeding 10 years
IT, software and communication Not exceeding 5 years
Plant and manufacturing equipment:
– Power plants 25 to 80 years
– Transmission grids and equipment 15 to 40 years
Property formerly own-used or leased to third parties un-der an operating lease, which the Group has decided to dis-pose of, and foreclosed property are defined as Properties heldfor resale and recorded in Other assets. They are carried at thelower of cost or recoverable value.
Investment property is carried at fair value with changes infair value recognized in the income statement in the periodof change. UBS employs internal real estate experts who de-termine the fair value of investment property by applying rec-ognized valuation techniques. In cases where prices of recentmarket transactions of comparable properties are available,fair value is determined by reference to these transactions.
t) Goodwill and other intangible assetsGoodwill represents the excess of the cost of an acquisitionover the fair value of the Group’s share of net identifiableassets of the acquired entity at the date of acquisition.
Other intangible assets are comprised of separately iden-tifiable intangible items arising from acquisitions and certainpurchased trademarks and similar items.
Goodwill and other intangible assets are recognized on thebalance sheet at cost determined at the date of acquisition andare amortized using the straight-line method over their esti-mated useful economic life, not exceeding 20 years. At eachbalance sheet date, goodwill and other intangible assets arereviewed for indications of impairment or changes in estimat-ed future benefits. If such indications exist, an analysis is per-formed to assess whether the carrying amount of goodwill orother intangible assets is fully recoverable. A write-down ismade if the carrying amount exceeds the recoverable amount.
95

Financial StatementsNotes to the Financial Statements
With the introduction of IFRS 3 Business Combinationsgoodwill acquired in business combinations entered into af-ter 31 March 2004 is not amortized, but tested annually forimpairment. The impairment test is conducted at the segmentlevel as reported in Note 2. The segment has been determinedas the cash generating unit for impairment testing purposesas this is the level at which the performance of an investmentis reviewed and assessed by management. During 2004, UBSrecorded goodwill of CHF 631 million from business combi-nations entered into after 31 March 2004.
Intangible assets are classified into two categories: Infra-structure, and Customer relationships, contractual rights andother. Infrastructure includes one intangible asset recognizedin connection with the acquisition of PaineWebber Group, Inc.Customer relationships, contractual rights and other includecustomer relationship intangibles from acquisition of financialservices businesses as well as from the acquisition of Motor-Columbus, where other contractual rights from delivery andsupply contracts were identified. These contractual rights areamortized over the remaining contract terms, which are upto 25 years. The most significant contract, however, is amor-tized over its remaining contract life of seven years, which isthe shortest remaining life of all contractual rights recognized.
u) Income taxesIncome tax payable on profits is recognized as an expensebased on the applicable tax laws in each jurisdiction in theperiod in which profits arise. The tax effects of income taxlosses available for carry-forward are recognized as a deferredtax asset if it is probable that future taxable profit will be avail-able against which those losses can be utilized.
Deferred tax liabilities are recognized for temporary differ-ences between the carrying amounts of assets and liabilitiesin the balance sheet and their amounts as measured for taxpurposes, which will result in taxable amounts in future peri-ods. Deferred tax assets are recognized for temporary differ-ences which will result in deductible amounts in future peri-ods, but only to the extent it is probable that sufficient taxableprofits will be available against which these differences canbe utilized.
Deferred tax assets and liabilities are measured at the taxrates that are expected to apply in the period in which theasset will be realized or the liability will be settled based onenacted rates.
Current as well as deferred tax assets and liabilities are off-set when they arise from the same tax reporting group andrelate to the same tax authority and when the legal right tooffset exists.
Current and deferred taxes are recognized as income taxbenefit or expense except for (i) deferred taxes recognized ordisposed of upon the acquisition or disposal of a subsidiary,and (ii) unrealized gains or losses on available-for-sale invest-ments and changes in fair value of derivative instrumentsdesignated as cash flow hedges, which are recorded net of
taxes in Net gains or losses not recognized in the income state-ment within Shareholders’ equity.
v) Debt issuedDebt issued is initially measured at fair value, which is the con-sideration received, net of transaction costs incurred. Subse-quent measurement is at amortized cost, using the effectiveinterest rate method to amortize cost at inception to theredemption value over the life of the debt.
Compound debt instruments that are related to non-UBSAG equity instruments, foreign exchange, credit instrumentsor indices are considered structured instruments. If such in-struments have not been designated at fair value throughprofit and loss, the embedded derivative is separated from thehost contract and accounted for as a standalone derivative ifthe criteria for separation are met. The host contract is sub-sequently measured at amortized cost. For most of its struc-tured debt instruments, UBS has designated them as held atfair value through profit and loss, see section n).
Debt instruments with embedded derivatives that are relat-ed to UBS AG shares or to a derivative instrument that has UBSAG shares as underlying are separated into a liability and an equity component at issue date, if they require physicalsettlement. Initially, a portion of the net proceeds from issuingthe compound debt instrument is allocated to the debt com-ponent based on its fair value. The determination of fair valueis generally based on quoted market prices for UBS debt instru-ments with comparable terms. The liability component is sub-sequently measured at amortized cost. The remaining amountis allocated to the equity component and reported in Share pre-mium account. Subsequent changes in fair value of the sepa-rated equity component are not recognized. However, if thecompound instrument or the embedded derivative related toUBS AG shares is cash settled or if it contains a settlement al-ternative, then the separated derivative is accounted for as atrading instrument with changes in fair value recorded in in-come or the entire compound instrument is designated as heldat fair value through profit and loss.
It is the Group’s policy to hedge the fixed interest rate riskon debt issues (except for certain subordinated long-term noteissues, see Note 30a), and apply fair value hedge accounting.When hedge accounting is applied to fixed rate debt instru-ments, the carrying values of debt issues are adjusted forchanges in fair value related to the hedged exposure ratherthan carried at amortized cost. See o) Derivative instrumentsand hedging for further discussion.
Own bonds held as a result of market making activities ordeliberate purchases in the market are treated as a redemp-tion of debt. A gain or loss on redemption is recorded depend-ing on whether the repurchase price of the bond was loweror higher than its carrying value. A subsequent sale of ownbonds in the market is treated as a re-issuance of debt.
Interest expense on debt instruments is included in Inter-est on debt issued.
96

w) Treasury shares and contracts on UBS sharesUBS AG shares held by the Group are classified in Share-holders’ equity as Treasury shares and accounted for atweighted average cost. The difference between the proceedsfrom sales of treasury shares and their cost (net of tax, if any)is classified as Share premium.
Contracts that require physical settlement in UBS AG sharesare classified as Shareholders’ equity and reported as Share pre-mium. Upon settlement of such contracts the proceeds received,less cost (net of tax, if any), are reported as Share premium.
Contracts on UBS AG shares that require net cash settle-ment or provide for a choice of settlement are classified astrading instruments, with the changes in fair value reportedin the income statement.
An exception to this treatment is physically settled written putoptions and forward share purchase contracts, including con-tracts where physical settlement is a settlement alternative. Inboth cases the present value of the obligation to purchase ownshares in exchange for cash is transferred out of Shareholders’equity and recognized as a liability at inception of a contract. Theliability is subsequently accreted, using the effective interest ratemethod, over the life of the contract to the nominal purchaseobligation by recognizing interest expense. Upon settlement ofa contract, the liability is derecognized and the amount of equi-ty originally transferred to liability is reclassified within Sharehold-ers’ equity to Treasury shares. The premium received for writingput options is recognized directly in Share premium.
x) Retirement benefitsUBS sponsors a number of retirement benefit plans for its em-ployees worldwide. These plans include both defined benefitand defined contribution plans and various other retirementbenefits such as post-employment medical benefits. Contri-butions to defined contribution plans are expensed when em-ployees have rendered services in exchange for such contri-butions, generally in the year of contribution.
The Group uses the projected unit credit actuarial methodto determine the present value of its defined benefit plans andthe related service cost and, where applicable, past service cost.
The principal actuarial assumptions used by the actuary areset out in Note 31.
The Group recognizes a portion of its actuarial gains andlosses as income or expense if the net cumulative unrecog-nized actuarial gains and losses at the end of the previousreporting period exceeded the greater of:
a) 10% of present value of the defined benefit obligation at that date (beforededucting plan assets); and
b) 10% of the fair value of any plan assets at that date.
The unrecognized actuarial gains and losses exceeding thegreater of these two values are recognized in the income state-ment over the expected average remaining working lives ofthe employees participating in the plans.
If an excess of the fair value of the plan assets over the pres-ent value of the defined benefit obligation cannot be recov-ered fully through refunds or reductions in future contribu-tions, no gain is recognized solely as a result of deferral of anactuarial loss or past service cost in the current period or noloss is recognized solely as a result of deferral of an actuarialgain in the current period.
y) Equity participation plansUBS provides various equity participation plans in the form ofstock plans and stock option plans. UBS generally uses the in-trinsic value method of accounting for such awards. Conse-quently, compensation expense is measured as the differencebetween the quoted market price of the stock at the grantdate less the amount, if any, that the employee is required topay, or by the excess of stock price over option strike price, ifany. The Group’s policy is to recognize compensation expensefor equity awards in the performance year.
z) Earnings per share (EPS)Basic earnings per share is calculated by dividing the net prof-it or loss for the period attributable to ordinary shareholdersby the weighted average number of ordinary shares out-standing during the period.
Diluted earnings per share is computed using the samemethod as for basic EPS, but the determinants are adjusted toreflect the potential dilution that could occur if options, war-rants, convertible debt securities or other contracts to issue or-dinary shares were converted or exercised into ordinary shares.
aa) Changes in accounting policies and comparabilityFinancial instrumentsOn 1 January 2004, UBS adopted revised IAS 32 FinancialInstruments: Disclosure and Presentation and revised IAS 39 Fi-nancial Instruments: Recognition and Measurement which wereapplied retrospectively to all financial instruments affected with-in the context of the two standards with the exception of theguidance relating to derecognition of financial assets and liabil-ities and, in part, recognition of Day 1 profit and loss, which wereapplied prospectively. As a result of adopting the revised stan-dards, UBS has restated prior period comparative information.
Revised IAS 32 amended the accounting for certain deriva-tive contracts linked to an entity’s own shares. Physically settledwritten put options and forward purchase contracts with UBSshares as underlying are recorded as liabilities, see section w). UBScurrently has physically settled written put options linked to ownshares that are now accounted for as liabilities. Liabilities of CHF96 million at 31 December 2004, and CHF 49 million at 31 De-cember 2003 were debited to Shareholders’ equity due to writ-ten options. The impact on the income statement of all periodspresented is insignificant. All other existing derivative contractslinked to own shares are accounted for as derivative instrumentsand are carried at fair value on the balance sheet under Positivereplacement values or Negative replacement values.
97

Financial StatementsNotes to the Financial Statements
Revised IAS 32 provides that netting is permitted only if, inaddition to all other netting conditions, normal settlement isintended to take place on a net basis. In general, that condi-tion is not met for derivative instruments and thereforereplacement values are now reported on a gross basis. In the31 December 2003 balance sheet, replacement values of CHF165,050 million that were previously offset are now reportedgross.
Revised IAS 39 permits any financial instrument to bedesignated at inception, or at adoption of revised IAS 39, ascarried at fair value through profit and loss. Upon adoptionof revised IAS 39, UBS made that designation for the majori-ty of its compound instruments issued. Previously, UBS sepa-rated the embedded derivative from the host contract andaccounted for the separated derivative as a trading instru-ment. The amounts are now included on the balance sheetwithin the line item Financial liabilities designated at fair val-ue, with amounts of CHF 65,756 million at 31 December 2004and CHF 35,286 million at 31 December 2003 being report-ed in that new line. Also, at 31 December 2004 assets in theamount of CHF 653 million are reported in the new lineFinancial assets designated at fair value. At 31 December2003, no financial assets were designated as held at fairvalue.
The guidance governing recognition and derecognition ofa financial asset is considerably more complex under revisedIAS 39 than previously and requires a multi-step decisionprocess to determine whether derecognition is appropriate.See section d) for a discussion of the accounting policies re-garding derecognition. As a result, certain transactions arenow accounted for as secured financing transactions insteadof purchases or sales of trading portfolio assets with an ac-companying swap derivative. The provisions of this guidancewere applied prospectively as of 1 January 2004.
The effect of restating the income statement due to theadoption of revised IAS 32 and 39 on the comparative priorperiods is a reduction of net profit by CHF 82 million for 2003and a reduction of CHF 24 million for 2002.
Investment propertiesEffective 1 January 2004, UBS changed its accounting policy forinvestment property from historical cost less accumulated de-preciation to the fair value model. All changes in the fair valueof investment property are now recognized in the income state-ment, and depreciation expense is no longer recorded. Invest-ment property is defined as property held exclusively to earnrental income and benefit from appreciation in value. Fair val-ue of investment property is determined by appropriate valua-tion techniques employed in the real estate industry, taking in-to account the specific circumstances for each item. This changerequired restatement of the 2003 and 2002 comparative finan-cial years. The effects of the restatement were a reduction ofnet profit by CHF 64 million in 2003, and an increase of net prof-it by CHF 19 million in 2002.
Credit losses incurred on OTC derivativesEffective 1 January 2004, the method of accounting for credit losses incurred on over the counter (OTC) derivatives hasbeen changed. All such credit losses are now reported in net trad-ing income and are no longer reported in credit loss expense.This change did not affect net profit or earnings per share re-sults. It did, however, affect segment reporting, as losses report-ed as credit loss expense were previously deferred over a three-year period in the Business Group segment reporting, whereasunder the changed method of accounting, losses in trading in-come are not subject to such a deferral. In the segment report,therefore, losses on OTC derivatives are now reported as theyare incurred. This change in accounting method affected, to aminor extent, certain balance sheet lines at 31 December 2003,which have been restated to conform to the current year pres-entation. The changed method of accounting had the follow-ing impact on the performance before tax of our BusinessGroups: In 2003, it reduced Wealth Management & BusinessBanking’s pre-tax performance by CHF 8 million. It raised the In-vestment Bank’s by CHF 37 million while Corporate Functions’fell by CHF 29 million. In 2002, the changed method loweredthe Investment Bank’s pre-tax performance by CHF 28 millionand raised Corporate Functions’ by CHF 28 million.
Segment reportingOn 1 July 2004, UBS purchased an additional 20% interest inMotor-Columbus AG, which increased its overall ownershipstake to 55.6% percent. Motor-Columbus has been consoli-dated as of 1 July 2004, when UBS gained control over thecompany. Due to its size and nature of business – production,distribution and trading of electricity – a new business seg-ment, Industrial holdings, was added, in which Motor-Colum-bus is reported.
As at 1 January 2003, the five private label banks (three ofwhich were subsequently merged into one bank) owned byUBS were transferred out of Wealth Management & BusinessBanking into Corporate Center. At the same time, GAM wastransferred out of Global Asset Management into CorporateCenter. The two businesses formed the Private Banks & GAMsegment, whereas the remainder of Corporate Center isreported as the Corporate Functions segment. Also, WealthManagement & Business Banking is reported as two segments,Wealth Management and Business Banking Switzerland. As at1 January 2002, Wealth Management USA was separated fromInvestment Bank and became a standalone Business Group.
Note 2 to these Group Financial Statements reflects the newsegment reporting structure. In all applicable instances, prior pe-riod comparative amounts of the affected Business Groups havebeen restated to conform to the current year presentation.
Business combinationsOn 1 April 2004, UBS adopted IFRS 3 Business Combinationsfor all business combinations entered into after 31 March2004. Subsequent to the adoption of the new standard, UBS
98

has entered into and completed a number of business com-binations that were all accounted for under the new standard.The most significant change under the new standard is thatgoodwill is no longer amortized over its estimated useful lifebut instead tested annually for impairment. Accordingly, noamortization expense has been recognized for goodwill ofCHF 631 million recognized on the balance sheet related tobusiness combinations entered into after 1 April 2004. Intan-gible assets may be assigned an indefinite useful life, if sup-portable based on facts and circumstances. These intangiblesare not amortized, but tested periodically for impairment.
In a step acquisition, where control over a subsidiary isachieved in stages, or where additional shares of a subsidiaryare purchased from minority owners, all assets and liabilitiesof that entity, excluding goodwill, are remeasured to fair value as of the acquisition date of the latest share transaction.The revaluation difference on the existing ownership interestfrom the carrying value to the newly established fair value isrecorded directly in Shareholders’ equity. As a consequence ofremeasuring all assets and liabilities to fair value, minority interests are also carried at fair value of net assets excludinggoodwill. Previously, only the percentage of assets and liabili-ties was increased to fair value by which the ownership inter-est was increased. Existing ownership interests were kept attheir carryover basis. Other relevant changes in accounting forbusiness combinations are that liabilities incurred for restruc-turing and integration of newly acquired businesses must beexpensed as incurred, unless they were a pre-acquisition con-tingency of the acquired business. Previously, liabilities incurredfor restructuring and integration could be recognized in pur-chase accounting, if they met certain criteria, increasing good-will recognized. Contingent liabilities of an acquired businesshave to be recognized on the balance sheet at their fair valuein purchase accounting, if fair value is determinable. Previous-ly, contingent liabilities were not recognized.
The accounting for business combinations entered into be-fore 31 March 2004 was not affected by the new standard.
Amended IAS 19, Employee BenefitsUBS adopted in 2002 the amended standard IAS 19 Em-ployee Benefits. The amendments introduce an asset ceiling provision that applies for defined benefit plans that have a sur-plus of plan assets over benefit obligations. The implementa-tion of the amended standard had no material impact.
Change in treatment of corporate client assetsEffective 1 January 2004, UBS re-classified corporate clientassets of Business Banking Switzerland (except for pensionfunds) to exclude them from invested assets. This change wasmade because UBS has a minimal advisory role for such clientsand asset flows are often driven more by liquidity requirementsthan pure investment reasons. This change reduced investedassets at 31 December 2003 by approximately CHF 76 billionand increased net new money for 2003 by CHF 7.5 billion.
ab) International Financial Reporting Standards to beadopted in 2005IASB Improvements ProjectIn December 2003, the IASB issued 15 revised InternationalAccounting Standards under its Improvement Project in anattempt to clarify language, to remove inconsistencies andto achieve convergence with other accounting standards, no-tably US GAAP. All revised standards are effective for finan-cial years beginning on or after 1 January 2005. Two of these15 improved standards, IAS 32 and IAS 39, were adopted ear-ly at the beginning of 2004. Two of the remaining 13 im-proved standards will have a significant impact on UBS, whichare IAS 27 Consolidated and Separate Financial Statementsand IAS 28 Investments in Associates.
IAS 27 has been amended to eliminate the exemption fromconsolidating a subsidiary where control is exercised temporar-ily. UBS has several private equity investments where it owns acontrolling interest, which are classified and accounted for asFinancial investments available-for-sale, which will be requiredto be consolidated. UBS will adopt IAS 27 on 1 January 2005with retrospective restatement of comparative prior years 2004and 2003. The effect of the adoption and consolidating theseinvestments will be as follows: At 1 January 2003, equity includ-ing minority interests are reduced by CHF 723 million, repre-senting the difference between the carrying value as Financialinvestments available-for-sale and the value on a consolidatedbasis. Consolidation will lead to recognition of total assets inthe amount of CHF 1.7 billion and CHF 2.9 billion at 31 Decem-ber 2004 and 2003, respectively. Significant balance sheet lineitems affected will include Property and equipment, Intangibleassets, Goodwill and Other assets. These investments gener-ated additional income of CHF 3.8 billion and CHF 4.1 billionin 2004 and 2003, respectively and additional net profit of CHF92 million and CHF 86 million in 2004 and 2003, respectively.
IAS 28 has been amended in the same way as IAS 27 to elim-inate the exemption from equity method accounting for invest-ments that are held exclusively for disposal. UBS will adopt theIAS 28 amendment on 1 January 2005 with retrospective re-statement of comparative prior years 2004 and 2003. Certainprivate equity investments where UBS has a significant influencewill be equity accounted for commencing 1 January 2005. Ap-plying the equity method of accounting for these investmentswill have the following effects: At 1 January 2003, equity is deb-ited by CHF 266 million, representing the difference betweenthe carrying value as Financial investments available-for-sale ver-sus the value on an equity method basis. The carrying value ofthese equity method investments will be CHF 248 million andCHF 393 million at 31 December 2004 and 2003, respectively,which includes equity in losses of CHF 55 million and gains ofCHF 10 million recognized in the income statement in 2004 and2003, respectively. Gains on sale recognized in 2004 and 2003will be CHF 1 million and zero, respectively. When accountedfor as Financial investments, gains on sale recognized were CHF70 million in 2004 and CHF 34 million in 2003.
99
Financial StatementsNotes to the Financial Statements
In 2005, these entities, along with all other investmentsmade by the Private Equity business unit, will be reclassifiedfrom the Investment Bank segment to the Industrial Holdingssegment. In addition, seven of the newly consolidated invest-ments held at 1 January 2003 were sold during 2003 and2004 and will be presented as discontinued operations in therestated comparative prior periods in accordance with IFRS 5which is discussed below. Gain on sale in the amount of CHF90 million and CHF 194 million have been reported related toprivate equity investments sold in 2004 and 2003, respective-ly. On a restated basis, the net profit from discontinued oper-ations related to these entities will be CHF 145 million and CHF186 million in 2004 and 2003, respectively.
UBS also has employee benefit trusts that are used in connec-tion with share-based payment arrangements and deferred com-pensation schemes. In connection with the issuance of IFRS 2,the IFRIC amended SIC 12 Consolidation – Special Purpose En-tities, an interpretation of IAS 27, to eliminate the scope exclu-sion for equity compensation plans. Therefore, pursuant to thecriteria set out in SIC 12, an entity that controls an employee ben-efit trust (or similar entity) set up for the purposes of a share-basedpayment arrangement will be required to consolidate that trust.Consolidating these trusts will have the following effects: At 1January 2003, no adjustment to opening retained earnings ismade as assets and liabilities of the trust are equal. Consolida-tion will lead to recognition of total assets in the amount of CHF1.1 billion and CHF 1.3 billion and liabilities of CHF 1.1 billion andCHF 1.3 billion at 31 December 2004 and 2003, respectively. Theamount of treasury shares will increase by CHF 2,029 million andCHF 1,474 million at 31 December 2004 and 2003, respective-ly. The weighted average number of treasury shares held by thesetrusts was 22,995,954 in 2004 and 30,792,147 in 2003, thusdecreasing the numerator to calculate basic earnings per share.The reduction in weighted average shares outstanding will in-crease basic earnings per share, but have no impact on dilutedearnings per share, as the additional treasury shares will be fullyadded back for calculating diluted earnings per share.
All other revised standards under the Improvement Project willprimarily affect presentation and disclosure, but not recognitionand measurement of assets and liabilities, and will therefore nothave a material impact on the financial statements. The two mostsignificant presentation differences relate to minority interestsand earnings per share. Beginning 2005, Net profit and Equitywill be presented including minority interests. Net profit will beallocated to net profit attributable to UBS shareholders and at-tributable to minority interests on the face of the income state-ment. Earnings per share will continue to be presented basedon net profit attributable to UBS shareholders, but will be allo-cated to earnings per share from continuing operations and fromdiscontinued operations.
IFRS 2 Share-based PaymentIn February 2004, the IASB issued IFRS 2 Share-based Payment,which requires share-based payments made to employees and
non-employees to be recognized in the financial statementsbased on the fair value of these awards measured at the dateof grant. UBS will adopt the new standard on 1 January 2005and fully restate the two comparative prior years. In accordancewith IFRS 2, UBS will apply the new requirements of the stan-dard to all prior period awards that impact income statementscommencing 2003. This includes all unvested equity settledawards and all outstanding cash settled awards at 1 January2003. The effects of restatement are as follows: The openingbalance of retained earnings at 1 January 2003 will be credit-ed by CHF 559 million. Additional compensation expense ofzero and CHF 558 million will be recognized in 2004 and 2003,respectively. The change in compensation expense is attribut-able to the first-time recognition of compensation expense forthe fair value of share options, as well as the recognition of ex-pense for share awards over the vesting period. Previously,share awards were recognized as compensation expense in theperformance year, which is generally the year prior to grant.The reason for the zero impact in 2004 is that a significantlyhigher amount of bonus payments were made in the form ofrestricted stock rather than cash. The reversal of compensationexpense attributable to these share payments offset the effectfrom recognizing options at fair value and share awards madeprior to 2004 over the vesting period.
UBS will introduce a new valuation model to determine thefair value of share options granted in 2005 and later. Share op-tions granted in 2004 and earlier will not be affected by thischange in valuation model. As part of the implementation of IFRS2, UBS thoroughly reviewed the option valuation model em-ployed in the past by comparing it to alternative models. As a re-sult of this review, a valuation model was identified that betterreflects the exercise behavior of employees and the specific termsand conditions under which the share options are granted. Con-current with the introduction of the new model, UBS will use im-plied instead of historic volatility as input into the new model.
IFRS 3 Business Combinations, IAS 36 Impairment of Assets and IAS 38 Intangible AssetsOn 31 March 2004, the IASB issued IFRS 3 Business Combina-tions, revised IAS 36 Impairment of Assets, and revised IAS 38 Intangible Assets. UBS adopted the standards on 1 April 2004. Under the transitional requirements of IFRS 3,goodwill recognized in business combinations after 31 March2004 will no longer be amortized over its estimated useful lifebut be tested annually for impairment. Goodwill existing at 31March 2004 will cease to be amortized as of 1 January 2005and reviewed annually for impairment. UBS recorded goodwillamortization expense of CHF 713 million in 2004 and CHF 756million in 2003. Intangible assets acquired in a business com-bination must be recognized separately from goodwill, if theymeet the recognition criteria. UBS will reclassify the trainedworkforce intangible recognized in connection with the acqui-sition of PaineWebber with a book value of CHF 1,010 millionto Goodwill at 1 January 2005.
100

IFRS 4 Insurance ContractsOn 31 March 2004, the IASB issued IFRS 4 Insurance Contracts.The standard applies to all insurance contracts written and toreinsurance contracts held. It requires that insurance contractsthat include a deposit component, are separated into the de-posit and the insurance component. UBS will adopt the newstandard as of 1 January 2005 and apply it to its insurance con-tracts. The new standard will not have a material effect on thefinancial statements.
IFRS 5 Non-current Assets Held for Sale and Discontinued OperationsOn 31 March 2004, the IASB issued IFRS 5 Non-current AssetsHeld for Sale and Discontinued Operations. The standard re-quires that non-current assets or disposal groups be classifiedas held for sale if their carrying amount is recovered principal-ly through a sale transaction rather than through continuing
use. Such assets are measured at the lower of carrying amountand fair value less costs to sell and are classified separately fromother assets in the balance sheet. Netting of assets and liabil-ities is not permitted. Discontinued operations are presentedon the face of the income statement as a single amount com-prising the total of the net profit or loss of discontinued oper-ations and the after tax gain or loss recognized on the sale orthe measurement to fair value less costs to sell of the net as-sets constituting the discontinued operations.
IFRS 5 provides certain criteria to be met for a componentof an entity to be defined as a discontinued operation. Cer-tain private equity investments meet this definition and willbe reclassified as discontinued operations. UBS will adopt thenew standard on 1 January 2005 and restate comparativeprior years 2004 and 2003. While the impact on the financialstatements will not be material, the income statement will bedivided into two sections; net income from continuing oper-ations and net income from discontinued operations.
101
UBS’s financial businesses are organized on a worldwide basis into four Business Groups and the Corporate Center.Wealth Management & Business Banking is segregated into twosegments, Wealth Management and Business Banking Switzer-land. The Corporate Center also consists of two segments, Pri-vate Banks & GAM and Corporate Functions. The IndustrialHoldings segment holds all industrial operations controlled bythe Group. In total, UBS now reports eight business segments.
Wealth Management & Business BankingWealth Management & Business Banking comprises two seg-ments. Wealth Management offers a comprehensive range ofproducts and services individually tailored to affluent interna-tional and Swiss clients, operating from offices around theworld. Business Banking Switzerland provides individual andcorporate clients in Switzerland with a complete portfolio ofbanking and securities services, focused on customer serviceexcellence, profitability and growth, by using a multi-channeldistribution. The two segments share technological and phys-ical infrastructure, and have joint departments supporting major functions such as e-commerce, financial planning andwealth management, investment policy and strategy.
Global Asset ManagementGlobal Asset Management provides investment products andservices to institutional investors and wholesale intermediariesaround the globe. Clients include corporate and public pen-sion plans, financial institutions and advisors, central banks aswell as charities, foundations and individual investors.
Investment BankInvestment Bank operates globally as a client-driven invest-ment banking and securities firm providing innovative prod-
ucts, research, advice and complete access to the world’s cap-ital markets for intermediaries, governments, corporate andinstitutional clients and other parts of UBS. Investment Bankalso manages the private equity business, investing UBS andthird-party funds, primarily in unlisted companies.
Wealth Management USAWealth Management USA is a US financial services firm pro-viding sophisticated wealth management services to affluentUS clients through a highly trained financial advisor network.
Corporate CenterCorporate Center comprises two segments. Corporate Functionsensures that the Business Groups operate as a coherent and ef-fective whole with a common set of values and principles in suchareas as risk management and control, financial reporting, mar-keting and communications, funding, capital and balance sheetmanagement, management of foreign exchange earnings andinformation technology infrastructure. Private Banks & GAMholds our private label banks and GAM, which provide clientswith a complete range of private banking services in Switzer-land and specialized asset management services, respectively.
Industrial HoldingsThe Industrial Holdings segment was established in third quar-ter 2004 to house the non-financial businesses of UBS. At thisstage, results include Motor-Columbus, in which UBS acquiredan additional 20% stake on 1 July 2004, bringing the totalstake to 55.6%. Motor-Columbus is a financial holding com-pany whose only significant asset is a 59.3% interest in the AtelGroup. Atel is a European energy provider focused on domes-tic and international power generation, electricity transmission,energy services as well as electricity trading and marketing.
Note 2a Segment Reporting by Business Group

Financial StatementsNotes to the Financial Statements
102
CHF million
Income 2
Credit loss (expense) / recovery
Total operating income
Personnel expenses
General and administrative expenses
Services to / from other business units
Depreciation
Amortization of goodwill and other intangible assets 3
Goods and materials purchased
Total operating expenses
Business Group performance before tax
Tax expense
Net profit before minority interests
Minority interests
Net profit
Additional information 4
Total assets
Total liabilities and minority interests
Capital expenditure
Income 2
Adjusted expected credit loss
Total operating income
Personnel expenses
General and administrative expenses
Services to / from other business units
Depreciation
Amortization of goodwill and other intangible assets 3
Goods and materials purchased
Total operating expenses
Business Group performance before tax
Tax expense
Net profit before minority interests
Minority interests
Net profit
Note 2a Reporting by Business Group (continued)
For the year ended 31 December 2004
Internal charges and transfer pricing adjustments are reflected in the performanceof each business. Revenue-sharing agreements are used to allocate external cus-tomer revenues to a Business Group on a reasonable basis. Transactions betweenBusiness Groups are conducted at arm’s length.
Management reporting based on expected credit loss
For internal management reporting purposes, we measure credit loss using an ex-pected loss concept. This table shows Business Group performance consistent withthe way in which our businesses are managed and the way Business Group per-formance is measured. Expected credit loss reflects the average annual costs thatare expected to arise from positions in the current portfolio that become impaired.The Adjusted expected credit loss reported for each Business Group is the expect-ed credit loss on its portfolio plus the difference between Credit loss expense andexpected credit loss, amortized over a three year period. The difference betweenthese Adjusted expected credit loss figures and the Credit loss expense recordedat Group level for reporting purposes is reported in Corporate Functions.

103
IndustrialFinancial Businesses Holdings1 UBS
Wealth Management &Business Banking Corporate Center
Business Banking Global Asset Wealth Private CorporateWealth Management Switzerland Management Investment Bank Management USA Banks & GAM Functions
7,701 5,063 2,022 15,984 5,098 1,145 113 3,667 40,793
(1 ) 92 0 240 3 (58 ) 0 0 276
7,700 5,155 2,022 16,224 5,101 1,087 113 3,667 41,069
2,080 2,393 901 8,156 3,437 432 790 326 18,515
642 1,064 299 2,535 800 160 1,077 126 6,703
1,395 (533 ) 126 219 302 10 (1,519 ) 0
66 69 23 239 71 20 794 70 1,352
75 0 129 288 304 74 17 77 964
2,861 2,861
4,258 2,993 1,478 11,437 4,914 696 1,159 3,460 30,395
3,442 2,162 544 4,787 187 391 (1,046) 207 10,674
2,135
8,539
(450)
8,089
164,720 210,133 29,334 1,473,726 51,850 8,043 (210,909 ) 7,887 1,734,784
161,046 204,479 28,501 1,459,757 47,259 7,480 (216,342 ) 7,626 1,699,806
304 212 8 322 50 19 599 50 1,564
7,701 5,063 2,022 15,984 5,098 1,145 113 3,667 40,793
(8 ) (25 ) 0 (7 ) (5 ) (6 ) 327 276
7,693 5,038 2,022 15,977 5,093 1,139 440 3,667 41,069
2,080 2,393 901 8,156 3,437 432 790 326 18,515
642 1,064 299 2,535 800 160 1,077 126 6,703
1,395 (533 ) 126 219 302 10 (1,519 ) 0
66 69 23 239 71 20 794 70 1,352
75 0 129 288 304 74 17 77 964
2,861 2,861
4,258 2,993 1,478 11,437 4,914 696 1,159 3,460 30,395
3,435 2,045 544 4,540 179 443 (719) 207 10,674
2,135
8,539
(450 )
8,0891 Results shown for the six-month period beginning on 1 July 2004. 2 Impairments on private equity and other financial investments for the year ended 31 December 2004 were as follows: WealthManagement & Business Banking CHF 10 million; Global Asset Management CHF 4 million; Investment Bank CHF 170 million; Wealth Management USA CHF 39 million; Corporate Center CHF 0 million.3 For further information regarding goodwill and other intangible assets by Business Group, please see Note 15: Goodwill and Other Intangible Assets. 4 The funding surplus or requirement is reflectedin each Business Group and adjusted in Corporate Center.

Financial StatementsNotes to the Financial Statements
104
CHF million
Income1
Credit loss (expense) / recovery
Total operating income
Personnel expenses
General and administrative expenses
Services to / from other business units
Depreciation
Amortization of goodwill and other intangible assets2
Total operating expenses
Business Group performance before tax
Tax expense
Net profit before minority interests
Minority interests
Net profit
Additional information3
Total assets
Total liabilities and minority interests
Capital expenditure
Income1
Adjusted expected credit loss
Total operating income
Personnel expenses
General and administrative expenses
Services to / from other business units
Depreciation
Amortization of goodwill and other intangible assets2
Total operating expenses
Business Group performance before tax
Tax expense
Net profit before minority interests
Minority interests
Net profit
Note 2a Reporting by Business Group (continued)
For the year ended 31 December 2003
Internal charges and transfer pricing adjustments are reflected in the performanceof each business. Revenue-sharing agreements are used to allocate external cus-tomer revenues to a Business Group on a reasonable basis. Transactions betweenBusiness Groups are conducted at arm’s length.
Management reporting based on expected credit loss
For internal management reporting purposes, we measure credit loss using an ex-pected loss concept. This table shows Business Group performance consistent withthe way in which our businesses are managed and the way Business Group per-formance is measured. Expected credit loss reflects the average annual costs thatare expected to arise from positions in the current portfolio that become impaired.The Adjusted expected credit loss reported for each Business Group is the expect-ed credit loss on its portfolio plus the difference between Credit loss expense andexpected credit loss, amortized over a three year period. The difference betweenthese Adjusted expected credit loss figures and the Credit loss expense recordedat Group level for reporting purposes is reported in Corporate Functions.

105
Wealth Management &Business Banking Corporate Center
Business Banking Global Asset Wealth Private CorporateWealth Management Switzerland Management Investment Bank Management USA Banks & GAM Functions UBS
6,797 5,247 1,737 13,991 5,190 880 20 33,862
4 (71 ) 0 (4 ) (3 ) 2 0 (72 )
6,801 5,176 1,737 13,987 5,187 882 20 33,790
1,944 2,406 806 7,303 3,627 381 764 17,231
604 1,090 265 2,074 719 169 1,165 6,086
1,479 (609 ) 156 180 433 11 (1,650 ) 0
82 88 25 246 72 28 812 1,353
75 0 153 278 336 81 20 943
4,184 2,975 1,405 10,081 5,187 670 1,111 25,613
2,617 2,201 332 3,906 0 212 (1,091) 8,177
1,593
6,584
(345)
6,239
150,285 192,517 21,929 1,316,897 46,837 9,084 (187,493 ) 1,550,056
147,479 186,185 20,917 1,303,281 41,732 8,406 (193,254 ) 1,514,746
167 261 17 518 68 17 427 1,475
6,797 5,247 1,737 13,991 5,190 880 20 33,862
(4 ) (127 ) 0 (55 ) (8 ) (2 ) 124 (72 )
6,793 5,120 1,737 13,936 5,182 878 144 33,790
1,944 2,406 806 7,303 3,627 381 764 17,231
604 1,090 265 2,074 719 169 1,165 6,086
1,479 (609 ) 156 180 433 11 (1,650 ) 0
82 88 25 246 72 28 812 1,353
75 0 153 278 336 81 20 943
4,184 2,975 1,405 10,081 5,187 670 1,111 25,613
2,609 2,145 332 3,855 (5) 208 (967) 8,177
1,593
6,584
(345 )
6,2391 Impairments on private equity and other financial investments for the year ended 31 December 2003 were as follows: Wealth Management & Business Banking CHF 18 million; GlobalAsset Management CHF 2 million; Investment Bank CHF 371 million; Wealth Management USA CHF 1 million; Corporate Center CHF 149 million. 2 For further information regardinggoodwill and other intangible assets by Business Group, please see Note 15: Goodwil and Other Intangible Assets. 3 The funding surplus or requirement is reflected in each Business Groupand adjusted in Corporate Center.

Financial StatementsNotes to the Financial Statements
106
CHF million
Income1
Credit loss (expense) / recovery
Total operating income
Personnel expenses
General and administrative expenses
Services to / from other business units
Depreciation
Amortization of goodwill and other intangible assets2
Total operating expenses
Business Group performance before tax
Tax expense
Net profit before minority interests
Minority interests
Net profit
Additional information3
Total assets
Total liabilities and minority interests
Capital expenditure
Income1
Adjusted expected credit loss
Total operating income
Personnel expenses
General and administrative expenses
Services to / from other business units
Depreciation
Amortization of goodwill and other intangible assets2
Total operating expenses
Business Group performance before tax
Tax expense
Net profit before minority interests
Minority interests
Net profit
Note 2a Reporting by Business Group (continued)
For the year ended 31 December 2002
Internal charges and transfer pricing adjustments are reflected in the performanceof each business. Revenue-sharing agreements are used to allocate external cus-tomer revenues to a Business Group on a reasonable basis. Transactions betweenBusiness Groups are conducted at arm’s length.
Management reporting based on expected credit loss
For internal management reporting purposes, we measure credit loss using an ex-pected loss concept. This table shows Business Group performance consistent withthe way in which our businesses are managed and the way Business Group per-formance is measured. Expected credit loss reflects the average annual costs thatare expected to arise from positions in the current portfolio that become impaired.The Adjusted expected credit loss reported for each Business Group is the expect-ed credit loss on its portfolio plus the difference between Credit loss expense andexpected credit loss, amortized over a three year period. The difference betweenthese Adjusted expected credit loss figures and the Credit loss expense recordedat Group level for reporting purposes is reported in Corporate Functions.

107
Wealth Management &Business Banking Corporate Center
Business Banking Global Asset Wealth Private CorporateWealth Management Switzerland Management Investment Bank Management USA Banks & GAM Functions UBS
6,690 5,494 1,655 12,419 5,561 1,038 1,365 34,222
1 (239 ) 0 126 (15 ) (3 ) 15 (115 )
6,691 5,255 1,655 12,545 5,546 1,035 1,380 34,107
1,869 2,469 763 7,815 4,158 386 1,064 18,524
617 1,305 301 2,359 926 120 1,444 7,072
1,475 (638 ) 164 140 492 12 (1,645 ) 0
93 105 22 320 81 40 853 1,514
97 186 364 1,691 98 24 2,460
4,151 3,241 1,436 10,998 7,348 656 1,740 29,570
2,540 2,014 219 1,547 (1,802) 379 (360) 4,537
676
3,861
(331 )
3,530
189,061 121,661 4,428 1,099,410 39,610 7,004 (114,496 ) 1,346,678
186,346 115,926 2,937 1,087,019 33,225 6,270 (123,997 ) 1,307,726
156 224 20 473 466 37 668 2,044
6,690 5,494 1,655 12,419 5,561 1,038 1,365 34,222
(26 ) (286 ) (90 ) (13 ) (2 ) 302 (115 )
6,664 5,208 1,655 12,329 5,548 1,036 1,667 34,107
1,869 2,469 763 7,815 4,158 386 1,064 18,524
617 1,305 301 2,359 926 120 1,444 7,072
1,475 (638 ) 164 140 492 12 (1,645 ) 0
93 105 22 320 81 40 853 1,514
97 186 364 1,691 98 24 2,460
4,151 3,241 1,436 10,998 7,348 656 1,740 29,570
2,513 1,967 219 1,331 (1,800) 380 (73) 4,537
676
3,861
(331 )
3,5301 Impairments on private equity and other financial investments for the year ended 31 December 2002 were as follows: Wealth Management & Business Banking CHF 32 million; GlobalAsset Management CHF 1 million; Investment Bank CHF 1,703 million; Corporate Center CHF 208 million. 2 For further information regarding goodwill and other intangible assets byBusiness Group, please see Note 15: Goodwill and Other Intangible Assets. 3 The funding surplus or requirement is reflected in each Business Group and adjusted in Corporate Center.

Financial StatementsNotes to the Financial Statements
For the year ended 31 December 2004
Total operating income Total assets Capital expenditure
CHF million Share % CHF million Share % CHF million Share %
Switzerland 14,949 37 189,019 11 799 51
Rest of Europe /Africa /Middle East 10,379 25 564,336 32 388 25
Americas 13,615 33 829,845 48 293 19
Asia Pacific 2,126 5 151,584 9 84 5
Total 41,069 100 1,734,784 100 1,564 100
For the year ended 31 December 2003
Total operating income Total assets Capital expenditure
CHF million Share % CHF million Share % CHF million Share %
Switzerland 13,176 39 182,280 12 689 47
Rest of Europe /Africa /Middle East 5,977 18 535,501 34 242 16
Americas 12,923 38 738,189 48 510 35
Asia Pacific 1,714 5 94,086 6 34 2
Total 33,790 100 1,550,056 100 1,475 100
For the year ended 31 December 2002
Total operating income Total assets Capital expenditure
CHF million Share % CHF million Share % CHF million Share %
Switzerland 14,327 42 176,544 13 885 43
Rest of Europe /Africa /Middle East 6,816 20 363,706 27 199 10
Americas 11,055 32 719,703 54 916 45
Asia Pacific 1,909 6 86,725 6 44 2
Total 34,107 100 1,346,678 100 2,044 100
108
Note 2b Segment Reporting by Geographic Location
The geographic analysis of total assets is based on customerdomicile whereas operating income and capital expenditure isbased on the location of the office in which the transactionsand assets are recorded. Because of the global nature of finan-cial markets the Group’s business is managed on an integrat-ed basis worldwide, with a view to profitability by product line.
The geographical analysis of operating income, total assets,and capital expenditure is provided in order to comply withIFRS, and does not reflect the way the Group is managed. Man-agement believes that analysis by Business Group, as shownin Note 2a to these Financial Statements, is a more meaning-ful representation of the way in which the Group is managed.

Net interest and trading income
For the year ended % change from
CHF million 31.12.04 31.12.03 31.12.02 31.12.03
Net interest income 11,860 12,299 10,546 (4 )
Net trading income 4,972 3,756 5,451 32
Total net interest and trading income 16,832 16,055 15,997 5
Breakdown by business activity
For the year ended % change from
CHF million 31.12.04 31.12.03 31.12.02 31.12.03
Net income from interest margin products 5,139 5,077 5,275 1
Equities 3,098 2,445 2,777 27
Fixed income 6,264 6,474 5,977 (3 )
Foreign exchange 1,467 1,436 1,506 2
Other 273 326 245 (16 )
Net income from trading activities 11,102 10,681 10,505 4
Net income from treasury activities 1,298 1,417 1,646 (8 )
Other 1 (707) (1,120 ) (1,429 ) 37
Total net interest and trading income 16,832 16,055 15,997 5
1 Includes external funding costs of the PaineWebber Group, Inc. acquisition.
Net interest income
For the year ended % change from
CHF million 31.12.04 31.12.03 31.12.02 31.12.03
Interest income
Interest earned on loans and advances 9,021 10,542 11,600 (14 )
Interest earned on securities borrowed and reverse repurchase agreements 11,006 11,148 11,184 (1 )
Interest and dividend income from financial investments 93 75 165 24
Interest and dividend income from trading portfolio 19,278 18,394 17,014 5
Total 39,398 40,159 39,963 (2 )
Interest expense
Interest on amounts due to banks and customers 5,529 5,072 6,383 9
Interest on securities lent and repurchase agreements 10,014 9,623 10,081 4
Interest and dividend expense from trading portfolio 7,993 9,925 8,226 (19 )
Interest on financial liabilities designated at fair value 1,168 751 341 56
Interest on debt issued 2,834 2,489 4,386 14
Total 27,538 27,860 29,417 (1 )
Net interest income 11,860 12,299 10,546 (4 )
109
Income Statement
Note 3 Net Interest and Trading Income
Accounting standards require separate disclosure of net inter-est income and net trading income (see the second and thethird table). This required disclosure, however, does not takeinto account that net interest and trading income are gener-ated by a range of different business activities. In many cases,a particular business activity can generate both net interest andtrading income. Fixed income trading activity, for example, gen-erates both trading profits and coupon income. UBS manage-ment therefore analyzes net interest and trading income ac-
cording to the business activity generating it. The first table be-low (labeled Net interest and trading income) provides infor-mation that corresponds to this management view. For exam-ple, net income from trading activities is further broken downinto the four sub-components of Equities, Fixed income, For-eign exchange and Other. These activities generate both typesof income (interest and trading revenue) and therefore thisanalysis is not comparable to the breakdown provided in thethird table on the next page (Net trading income only).

Financial StatementsNotes to the Financial Statements
Note 3 Net Interest and Trading Income (continued)
Net trading income1
For the year ended % change from
CHF million 31.12.04 31.12.03 31.12.02 31.12.03
Equities 2,254 1,660 2,621 36
Fixed income 2 131 396 997 (67 )
Foreign exchange and other 2,587 1,700 1,833 52
Net trading income 4,972 3,756 5,451 32
1 Please refer to the table “Net Interest and Trading Income” on the previous page for the Equities, Fixed income, Foreign exchange and Other business results (for an explanation, read the correspondingintroductory comment). 2 Includes commodities trading income.
110
Included in the Net trading income table are fair value changesof CHF (1,203) million for the year ended 31 December 2004,CHF (115) million for the year ended 31 December 2003, andCHF 446 million for the year ended 31 December 2002 relat-ed to financial liabilities designated as held at fair valuethrough profit and loss. For 2004, CHF (801) million of the to-tal fair value change was attributable to changes in fair value
of embedded derivatives, while CHF (402) million was attrib-utable to changes in LIBOR. The exposure from embedded de-rivatives is economically hedged with derivatives whosechange in fair value is also reported in Net trading income, off-setting the fair value changes related to financial liabilities des-ignated as held at fair value.
Note 4 Net Fee and Commission Income
For the year ended % change from
CHF million 31.12.04 31.12.03 31.12.02 31.12.03
Equity underwriting fees 1,430 1,270 1,166 13
Bond underwriting fees 1,114 1,084 968 3
Total underwriting fees 2,544 2,354 2,134 8
Corporate finance fees 1,078 761 848 42
Brokerage fees 5,916 5,608 5,987 5
Investment fund fees 4,588 3,895 4,033 18
Fiduciary fees 220 241 300 (9 )
Custodian fees 1,261 1,201 1,302 5
Portfolio and other management and advisory fees 4,611 3,855 4,065 20
Insurance-related and other fees 342 355 417 (4 )
Total securities trading and investment activity fees 20,560 18,270 19,086 13
Credit-related fees and commissions 266 249 275 7
Commission income from other services 988 1,087 1,006 (9 )
Total fee and commission income 21,814 19,606 20,367 11
Brokerage fees paid 1,399 1,483 1,349 (6 )
Other 999 778 797 28
Total fee and commission expense 2,398 2,261 2,146 6
Net fee and commission income 19,416 17,345 18,221 12

Note 5 Other Income
For the year ended % change from
CHF million 31.12.04 31.12.03 31.12.02 31.12.03
Gains / (losses) from disposal of associates and subsidiaries
Net gain from disposal of:
Consolidated subsidiaries 83 160 228 (48 )
Investments in associates 1 2 0 (50 )
Total 84 162 228 (48 )
Financial investments available-for-sale
Net gain from disposal of:
Private equity investments 557 352 273 58
Other financial investments 46 90 457 (49 )
Impairment charges on private equity investments and other financial investments (223) (541 ) (1,944 ) 59
Total 380 (99 ) (1,214 )
Net income from investments in property 1 65 75 90 (13 )
Equity in income of associates 65 123 7 (47 )
Gains / (losses) from investment properties 2 11 (42 ) 17
Other 292 243 876 20
Total other income 897 462 4 94
1 Includes net rent received from third parties and net operating expenses. 2 Includes unrealized and realized profit from investment properties at fair value.
111
Note 6 Personnel Expenses
For the year ended % change from
CHF million 31.12.04 31.12.03 31.12.02 31.12.03
Salaries and bonuses 14,835 13,478 14,219 10
Contractors 572 539 579 6
Insurance and social contributions 1,093 923 939 18
Contribution to retirement plans 707 721 676 (2 )
Other personnel expenses 1,308 1,570 2,111 (17 )
Total personnel expenses 18,515 17,231 18,524 7
Note 7 General and Administrative Expenses
For the year ended % change from
CHF million 31.12.04 31.12.03 31.12.02 31.12.03
Occupancy 1,274 1,304 1,354 (2 )
Rent and maintenance of machines and equipment 686 708 665 (3 )
Telecommunications and postage 835 864 1,019 (3 )
Administration 660 599 819 10
Marketing and public relations 442 398 453 11
Travel and entertainment 634 526 600 21
Professional fees 705 589 568 20
IT and other outsourcing 953 844 1,036 13
Other 514 254 558 102
Total general and administrative expenses 6,703 6,086 7,072 10

Financial StatementsNotes to the Financial Statements
Note 8 Earnings per Share (EPS) and Shares Outstanding
For the year ended % change from
31.12.04 31.12.03 31.12.02 31.12.03
Basic earnings (CHF million)
Net profit 8,089 6,239 3,530 30
Diluted earnings (CHF million)
Net profit 8,089 6,239 3,530 30
Less: Profit on equity derivative contracts (5) 1 (20 )
Net profit for diluted EPS 8,084 6,240 3,510 30
Weighted average shares outstanding
Weighted average shares outstanding 1,052,914,417 1,116,953,623 1,208,586,678 (6 )
Potentially dilutive ordinary shares resulting from options and warrants outstanding 1 29,046,943 21,847,002 14,796,264 33
Weighted average shares outstanding for diluted EPS 1,081,961,360 1,138,800,625 1,223,382,942 (5 )
Earnings per share (CHF)
Basic 7.68 5.59 2.92 37
Diluted 7.47 5.48 2.87 36
1 Total equivalent shares outstanding on options that were not dilutive for the respective periods but could potentially dilute earnings per share in the future were 18,978,199, 37,234,538 and75,385,368 for the years ended 31 December 2004, 31 December 2003 and 31 December 2002, respectively.
Shares outstanding
As at % change from
31.12.04 31.12.03 31.12.02 31.12.03
Total ordinary shares issued 1,126,858,177 1,183,046,764 1,256,297,678 (5 )
Second trading line treasury shares
2002 first program 67,700,000
2002 second program 6,335,080
2003 program 56,707,000
2004 program 39,935,094
Other treasury shares 63,589,877 54,653,692 23,146,014 16
Total treasury shares 103,524,971 111,360,692 97,181,094 (7 )
Shares outstanding 1,023,333,206 1,071,686,072 1,159,116,584 (5 )
112

Note 9a Due from Banks and Loans
By type of exposure
CHF million 31.12.04 31.12.03
Banks 1 35,520 32,024
Allowance for credit losses (256) (284 )
Net due from banks 35,264 31,740
Loans
Residential mortgages 117,731 109,980
Commercial mortgages 18,950 19,162
Other Loans 98,081 86,829
Subtotal 234,762 215,971
Allowance for credit losses (2,375) (3,292 )
Net loans 232,387 212,679
Net due from banks and loans 267,651 244,419
1 Includes due from banks from Industrial Holdings in the amount of CHF 764 million.
By geographic region (based on the location of the borrower)
CHF million 31.12.04 31.12.03
Switzerland 152,433 152,358
Rest of Europe /Africa /Middle East 45,712 43,842
Americas 61,751 42,653
Asia Pacific 10,386 9,142
Subtotal 270,282 247,995
Allowance for credit losses (2,631) (3,576 )
Net due from banks and loans 267,651 244,419
By type of collateral
CHF million 31.12.04 31.12.03
Secured by real estate 138,692 130,740
Collateralized by securities 38,872 28,062
Guarantees and other collateral 18,973 18,295
Unsecured 73,745 70,898
Subtotal 270,282 247,995
Allowance for credit losses (2,631) (3,576 )
Net due from banks and loans 267,651 244,419
113
Balance Sheet: Assets

Financial StatementsNotes to the Financial Statements
Note 9b Allowances and Provisions for Credit Losses
Specific allowances Collective loan Total TotalCHF million and provisions loss provision 31.12.04 31.12.03 2
Balance at the beginning of the year1 3,692 262 3,954 5,232
Write-offs (854) (3) (857) (1,436 )
Recoveries 59 59 87
Increase / (decrease) in credit loss allowance and provision (251) (25) (276) 72
Foreign currency translation and other adjustments 30 (27) 3 (1 )
Balance at the end of the year 2,676 207 2,883 3,954
CHF million 31.12.04 31.12.03
As a reduction of Due from banks 256 284
As a reduction of Loans 2,375 3,292
As a reduction of other balance sheet positions 41 88
Subtotal 2,672 3,664
Included in other liabilities related to commitments and contingent liabilities 211 290
Total allowances and provisions for credit losses 2,883 3,954
1 Includes country provisions of CHF 183 million and CHF 262 million at 31 December 2004 and 31 December 2003 respectively. 2 Restated to reflect transfers of allowances and provisons for OTCderivatives to the trading portfolio as a reduction of fair value, following the revised treatment of OTC derivatives credit losses.
114
Note 9c Impaired Due from Banks and Loans
CHF million 31.12.04 31.12.03
Total gross impaired due from banks and loans 1, 2 4,861 7,209
Allowance for impaired due from banks 239 245
Allowance for impaired loans 2,266 3,213
Total allowances for credit losses related to impaired due from banks and loans 2,505 3,458
Average total gross impaired due from banks and loans 3 6,038 8,594
1 All impaired due from banks and loans have a specific allowance for credit losses. 2 Interest income on impaired due from banks and loans was CHF 172 million for 2004 and CHF 279 million for2003. 3 Average balances were calculated from quarterly data.
CHF million 31.12.04 31.12.03
Total gross impaired due from banks and loans 4,861 7,209
Estimated liquidation proceeds of collateral 1,758 2,465
Net impaired due from banks and loans 3,103 4,744
Specific allowances and provisions 2,505 3,458

Note 9d Non-Performing Due from Banks and Loans
115
CHF million 31.12.04 31.12.03
Total gross non-performing due from banks and loans 3,696 4,901
Total allowances for credit losses related to non-performing due from banks and loans 2,264 2,764
Average total gross non-performing due from banks and loans 1 4,338 5,410
1 Average balances are calculated from quarterly data.
CHF million 31.12.04 31.12.03
Non-performing due from banks and loans at the beginning of the year 4,901 6,000
Net additions / (reductions) (496) 317
Write-offs and disposals (709) (1,416 )
Non-performing due from banks and loans at the end of the year 3,696 4,901
By type of exposure
CHF million 31.12.04 31.12.03
Banks 242 253
Loans
Mortgages 1,011 1,470
Other 2,443 3,178
Total loans 3,454 4,648
Total non-performing due from banks and loans 3,696 4,901
By geographic region (based on the location of borrower)
CHF million 31.12.04 31.12.03
Switzerland 2,772 4,012
Rest of Europe /Africa /Middle East 607 488
Americas 220 366
Asia Pacific 97 35
Total non-performing due from banks and loans 3,696 4,901
A loan (included in due from banks or loans) is classified asnon-performing: 1) when the payment of interest, principalor fees is overdue by more than 90 days and there is no firmevidence that they will be made good by later payments or
the liquidation of collateral; 2) when insolvency proceedingshave commenced; or 3) when obligations have been restruc-tured on concessionary terms.

Financial StatementsNotes to the Financial Statements
Balance sheet assets
Cash collateral on Reverse repurchase Cash collateral on Reverse repurchasesecurities borrowed agreements securities borrowed agreements
CHF million 31.12.04 31.12.04 31.12.03 31.12.03
By counterparty
Banks 167,567 243,890 172,783 237,148
Customers 52,675 113,274 41,149 83,351
Total 220,242 357,164 213,932 320,499
Balance sheet liabilities
Cash collateral on Repurchase Cash collateral on Repurchasesecurities lent agreements securities lent agreements
CHF million 31.12.04 31.12.04 31.12.03 31.12.03
By counterparty
Banks 40,580 252,151 39,587 263,905
Customers 20,965 170,436 13,691 151,958
Total 61,545 422,587 53,278 415,863
Under reverse repurchase and securities borrowing arrangements, the Group obtains securities on terms which permit it to repledge or resell the securities to others. Amounts on such terms as at 31 December 2004 and 31 December 2003 wereas follows:
CHF million 31.12.04 31.12.03
Securities received under reverse repurchase and / or securities borrowing arrangements which can be repledged or resold 949,570 827,602
thereof repledged / transferred to others in connection with financing activities or to satisfy commitments under short sale transactions 639,865 593,049
116
Note 10 Securities Borrowing, Securities Lending, Repurchase and Reverse Repurchase Agreements
The Group enters into collateralized reverse repurchase andrepurchase agreements and securities borrowing and securi-ties lending transactions that may result in credit exposure inthe event that the counterparty to the transaction is unableto fulfill its contractual obligations. The Group controls cred-
it risk associated with these activities by monitoring counter-party credit exposure and collateral values on a daily basis andrequiring additional collateral to be deposited with or re-turned to the Group when deemed necessary.

CHF million 31.12.04 31.12.03
Trading portfolio assets
Money market paper 44,842 40,003
thereof pledged as collateral with central banks 4,706 6,208
thereof pledged as collateral and can be repledged or resold by counterparty 12,580 0
Debt instruments
Swiss government and government agencies 776 1,011
US Treasury and government agencies 92,330 92,250
Other government agencies 79,340 69,755
Corporate listed 140,500 152,413
Other unlisted 35,646 8,457
Total 348,592 323,886
thereof pledged as collateral 147,525 130,093
thereof can be repledged or resold by counterparty 120,317 104,402
Equity instruments
Listed 90,594 64,116
Unlisted 18,119 10,507
Total 108,713 74,623
thereof pledged as collateral 27,140 16,426
thereof can be repledged or resold by counterparty 26,218 16,357
Traded loans 16,077 12,650
Precious metals, commodities 1 11,150 10,610
Total trading portfolio assets 529,374 461,772
Trading portfolio liabilities
Debt instruments
Swiss government and government agencies 511 586
US Treasury and government agencies 54,848 52,377
Other government agencies 49,512 38,369
Corporate listed 27,413 13,537
Other unlisted 2,600 10,851
Total 134,884 115,720
Equity instruments 36,149 28,237
Total trading portfolio liabilities 171,033 143,957
1 Commodities basically consist of energy.
117
Note 11 Trading Portfolio
The Group trades in debt instruments (including money mar-ket paper and tradeable loans), equity instruments, precious metals, commodities and derivatives to meet the financialneeds of its customers and to generate revenue. Note 23 pro-
vides a description of the various classes of derivatives togeth-er with the related notional amounts, while Note 10 providesfurther details about cash collateral on securities borrowedand lent and repurchase and reverse repurchase agreements.

Financial StatementsNotes to the Financial Statements
Note 12 Financial Investments (available-for-sale)
CHF million 31.12.04 31.12.03
Money market paper 567 596
Other debt instruments
Listed 261 189
Unlisted 21 72
Total 282 261
Equity instruments
Listed 504 387
Unlisted 687 630
Total 1,191 1,017
Private equity investments 3,009 3,265
Total financial investments 5,049 5,139
thereof eligible for discount at central banks 86 196
The following tables show the unrealized gains and losses not recognized in the income statement for the years ended 2004and 2003:
Unrealized gains / losses not recognized in the income statement
CHF million Fair value Gross gains Gross losses Net, before tax Tax effect Net, after tax
31 December 2004
Money market paper 567 0 0 0 0 0
Debt securities issued by Swiss national government and agencies 10 1 0 1 0 1
Debt securities issued by Swiss local governments 20 1 0 1 0 1
Debt securities issued by US Treasury and agencies 0 0 0 0 0 0
Debt securities issued by foreign governments and official institutions 40 0 0 0 0 0
Corporate debt securities 140 7 (4 ) 3 0 3
Mortgage-backed securities 72 0 0 0 0 0
Other debt securities 0 0 0 0 0 0
Equity securities 1,191 455 (5 ) 450 (83 ) 367
Private equity investments 3,009 979 (44 ) 935 (89 ) 846
Total 5,049 1,443 (53) 1,390 (172) 1,218
Unrealized gains / losses not recognized in the income statement
CHF million Fair value Gross gains Gross losses Net, before tax Tax effect Net, after tax
31 December 2003
Money market paper 596 0 0 0 0 0
Debt securities issued by Swiss national government and agencies 14 2 0 2 0 2
Debt securities issued by Swiss local governments 25 0 0 0 0 0
Debt securities issued by US Treasury and agencies 0 0 0 0 0 0
Debt securities issued by foreign governments and official institutions 54 0 0 0 0 0
Corporate debt securities 156 3 (8 ) (5 ) (1 ) (6 )
Mortgage-backed securities 0 0 0 0 0 0
Other debt securities 12 0 0 0 0 0
Equity securities 1,017 296 (7 ) 289 (58 ) 231
Private equity investments 3,265 781 (216 ) 565 0 565
Total 5,139 1,082 (231) 851 (59) 792
118

Fair Value Unrealized Losses
Investments Investments Investments Investmentswith unrealized with unrealized with unrealized with unrealized
loss less than loss more than loss less than loss more thanCHF million 12 months 12 months Total 12 months 12 months Total
31 December 2004
Money market paper 0 0 0 0 0 0
Debt securities issued by the Swiss national government and agencies 0 0 0 0 0 0
Debt securities issued by Swiss local governments 0 0 0 0 0 0
Debt securities issued by US Treasury and agencies 0 0 0 0 0 0
Debt securities issued by foreign governments and official institutions 0 0 0 0 0 0
Corporate debt securities 0 0 0 0 (4 ) (4 )
Mortgage-backed securities 0 0 0 0 0 0
Other debt securities 0 0 0 0 0 0
Equity securities 1 24 25 (1 ) (4 ) (5 )
Private equity investments 424 82 506 (5 ) (39 ) (44 )
Total 425 106 531 (6) (47) (53)
Contractual maturities of the investments in debt instruments 1
Within 1 year 1–5 years 5–10 years Over 10 years
CHF million, except percentages Amount Yield (%) Amount Yield (%) Amount Yield (%) Amount Yield (%)
31 December 2004
Swiss national government and agencies 1 5.50 2 4.29 6 3.80 1 4.00
Swiss local governments 10 3.97 10 4.14 0 0 0 0
Foreign governments and official institutions 36 2.13 4 1.25 0 0 0 0
Corporate debt securities 57 2.74 50 2.92 0 0 33 0
Mortgage-backed securities 3 2.50 0 0 5 3.21 64 4.36
Other debt securities 0 0 0 0 0 0 0 0
Total fair value 107 66 11 981 Money market papers have contractual maturities of less than one year.
Proceeds from sales and maturities of investment securities available-for-sale, excluding private equity, were as follows:
CHF million 31.12.04 31.12.03
Proceeds 277 1,379
Gross realized gains 49 112
Gross realized losses (4) (23 )
119
Note 12 Financial Investments (available-for-sale) (continued)
The unrealized losses not recognized in the income statementare considered to be temporary on the basis that the invest-ments are intended to be held for a period of time sufficientto recover their cost, and UBS believes that the evidence in-dicating that the cost of the investments should be recover-able within a reasonable period of time outweighs the evi-dence to the contrary. This includes the nature of the
investments, valuations and research undertaken by UBS, thecurrent outlook for each investment, offers under negotiationat favourable prices and the duration of the unrealized losses.
The following table shows the duration of unrealized losses not recognized in the income statement for the yearended 2004:
Financial StatementsNotes to the Financial Statements
Note 13 Investments in Associates
CHF million 31.12.04 31.12.03
Carrying amount at the beginning of the year 1,616 705
Additions 1,8961 88
Disposals (684) (142 )
Transfers (378) 1,001
Income 65 123
Dividend paid (32) (30 )
Foreign currency translation (56) (129 )
Carrying amount at the end of the year 2,427 1,616
1 Additions of CHF 1,022 million due to the consolidation of Motor-Columbus.
120
Note 14 Property and Equipment
Other Plant andLeasehold IT, software machines manu-
Own used Investment improve- and com- and facturing Projects inCHF million properties properties ments munication equipment equipment progress 31.12.04 31.12.03
Historical cost
Balance at the beginning of the year 9,408 2,545 4,241 1,425 0 266 17,885 17,390
Additions 232 235 460 123 29 149 1,228 1,352
Additions from acquired companies 179 0 0 0 1,880 34 2,093 24
Disposals /write-offs 1 (436 ) (175 ) (619 ) (46 ) (11 ) (52 ) (1,339) (1,030 )
Reclassifications (60 ) 85 5 (63 ) 0 (153 ) (186) 457
Foreign currency translation 6 (100 ) (107 ) (40 ) 38 (2 ) (205) (308 )
Balance at the end of the year 9,329 2,590 3,980 1,399 1,936 242 19,476 17,885
Accumulated depreciation
Balance at the beginning of the year 4,365 1,570 3,334 1,165 0 4 10,438 9,870
Depreciation 247 201 775 68 61 1,352 1,353
Disposals /write-offs 1 (7 ) (53 ) (636 ) (43 ) (10 ) 0 (749) (936 )
Reclassifications (42 ) 2 0 1 0 (4 ) (43) 330
Foreign currency translation 0 (61 ) (98 ) (21 ) 2 0 (178) (179 )
Balance at the end of the year 4,563 1,659 3,375 1,170 53 0 10,820 10,438
Fair value 41 39 80 236
Net book value at the end of the year 2 4,766 41 931 605 229 1,883 281 8,736 7,683
1 Includes write-offs of fully depreciated assets. 2 Fire insurance value of property and equipment is CHF 15,873 million (2003: CHF 14,021 million).

Note 15 Goodwill and Other Intangible Assets
Goodwill Other intangible assets
Customerrelationships,
contractualCHF million Total Infrastructure rights and other Total 31.12.04 31.12.03
Historical cost
Balance at the beginning of the year 12,032 958 1,915 2,873 14,905 17,022
Additions and reallocations 960 0 1,531 1,531 2,491 340
Disposals and other reductions (62 ) 0 14 14 (48) (371 )
Write-offs 1 (105 ) 0 (1 ) (1 ) (106) (508 )
Foreign currency translation (966 ) (78 ) (154 ) (232 ) (1,198) (1,578 )
Balance at the end of the year 11,859 880 3,305 4,185 16,044 14,905
Accumulated amortization
Balance at the beginning of the year 2,684 152 540 692 3,376 3,326
Amortization 713 53 198 251 964 943
Disposals (9 ) 0 0 0 (9) (70 )
Write-offs 1 (105 ) 0 (1 ) (1 ) (106) (508 )
Foreign currency translation (271 ) (21 ) (38 ) (59 ) (330) (315 )
Balance at the end of the year 3,012 184 699 883 3,895 3,376
Net book value at the end of the year 8,847 696 2,606 3,302 12,149 11,529
1 Represents write-offs of fully amortized goodwill and other intangible assets.
The following table presents the disclosure of goodwill and other intangible assets by business unit for the year ended 31 December 2004.
Balance at Balance atthe beginning Additions and Disposals and Foreign currency the end
CHF million of the year reallocations other reductions Amortization translation of the year
Goodwill
Wealth Management 837 486 (5 ) (67 ) (75 ) 1,176
Business Banking Switzerland 0 0 0 0 0 0
Global Asset Management 1,401 2 (1 ) (129 ) (84 ) 1,189
Investment Bank 3,372 352 (16 ) (252 ) (257 ) 3,199
Wealth Management USA 3,315 0 (16 ) (197 ) (250 ) 2,852
Private Banks & GAM 421 0 (15 ) (68 ) (27 ) 311
Corporate Functions 2 0 0 0 (2 ) 0
Industrial Holdings 0 120 0 0 0 120
UBS 9,348 960 (53) (713) (695) 8,847
Other intangible assets
Wealth Management 4 169 0 (8 ) (6 ) 159
Business Banking Switzerland 0 0 0 0 0 0
Global Asset Management 0 0 0 0 0 0
Investment Bank 324 158 0 (36 ) (28 ) 418
Wealth Management USA 1,805 0 0 (107 ) (138 ) 1,560
Private Banks & GAM 4 0 15 (6 ) 1 14
Corporate Functions 44 0 0 (17 ) (3 ) 24
Industrial Holdings 0 1,204 (1 ) (77 ) 1 1,127
UBS 2,181 1,531 14 (251) (173) 3,302
For further information about disclosure by Business Group, including the amortization of goodwill and other intangible as-sets of previous years, please see Note 2a: Segment Reporting by Business Group.
121

Financial StatementsNotes to the Financial Statements
Note 15 Goodwill and Other Intangible Assets (continued)
The estimated, aggregated amortization expenses for other intangible assets are as follows:
CHF million Other intangible assets
Estimated, aggregated amortization expenses for:
2005 284
2006 273
2007 264
2008 252
2009 219
2010 and thereafter 1,000
Total 2,292
122
Due to the issuance of IFRS 3 Business Combinations, good-will amortization will cease from 1 January 2005. In addition,certain intangible assets will be reclassified to goodwill at 1 January 2005 and have been excluded for the purpose of
calculating estimated (aggregated) amortization expenses forOther intangible assets. See Notes 1aa) and 1ab) for furtherdetails.
Note 16 Other Assets
CHF million Note 31.12.04 31.12.03
Deferred tax assets 21 2,663 2,276
Settlement and clearing accounts 4,747 2,874
VAT and other tax receivables 326 338
Prepaid pension costs 804 862
Properties held for resale 534 754
Life insurance assets 19,224 13,544
Other receivables 6,486 4,811
Accounts receivable trade 66 0
Total other assets 34,850 25,459

Note 17 Due to Banks and Customers
CHF million 31.12.04 31.12.03
Due to banks 118,901 127,012
Due to customers in savings and investment accounts 101,081 94,914
Other amounts due to customers 275,002 251,719
Total due to customers 376,083 346,633
Total due to banks and customers 494,984 473,645
123
Balance Sheet: Liabilities
The Group issues both CHF and non-CHF denominated fixedand floating rate debt. Floating rate debt generally pays in-terest based on the three-month or six-month London Inter-bank Offered Rate (LIBOR).
Subordinated debt securities are unsecured obligations ofthe Group and are subordinated in right of payment to all pres-ent and future senior indebtedness and certain other obliga-tions of the Group. At 31 December 2004 and 31 December2003, the Group had CHF 8,605 million and CHF 8,061 mil-lion, respectively, in subordinated debt. Subordinated debtusually pays interest annually and provides for single principalpayments upon maturity.
At 31 December 2004 and 31 December 2003, the Grouphad CHF 91,427 million and CHF 57,953 million, respective-ly, in unsubordinated debt (excluding money market paper).
The Group issues debt with returns linked to equity, in-terest rates, foreign exchange and credit instruments or in-dices. As described in Note 1m), most of these debt instru-ments have been designated as held at fair value throughprofit and loss and are presented in a separate line in the bal-ance sheet. For compound debt instruments not designat-ed as held at fair value, derivatives embedded in these in-
struments are separated from the host debt contract and re-ported as stand alone derivatives, as described in Note 1o).The amount recorded within Debt Issued represents thehost contract after the separation of the embedded deriva-tive. At 31 December 2004 and 31 December 2003, theGroup had CHF 148 million and CHF 427 million, respective-ly, in bonds with attached warrants on UBS shares outstand-ing. All warrants related to those bonds issued in prior yearshave expired.
In addition, the Group uses interest rate and foreign ex-change derivatives to manage the risks inherent in certaindebt issues. In the case of interest rate risk management, theGroup applies hedge accounting as discussed in Note 1 –Summary of Significant Accounting Policies and Note 23 –Derivative Instruments. As a result of applying hedge account-ing, at 31 December 2004 and 31 December 2003, the carrying value of debt issued is CHF 349 million higher andCHF 411 million higher, respectively, reflecting changes in fairvalue due to interest rate movements.
The contractual redemption amount at maturity of finan-cial liabilities designated at fair value approximates the car-rying value at 31 December 2004.
Note 18 Financial liabilities designated at fair value and debt issued

Financial StatementsNotes to the Financial Statements
Contractual maturity dates
Total TotalCHF million, except where indicated 2005 2006 2007 2008 2009 2010–2014 Thereafter 31.12.04 31.12.03
UBS AG Parent Bank
Senior debt
Fixed rate 35,193 7,220 8,879 4,367 5,239 7,405 1,110 69,413 52,174
Interest rates (range in %) 0–19 0–16.5 0–11 0–20 0–13.5 0–15 0–10
Floating rate 6,662 1,369 1,047 527 1,622 2,435 8,923 22,585 12,542
Subordinated debt
Fixed rate 1,488 1,573 1,379 0 524 1,902 1,381 8,247 7,514
Interest rates (range in %) 4–8.75 4.25–7.25 5.75–8 5.88 3.13–4.5 7–8.75
Floating rate 0 0 0 0 0 0 342 342 506
Subtotal 43,343 10,162 11,305 4,894 7,385 11,742 11,756 100,587 72,736
Subsidiaries
Senior debt
Fixed rate 53,099 3,632 1,418 5,628 4,671 1,532 1,010 70,990 43,579
Interest rates (range in %) 0–10 0–10 0–10 0–10 0–18.5 0–35 0–35
Floating rate 718 265 314 810 426 2,121 3,227 7,881 7,773
Subordinated debt
Fixed rate 0 0 0 0 0 0 16 16 41
Interest rates (range in %) 9
Floating rate 0 0 0 0 0 0 0 0 0
Subtotal 53,817 3,897 1,732 6,438 5,097 3,653 4,253 78,887 51,393
Total 97,160 14,059 13,037 11,332 12,482 15,395 16,009 179,474 124,129
124
Note 18 Financial Liabilities Designated at Fair Value and Debt Issued (continued)
Financial liabilities designated at fair value
CHF million 31.12.04 31.12.03
Unsecuritized compound debt instruments 4,110 0
Bonds and compound debt instruments 61,646 35,286
Total 65,756 35,286
Debt issued (held at amortized cost)
CHF million 31.12.04 31.12.03
Short-term debt: Money market paper issued 79,442 58,115
Long-term debt:
Bonds
Senior 28,035 19,883
Subordinated 8,605 8,061
Shares in bond issues of the Swiss Regional or Cantonal Banks’ Central Bond Institutions 60 210
Medium-term notes 1,686 2,574
Subtotal long-term debt 38,386 30,728
Total 117,828 88,843
The following table shows the split between fixed and float-ing rate debt issues based on the contractual terms. How-ever it should be noted that the Group uses interest rate
swaps to hedge many of the fixed rate debt issues, whichchanges their re-pricing characteristics into that of floatingrate debt.
The table above indicates fixed interest rate coupons rangingfrom 0 up to 35 percent on the Group’s bonds. These high orlow coupons generally relate to structured debt issues priorto the separation of embedded derivatives. As a result, the
stated interest rate on such debt issues generally does not re-flect the effective interest rate the Group is paying to serviceits debt after the embedded derivative has been separatedand, where applicable, the application of hedge accounting.

Note 19 Other Liabilities
CHF million Note 31.12.04 31.12.03
Provisions 20 1,947 1,361
Provision for commitments and contingent liabilities 9b 211 290
Current tax liabilities 2,298 1,754
Deferred tax liabilities 21 2,984 2,208
VAT and other tax payables 520 544
Settlement and clearing accounts 2,185 2,608
Obligations under life insurance policies 22,057 13,544
Accounts payable 1,241 0
Other payables 8,899 9,051
Total other liabilities 42,342 31,360
125
Note 20 Provisions
Total TotalCHF million Operational /Other 1 Litigation 31.12.04 31.12.03
Balance at the beginning of the year 855 506 1,361 1,375
Additions from acquired companies 698 0 698 0
New provisions charged to income 127 414 541 330
Capitalized reinstatement costs 66 0 66 155
Recoveries 14 26 40 40
Provisions applied (270 ) (415 ) (685) (452 )
Foreign currency translation (37 ) (37 ) (74) (87 )
Balance at the end of the year 1,453 494 1,947 1,361
1 Comprises provisions for: contract risk related to international electricity trading business; annual cost liabilities related to power purchases from joint venture companies where production costs exceedmarket prices; reinstatement costs; subleases; and transaction process losses.
Note 21 Income Taxes
For the year ended
CHF million 31.12.04 31.12.03 31.12.02
Domestic
Current 1,336 810 938
Deferred 37 118 (34 )
Foreign
Current 796 294 249
Deferred (34) 371 (477 )
Total income tax expense 2,135 1,593 676
The Group made net tax payments, including domestic and foreign taxes, of CHF 1,336 million, CHF 1,104 million and CHF 572 million for the full years of 2004, 2003 and 2002, respectively.

Financial StatementsNotes to the Financial Statements
Note 21 Income Taxes (continued)
The components of operating profit before tax, and the differences between income tax expense reflected in the FinancialStatements and the amounts calculated at the Swiss statutory rate are as follows:
For the year ended
CHF million 31.12.04 31.12.03 31.12.02
Operating profit before tax 10,674 8,177 4,537
Domestic 6,219 5,384 6,542
Foreign 4,455 2,793 (2,005 )
Income taxes at Swiss Statutory rate of 24% in 2004, 24% in 2003 and 25% in 2002, respectively 2,561 1,962 1,134
Increase / (decrease) resulting from:
Applicable tax rates differing from Swiss statutory rate 139 (233 ) (341 )
Tax losses not recognized 103 42 51
Previously unrecorded tax losses now recognized (249) (291 ) (349 )
Lower taxed income (660) (366 ) (378 )
Non-deductible goodwill amortization 262 386 291
Other non-deductible expenses 219 186 301
Adjustments related to prior years and other (296) (191 ) (122 )
Change in deferred tax valuation allowance 56 98 89
Income tax expense 2,135 1,593 676
Significant components of the Group’s gross deferred income tax assets and liabilities are as follows:
CHF million 31.12.04 31.12.03
Deferred tax assets
Compensation and benefits 1,716 1,538
Allowance for credit losses 12 4
Net operating loss carry forwards 2,246 2,626
Trading assets 483 306
Other 874 685
Total 5,331 5,159
Valuation allowance (2,668) (2,883 )
Net deferred tax assets 2,663 2,276
Deferred tax liabilities
Property and equipment 773 307
Investments 343 390
Other provisions 313 401
Trading assets 408 348
Other 1,147 762
Total deferred tax liabilities 2,984 2,208
126
The change in the balance of net deferred tax assets and de-ferred tax liabilities does not equal the deferred tax expensein those years. This is mainly due to the impact of the acqui-
sition of Motor-Columbus, as well as the effect of foreign cur-rency rate changes on tax assets and liabilities denominatedin currencies other than CHF.

Note 21 Income Taxes (continued)
127
The carry forwards expire as follows: 31.12.04
Within 1 year 46
From 2 to 4 years 106
After 4 years 5,680
Total 5,832
Certain foreign branches and subsidiaries of the Group have de-ferred tax assets related to net operating loss carry forwards andother items. Due to realization of these assets being uncertain,the Group has established valuation allowances of CHF 2,668million (CHF 2,883 million at 31 December 2003). For compa-nies that suffered tax losses in either the current or precedingyear an amount of CHF 431 million (CHF 542 million at 31 De-cember 2003) has been recognized as deferred tax assets basedon expectations that sufficient taxable income will be generat-ed in future years to utilize the tax loss carry forwards.
The Group provides deferred income taxes on undistrib-uted earnings of non-Swiss subsidiaries except to the extent that such earnings are indefinitely invested. In the event theseearnings were distributed, additional taxes of approximatelyCHF 18 million would be due.
At 31 December 2004 net operating loss carry forwards to-taling CHF 5,832 million (not recognized as a deferred taxasset) are available to reduce taxable income of certain branch-es and subsidiaries.
Note 22 Minority Interests
CHF million 31.12.04 31.12.03
Balance at the beginning of the year 4,073 3,529
Issuance of trust preferred securities 0 372
Other increases 1,9221 573
Decreases and dividend payments (668) (357 )
Foreign currency translation (443) (389 )
Minority interest in net profit 450 345
Balance at the end of the year 5,334 4,073
1 Includes 1,742 million CHF related to the acquisition of Motor-Columbus.
Note 23 Derivative Instruments
A derivative is a financial instrument, the value of which is de-rived from the value of another (‘underlying’) financial instru-ment, an index or some other variable. Typically, the underly-ing is a share, commodity or bond price, an index value or anexchange or interest rate.
The majority of derivative contracts are negotiated as toamount (‘notional’), tenor and price between UBS and itscounterparties, whether other professionals or customers(OTC). The rest are standardized in terms of their amounts andsettlement dates and are bought and sold in organized mar-kets (exchange traded).
The ‘notional’ amount of a derivative is generally the quan-tity of the underlying instrument on which the derivative con-tract is based and is the basis upon which changes in the val-ue of the contract are measured. It provides an indication of
the underlying volume of business transacted by the Groupbut does not provide any measure of risk.
Derivative instruments are carried at fair value, shown inthe balance sheet as separate totals of Positive replacementvalues (assets) and Negative replacement values (liabilities).Positive replacement values represent the cost to the Groupof replacing all transactions with a fair value in the Group’sfavor if all the relevant counterparties of the Group were todefault at the same time, assuming transactions could be re-placed instantaneously. Negative replacement values representthe cost to the Group’s counterparties of replacing all theirtransactions with the Group with a fair value in their favor ifthe Group were to default. Positive and negative replacementvalues on different transactions are only netted if the trans-actions are with the same counterparty and the cash flows will

Financial StatementsNotes to the Financial Statements
be settled on a net basis. Changes in replacement values ofderivative instruments are recognized in trading income un-less they qualify as hedges for accounting purposes, as ex-plained in Note 1 Summary of Significant Accounting Policies,section o) Derivative instruments and hedging.
Types of derivative instrumentsThe Group uses the following derivative financial instrumentsfor both trading and hedging purposes:
Forwards and futures are contractual obligations to buy orsell financial instruments or commodities on a future date ata specified price. Forward contracts are tailor-made agree-ments that are transacted between counterparties in the over-the-counter (OTC) market, whereas futures are standardizedcontracts transacted on regulated exchanges.
Swaps are transactions in which two parties exchangecash flows on a specified notional amount for a predeterminedperiod. Most swaps are traded OTC. The major types of swaptransactions undertaken by the Group are as follows:– Interest rate swap contracts generally entail the contrac-
tual exchange of fixed and floating rate interest paymentsin a single currency, based on a notional amount and areference interest rate, e. g. LIBOR.
– Cross currency swaps involve the exchange of interest pay-ments based on two different currency principal balancesand reference interest rates and generally also entailexchange of principal amounts at the start and /or endof the contract.
– Credit default swaps (CDSs) are the most common form ofcredit derivative, under which the party buying protectionmakes one or more payments to the party selling protectionin exchange for an undertaking by the seller to make a pay-ment to the buyer following a credit event (as defined in thecontract) with respect to a third party. Settlement followinga credit event may be a net cash amount, or cash in returnfor physical delivery of one or more obligations of the creditentity (as defined in the contract) and is made regardless ofwhether the protection buyer has actually suffered a loss. Af-ter a credit event and settlement, the contract is terminated.
– Total rate of return swaps give the total return receiver ex-posure to all of the cash flows and economic benefits andrisks of an underlying asset, without having to own the as-set, in exchange for a series of payments, often based ona reference interest rate, e. g. LIBOR. The total return pay-er has an equal and opposite position.Options are contractual agreements under which, typical-
ly, the seller (writer) grants the purchaser the right, but notthe obligation, either to buy (call option) or to sell (put option)by or at a set date, a specified quantity of a financial instru-ment or commodity at a predetermined price. The purchaserpays a premium to the seller for this right. Options involvingmore complex payment structures are also transacted. Optionsmay be traded OTC or on a regulated exchange, and may betraded in the form of a security (warrant).
Derivatives transacted for trading purposesMost of the Group’s derivative transactions relate to sales andtrading activities. Sales activities include the structuring andmarketing of derivative products to customers to enable themto take, transfer, modify or reduce current or expected risks.Trading includes market-making, positioning and arbitrage ac-tivities. Market making involves quoting bid and offer pricesto other market participants with the intention of generatingrevenues based on spread and volume. Positioning meansmanaging market risk positions with the expectation of prof-iting from favorable movements in prices, rates or indices. Ar-bitrage activities involve identifying and profiting from pricedifferentials between the same product in different marketsor the same economic factor in different products.
Derivatives transacted for hedging purposesThe Group enters into derivative transactions for the purpos-es of hedging assets, liabilities, forecast transactions, cashflows and credit exposures. The accounting treatment ofhedge transactions varies according to the nature of theinstrument hedged and whether the hedge qualifies as suchfor accounting purposes.
Derivative transactions may qualify as hedges for account-ing purposes if they are fair value hedges or cash flow hedges.These are described under the corresponding headings below.The Group’s accounting policies for derivatives designated andaccounted for as hedging instruments are explained in Note1 o), Derivative instruments and hedging, where terms usedin the following sections are explained.
The Group also enters into derivative transactions whichprovide economic hedges for credit risk exposures but do notmeet the requirements for hedge accounting treatment: theGroup uses CDSs as economic hedges for credit risk exposuresin the loan and traded product portfolios but cannot applyhedge accounting to such positions.
Fair value hedgesThe Group’s fair value hedges principally consist of interest rateswaps that are used to protect against changes in the fair val-ue of fixed rate long-term debt due to movements in marketinterest rates. For the year ended 31 December 2004, theGroup recognized a net gain of CHF 22 million and in 2003a net gain of CHF 21 million, representing the ineffective por-tions, as defined in Note 1 o), of fair value hedges. The fairvalues of outstanding derivatives designated as fair valuehedges were a CHF 438 million net positive replacement val-ue at 31 December 2004 and a CHF 797 million net positivereplacement value at 31 December 2003.
Cash flow hedges of forecast transactionsThe Group is exposed to variability in future interest cashflows on non-trading assets and liabilities which bear inter-est at variable rates or which are expected to be re-fundedor reinvested in the future. The amounts and timing of fu-
128
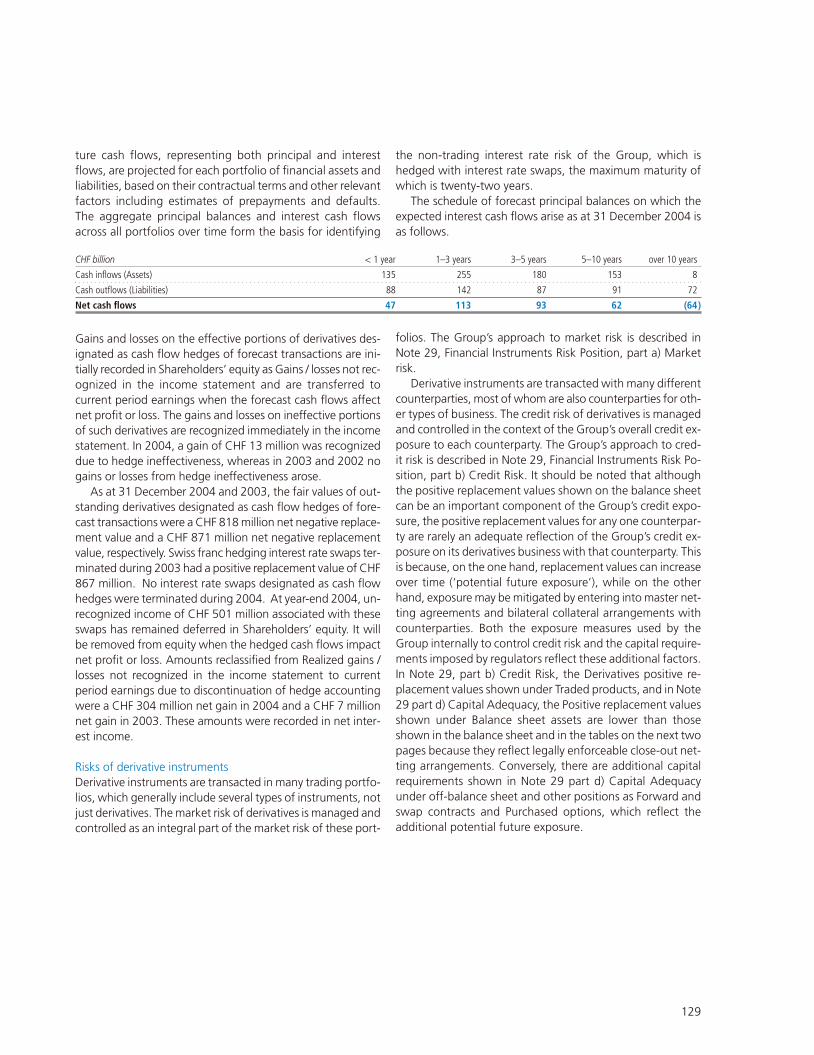
ture cash flows, representing both principal and interestflows, are projected for each portfolio of financial assets andliabilities, based on their contractual terms and other relevantfactors including estimates of prepayments and defaults.The aggregate principal balances and interest cash flowsacross all portfolios over time form the basis for identifying
the non-trading interest rate risk of the Group, which ishedged with interest rate swaps, the maximum maturity ofwhich is twenty-two years.
The schedule of forecast principal balances on which theexpected interest cash flows arise as at 31 December 2004 isas follows.
129
CHF billion < 1 year 1–3 years 3–5 years 5–10 years over 10 years
Cash inflows (Assets) 135 255 180 153 8
Cash outflows (Liabilities) 88 142 87 91 72
Net cash flows 47 113 93 62 (64)
Gains and losses on the effective portions of derivatives des-ignated as cash flow hedges of forecast transactions are ini-tially recorded in Shareholders’ equity as Gains / losses not rec-ognized in the income statement and are transferred tocurrent period earnings when the forecast cash flows affectnet profit or loss. The gains and losses on ineffective portionsof such derivatives are recognized immediately in the incomestatement. In 2004, a gain of CHF 13 million was recognizeddue to hedge ineffectiveness, whereas in 2003 and 2002 nogains or losses from hedge ineffectiveness arose.
As at 31 December 2004 and 2003, the fair values of out-standing derivatives designated as cash flow hedges of fore-cast transactions were a CHF 818 million net negative replace-ment value and a CHF 871 million net negative replacementvalue, respectively. Swiss franc hedging interest rate swaps ter-minated during 2003 had a positive replacement value of CHF867 million. No interest rate swaps designated as cash flowhedges were terminated during 2004. At year-end 2004, un-recognized income of CHF 501 million associated with theseswaps has remained deferred in Shareholders’ equity. It willbe removed from equity when the hedged cash flows impactnet profit or loss. Amounts reclassified from Realized gains /losses not recognized in the income statement to current period earnings due to discontinuation of hedge accountingwere a CHF 304 million net gain in 2004 and a CHF 7 millionnet gain in 2003. These amounts were recorded in net inter-est income.
Risks of derivative instrumentsDerivative instruments are transacted in many trading portfo-lios, which generally include several types of instruments, notjust derivatives. The market risk of derivatives is managed andcontrolled as an integral part of the market risk of these port-
folios. The Group’s approach to market risk is described inNote 29, Financial Instruments Risk Position, part a) Marketrisk.
Derivative instruments are transacted with many differentcounterparties, most of whom are also counterparties for oth-er types of business. The credit risk of derivatives is managedand controlled in the context of the Group’s overall credit ex-posure to each counterparty. The Group’s approach to cred-it risk is described in Note 29, Financial Instruments Risk Po-sition, part b) Credit Risk. It should be noted that althoughthe positive replacement values shown on the balance sheetcan be an important component of the Group’s credit expo-sure, the positive replacement values for any one counterpar-ty are rarely an adequate reflection of the Group’s credit ex-posure on its derivatives business with that counterparty. Thisis because, on the one hand, replacement values can increaseover time (‘potential future exposure’), while on the otherhand, exposure may be mitigated by entering into master net-ting agreements and bilateral collateral arrangements withcounterparties. Both the exposure measures used by theGroup internally to control credit risk and the capital require-ments imposed by regulators reflect these additional factors.In Note 29, part b) Credit Risk, the Derivatives positive re-placement values shown under Traded products, and in Note29 part d) Capital Adequacy, the Positive replacement valuesshown under Balance sheet assets are lower than thoseshown in the balance sheet and in the tables on the next twopages because they reflect legally enforceable close-out net-ting arrangements. Conversely, there are additional capital requirements shown in Note 29 part d) Capital Adequacy under off-balance sheet and other positions as Forward andswap contracts and Purchased options, which reflect the additional potential future exposure.

Financial StatementsNotes to the Financial Statements
Note 23 Derivative Instruments (continued)
TotalAs at 31 December 2004 Term to maturitynotionalWithin 3 months 3–12 months 1–5 years Over 5 years Total Total amount
CHF million PRV 1 NRV 2 PRV NRV PRV NRV PRV NRV PRV NRV CHF bn
Interest rate contracts
Over the counter (OTC) contracts
Forward contracts 440 495 112 144 58 34 90 166 700 839 843.6
Swaps 4,305 4,002 11,015 11,921 65,419 64,487 76,470 75,287 157,209 155,697 9,871.0
Options 806 722 1,845 2,239 6,553 8,292 5,942 6,479 15,146 17,732 1,181.4
Exchange-traded contracts 3
Futures 2,073.0
Options 86 87 133 103 5 5 224 195 817.9
Total 5,637 5,306 13,105 14,407 72,035 72,818 82,502 81,932 173,279 174,463 14,786.9
Credit derivative contracts
Over the counter (OTC) contracts
Credit default swaps 7 10 51 99 3,819 5,409 2,401 1,501 6,278 7,019 639.2
Total rate of return swaps 31 15 57 69 433 1,076 376 272 897 1,432 27.1
Total 38 25 108 168 4,252 6,485 2,777 1,773 7,175 8,451 666.3
Foreign exchange contracts
Over the counter (OTC) contracts
Forward contracts 3,496 4,585 807 1,316 186 449 68 240 4,557 6,590 355.6
Interest and currency swaps 27,587 28,094 15,101 14,907 20,897 15,484 7,189 7,240 70,774 65,725 2,811.4
Options 2,224 2,202 2,809 2,553 508 503 4 4 5,545 5,262 559.2
Exchange-traded contracts 3
Futures 2.9
Options 9 9 81 79 11 10 101 98 5.9
Total 33,316 34,890 18,798 18,855 21,602 16,446 7,261 7,484 80,977 77,675 3,735.0
Precious metals contracts
Over the counter (OTC) contracts
Forward contracts 130 113 150 201 447 192 9 24 736 530 13.5
Options 156 115 281 251 683 615 34 28 1,154 1,009 43.4
Exchange-traded contracts 3
Futures 0.8
Options 215 237 195 259 18 33 428 529 2.5
Total 501 465 626 711 1,148 840 43 52 2,318 2,068 60.2
Equity / index contracts
Over the counter (OTC) contracts
Forward contracts 795 506 572 419 1,912 928 129 24 3,408 1,877 103.6
Options 2,017 7,807 2,057 7,245 7,367 16,290 455 2,144 11,896 33,486 223.6
Exchange-traded contracts 3
Futures 8.1
Options 1,212 1,040 947 1,142 1,711 1,979 98 109 3,968 4,270 401.6
Total 4,024 9,353 3,576 8,806 10,990 19,197 682 2,277 19,272 39,633 736.9
Commodity contracts
Over the counter (OTC) contracts
Forward contracts 338 343 519 491 420 379 1,277 1,213 35.4
Options 76 73 85 79 118 57 279 209 4.7
Total 414 416 604 570 538 436 0 0 1,556 1,422 40.1
Total derivative instruments 43,930 50,455 36,817 43,517 110,565 116,222 93,265 93,518 284,577 303,7121 PRV: Positive replacement value. 2 NRV: Negative replacement value. 3 Exchange-traded products include proprietary trades only.
130

Note 23 Derivative Instruments (continued)
TotalAs at 31 December 2003 Term to maturitynotionalWithin 3 months 3–12 months 1–5 years Over 5 years Total Total amount
CHF million PRV 1 NRV 2 PRV NRV PRV NRV PRV NRV PRV NRV CHF bn
Interest rate contracts
Over the counter (OTC) contracts
Forward contracts 424 586 258 312 71 130 5 4 758 1,032 1,128.4
Swaps 3,831 4,388 8,698 5,991 64,216 65,075 52,019 50,517 128,764 125,971 8,065.4
Options 464 978 868 992 4,686 5,967 4,223 5,334 10,241 13,271 815.4
Exchange-traded contracts 3
Futures 243.7
Options 7 9 2 8 9 17 63.4
Total 4,726 5,961 9,826 7,303 68,973 71,172 56,247 55,855 139,772 140,291 10,316.3
Credit derivative contracts
Over the counter (OTC) contracts
Credit default swaps 109 102 39 61 3,443 3,536 1,928 1,880 5,519 5,579 289.3
Total rate of return swaps 27 2 29 576 197 470 112 305 365 1,353 12.0
Total 136 104 68 637 3,640 4,006 2,040 2,185 5,884 6,932 301.3
Foreign exchange contracts
Over the counter (OTC) contracts
Forward contracts 3,045 3,879 1,978 2,573 161 317 15 12 5,199 6,781 298.4
Interest and currency swaps 24,929 25,242 14,258 12,428 17,780 14,394 6,002 5,250 62,969 57,314 2,254.4
Options 3,232 3,348 3,211 2,550 513 356 9 1 6,965 6,255 576.8
Exchange-traded contracts 3
Futures 5.0
Options 3 3 119 116 122 119 13.2
Total 31,209 32,472 19,566 17,667 18,454 15,067 6,026 5,263 75,255 70,469 3,147.8
Precious metals contracts
Over the counter (OTC) contracts
Forward contracts 246 247 377 305 333 270 18 23 974 845 15.9
Options 304 193 308 386 668 629 116 54 1,396 1,262 35.1
Exchange-traded contracts 3
Futures 1.1
Options 9 40 21 63 3 4 33 107 2.3
Total 559 480 706 754 1,004 903 134 77 2,403 2,214 54.4
Equity / index contracts
Over the counter (OTC) contracts
Forward contracts 509 529 763 583 917 449 1,408 501 3,597 2,062 57.9
Options 1,841 2,788 3,482 7,847 11,111 13,646 1,328 4,560 17,762 28,841 213.8
Exchange-traded contracts 3
Futures 8.6
Options 708 858 892 1,363 883 768 54 117 2,537 3,106 62.6
Total 3,058 4,175 5,137 9,793 12,911 14,863 2,790 5,178 23,896 34,009 342.9
Commodity contracts
Over the counter (OTC) contracts
Forward contracts 206 181 456 424 93 42 755 647 10.6
Options 168 153 73 53 241 206 1.6
Total 374 334 529 477 93 42 0 0 996 853 12.2
Total derivative instruments 40,062 43,526 35,832 36,631 105,075 106,053 67,237 68,558 248,206 254,7681 PRV: Positive replacement value. 2 NRV: Negative replacement value. 3 Exchange-traded products include proprietary trades only.
131

Financial StatementsNotes to the Financial Statements
Note 24 Fiduciary Transactions
Fiduciary placement represents funds which customers have instructed the Group to place in foreign banks. The Group is notliable to the customer for any default by the foreign bank nor do creditors of the Group have a claim on the assets placed.
CHF million 31.12.04 31.12.03
Placements with third parties 39,588 37,851
Fiduciary credits and other fiduciary financial transactions 57 74
Total fiduciary transactions 39,645 37,925
The Group also acts in its own name as trustee or in fiduciary capacities for the account of third parties. The assets managedin such capacities are not reported on the balance sheet unless they are invested with UBS. UBS earns commission and feeincome from such transactions and assets. These activities potentially expose UBS to liability risks in cases of gross negligencewith regard to non-compliance with its fiduciary and contractual duties. The risks associated with this business are coveredby the standard UBS risk framework.
132
Off-Balance Sheet Information
Note 25 Commitments and Contingent Liabilities
The Group utilizes various lending-related financial instru-ments in order to meet the financial needs of its cus-tomers. The Group issues commitments to extend credit,standby and other letters of credit, guarantees, commitmentsto enter into repurchase agreements, note issuance facilitiesand revolving underwriting facilities. Guarantees representirrevocable assurances, subject to the satisfaction of certainconditions, that the Group will make payment in the eventthat the customer fails to fulfill its obligation to third parties.The Group also enters into commitments to extend credit inthe form of credit lines which are available to secure the liq-uidity needs of our customers, but not yet drawn upon bythem, the majority of which range in maturity from 1 monthto 5 years.
The contractual amount of these instruments is the maxi-mum amount at risk for the Group if the customer fails tomeet its obligations. The risk is similar to the risk involved in
extending loan facilities and is monitored with the same riskcontrol processes and specific credit risk policies. For the yearsended 31 December 2004, 2003 and 2002 the Group recog-nized a CHF 31 million credit loss expense, CHF 23 millioncredit loss recovery and CHF 13 million credit loss expense, re-spectively, related to obligations incurred for contingenciesand commitments.
The Group generally enters into sub-participations to mit-igate the risks from commitments and contingencies. A sub-participation is an agreement with another party to fund a por-tion of the credit facility and to take a share of the loss in theevent that the borrower fails to fulfill its obligations. TheGroup retains the contractual relationship with the borrowerand the sub-participant has only an indirect relationship withthe borrower. The Group will only enter into sub-participationagreements with banks whose rating is at least equal to orhigher than that of the borrower.

Note 25 Commitments and Contingent Liabilities (continued)
CHF million 31.12.04 31.12.03
Contingent liabilities
Credit guarantees and similar instruments 1 10,252 10,832
Sub-participations (621) (765 )
Total 9,631 10,067
Performance guarantees and similar instruments 2 2,536 2,760
Sub-participations (415) (276 )
Total 2,121 2,484
Irrevocable commitments and documentary credits 2,106 1,971
Sub-participations (272) (373 )
Total 1,834 1,598
Gross contingent liabilities 14,894 15,563
Sub-participations (1,308) (1,414 )
Net contingent liabilities 13,586 14,149
Irrevocable commitments
Undrawn irrevocable credit facilities 53,168 46,623
Sub-participations (7) (235 )
Total 53,161 46,388
Liabilities for calls on shares and other equities 19 337
Gross irrevocable commitments 53,187 46,960
Sub-participations (7) (235 )
Net irrevocable commitments 53,180 46,725
Gross commitments and contingent liabilities 68,081 62,523
Sub-participations (1,315) (1,649 )
Net commitments and contingent liabilities 66,766 60,874
Market value guarantees in form of written put options 352,509 218,638
1 Credit guarantees in the form of bills of exchange and other guarantees, including guarantees in the form of irrevocable letters of credit, endorsement liabilities from bills rediscounted, advancepayment guarantees and similar facilities. 2 Bid bonds, performance bonds, builders’ guarantees, letters of indemnity, other performance guarantees in the form of irrevocable letters of credit andsimilar facilities.
133
As part of its trading and market-making activities, UBS writesput options on a broad range of underlyings. For writing putoptions, UBS receives a premium, which is recognized as neg-ative replacement value on the balance sheet. The contractvolume of a written put option, which is the number of unitsof the underlying multiplied by the exercise price per unit, isconsidered a market price guarantee issued, because the op-tion holder is entitled to make UBS purchase the underlyingat the stated exercise price. The fair value of all written putoptions is recognized on the balance sheet as negative replace-
ment value, which is significantly lower than the underlyingtotal contract volume that represents the maximum potentialpayment UBS could be required to make upon exercise of theputs. The exposure from writing put options is managedthrough UBS’s standard risk management process at a levelthat is within the set risk limits. Accordingly, neither the un-derlying total contract volume nor the negative replacementvalue are indicative of the actual risk exposure arising fromwritten put options.

Financial StatementsNotes to the Financial Statements
Note 26 Operating Lease Commitments
At 31 December 2004, UBS was obligated under a number of non-cancellable operating leases for premises and equipmentused primarily for banking purposes. The significant premises leases usually include renewal options and escalation clausesin line with general office rental market conditions as well as rent adjustments based on price indices. However, the leaseagreements do not contain contingent rent payment clauses and purchase options. The leases also do not impose anyrestrictions on UBS’s ability to pay dividends, engage in debt financing transactions or enter into further lease agreements.
Our minimum commitments for non-cancellable leases of premises and equipment are presented as follows:
CHF million 31.12.04
Operating leases due
2005 886
2006 805
2007 719
2008 647
2009 584
2010 and thereafter 4,060
Subtotal commitments for minimum payments under operating leases 7,701
Less: Sublease rentals under non-cancellable leases 547
Net commitments for minimum payments under operating leases 7,154
Operating expenses include CHF 1,214 million and CHF 1,233 million of gross operating lease rentals which were reduced by CHF 43 million and CHF 43 million of sublease income for the years ended 31 December 2004 and 31 December 2003, respectively. Operating expenses for the year ended 31 December 2002 include CHF 1,193 million in respect of operating lease rentals.
134
Note 25 Commitments and Contingent Liabilities (continued)
CHF million Mortgage collateral Other collateral Unsecured Total
Overview of collateral
Gross contingent liabilities 347 7,661 6,886 14,894
Gross irrevocable commitments 3,252 22,384 27,532 53,168
Liabilities for calls on shares and other equities 0 0 19 19
Total 31.12.04 3,599 30,045 34,437 68,081
Total 31.12.03 2,637 30,870 29,016 62,523
Other commitmentsThe Group enters into commitments to fund external private equity funds and investments, which typically expire within fiveyears. The commitments themselves do not involve credit or market risk as the funds purchase investments at market valueat the time the commitments are drawn. The maximum amount available to fund these investments at 31 December 2004and 31 December 2003 was CHF 1,019 million and CHF 1,537 million, respectively.

Note 27 Pledged Assets
Assets are pledged as collateral for collateralized credit lines with central banks, loans from central mortgage institutions, de-posit guarantees for savings banks, security deposits relating to stock exchange membership and mortgages on the Group’s property. No financial assets are pledged for contingent liabilities. The following table shows additional informationabout assets pledged or assigned as security for liabilities and assets subject to reservation of title for the years ended 31 December 2004 and 31 December 2003.
Carrying amount Related liability Carrying amount Related liabilityCHF million 31.12.04 31.12.04 31.12.03 31.12.03
Mortgage loans 175 60 428 209
Securities 193,028 131,462 157,639 121,984
Property and equipment 320 0 0 0
Total pledged assets 193,523 131,522 158,067 122,193
135
Note 28 Litigation
Due to the nature of their business, the bank and other com-panies within the UBS Group are involved in various claims,disputes and legal proceedings, arising in the ordinary courseof business. The Group makes provisions for such matterswhen, in the opinion of management and its professional ad-visors, it is probable that a payment will be made by the Group,and the amount can be reasonably estimated (see Note 20).
In respect of the further claims asserted against the Groupof which management is aware (and which, according to theprinciples outlined above, have not been provided for), it isthe opinion of the management that such claims are eitherwithout merit, can be successfully defended or will not havea material adverse effect on the Group’s financial condition,results of operations or liquidity.
Note 29 Financial Instruments Risk Position
This section presents information about UBS’s exposure to andits management and control of risks, in particular the primaryrisks associated with its use of financial instruments:– market risk (part a) is exposure to market variables such as
interest rates, exchange rates and equity markets– credit risk (part b) is the risk of loss resulting from client or
counterparty default and arises on credit exposure in allforms, including settlement risk
– liquidity and funding risk (part c) is the risk that UBS is un-able to meet its payment obligations when due, or that itis unable, on an ongoing basis, to borrow funds in the mar-ket on an unsecured, or even secured basis at an accept-able price to fund actual or proposed commitments.Part d) presents and explains the Group’s regulatory capi-
tal position.
Sections a) to d) generally refer only to UBS’s financial busi-nesses, while section e) covers the financial instruments riskpositions of the industrial holding Motor-Columbus throughits operating subsidiary Atel. The tables in this note which arebased on risk information include only the financial business-es of the Group. Those which present an analysis of the wholebalance sheet include the positions of Motor-Columbus.
It should be noted that, in management’s view, any repre-sentation of risk at a specific date offers only a snapshot ofthe risks taken, since both trading and non-trading positionscan vary significantly on a daily basis, because they are active-ly managed. As such, it may not be representative of the lev-el of risk at other times.
Additional Information

Financial StatementsNotes to the Financial Statements
Note 29 Financial Instruments Risk Position (continued)a) Market Risk
136
(i) OverviewMarket risk is the risk of loss arising from movements in mar-ket variables including observable variables such as interestrates, exchange rates and equity markets, and others whichmay be only indirectly observable such as volatilities and cor-relations. The risk of price movements on securities and oth-er obligations in tradable form resulting from general creditand country risk factors and events specific to individual issuersis also considered market risk.
Market risk is incurred in UBS primarily through trading ac-tivities, which are centered in the Investment Bank but alsoarise, to a much lesser extent, in the Wealth Managementbusinesses. It arises from market making, client facilitation andproprietary positions in equities, fixed income and interest rateproducts, foreign exchange and, to a lesser extent, preciousmetals and energy.
Additionally, Group Treasury assumes material non-tradingmarket risk positions that arise from its balance sheet and cap-ital management activities. There are also smaller non-trad-ing market risk positions, predominantly interest rate risks, inthe other Business Groups.
Each Business Group has a Chief Risk Officer (CRO), report-ing functionally to the Group CRO, responsible for independ-ent risk control of market risk.
Market risk authority, including both approval of marketrisk limits and approval of market risks in large or complextransactions and securities underwritings, is exercised by theChairman’s Office and the GEB and is further delegated onan ad personam basis to the Group CRO and Market Risk Of-ficers within the Business Groups.
Market risk measures and controls are applied to all trad-ing activities, to foreign exchange, precious metal and ener-gy exposures wherever they arise, and to interest rate risk inthe banking books of all Business Groups including GroupTreasury and the independent private banks.
The principal portfolio risk measures and limits on marketrisk are Value at Risk (VaR) and stress loss. VaR is an estimateof the potential loss on the current portfolio from adverse mar-ket movements, based on historical market movements, as-suming a specified time horizon before positions can be ad-justed (holding period), and expressed as the maximumpotential loss that, with a specified level of confidence (prob-ability), will not be exceeded. Stress loss is assessed against aset of forward-looking scenarios using stress moves in mar-ket variables, which are regularly reviewed. Complementarycontrols are also applied, where appropriate, to prevent un-due concentrations, taking into account variations in pricevolatility and market depth and liquidity. They include controlson exposure to individual market risk variables, such as indi-vidual interest or exchange rates, and on positions in the se-curities of individual issuers (’issuer risk’).
(ii) Interest Rate RiskInterest rate risk is the risk of loss resulting from changes ininterest rates. It is controlled primarily through the limit struc-ture described in (a) (i) above. Exposure to interest rate move-ments can be expressed for all interest rate sensitive positions,whether marked to market or subject to amortized cost ac-counting, as the impact on their fair values of a one basis point(0.01%) change in interest rates. This sensitivity, analyzed bytime band, is set out below. Interest rate sensitivity is one ofthe inputs to the VaR model.
The table sets out the extent to which UBS was exposedto interest rate risk at 31 December 2004 and 2003. It showsthe net impact of a one basis point (0.01%) increase in mar-ket interest rates across all time bands on the fair values of in-terest rate sensitive positions, both on- and off-balance sheet.The impact of such an increase in interest rates depends onUBS’s net asset or net liability position in each category, cur-rency and time band in the table. A negative amount in thetable reflects a potential reduction in fair value, while a posi-tive amount reflects a potential increase in fair value.

Note 29 Financial Instruments Risk Position (continued)a) Market Risk (continued)
Interest rate sensitivity position1
Interest rate sensitivity by time bands at 31.12.04
Within 1 1 to 3 3 to 12 1 to 5 Over 5CHF thousand gain / (loss) per basis point increase month months months years years Total
CHF Trading 65 69 (83 ) 24 120 195
Non-trading (203 ) (13 ) (313 ) (3,575 ) (2,641 ) (6,745)
USD Trading 49 (236 ) (1,184 ) 886 127 (358)
Non-trading 30 (158 ) (121 ) (2,010 ) (2,472 ) (4,731)
EUR Trading 192 (276 ) 342 (366 ) (814 ) (922)
Non-trading (8 ) 1 (22 ) (180 ) (200 ) (409)
GBP Trading (19 ) 52 60 (380 ) (32 ) (319)
Non-trading (1 ) (7 ) (34 ) (290 ) 270 (62)
JPY Trading (17 ) 630 (562 ) (1,804 ) 781 (972)
Non-trading (1 ) 1 (1 ) (4 ) (1 ) (6)
Other Trading 75 (121 ) (8 ) 5 145 96
Non-trading (1 ) 1 1 (1 ) (2 ) (2)
Interest rate sensitivity by time bands at 31.12.03
Within 1 1 to 3 3 to 12 1 to 5 Over 5CHF thousand gain / (loss) per basis point increase month months months years years Total
CHF Trading 19 (185 ) (6 ) 311 (91 ) 48
Non-trading (38 ) (99 ) (359 ) (4,288 ) (3,587 ) (8,371)
USD Trading (17 ) (690 ) (638 ) (941 ) 1,190 (1,096)
Non-trading 50 (55 ) (92 ) (2,213 ) (1,702 ) (4,012)
EUR Trading (84 ) (206 ) 398 (1,018 ) 649 (261)
Non-trading 4 6 (21 ) (131 ) (196 ) (338)
GBP Trading 24 31 131 (736 ) 536 (14)
Non-trading 0 (10 ) (55 ) (40 ) 481 376
JPY Trading 59 (326 ) (34 ) 410 (273 ) (164)
Non-trading (4 ) 3 (1 ) (5 ) (2 ) (9)
Other Trading (43 ) 22 80 (464 ) 335 (70)
Non-trading (1 ) 0 (6 ) (1 ) (3 ) (11)1 Positions in Industrial Holdings are excluded.
137
Positions shown as ’trading’ are those which contribute tomarket risk regulatory capital, i. e. those considered ’tradingbook’ for regulatory capital purposes (see section d). ’Non-trading’ includes all other interest rate sensitive assets andliabilities including derivatives designated as hedges for ac-counting purposes (as explained in Note 23) and off balancesheet commitments on which an interest rate has beenfixed. This distinction differs somewhat from the account-ing classification of trading and non-trading assets and lia-bilities.
Details of money market paper and debt instruments de-fined as trading portfolio for accounting purposes are includ-ed in Note 11 and of debt instruments defined as financialinvestments for accounting purposes in Note 12. Details of de-rivatives are shown in Note 23, but it should be noted that in-terest rate risk arises not only on interest rate contracts butalso on other forwards, swaps and options, in particular on
forward foreign exchange contracts. Off-balance sheet com-mitments on which an interest rate has been fixed are prima-rily forward starting fixed term loans.
TradingThe major part of this risk arises in the Investment Bank’s FixedIncome Rates and Currencies business.
Non-tradingInterest rate risk is inherent in many of UBS’s businesses andarises from factors such as differences in timing betweencontractual maturity or re-pricing of assets, liabilities and de-rivative instruments.
Most non-trading interest rate risk is captured at the pointof business origination and transferred to a risk managementunit – primarily the Cash and Collateral Trading unit of the In-vestment Bank or Group Treasury – where it is managed with-

Financial StatementsNotes to the Financial Statements
in the market risk limits described in (a)(i). The margin risks em-bedded in retail products remain with, and are subject to ad-ditional analysis and control by, the originating business units.
Many client products have no contractual maturity date ordirectly market-linked rate. Their interest rate risk is transferredon a pooled basis through “replication” portfolios – portfo-lios of revolving transactions between the originating businessunit and Group Treasury at market rates designed to approx-imate their average cash flow and re-pricing behavior. Thestructure and parameters of the replication portfolios are setin accordance with long-term observations of market andclient behavior, and are reviewed periodically.
Interest rate risk also arises from balance sheet items suchas the financing of bank property and investments in equityof associated companies, and from the investment of theGroup’s equity. The risk on these items is also transferred toGroup Treasury, through replicating portfolios designed to ap-proximate the desired funding or investment profile.
The Group’s equity is invested at longer-term fixed interestrates in CHF, USD, EUR and GBP with an average duration ofbetween three and four years, in line with strategic investmenttargets set by the Group Executive Board (GEB). These invest-ments account for CHF 12.6 million of the non-trading inter-est rate sensitivity, with CHF 6.6 million arising in CHF, CHF5.0 million in USD and the remainder in EUR and GBP. The in-terest rate sensitivity of these investments is directly relatedto the chosen investment duration and it should be recognizedthat, although investing in significantly shorter maturitieswould lead to a reduction in apparent interest rate sensitivi-ty, it would lead to higher volatility in interest earnings.
(iii) Currency RiskCurrency risk is the risk of loss resulting from changes inexchange rates.
TradingUBS is an active participant in currency markets and carries cur-rency risk from these trading activities, conducted primarily inthe Investment Bank. These trading exposures are subject toVaR, stress and concentration limits as described in (a)(i). De-tails of foreign exchange contracts, most of which arise fromtrading activities and contribute to currency risk, are shownin Note 23.
Non-TradingUBS’s reporting currency is the Swiss franc but its assets, lia-bilities, income and expense are denominated in many cur-rencies, with significant amounts in USD, EUR and GBP, as wellas CHF.
Reported profits or losses are exchanged monthly intoCHF, reducing volatility in the Group’s earnings from subse-
quent changes in exchange rates. Group Treasury also, fromtime to time, proactively hedges significant expected foreigncurrency earnings / costs (mainly USD, EUR and GBP) withina time horizon up to one year, in accordance with the instruc-tions of the GEB and subject to its VaR limit. Economic hedg-ing strategies employed include a cost-efficient option strat-egy, providing a safety net against unfavorable currencyfluctuations while preserving upside potential.
The Group’s equity is invested in a diversified portfoliobroadly reflecting the currency distribution of its risk-weight-ed assets in CHF, USD, EUR and GBP. This creates structuralforeign currency exposures, the gains or losses on which arerecorded through equity, leading to fluctuations in UBS’s cap-ital base in line with the fluctuations in risk-weighted assets,thereby protecting the BIS Tier 1 capital ratio.
At 31 December 2004, the largest combined trading andnon-trading currency exposures against the Swiss franc werein USD (short USD 224 million), EUR (short EUR 664 million)and GBP (long GBP 221 million). At 31 December 2003 thelargest exposures were in USD (short USD 723 million), EUR(long EUR 71 million) and GBP (short GBP 40 million).
(iv) Equity RiskEquity risk is the risk of loss resulting from changes in the lev-els of equity indices and values of individual stocks.
The Investment Bank is a significant player in major equi-ty markets and carries equity risk from these activities. Theseexposures are subject to VaR, stress and concentration limitsas described in (a)(i) and, in the case of individual stocks, toissuer risk controls as described in (a)(v).
Details of equities defined as trading portfolio for account-ing purposes are given in Note 11. Details of equity deriva-tives contracts (on indices and individual equities), which ariseprimarily from the Investment Bank’s trading activities, areshown in Note 23.
(v) Issuer RiskThe values of tradable assets – equities, bonds and otherdebt instruments (including money market paper and trad-able loans) held for trading – are affected by factors specif-ic to individual issuers as well as general market moves. Thiscan include short-term factors influencing price but alsomore fundamental causes including severe financial deteri-oration.
As an active trader and market maker in equities, bondsand other securities, the Investment Bank holds positions intradable assets, which are not only included in VaR but alsosubject to concentration limits on exposure to individual is-suers. This includes both exposures arising from physicalholdings, and exposures from derivatives based on suchassets.
138
Note 29 Financial Instruments Risk Position (continued)a) Market Risk (continued)

Credit risk represents the loss which UBS would suffer if a clientor counterparty failed to meet its contractual obligations. It isinherent in traditional banking products – loans, commitmentsto lend and other contingent liabilities, such as letters of cred-it – and in traded products – derivative contracts such as for-wards, swaps and options, and repo and securities borrowingand lending transactions. Some of these products are account-ed for on an amortized cost basis while others are recorded inthe financial statements at fair value. Banking products aregenerally carried at amortized cost, but loans which have beenoriginated by the Group for subsequent syndication or distri-bution through the cash markets, are carried at fair value. With-in traded products, OTC derivatives are carried at fair value,while repos and securities borrowing and lending transactionsare accounted for on an amortized cost basis. Regardless ofthe accounting treatment, all banking and traded products arecontrolled under the same credit risk framework.
All Business Groups taking material credit risk have inde-pendent credit risk control functions headed by Chief CreditOfficers (CCOs) reporting functionally to the Group CCO. Theyare responsible for the independent control of credit risk in-cluding counterparty ratings and credit risk assessment. Cred-it risk authority, including authority to establish allowances andprovisions and credit valuation adjustments for impairedclaims, is exercised by the Chairman’s Office and the GEB andis further delegated on an ad personam basis to the GroupCCO and to Credit Officers within the Business Groups.
For credit control purposes, credit exposure is measured forbanking products as the face value amount. For traded prod-ucts, credit exposure is measured as the current replacementvalue of contracts plus potential future changes in replace-
ment value, taking account of master netting agreements withindividual counterparties where they are considered enforce-able in insolvency. UBS is an active user of credit derivativesto hedge credit risk on individual names and on a portfoliobasis in banking and traded products. In line with general mar-ket trends, UBS has also entered into bilateral collateral agree-ments with market participants to mitigate credit risk on OTCderivatives. Individual hedges and collateral arrangements arereflected in our internal credit exposure measurement, andcredit limits are applied on this basis.
In the table, the amounts shown as credit exposure differsomewhat from the internal credit view. For banking products,they are based on the accounting view, which, for example,does not reflect risk reduction resulting from credit hedges andcollateral received, but does include cash collateral posted byUBS against negative replacement values on derivatives. Fortraded products, positive and negative replacement values areshown net only where permitted for regulatory capital purpos-es (consistent with the table in part d) Capital Adequacy), andpotential future exposure is not included. This in turn differsfrom the accounting treatment of traded products in severalrespects. OTC derivatives are represented on the balance sheetby positive and negative replacement values, which are nettedonly if the cash flows will actually be settled net, which is notgenerally the case – for details see Note 23. Securities borrow-ing and lending transactions are represented on the balancesheet by the gross values of cash collateral placed with or re-ceived from counterparties while repos / reverse repos are rep-resented by the gross amounts of the forward commitments– for details see Note 10 – the credit exposure generally beingonly a small percentage of these balance sheet amounts.
139
Note 29 Financial Instruments Risk Position (continued)b) Credit Risk
Breakdown of credit exposure 1
Amounts for each product type are shown gross before allowances and provisions.
CHF million 31.12.04 31.12.03
Banking products
Loans to customers and due from banks 2 269,518 247,995
Contingent liabilities (gross – before participations) 3 14,894 15,563
Undrawn irrevocable credit facilities (gross – before participations) 3 53,168 46,623
Traded products 4
Derivatives positive replacement values (before collateral but after netting) 5 78,317 84,334
Securities borrowing and lending, repos and reverse repos 6, 7 24,768 30,833
Allowances and provisions 8 (2,883) (3,954 )
Total credit exposure net of allowances and provisions 437,782 421,394
1 Positions in Industrial Holdings are excluded. 2 See Note 9a – Due from Banks and Loans for further information. 3 See Note 25 – Commitments and Contingent Liabilities for further information.4 Does not include potential future credit exposure arising from changes in value of products with variable value. Potential future credit exposure is, however, included in internal measures of creditexposure for risk management and control purposes. 5 Replacement values are shown net where netting is permitted for regulatory capital purposes. See also Note 23 – Derivative Instruments forfurther information. 6 This figure represents the difference in value between the cash or securities lent or given as collateral to counterparties, and the value of cash or securities borrowed or taken ascollateral from the same counterparties under stock borrow / lend and repo / reverse repo transactions. 7 See Note 10 – Securities Borrowing, Securities Lending, Repurchase and Reverse RepurchaseAgreements for further information about these types of transactions. 8 See Note 9b – Allowances and Provisions for Credit Losses for further information.

UBS manages and controls concentrations of credit risk wher-ever they are identified, in particular to individual counterpar-ties and groups, and to industries and countries. UBS sets lim-its on its credit exposure to both individual counterparties andcounterparty groups. Concentrations of credit risk exist ifclients are engaged in similar activities, or are located in thesame geographic region or have comparable economic char-acteristics such that their ability to meet contractual obliga-tions would be similarly affected by changes in economic, po-litical or other conditions. Stress measures are applied toassess the impact of variations in default rates and asset val-ues, taking into account risk concentrations in each portfo-lio. Stress loss limits are applied where considered necessary,including limits on credit exposure to all but the best-ratedcountries. With the exceptions of private households (CHF135,397 million), banks and financial institutions (CHF 75,311million) and real estate and rentals in Switzerland (CHF 11,466million), there are no material concentrations of loans at 31December 2004, and the vast majority of those to privatehouseholds and to real estate and rentals are secured. Deriv-atives exposure is predominantly to investment grade banksand financial institutions.
Impaired claimsUBS classifies a claim as impaired if it considers that it will suf-fer a loss on that claim as a result of the obligor’s inability tomeet its commitments (including interest payments, principalrepayments or other payments due, for example on a deriva-tive product or under a guarantee) according to the contrac-tual terms, and after realization of any available collateral.Loans are further classified as non-performing where paymentof interest, principal or fees is overdue by more than 90 daysand there is no firm evidence that they will be made good bylater payments or the liquidation of collateral, or where insol-vency proceedings have commenced or obligations have beenrestructured on concessionary terms.
The recognition of impairment in the financial statementsdepends on the accounting treatment of the claim. For prod-ucts accounted for on an amortized cost basis, impairment isrecognized through the creation of a provision or allowance,which is charged to the income statement as credit loss ex-pense. Allowances or provisions are determined such that thecarrying values of impaired claims are consistent with the prin-
ciples of IAS 39. For products recorded at fair value, impair-ment is recognized through a credit valuation adjustment,which is charged to the income statement through the nettrading income line.
UBS also assesses portfolios of claims with similar credit riskcharacteristics for collective impairment in accordance withIAS 39 (amortized cost products only). A portfolio is consid-ered impaired on a collective basis if there is objective evidenceto suggest that it contains impaired obligations but the indi-vidual impaired items cannot yet be identified.
For further information about accounting policy for al-lowances and provisions for credit losses see Note 1q). For theamounts of allowance and provision for credit losses andamounts of impaired and non-performing loans, see Note 9b), c) and d). It should be noted that allowances and provi-sions for collective impairment are included in the total of al-lowances and provisions in the table on the previous page, andin notes 9a and 9b, but that portfolios against which collec-tive loan loss provisions have been established are not includ-ed in the totals of impaired loans in Note 9c.
The occurrence of credit losses is erratic in both timing andamount and those that arise usually relate to transactions en-tered into in previous accounting periods. In order to reflectthe fact that future credit losses are implicit in the current port-folio, and to encourage risk-adjusted pricing for products car-ried at amortized cost, UBS uses the concept of ’expected loss’for management purposes. Expected loss is a forward look-ing, statistically based concept which is used to estimate theannual costs that will arise, on average over time, from posi-tions in the current portfolio that become impaired. It is de-rived from the probability of default (given by the counterpar-ty rating), current and likely future exposure to thecounterparty and the likely severity of the loss should defaultoccur. Note 2a includes two tables: the first shows Credit lossexpense, as recorded in the Financial Statements, for eachBusiness Group; the second reflects an ’Adjusted expectedcredit loss’ for each Business Group, which is the expectedcredit loss on its portfolio, plus the difference between Cred-it loss expense and expected credit loss, amortized over athree-year period. The difference between the total of theseAdjusted expected credit loss figures and the Credit loss ex-pense recorded at Group level for financial reporting is report-ed in Corporate Functions.
Financial StatementsNotes to the Financial Statements
140
Note 29 Financial Instruments Risk Position (continued)b) Credit Risk (continued)

UBS’s approach to liquidity management is to ensure, as faras possible, that it will always have sufficient liquidity to meetits liabilities when due, without compromising its ability torespond quickly to strategic market opportunities. A central-ized approach is adopted, based on an integrated frame-work incorporating the assessment of expected cash flowsand the availability of high-grade collateral which could beused to secure additional funding if required. The liquidityposition is assessed and managed under a variety of scenar-ios, giving due consideration to stress factors. Scenarios en-
compass not only normal market conditions but also stressedconditions, including both UBS-specific and general marketcrises. The impact on both trading and client businesses isconsidered, taking account of potential collateral with whichfunds might be raised, and the possibility that customersmight seek to withdraw funds or draw down unutilizedcredit lines.
The breakdown by contractual maturity of assets and lia-bilities, which is the basis of the “normal market conditions”scenario, at 31 December 2004 is shown in the table below.
141
Note 29 Financial Instruments Risk Position (continued)c) Liquidity Risk
Maturity analysis of assets and liabilities
Due DueDue between between
On Subject within 3 and 1 and Due afterCHF billion demand to notice 1 3 months 12 months 5 years 5 years Total
Assets
Cash and balances with central banks 6.0 6.0
Due from banks 20.0 0.4 10.5 1.1 2.1 1.2 35.3
Cash collateral on securities borrowed 0.0 186.0 32.0 2.1 0.1 0.0 220.2
Reverse repurchase agreements 0.0 49.6 255.0 46.0 5.5 1.1 357.2
Trading portfolio assets 2 370.3 0.0 0.0 0.0 0.0 0.0 370.3
Trading portfolio assets pledged as collateral 159.1 0.0 0.0 0.0 0.0 0.0 159.1
Positive replacement values 2 284.6 0.0 0.0 0.0 0.0 0.0 284.6
Financial assets designated at fair value 0.7 0.0 0.0 0.0 0.0 0.0 0.7
Loans 23.1 35.8 47.3 30.2 79.6 16.4 232.4
Financial investments 4.1 0.0 0.6 0.1 0.2 0.1 5.1
Accrued income and prepaid expenses 5.9 0.0 0.0 0.0 0.0 0.0 5.9
Investments in associates 0.0 0.0 0.0 0.0 0.0 2.4 2.4
Property and equipment 0.0 0.0 0.0 0.0 0.0 8.7 8.7
Goodwill and other intangible assets 0.0 0.0 0.0 0.0 0.0 12.1 12.1
Other assets 15.6 19.2 0.0 0.0 0.0 0.0 34.8
Total 31.12.04 889.4 291.0 345.4 79.5 87.5 42.0 1,734.8
Total 31.12.03 832.4 260.6 271.2 82.6 72.2 31.1 1,550.1
Liabilities
Due to banks 30.8 6.5 77.8 1.5 1.9 0.4 118.9
Cash collateral on securities lent 0.0 51.7 9.8 0.0 0.0 0.0 61.5
Repurchase agreements 0.0 20.2 363.2 37.8 1.2 0.2 422.6
Trading portfolio liabilities 2 171.0 0.0 0.0 0.0 0.0 0.0 171.0
Negative replacement values 2 303.7 0.0 0.0 0.0 0.0 0.0 303.7
Financial liabilities designated at fair value 0.0 0.0 2.3 9.0 46.4 8.1 65.8
Due to customers 119.1 112.0 135.4 5.2 1.5 2.9 376.1
Accrued expenses and deferred income 14.7 0.0 0.0 0.0 0.0 0.0 14.7
Debt issued 0.0 0.0 74.9 12.1 5.0 25.8 117.8
Other liabilities 20.3 22.1 0.0 0.0 0.0 0.0 42.4
Total 31.12.04 659.6 212.5 663.4 65.6 56.0 37.4 1,694.5
Total 31.12.03 795.0 188.0 338.5 130.4 36.5 22.3 1,510.7
1 Deposits without a fixed term, on which notice of withdrawal or termination has not been given (such funds may be withdrawn by the depositor or repaid by the borrower subject to an agreed periodof notice which can be from 2 days to 6 months). 2 Trading and derivative positions are shown within ’on demand’ which management believes most accurately reflects the short-term nature of tradingactivities. The contractual maturity of the instruments may however extend over significantly longer periods.

Financial StatementsNotes to the Financial Statements
The adequacy of UBS’s capital is monitored using, among oth-er measures, the rules and ratios established by the BaselCommittee on Banking Supervision (“BIS rules / ratios”). TheBIS ratios compare the amount of eligible capital (in total andTier 1) with the total of risk-weighted assets (RWAs).
While UBS monitors and reports its capital ratios under BISrules, it is the rules established by the Swiss regulator, the EBK,which ultimately determine the regulatory capital required tounderpin its business, and these rules, on balance, result inhigher RWAs than the BIS rules. As a result, UBS’s ratios arelower when calculated under the EBK regulations than underthe BIS rules.
BIS Eligible capitalBIS eligible capital consists of two parts. Tier 1 capital com-prises share capital, share premium, retained earnings includ-ing current year profit, foreign currency translation and mi-nority interests less accrued dividends, net long positions inown shares and goodwill. Certain adjustments are made toIFRS-based profit and reserves, in line with BIS recommenda-tions, as prescribed by the EBK. Tier 2 capital includes subor-dinated long-term debt. Tier 1 capital is required to be at least4% and Total eligible capital at least 8% of RWAs.
BIS Risk-Weighted Assets (RWAs)Total RWAs are made up of three elements – credit risk, oth-er assets and market risk, each of which is described below.
The credit risk component consists of on- and off-balancesheet claims, measured according to regulatory formulae out-lined below, and weighted according to type of counterpar-ty and collateral at 0%, 20%, 50% or 100%. The least riskyclaims, such as claims on OECD governments and claims col-lateralized by cash, are weighted at 0%, meaning that no cap-ital support is required, while the claims deemed most risky,including unsecured claims on corporates and private cus-tomers, are weighted at 100%, meaning that 8% capital sup-port is required.
Securities not held for trading are included as claims, basedon the net long position in the securities of each issuer, includ-
ing both physical holdings and positions derived from othertransactions such as options. UBS’s investment in Motor-Columbus is treated for regulatory capital purposes as a po-sition in a security not held for trading.
Claims arising from derivatives transactions include twocomponents: the current positive replacement values and ’add-ons’ to reflect their potential future exposure. Where UBS hasentered into a master netting agreement which is accepted bythe EBK as being legally enforceable in insolvency, positive andnegative replacement values with individual counterpartiescan be netted and therefore the on-balance sheet componentof RWAs for derivatives transactions shown in the table on thenext page (Positive replacement values) is less than the balancesheet value of Positive replacement values. The add-ons com-ponent of the RWAs is shown in the table on the next pageunder Off-balance sheet exposures and other positions – For-ward and swap contracts, and Purchased options.
Claims arising from contingent commitments and irrevo-cable facilities granted are converted to credit equivalentamounts based on specified percentages of nominal value.
There are other types of asset, most notably property andequipment and intangibles, which, while not subject to cred-it risk, represent a risk to the bank in respect of their poten-tial for writedown and impairment and which therefore re-quire capital underpinning.
Capital is required to support market risk arising in all for-eign exchange, precious metals and commodity (including en-ergy) positions, and all positions held for trading in interest rateinstruments and equities, including risks on individual equitiesand traded debt obligations such as bonds. UBS computes thisrisk using a Value at Risk (VaR) model approved by the EBK, fromwhich the market risk capital requirement is derived. Unlike thecalculations for credit risk and other assets, this produces thecapital requirement itself rather than the RWA amount. In or-der to compute a total capital ratio, the market risk capital re-quirement is converted to a ’RWA equivalent’ (shown in thetable as Market risk positions) such that the capital requirementis 8% of this RWA equivalent, i.e. the market risk capital require-ment derived by VaR is multiplied by 12.5.
142
Note 29 Financial Instruments Risk Position (continued)d) Capital Adequacy

Note 29 Financial Instruments Risk Position (continued)d) Capital Adequacy (continued)
Risk-weighted assets (BIS)
Risk-weighted Risk-weightedExposure amount Exposure 1 amount
CHF million 31.12.04 31.12.04 31.12.03 31.12.03
Balance sheet exposures
Due from banks and other collateralized lendings 2 556,947 7,820 531,098 8,565
Net positions in securities 3, 4 8,227 6,914 7,277 6,182
Positive replacement values 5 78,317 17,121 84,334 22,324
Loans, net of allowances for credit losses and other collateralized lendings 2 429,186 164,620 359,154 153,537
Accrued income and prepaid expenses 5,790 3,573 6,218 4,284
Property and equipment 8,772 8,772 9,611 9,611
Other assets 32,725 8,949 24,918 7,673
Off-balance sheet exposures
Contingent liabilities 14,894 7,569 15,563 8,167
Irrevocable commitments 53,187 11,764 46,960 6,863
Forward and swap contracts 6 14,419,106 8,486 11,746,880 4,710
Purchased options 6 2,306,605 386 1,183,708 1,716
Market risk positions 7 18,151 18,269
Total risk-weighted assets 264,125 251,901
1 Prior year numbers have been adjusted to conform with current year’s presentation. 2 Includes gross securities borrowing and reverse repo exposures, as well as traded loans which are included intrading assets. These positions have not been included in the market risk position. 3 Includes security positions which are not included in the market risk position, including Motor-Columbus, which isnot consolidated for capital adequacy purposes. 4 Excluding positions in the trading book, which are included in market risk positions. 5 Represents the mark to market values of Forward and swapcontracts and Purchased options, where positive but after netting, where applicable. 6 Represents the “add-ons” for these contracts. 7 Regulatory capital adequacy requirements for market risk,calculated using the approved Value at Risk model, multiplied by 12.5 to give the “risk-weighted asset equivalent”.
BIS capital ratios
Capital Ratio Capital RatioCHF million % CHF million %
31.12.04 31.12.04 31.12.03 31.12.03
Tier 1 31,051 11.8 29,765 11.8
of which hybrid Tier 1 2,963 1.1 3,224 1.3
Tier 2 4,815 1.8 3,816 1.5
Total BIS 35,866 13.6 33,581 13.3
The Tier 1 capital includes CHF 2,963 million (USD 2,600 million) in trust preferred securities at 31 December 2004 and CHF 3,224 million (USD 2,600 million) at 31 December 2003.
143
Financial StatementsNotes to the Financial Statements
The Atel Group, the operating arm of Motor-Columbus, is ex-posed to electricity price risk, interest rate risk, currency risk,credit risk, and other business risks.
Risk limits are allocated to individual risk categories andcompliance with these limits is continuously monitored, thelimits being periodically adjusted in the broad context of thecompany’s overall risk capacity.
A risk policy has been established and is monitored by arisk committee composed of executive management. It wasapproved by the Board of Directors of Atel and is reviewed andratified by them annually. The policy sets out the principles forAtel’s business. It specifies requirements for entering into,measuring, managing and limiting risk in its business and theorganization and responsibilities of risk management. The ob-jective of the policy is to provide a reasonable balance betweenthe business risks entered into and Atel’s earnings and risk-bearing shareholders’ equity.
A financial risk policy sets out the context of financial riskmanagement in terms of content, organization and systems,with the objective of reducing financial risk, balancing thecosts of hedging and the risks assumed. The responsible unitsmanage their financial risks within the framework of this pol-icy and limits defined for their area.
Energy price riskPrice risks in the energy business arise from, among others,price volatility, changing market prices and changing correla-tions between markets and products. Derivative financial in-struments are used to hedge underlying physical transac-tions, subject to the risk policy.
Interest rate riskInterest rate swaps are permitted to hedge capital markets in-terest rate exposure, with changes in fair value being report-ed in the income statement.
Currency risksTo minimize currency risk, Atel tries to offset operating incomeand expenses in foreign currencies. Any surplus is hedgedthrough currency forwards and options within the frameworkof the financial risk policy.
Net investment in foreign subsidiaries is also subject to ex-change rate movements, but differences in inflation rates tendto cancel out these changes over the longer term and for thisreason Atel does not hedge investment in foreign subsidiaries.
Credit riskCredit risk management is based on assessment of the cred-itworthiness of new contracting parties before entering intoany transaction, giving rise to credit exposure, and continu-ous monitoring of creditworthiness and exposures thereafter.In the energy business, Atel only enters into transactions lead-ing to credit exposure with counterparties that fulfill the cri-teria laid out in the risk policy. Concentration risk is minimizedby the number of customers and their geographical distribu-tion.
Financial assets reported in the balance sheet represent themaximum loss to Atel in the event of counterparty default atthe balance sheet date.
144
Note 29 Financial Instruments Risk Position (continued)e) Financial Instruments Risk Position in Motor-Columbus

145
Note 30 Fair Value of Financial Instruments30a Fair Value of Financial Instruments
The following table presents the fair value of financial instruments, including those not reflected in the financial statementsat fair value. It is accompanied by a discussion of the methods used to determine fair value for financial instruments.
Carrying Fair Unrealized Carrying Fair Unrealizedvalue value gain / (loss) value value gain / (loss)
CHF billion 31.12.04 31.12.04 31.12.04 31.12.03 31.12.03 31.12.03
Assets
Cash and balances with central banks 6.0 6.0 0.0 3.6 3.6 0.0
Due from banks 35.3 35.3 0.0 31.7 31.7 0.0
Cash collateral on securities borrowed 220.2 220.2 0.0 213.9 213.9 0.0
Reverse repurchase agreements 357.1 357.1 0.0 320.5 320.5 0.0
Trading portfolio assets 370.3 370.3 0.0 341.0 341.0 0.0
Trading portfolio assets pledged as collateral 159.1 159.1 0.0 120.8 120.8 0.0
Positive replacement values 284.6 284.6 0.0 248.2 248.2 0.0
Financial assets designated at fair value 0.7 0.7 0.0 0.0 0.0 0.0
Loans 232.4 233.8 1.4 212.7 214.0 1.3
Financial investments 5.0 5.0 0.0 5.1 5.1 0.0
Liabilities
Due to banks 118.9 118.9 0.0 127.0 127.0 0.0
Cash collateral on securities lent 61.5 61.5 0.0 53.3 53.3 0.0
Repurchase agreements 422.6 422.6 0.0 415.9 415.9 0.0
Trading portfolio liabilities 171.0 171.0 0.0 144.0 144.0 0.0
Negative replacement values 303.7 303.7 0.0 254.8 254.8 0.0
Financial liabilities designated at fair value 65.8 65.8 0.0 35.3 35.3 0.0
Due to customers 376.1 376.1 0.0 346.6 346.6 0.0
Debt issued 117.8 118.9 (1.1) 88.8 90.0 (1.2 )
Subtotal 0.3 0.1
Unrealized gains and losses recorded in Shareholders’ equity before tax on:
Financial investments 1.4 0.8
Derivative instruments designated as cash flow hedges (0.4) (0.2 )
Net unrealized gains and losses not recognized in the income statement 1.3 0.7
Fair value is the amount for which an asset could be ex-changed, or a liability settled, between knowledgeable, will-ing parties in an arm’s length transaction. For financial instru-ments carried at fair value, market prices or rates are used todetermine fair value where an active market exists (such as arecognized stock exchange), as it is the best evidence of thefair value of a financial instrument.
Market prices are not, however, available for certain finan-cial assets and liabilities held and issued by UBS. Therefore,where no active market price or rate is available, fair valuesare estimated using present value or other valuation tech-niques, using inputs based on market conditions existing atthe balance sheet dates.
Valuation techniques are generally applied to OTC deriva-tives, unlisted trading portfolio assets and liabilities, and un-listed financial investments. The most frequently applied pric-ing models and valuation techniques include forward pricing
and swap models using present value calculations, optionmodels such as the Black-Scholes model or generalizations ofit, and credit models such as default rate models or creditspread models.
The values derived from applying these techniques are sig-nificantly affected by the choice of valuation model used andthe underlying assumptions made concerning factors such asthe amounts and timing of future cash flows, discount rates,volatility, and credit risk.
The following methods and significant assumptions havebeen applied in determining the fair values of financial instru-ments presented in the above table, both for financial instru-ments carried at fair value, and those carried at cost (for whichfair values are provided as a comparison):(a) trading portfolio assets and liabilities, trading portfolio as-
sets pledged as collateral, financial assets and liabilitiesdesignated at fair value, derivatives, and other transactions

Financial StatementsNotes to the Financial Statements
undertaken for trading purposes are measured at fair val-ue by reference to quoted market prices when available.If quoted market prices are not available, then fair valuesare estimated on the basis of pricing models, or other rec-ognized valuation techniques. Fair value is equal to the car-rying amount for these items;
(b) financial investments classified as available-for-sale aremeasured at fair value by reference to quoted marketprices when available. If quoted market prices are notavailable, then fair values are estimated on the basis ofpricing models or other recognized valuation techniques.Fair value is equal to the carrying amount for these items,and unrealized gains and losses, excluding impairmentwritedowns, are recorded in Shareholders’ equity until anasset is sold, collected or otherwise disposed of;
(c) the carrying amount of liquid assets and other assets ma-turing within 12 months is assumed to approximate theirfair value. This assumption is applied to liquid assets andthe short-term elements of all other financial assets andfinancial liabilities;
(d) the fair value of demand deposits and savings accountswith no specific maturity is assumed to be the amountpayable on demand at the balance sheet date;
(e) the fair value of variable rate financial instruments is as-sumed to be approximated by their carrying amountsand, in the case of loans, does not, therefore, reflectchanges in their credit quality, as the impact of credit riskis recognized separately by deducting the amount of theallowance for credit losses from both carrying and fair values;
(f) the fair value of fixed rate loans and mortgages carriedat amortized cost is estimated by comparing market in-terest rates when the loans were granted with currentmarket rates offered on similar loans. Changes in thecredit quality of loans within the portfolio are not takeninto account in determining gross fair values, as the im-pact of credit risk is recognized separately by deductingthe amount of the allowance for credit losses from bothcarrying and fair values.
Where applicable, for the purposes of the fair value disclosureon the previous page, the interest accrued to date on finan-cial instruments is included in the carrying value of the finan-cial instruments.
These valuation techniques and assumptions provide aconsistent measurement of fair value for UBS’s assets and li-abilities as shown in the table. However, because other insti-tutions may use different methods and assumptions when es-timating fair value using a valuation technique, and whenestimating the fair value of financial instruments not carriedat fair value, such fair value disclosures cannot necessarily becompared from one financial institution to another.
The table does not reflect the fair values of non-financialassets and liabilities such as property, equipment, goodwill,prepayments and non-interest accruals.
Substantially all of UBS’s commitments to extend credit areat variable rates. Accordingly, UBS has no significant exposureto fair value fluctuations resulting from interest rate move-ments related to these commitments.
The fair values of UBS’s fixed rate loans, long- and medi-um-term notes and bonds issued are predominantly hedgedby derivative instruments, mainly interest rate swaps, as ex-plained in Note 23. The interest rate risk inherent in balancesheet positions with no specific maturity is also hedged withderivative instruments based on management’s view on theeffective interest repricing date of the products.
Derivative instruments used for hedging are carried on thebalance sheet at fair values, which are included in the Positiveor Negative replacement values in the table. When the interestrate risk on a fixed rate financial instrument is hedged with a de-rivative in a fair value hedge, the fixed rate financial instrument(or hedged portion thereof) is reflected in the table at fair valueonly in relation to the interest rate risk, not the credit risk, as ex-plained in (f). Fair value changes are recorded in net profit. Thetreatment of derivatives designated as cash flow hedges is ex-plained in Note 1o). The amount shown in the table as “Deriv-ative instruments designated as cash flow hedges” is the netchange in fair values on such derivatives that is recorded in Share-holders’ equity and not yet transferred to income or expense.
146
Note 30 Fair Value of Financial Instruments (continued)30a Fair Value of Financial Instruments (continued)

For trading portfolio securities and financial investmentswhich are listed or otherwise traded in an active market, for ex-change traded derivatives, and for other financial instrumentsfor which quoted prices in an active market are available, fairvalue is determined directly from those quoted market prices.
For financial instruments which do not have directly avail-able quoted market prices, fair values are estimated using val-uation techniques, or models, based wherever possible on as-sumptions supported by observable market prices or ratesexisting at the balance sheet date. This is the case for the ma-jority of OTC derivatives, most unlisted instruments, and oth-er items which are not traded in active markets.
For a small portion of financial instruments, fair values can-not be obtained directly from quoted market prices, or indi-rectly using valuation techniques or models supported by ob-servable market prices or rates. This is generally the case forprivate equity investments in unlisted securities, and for cer-tain exotic or structured financial instruments. In these casesfair value is estimated indirectly using valuation techniques ormodels for which the inputs are reasonable assumptions,based on market conditions.
The following table presents the valuation methods usedto determine fair values of financial instruments carried at fairvalue:
147
Note 30 Fair Value of Financial Instruments (continued)30b Determination of Fair Values from Quoted Market Prices or Valuation Techniques
30c Sensitivity of Fair Values to Changing Significant Assumptions to Reasonably Possible Alternatives
Valuation technique – Valuation technique – non-CHF billion Quoted market price market observable inputs market observable inputs Total
Trading portfolio assets 209.6 159.7 1.0 370.3
Trading portfolio assets pledged as collateral 156.0 3.1 0.0 159.1
Positive replacement values 6.2 265.2 13.2 284.6
Financial assets designated at fair value 0.7 0.0 0.0 0.7
Financial investments 1.1 0.4 3.5 5.0
Total assets 373.6 428.4 17.7 819.7
Trading portfolio liabilities 161.3 9.7 0.0 171.0
Negative replacement values 9.8 270.1 23.8 303.7
Financial liabilities designated at fair value 0.0 65.8 0.0 65.8
Total liabilities 171.1 345.6 23.8 540.5
Included in the fair value of financial instruments carried atfair value on the balance sheet are those estimated in full orin part using valuation techniques based on assumptions thatare not supported by observable market prices or rates. Mod-els used in these situations undergo an internal validationprocess before they are certified for use. Any related modelvaluation uncertainty is quantified, and deducted from the fairvalues produced by the models. Based on the controls and pro-cedural safeguards we employ, management believes the re-sulting estimated fair values recorded in the balance sheet andthe changes in fair values recorded in the income statementare reasonable, and are the most appropriate at the balancesheet date.
The potential effect of using reasonably possible alterna-tive assumptions as inputs to valuation models from which the
fair values of these financial instruments are determinedhas been quantified as a reduction of approximately CHF 579million using less favorable assumptions, and an increase ofapproximately CHF 927 million using more favorable assump-tions.
The determination of reasonably possible alternativeassumptions is itself subject to considerable judgment, but forthis purpose was determined using the same technique as forthe model valuation adjustments. This was based on increas-ing and decreasing the confidence level applied to determinethe original model valuation adjustments. The resulting effecton fair values reflects the application of less favorable andmore favorable assumptions. In changing the assumptions itwas assumed that the impact of correlation between differ-ent financial instruments and models is minimal.

Financial StatementsNotes to the Financial Statements
Total Net trading income for the year ended 31 December2004 was CHF 4,972 million, which represents the net resultfrom a range of products traded across different business ac-tivities, including the effect of foreign currency translation, andincluding both realized and unrealized income. Unrealized in-come is determined from changes in fair values, using quot-ed prices in active markets when available, and is otherwiseestimated using valuation techniques.
Included in the unrealized portion of Net trading incomeare net losses from changes in fair values of CHF 7,123 mil-lion on financial instruments for which fair values were esti-mated using valuation techniques. These valuation techniquesincluded models such as those described above, which rangefrom relatively simple models with market observable inputs,to those which are more complex and require the use of as-sumptions or estimates based on market conditions.
Net trading income is often generated in transactions in-volving several financial instruments, or subject to hedging or
other risk management techniques, which may result in dif-ferent portions of the transaction being priced using differ-ent methods.
Consequently, the changes in fair value recognized inprofit or loss during the period which were estimated usingvaluation techniques represent only a portion of Net tradingincome, and in many cases these amounts were offset by oth-er financial instruments or transactions, which were pricedin active markets using quoted market prices or rates, orwhich have been realized. The amount of such income in thecurrent year, including the effect of foreign currency transla-tion on unrealized transactions, was a gain of CHF 12,095million.
Changes in fair value estimated using valuation techniquesare also recognized in net profit, in situations of unrealizedimpairments on financial investments available-for-sale. Thetotal of such impairment amounts recognized in net profitduring the period was CHF 218 million.
148
Note 30 Fair Value of Financial Instruments (continued)
30d Changes in Fair Value Recognized in Profit or Loss during the Period which were Estimated using ValuationTechniques

149
Note 30 Fair Value of Financial Instruments (continued)30e Continuing Involvement in Assets that have been Transferred
The following table presents details of assets which have been sold or otherwise transferred, but which continue to be rec-ognized, either in full or to the extent of UBS’s continuing involvement:
Continued asset recognition in full
CHF billion Total assets Associated liability
Nature of transaction
Securities lending agreements 37.3 13.8
Repurchase agreements 121.8 117.6
Other collateralized securities trading 2.9 2.1
Total 31.12.04 162.0 133.5
The assets in the above table continue to be recognized tothe extent shown, due to transactions which do not qualify forderecognition of the assets from the balance sheet. Derecog-nition criteria are discussed in more detail in Notes 1 d) and aa).
In each situation of continued recognition, whether in full,or to the extent of continuing involvement, UBS retains therisks of the relevant portions of the retained assets. These in-clude credit risk, settlement risk, country risk, and market risk.In addition, the nature of an associated transaction whichgives rise to the continued involvement may modify existingrisks, or introduce risks such as credit exposure to the coun-terparty to the associated transaction.
The majority of retained assets relate to repurchase agree-ments and securities lending agreements. Repurchase agree-ments are nearly always concluded with debt instruments,such as bonds, notes or money market paper; the majority ofsecurities lending agreements are concluded with shares, andthe remainder typically with bonds and notes. Both types oftransactions are transacted using standard agreements em-ployed by financial market participants, and are undertaken
with counterparties subject to UBS’s normal credit approvalprocesses. The resulting credit exposures are controlled by dai-ly monitoring and collateralization of the positions. Theamounts for repurchase agreements and securities lendingagreements are shown in the above table.
A small portion of retained assets relate to transactions inwhich UBS has transferred assets, but continues to have in-volvement in the transferred assets, for example through pro-viding a guarantee, writing put options, acquiring call options,or entering into a total return swap or other type of swaplinked to the performance of the asset. If control is retaineddue to these types of associated transactions, UBS continuesto recognize the transferred asset in its entirety, otherwise tothe extent of its continuing involvement.
In particular, transactions involving the transfer of assets inconjunction with entering into a total rate of return swap areaccounted for as secured financing transactions, instead ofsales of trading portfolio assets with an accompanying swapderivative. These transactions are included in the above tablewithin Trading portfolio assets.

Financial StatementsNotes to the Financial Statements
a) Defined benefit plansThe Group has established various pension plans inside andoutside of Switzerland. The major plans are located in Switzer-land, the UK, the US and Germany. The pension funds of AtelLtd. and some of its Group companies in Switzerland and Ger-many are included in the disclosure as of 31 December 2004.Independent actuarial valuations are performed for the plansin these locations. The measurement date of these plans is the31 December for each year presented.
The overall investment policy and strategy for the Group’sdefined benefit pension plans is guided by the objective toachieve an investment return which, together with the con-tributions paid, is sufficient to maintain reasonable controlover the various funding risks of the plans. The investmentadvisors appointed by plan trustees are responsible for de-termining the mix of asset types and target allocations whichare reviewed by the plan trustees on an ongoing basis. Ac-tual asset allocation is determined by a variety of current eco-nomic and market conditions and in consideration of specif-ic asset class risk.
The expected long-term rates of return on plan assets arebased on long-term expected inflation, interest rates, riskpremiums and targeted asset class allocations. These estimatestake into consideration historical asset class returns and aredetermined together with the plans’ investment and actuar-ial advisors.
Swiss pension plansThe pension fund of UBS covers practically all UBS employeesin Switzerland and exceeds the minimum benefit requirementsunder Swiss law. Contributions to the pension fund of UBSare paid for by employees and the employer. For the mainplan, the employee contributions are calculated as a percent-age of insured annual salary and are deducted monthly. Thepercentages deducted from salary for full benefit coverage (in-cluding risk benefits) depend on age and vary between 7%and 10%. The employer pays a variable contribution thatranges between 150% and 220% of the sum of employees’contributions. The computation of the benefits is based on thefinal covered salary. The benefits covered include retirementbenefits, disability, death and survivor pensions, and employ-ment termination benefits.
Additional employee and employer contributions are madeto the other plans of the pension fund of UBS. These plansprovide benefits which are based on annual contributions asa percentage of salary and accrue at a minimum interest rateannually.
The employer contributions expected to be made in 2005to the Swiss pension plans are CHF 385 million. The accumu-lated benefit obligation (which is the current value of accruedbenefits without allowance for future salary increases) forthese pension plans was CHF 18,566 million as of 31 Decem-ber 2004 (2003 CHF 16,817 million, 2002 CHF 15,853 million).
Foreign pension plansThe foreign locations of UBS operate various pension plans inaccordance with local regulations and practices. Among theseplans are defined contribution plans as well as defined bene-fit plans. The locations with defined benefit plans of a mate-rial nature are in the UK, the US and Germany. The UK andthe US defined benefit plans are closed to new entrants whoare covered by defined contribution plans. The amountsshown for foreign plans reflect the net funded positions of themajor foreign plans.
The retirement plans provide benefits in the event of re-tirement, death, disability or employment termination. Theplans’ retirement benefits depend on age, contributions andlevel of compensation. The principal plans are financed in fullby the Group. The employer contributions expected to bemade in 2005 to these pension plans are CHF 55 million. Thefunding policy for these plans is consistent with local govern-ment and tax requirements.
The assumptions used in foreign plans take into accountlocal economic conditions.
The accumulated benefit obligation for these pension planswas CHF 4,118 million as of 31 December 2004 (2003 CHF3,609 million, 2002 CHF 3,376 million).
For pension plans with an accumulated benefit obligationin excess of plan assets, the aggregate projected benefit ob-ligation and accumulated benefit obligation was CHF 3,755million and CHF 3,735 million as of 31 December 2004 (2003CHF 944 million and CHF 930 million, 2002 CHF 3,436 mil-lion and CHF 3,376 million). The fair value of plan assets forthese plans was CHF 3,166 million as of 31 December 2004(2003 CHF 677 million, 2002 CHF 2,382 million).
150
Note 31 Pension and Other Post-Retirement Benefit Plans

Note 31 Pension and Other Post-Retirement Benefit Plans (continued)
a) Defined benefit plans
Swiss Foreign
CHF million 31.12.04 31.12.03 31.12.02 31.12.04 31.12.03 31.12.02
Defined benefit obligation at the beginning of the year (18,216) (19,204 ) (17,879 ) (3,663) (3,436 ) (3,553 )
Service cost (548) (564 ) (554 ) (83) (91 ) (108 )
Interest cost (672) (703 ) (699 ) (212) (197 ) (210 )
Special termination benefits (35) (70 ) (209 )
Actuarial gain / (loss) (1,392) 1,395 (681 ) (296) (201 ) (177 )
Benefits paid 910 930 818 125 124 111
Curtailment / settlement 74
Acquisitions (272) (159)
Foreign currency translation 146 138 427
Defined benefit obligation at the end of the year (20,225) (18,216 ) (19,204 ) (4,142) (3,663 ) (3,436 )
Fair value of plan assets at the beginning of the year 17,619 16,566 18,289 3,402 2,382 2,887
Actual return on plan assets 980 1,411 (1,350 ) 370 429 (240 )
Employer contributions 411 370 236 65 831 164
Plan participant contributions 203 202 209
Benefits paid (910) (930 ) (818 ) (125) (124 ) (111 )
Acquisitions 272
Foreign currency translation (132) (116 ) (318 )
Fair value of plan assets at the end of the year 18,575 17,619 16,566 3,580 3,402 2,382
Funded status (1,650) (597 ) (2,638 ) (562) (261 ) (1,054 )
Unrecognized net actuarial (gains) / losses 3,006 1,716 3,892 1,046 970 1,126
Unrecognized prior service cost 1 1 1
Unrecognized asset (1,356) (1,119 ) (1,221 )
(Accrued) /prepaid pension cost 0 0 33 485 710 73
Movement in the net (liability) or asset
(Accrued) / prepaid pension cost at the beginning of the year 0 33 356 710 73 9
Net periodic pension cost (411) (403 ) (559 ) (105) (168 ) (83 )
Employer contributions 411 370 236 65 831 164
Acquisitions (159)
Foreign currency translation (26) (26 ) (17 )
(Accrued) /prepaid pension cost 0 0 33 485 710 73
Amounts recognized in the Balance Sheet
Prepaid pension cost 33 805 862 220
Accrued pension liability (320) (152 ) (147 )
(Accrued) /prepaid pension cost 0 0 33 485 710 73
151

Financial StatementsNotes to the Financial Statements
Note 31 Pension and Other Post-Retirement Benefit Plans (continued)
a) Defined benefit plans (continued)
CHF million Swiss Foreign
for the year ended 31.12.04 31.12.03 31.12.02 31.12.04 31.12.03 31.12.02
Components of net periodic pension cost
Service cost 548 564 554 83 91 108
Interest cost 672 703 699 212 197 210
Expected return on plan assets (878) (818 ) (900 ) (248) (178 ) (199 )
Increase / (decrease) of unrecognized assets 237 (102 ) 206
Special termination benefits 35 70 209
Amortization of unrecognized prior service cost 1
Amortization of unrecognized net (gains) / losses 188 58 58 22
Curtailment / settlement (59 )
Employee contributions (203) (202 ) (209 )
Net periodic pension cost 411 403 559 105 168 83
Principal weighted average actuarial assumptions used (%)
Assumptions used to determine defined benefit obligations at the end of the year
Discount rate 3.3 3.8 3.8 5.5 5.7 5.8
Expected rate of salary increase 2.5 2.5 2.5 4.4 4.6 4.4
Rate of pension increase 1.0 1.0 1.5 1.9 1.9 1.5
Assumptions used to determine net periodic pension cost for the year ended
Discount rate 3.8 3.8 4.0 5.7 5.8 6.2
Expected rate of return on plan assets 5.0 5.0 5.0 7.2 7.1 7.3
Expected rate of salary increase 2.5 2.5 2.5 4.6 4.4 4.4
Rate of pension increase 1.0 1.5 1.5 1.9 1.5 1.5
CHF million
Expected future benefit payments
2005 935 116
2006 951 112
2007 967 121
2008 990 131
2009 1,015 140
2010–2014 5,252 864
Plan assets
Actual plan asset allocation (%)
Equity instruments 43 39 35 54 52 57
Debt instruments 41 43 47 41 30 36
Real estate 12 12 13 2 1 1
Other 4 6 5 3 17 6
Total 100 100 100 100 100 100
152

Note 31 Pension and Other Post-Retirement Benefit Plans (continued)
a) Defined benefit plans (continued)
Swiss Foreign
31.12.04 31.12.03 31.12.02 31.12.04 31.12.03 31.12.02
Long-term target plan asset allocation (%)
Equity instruments 34–49 49–55
Debt instruments 30–53 44–47
Real estate 12–19 1–2
Other 0 0–6
Actual return on plan assets (%) 5.5 8.6 (7.5 ) 10.8 17.8 (8.7 )
CHF million
Additional details to fair value of plan assets
UBS financial instruments and UBS bank accounts 1,239 1,005 814
UBS AG shares 1 238 246 206
Securities lent to UBS included in plan assets 3,778 2,930 2,645
Other assets used by UBS included in plan assets 73 84 90
1 The numbers of UBS AG shares were 2,493,173, 2,908,699 and 3,072,500 as of 31 December 2004, 31 December 2003 and 31 December 2002, respectively. The amounts of capital repayment anddividend received on UBS AG shares for the years ended 31 December 2004, 31 December 2003 and 31 December 2002 were CHF 7 million for each year.
153
b) Post-retirement medical and life plansIn the US and the UK the Group offers retiree medical bene-fits that contribute to the health care coverage of employeesand beneficiaries after retirement. In addition to retiree med-ical benefits, the Group in the US also provides retiree life in-surance benefits.
The benefit obligation in excess of fair value of plan assetsfor those plans amounts to CHF 166 million as of 31 Decem-ber 2004 (2003 CHF 179 million, 2002 CHF 164 million) andthe total accrued post-retirement cost to CHF 136 million asof 31 December 2004 (2003 CHF 137 million, 2002 CHF 130
million). The net periodic post-retirement costs for the yearsended 31 December 2004, 31 December 2003 and 31 De-cember 2002 were CHF 16 million, CHF 22 million and CHF25 million, respectively.
The employer contributions expected to be made in 2005to the post-retirement medical and life plans are CHF 7 mil-lion. The expected future benefit payments are CHF 7 millionfor each of the years 2005, 2006 and 2007, CHF 8 million foreach of the years 2008 and 2009 and CHF 46 million in totalfor the years 2010–2014.

Financial StatementsNotes to the Financial Statements
Note 31 Pension and Other Post-Retirement Benefit Plans (continued)
b) Post-retirement medical and life plans
CHF million 31.12.04 31.12.03 31.12.02
Post-retirement benefit obligation at the beginning of the year (179) (166 ) (145 )
Service cost (6) (11 ) (8 )
Interest cost (9) (10 ) (9 )
Plan amendments (3 )
Actuarial gain / (loss) 8 (14 ) (31 )
Benefits paid 8 6 4
Foreign currency translation 12 16 26
Post-retirement benefit obligation at the end of the year (166) (179 ) (166 )
Fair value of plan assets at the beginning of the year 0 2 3
Actual return on plan assets 0 0 0
Employer contributions 8 4 3
Benefits paid (8) (6 ) (4 )
Fair value of plan assets at the end of the year 0 0 2
The assumed average health care cost trend rate used in determining post-retirement benefit expense is assumed to be 11%for 2004 and to decrease to an ultimate trend rate of 5% in 2011. Assumed health care cost trend rates have a significant ef-fect on the amounts reported for the health care plan. A one-percentage-point change in the assumed health care cost trendrates would change the US post-retirement benefit obligation and the service and interest cost components of the net peri-odic post-retirement benefit costs as follows:
CHF million 1% increase 1% decrease
Effect on total service and interest cost 3 (3)
Effect on the post-retirement benefit obligation 22 (18)
154
c) Defined contribution plansThe Group also sponsors a number of defined contributionplans primarily in the UK and the US. Certain plans permit em-ployees to make contributions and earn matching or othercontributions from the Group. The contributions to these
plans recognized as expense for the years ended 31 Decem-ber 2004, 31 December 2003 and 31 December 2002 wereCHF 187 million, CHF 141 million and CHF 133 million, respec-tively.

UBS has established several equity participation plans to fur-ther align the long-term interests of executives, managers,staff and shareholders. The plans are offered to eligible em-ployees in approximately 50 countries and are designed tomeet the complex legal, tax and regulatory requirements ofeach country in which they are offered. The explanations be-low describe the most significant plans in general, but specif-ic plan rules and investment offerings may vary by country.
Equity Plus (EP): This voluntary plan gives eligible employ-ees the opportunity to purchase UBS shares at fair market val-ue on the purchase date and receive at no additional cost twoUBS options for each share purchased, up to a maximum an-nual limit. The options have a strike price equal to the fair mar-ket value of the stock on the date the option is granted. Sharepurchases can be made annually from bonus compensationor quarterly based on regular deductions from salary. Sharespurchased under Equity Plus are restricted from sale for twoyears from the time of purchase, and the options granted havea two year vesting requirement and generally expire from tenyears to ten and one-half years after the date of grant.
Discounted purchase plans: Selected employees in Switzer-land are entitled to purchase a specified number of UBSshares at a predetermined discounted price each year. Thenumber of shares that can be purchased depends on rank. Anysuch shares purchased must be held for a specified period oftime. The discount is recorded as compensation expense. Thelast share purchase opportunity will take place in 2005.
Equity Ownership Plan (EOP): Selected personnel receivebetween 10% and 45% of their performance-related com-
pensation in UBS shares or notional UBS shares instead ofcash, on a mandatory basis. Up to and including 2004, par-ticipants in certain countries were eligible to receive a por-tion of their award in UBS shares with a matching contribu-tion in UBS options or in Alternative Investment Vehicles(AIVs) (generally money market funds, UBS and non-UBS mu-tual funds and other UBS sponsored funds). In 2002 and2003, certain employees received UBS options instead of UBSshares for a portion of their EOP award. In 2005, AIVs andoptions will no longer be granted as part of EOP. EOP awardsvest in one-third increments over a three-year vesting peri-od. Under certain conditions, these awards are fully for-feitable by the employee.
Key employee option plans: Under these plans, key andhigh potential employees are granted UBS options with astrike price not less than the fair market value of the shareson the date the option is granted. Option grants generally vestin one-third increments over a three-year period. Expirationof the options is generally from ten to ten and one-half years.One option gives the right to purchase one registered UBSshare at the option’s strike price.
Other deferred compensation plans: UBS sponsors otherdeferred compensation plans for selected eligible employees.Generally, contributions are made on a tax deferred basis, andparticipants are allowed to notionally invest in AIVs. No addi-tional company match is granted, and the plan is generally notforfeitable. In addition, UBS also grants deferred compensa-tion awards to new recruits, senior management and otherkey employees in the form of UBS shares or options.
155
Note 32 Equity Participation Plans a) Equity Participation Plans Offered

Financial StatementsNotes to the Financial Statements
156
Note 32 Equity Participation Plans (continued)b) UBS Share Awards
i) Stock compensation plansMovements in shares granted under various equity participation plans mentioned on the previous page are as follows:
Stock compensation plans 31.12.04 31.12.03 31.12.02
Unvested shares outstanding, at the beginning of the year 31,383,890 48,136,561 52,299,332
Shares awarded during the year 11,713,406 11,023,553 13,511,655
Vested during the year (17,996,498) (26,915,860 ) (16,333,832 )
Forfeited during the year (463,979) (860,364 ) (1,340,594 )
Unvested shares outstanding, at the end of the year 24,636,819 31,383,890 48,136,561
Weighted-average fair market value of shares awarded (in CHF) 95 61 71
Fair market value of outstanding shares at the end of the year (CHF billion) 2.3 2.7 3.2
ii) Stock purchase plansThe following table shows the shares awarded and the weighted-average fair value per share for the Group’s stock purchaseplans.
Stock purchase plans 31.12.04 31.12.03 31.12.02
Share quantity purchased through discounted purchase plans 1,035,079 1,722,492 1,339,223
Weighted-average purchase price (in CHF) 45 31 40
Share quantity purchased through EP at fair market value 2,448,231 2,593,391 2,483,684
Weighted-average purchase price (in CHF) 93 61 77
Weighted-average purchase price (in USD) 73 49 46

Movements in options granted under various equity participation plans mentioned on the previous page are as follows:
Weighted- Weighted- Weighted-average average averageexercise exercise exercise
Number of price Number of price Number of priceoptions (in CHF) options (in CHF) options (in CHF)
31.12.04 31.12.04 1 31.12.03 31.12.03 1 31.12.02 31.12.02 1
Outstanding, at the beginning of the year 109,040,026 63 88,164,227 67 63,286,669 66
Granted during the year 24,113,252 91 38,969,319 59 37,060,178 71
Exercised during the year (29,396,959) 58 (14,782,471 ) 54 (9,595,133 ) 54
Forfeited during the year (2,692,824) 66 (2,721,970 ) 64 (2,082,356 ) 71
Expired unexercised (156,141) 76 (589,079 ) 76 (505,131 ) 77
Outstanding, at the end of the year 100,907,354 69 109,040,026 63 88,164,227 67
Exercisable, at the end of the year 37,941,280 65 34,726,720 59 21,765,482 51
1 Some of the options in this table have exercise prices denominated in US dollars which have been converted into CHF at the year-end spot exchange rate for the purposes of this table.
The following table summarizes additional information about stock options outstanding at 31 December 2004:
Options outstanding Options exercisable
Range of exercise Number of options Weighted-average Weighted-average Number of Weighted-averageprices per share outstanding exercise price remaining contractual life options exercisable exercise price
CHF CHF Years CHF
53.37–70.00 18,600,149 61.19 6.7 6,781,903 63.74
70.01–85.00 16,437,141 78.01 6.6 8,820,175 77.90
85.01–103.75 17,577,171 96.82 7.7 5,277,876 99.54
53.37–103.75 52,614,461 78.35 7.0 20,879,954 78.77
USD USD Years USD
7.65–35.00 3,185,982 21.00 1.6 3,185,982 21.00
35.01–45.00 11,460,304 43.13 8.1 1,868,770 43.33
45.01–55.00 19,076,401 47.57 6.2 10,590,462 47.41
55.01–81.97 14,570,206 71.11 8.7 1,416,112 58.13
7.65–81.97 48,292,893 51.86 7.1 17,061,326 42.92
157
Note 32 Equity Participation Plans (continued)c) UBS Option Awards
d) Compensation Expense
Generally under IFRS, for all equity participation instruments(shares, cash-settled warrants and other cash-settled deriva-tives for which the underlying is UBS shares) except options,UBS accrues expense in the performance year and deter-mines the number of instruments granted to employees basedon the instrument’s market price at the grant date, which isgenerally in the year following the performance year. For op-tions, the amount of expense recognized is equal to the in-trinsic value at grant date (i. e. the difference between thestrike price and fair market value of shares at the date of grant.
This difference is generally zero, as option strike prices are gen-erally at or above the market prices of the shares). For dis-counted purchase plans, the expense is equal to the differencebetween the fair market value and the discounted value andis accrued for in the performance year. Management’s esti-mate of the accrued expense before tax for share-based com-pensation for the years ended 31 December 2004, 2003 and2002 was CHF 1,406 million, CHF 833 million and CHF 592million, respectively.

Financial StatementsNotes to the Financial Statements
158
Note 32 Equity Participation Plans (continued)e) Pro-Forma Net Income
The following table presents IFRS Net profit and Earnings per share for 2004, 2003 and 2002 as if UBS had applied the fairvalue method of accounting for its equity participation plans. The fair value method would recognize expense equal to thefair value of option awards at grant, which is higher than the intrinsic value because of the time value of options.
CHF million, except per share data 31.12.04 31.12.03 31.12.02
Net profit, as reported 8,089 6,239 3,530
Add: Equity-based employee compensation expenseincluded in reported net income, net of tax 1,131 630 493
Deduct: Total equity-based employee compensation expense determined under the fair-value-based method for all awards,net of tax (1,639) (1,069 ) (1,183 )
Net profit, pro-forma 7,581 5,800 2,840
Earnings per share
Basic, as reported 7.68 5.59 2.92
Basic, pro-forma 7.20 5.19 2.35
Diluted, as reported 7.47 5.48 2.87
Diluted, pro-forma 7.00 5.09 2.31
The fair value of options granted was determined using a proprietary option pricing model, substantially similar to the Black-Scholes model, with the following assumptions:
31.12.04 31.12.03 31.12.02
Expected volatility 34% 35% 35%
Risk-free interest rate (CHF) 2.03% 1.70% 3.28%
Risk-free interest rate (USD) 3.70% 3.17% 4.65%
Expected dividend rate 3.87% 4.43% 3.35%
Expected life (years) 5.6 4.5 4.5
The weighted-average fair value of options granted in 2004, 2003 and 2002 was CHF 25, CHF 15 and CHF 20 per share,respectively.

The Group defines related parties as Associated companies,private equity investees, the Board of Directors, the Group Ex-ecutive Board, close family members and enterprises which arecontrolled by these individuals through their majority share-holding or their role as chairman and / or CEO in those com-panies. This definition is based on the requirements of the “Di-rective on Information Relating to Corporate Governance”issued by the SWX Swiss Exchange and effective from 1 July2002 for all listed companies in Switzerland.
a) Remuneration and equity holdingsThe executive members of the Board of Directors have top-management employment contracts and receive pension ben-efits upon retirement. Total remuneration to the executivemembers of the Board of Directors and Group Executive Boardrecognized in the income statement including cash, shares andaccrued pension benefits amounted to CHF 165.3 million in2004, CHF 144.6 million in 2003 and CHF 131.8 million in2002. Total compensation numbers exclude merger-related re-tention payments for the two ex-PaineWebber executives ofCHF 21.1 million (USD 17.0 million) in 2003 and CHF 20.6 mil-lion (USD 14.9 million) in 2002. These retention paymentswere committed to at the time of the merger in 2000 and ful-ly disclosed at the time. No additional payments were due in2004.
The external members of the Board of Directors do nothave employment or service contracts with UBS, and thus arenot entitled to benefits upon termination of their service onthe Board of Directors. Total fees paid to these individuals fortheir services as external board members amounted to CHF5.7 million in 2004, CHF 5.4 million in 2003 and CHF 3.5 mil-lion in 2002.
The number of long-term stock options outstanding to theexecutive members of the Board of Directors and Group Ex-ecutive Board from equity participation plans was 6,004,997(equivalent to the same number of shares) at 31 December2004, 6,218,011 options (equivalent to the same number ofshares) and 120,264 warrants (equivalent to 7,214 shares) at31 December 2003 and 5,410,172 options (equivalent to thesame number of shares) and 24,558,529 warrants (equivalentto 1,473,217 UBS shares) at 31 December 2002. These plansare further explained in Note 32, Equity Participation Plans.
The total number of shares held by members of the Boardof Directors, the Group Executive Board and parties closelylinked to them was 3,506,610 at 31 December 2004,3,150,217 at 31 December 2003 and 2,139,371 at 31 Decem-ber 2002. No member of the Board of Directors or Group Ex-ecutive Board is the beneficial owner of more than 1% of theGroup’s shares at 31 December 2004.
b) Loans and advances to Board of Directors and seniorexecutivesThe outstanding balance of loans to the members of the Boardof Directors, the Group Executive Board and close family mem-bers amounted to CHF 15.8 million at 31 December 2004 andCHF 25.2 million at 31 December 2003. Executive membersof the Board and GEB members have been granted loans, fixedadvances and mortgages at the same terms and conditions thatare available to other employees, based on terms and condi-tions granted to third parties adjusted for reduced credit risk.In 2002, a thorough review of outstanding loans to senior ex-ecutives was performed to ensure compliance with the US Sar-banes-Oxley Act of 2002. Non-executive Board members aregranted loans and mortgages at general market conditions.
159
Note 33 Related Parties

Financial StatementsNotes to the Financial Statements
c) Loans to significant associated companies
CHF million 31.12.04 31.12.03
Balance at the beginning of the year 63 40
Additions 38 48
Reductions (36) (25 )
Balance at the end of the year 65 63
All loans to associated companies are transacted at arm’s length. At 31 December 2004 and 2003, there were commitmentsand contingent liabilities to significant associated companies of CHF 55 million and CHF 14 million, respectively. In addition,the Group routinely receives services from associated companies at arm’s length terms. For the years ended 31 December2004, 31 December 2003 and 31 December 2002, the amount paid to significant associates for these services was CHF 248million, CHF 106 million and CHF 60 million, respectively. Fees received for services provided to associated companies for theyears ended 31 December 2004, 31 December 2003 and 31 December 2002 was CHF 180 million, CHF 122 million and CHF2 million, respectively.
During 2003, UBS sold its VISA acquiring business to Telekurs Holding AG, an associated company. UBS realized a CHF 90million gain from this divestment.
Note 36 provides a list of significant associates.
d) Loans to private equity investees
CHF million 31.12.04 31.12.03
Balance at the beginning of the year 366 338
Additions 46 153
Reductions (222) (125 )
Balance at the end of the year 190 366
At 31 December 2004 and 31 December 2003, there were commitments and contingent liabilities to private equity compa-nies of CHF 36 million and CHF 23 million, respectively. In addition the Group purchased services from private equity compa-nies at arm’s length terms for the years ended 31 December 2004, 31 December 2003 and 31 December 2002 in the amountof CHF 0 million, CHF 14 million and CHF 116 million, respectively.
e) Other related party transactionsDuring 2004 and 2003, UBS entered into the following transactions at arm’s length with companies whose Chairman and /or CEO is an external member of the Board of Directors of UBS or of which an external director is a controlling shareholder.
In 2004 and 2003 these companies included Bertarelli & Cie. (Switzerland), Kedge Capital Partners Ltd. (Jersey), J. Sains-bury plc. (UK), Serono Group (Switzerland), Team Alinghi (Switzerland), Unisys Corporation (USA). In addition to those men-tioned, related parties in 2004 also included BMW Group (Germany) and Stadler Rail Group (Switzerland). In 2003, relatedparties also included Sika AG (Switzerland).
Other related party transactions
CHF million 2004 2003
Goods sold and services provided by related parties to UBS 34 43
Services provided to related parties by UBS (fees received) 10 7
Loans granted to related parties by UBS1 294 79
1 In 2004, includes loans, guarantees and contingent liabilities of CHF 32 million and unused committed facilities of CHF 262 million but excludes unused uncommitted working capital facilities andunused guarantees of CHF 110 million. In 2003, includes loans, guarantees, contingent liabilities and committed credit facilities of CHF 58.5 million, but excludes uncommitted working capital facilitiesof CHF 119.6 million.
As part of its sponsorship of Team Alinghi, defender for the “America’s Cup 2007”, UBS paid CHF 8.5 million (EUR 5.5 mil-lion) as sponsoring fee for 2004 and CHF 1.4 million (EUR 0.9 million) as sponsoring fee for the UBS Trophy in New Port, RI,USA. Team Alinghi’s controlling shareholder is UBS board member Ernesto Bertarelli.
UBS also engages in trading and risk management activities (e.g. swaps, options, forwards) with related parties. These trans-actions may give rise to credit risk either for UBS or for a related party towards UBS. As part of its normal course of business,UBS is also a market maker in equity and debt instruments and at times may hold positions in instruments of related parties.
160
Note 33 Related Parties (continued)

Note 34 Sales of Financial Assets in Securitizations
During the years ended 31 December 2004, 2003 and 2002, UBS securitized (i.e., transformed owned financial assets intosecurities through sales transactions) residential mortgage loans and securities, commercial mortgage loans and other finan-cial assets, acting as lead or co-manager. UBS’s continuing involvement in these transactions was primarily limited to the tem-porary retention of various security interests.
Proceeds received at the time of securitization were as follows:
Proceeds received
CHF billion 31.12.04 31.12.03 31.12.02
Residential mortgage securitizations 91 131 143
Commercial mortgage securitizations 3 4 4
Other financial asset securitizations 9 2 6
Related pre-tax gains (losses) recognized, including unrealized gains (losses) on retained interests, at the time of securitiza-tion were as follows:
Pre-tax gains / (losses) recognized
CHF million 31.12.04 31.12.03 31.12.02
Residential mortgage securitizations 197 338 524
Commercial mortgage securitizations 141 214 206
Other financial asset securitizations 21 2 (5 )
At 31 December 2004 and 2003, UBS retained CHF 2.4 billion and CHF 3.8 billion, respectively, in agency residential mort-gage securities, backed by the Government National Mortgage Association (GNMA), the Federal National Mortgage Associ-ation (FNMA) and the Federal Home Loan Mortgage Corporation (FHLMC). The fair value of retained interests in residentialmortgage securities is generally determined using observable market prices. Retained interests in other residential mortgage,commercial mortgage and other securities were not material at 31 December 2004 and 2003.
161
Note 35 Post-Balance Sheet Events
There have been no material post-balance sheet events whichwould require disclosure or adjustment to the 31 December2004 Financial Statements.
Bond issues have increased by CHF 991 million from thebalance sheet date to 3 February 2005.
On 3 February 2005, the Board of Directors reviewed theFinancial Statements and authorized them for issue. These Fi-nancial Statements will be submitted to the Annual GeneralMeeting of Shareholders to be held on 21 April 2005 for ap-proval.

Financial StatementsNotes to the Financial Statements
Note 36 Significant Subsidiaries and Associates
The legal entity group structure of UBS is designed to support the Group’s businesses within an efficient legal, tax, regulato-ry and funding framework. Neither the Business Groups of UBS (namely Investment Bank, Wealth Management USA, WealthManagement & Business Banking and Global Asset Management) nor Corporate Center are replicated in their own individ-ual legal entities but rather they generally operate out of the parent bank, UBS AG, through its Swiss and foreign branches.
The parent bank structure allows UBS to capitalize on the advantages offered by the use of one legal platform by all theBusiness Groups. It provides for the most cost efficient and flexible structure and facilitates efficient allocation and use of cap-ital, comprehensive risk management and straightforward funding processes.
Where, usually due to local legal, tax or regulatory rules or due to additional legal entities joining the UBS Group viaacquisition, it is either not possible or not efficient to operate out of the parent bank, then local subsidiary companies hostthe appropriate businesses. The significant operating subsidiary companies in the Group are listed below:
Significant subsidiaries
Share EquityJurisdiction Business capital interest
Company of incorporation Group 1 in millions accumulated in %
Banco UBS SA Rio de Janeiro, Brazil IB BRL 52.9 100.0
BDL Banco di Lugano Lugano, Switzerland CC CHF 50.0 100.0
BDL Banco di Lugano (Singapore) Ltd Singapore, Singapore CC SGD 25.0 100.0
Brunswick UBS Ltd George Town, Cayman Islands IB USD 25.0 100.0
Cantrade Private Bank Switzerland (CI) Limited St. Helier, Jersey CC GBP 0.7 100.0
Crédit Industriel SA Zurich, Switzerland WM&BB CHF 10.0 100.0
Ehinger & Armand von Ernst AG Zurich, Switzerland CC CHF 21.0 100.0
Factors AG Zurich, Switzerland WM&BB CHF 5.0 100.0
Ferrier Lullin & Cie SA Geneva, Switzerland CC CHF 30.0 100.0
GAM Holding AG Zurich, Switzerland CC CHF 50.0 100.0
GAM Limited Hamilton, Bermuda CC USD 2.0 100.0
Giubergia UBS SIM SpA Milan, Italy IB EUR 15.1 51.7
Noriba Bank BSC Manama, Bahrain WM&BB USD 10.0 100.0
PaineWebber Capital Inc Delaware, USA WM-US USD 25.8 2 100.0
PT UBS Securities Indonesia Jakarta, Indonesia IB IDR 50,000.0 96.7
SBC Wealth Management AG Zug, Switzerland CC CHF 290.1 100.0
SBCI IB Limited London, Great Britain IB GBP 100.0 100.0
SG Warburg & Co International BV Amsterdam, the Netherlands IB GBP 40.5 100.0
Thesaurus Continentale Effekten-Gesellschaft in Zürich Zurich, Switzerland WM&BB CHF 0.1 100.0
UBS (Bahamas) Ltd Nassau, Bahamas WM&BB USD 4.0 100.0
UBS (France) SA Paris, France WM&BB EUR 10.7 100.0
UBS (Italia) SpA Milan, Italy WM&BB EUR 42.0 100.0
UBS (Luxembourg) SA Luxembourg, Luxembourg WM&BB CHF 150.0 100.0
UBS (Monaco) SA Monte Carlo, Monaco WM&BB EUR 9.2 100.0
UBS (Trust and Banking) Limited Tokyo, Japan Global AM JPY 11,150.0 100.0
UBS Advisory and Capital Markets Australia Ltd Sydney, Australia IB AUD 580.8 2 100.0
UBS Alternative and Quantitative Investments LLC Delaware, USA Global AM USD 0.0 100.0
UBS Americas Inc Delaware, USA IB USD 4,550.8 2 100.0
UBS Asesores SA Panama, Panama WM&BB USD 0.0 100.0
UBS Australia Limited Sydney, Australia IB AUD 50.0 100.0
UBS Bank (Canada) Toronto, Canada WM&BB CAD 8.5 100.0
UBS Bank USA Utah, USA WM-US USD 1,700.0 2 100.0
UBS Belgium SA /NV Brussels, Belgium WM&BB EUR 16.0 100.0
UBS Beteiligungs-GmbH & Co KG Frankfurt am Main, Germany IB EUR 498.8 100.0
UBS Capital (Jersey) Ltd St. Helier, Jersey IB GBP 226.0 100.0
UBS Capital AG Zurich, Switzerland IB CHF 5.0 100.0
1 WM&BB: Wealth Management & Business Banking, Global AM: Global Asset Management, IB: Investment Bank, WM-US: Wealth Management USA, CC: Corporate Center, IH: Industrial Holdings.2 Share Capital and Share Premium.
162

Note 36 Significant Subsidiaries and Associates (continued)
Significant subsidiaries (continued)
Share EquityJurisdiction Business capital interest
Company of incorporation Group 1 in millions accumulated in %
UBS Capital Americas Investments II LLC Delaware, USA IB USD 130.0 2 100.0
UBS Capital Americas Investments III Ltd George Town, Cayman Islands IB USD 61.1 2 100.0
UBS Capital Asia Pacific Limited George Town, Cayman Islands IB USD 5.0 100.0
UBS Capital BV Amsterdam, the Netherlands IB EUR 118.8 2 100.0
UBS Capital II LLC Delaware, USA IB USD 2.6 2 100.0
UBS Capital Latin America LDC George Town, Cayman Islands IB USD 113.0 2 100.0
UBS Capital LLC Delaware, USA IB USD 378.5 2 100.0
UBS Capital SpA Milan, Italy IB EUR 0.8 100.0
UBS Card Center AG Glattbrugg, Switzerland WM&BB CHF 40.0 100.0
UBS Corporate Finance Italia SpA Milan, Italy IB EUR 1.9 100.0
UBS Corporate Finance South Africa (Proprietary) Limited Sandton, South Africa IB ZAR 0.0 100.0
UBS Derivatives Hong Kong Limited Hong Kong, China IB HKD 60.0 100.0
UBS Employee Benefits Trust Limited St. Helier, Jersey CC CHF 0.0 100.0
UBS Energy Canada Ltd. Calgary, Canada IB USD 11.3 100.0
UBS Energy LLC Delaware, USA IB USD 0.0 100.0
UBS Equity Research Malaysia Sdn Bhd Kuala Lumpur, Malaysia IB MYR 0.5 70.0
UBS España SA Madrid, Spain WM&BB EUR 54.2 100.0
UBS Fiduciaria SpA Milan, Italy WM&BB EUR 0.2 100.0
UBS Fiduciary Trust Company New Jersey, USA WM-US USD 4.4 2 99.6
UBS Finance (Cayman Islands) Ltd George Town, Cayman Islands CC USD 0.5 100.0
UBS Finance (Curação) NV Willemstad, Netherlands Antilles CC USD 0.1 100.0
UBS Finance (Delaware) LLC Delaware, USA IB USD 37.3 2 100.0
UBS Financial Services Inc. Delaware, USA WM-US USD 1,672.3 2 100.0
UBS Financial Services Incorporated of Puerto Rico Hato Rey, Puerto Rico WM-US USD 31.0 2 100.0
UBS Fund Advisor LLC Delaware, USA WM-US USD 0.0 100.0
UBS Fund Holding (Luxembourg) SA Luxembourg, Luxembourg Global AM CHF 42.0 100.0
UBS Fund Holding (Switzerland) AG Basel, Switzerland Global AM CHF 18.0 100.0
UBS Fund Management (Switzerland) AG Basel, Switzerland Global AM CHF 1.0 100.0
UBS Fund Services (Cayman) Ltd George Town, Cayman Islands Global AM USD 5.6 100.0
UBS Fund Services (Ireland) Limited Dublin, Ireland Global AM EUR 0.5 100.0
UBS Fund Services (Luxembourg) SA Luxembourg, Luxembourg Global AM CHF 2.5 100.0
UBS Global Asset Management (Americas) Inc Delaware, USA Global AM USD 0.0 100.0
UBS Global Asset Management (Australia) Ltd Sydney, Australia Global AM AUD 8.0 100.0
UBS Global Asset Management (Canada) Co Toronto, Canada Global AM CAD 117.0 100.0
UBS Global Asset Management (France) SA Paris, France WM&BB EUR 2.1 100.0
UBS Global Asset Management (Hong Kong) Limited Hong Kong, China Global AM HKD 25.0 100.0
UBS Global Asset Management (Italia) SIM SpA Milan, Italy Global AM EUR 2.0 100.0
UBS Global Asset Management (Japan) Ltd Tokyo, Japan Global AM JPY 2,200.0 100.0
UBS Global Asset Management (Singapore) Holdings Pte Ltd Singapore, Singapore Global AM SGD 4.0 100.0
UBS Global Asset Management (Taiwan) Ltd Taipei, Taiwan Global AM TWD 340.0 97.1
UBS Global Asset Management (US) Inc Delaware, USA Global AM USD 35.2 2 100.0
UBS Global Asset Management Holding Ltd London, Great Britain Global AM GBP 33.0 100.0
UBS Global Life AG Vaduz, Liechtenstein WM&BB CHF 5.0 100.0
UBS Global Trust Corporation St. John, Canada WM&BB CAD 0.1 100.0
UBS International Holdings BV Amsterdam, the Netherlands CC EUR 6.8 100.0
UBS International Inc New York, USA WM&BB USD 34.3 2 100.0
UBS International Life Limited Dublin, Ireland WM&BB EUR 1.0 100.0
1 WM&BB: Wealth Management & Business Banking, Global AM: Global Asset Management, IB: Investment Bank, WM-US: Wealth Management USA, CC: Corporate Center, IH: Industrial Holdings.2 Share Capital and Share Premium.
163

Financial StatementsNotes to the Financial Statements
Note 36 Significant Subsidiaries and Associates (continued)
Significant subsidiaries (continued)
Share EquityJurisdiction Business capital interest
Company of incorporation Group 1 in millions accumulated in %
UBS Invest Kapitalanlagegesellschaft mbH Frankfurt am Main, Germany Global AM EUR 7.7 100.0
UBS Investment Bank AG Frankfurt am Main, Germany IB EUR 155.7 100.0
UBS Investment Bank Nederland BV Amsterdam, the Netherlands IB EUR 10.9 100.0
UBS Laing and Cruickshank Limited London, Great Britain WM&BB GBP 2.5 100.0
UBS Leasing AG Brugg, Switzerland WM&BB CHF 10.0 100.0
UBS Life AG Zurich, Switzerland WM&BB CHF 25.0 100.0
UBS Limited London, Great Britain IB GBP 21.2 100.0
UBS Loan Finance LLC Delaware, USA IB USD 16.7 100.0
UBS Mortgage Holdings LLC Delaware, USA WM-US USD 0.0 100.0
UBS New Zealand Limited Auckland, New Zealand IB NZD 7.5 100.0
UBS O’Connor LLC Delaware, USA Global AM USD 1.0 100.0
UBS PaineWebber Life Insurance Company California, USA WM-US USD 39.3 2 100.0
UBS Portfolio LLC Delaware, USA IB USD 0.1 100.0
UBS Preferred Funding Company LLC I Delaware, USA CC USD 0.0 100.0
UBS Preferred Funding Company LLC II Delaware, USA CC USD 0.0 100.0
UBS Preferred Funding Company LLC III Delaware, USA CC USD 0.0 100.0
UBS Preferred Funding Company LLC IV Delaware, USA CC USD 0.0 100.0
UBS Principal Finance LLC Delaware, USA IB USD 0.1 100.0
UBS Private Clients Australia Ltd Melbourne, Australia WM&BB AUD 53.9 100.0
UBS Real Estate Investments Inc Delaware, USA IB USD 0.3 100.0
UBS Real Estate Securities Inc Delaware, USA IB USD 0.4 100.0
UBS Realty Investors LLC Connecticut, USA Global AM USD 9.3 100.0
UBS Securities (Thailand) Ltd Bangkok, Thailand IB THB 400.0 100.0
UBS Securities Asia Limited Hong Kong, China IB HKD 20.0 100.0
UBS Securities Australia Ltd Sydney, Australia IB AUD 209.8 2 100.0
UBS Securities Canada Inc Toronto, Canada IB CAD 10.0 50.0
UBS Securities España Sociedad de Valores SA Madrid, Spain IB EUR 15.0 100.0
UBS Securities France SA Paris, France IB EUR 22.9 100.0
UBS Securities Hong Kong Limited Hong Kong, China IB HKD 230.0 100.0
UBS Securities India Private Limited Mumbai, India IB INR 237.8 75.0
UBS Securities International Limited London, Great Britain IB GBP 18.0 100.0
UBS Securities Japan Ltd George Town, Cayman Islands IB JPY 60,000.0 100.0
UBS Securities Limited London, Great Britain IB GBP 140.0 100.0
UBS Securities Limited Seoul Branch Seoul, South Korea IB KRW 0.0 100.0
UBS Securities LLC Delaware, USA IB USD 2,141.4 2 100.0
UBS Securities Philippines Inc Makati City, Philippines IB PHP 150.0 100.0
UBS Securities Singapore Pte Ltd Singapore, Singapore IB SGD 55.0 100.0
UBS Services USA LLC Delaware, USA WM-US USD 0.0 100.0
UBS Securities South Africa (Proprietary) Limited Sandton, South Africa IB ZAR 87.1 2 100.0
UBS Trust (Canada) Toronto, Canada WM&BB CAD 12.5 100.0
UBS Trust Company National Association New York, USA WM-US USD 5.0 2 100.0
UBS Trustees (Bahamas) Ltd Nassau, Bahamas WM&BB USD 2.0 100.0
UBS Trustees (Cayman) Ltd George Town, Cayman Islands WM&BB USD 2.0 100.0
UBS Trustees (Jersey) Ltd St.Helier, Jersey WM&BB GBP 0.0 100.0
UBS Trustees (Singapore) Limited Singapore, Singapore WM&BB SGD 3.3 100.0
UBS UK Holding Limited London, Great Britain IB GBP 5.0 100.0
UBS Wealth Management AG Frankfurt, Germany WM&BB EUR 51.0 100.0
1 WM&BB: Wealth Management & Business Banking, Global AM: Global Asset Management, IB: Investment Bank, WM-US: Wealth Management USA, CC: Corporate Center, IH: Industrial Holdings.2 Share Capital and Share Premium.
164

165
Note 36 Significant Subsidiaries and Associates (continued)
Significant subsidiaries (continued)
Share EquityJurisdiction Business capital interest
Company of incorporation Group 1 in millions accumulated in %
Motor-Columbus AG Baden, Switzerland IH CHF 253.0 55.6
Aare-Tessin AG für Elektrizität 3 Olten, Switzerland IH CHF 303.6 33.0
Atel Energia S. r. l. 3 Milan, Italy IH EUR 20.0 32.3
Atel Installationstechnik AG 3 Olten, Switzerland IH CHF 30.0 33.0
Entrade GmbH 3 Schaffhausen, Switzerland IH CHF 0.4 24.7
GAH Beteiligungs AG 3 Heidelberg, Germany IH EUR 25.0 33.0
Società Elettrica Sopracenerina SA 3 Locarno, Switzerland IH CHF 27.5 19.6
1 WM&BB: Wealth Management & Business Banking, Global AM: Global Asset Management, IB: Investment Bank, WM-US: Wealth Management USA, CC: Corporate Center, IH: Industrial Holdings.2 Share Capital and Share Premium. 3 Not wholly owned subsidiary controlled by Motor-Columbus which itself is only 55.6% owned by UBS.
Consolidated companies: changes in 2004
Significant new companies
UBS Alternative and Quantitative Investments LLC – Delaware, USA
UBS Energy Canada Limited – Calgary, Canada
UBS Energy LLC – Delaware, USA
UBS Fund Services (Ireland) Limited – Dublin, Ireland
UBS Global Life AG – Vaduz, Liechtenstein
UBS Laing and Cruickshank Limited – London, Great Britain
UBS Securities Limited Seoul Branch – Seoul, South Korea
UBS Services USA LLC – Delaware, USA
Motor-Columbus AG – Baden, Switzerland
Aare-Tessin AG für Elektrizität – Olten, Switzerland
Atel Energia S.r.l. – Milan, Italy
Atel Installationstechnik AG – Olten, Switzerland
Entrade GmbH – Schaffhausen, Switzerland
GAH Beteiligungs AG – Heidelberg, Germany
Società Elettrica Sopracenerina SA – Locarno, Switzerland
Deconsolidated companies
Significant deconsolidated companies Reason for deconsolidation
UBS Finanzholding AG – Zurich, Switzerland Merged
Aventic AG – Zurich, Switzerland Merged
Significant associates
Equity interest Share capitalCompany Industry in % in millions
Electricité d’Emosson SA – Martigny, Switzerland Electricity 16 CHF 140
Engadiner Kraftwerke AG – Zernez, Switzerland Electricity 7 CHF 140
Kernkraftwerk Gösgen-Däniken AG – Däniken, Switzerland Electricity 13 CHF 350 1
Kernkraftwerk Leibstadt AG – Leibstadt, Switzerland Electricity 9 CHF 450
SIS Swiss Financial Services Group AG – Zurich, Switzerland Financial 33 CHF 26
Telekurs Holding AG – Zurich, Switzerland Financial 33 CHF 45
Azienda Energetica Municipale S.p.A. – Milan, Italy Electricity 2 EUR 930
UBS Currency Portfolio Ltd – George Town, Cayman Islands Private Investment Company 18 USD 1 ,831 2
UBS Global Equity Arbitrage Ltd – George Town, Cayman Islands Private Investment Company 37 USD 929 2
O’Connor Proprietary Series – Currency and Rates, Fundamental Long / Short and Convertible Arbitrage Limited – George Town, Cayman Islands Private Investment Company 44 USD 506 2
O’Connor Proprietary Series – Currency and Rates, Fundamental Long / Short and Convertible Arbitrage (EURO) Limited – George Town, Cayman Islands Private Investment Company 51 EUR 153 2
Volbroker.com Limited – London, Great Britain Financial 21 GBP 18
1 Thereof paid in CHF 290.0 millions. 2 For Hedge Funds Net Asset Value instead of share capital.

Financial StatementsNotes to the Financial Statements
Invested assets include all client assets managed by or deposit-ed with UBS for investment purposes only. They therefore ex-clude all assets held for purely transactional purposes. Assetsincluded are, for example, managed fund assets, managed in-stitutional assets, discretionary and advisory wealth manage-ment portfolios, fiduciary deposits, time deposits, savings ac-counts and wealth management securities or brokerageaccounts. Custody-only assets and transactional cash or cur-rent accounts as well as non-bankable assets (e. g. art collec-tions) and deposits from third-party banks for funding ortrading purposes are excluded.
Discretionary assets are defined as those where the bankdecides on how a client’s assets are invested. Other investedassets are those where the client decides on how the assetsare invested. When a single product is created in one Business
Group and sold in another, it is counted in both the BusinessGroup that does the investment management and the onethat distributes it. This results in double counting within UBStotal invested assets, as both Business Groups are providinga service independently to their respective clients, and bothadd value and generate revenue.
Net new money is the net amount of invested assets thatare acquired by the bank from new clients, invested assets thatare lost when clients terminate their relationship with UBS andthe inflows and outflows of invested assets from existing UBSclients. Interest and dividend income from invested assets is notincluded in the net new money result. Market and currencymovements are also excluded, as are the effects resulting fromany acquisition or divestment of a UBS subsidiary or business.Interest expense on loans results in net new money outflows.
166
Note 37 Invested Assets and Net New Money
CHF billion 31.12.04 31.12.03
Fund assets managed by UBS 354 339
Discretionary assets 570 507
Other invested assets 1,326 1,287
Total invested assets 2,250 2,133
thereof double count 294 283
Net new money 88.9 69.1

Harris provides advice on pension and retirement benefitproducts, serving primarily executives and company directorswith 28 employees. Subsequent to the acquisition both firmshave been integrated into the UBS wealth management op-erations in the UK.
In fourth quarter 2004, UBS acquired Sauerborn Trust AG(Sauerborn), an independent German firm providing financialadvisory services to individuals in the ultra-high net worth seg-ment. Sauerborn has approximately CHF 9.4 billion of assetsunder management. UBS has merged its ultra-high net worthsegment within the German wealth management businesswith the operations of Sauerborn to provide an expandedrange of services and products to its clients and reap the ben-efits of synergies. UBS paid a cash consideration of approxi-mately CHF 140 million (EUR 91 million) at closing, and willpay a further CHF 65 million (EUR 42 million) in three equalinstallments over the next two years.
The aggregate purchase price for the five acquisitions is ap-proximately CHF 696 million and has been allocated to ac-quired net assets at fair value of CHF 175 million. The differ-ence of CHF 521 million to the purchase price has beenrecognized as goodwill. Details of assets and liabilities recog-nized are as follows:
During 2004, UBS completed several acquisitions that were ac-counted for as business combinations. Except Motor-Colum-bus, which is discussed separately, none of the acquisitions wasindividually significant to the financial statements, and there-fore, they are presented aggregated per Business Group.
Wealth ManagementIn the first quarter of 2004, UBS acquired the private bankingoperations of Lloyds Bank S.A., France, and the private clientbusiness of Merrill Lynch in Germany and Austria. The twobusinesses together had invested assets of approximately CHF3.3 billion at the date of acquisition. Both businesses havebeen integrated into the local UBS Wealth Management op-erations and helped to significantly increase the client base inFrance and Germany.
In the second quarter of 2004, UBS acquired Laing &Cruickshank and Scott Goodman Harris, both British firms.Laing & Cruickshank, acquired for a consideration of approx-imately CHF 363 million, provides comprehensive wealth man-agement services to high net worth investors and charities. 75client advisors looked after invested assets of approximatelyCHF 11.4 billion, which doubled the size of UBS’s wealth man-agement operations in the United Kingdom. Scott Goodman
Step-up toCHF million Book value fair value Fair value
Assets
Intangible assets 0 162 162
Property and equipment 3 (1 ) 2
Financial Investments 5 0 5
Goodwill 0 521 521
All other assets 260 2 262
Total assets 268 684 952
Liabilities
Provisions 5 19 24
Deferred tax liabilities 0 54 54
All other liabilities 178 0 178
Total liabilities 183 73 256
Net assets 85 611 696
Total liabilities and equity 268 684 952
Intangible assets recognized relate to the businesses’ existing customer relationships and have been assigned useful lives oftwenty years, over which they will be amortized.
167
Note 38 Business Combinations

Financial StatementsNotes to the Financial Statements
Investment BankIn fourth quarter 2004, UBS acquired Charles Schwab Sound-View Capital Markets, the capital markets division of CharlesSchwab Corp. (Schwab), for an aggregate cash considerationof approximately CHF 304 million. The business comprises eq-uities trading and sales, including a third-party execution busi-ness, along with Schwab’s NASDAQ trading system. This busi-ness handles over 200 million shares a day in trade volumeand makes a market in over 11,000 stocks. As part of the ac-quisition, UBS and Schwab have entered into multi-year exe-cution service agreements for the handling of Schwab’s equi-ties and listed options orders. The business was integrated inthe Equities business of UBS’s Investment Bank.
Also in fourth quarter 2004, UBS acquired Brunswick Cap-ital’s 50% stake in Brunswick UBS, an equity brokerage andtrading, investment banking and custody joint venture in Rus-sia in which UBS and Brunswick Capital were equal partners.The total purchase price has been estimated at approximate-ly CHF 203 million, of which UBS paid at closing a cash con-
sideration to the sellers of CHF 113 million (USD 99 million)and will pay a further CHF 75 million (USD 66 million) at theend of 2005 plus 20% of Brunswick UBS’s net profits for 2005.Formed in 1997, Brunswick UBS has developed a significantfranchise in the Russian securities market, employing 120 peo-ple in Moscow. UBS has already consolidated Brunswick, sothat the effects of this acquisition on the financial statementsare minor.
The aggregate purchase price for the two businesses is ap-proximately CHF 507 million, a portion of which includes a de-ferred component linked to future results of operations. Ac-cordingly, a revision of the current purchase price estimate willbe made, if necessary, once final payments have been deter-mined. The purchase price has been allocated to net assetsacquired of CHF 198 million, which includes a revaluation ofCHF 27 million related to UBS’s existing interest in Brunswick.The difference of CHF 336 million to the purchase price hasbeen recognized as goodwill. Details of assets and liabilitiesrecognized are as follows:
168
Note 38 Business Combinations (continued)
Step-up toCHF million Book value fair value Fair value
Assets
Intangible assets 21 133 154
Property and equipment 20 (13 ) 7
Financial investments 99 (2 ) 97
Deferred tax assets 37 (37 ) –
Goodwill – 336 336
All other assets 361 (1 ) 360
Total assets 538 416 954
Liabilities
Deferred tax liabilities – 23 23
All other liabilities 364 32 396
Total liabilities 364 55 419
Minority interests 40 (39 ) 1
Equity 134 400 534
Total liabilities, minority interests and equity 538 416 954
Intangible assets recognized relate to the businesses’ existing customer relationships and have been assigned useful lives offive years in the case of Brunswick and eight years in the case of Schwab over which they will be amortized.

Notz StuckiIn the first quarter of 2004, Ferrier Lullin, one of UBS’s privatelabel banks, acquired Notz Stucki & Co., a small private bankin Geneva. The activities have been integrated into the oper-ations of Ferrier Lullin. The purchase price of CHF 42 millionwas allocated to net tangible assets of CHF 22 million, andNotz Stucki’s customer base of CHF 21 million, less deferredtaxes of CHF 5 million. The difference of CHF 4 million to thepurchase price was recognized as goodwill.
Motor-ColumbusOn 1 July 2004, UBS acquired from RWE, a German utilitiescompany, its 20% ownership interest in Motor-Columbus AG(Motor-Columbus) for a cash consideration, including inciden-tal acquisition costs, of approximately CHF 379 million. UBSnow holds a 55.6% majority interest in Motor-Columbus, aSwiss holding company whose most significant asset is an ap-proximate 59.3% ownership interest in Aare-Tessin AG für
Elektrizität (Atel), a Swiss group engaged in the production,distribution and trading of electricity.
UBS now consolidates Motor-Columbus and treated theacquisition of the 20% ownership interest as a business com-bination. The purchase price was allocated to acquired net as-sets of approximately CHF 260 million and the difference ofCHF 119 million to the purchase price was recognized asgoodwill. In accordance with IFRS 3, the existing 35.6% in-terest in Motor-Columbus was revalued to the valuation ba-sis established at 1 July 2004, resulting in a revaluation amountof approximately CHF 81 million (CHF 63 million net of de-ferred tax liabilities), which was recorded directly in equity. Theminority interests were also revalued to the new valuation ba-sis, so that assets acquired and liabilities assumed are carriedat full fair value. Details of assets, liabilities and minority in-terests, for which a step-up to fair value was recognized in pur-chase accounting, and all other assets and liabilities recog-nized at carryover basis are as follows:
169
Note 38 Business Combinations (continued)
Step-up toCHF million Book value fair value Fair value
Assets
Intangible assets 444 750 1,194
Property and equipment 1,939 144 2,083
Investments in associates 655 367 1,022
Financial investments 621 19 640
Deferred tax assets 113 67 180
All other assets 2,629 – 2,629
Total assets 6,401 1,347 7,748
Liabilities
Provisions 835 75 910
Debt issued 700 27 727
Deferred tax liabilities 293 308 601
All other liabilities 3,045 – 3,045
Total liabilities 4,873 410 5,283
Minority interests 784 382 1,166
Equity 744 555 1,299
Total liabilities, minority interests and equity 6,401 1,347 7,748
The CHF 75 million step-up to fair value of provisions relatesto contingent liabilities arising from guarantees and certaincontractual obligations. UBS’s share in the equity at fair valueof CHF 1,299 million is CHF 723 million, while the remainingCHF 576 million is recognized as additional minority interests,bringing total minority interest as of the acquisition date toCHF 1,742 million.
Useful economic lives between 4 and 25 years have beenassigned to amortizable and depreciable assets based on con-tractual lives, where applicable, or estimates of the period dur-ing which the assets will benefit the operations.

Financial StatementsNotes to the Financial Statements
Pro-forma information (unaudited)The following pro-forma information shows UBS’s total oper-ating income, net profit and basic earnings per share as if allof the above acquisitions had been made as at 1 January 2004
and 2003, respectively. Adjustments have been made to re-flect additional amortization and depreciation of assets andliabilities, which have been assigned fair values different fromtheir carryover basis in purchase accounting.
170
Note 38 Business Combinations (continued)
For the year ended
CHF million, except where indicated 31.12.04 31.12.03
Total operating income 44,812 39,536
Net profit 8,112 6,277
Basic earnings per share (CHF) 7.71 5.62
Note 39 Currency Translation Rates
The following table shows the principal rates used to translate the financial statements of foreign entities into Swiss francs:
Spot rate Average rateAs at Year ended
31.12.04 31.12.03 31.12.04 31.12.03 31.12.02
1 USD 1.14 1.24 1.24 1.34 1.54
1 EUR 1.55 1.56 1.54 1.54 1.46
1 GBP 2.19 2.22 2.27 2.20 2.33
100 JPY 1.11 1.15 1.15 1.16 1.24

The consolidated financial statements of UBS are prepared inaccordance with International Financial Reporting Standards.Set out below are the significant differences regarding recog-nition and measurement between IFRS and the provisions of theBanking Ordinance and the Guidelines of the Swiss BankingCommission governing financial statement reporting pursuantto Article 23 through Article 27 of the Banking Ordinance.
1. ConsolidationUnder IFRS, entities which are directly or indirectly controlledby the Group are consolidated. Temporarily controlled entitiesthat are acquired and held with a view to their subsequentdisposal, are recorded as Financial investments.
Under Swiss law, only entities that are active in the field ofbanking and finance as well as real estate entities are subjectto consolidation. Entities which are held temporarily arerecorded as Financial investments.
2. Financial investmentsUnder IFRS, available-for-sale financial investments are carriedat fair value. Changes in fair value are recorded directly inShareholders’ equity until an investment is sold, collected orotherwise disposed of, or until an investment is determinedto be impaired. At the time an available-for-sale investmentis determined to be impaired, the cumulative unrealized losspreviously recognized in Shareholders’ equity is included in netprofit or loss for the period. On disposal of a financial invest-ment, the difference between the net disposal proceeds andthe carrying amount plus any attributable unrealized gain orloss balance recognized in Shareholders’ equity, is included innet profit or loss for the period.
Under Swiss law, financial investments are carried at thelower of cost or market value. Reductions to market value be-low cost and reversals of such reductions as well as gains andlosses on disposal are included in Other income.
3. Cash flow hedgesThe Group uses derivative instruments to hedge against theexposure from varying cash flows receivable and payable. Un-
der IFRS, when hedge accounting is applied for these instru-ments, the unrealized gain or loss on the effective portion ofthe derivatives is recorded in Shareholders’ equity until thehedged cash flows occur, at which time the accumulated gainor loss is realized and released to income.
Under Swiss law, the unrealized gains or losses on the ef-fective portion of the derivative instruments used to hedgecash flow exposures are deferred on the balance sheet as as-sets or liabilities. The deferred amounts are released to incomewhen the hedged cash flows occur.
4. Investment propertyUnder IFRS, investment properties are carried at fair value.
Under Swiss law, investment properties are carried at thelower of cost less accumulated depreciation or market value.Depreciations on investment properties are continued until asale is executed.
5. Fair value optionUnder IFRS, the Group applies the fair value option to hybridinstruments issued. As a result the embedded derivative aswell as the host contract related to the hybrid instrument aremarked to market.
Under Swiss law, the fair value option is not available. Hy-brid instruments are bifurcated: while the embedded deriva-tive is marked to market, the host contract is accounted foron an accrued cost basis.
6. GoodwillUnder IFRS, goodwill acquired in business combinations en-tered into after 31 March 2004 is not amortized, but testedannually for impairment. Intangible assets acquired in businesscombinations entered into after 31 March 2004 to which anindefinite useful life has been assigned, are not amortized buttested annually for impairment.
Under Swiss law, goodwill and intangible assets with in-definite useful lives must be amortized over a period not ex-ceeding five years, unless a longer useful life, which may notexceed twenty years, can be justified.
171
Note 40 Swiss Banking Law Requirements

Financial StatementsNotes to the Financial Statements
The consolidated financial statements of UBS have been pre-pared in accordance with IFRS. The principles of IFRS differ incertain respects from United States Generally Accepted Ac-counting Principles (“US GAAP”). The following is a summa-ry of the relevant significant accounting and valuation differ-ences between IFRS and US GAAP.
a. Purchase accounting (merger of Union Bank ofSwitzerland and Swiss Bank Corporation)
Under IFRS, the 1998 merger of Union Bank of Switzerlandand Swiss Bank Corporation was accounted for under theuniting of interests method. The balance sheets and incomestatements of the banks were combined, and no adjustmentswere made to the carrying values of the assets and liabilities.Under US GAAP, the business combination creating UBS AGis accounted for under the purchase method with Union Bankof Switzerland being considered the acquirer. Under the pur-chase method, the cost of acquisition is measured at fair val-ue and the acquirer’s interests in identifiable tangible assetsand liabilities of the acquiree are restated to fair values at thedate of acquisition. Any excess consideration paid over the fairvalue of net tangible assets acquired is allocated, first to iden-tifiable intangible assets based on their fair values, if deter-minable, with the remainder allocated to goodwill.
Goodwill and intangible assetsFor US GAAP purposes, the excess of the consideration paidfor Swiss Bank Corporation over the fair value of the net tan-gible assets received has been recorded as goodwill and wasamortized on a straight-line basis using a weighted averagelife of 13 years from 29 June 1998 to 31 December 2001.
Under US GAAP until 31 December 2001, goodwill ac-quired before 30 June 2001 was capitalized and amortizedover its estimated useful life with adjustments for any impair-ment.
On 1 January 2002, UBS adopted SFAS 141, “BusinessCombinations” and SFAS 142, “Goodwill and Other Intan-gible Assets”. SFAS 141 requires reclassification of intangi-ble assets to goodwill which no longer meet the recognitioncriteria under the new standard. SFAS 142 requires thatgoodwill and intangible assets with indefinite lives no longerbe amortized but be tested annually for impairment. Identi-fiable intangible assets with finite lives will continue to beamortized. Upon adoption, the amortization charges relat-ed to the 1998 business combination of Union Bank ofSwitzerland and Swiss Bank Corporation ceased to be record-ed under US GAAP.
In 2004 and 2003, goodwill recorded under US GAAP wasreduced by CHF 78 million and CHF 39 million respectively,
due to recognition of deferred tax assets of Swiss Bank Cor-poration which had previously been subject to valuation re-serves.
Other purchase accounting adjustmentsThe restatement of Swiss Bank Corporation’s net assets to fairvalue in 1998 resulted in decreasing net tangible assets by CHF1,077 million for US GAAP. This amount is being amortizedover periods ranging from two years to 20 years.
b. Reversal of IFRS goodwill amortization
The adoption of SFAS 142 “Goodwill and Intangible Assets”resulted in two new reconciling items: 1) Intangible assets onthe IFRS balance sheet with a book value of CHF 1.8 billion at1 January 2002 were reclassified to Goodwill for US GAAP;2) The amortization of IFRS Goodwill and the Intangible as-sets reclassified to Goodwill for US GAAP (CHF 778 million,CHF 831 million and CHF 1,017 million for the years ended31 December 2004, 31 December 2003 and 31 December2002, respectively) was reversed.
With the adoption of IFRS 3 Business Combinations, UBSwill cease amortizing pre-existing Goodwill under IFRS begin-ning 1 January 2005. Goodwill will be subject to an annualimpairment test as it is under US GAAP, and there will nolonger be a difference between the two sets of standards re-garding goodwill amortization. Goodwill from business com-binations entered into on or after 31 March 2004 has alreadybeen accounted for under the provisions of IFRS 3, and noGoodwill amortization has been recorded for these transac-tions under IFRS or US GAAP.
c. Purchase accounting under IFRS 3 and FAS 141
With the adoption of IFRS 3 on 31 March 2004, the account-ing for business combinations generally converged with USGAAP with the exception of the measurement of minority in-terests and the recognition of a revaluation reserve in the caseof a step acquisition.
Under IFRS, minority interests are recognized at the per-centage of fair value of identifiable net assets acquired at theacquisition date whereas under US GAAP they are recognizedat the percentage of book value of identifiable net assets ac-quired at the acquisition date. In most cases, minority inter-ests would tend to have a higher measurement value underIFRS than under US GAAP.
Furthermore, IFRS requires that in a step acquisition the ex-isting ownership interest in an entity be revalued to the newvaluation basis established at the time of acquisition. The in-crease in value is recorded directly in equity as a revaluation
172
Note 41 Reconciliation of International Financial Reporting Standards (IFRS) to United States GenerallyAccepted Accounting Principles (US GAAP)
Note 41.1 Valuation and Income Recognition Differences between IFRS and US GAAP

reserve. Under US GAAP, the existing ownership interest re-mains at its original valuation.
d. Derivative instrumentsUnder IAS 39, UBS hedges interest rate risk based on forecastcash inflows and outflows on a Group basis. For this purpose,UBS accumulates information about non-trading financial as-sets and financial liabilities, which is then used to estimate andaggregate cash flows and to schedule the future periods inwhich these cash flows are expected to occur. Appropriate de-rivative instruments are then used to hedge the estimated fu-ture cash flows against repricing risk. SFAS 133 does not per-mit hedge accounting for hedges of future cash flowsdetermined by this methodology. Accordingly, for US GAAPsuch hedging instruments continue to be carried at fair valuewith changes in fair value recognized in Net trading income.
In addition, amounts deferred under hedging relationshipsprior to the adoption of IAS 39 on 1 January 2001 that do notqualify as hedges under current requirements under IFRS areamortized to income over the remaining life of the hedgingrelationship. Such amounts have been reversed for US GAAPas they have never been treated as hedges.
e. Financial investments and private equity
Financial investments available-for-saleThree exceptions exist between IFRS and US GAAP in account-ing for financial investments available-for-sale: 1) Non-mar-ketable equity financial investments (excluding private equi-ty investments discussed below), which are classified asavailable-for-sale and carried at fair value under IFRS, contin-ue to be carried at cost less “other than temporary” impair-ments under US GAAP. The opening adjustment and subse-quent changes in fair value recorded directly in Shareholders’equity on non-marketable equity financial instruments due tothe implementation of IAS 39 have been reversed under USGAAP to reflect the difference between the two standards inmeasuring such investments. 2) Writedowns on impaired debtinstruments can be fully or partially reversed under IFRS if thevalue of the impaired assets increases. Such reversals of im-pairment writedowns are not allowed under US GAAP. Rever-sals under IFRS were not significant in 2004, 2003 or 2002.3) Private equity investments, as described in the next section.
Private equity investmentsUBS accounts for private equity investments as available-for-sale securities in its primary Financial Statements under IFRS,with changes in fair value recognized in Shareholders’ equi-ty. Under US GAAP, all of these investments were accountedfor at cost less “other than temporary” impairments prior to1 January 2002.
On 1 January 2002, UBS adopted the provisions of SFAS144 “Accounting for the Impairment or Disposal of Long-LivedAssets” for its US GAAP Financial Statements. The statementprimarily addresses financial accounting and reporting for theimpairment or disposal of long-lived assets. In addition, SFAS144 eliminated the exception to consolidation for subsidiariesfor which control is likely to be temporary, as previously con-tained in Accounting Research Bulletin 51 “Consolidated Fi-nancial Statements” as amended by SFAS 94 “Consolidationof All Majority-Owned Subsidiaries”. Therefore, on adoptingSFAS 144, UBS changed its US GAAP accounting for certainprivate equity investments by accounting for those invest-ments held within separate investment subsidiaries in accor-dance with the “AICPA Audit and Accounting Guide, Auditsof Investment Companies”. The effect of this change for USGAAP reporting purposes is that certain private equity invest-ments are now recorded at fair value, with changes in fair val-ue recognized in US GAAP net profit. The remaining privateequity investments continue to be accounted for at cost less“other than temporary” impairment.
For the IFRS to US GAAP reconciliation, fair value adjust-ments on certain private equity investments recorded direct-ly in Shareholders’ equity under IFRS had to be shown in theincome statement for US GAAP purposes. At 1 January 2002,the date of adoption of SFAS 144, the cumulative effect ofthis change in accounting on US GAAP net profit was an in-crease of CHF 639 million, after tax. For the years ended 31December 2004, 31 December 2003 and 31 December 2002,the effect of applying the new standard on the reconciliationof IFRS net profit to US GAAP was to increase US GAAP netprofit by CHF 154 million after tax, decrease US GAAP netprofit by CHF 119 million, after tax and to increase US GAAPnet profit by CHF 83 million, after tax, respectively.
The pro-forma Net profit assuming that the change in ac-counting principle were applied retroactively would be as fol-lows:
173
CHF million, except for per share data Pro-formaFor the year ended 31.12.04 31.12.03 31.12.02
Net profit under US GAAP 8,818 6,513 4,907
Basic earnings per share 8.56 5.83 4.06
Diluted earnings per share 8.15 5.72 3.99
See Note 2 for information regarding impairment charges recorded for private equity investments.

Financial StatementsNotes to the Financial Statements
f. Pension plans
Under IFRS, UBS recognizes pension expense based on a spe-cific method of actuarial valuation used to determine the pro-jected plan liabilities for accrued service, including future ex-pected salary increases, and expected return on plan assets.Plan assets are recorded at fair value and are held in a sepa-rate trust to satisfy plan liabilities. Under IFRS the recognitionof a prepaid asset is subject to certain limitations, and any un-recognized prepaid asset is recorded as pension expense. USGAAP does not allow a limitation on the recognition of pre-paid assets recorded in the balance sheet.
Under US GAAP, pension expense is based on the same ac-tuarial method of valuation of liabilities and assets as underIFRS. Differences in the amounts of expense and liabilities (orprepaid assets) exist due to different transition date rules,stricter provisions for recognition of a prepaid asset, and thetreatment of the 1998 merger of Union Bank of Switzerlandand Swiss Bank Corporation.
In addition, under US GAAP, if the fair value of plan assetsfalls below the accumulated benefit obligation (which is the cur-rent value of accrued benefits without allowance for future salaryincreases), an additional minimum liability must be shown in thebalance sheet. If an additional minimum liability is recognized,an equal amount will be recognized as an intangible asset up tothe amount of any unrecognized prior service cost. Any amountnot recognized as an intangible asset is reported in Other com-prehensive income. The additional minimum liability required un-der US GAAP amounts to CHF 1,125 million, CHF 306 millionand CHF 1,225 million as at 31 December 2004, 2003 and 2002,respectively. The amount recognized in intangible assets was CHF0 million, CHF 0 million and CHF 2 million and the amount rec-ognized in Other comprehensive income before tax was CHF1,125 million, CHF 306 million and CHF 1,223 million as at 31December 2004, 2003 and 2002, respectively.
g. Other post-retirement benefit plans
Under IFRS, UBS has recorded expenses and liabilities forpost-retirement medical and life insurance benefits, deter-mined under a methodology similar to that described aboveunder pension plans.
Under US GAAP, expenses and liabilities for post-retirementmedical and life insurance benefits are determined under thesame methodology as under IFRS. Differences in the levels of ex-penses and liabilities have occurred due to different transition daterules and the treatment of the merger of Union Bank of Switzer-land and Swiss Bank Corporation under the purchase method.
h. Equity participation plans
As of the reporting date, IFRS does not have any standard ineffect that specifically addresses the recognition and measure-ment requirements for equity participation plans.
US GAAP permits the recognition of compensation costbased on the grant date fair value of equity instruments is-sued (SFAS 123) or based on the intrinsic value of equity in-struments issued (Accounting Principles Board “APB” No.25). If an entity elects to apply the APB 25 intrinsic valuemethod they must provide pro forma disclosures of net prof-it and earnings per share, as if the fair value based methoddescribed in SFAS 123 had been applied. Under IFRS, UBS rec-ognizes the intrinsic value of equity instruments issued meas-ured at the grant date. No subsequent changes in value arerecognized. Under US GAAP, UBS applies the APB No. 25 in-trinsic value method, which requires adjustments to intrinsicvalues subsequent to the grant date in certain circumstances.
Prior to January 2004, certain equity compensation trustswere consolidated under US GAAP. With the adoption of FIN46-R, “Consolidation of Variable Interest Entities” on 1 Jan-uary 2004, the remaining unconsolidated employee equitycompensation trusts formed before 1 February 2003 wereconsolidated for US GAAP purposes for the first time. The ef-fect of the trust consolidations is to increase assets by CHF1,175 million and CHF 460 million and liabilities by CHF 1,175million and CHF 483 million at 31 December 2004 and 31 De-cember 2003 respectively.
With the consolidation of the additional trusts under FIN46-R, UBS has re-evaluated its accounting for share-basedcompensation plans under APB 25 by taking into considera-tion the settlement methods and activities of the trusts. Basedon this review, most share plans issued prior to 2001 are nowtreated as variable awards under APB 25. There were nochanges to the accounting for option plans. On 1 January2004, a CHF 6 million expense reduction was recorded as acumulative adjustment due to a change in accounting. For theyear ended 31 December 2004, CHF 67 million in expense wasrecorded in the US GAAP income statement for these variableplans.
In addition, prior to the adoption of FIN 46-R, certain ofUBS’s option awards had been determined to be variable pur-suant to APB No. 25, primarily because they may be settledin cash or because UBS has offered to hedge the value of theaward. The effect of applying variable accounting to these op-tion awards in the US GAAP reconciliation for the years end-ed 31 December 2004, 2003 and 2002, is a CHF 10 millionincrease in compensation expense, CHF 28 million increase incompensation expense and CHF 51 million decrease in com-pensation expense, respectively. In addition, certain of UBS’sshare plans have been deemed variable under APB No. 25. Ad-ditional expense was also recorded related to social tax pay-ments on equity instruments recorded directly in Sharehold-ers’ equity for IFRS. For US GAAP, the net effect of thesetransactions is an increase to compensation expense of CHF27 million, an increase to compensation expense of CHF 118million and a decrease to compensation expense of CHF 12million, for the years ended 31 December 2004, 2003 and2002, respectively.
174

i. Software capitalization
Under IFRS, effective 1 January 2000, certain costs associat-ed with the acquisitions or development of internal-use soft-ware had to be capitalized. Once the software was ready forits intended use, the costs capitalized were amortized to theincome statement over the estimated life of the software. Un-der US GAAP, the same principle applied, however this stan-dard was effective 1 January 1999. For US GAAP, the costs as-sociated with the acquisition or development of internal-usesoftware that met the US GAAP software capitalization crite-ria in 1999 were reversed from Operating expenses and amor-tized over a life of two years from the time that the soft-ware was ready for its intended use. From 1 January 2000, the only remaining reconciliation item was the amortization ofsoftware capitalized in 1999 for US GAAP purposes. At 31 December 2002, this amount was fully utilized and thereis no longer a difference between IFRS and US GAAP.
j. Consolidation of Variable Interest Entities (VIEs) anddeconsolidation of trust preferred securities
IFRS and US GAAP generally require consolidation of entitieson the basis of controlling a majority of voting rights. How-ever, in certain situations, there are no voting rights, or con-trol of a majority of voting rights is not a reliable indicator ofthe need to consolidate, such as when voting rights are sig-nificantly disproportionate to risks and rewards. There are dif-ferences in the approach of IFRS and US GAAP to those situ-ations.
Under IFRS, when control is exercised through means oth-er than controlling a majority of voting rights, the consolida-tion assessment is based on the substance of the relationship.Indicators of control in these situations include: predetermi-nation of the entity’s activities; the entity’s activities being con-ducted on behalf of the enterprise; decision-making powersbeing held by the enterprise; the right to obtain the majorityof the benefits or be exposed to the risks inherent in the ac-tivities of the entity; or retaining the majority of the residualor ownership risks related to the entity’s assets in order to ob-tain benefits from its activities.
Under US GAAP, consolidation considerations are subjectto FASB interpretation No. 46, “Consolidation of Variable In-terest Entities (revised December 2003)”, an interpretation ofAccounting Research Bulletin No. 51 (FIN 46-R). FIN 46-R re-quires that when voting interests do not exist, or differ signif-icantly from economic interests, an entity is considered to bea “Variable Interest Entity” (“VIE”). An enterprise holding vari-able interests that will absorb a majority of a VIE’s “expectedlosses”, receive a majority of a VIE’s “expected residual re-turns”, or both, is known as the “primary beneficiary”, andmust consolidate the VIE.
From 1 January 2004 UBS has fully applied FIN 46-R con-solidation requirements to its US GAAP financial statements.
At 31 December 2003, the consolidation requirements ofthe predecessor standard, FIN 46, only applied to VIEs createdafter 31 January 2003.
In many cases the assessment of consolidation under IFRSand US GAAP is the same, however, there are certain differ-ences.
The entities consolidated for US GAAP purposes at 31 De-cember 2004, which were not otherwise consolidated inUBS’s primary consolidated Financial Statements under IFRS,are mostly investment fund products, securitization VIEs, andemployee equity compensation trusts. These are discussed inmore detail in Note 42.1.
The entities not consolidated for US GAAP purposes, whichUBS consolidates under IFRS, are certain trusts which have is-sued trust preferred securities. Under IFRS these are equity in-struments held by third parties and are treated as minority in-terests, with dividends paid also reported in minority interests;under US GAAP the securities are treated as debt, with inter-est paid reported in interest expense.
A discussion of FIN 46-R measurement requirements anddisclosures is set out in Note 42.1.
k. Financial liabilities held at fair value through profitand loss
Revised IAS 39 provides the election to designate at initialrecognition any financial asset or liability as held at fair valuethrough profit and loss. UBS applies this fair value designa-tion election to a significant portion of its issued debt. Manydebt issues are in the form of hybrid instruments, consistingof a debt host with an embedded derivative. Regular debt in-struments as well as hybrid instruments are carried in their en-tirety at fair value with all changes in fair value recorded inprofit and loss. Under US GAAP, debt instruments have to becarried at amortized cost. Derivatives embedded in hybrid in-struments are separated from the debt hosts and accountedfor as if they were freestanding derivatives.
l. Physically settled written puts
With the adoption of revised IAS 32 and IAS 39 at 1 January2004, the accounting for physically settled written put optionson UBS shares changed. Previously, such put options were ac-counted for as derivatives whereas now the present value ofthe contractual amount is recorded as a liability, while the pre-mium received is credited to equity. Subsequently, the liabili-ty is accreted over the life of the put option to its contractu-al amount recognizing interest expense in accordance with theeffective interest method. Under US GAAP, physically settledwritten put options on UBS shares continue to be accountedfor as derivative instruments. All other outstanding derivativecontracts, except written put options with the UBS share asunderlying, are treated as derivative instruments under bothsets of accounting standards.
175

Financial StatementsNotes to the Financial Statements
m. Investment properties
As at 1 January 2004, UBS changed its accounting for in-vestment properties from the cost less depreciation methodto the fair value method. Under the fair value method,
changes in fair value are recognized in the income statement,and depreciation is no longer recognized. Under US GAAP, in-vestment properties continue to be carried at cost less accu-mulated depreciation.
176
Note 41.2 Recently Issued US Accounting Standards
In December 2003, the “Medicare Prescription Drug, Im-provement and Modernization Act of 2003” (the Act) waspassed in the US. Commencing 1 January 2006, the Act in-troduces a prescription drug benefit for individuals eligible un-der Medicare (Medicare Part D) as well as a federal subsidyequal to 28% of certain post-65 prescription drug claims forsponsors of retiree health care plans with drug benefits thatare at least actuarially equivalent to those to be offered un-der Medicare Part D.
Pursuant to the guidance included in FASB Staff PositionFAS 106-1 (FSP 106-1), the Group chose to defer recognitionof the potential effects of the Act in its 2003 Financial State-ments due to the lack of authoritative accounting guidanceconcerning certain technical matters.
In May 2004, the FASB issued FASB Staff Position FAS 106-2, Accounting and Disclosure Requirements Related to theMedicare Prescription Drug, Improvement and ModernizationAct of 2003 (FSP 106-2) which supersedes FSP 106-1. FSP106-2 requires plan sponsors to account for the effect of the sub-sidy on benefits attributable to past service as an unrecognizedactuarial gain and as a reduction of the service cost compo-nent of the net periodic post-retirement costs for amounts at-tributable to current service if prescription drug benefits avail-able under the plan are actuarially equivalent to those underMedicare Part D for 2006. UBS believes that the US health careplans will be eligible for the subsidy and prospectively adopt-ed FSP 106-2 on 1 July 2004. The adoption of FSP 106-2 didnot have a material effect on UBS’s Financial Statements.
In December 2003, the FASB issued revised SFAS 132 “Em-ployers’ Disclosures about Pensions and Other PostretirementBenefits” (SFAS 132-R). SFAS 132-R retains the disclosure re-quirements included in SFAS 132, Employers’ Disclosuresabout Pensions and Other Postretirement Benefits, which itreplaces. SFAS 132-R requires additional disclosures to thosein SFAS 132 regarding the assets, obligations, cash flows andnet periodic benefit cost of defined benefit pension plans andother defined benefit postretirement plans. Except for certaindisclosures relating to foreign plans and disclosures regardingthe estimated future benefit payments prescribed in SFAS 132-R, SFAS 132-R was effective for financial statements withfiscal years ending after 15 December 2003. The remainingadditional disclosures regarding foreign plans and the estimat-ed future benefit payments disclosures are effective for finan-cial statements with fiscal years ending after 15 June 2004.
UBS elected to adopt early the additional disclosures requiredfor foreign plans as well as the prescribed SFAS 132-R disclo-sures in its 2003 Financial Statements. Pursuant to the tran-sitional disclosure requirements, UBS included the disclosureof the estimated future benefit payments for the year ended31 December 2004 in Note 31, Pension and Other Post-Re-tirement Benefit Plans.
In November 2003, the FASB’s Emerging Issues Task Force(EITF) issued EITF 03-1, “The Meaning of Other-Than-Tempo-rary Impairment and Its Application to Certain Investments”.The EITF reached a consensus regarding certain qualitative andquantitative disclosures for debt and marketable equity secu-rities classified as available-for-sale or held to maturity underSFAS 115 and 124 that are impaired at the balance sheet datebut for which an other-than-temporary impairment has notbeen recognized. UBS provided the required EITF 03-1 disclo-sures in Note 12 of the 2003 Financial Statements.
In March 2004, the EITF reached a consensus on an other-than-temporary impairment model for debt and equity secu-rities classified as available-for-sale or held to maturity underSFAS 115 and 124 and equity securities held under the costmethod. This EITF consensus would have been effective forinterim and annual reporting periods beginning after 15 June2004. In September 2004, the FASB staff issued FSP 03-1-1,“Effective Date of Paragraphs 10-20 of EITF 03-1, The Mean-ing of Other Than Temporary Impairment”, which delayed theeffective date for the recognition and measurement guidanceincluded in EITF 03-1. The EITF 03-1 disclosure requirementswere not delayed and are included in Note 12.
In December 2003, the FASB issued FASB Interpretation No.46 “Consolidation of Variable Interest Entities (revised Decem-ber 2003), an Interpretation of ARB No. 51” (FIN 46-R) whichaddresses how an enterprise should evaluate whether it hasa controlling financial interest in an entity through means oth-er than voting rights and accordingly wether it should consol-idate the entity. This consolidation evaluation under FIN 46-Rreduces the impact of a decision maker in the calculation ofexpected losses and expected residual returns compared to theconsolidation evaluation under the original FIN 46. FIN 46-Ralso changed the definition of a variable interest.
As an SEC foreign registrant, UBS applied the consolida-tion requirements for VIEs created before 1 February 2003 forthe first time on 1 January 2004. To VIEs created after 31 Jan-uary 2003, the original FIN 46 was applied for the first time

at 31 December 2003. Under FN 46-R, at 1 January 204, sev-eral of UBS’s employee equity compensation trusts were con-solidated for the first time, while trust preferred security ve-hicles were deconsolidated.
The adoption of FIN 46-R is discussed in more detail in Note42.
Recently issued US accounting standards not yet adoptedIn December 2004, the FASB issued SFAS 123 (revised 2004),“Share-Based Payment”, (SFAS 123-R) which is a revision ofSFAS 123, “Accounting for Stock-Based Compensation”(SFAS 123) and supersedes APB Opinion 25, “Accounting forStock Issued to Employees” (APB Opinion 25). SFAS 123-R re-quires all share-based payments to employees, includinggrants of employee stock options, to be recognized in the in-come statement based on their fair values at date of grant,eliminating the pro-forma disclosure alternative. Further, SFAS123-R introduces the notion of a requisite service period,which indicates that the service period for awards with futurevesting may not be defined as a prior period. For UBS this willresult in a change in the expense attribution period for awards.
SFAS 123-R is effective for interim or annual reporting pe-riods beginning after 15 June 2005 with earlier applicationpermitted. UBS will adopt SFAS 123-R effective 1 January 2005using the modified prospective method. Under this method,SFAS 123-R applies only to new awards that are granted, mod-ified or settled after the Standard is adopted. Compensationcost for prior awards shall be based on the grant date fair val-ue and expense attribution method used for recognition ordisclosure purposes under SFAS 123. Prior periods will not berestated.
UBS currently accounts for share-based payments using theintrinsic value method under APB 25, and as such, generallyrecognizes no compensation cost for employee stock op-tions. Under this approach UBS recognized the fair value of
share awards granted as part of annual bonuses in the yearof corresponding performance, aligning with the revenueproduced. For disclosure purposes, UBS recognized the fair val-ue of option awards on the date of grant. Thus, for recogni-tion and disclosure purposes, expense for share and optionawards issued prior to but outstanding at the date of adop-tion of SFAS 123-R has been fully attributed to prior periods.Further, share awards issued in 2005 as part of the 2004 per-formance year, have been fully recognized in 2004. Thereforeunder SFAS 123-R, only option awards and certain shareawards granted, modified or settled after the effective dateare to be recognized in the 2005 financial statements. Theseawards will be recognized over the requisite service period asnewly defined in SFAS 123-R, which is expected to result in aramp-up of compensation expense over the next several yearsas these awards move through their vesting periods. There-fore, compensation expense is expected to decrease in 2005compared to 2004 as the ramp-up effect for the share awardswill offset the first-time recognition of the fair value of optionawards. However, compensation cost will increase as awardsto which the new measurement and attribution requirementsapply move through their vesting period. Once these initialawards are fully vested (generally three years), compensationexpense under SFAS 123-R is not expected to be materially dif-ferent than what would be disclosed in the pro-forma disclo-sures under SFAS 123.
In 2005 UBS will be introducing a new valuation model todetermine the fair value of share options granted. Share op-tions granted in 2004 and earlier will not be affected by thischange in valuation model. This new valuation model betterreflects the exercise behavior of employees and the specificterms and conditions under which the share options aregranted. Concurrent with the introduction of the new mod-el, UBS will use implied instead of historic volatility as inputinto the new model.
177

Financial StatementsNotes to the Financial Statements
178
Note 41.3 Reconciliation of IFRS Shareholders’ Equity and Net profit to US GAAP
Note 41.1 Shareholders’ equity Net profit
CHF million Reference 31.12.04 31.12.03 31.12.04 31.12.03 31.12.02
Amounts determined in accordance with IFRS 34,978 35,310 8,089 6,239 3,530
Adjustments in respect of:
SBC purchase accounting goodwill and other purchase accounting adjustments a 15,152 15,196 (44) (89 ) (128 )
Reversal of IFRS goodwill amortization b 2,603 1,825 778 808 1,017
Purchase accounting under IFRS 3 and FAS 141 c (88) 0 3 0 0
Derivative instruments d (75) (94 ) (217) 188 342
Financial investments and private equity e (266) (84 ) 304 (159 ) 767
Pension plans f 372 1,303 (110) (235 ) (156 )
Other post-retirement benefit plans g (1) (1 ) 0 0 7
Equity participation plans h (80) (112 ) (98) (152 ) 63
Software capitalization i 0 0 0 0 (60 )
Consolidation of variable interest entities (VIEs) and deconsolidation of trust preferred securities j 47 (10 ) 18 (10 ) 0
Financial liabilities held at fair value through profit and loss k 197 117 100 78 39
Physically settled written puts l 93 48 9 5 3
Investment properties m (8) (24 ) 14 88 (23 )
Other adjustments (50) 0 (50) 0 0
Tax adjustments (206) (300 ) 22 (248 ) 145
Total adjustments 17,690 17,864 729 274 2,016
Amounts determined in accordance with US GAAP 52,668 53,174 8,818 6,513 5,546
Note 41.4 Earnings per Share
Under both IFRS and US GAAP, basic earnings per share (“EPS”) is computed by dividing income available to commonshareholders by the weighted average number of common shares outstanding. Diluted EPS includes the determinants of basic EPS and, in addition, gives effect to dilutive potential common shares that were outstanding during the period.
The computations of basic and diluted EPS for the years ended 31 December 2004, 31 December 2003 and 31 Decem-ber 2002 are presented in the following table.
31.12.04 31.12.03 31.12.02
For the year ended US GAAP IFRS US GAAP IFRS US GAAP IFRS
Net profit available for ordinary shares (CHF million) 8,818 8,089 6,513 6,239 5,546 3,530
Net profit for diluted EPS (CHF million) 8,813 8,084 6,514 6,240 5,520 3,510
Weighted average shares outstanding 1,029,895,610 1,052,914,417 1,116,602,289 1,116,953,623 1,208,055,132 1,208,586,678
Diluted weighted average shares outstanding 1,081,961,360 1,081,961,360 1,138,800,625 1,138,800,625 1,222,862,165 1,223,382,942
Basic earnings per share (CHF) 8.56 7.68 5.83 5.59 4.59 2.92
Diluted earnings per share (CHF) 8.15 7.47 5.72 5.48 4.51 2.87

In addition to the differences in valuation and income recog-nition, other differences, essentially related to presentation,exist between IFRS and US GAAP. Although there is no impacton IFRS and US GAAP reported Shareholders’ equity and Netprofit due to these differences, it may be useful to understandthem to interpret the financial statements presented in accor-dance with US GAAP. The following is a summary of presen-tation differences that relate to the basic IFRS financial state-ments.
1. Settlement date vs. trade date accountingUBS’s transactions from securities activities are recorded un-der IFRS on the settlement date. This results in recording a for-ward transaction during the period between the trade dateand the settlement date. Forward positions relating to trad-ing activities are revalued to fair value and any unrealized prof-its and losses are recognized in Net profit.
Under US GAAP, trade date accounting is required for spotpurchases and sales of securities. Therefore, all such transac-tions with a trade date on or before the balance sheet datewith a settlement date after the balance sheet date have beenrecorded at trade date for US GAAP. This has resulted in re-ceivables and payables to broker-dealers and clearing organ-izations recorded in Other assets and Other liabilities in theUS GAAP balance sheet.
2. Financial investmentsUnder IFRS, UBS’s private equity investments and non-mar-ketable equity financial investments are included in Financialinvestments. For US GAAP presentation, non-marketable eq-uity financial investments are reclassified to Other assets, andprivate equity investments are shown separately on the bal-ance sheet.
3. Securities received as proceeds in a securities forsecurities lending transactionWhen UBS acts as the lender in a securities lending agreementand receives securities as collateral that can be pledged or sold,it recognizes the securities received and a corresponding ob-ligation to return them. These securities are reflected on theUS GAAP balance sheet in the line “Securities received as col-lateral” on the asset side of the balance sheet. The offsetting
liability is presented in the line “Obligation to return securi-ties received as collateral”.
4. Reverse repurchase, repurchase, securities borrowing andsecurities lending transactionsUBS enters into certain types of reverse repurchase, repurchase,securities borrowing and securities lending transactions that re-sult in a difference between IFRS and US GAAP. Under IFRS, theyare considered borrowing and lending transactions which are notreflected in the balance sheet except to the extent of cash col-lateral advanced or received. Under US GAAP, however, they areconsidered purchase and sale transactions due to the fact thatthe contracts do not meet specific collateral or margining require-ments under SFAS 140. Due to the different treatment of thesetransactions under IFRS and US GAAP, interest income and ex-pense recorded under IFRS must be reclassified to Net tradingincome for US GAAP. Additionally under US GAAP, the securi-ties received are recognized on the balance sheet as a spot pur-chase (Trading portfolio assets) with a corresponding forwardsale transaction (Replacement values) and a receivable (Cash col-lateral on securities borrowed) is reclassified, as applicable. Thesecurities delivered are recognized as a spot sale (Trading port-folio liabilities) with a corresponding forward repurchase trans-action (Replacement values) and a liability (Cash collateral on se-curities lent) is reclassified, as applicable.
5. Recognition/derecognition of financial assetsThe guidance governing recognition and derecognition of afinancial asset is considerably more complex under revised IAS39 than previously and requires a multi-step decision processto determine whether derecognition is appropriate. UBS dere-cognizes financial assets for which it transfers the contractu-al rights to the cash flows and no longer retains any risk or re-ward coming from them nor maintains control over thefinancial assets. The provisions of this guidance were appliedprospectively as at 1 January 2004. As a result of the new re-quirements, certain transactions are now accounted for as se-cured financing transactions instead of purchases or sales oftrading portfolio assets with an accompanying swap deriva-tive. Under US GAAP, these transactions continue to be shownas purchases and sales of trading portfolio assets and werereclassified accordingly.
179
Note 41.5 Presentation Differences between IFRS and US GAAP

Financial StatementsNotes to the Financial Statements
Note 41.6 Consolidated Income Statement
The following is a Consolidated Income Statement of the Group, for the years ended 31 December 2004, 31 December 2003and 31 December 2002, restated to reflect the impact of valuation and income recognition differences and presentationdifferences between IFRS and US GAAP.
CHF million 31.12.04 31.12.03 31.12.02
For the year ended Reference US GAAP IFRS US GAAP IFRS US GAAP IFRS
Operating income
Interest income a, d, j, 4, 5 39,124 39,398 39,940 40,159 39,679 39,963
Interest expense a, j, k, 4, 5 (27,306) (27,538) (27,700 ) (27,860 ) (29,334 ) (29,417 )
Net interest income 11,818 11,860 12,240 12,299 10,345 10,546
Credit loss expense / (recovery) 276 276 (72 ) (72 ) (115 ) (115 )
Net interest income after credit loss expense / (recovery) 12,094 12,136 12,168 12,227 10,230 10,431
Net fee and commission income 19,416 19,416 17,345 17,345 18,221 18,221
Net trading income d, h, j, k, l, 4, 5 4,879 4,972 4,021 3,756 5,940 5,451
Other income 1 b, c, e, j, m 1,188 897 380 462 96 4
Income from Industrial Holdings 3,648 3,648
Total operating income 41,225 41,069 33,914 33,790 34,487 34,107
Operating expenses
Personnel expenses f, g, h 18,729 18,515 17,615 17,231 18,610 18,524
General and administrative expenses j 6,705 6,703 6,086 6,086 7,072 7,072
Depreciation of property and equipment a, i, m 1,385 1,352 1,396 1,353 1,613 1,514
Amortization of goodwill b 0 713 0 756 0 930
Amortization of other intangible assets b 186 251 112 187 1,443 1,530
Goods and materials purchased 2,861 2,861 0 0 0 0
Total operating expenses 29,866 30,395 25,209 25,613 28,738 29,570
Operating profit / (loss) before tax and minority interests 11,359 10,674 8,705 8,177 5,749 4,537
Tax expense / (benefit) 2,112 2,135 1,842 1,593 511 676
Net profit / (loss) before minority interests 9,247 8,539 6,863 6,584 5,238 3,861
Minority interests j (435) (450) (350 ) (345 ) (331 ) (331 )
Change in accounting principle: cumulative effect of adoption of “AICPA Audit and Accounting Guide, Audits of Investment Companies”on certain financial investments, net of tax 0 0 0 0 639 0
Cumulative adjustment of accounting for certain equity based compensation plans as cash settled, net of tax 6 0 0 0 0 0
Net profit 8,818 8,089 6,513 6,239 5,546 3,530
1 The CHF 304 million gain, CHF 159 million loss and CHF 108 million gain included in US GAAP Other income at 31 December 2004, 31 December 2003 and 31 December 2002, respectively are dueto UBS’s adoption of the “AICPA Audit and Accounting Guide, Audits of Investment Companies” on certain private equity investments for its US GAAP financial statements. These amounts represent thechange in fair value of these investments during 2004, 2003 and 2002.Note: References above coincide with the discussions in Note 41.1 and Note 41.5. These references indicate which IFRS to US GAAP differences affect an individual financial statement caption. Certainprior year US GAAP amounts in 2003 and 2002 have been adjusted to conform to the current year’s presentation.
180

Note 41.7 Condensed Consolidated Balance Sheet
The following is a Condensed Consolidated Balance Sheet of the Group, as at 31 December 2004 and 31 December 2003,restated to reflect the impact of valuation and income recognition principles and presentation differences between IFRS andUS GAAP.
31.12.04 31.12.03
CHF million Reference US GAAP IFRS US GAAP IFRS
Assets
Cash and balances with central banks 6,036 6,036 3,584 3,584
Due from banks h, j 35,286 35,264 31,758 31,740
Cash collateral on securities borrowed 4 218,414 220,242 211,058 213,932
Reverse repurchase agreements 357,164 357,164 320,499 320,499
Trading portfolio assets c, h, j,1, 4, 5 449,389 370,259 423,733 341,013
Trading portfolio assets pledged as collateral 159,115 159,115 120,759 120,759
Positive replacement values j, k, 1, 4, 5 284,468 284,577 248,924 248,206
Financial assets designated at fair value c 653
Loans a, j, 5 228,968 232,387 212,729 212,679
Financial investments e, j, 2 1,455 5,049 1,303 5,139
Securities received as collateral 3 12,950 13,071
Accrued income and prepaid expenses h, j 5,882 5,876 6,219 6,218
Investments in associates c 2,153 2,427 1,616 1,616
Property and equipment a, c, m 9,045 8,736 8,116 7,683
Goodwill a, b 26,977 8,847 26,775 9,348
Other intangible assets b, c 1,722 3,302 1,174 2,181
Private equity investments 2 3,094 3,308
Other assets c, d, f, h, j, 1, 2, 5 101,068 34,850 64,381 25,459
Total assets 1,903,186 1,734,784 1,699,007 1,550,056
Liabilities
Due to banks h, 1 119,021 118,901 127,385 127,012
Cash collateral on securities lent 4 57,792 61,545 51,157 53,278
Repurchase agreements j 423,513 422,587 415,863 415,863
Trading portfolio liabilities j, 1, 4, 5 190,907 171,033 149,380 143,957
Obligation to return securities received as collateral 3 12,950 13,071
Negative replacement values j, k, l, 1, 4, 5 360,345 303,712 326,136 254,768
Financial liabilities designated at fair value j, k, 5 65,756 35,286
Due to customers j, 5 386,913 376,083 347,358 346,633
Accrued expenses and deferred income j 14,830 14,685 13,673 13,673
Debt issued a, c, d, j, k, 1 164,744 117,828 123,259 88,843
Other liabilities c, d, f, g, h, j, l, m, 1 117,743 42,342 74,044 31,360
Total liabilities 1,848,758 1,694,472 1,641,326 1,510,673
Minority interests c ,j 1,760 5,334 4,507 4,073
Total shareholders’ equity 52,668 34,978 53,174 35,310
Total liabilities, minority interests and shareholders’ equity 1,903,186 1,734,784 1,699,007 1,550,056
Positive and Negative replacement values under US GAAP are presented on a gross basis for all periods presented.Note: References above coincide with the discussions in Note 41.1 and Note 41.5. These references indicate which IFRS to US GAAP differences affect an individual financial statement caption.
181

Financial StatementsNotes to the Financial Statements
Note 41.8 Comprehensive Income
Comprehensive income under US GAAP is defined as the change in shareholders’ equity excluding transactions with share-holders. Comprehensive income has two major components: Net profit, as reported in the income statement, and Othercomprehensive income. Other comprehensive income includes such items as foreign currency translation, unrealized gains /losses on available-for-sale securities, unrealized gains / losses on changes in fair value of derivative instruments designated ascash flow hedges and additional minimum pension liability. The components and accumulated other comprehensive incomeamounts on a US GAAP basis for the years ended 31 December 2004, 31 December 2003 and 31 December 2002 are asfollows:
Unrealized Accumu-gains / Unrealized lated other
(losses) on gains / Additional compre- Compre-Foreign available- (losses) on minimum Deferred hensive hensive
currency for-sale cash flow pension income income / income /CHF million translation investments hedges liability taxes (loss) (loss)
Balance at 1 January 2002 (769) 469 9 (303) (7) (601)
Net profit 5,546
Other comprehensive income:
Foreign currency translation (80 ) (80 ) (80 )
Net unrealized gains on available-for-sale investments 143 (34 ) 109 109
Impairment charges reclassified to the income statement 121 (26 ) 95 95
Reclassification of gains on available-for-sale investments realized in net profit (470 ) 102 (368 ) (368 )
Net unrealized losses on cash flow hedges (4 ) 3 (1 ) (1 )
Reclassification of gains on cash flow hedges realized in net profit (8 ) 0 (8 ) (8 )
Additional minimum pension liability (920 ) 93 (827 ) (827 )
Other comprehensive income / (loss) (80 ) (206 ) (12 ) (920 ) 138 (1,080 ) (1,080 )
Comprehensive income 4,466
Balance at 31 December 2002 (849) 263 (3) (1,223) 131 (1,681)
Net profit 6,513
Other comprehensive income:
Foreign currency translation (795 ) (795 ) (795 )
Net unrealized losses on available-for-sale investments (130 ) 49 (81 ) (81 )
Impairment charges reclassified to the income statement 111 (18 ) 93 93
Reclassification of gains on available-for-sale investments realized in net profit (69 ) 11 (58 ) (58 )
Reclassification of losses on cash flow hedges realized in net profit 3 (1 ) 2 2
Additional minimum pension liability 917 (82 ) 835 835
Other comprehensive income / (loss) (795 ) (88 ) 3 917 (41 ) (4 ) (4 )
Comprehensive income 6,509
Balance at 31 December 2003 (1,644) 175 0 (306) 90 (1,685)
Net profit 8,818
Other comprehensive income:
Foreign currency translation (818 ) (818 ) (818 )
Net unrealized gains on available-for-sale investments 32 (15 ) 17 17
Impairment charges reclassified to the income statement 10 (2 ) 8 8
Reclassification of gains on available-for-sale investments realized in net profit (5 ) 1 (4 ) (4 )
Additional minimum pension liability (819 ) 21 (798 ) (798 )
Other comprehensive income / (loss) (818 ) 37 0 (819 ) 5 (1,595 ) (1,595 )
Comprehensive income 7,223
Balance at 31 December 2004 (2,462) 212 0 (1,125) 95 (3,280)
182

IntroductionFor the financial year 2004 UBS fully applied Financial Ac-counting Standards Board (FASB) Interpretation No. 46, “Con-solidation of Variable Interest Entities (revised December2003)”, an interpretation of Accounting Research Bulletin No.51 (FIN 46-R). At 31 December 2003 the predecessor stan-dard, FIN 46, had application to UBS only with respect to tran-sitional disclosure requirements, and consolidation require-ments for certain VIEs created after 31 January 2003.
Identification of variable interest entities (VIEs) andmeasurement of variable interestsQualifying special purpose entities (QSPEs) per Statement ofFinancial Accounting Standards (SFAS) No. 140 “Accountingfor Transfers and Servicing of Financial Assets and Extinguish-ments of Liabilities” are excluded from the scope of FIN 46-R. In most other cases, FIN 46-R requires that control over anentity be assessed for US GAAP first based on voting interests;if voting interests do not exist, or differ significantly from eco-nomic interests, the entity is considered a VIE, and control isassessed based on its variable interests. Specifically, VIEs areentities in which no equity investors exist, or the equity in-vestors:– do not have sufficient equity at risk for the entity to finance
its activities without additional subordinated financial sup-port from other parties; or
– do not have the characteristics of a controlling financial in-terest; or
– have voting rights that are not proportionate to their eco-nomic interests, and the activities of the entity involve orare conducted on behalf of investors with disproportion-ately small or no voting interests.Variable interests are interests held in a VIE that change
with changes in the fair value of a VIE’s net assets, exclusiveof variable interests. Interests of related parties (includingmanagement, employees, affiliates and agents) are includedin the evaluation as if owned directly by the enterprise.
A primary beneficiary is an enterprise which absorbs a ma-jority of a VIE’s expected losses, expected residual returns, orboth – it must consolidate the VIE and provide certain disclo-sures. The holder of a significant variable interest in a VIE isrequired to make disclosures only. UBS treats variable inter-ests of more than 20% of a VIE’s expected losses, expectedresidual returns, or both, as significant.
The FASB Emerging Issues Task Force (EITF) has summarizedfour different general approaches to the application of FIN 46-R in EITF issue No. 04-7. In applying FIN 46-R, UBS has adopt-ed a quantitative approach, particularly for derivatives, whichis known as “View A”, and is based on variability in the fairvalue of the net assets in the VIE, exclusive of variable inter-ests.
Under View A, investments or derivatives in a VIE either cre-ate (increase), or absorb (decrease) variability in the fair valueof a VIE’s net assets. The VIE counterparty is a risk creator (riskmaker), or risk absorber (risk taker), respectively. Only risk ab-sorption (risk taker) positions are assessed; risk creation inter-ests are deemed not to be variable interests.
VIEs often contain multiple risk factors, such as credit, eq-uity, foreign currency and interest rate risks, which requirequantification by variable interest holders. UBS analyzes theserisks into components, identifies the parties absorbing them,and uses models to quantify and compare them. These mod-els are based on internally approved valuation models and insome cases require the use of Monte Carlo simulation tech-niques. They are applied when UBS first becomes involvedwith a VIE, or after a major restructuring.
Measurement of maximum exposure to lossMaximum exposure to loss is disclosed for VIEs in which UBShas a significant variable interest.
UBS’s maximum exposure to loss is generally measured asits net investment in the VIE, plus any additional amounts itmay be obligated to invest. If UBS receives credit protectionfrom credit derivatives it is measured as any positive replace-ment value of the derivatives. If UBS has provided guaranteesor other types of credit protection to a VIE it is measured asthe notional amount of the credit protection instruments orcredit derivatives. In other derivative transactions exposingUBS to potential losses, there is no theoretical limit to the max-imum loss which could be incurred before considering offset-ting positions or hedges entered into outside of the VIE. How-ever, UBS’s general risk management process involves thehedging of risk exposures for VIEs, on the same basis as fornon-VIE counterparties. See Note 29 for a further discussionof UBS’s risk mitigation strategies.
VIEs in which UBS is the primary beneficiaryVIEs in which UBS is the primary beneficiary require consoli-dation, which may increase both total assets and liabilities ofthe US GAAP financial statements, or in other cases may re-sult in a reclassification of existing assets or liabilities.
In certain cases, an entity not consolidated under IFRS, isconsolidated under FIN 46-R because UBS is the primary ben-eficiary. Significant groups of these include CHF 4.3 billion ofinvestment fund products, and CHF 1.1 billion of securitiza-tion VIEs, which includes some third-party VIEs mentioned be-low.
The other significant group of VIEs consolidated for USGAAP, but not under IFRS, are employee equity compensationtrusts, for which UBS is the primary beneficiary because of thevariable interests of employees. These trusts have a total sizeprior to US GAAP consolidation of approximately CHF 2.8 bil-
183
Note 42 Additional Disclosures Required under US GAAP and SEC RulesNote 42.1 Variable interest entities

Financial StatementsNotes to the Financial Statements
lion, including approximately CHF 2.0 billion in UBS shares andCHF 0.8 billion in alternative investment vehicles. Upon con-solidation, the UBS shares are treated as treasury shares,which increases the weighted average number of treasuryshares at 31 December 2004 by 23 million shares, and de-creases the basic EPS denominator by 2%.
UBS has reviewed the population of potential third-partyVIEs it is involved with. Those identified in which UBS is theprimary beneficiary, and are consolidated for US GAAP pur-poses, have combined assets of approximately CHF 5.5 billionand are included in the table below.
Many entities consolidated under US GAAP due to FIN 46-Rare already consolidated under IFRS, based on the determina-
tion of exercise of control under IFRS. The total size of thispopulation is approximately CHF 4.7 billion, mostly compris-ing investment funds managed by UBS, other investmentfund products, and securitization vehicles.
Certain VIEs in which UBS is the primary beneficiary, butfor which UBS also holds a majority voting interest, are con-solidated, but do not require disclosure in the table below. Inmost cases such VIEs, or their financial position and perform-ance, are already consolidated under IFRS.
The creditors or beneficial interest holders of VIEs in whichUBS is the primary beneficiary do not have any recourse to thegeneral credit of UBS.
184
VIEs in which UBS is the primary beneficiary
Consolidated assets that are collateral(CHF million) for the VIEs’ obligationsNature, purpose and activities of VIEs Total assets Classification Amount
Securitizations 1,363 Loan receivables, government debt securities, corporate debt securities 1,363
Investment fund products 4,648 Investment funds 4,648
Investment funds managed by UBS 4,303 Debt, equity 4,270
Passive intermediary to a derivative transaction 174 Loan receivables, corporate debt securities 174
Trust vehicles for awards to UBS employees 2,798 UBS shares and alternative investment vehicles 2,798
Private equity investments 300 Private equity investments 152
Other miscellaneous structures 36 – –
Total 31.12.04 13,622 13,405
Entities which are de-consolidated for US GAAP purposes In certain cases, an entity consolidated under IFRS is not con-solidated under FIN 46-R. UBS consolidates under IFRS sever-al trusts that have issued trust preferred securities amountingto CHF 3.0 billion, which are de-consolidated for US GAAPpurposes. Under IFRS the trust preferred securities are treat-ed as minority interests, with dividends paid reported in mi-nority interests; under US GAAP the securities are treated asdebt, with interest paid reported in interest expense.
VIEs in which UBS holds a significant variable interestVIEs in which UBS holds a significant variable interest are most-ly used in securitizations, or as investment fund products, in-cluding funds managed by UBS.
UBS has reviewed the population of potential third partyVIEs it is involved with. Those identified in which UBS holds asignificant variable interest have combined assets of approx-imately CHF 11.7 billion, for which UBS has a maximum ex-posure to loss of approximately CHF 4.4 billion. Disclosures forthese are included in the table below.
VIEs in which UBS holds a significant variable interest
(CHF million) Maximum exposureNature, purpose and activities of VIEs Total assets Nature of involvement to loss
Securitizations 7,075 UBS acts as swap counterparty 2,700
Investment fund products 4,863 UBS holds notes or units 1,744
Investment funds managed by UBS 1,978 UBS acts as investment manager 742
Credit protection vehicles 1,449 SPE used for credit protection – UBS sells credit risk on portfolios to investors 800
Other miscellaneous structures 114 UBS acts as swap counterparty 54
Total 31.12.04 15,479 6,040

Third-party VIEs not otherwise classifiedFIN 46-R requires UBS to consider all VIEs for consolidation,including VIEs which UBS has not created, but in which it holdsvariable interests as a third-party counterparty, either throughdirect or indirect investment, or through derivative trans-actions.
UBS has identified that it holds variable interests in 56 third-party VIEs that in some cases could result in UBS being con-sidered the primary beneficiary, but the information necessaryto make this determination or perform the accounting re-quired to consolidate the VIE, was held by third parties, andwas not available to UBS. Additional disclosures for these VIEsare provided in the table below.
185
VIEs not originated by UBS – information unavailable from third parties
Net income Maximum(CHF million) from VIE in exposureNature, purpose and activities of VIEs Total assets Nature of involvement current period to loss
Securitizations 4,083 UBS acts as swap counterparty 114 3,561
Investment fund products 480 UBS acts as swap counterparty 24 457
Total 31.12.04 4,563 138 4,018
Future developmentsAs the guidance for FIN 46-R has seen considerable contin-ued development, it is possible UBS may be required to applya different approach in the future, which would impact the
US GAAP financial position, results, and reporting. However,it is not possible at this time to predict the impact this mighthave.

Financial StatementsNotes to the Financial Statements
186
Note 42.2 Industrial Holdings’ Income Statement1
Following an additional percentage acquisition of Motor-Columbus, UBS now holds a majority ownership interest in the com-pany. As a result, UBS has fully consolidated Motor-Columbus in its financial statements, housing it within a separate seg-ment. “Industrial Holdings” consists of Motor-Columbus, a Swiss holding company, whose most significant asset is a 59.3%interest in Atel, a Swiss-based European energy provider. The following table provides information required by Regulation S-X for commercial and industrial companies, including a condensed income statement and certain additional balance sheetinformation:
CHF million 31.12.04 2
Operating income
Net sales 3,632
Operating expenses
Cost of products sold 3,200
Marketing expenses 44
General and administrative expenses 131
Other intangible assets amortization 77
Other operating expenses 8
Total operating expenses 3,460
Operating profit 172
Non-operating profit
Interest income 4
Interest expense (38)
Other non-operating income, net 50
Non-operating profit 16
Net profit before tax and minority interests 188
Income taxes 47
Net profit before minority interests 141
Equity in income of associates, net of tax 17
Minority interests (113)
Net profit 45
Accounts receivables trade, gross 1,681
Allowance for doubtful receivables (18)
Accounts receivables trade, net 1,6631 Industrial Holdings consists of Motor-Columbus, a Swiss holding company, whose most significant asset is a 59.3% interest in Atel, a Swiss-based European energy provider. 2 Results shown for thesix-month period beginning on 1 July 2004.

In the normal course of business, UBS provides representa-tions, warranties and indemnifications to counterparties inconnection with numerous transactions. These provisions aregenerally ancillary to the business purposes of the contractsin which they are embedded. Indemnification clauses aregenerally standard contractual terms related to the Group’sown performance under a contract and are entered intobased on an assessment that the risk of loss is remote. Indem-nifications may also protect counterparties in the event thatadditional taxes are owed due either to a change in applica-ble tax laws or adverse interpretations of tax laws. The pur-pose of these clauses is to ensure that the terms of a contractare met at inception.
The most significant business where UBS provides repre-sentations and warranties are asset securitizations. UBS gen-erally represents that certain securitized assets meet specificrequirements, for example documentary attributes. UBS maybe required to repurchase the assets and/or indemnify the pur-chaser of the assets against losses due to any breaches of such
representations or warranties. Generally, the maximumamount of future payments the Group would be required tomake under such repurchase and/or indemnification provi-sions would be equal to the current amount of assets held bysuch securitization-related SPEs as at 31 December 2004,plus, in certain circumstances, accrued and unpaid interest onsuch assets and certain expenses. The potential loss due tosuch repurchase and/or indemnity is mitigated by the due dili-gence UBS performs to ensure that the assets comply with therequirements set forth in the representations and warranties.UBS receives no compensation for representations and war-ranties, and it is not possible to determine their fair value be-cause they rarely, if ever, result in a payment. Historically, loss-es incurred on such repurchases and/or indemnifications havebeen insignificant. Management expects the risk of materialloss to be remote. No liabilities related to such representations,warranties, and indemnifications are included in the balancesheet at 31 December 2004 and 2003.
187
Note 42.3 Indemnifications
Guarantee of PaineWebber securitiesFollowing the acquisition of Paine Webber Group Inc., UBS AGmade a full and unconditional guarantee of the senior andsubordinated notes and trust preferred securities (“Debt Se-curities”) of PaineWebber. Prior to the acquisition, PaineWeb-ber was an SEC Registrant. Upon the acquisition, Paine Web-ber was merged into UBS Americas Inc., a wholly ownedsubsidiary of UBS.
Under the guarantee, if UBS Americas Inc. fails to make anytimely payment under the Debt Securities agreements, theholders of the Debt Securities or the Debt Securities trusteemay demand payment from UBS without first proceedingagainst UBS Americas Inc. UBS’s obligations under the subor-
dinated note guarantee are subordinated to the prior paymentin full of the deposit liabilities of UBS and all other liabilitiesof UBS. At 31 December 2004, the amount of senior liabili-ties of UBS to which the holders of the subordinated debt se-curities would be subordinated is approximately CHF 1,685billion.
The information presented in this note is prepared in ac-cordance with IFRS and should be read in conjunction withthe Consolidated Financial Statements of UBS of which thisinformation is a part. At the bottom of each column, Net prof-it and Shareholders’ equity has been reconciled to US GAAP.See Note 41 for a detailed reconciliation of the IFRS financialstatements to US GAAP for UBS on a consolidated basis.
Note 42.4 Supplemental Guarantor Information

Financial StatementsNotes to the Financial Statements
Supplemental Guarantor Consolidating Income Statement
CHF million UBS AG UBS ConsolidatingFor the year ended 31 December 2004 Parent Bank 1 Americas Inc. Subsidiaries entries UBS Group
Operating income
Interest income 29,423 13,364 14,486 (17,875 ) 39,398
Interest expense 21,732 10,009 13,672 (17,875 ) 27,538
Net interest income 7,691 3,355 814 0 11,860
Credit loss expense 334 1 (59 ) 0 276
Net interest income after credit loss expense 8,025 3,356 755 0 12,136
Net fee and commission income 7,830 7,119 4,467 0 19,416
Net trading income 4,204 386 382 0 4,972
Income from subsidiaries 1,364 0 0 (1,364 ) 0
Other income 449 737 (289 ) 0 897
Income from industrial holdings 0 0 3,648 0 3,648
Total operating income 21,872 11,598 8,963 (1,364 ) 41,069
Operating expenses
Personnel expenses 9,699 6,577 2,239 0 18,515
General and administrative expenses 1,994 2,719 1,990 0 6,703
Depreciation of property and equipment 769 155 428 0 1,352
Amortization of goodwill and other intangible assets 46 750 168 0 964
Goods and materials purchased 0 0 2,861 0 2,861
Total operating expenses 12,508 10,201 7,686 0 30,395
Operating profit / (loss) before tax and minority interests 9,364 1,397 1,277 (1,364 ) 10,674
Tax expense / (benefit) 1,275 153 707 0 2,135
Net profit / (loss) before minority interests 8,089 1,244 570 (1,364 ) 8,539
Minority interests 0 (35 ) (415 ) 0 (450 )
Net profit / (loss) 8,089 1,209 155 (1,364 ) 8,089
Net profit / (loss) US GAAP 2 6,426 1,977 415 0 8,818
1 UBS AG Parent Bank prepares its financial statements in accordance with Swiss banking law requirements. For the purpose of this disclosure, the accounts have been adjusted to IFRS. 2 Refer to Note41 for a description of the differences between IFRS and US GAAP.
188

Supplemental Guarantor Consolidating Balance Sheet
CHF million UBS AG UBS ConsolidatingFor the year ended 31 December 2004 Parent Bank 1 Americas Inc. Subsidiaries Entries UBS Group
Assets
Cash and balances with central banks 4,152 7 1,877 0 6,036
Due from banks 94,881 11,194 132,730 (203,541 ) 35,264
Cash collateral on securities borrowed 87,198 185,741 95,334 (148,031 ) 220,242
Reverse repurchase agreements 213,080 171,447 229,558 (256,921 ) 357,164
Trading portfolio assets 205,075 138,015 27,169 0 370,259
Trading portfolio assets pledged as collateral 107,944 39,998 11,173 0 159,115
Positive replacement values 287,786 1,985 138,451 (143,645 ) 284,577
Financial assets designated at fair value 0 0 653 0 653
Loans 252,342 29,440 36,509 (85,904 ) 232,387
Financial investments 839 937 3,273 0 5,049
Accrued income and prepaid expenses 3,129 1,846 3,546 (2,645 ) 5,876
Investments in associates 28,915 14 1,307 (27,809 ) 2,427
Property and equipment 5,475 511 2,750 0 8,736
Goodwill and other intangible assets 528 9,664 1,957 0 12,149
Other assets 8,536 3,728 24,922 (2,336 ) 34,850
Total assets 1,299,880 594,527 711,209 (870,832 ) 1,734,784
Liabilities
Due to banks 157,889 87,736 76,817 (203,541 ) 118,901
Cash collateral on securities lent 85,053 45,362 79,161 (148,031 ) 61,545
Repurchase agreements 119,826 332,513 227,169 (256,921 ) 422,587
Trading portfolio liabilities 98,019 59,867 13,147 0 171,033
Negative replacement values 309,809 2,105 135,443 (143,645 ) 303,712
Financial liabilities designated at fair value 47,116 0 18,640 0 65,756
Due to customers 366,762 47,265 47,960 (85,904 ) 376,083
Accrued expenses and deferred income 7,588 6,233 3,509 (2,645 ) 14,685
Debt issued 56,658 5,214 55,956 0 117,828
Other liabilities 9,378 2,442 32,858 (2,336 ) 42,342
Total liabilities 1,258,098 588,737 690,660 (843,023 ) 1,694,472
Minority interests 0 144 5,190 0 5,334
Total shareholders’ equity 41,782 5,646 15,359 (27,809 ) 34,978
Total liabilities, minority interests and shareholders’ equity 1,299,880 594,527 711,209 (870,832 ) 1,734,784
Total shareholders’ equity – US GAAP 2 29,116 7,760 15,792 0 52,668
1 UBS AG Parent Bank prepares its financial statements in accordance with Swiss banking law requirements. For the purpose of this disclosure, the accounts have been adjusted to IFRS. 2 Refer to Note41 for a description of the differences between IFRS and US GAAP.
189

Financial StatementsNotes to the Financial Statements
Supplemental Guarantor Consolidating Cash Flow Statement
CHF million UBS AG UBSFor the year ended 31 December 2004 Parent Bank 1 Americas Inc. Subsidiaries UBS Group
Net cash flow from/ (used in) operating activities (6,652 ) (1,636 ) (19,610 ) (27,898 )
Cash flow from / (used in) investing activities
Investments in subsidiaries and associates (2,511 ) 0 0 (2,511 )
Disposal of subsidiaries and associates 800 0 0 800
Purchase of property and equipment (555 ) (164 ) (430 ) (1,149 )
Disposal of property and equipment 64 249 391 704
Net (investment in) / divestment of financial investments 39 145 502 686
Net cash flow from/ (used in) investing activities (2,163 ) 230 463 (1,470 )
Cash flow from / (used in) financing activities
Net money market paper issued / (repaid) 5,758 199 15,422 21,379
Net movements in treasury shares and own equity derivative activity (4,999 ) 0 0 (4,999 )
Capital issuance 2 0 0 2
Dividends paid (2,806 ) 0 0 (2,806 )
Issuance of long-term debt, including financial liabilities designated at fair value 35,426 (26 ) 15,811 51,211
Repayment of long-term debt, including financial liabilities designated at fair value (11,944 ) (1,869 ) (10,904 ) (24,717 )
Increase in minority interests 0 (969 ) 1,071 102
Dividend payments to / purchase from minority interests 0 (1 ) (331 ) (332 )
Net activity in investments in subsidiaries (4,799 ) 866 3,933 0
Net cash flow from/ (used in) financing activities 16,638 (1,800 ) 25,002 39,840
Effects of exchange rate differences (1,282 ) 401 (171 ) (1,052 )
Net increase / (decrease) in cash equivalents 6,541 (2,805 ) 5,684 9,420
Cash and cash equivalents, beginning of the year 43,309 18,811 11,236 73,356
Cash and cash equivalents, end of the year 49,850 16,006 16,920 82,776
Cash and cash equivalents comprise:
Cash and balances with central banks 4,152 7 1,877 6,036
Money market paper 2 31,262 13,450 697 45,409
Due from banks maturing in less than three months 14,436 2,549 14,346 31,331
Total 49,850 16,006 16,920 82,776
1 UBS AG Parent Bank prepares its financial statements in accordance with Swiss banking law requirements. For the purpose of this disclosure, the accounts have been adjusted to IFRS. 2 Moneymarket paper is included in the Balance sheet under Trading portfolio assets and Financial investments. CHF 13,242 million was pledged at 31 December 2004.
190
Guarantee of other securitiesIn October 2000, UBS AG, acting through a wholly ownedsubsidiary, issued USD 1.5 billion (CHF 2.6 billion at issuance)8.622% UBS Trust Preferred securities. In June 2001, UBS is-sued an additional USD 800 million (CHF 1.3 billion at is-suance) of such securities (USD 300 million at 7.25% and USD500 million at 7.247%). In May 2003, UBS issued USD 300million of Floating Rate Noncumulative Trust Preferred Secu-rities (CHF 390 million at issuance) at 0.7% above one-month
LIBOR of such securities. UBS AG has fully and uncondition-ally guaranteed these securities. UBS’s obligations under thetrust preferred securities guarantee are subordinated to theprior payment in full of the deposit liabilities of UBS and allother liabilities of UBS. At 31 December 2004, the amount ofsenior liabilities of UBS to which the holders of the subordi-nated debt securities would be subordinated is approximate-ly CHF 1,685 billion.

UBS AG (Parent Bank)
UBS AG (Parent Bank)Table of Contents
Parent Bank Review 193
Financial Statements 194
Income Statement 194Balance Sheet 195Statement of Appropriation of Retained Earnings 196
Notes to the Financial Statements 197
Additional Income Statement Information 198Net Trading Income 198Extraordinary Income and Expenses 198
Additional Balance Sheet Information 199Value Adjustments and Provisions 199Statement of Shareholders’ Equity 199Share Capital 199
Off-Balance Sheet and Other Information 200Assets Pledged or Assigned as Security for Own Obligations, Assets Subject to Reservation of Title 200Commitments and Contingent Liabilities 200Derivative Instruments 200Fiduciary Transactions 201Due to UBS Pension Plans, Loans to Corporate Bodies /Related Parties 201Headcount 201
Report of the Statutory Auditors 202
Report of the Capital Increase Auditors 203
192
UBS AG (Parent Bank)Table of Contents

Income Statement
The Parent Bank UBS AG net profit increased by CHF 1,749million from CHF 4,197 million to CHF 5,946 million. Incomefrom investments in associates decreased to CHF 461 millionfrom CHF 1,914 million in 2003 mainly due to less distribu-tion received. The increase in Extraordinary income and ex-penses is explained on page 198.
Balance Sheet
Total assets increased by CHF 141 billion to CHF 1,136 billionat 31 December 2004. This movement is mainly caused by in-creased positions in Due from banks of CHF 28 billion and Duefrom customers of CHF 29 billion. A considerable increase re-sulted in Trading balances in securities and precious metals ofCHF 52 billion (thereof debt instruments CHF 25 billion andequities CHF 37 billion) as well as in Positive replacement val-ues of CHF 17 billion. The decrease in financial investmentsof CHF 4.5 billion is mainly due to the reclassification of ownshares to Trading balances in securities and precious metals.The Investments in associated companies expanded by almostCHF 6 billion which is mainly due to new investments or ad-ditional financing of subsidiaries abroad, the establishment ofnew fund companies and the step acquisition of Motor-Columbus.
193
Parent Bank Review
UBS AG (Parent Bank)Parent Bank Review

UBS AG (Parent Bank)Financial Statements
Income Statement
For the year ended % change from
CHF million 31.12.04 31.12.03 31.12.03
Interest and discount income 18,902 19,417 (3 )
Interest and dividend income from trading portfolio 10,457 9,325 12
Interest and dividend income from financial investments 13 11 18
Interest expense (21,659) (20,034 ) (8 )
Net interest income 7,713 8,719 (12 )
Credit-related fees and commissions 228 228 0
Fee and commission income from securities and investment business 8,002 6,998 14
Other fee and commission income 735 826 (11 )
Fee and commission expense (1,135) (1,180 ) 4
Net fee and commission income 7,830 6,872 14
Net trading income 3,469 521 566
Net income from disposal of financial investments 87 (69 )
Income from investments in associated companies 461 1,914 (76 )
Income from real estate holdings 46 43 7
Sundry income from ordinary activities 1,418 1,213 17
Sundry ordinary expenses (26) (96 ) 73
Other income from ordinary activities 1,986 3,005 (34 )
Operating income 20,998 19,117 10
Personnel expenses 9,699 8,889 9
General and administrative expenses 3,833 3,943 (3 )
Operating expenses 13,532 12,832 5
Operating profit 7,466 6,285 19
Depreciation and write-offs on investments in associated companies and fixed assets 1,021 919 11
Allowances, provisions and losses 184 658 (72 )
Profit before extraordinary items and taxes 6,261 4,708 33
Extraordinary income 1,016 92
Extraordinary expenses 49 1
Tax expense / (benefit) 1,282 602 113
Profit for the period 5,946 4,197 42
194
Financial Statements

Balance Sheet
% change fromCHF million 31.12.04 31.12.03 31.12.03
Assets
Liquid assets 4,152 2,895 43
Money market paper 31,262 21,233 47
Due from banks 350,055 321,796 9
Due from customers 159,988 130,814 22
Mortgage loans 132,941 131,900 1
Trading balances in securities and precious metals 288,170 236,096 22
Financial investments 4,503 8,955 (50 )
Investments in associated companies 20,547 14,757 39
Fixed assets 4,212 4,367 (4 )
Accrued income and prepaid expenses 3,129 3,666 (15 )
Positive replacement values 128,300 111,612 15
Other assets 8,550 6,585 30
Total assets 1,135,809 994,676 14
Total subordinated assets 4,970 4,450 12
Total amounts receivable from Group companies 446,850 397,410 12
Liabilities
Money market paper issued 29,637 23,879 24
Due to banks 428,371 377,447 13
Due to customers on savings and deposit accounts 83,976 84,360 0
Other amounts due to customers 316,467 274,408 15
Medium-term bonds 1,686 2,403 (30 )
Bond issues and loans from central mortgage institutions 60,125 45,968 31
Accruals and deferred income 7,588 7,060 7
Negative replacement values 158,811 127,885 24
Other liabilities 5,951 6,802 (13 )
Value adjustments and provisions 3,929 3,894 1
Share capital 901 946 (5 )
General statutory reserve 7,572 7,212 5
Reserve for own shares 9,056 8,024 13
Other reserves 15,793 20,191 (22 )
Profit for the period 5,946 4,197 42
Total liabilities 1,135,809 994,676 14
Total subordinated liabilities 12,695 12,471 2
Total amounts payable to Group companies 357,311 257,955 39
195

UBS AG (Parent Bank)Financial Statements
196
Statement of Appropriation of Retained Earnings
CHF million
The Board of Directors proposes to the Annual General Meeting the following appropriation:
Profit for the financial year 2004 as per the Parent Bank’s Income Statement 5,946
Appropriation to general statutory reserve 322
Appropriation to other reserves 2,363
Proposed dividends 3,261
Total appropriation 5,946
Dividend Distribution
The Board of Directors will recommend to the Annual General Meeting on 21 April 2005 that UBS should pay a dividend ofCHF 3.00 per share of CHF 0.80 par value. If the dividend is approved, the payment of CHF 3.00 per share, after deductionof 35% Swiss withholding tax, would be made on 26 April 2005 for shareholders who hold UBS shares on 21 April 2005.
The Parent Bank’s accounting policies are in compliance withSwiss banking law. The accounting policies are principally the same as for the Group Financial Statements outlined inNote 1, Summary of Significant Accounting Policies. Major dif-ferences between the Swiss banking law requirements andInternational Financial Reporting Standards are described inNote 40 to the Group Financial Statements.
In addition, the following principles are applied for theParent Bank:
Treasury sharesTreasury shares is the term used to describe when an enter-prise holds its own equity instruments. Under IFRS, treasuryshares are presented in the balance sheet as a deduction fromequity. No gain or loss is recognized in the income statementon the sale, issuance, acquisition, or cancellation of thoseshares. Consideration received or paid is presented in thefinancial statement as a change in equity.
Under Swiss law, treasury shares are classified in the bal-ance sheet as trading balances or as financial assets, shortpositions are included in Due to banks. Realized gains andlosses on the sale, issuance or acquisition of treasury shares,and unrealized gains or losses from re-measurement of treas-ury shares in the trading portfolio to market value are includ-ed in the income statement. Treasury shares included inFinancial investments are carried at the lower of cost or mar-ket value.
Foreign currency translationTransactions and translation of assets and liabilities denomi-nated in foreign currencies into the Parent Bank’s or a branch’sreporting currency are accounted for as described in Note 1i).
Assets and liabilities of foreign branches are translated intoCHF at the exchange rates at the balance sheet date, whileincome and expense items are translated at weighted aver-age rates for the period. Exchange differences arising on thetranslation of each of these foreign branches are credited toa provision account (other liabilities) in case of a gain, whileany losses are firstly debited to that provision account untilsuch provision is fully utilized, and secondly to profit and loss.
Investments in associated companiesInvestments in associated companies are equity interestswhich are held for the purpose of the Parent Bank’s businessactivities or for strategic reasons. They are carried at cost lessvaluation reserves, if needed.
Property and equipmentBank buildings and other real estate are carried at cost lessaccumulated depreciation. Depreciation of computer andtelecommunication equipment, other office equipment, fix-tures and fittings is recognized on a straight-line basis over theestimated useful lives of the related assets. The useful lives ofProperty and equipment are summarized in Note 1, Summa-ry of Significant Accounting Policies, of the Group FinancialStatements.
Extraordinary income and expensesCertain items of income and expense appear as extraordinarywithin the Parent Bank Financial Statements, whereas in theGroup Financial Statements they are considered to be oper-ating income or expenses and appear within the appropriateincome or expense category. These items are separately iden-tified on page 198.
197
Notes to the Financial Statements
UBS AG (Parent Bank)Notes to the Financial Statements
Accounting Principles

UBS AG (Parent Bank)Notes to the Financial Statements
Extraordinary income contains CHF 609 million first-time adop-tion impact as at 1 January 2004 from changing the valuationmethod for treasury shares from lower of cost or market to themark to market method. It further includes CHF 72 million
(2003: CHF 33 million) from the sale of investments in associ-ates and CHF 334 million from release of provisions (2003: CHF59 million). Extraordinary expenses contain CHF 48 million lossfrom the liquidation of investments in associates in 2004.
198
Additional Income Statement Information
Net Trading Income
For the year ended % change from
CHF million 31.12.04 31.12.03 31.12.03
Equities 2,262 1,708 32
Fixed income 1 (266) (1,307 ) 80
Foreign exchange and other 1,473 120
Total 3,469 521 566
1 Includes commodities trading income.
Extraordinary Income and Expenses

199
Additional Balance Sheet Information
Value Adjustments and Provisions
Provisions Recoveries,applied in doubtful interest, New
accordance currency Provisions provisionsBalance at with their translation released charged Balance at
CHF million 31.12.03 specified purpose differences to income to income 31.12.04
Default risks (credit and country risk) 4,218 (814 ) (292 ) (962 ) 627 2,777
Trading portfolio risks 2,723 413 201 3,337
Litigation risks 392 (312 ) 15 (77 ) 215 233
Operational risks 1,871 (580 ) 164 (137 ) 190 1,508
Capital and income taxes 1,118 (819 ) 24 1,535 1,858
Total allowance for general credit losses and other provisions 10,322 (2,525) 324 (1,176) 2,768 9,713
Allowances deducted from assets 6,428 5,784
Total provisions as per balance sheet 3,894 3,929
Statement of Shareholders’ Equity
General statutory General statutory Total Shareholders’reserves: reserves: Reserves for equity (before
CHF million Share capital Share premium Retained earnings own shares Other reserves distribution of profit)
As at 31.12.02 and 1.1.03 1,005 11,550 842 6,623 24,119 44,139
Cancellation of own shares (61 ) (5,468 ) (5,529)
Capital increase 2 59 61
Increase in reserves 229 (229 )
Prior year dividend (2,298 ) (2,298)
Profit for the period 4,197 4,197
Changes in reserves for own shares 1,401 (1,401 )
As at 31.12.03 and 1.1.04 946 6,141 1,071 8,024 24,388 40,570
Cancellation of own shares (47 ) (4,469 ) (4,516)
Capital increase 2 72 74
Increase in reserves 288 (288 )
Prior year dividend (2,806 ) (2,806)
Profit for the period 5,946 5,946
Changes in reserves for own shares 1,032 (1,032 )
As at 31.12.04 901 6,213 1,359 9,056 21,739 39,268
Share Capital
Par value Ranking for dividends
No. of shares Capital in CHF No. of shares Capital in CHF
As at 31.12.04
Issued and paid up 1,126,858,177 901,486,542 1,086,923,083 869,538,466
Conditional share capital 3,533,012 2,826,410
As at 31.12.03
Issued and paid up 1,183,046,764 946,437,411 1,126,339,764 901,071,811
Conditional share capital 6,871,752 5,497,402

UBS AG (Parent Bank)Notes to the Financial Statements
200
Off-Balance Sheet and Other Information
Assets Pledged or Assigned as Security for Own Obligations, Assets Subject to Reservation of Title
31.12.04 31.12.03 Change in %
CHF million Book value Effective liability Book value Effective liability Book value Effective liability
Money market paper 16,022 5,063 6,225 157
Mortgage loans 175 60 428 210 (59 ) (71 )
Securities 102,726 55,126 96,065 66,395 7 (17 )
Total 118,923 60,249 102,718 66,605 16 (10 )
Assets are pledged as collateral for securities borrowing and repo transactions, for collateralized credit lines with central banks,loans from mortgage institutions and security deposits relating to stock exchange membership.
Commitments and Contingent Liabilities
% change fromCHF million 31.12.04 31.12.03 31.12.03
Contingent liabilities 123,429 122,555 1
Irrevocable commitments 50,552 42,708 18
Liabilities for calls on shares and other equities 104 97 7
Confirmed credits 1,820 1,592 14
Derivative Instruments
31.12.2004 31.12.2003
Notional amount Notional amountCHF million PRV 1 NRV 2 CHF bn PRV NRV CHF bn
Interest rate contracts 174,995 183,210 15,398 141,654 149,972 10,321
Credit derivative contracts 7,895 9,353 671 7,085 7,679 315
Foreign exchange contracts 81,377 79,046 3,729 75,229 70,658 3,131
Precious metal contracts 1,919 1,590 61 2,382 2,176 55
Equity / index contracts 20,487 44,107 721 25,362 37,613 346
Commodity contracts 1,739 1,616 41 1,025 895 11
Total derivative instruments 288,412 318,922 20,621 252,737 268,993 14,179
1 PRV: Positive replacement values prior to netting. 2 NRV: Negative replacement values prior to netting.

Fiduciary Transactions
% change fromCHF million 31.12.04 31.12.03 31.12.03
Deposits:
with other banks 30,581 29,549 3
with Group banks 740 672 10
Loans and other financial transactions 6 6 0
Total 31,327 30,227 4
201
Due to UBS Pension Plans, Loans to Corporate Bodies /Related Parties
% change fromCHF million 31.12.04 31.12.03 31.12.03
Due to UBS pension plans and UBS debt instruments held by pension plans 1,329 1,096 21
Securities borrowed from pension plans 3,778 2,930 29
Loans to directors, senior executives and auditors 1 16 25 (36 )
1 Loans to directors, senior executives and auditors are loans to members of the Board of Directors, the Group Executive Board and the Group’s official auditors under Swiss company law. This alsoincludes loans to companies which are controlled by these natural or legal persons. There are no loans to the auditors.
Headcount
Parent Bank headcount was 35,542 on 31 December 2004 and 33,949 on 31 December 2003.

UBS AG (Parent Bank)Report of the Statutory Auditors
202

UBS AG (Parent Bank)Report of the Capital Increase Auditors
203

204

Additional Disclosure Required under SEC Regulations

Additional Disclosure Required under SEC RegulationsTable of Contents
A Introduction 207
B Selected Financial Data 207Balance Sheet Data 209US GAAP Income Statement Data 210US GAAP Balance Sheet Data 211Ratio of Earnings to Fixed Charges 211
C Information on the Company 211Property, plant and equipment 211
D Information Required by Industry Guide 3 212Selected statistical information 212Average Balances and Interest Rates 212Analysis of Changes in Interest Income and Expense 214Deposits 216Short-term Borrowings 217Contractual maturities of the Investmentsin Debt Instruments 218Due from Banks and Loans (gross) 219Due from Banks and Loan Maturities (gross) 220Impaired, Non-performing and Restructured Loans 221Cross-Border Outstandings 222Summary of Movements in Allowances and Provisions for Credit Losses 223Allocation of the Allowances and Provisions for Credit Losses 225Due from Banks and Loans by Industry Sector (gross) 226Loss History Statistics 227
206
Additional Disclosure Required under SEC RegulationsTable of Contents

The following pages contain additional disclosure about theUBS Group which is required under SEC regulations.
Unless otherwise stated, UBS’s Financial Statements havebeen prepared in accordance with International Financial Re-porting Standards (IFRS) and are denominated in Swiss francs,
or CHF, the reporting currency of the Group. Certain financialinformation has also been presented in accordance with Unit-ed States Generally Accepted Accounting Principles (US GAAP).Comparative figures for 2001 and 2000 have not been re-stated.
207
A – Introduction
The tables below set forth, for the periods and dates indicat-ed, information concerning the noon buying rate for theSwiss franc, expressed in United States dollars, or USD, per oneSwiss franc. The noon buying rate is the rate in New York City
for cable transfers in foreign currencies as certified for customspurposes by the Federal Reserve Bank of New York.
On 28 February 2005 the noon buying rate was 0.8632USD per 1 CHF.
B – Selected Financial Data
Average rate 1
Year ended 31 December High Low (USD per 1 CHF) At period end
2000 0.6441 0.5479 0.5912 0.6172
2001 0.6331 0.5495 0.5910 0.5857
2002 0.7229 0.5817 0.6453 0.7229
2003 0.8189 0.7048 0.7493 0.8069
2004 0.8843 0.7601 0.8059 0.8712
Month High Low
September 2004 0.8026 0.7865
October 2004 0.8371 0.7908
November 2004 0.8781 0.8315
December 2004 0.8843 0.8616
January 2005 0.8712 0.8381
February 2005 0.8632 0.8182
1 The average of the noon buying rates on the last business day of each full month during the relevant period.

Additional Disclosure Required under SEC Regulations
B – Selected Financial Data (continued)
For the year ended
CHF million, except where indicated 31.12.04 31.12.03 31.12.02 31.12.01 31.12.00
Income statement data
Interest income 39,398 40,159 39,963 52,277 51,745
Interest expense (27,538) (27,860 ) (29,417 ) 44,236 43,615
Net interest income 11,860 12,299 10,546 8,041 8,130
Credit loss (expense) / recovery 276 (72 ) (115 ) (498 ) 130
Net interest income after credit loss (expense) / recovery 12,136 12,227 10,431 7,543 8,260
Net fee and commission income 19,416 17,345 18,221 20,211 16,703
Net trading income 4,972 3,756 5,451 8,802 9,953
Other income 897 462 4 558 1,486
Income from Industrial Holdings 3,648
Operating income 41,069 33,790 34,107 37,114 36,402
Operating expenses 30,395 25,613 29,570 30,396 26,203
Operating profit before tax 10,674 8,177 4,537 6,718 10,199
Tax expense / (benefit) 2,135 1,593 676 1,401 2,320
Minority interests (450) (345 ) (331 ) (344 ) (87 )
Net profit 8,089 6,239 3,530 4,973 7,792
Cost / income ratio (%) 1 72.6 75.6 86.4 80.8 72.2
Per share data (CHF)
Basic earnings per share 2 7.68 5.59 2.92 3.93 6.44
Diluted earnings per share 2 7.47 5.48 2.87 3.78 6.35
Operating profit before tax per share 10.14 7.32 3.75 5.31 8.44
Cash dividends declared per share (CHF) 3 3.00 2.60 2.00 0.00 1.50
Cash dividend equivalent in USD 3 2.00 1.46 0.00 0.86
Dividend payout ratio (%) 3 39.1 46.5 68.5 23.3
Rates of return (%)
Return on Shareholders’ equity 4 24.7 17.8 8.9 11.7 21.5
Return on average equity 22.9 16.8 8.3 11.3 22.0
Return on average assets 0.44 0.40 0.24 0.36 0.70
1 Operating expenses / operating income before credit loss expense for Financial Businesses. 2 For EPS calculation, see Note 8 to the Financial Statements. 3 Dividends are normally declared and paidin the year subsequent to the reporting period. In 2000, as part of the arrangements of the acquisition of PaineWebber, a dividend of CHF 1.50 was paid on 5 October 2000 in respect of the nine monthsended 30 September 2000. In 2001 a further amount of CHF 1.60 per share was distributed to shareholders in the form of a par value reduction, in respect of 2000. No dividend was paid out for theyear 2001. A par value reduction of CHF 2.00 per share was paid on 10 July 2002. A dividend of CHF 2.00 per share was paid on 23 April 2003 and CHF 2.60 on 20 April 2004. A dividend of CHF 3.00per share will be paid on 26 April 2005 subject to approval by shareholders at the Annual General Meeting. The USD amount per share will be determined on 22 April 2005. 4 Net profit / averageShareholders’ equity excluding dividends.
208

B – Selected Financial Data (continued)
As at
CHF million, except where indicated 31.12.04 31.12.03 31.12.02 31.12.01 31.12.00
Balance sheet data
Total assets 1,734,784 1,550,056 1,346,678 1,253,297 1,087,552
Shareholders’ equity 34,978 35,310 38,952 43,530 44,833
Average equity to average assets (%) 1.93 2.38 2.87 3.49 3,17
Market capitalization 103,638 95,401 79,448 105,475 112,666
Shares
Registered ordinary shares 1,126,858,177 1,183,046,764 1,256,297,678 1,281,717,499 1,333,139,187
Own shares to be delivered 0 0 0 0 28,444,788
Treasury shares 103,524,971 111,360,692 97,181,094 41,254,951 55,265,349
BIS capital ratios
Tier 1 (%) 11.8 11.8 11.3 11.6 11.7
Total BIS (%) 13.6 13.3 13.8 14.8 15.7
Risk-weighted assets 264,125 251,901 238,790 253,735 273,290
Invested assets (CHF billion) 2,250 2,133 1,959 2,448 2,445
Headcount Financial Businesses (full-time equivalents)
Switzerland 25,990 26,662 27,972 29,163 30,215
Europe (excluding Switzerland) 10,764 9,906 10,009 9,650 9,286
Americas 26,232 25,511 27,350 27,463 28,114
Asia Pacific 4,438 3,850 3,730 3,709 3,461
Total 67,424 65,929 69,061 69,985 71,076
Long-term ratings 1
Fitch, London AA+ AA+ AAA AAA AAA
Moody’s, New York Aa2 Aa2 Aa2 Aa2 Aa1
Standard & Poor’s, New York AA+ AA+ AA+ AA+ AA+
1 See the Handbook 2004/2005, page 48 for information about the nature of these ratings.
209
Balance Sheet Data
As at
CHF million 31.12.04 31.12.03 31.12.02 31.12.01 31.12.00
Assets
Total assets 1,734,784 1,550,056 1,346,678 1,253,297 1,087,552
Due from banks 35,264 31,740 32,516 27,526 29,147
Cash collateral on securities borrowed 220,242 213,932 139,049 162,938 177,857
Reverse repurchase agreements 357,164 320,499 294,067 269,256 193,801
Trading portfolio assets 370,259 341,013 261,071 397,886 315,588
Trading portfolio assets pledged as collateral 159,115 120,759 110,365
Positive replacement values 284,577 248,206 247,421 73,447 57,875
Loans 232,387 212,679 211,740 226,545 244,842
Liabilities
Due to banks 118,901 127,012 83,178 106,531 82,240
Cash collateral on securities lent 61,545 53,278 36,870 30,317 23,418
Repurchase agreements 422,587 415,863 366,858 368,620 295,513
Trading portfolio liabilities 171,033 143,957 106,453 105,798 82,632
Negative replacement values 303,712 254,768 247,206 71,443 75,923
Financial liabilities designated at fair value 65,756 35,286 14,516
Due to customers 376,083 346,633 306,876 333,781 310,679
Debt issued 117,828 88,843 114,446 156,218 129,635
Shareholders’ equity 34,978 35,310 38,952 43,530 44,833
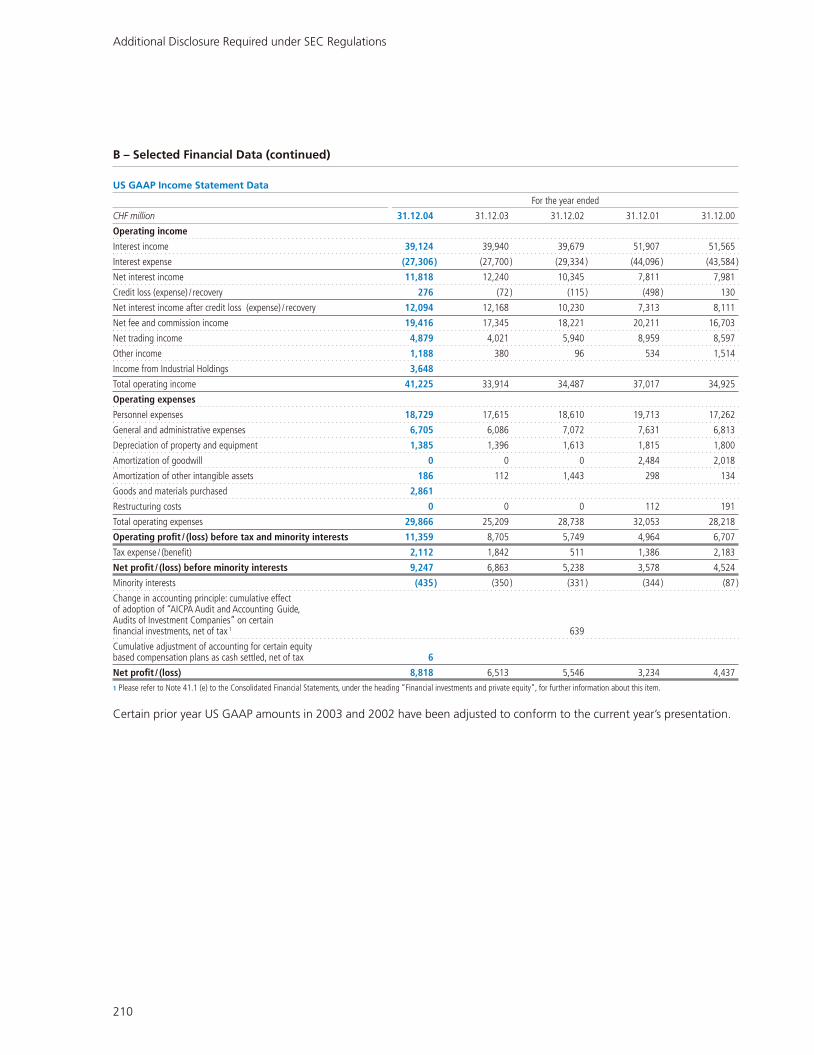
Additional Disclosure Required under SEC Regulations
B – Selected Financial Data (continued)
US GAAP Income Statement Data
For the year ended
CHF million 31.12.04 31.12.03 31.12.02 31.12.01 31.12.00
Operating income
Interest income 39,124 39,940 39,679 51,907 51,565
Interest expense (27,306) (27,700 ) (29,334 ) (44,096 ) (43,584 )
Net interest income 11,818 12,240 10,345 7,811 7,981
Credit loss (expense) / recovery 276 (72 ) (115 ) (498 ) 130
Net interest income after credit loss (expense) / recovery 12,094 12,168 10,230 7,313 8,111
Net fee and commission income 19,416 17,345 18,221 20,211 16,703
Net trading income 4,879 4,021 5,940 8,959 8,597
Other income 1,188 380 96 534 1,514
Income from Industrial Holdings 3,648
Total operating income 41,225 33,914 34,487 37,017 34,925
Operating expenses
Personnel expenses 18,729 17,615 18,610 19,713 17,262
General and administrative expenses 6,705 6,086 7,072 7,631 6,813
Depreciation of property and equipment 1,385 1,396 1,613 1,815 1,800
Amortization of goodwill 0 0 0 2,484 2,018
Amortization of other intangible assets 186 112 1,443 298 134
Goods and materials purchased 2,861
Restructuring costs 0 0 0 112 191
Total operating expenses 29,866 25,209 28,738 32,053 28,218
Operating profit / (loss) before tax and minority interests 11,359 8,705 5,749 4,964 6,707
Tax expense / (benefit) 2,112 1,842 511 1,386 2,183
Net profit / (loss) before minority interests 9,247 6,863 5,238 3,578 4,524
Minority interests (435) (350 ) (331 ) (344 ) (87 )
Change in accounting principle: cumulative effect of adoption of “AICPA Audit and Accounting Guide,Audits of Investment Companies” on certainfinancial investments, net of tax 1 639
Cumulative adjustment of accounting for certain equitybased compensation plans as cash settled, net of tax 6
Net profit / (loss) 8,818 6,513 5,546 3,234 4,437
1 Please refer to Note 41.1 (e) to the Consolidated Financial Statements, under the heading “Financial investments and private equity”, for further information about this item.
Certain prior year US GAAP amounts in 2003 and 2002 have been adjusted to conform to the current year’s presentation.
210

B - Selected Financial Data (continued)
US GAAP Balance Sheet Data
As at
CHF million 31.12.04 31.12.03 31.12.02 31.12.01 31.12.00
Assets
Total assets 1,903,186 1,699,007 1,296,938 1,361,920 1,124,554
Due from banks 35,286 31,758 32,481 27,550 29,182
Cash collateral on securities borrowed 218,414 211,058 139,073 162,566 177,857
Reverse repurchase agreements 357,164 320,499 294,086 269,256 193,801
Trading portfolio assets 449,389 423,733 331,480 455,406 318,788
Trading portfolio assets pledged as collateral 159,115 120,759 110,365
Positive replacement values 1 284,468 248,924 83,757 73,474 57,775
Loans 228,968 212,729 211,755 226,747 245,214
Goodwill 26,977 26,775 28,127 29,255 31,016
Other intangible assets 1,722 1,174 1,222 4,510 4,710
Other assets 101,068 64,381 21,314 36,972 27,955
Liabilities
Due to banks 119,021 127,385 83,178 106,531 82,240
Cash collateral on securities lent 57,792 51,157 36,870 30,317 23,418
Repurchase agreements 423,513 415,863 366,858 368,620 295,513
Trading portfolio liabilities 190,907 149,380 117,721 119,528 87,832
Obligation to return securities received as collateral 12,950 13,071 16,308 10,931 0
Negative replacement values 1 360,345 326,136 132,354 116,666 75,423
Due to customers 386,913 347,358 306,872 333,766 310,686
Accrued expenses and deferred income 14,830 13,673 15,330 17,289 21,038
Debt issued 164,744 123,259 129,527 156,462 129,750
Shareholders’ equity 52,668 53,174 55,576 59,282 62,960
1 Positive and negative replacement values represent the fair value of derivative instruments. From 2003 onwards, they are presented on a gross basis under US GAAP.
211
Ratio of Earnings to Fixed Charges
The following table sets forth UBS AG’s ratio of earnings to fixed charges, for the periods indicated. Ratios of earnings tocombined fixed charges and preferred stock dividends requirements are not presented as there were no preferred sharedividends in any of the periods indicated.
For the year ended
31.12.04 31.12.03 31.12.02 31.12.01 31.12.00
IFRS 1 1.36 1.27 1.14 1.14 1.23
US GAAP 1 1.39 1.29 1.18 1.10 1.15
1 The ratio is provided using both IFRS and US GAAP values, since the ratio is materially different under the two accounting standards.
Property, Plant and EquipmentAt 31 December 2004, UBS Financial Businesses operatedabout 1,044 business and banking locations worldwide, ofwhich about 42% were in Switzerland, 11% in the rest of Eu-rope, Middle East and Africa, 45% in the Americas and 2%in Asia Pacific. 39% of the business and banking locations inSwitzerland were owned directly by UBS with the remainder,along with most of UBS’s offices outside Switzerland, beingheld under commercial leases.
At 31 December 2004, the Industrial Holdings segment op-erated about 212 business locations in Europe, of which 33%were in Switzerland and 67% in the rest of Europe. 81% ofall business locations in Switzerland and the rest of Europewere held under commercial leases.
These premises are subject to continuous maintenanceand upgrading and are considered suitable and adequate forour current and anticipated operations.
C – Information on the Company

Additional Disclosure Required under SEC Regulations
Average Balances and Interest Rates
The following table sets forth average interest-earning assets and average interest-bearing liabilities, along with the averagerates, for the years ended 31 December 2004, 2003 and 2002.
31.12.04 31.12.03 31.12.02
Average Average Average Average Average AverageCHF million, except where indicated balance Interest rate (%) balance Interest rate (%) balance Interest rate (%)
Assets
Due from banks
Domestic 12,463 183 1.5 11,417 200 1.8 12,534 388 3.1
Foreign 23,648 389 1.6 21,118 1,035 4.9 17,668 634 3.6
Cash collateral on securities borrowed and reverse repurchase agreements
Domestic 17,969 457 2.5 6,576 200 3.0 5,471 235 4.3
Foreign 710,065 10,549 1.5 582,066 10,948 1.9 573,526 10,949 1.9
Trading portfolio assets
Domestic 10,122 337 3.3 7,990 222 2.8 7,812 269 3.4
Foreign – taxable 494,692 18,914 3.8 407,867 18,151 4.5 373,810 16,714 4.5
Foreign – non-taxable 2,309 27 1.2 1,668 21 1.3 1,720 31 1.8
Foreign – total 497,001 18,941 3.8 409,535 18,172 4.4 375,530 16,745 4.5
Financial assets designated at fair value
Domestic 196 0 0 0 0 0
Foreign 0 0 0 0 0 0
Loans
Domestic 168,456 5,401 3.2 165,397 6,437 3.9 170,641 6,987 4.1
Foreign 60,382 1,813 3.0 51,457 1,805 3.5 55,199 1,789 3.2
Financial investments
Domestic 1,132 27 2.4 1,988 40 2.0 3,794 60 1.6
Foreign – taxable 4,122 66 1.6 4,798 35 0.7 8,781 105 1.2
Foreign – non-taxable 0 0 0.0 0 0 0.0 0 0 0.0
Foreign – total 4,122 66 1.6 4,798 35 0.7 8,781 105 1.2
Total interest-earning assets 1,505,556 38,163 2.5 1,262,342 39,094 3.1 1,230,956 38,161 3.1
Net interest on swaps 1,235 1,065 1,802
Interest income and average interest-earning assets 1,505,556 39,398 2.6 1,262,342 40,159 3.2 1,230,956 39,963 3.2
Non-interest-earning assets
Positive replacement values 246,952 249,155 188,462
Fixed assets 7,840 11,710 12,625
Other 68,925 40,104 53,293
Total average assets 1,829,273 1,563,311 1,485,336
212
Selected Statistical InformationThe tables below set forth selected statistical information re-garding the Group’s banking operations extracted from theFinancial Statements. Unless otherwise indicated, averagebalances for the years ended 31 December 2004, 31 Decem-
ber 2003 and 31 December 2002 are calculated from month-ly data. The distinction between domestic and foreign is gen-erally based on the booking location. For loans, this methodis not significantly different from an analysis based on thedomicile of the borrower.
D – Information Required by Industry Guide 3

D – Information Required by Industry Guide 3 (continued)
31.12.04 31.12.03 31.12.02
Average Average Average Average Average AverageCHF million, except where indicated balance Interest rate (%) balance Interest rate (%) balance Interest rate (%)
Liabilities and Equity
Due to banks
Domestic 31,129 416 1.3 28,719 150 0.5 28,625 452 1.6
Foreign 94,747 1,575 1.7 72,712 1,751 2.4 60,621 1,362 2.2
Cash collateral on securities lent and repurchase agreements
Domestic 33,846 489 1.4 23,287 295 1.3 18,382 355 1.9
Foreign 614,295 9,525 1.6 515,665 9,328 1.8 523,375 9,726 1.9
Trading portfolio liabilities
Domestic 3,717 180 4.8 3,252 156 4.8 3,239 146 4.5
Foreign 161,286 7,813 4.8 127,104 9,769 7.7 109,013 8,080 7.4
Financial liabilities designated at fair value
Domestic 85 1 1.2 0 0 0 0
Foreign 49,234 1,167 2.4 22,445 751 3.3 10,905 341 3.1
Due to customers
Domestic – demand deposits 67,005 167 0.2 55,496 100 0.2 42,484 435 1.0
Domestic – savings deposits 84,112 414 0.5 81,963 527 0.6 71,465 625 0.9
Domestic – time deposits 19,052 280 1.5 21,125 395 1.9 27,646 447 1.6
Domestic – total 170,169 861 0.5 158,584 1,022 0.6 141,595 1,507 1.1
Foreign 1 192,992 2,677 1.4 161,723 2,149 1.3 172,650 3,062 1.8
Short-term debt
Domestic 246 0 64 0 0.0 69 0 0.0
Foreign 79,902 1,338 1.7 73,193 1,015 1.4 91,616 1,915 2.1
Long-term debt
Domestic 7,639 168 2.2 6,413 188 2.9 10,082 433 4.3
Foreign 30,922 1,328 4.3 30,775 1,286 4.2 35,958 2,038 5.7
Total interest-bearing liabilities 1,470,209 27,538 1.9 1,223,936 27,860 2.3 1,206,130 29,417 2.4
Non-interest-bearing liabilities
Negative replacement values 260,629 254,819 191,183
Other 63,065 47,391 45,337
Total liabilities 1,793,903 1,526,146 1,442,650
Shareholders’ equity 35,370 37,165 42,686
Total average liabilities and shareholders’ equity 1,829,273 1,563,311 1,485,336
Net interest income 11,860 12,299 10,546
Net yield on interest-earning assets 0.8 1.0 0.9
1 Due to customers in foreign offices consists mainly of time deposits.
213
The percentage of total average interest-earning assets attrib-utable to foreign activities was 86% for 2004 (85% for 2003and 84% for 2002). The percentage of total average interest-bearing liabilities attributable to foreign activities was 84% for2004 (82% for 2003 and 83% for 2002). All assets and lia-bilities are translated into CHF at uniform month-end rates.Interest income and expense are translated at monthly aver-age rates.
Average rates earned and paid on assets and liabilities canchange from period to period based on the changes in inter-est rates in general, but are also affected by changes in the cur-rency mix included in the assets and liabilities. This is especial-ly true for foreign assets and liabilities. Tax-exempt income isnot recorded on a tax-equivalent basis. For all three yearspresented, tax-exempt income is considered to be insignificantand therefore the impact from such income is negligible.

Additional Disclosure Required under SEC Regulations
D – Information Required by Industry Guide 3 (continued)
Analysis of Changes in Interest Income and Expense
The following tables allocate, by categories of interest-earning assets and interest-bearing liabilities, the changes in interestincome and expense due to changes in volume and interest rates for the year ended 31 December 2004 compared to theyear ended 31 December 2003, and for the year ended 31 December 2003 compared to the year ended 31 December 2002.Volume and rate variances have been calculated on movements in average balances and changes in interest rates. Changesdue to a combination of volume and rates have been allocated proportionally. Refer to page 221 of Industry Guide 3 for adiscussion of the treatment of impaired, non-performing and restructured loans.
2004 compared to 2003 2003 compared to 2002
Increase / (decrease) Increase / (decrease)due to changes in due to changes in
Average Average Net Average Average NetCHF million volume rate change volume rate change
Interest income from interest-earning assets
Due from banks
Domestic 19 (36) (17) (35 ) (153 ) (188 )
Foreign 124 (770) (646) 124 277 401
Cash collateral on securities borrowed and reverse repurchase agreements
Domestic 342 (85) 257 48 (83 ) (35 )
Foreign 2,432 (2,831) (399) 162 (163 ) (1 )
Trading portfolio assets
Domestic 60 55 115 6 (53 ) (47 )
Foreign – taxable 3,907 (3,144) 763 1,533 (96 ) 1,437
Foreign – non-taxable 8 (2) 6 (1 ) (9 ) (10 )
Foreign – total 3,915 (3,146) 769 1,532 (105 ) 1,427
Financial assets designated at fair value
Domestic 0 0 0 0 0 0
Foreign 0 0 0 0 0 0
Loans
Domestic 119 (1,155) (1,036) (215 ) (335 ) (550 )
Foreign 312 (304) 8 (120 ) 136 16
Financial investments
Domestic (17) (4) (13) (29 ) 9 (20 )
Foreign - taxable (5) 36 31 (48 ) (22 ) (70 )
Foreign - non-taxable 0 0 0 0 0 0
Foreign - total (5) 36 31 (48 ) (22 ) (70 )
Interest income
Domestic 523 (1,217) (694) (225 ) (615 ) (840 )
Foreign 6,778 (7,015) (237) 1,650 123 1,773
Total interest income from interest-earning assets 7,301 (8,232) (931) 1,425 (492 ) 933
Net interest on swaps 170 (737 )
Total interest income (761) 196
214

D – Information Required by Industry Guide 3 (continued)
Analysis of Changes in Interest Income and Expense (continued)
2004 compared to 2003 2003 compared to 2002
Increase / (decrease) Increase / (decrease)due to changes in due to changes in
Average Average Net Average Average NetCHF million volume rate change volume rate change
Interest expense on interest-bearing liabilities
Due to banks
Domestic 12 254 266 2 (304 ) (302 )
Foreign 529 (705) (176) 266 123 389
Cash collateral on securities lent and repurchase agreements
Domestic 137 57 194 93 (153 ) (60 )
Foreign 1,775 (1,578) 197 (146 ) (252 ) (398 )
Trading portfolio liabilities
Domestic 22 2 24 1 9 10
Foreign 2,632 (4,588) (1,956) 1,339 350 1,689
Financial liabilities designated at fair value
Domestic 0 1 1 0 0 0
Foreign 884 (468) 416 358 52 410
Due to customers
Domestic – demand deposits 23 44 67 130 (465 ) (335 )
Domestic – savings deposits 13 (126) (113) 94 (192 ) (98 )
Domestic – time deposits (39) (76) (115) (104 ) 52 (52 )
Domestic – total (3) (158) (161) 120 (605 ) (485 )
Foreign 406 122 528 (197 ) (716 ) (913 )
Short-term debt
Domestic 0 0 0 0 0 0
Foreign 94 229 323 (387 ) (513 ) (900 )
Long-term debt
Domestic 36 (56) (20) (158 ) (87 ) (245 )
Foreign 6 36 42 (295 ) (457 ) (752 )
Interest expense
Domestic 204 100 304 58 (1,140 ) (1,082 )
Foreign 6,326 (6,952) (626) 938 (1,413 ) (475 )
Total interest expense 6,530 (6,852) (322) 996 (2,553 ) (1,557 )
215

Additional Disclosure Required under SEC Regulations
D – Information Required by Industry Guide 3 (continued)
DepositsThe following table analyzes average deposits and the average rates on each deposit category listed below for the years ended 31 December 2004, 2003 and 2002. The geographic allocation is based on the location of the office or branch where the deposit is made. Deposits by foreign depositors in domestic offices were CHF 49,699 million, CHF 49,857 millionand CHF 43,914 million at 31 December 2004, 31 December 2003 and 31 December 2002, respectively.
31.12.04 31.12.03 31.12.02
Average Average Average Average Average AverageCHF million, except where indicated deposit rate (%) deposit rate (%) deposit rate (%)
Banks
Domestic offices
Demand deposits 7,770 0.1 3,836 0.0 3,524 0.7
Time deposits 4,693 1.7 7,581 0.6 9,010 1.7
Total domestic offices 12,463 0.7 11,417 0.4 12,534 1.4
Foreign offices
Interest-bearing deposits 1 23,648 1.7 21,118 2.4 17,668 2.2
Total due to banks 36,111 1.3 32,535 1.7 30,202 1.9
Customer accounts
Domestic offices
Demand deposits 67,005 0.2 55,496 0.2 42,484 1.0
Savings deposits 84,112 0.5 81,963 0.6 71,465 0.9
Time deposits 19,052 1.5 21,125 1.9 27,646 1.6
Total domestic offices 170,169 0.5 158,584 0.6 141,595 1.1
Foreign offices
Interest-bearing deposits 1 192,992 1.4 161,723 1.3 172,650 1.8
Total due to customers 363,161 1.0 320,307 1.0 314,245 1.5
1 Mainly time deposits.
At 31 December 2004, the maturity of time deposits exceeding CHF 150,000, or an equivalent amount in other currencies,was as follows:
CHF million Domestic Foreign
Within 3 months 30,107 128,027
3 to 6 months 1,392 3,470
6 to 12 months 882 662
1 to 5 years 932 2,627
Over 5 years 215 2,843
Total time deposits 33,528 137,629
216

D - Information Required by Industry Guide 3 (continued)
Short-term Borrowings
The following table presents our period-end, average and maximum month-end outstanding amounts for short-termborrowings, along with the average rates and period-end rates at and for the years ended 31 December 2004, 2003 and2002.
Money market paper issued Due to banks Repurchase agreements 1
CHF million, except where indicated 31.12.04 31.12.03 31.12.02 31.12.04 31.12.03 31.12.02 31.12.04 31.12.03 31.12.02
Period-end balance 79,442 58,115 72,800 83,381 89,089 48,732 557,892 500,592 464,020
Average balance 80,148 73,257 91,685 89,765 68,896 59,044 587,988 498,679 509,572
Maximum month-end balance 94,366 92,605 108,463 115,880 96,694 77,312 637,594 593,738 593,786
Average interest rate during the period (%) 1.7 1.4 2.1 1.6 2.8 3.1 1.5 1.8 1.8
Average interest rate at period-end (%) 2.1 1.3 1.5 2.0 1.5 2.0 2.0 1.3 1.7
1 For the purpose of this disclosure, balances are presented on a gross basis.
217

Additional Disclosure Required under SEC Regulations
D – Information Required by Industry Guide 3 (continued)
Contractual Maturities of the Investments in Debt Instruments
Within 1 year 1–5 years 5–10 years Over 10 years
CHF million, except percentages Amount Yield (%) Amount Yield (%) Amount Yield (%) Amount Yield (%)
31 December 20041
Swiss national government and agencies 1 5.50 2 4.29 6 3.80 1 4.00
Swiss local governments 10 3.97 10 4.14 0 0.00 0 0.00
Foreign governments and official institutions 36 2.13 4 1.25 0 0.00 0 0.00
Corporate debt securities 57 2.74 50 2.92 0 0.00 33 0.00
Mortgage-backed securities 3 2.50 0 0.00 5 3.21 64 4.36
Other debt securities 0 0.00 0 0.00 0 0.00 0 0.00
Total fair value 107 66 11 981 Money market papers have contractual maturities of less than one year.
Within 1 year 1–5 years 5–10 years Over 10 years
CHF million, except percentages Amount Yield (%) Amount Yield (%) Amount Yield (%) Amount Yield (%)
31 December 20031
Swiss national government and agencies 3 6.61 4 2.92 6 3.80 1 4.00
Swiss local governments 5 3.90 20 2.01 0 0.00 0 0.00
Foreign governments and official institutions 45 1.89 9 1.49 0 0.00 0 0.00
Corporate debt securities 81 1.09 68 3.53 7 7.38 0 0.00
Mortgage-backed securities 0 0.00 0 0.00 0 0.00 0 0.00
Other debt securities 4 0.00 8 0.00 0 0.00 0 0.00
Total fair value 138 109 13 11 Money market papers have contractual maturities of less than one year.
Within 1 year 1–5 years 5–10 years Over 10 years
CHF million, except percentages Amount Yield (%) Amount Yield (%) Amount Yield (%) Amount Yield (%)
31 December 20021
Swiss national government and agencies 0 0.00 7 4.88 8 3.86 1 4.00
Swiss local governments 8 4.02 30 3.94 4 3.59 0 0.00
Foreign governments and official institutions 35 4.63 45 3.13 1 6.12 0 0.00
Corporate debt securities 675 2.23 249 2.64 19 3.41 21 8.02
Mortgage-backed securities 4 2.25 15 3.97 4 4.03 0 0.00
Other debt securities 1 4.77 48 2.65 0 0.00 0 0.00
Total fair value 723 394 36 221 Money market papers have contractual maturities of less than one year.
218

D – Information Required by Industry Guide 3 (continued)
Due from Banks and Loans (gross)
Loans are widely dispersed over industry sectors both within and outside of Switzerland. With the exceptions of privatehouseholds (foreign and domestic) and banks and financial institutions outside Switzerland and real estate and rentals inSwitzerland, there is no material concentration of loans. For further discussion of the loan portfolio, see the Handbook2004 /2005. The following table illustrates the diversification of the loan portfolio among industry sectors at 31 December2004, 2003, 2002, 2001 and 2000. The industry categories presented are consistent with the classification of loans for re-porting to the Swiss Federal Banking Commission and Swiss National Bank.
CHF million 31.12.04 31.12.03 31.12.02 31.12.01 31.12.00
Domestic
Banks 1 1,406 619 1,029 1,533 2,896
Construction 1,943 2,175 2,838 3,499 4,870
Financial institutions 4,332 4,009 4,301 5,673 5,725
Hotels and restaurants 2,269 2,440 2,655 2,950 3,526
Manufacturing 2 5,485 6,478 7,237 8,686 9,577
Private households 105,160 102,181 95,295 93,746 91,667
Public authorities 5,460 5,251 5,529 5,222 5,658
Real estate and rentals 11,466 12,449 13,573 14,992 16,673
Retail and wholesale 4,908 6,062 7,172 8,674 9,635
Services 3 9,110 9,493 10,237 12,161 11,767
Other 4, 5 894 1,201 1,722 1,860 2,651
Total domestic 152,433 152,358 151,588 158,996 164,645
Foreign
Banks 34,114 31,405 31,882 26,728 27,168
Chemicals 366 245 519 1,080 1,423
Construction 122 84 153 266 773
Electricity, gas and water supply 745 249 1,105 977 1,584
Financial institutions 35,459 23,493 18,378 14,458 20,348
Manufacturing 6 2,758 2,421 2,300 4,258 4,596
Mining 1,695 1,114 868 1,313 2,070
Private households 30,237 21,194 33,063 25,619 29,470
Public authorities 1,228 1,224 2,628 6,454 11,754
Real estate and rentals 940 473 616 10,227 5,077
Retail and wholesale 1,102 1,880 1,367 1,732 1,862
Services 8,002 7,983 1,654 4,786 1,585
Transport, storage and communication 762 3,658 676 2,117 993
Other 5, 7 319 214 2,304 2,973 11,168
Total foreign 117,849 95,637 97,513 102,988 119,871
Total gross 270,282 247,995 249,101 261,984 284,5161 Includes Due from banks from Industrial Holdings of CHF 764 million at 31 December 2004. 2 Includes chemicals, food and beverages. 3 Includes transportation, communication, health and socialwork, education and other social and personal service activities. 4 Includes mining and electricity, gas and water supply. 5 31 December 2003 and 31 December 2002 amounts include a change inaccounting treatment of credit risk losses on OTC derivatives as at 1 January 2004, which are now recorded under Net trading income. As a consequence, the underlying gross exposure is no longerreported as “Due from Banks and Loans (gross)”. Years prior to 2002 have not been restated. 6 Includes food and beverages. 7 Includes hotels and restaurants.
219

Additional Disclosure Required under SEC Regulations
D - Information Required by Industry Guide 3 (continued)
Due from Banks and Loans (gross) (continued)
The following table analyzes the Group’s mortgage portfolio by geographic origin of the client and type of mortgage at 31 December 2004, 2003, 2002, 2001 and 2000. Mortgages are included in the industry categories mentioned above.
CHF million 31.12.04 31.12.03 31.12.02 31.12.01 31.12.00
Mortgages
Domestic 124,496 122,069 116,359 116,628 116,348
Foreign 12,185 7,073 11,510 9,583 4,206
Total gross mortgages 136,681 129,142 127,869 126,211 120,554
Mortgages
Residential 117,731 109,980 108,779 101,969 96,181
Commercial 18,950 19,162 19,090 24,242 24,373
Total gross mortgages 136,681 129,142 127,869 126,211 120,554
Due from Banks and Loan Maturities (gross)
The following table discloses loans by maturity at 31 December 2004. The determination of maturities is based on contractterms. Information on interest rate sensitivities can be found in Note 29 to the Financial Statements.
CHF million Within 1 year 1 to 5 years Over 5 years Total
Domestic
Banks 812 594 0 1,406
Mortgages 48,428 67,205 8,863 124,496
Other loans 18,818 5,960 1,753 26,531
Total domestic 68,058 73,759 10,616 152,433
Foreign
Banks 32,285 1,442 387 34,114
Mortgages 10,691 1,314 180 12,185
Other loans 59,198 6,581 5,771 71,550
Total foreign 102,174 9,337 6,338 117,849
Total gross 1 170,232 83,096 16,954 270,282
At 31 December 2004, the total amounts of Due from banks and loans due after one year granted at fixed and floating ratesare as follows:
CHF million 1 to 5 years Over 5 years Total
Fixed rate loans 78,623 14,828 93,451
Adjustable or floating rate loans 4,473 2,126 6,599
Total 83,096 16,954 100,0501 Includes Due from banks from Industrial Holdings of CHF 764 million at 31 December 2004.
220
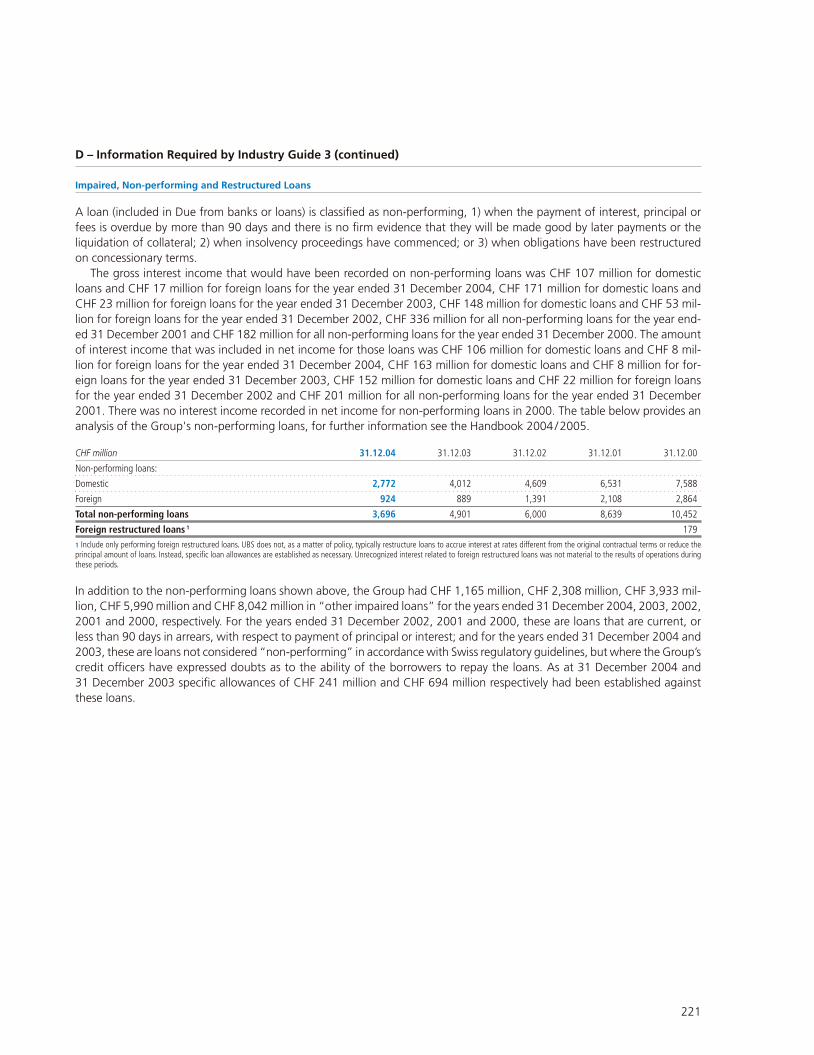
D – Information Required by Industry Guide 3 (continued)
Impaired, Non-performing and Restructured Loans
A loan (included in Due from banks or loans) is classified as non-performing, 1) when the payment of interest, principal orfees is overdue by more than 90 days and there is no firm evidence that they will be made good by later payments or theliquidation of collateral; 2) when insolvency proceedings have commenced; or 3) when obligations have been restructuredon concessionary terms.
The gross interest income that would have been recorded on non-performing loans was CHF 107 million for domesticloans and CHF 17 million for foreign loans for the year ended 31 December 2004, CHF 171 million for domestic loans andCHF 23 million for foreign loans for the year ended 31 December 2003, CHF 148 million for domestic loans and CHF 53 mil-lion for foreign loans for the year ended 31 December 2002, CHF 336 million for all non-performing loans for the year end-ed 31 December 2001 and CHF 182 million for all non-performing loans for the year ended 31 December 2000. The amountof interest income that was included in net income for those loans was CHF 106 million for domestic loans and CHF 8 mil-lion for foreign loans for the year ended 31 December 2004, CHF 163 million for domestic loans and CHF 8 million for for-eign loans for the year ended 31 December 2003, CHF 152 million for domestic loans and CHF 22 million for foreign loansfor the year ended 31 December 2002 and CHF 201 million for all non-performing loans for the year ended 31 December2001. There was no interest income recorded in net income for non-performing loans in 2000. The table below provides ananalysis of the Group's non-performing loans, for further information see the Handbook 2004 /2005.
CHF million 31.12.04 31.12.03 31.12.02 31.12.01 31.12.00
Non-performing loans:
Domestic 2,772 4,012 4,609 6,531 7,588
Foreign 924 889 1,391 2,108 2,864
Total non-performing loans 3,696 4,901 6,000 8,639 10,452
Foreign restructured loans 1 179
1 Include only performing foreign restructured loans. UBS does not, as a matter of policy, typically restructure loans to accrue interest at rates different from the original contractual terms or reduce theprincipal amount of loans. Instead, specific loan allowances are established as necessary. Unrecognized interest related to foreign restructured loans was not material to the results of operations duringthese periods.
In addition to the non-performing loans shown above, the Group had CHF 1,165 million, CHF 2,308 million, CHF 3,933 mil-lion, CHF 5,990 million and CHF 8,042 million in “other impaired loans” for the years ended 31 December 2004, 2003, 2002,2001 and 2000, respectively. For the years ended 31 December 2002, 2001 and 2000, these are loans that are current, orless than 90 days in arrears, with respect to payment of principal or interest; and for the years ended 31 December 2004 and2003, these are loans not considered “non-performing” in accordance with Swiss regulatory guidelines, but where the Group’scredit officers have expressed doubts as to the ability of the borrowers to repay the loans. As at 31 December 2004 and 31 December 2003 specific allowances of CHF 241 million and CHF 694 million respectively had been established againstthese loans.
221

Additional Disclosure Required under SEC Regulations
D – Information Required by Industry Guide 3 (continued)
Cross-Border Outstandings
Cross-border outstandings consist of general banking products such as loans (including unutilized commitments) and depositswith third parties, credit equivalents of over the counter (OTC) derivatives and repurchase agreements, and the market valueof the inventory of securities. Outstandings are monitored and reported on an ongoing basis by the credit risk managementand control organization with a dedicated country risk information system. With the exception of the 32 most developedeconomies, these exposures are rigorously limited. The following analysis excludes Due from banks from Industrial Holdings.
Claims that are secured by third-party guarantees are recorded against the guarantor’s country of domicile. Outstandingsthat are secured by collateral are recorded against the country where the asset could be liquidated. This follows the “Guide-lines for the Management of Country Risk”, which are applicable to all banks that are supervised by the Swiss Federal Bank-ing Commission.
The following tables list those countries for which cross-border outstandings exceeded 0.75% of total assets at 31 De-cember 2004, 2003 and 2002. At 31 December 2004, there were no outstandings that exceeded 0.75% of total assets inany country currently facing liquidity problems that the Group expects would materially affect the country’s ability to serviceits obligations.
For more information on cross-border exposure, see the Handbook 2004 /2005.
31.12.04
CHF million Banks Private Sector Public Sector Total % of total assets
United States 8,733 114,202 9,150 132,085 7.6
Germany 18,666 5,977 7,351 31,994 1.8
Italy 4,588 2,699 16,803 24,090 1.4
Japan 1,366 10,409 9,472 21,247 1.2
United Kingdom 8,321 11,929 328 20,578 1.2
France 5,559 6,835 2,776 15,170 0.9
31.12.03
CHF million Banks Private Sector Public Sector Total % of total assets
United States 10,125 108,461 8,138 126,724 8.2
Italy 4,747 2,233 18,289 25,269 1.6
Germany 17,499 5,884 1,270 24,654 1.6
United Kingdom 8,340 11,344 550 20,234 1.3
France 4,841 5,604 4,271 14,716 0.9
Japan 1,630 7,845 4,001 13,477 0.9
31.12.02
CHF million Banks Private Sector Public Sector Total % of total assets
United States 11,111 105,375 7,958 124,444 9.2
Germany 17,633 6,038 5,857 29,528 2.2
Italy 4,490 1,955 17,071 23,515 1.7
United Kingdom 10,001 11,963 345 22,310 1.7
France 5,218 7,640 8,138 20,996 1.6
Australia 5,435 4,114 2,285 11,834 0.9
Canada 2,186 3,044 5,851 11,081 0.8
222

D – Information Required by Industry Guide 3 (continued)
Summary of Movements in Allowances and Provisions for Credit Losses
The following table provides an analysis of movements in allowances and provisions for credit losses. The following analysisincludes Due from banks from Industrial Holdings.
UBS writes off loans against allowances only upon final settlement of bankruptcy proceedings, the sale of the underlyingassets and /or in case of debt forgiveness. Under Swiss law, a creditor can continue to collect from a debtor who has emergedfrom bankruptcy, unless the debt has been forgiven through a formal agreement.
CHF million 31.12.04 31.12.03 31.12.02 31.12.01 31.12.00
Balance at beginning of year 3,954 5,232 8,218 10,581 13,398
Domestic
Write-offs
Banks 0 0 0 0 0
Construction (49) (73 ) (148 ) (248 ) (261 )
Financial institutions (24) (37 ) (103 ) (51 ) (178 )
Hotels and restaurants (101) (57 ) (48 ) (52 ) (193 )
Manufacturing 1 (77) (121 ) (275 ) (109 ) (264 )
Private households (208) (262 ) (536 ) (1,297 ) (640 )
Public authorities 0 (18 ) 0 0 0
Real estate and rentals (109) (206 ) (357 ) (317 ) (729 )
Retail and wholesale (68) (67 ) (101 ) (115 ) (160 )
Services 2 (83) (111 ) (155 ) (93 ) (227 )
Other 3 (9) (43 ) (49 ) (46 ) (30 )
Total domestic write-offs (728) (995 ) (1,772 ) (2,328 ) (2,682 )
Foreign
Write-offs
Banks (21) (17 ) (49 ) (24 ) (15 )
Chemicals (1) 0 0 (2 ) 0
Construction (3) 0 0 (10 ) (13 )
Electricity, gas and water supply 0 0 (36 ) (63 ) (3 )
Financial institutions (34) (112 ) (228 ) (74 ) (33 )
Manufacturing 4 (23) (77 ) (70 ) (119 ) (11 )
Mining (8) (15 ) (1 ) (304 ) 0
Private households (8) (11 ) (65 ) (5 ) 0
Public authorities (2) 0 (1 ) 0 (4 )
Real estate and rentals 0 (1 ) (2 ) (1 ) 0
Retail and wholesale 0 (76 ) (10 ) 0 (160 )
Services (7) (25 ) (39 ) (30 ) (8 )
Transport, storage and communication 0 (24 ) (74 ) 0 (11 )
Other 5 (22) (83 ) (189 ) (48 ) (55 )
Total foreign write-offs (129) (441 ) (764 ) (680 ) (313 )
Total write-offs (857) (1,436 ) (2,536 ) (3,008 ) (2,995 )
1 Includes chemicals, food and beverages. 2 Includes transportation, communication, health and social work, education and other social and personal service activities. 3 Includes mining andelectricity, gas and water supply. 4 Includes food and beverages. 5 Includes hotels and restaurants.
223

Additional Disclosure Required under SEC Regulations
D – Information Required by Industry Guide 3 (continued)
Summary of Movements in Allowances and Provisions for Credit Losses (continued)
CHF million 31.12.04 31.12.03 31.12.02 31.12.01 31.12.00
Recoveries
Domestic 54 49 43 58 124
Foreign 5 38 27 23 39
Total recoveries 59 87 70 81 163
Net write-offs (798) (1,349 ) (2,466 ) (2,927 ) (2,832 )
Increase / (decrease) in credit loss allowance and provision (251) 72 115 498 (130 )
Collective loan loss provisions (25)
Other adjustments 1 3 (1 ) (635 ) 66 145
Balance at end of year 2,883 3,954 5,232 8,218 10,581
1 See the table below for details.
Doubtful interest 0 0 0 0 182
Net foreign exchange 2 (57 ) (269 ) 44 23
Subsidiaries sold and other adjustments 1 56 (366 ) 22 (60 )
Total adjustments 3 (1 ) (635 ) 66 145
224
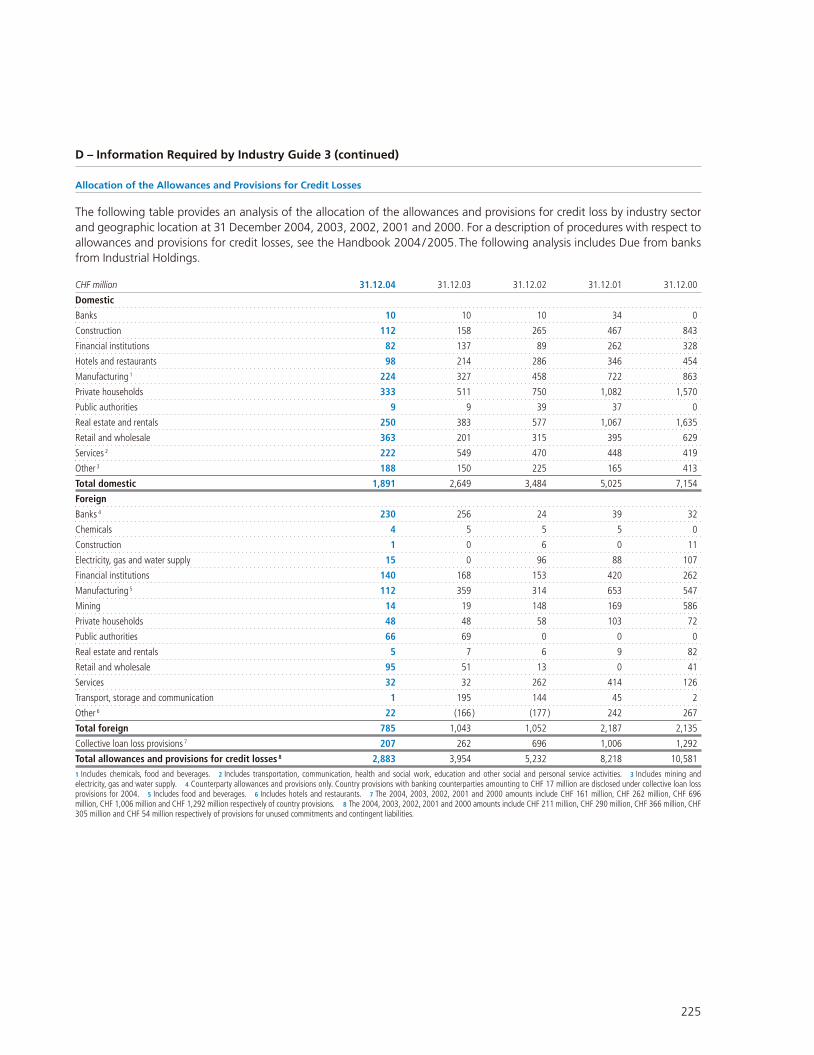
D – Information Required by Industry Guide 3 (continued)
Allocation of the Allowances and Provisions for Credit Losses
The following table provides an analysis of the allocation of the allowances and provisions for credit loss by industry sectorand geographic location at 31 December 2004, 2003, 2002, 2001 and 2000. For a description of procedures with respect toallowances and provisions for credit losses, see the Handbook 2004 /2005. The following analysis includes Due from banksfrom Industrial Holdings.
CHF million 31.12.04 31.12.03 31.12.02 31.12.01 31.12.00
Domestic
Banks 10 10 10 34 0
Construction 112 158 265 467 843
Financial institutions 82 137 89 262 328
Hotels and restaurants 98 214 286 346 454
Manufacturing 1 224 327 458 722 863
Private households 333 511 750 1,082 1,570
Public authorities 9 9 39 37 0
Real estate and rentals 250 383 577 1,067 1,635
Retail and wholesale 363 201 315 395 629
Services 2 222 549 470 448 419
Other 3 188 150 225 165 413
Total domestic 1,891 2,649 3,484 5,025 7,154
Foreign
Banks 4 230 256 24 39 32
Chemicals 4 5 5 5 0
Construction 1 0 6 0 11
Electricity, gas and water supply 15 0 96 88 107
Financial institutions 140 168 153 420 262
Manufacturing 5 112 359 314 653 547
Mining 14 19 148 169 586
Private households 48 48 58 103 72
Public authorities 66 69 0 0 0
Real estate and rentals 5 7 6 9 82
Retail and wholesale 95 51 13 0 41
Services 32 32 262 414 126
Transport, storage and communication 1 195 144 45 2
Other 6 22 (166 ) (177 ) 242 267
Total foreign 785 1,043 1,052 2,187 2,135
Collective loan loss provisions 7 207 262 696 1,006 1,292
Total allowances and provisions for credit losses 8 2,883 3,954 5,232 8,218 10,581
1 Includes chemicals, food and beverages. 2 Includes transportation, communication, health and social work, education and other social and personal service activities. 3 Includes mining andelectricity, gas and water supply. 4 Counterparty allowances and provisions only. Country provisions with banking counterparties amounting to CHF 17 million are disclosed under collective loan lossprovisions for 2004. 5 Includes food and beverages. 6 Includes hotels and restaurants. 7 The 2004, 2003, 2002, 2001 and 2000 amounts include CHF 161 million, CHF 262 million, CHF 696million, CHF 1,006 million and CHF 1,292 million respectively of country provisions. 8 The 2004, 2003, 2002, 2001 and 2000 amounts include CHF 211 million, CHF 290 million, CHF 366 million, CHF305 million and CHF 54 million respectively of provisions for unused commitments and contingent liabilities.
225

Additional Disclosure Required under SEC Regulations
D – Information Required by Industry Guide 3 (continued)
Due from Banks and Loans by Industry Sector (gross)
The following table presents the percentage of loans in each industry sector and geographic location to total loans. This tablecan be read in conjunction with the preceding table showing the breakdown of the allowances and provisions for credit loss-es by industry sectors to evaluate the credit risks in each of the categories.
in % 31.12.04 31.12.03 31.12.02 31.12.01 31.12.00
Domestic
Banks 1 0.5 0.2 0.4 0.6 1.0
Construction 0.7 0.9 1.1 1.3 1.7
Financial institutions 1.6 1.6 1.7 2.2 2.0
Hotels and restaurants 0.8 1.0 1.1 1.1 1.2
Manufacturing 2 2.0 2.6 2.9 3.3 3.4
Private households 38.9 41.2 38.3 35.8 32.2
Public authorities 2.0 2.1 2.2 2.0 2.0
Real estate and rentals 4.2 5.0 5.4 5.7 5.9
Retail and wholesale 1.8 2.4 2.9 3.3 3.4
Services 3 3.4 3.8 4.1 4.6 4.1
Other 4 0.5 0.6 0.8 0.8 1.0
Total domestic 56.4 61.4 60.9 60.7 57.9
Foreign
Banks 12.6 12.7 12.8 10.2 9.5
Chemicals 0.1 0.1 0.2 0.4 0.5
Construction 0.0 0.0 0.1 0.1 0.3
Electricity, gas and water supply 0.3 0.1 0.4 0.4 0.6
Financial institutions 13.1 9.5 7.4 5.5 7.2
Manufacturing 5 1.0 1.0 0.9 1.6 1.6
Mining 0.6 0.4 0.3 0.5 0.7
Private households 11.2 8.5 13.3 9.8 10.4
Public authorities 0.5 0.5 1.1 2.5 4.1
Real estate and rentals 0.3 0.2 0.2 3.9 1.8
Retail and wholesale 0.4 0.8 0.5 0.7 0.7
Services 3.0 3.2 0.7 1.8 0.6
Transport, storage and communication 0.3 1.5 0.3 0.8 0.3
Other 6 0.2 0.1 0.9 1.1 3.8
Total foreign 43.6 38.6 39.1 39.3 42.1
Total gross 100.0 100.0 100.0 100.0 100.0
1 Includes Due from banks from Industrial Holdings in the amount of CHF 764 million. 2 Includes chemicals, food and beverages. 3 Includes transportation, communication, health and social work,education and other social and personal service activities. 4 Includes mining and electricity, gas and water supply. 5 Includes food and beverages. 6 Includes hotels and restaurants.
226

D - Information Required by Industry Guide 3 (continued)
Loss History Statistics
The following is a summary of the Group’s loan loss history (relating to Due from banks and loans).
CHF million, except where indicated 31.12.04 31.12.03 31.12.02 31.12.01 31.12.00
Gross loans 270,2821 247,995 249,101 261,984 284,516
Impaired loans 4,861 7,209 9,933 14,629 18,494
Non-performing loans 3,696 4,901 6,000 8,639 10,452
Allowances and provisions for credit losses 2 2,883 3,954 5,232 8,218 10,581
Net write-offs 798 1,349 2,466 2,927 2,832
Credit loss (expense) / recovery 276 (72 ) (115 ) (498 ) 130
Ratios
Impaired loans as a percentage of gross loans 1.8 2.9 4.0 5.6 6.5
Non-performing loans as a percentage of gross loans 1.4 2.0 2.4 3.3 3.7
Allowances and provisions for credit losses as a percentage of:
Gross loans 1.1 1.6 2.1 3.1 3.7
Impaired loans 59.3 54.8 52.7 56.2 57.2
Non-performing loans 78.0 80.7 87.2 95.1 101.2
Allocated allowances as a percentage of impaired loans 3 51.5 48.0 45.7 49.9 52.4
Allocated allowances as a percentage of non-performing loans 4 61.3 56.4 57.6 62.2 60.6
Net write-offs as a percentage of:
Gross loans 0.3 0.5 1.0 1.1 1.0
Average loans outstanding during the period 0.3 0.5 1.0 1.2 1.1
Allowances and provisions for credit losses 27.7 34.1 47.1 35.6 26.8
Allowances and provisions for credit losses as a multiple of net write-offs 3.61 2.93 2.12 2.81 3.74
1 Includes Due from banks from Industrial Holdings of CHF 764 million. 2 Includes collective loan loss provisions. 3 Allowances relating to impaired loans only. 4 Allowances relating to non-performing loans only.
227

228
Cautionary statement regarding forward-looking statements | This communication contains statements that constitute“forward-looking statements”, including, but not limited to, statements relating to the implementation of strategic initiatives, suchas the European wealth management business, and other statements relating to our future business development and economicperformance. While these forward-looking statements represent our judgments and future expectations concerning the develop-ment of our business, a number of risks, uncertainties and other important factors could cause actual developments and results todiffer materially from our expectations. These factors include, but are not limited to, (1) general market, macro-economic, govern-mental and regulatory trends, (2) movements in local and international securities markets, currency exchange rates and interestrates, (3) competitive pressures, (4) technological developments, (5) changes in the financial position or creditworthiness of ourcustomers, obligors and counterparties and developments in the markets in which they operate, (6) legislative developments, (7)management changes and changes to our Business Group structure and (8) other key factors that we have indicated could adverselyaffect our business and financial performance which are contained in other parts of this document and in our past and future filings and reports, including those filed with the SEC. More detailed information about those factors is set forth elsewhere in thisdocument and in documents furnished by UBS and filings made by UBS with the SEC, including UBS’s Annual Report on Form 20-Ffor the year ended 31 December 2004. UBS is not under any obligation to (and expressly disclaims any such obligations to) updateor alter its forward-looking statements whether as a result of new information, future events, or otherwise.
Imprint | Publisher/Copyright: UBS AG, Switzerland | Languages: English, German | SAP-No. 80531E-0501

ab
UBS AGP.O. Box, CH-8098 ZurichP.O. Box, CH-4002 Basel
www.ubs.com


