+ All Categories
Home > Documents > Ab Initio Phase Diagrams of Minerals · Artem R. Oganov Laboratory of Crystallography, ETH Zurich,...

Ab Initio Phase Diagrams of Minerals · Artem R. Oganov Laboratory of Crystallography, ETH Zurich,...

Date post: 16-May-2018
Category:
Upload: vudung
View: 219 times
Download: 1 times
Share this document with a friend
33
Artem R. Oganov Laboratory of Crystallography, ETH Zurich, Zurich CH-8092, Switzerland. E-mail: [email protected] Web-page: http://olivine.ethz.ch/~artem Ab Initio Phase Diagrams of Minerals
Transcript

Artem R. Oganov

Laboratory of Crystallography, ETH Zurich, Zurich CH-8092, Switzerland.

E-mail: [email protected]: http://olivine.ethz.ch/~artem

Ab Initio Phase Diagrams of Minerals

Theoretical Mineral Physics Group at ETH Zurich…

Acknowledgements:

Collaborators: S.Ono, M.Gillan, D.Price, ABINIT group, VASP group, ...

Supercomputers: CSCS (Manno), CSAR (Manchester), own.

Synchrotron: SPring8 (Japan).

ETH Zurich: funding.

Plan:

IntroductionSimulation MethodsResults

MgOSiO2

MgSiO3 perovskite and post-perovskite

ConclusionsAppendices

1. Introduction

Earth’s InteriorLower mantle:

53 vol.% of the Earth!!!75 vol.% - MgSiO3perovskite20% - (Mg,Fe)O5% - CaSiO3 perovskiteBottom 200 km -MYSTERY!!!(D’’ layer).

Earth’s structure

Phase Diagrams and Deep Earth

Phase relations in mantle(after Ringwood, 1991)

Mantle convection: 670 km boundaryis a partial barrier (thanks to P.Tackley)

Seismic discontinuities. Geochemistry. Geodynamics.

Which Diagrams Needed?Mantle: MgO-SiO2-CaO-Al2O3-FeO-Fe2O3.p,T,x-phase diagrams, ideally.

Here: pure MgO, SiO2, MgSiO3.

2. Simulation Methods

Density-Functional Perturbation Theory

Quasiharmonic approximation.Phonon frequencies ωi(k) and density of states g(ω).Thermodynamic properties, e.g.:

G=F+(-dF/dV)V.ABINIT code.

Ab Initio Lattice Dynamics

Phonon dispersion curves and phonon density of states of MgO: 0 GPa, 400 GPa, 600 GPa. (Oganov et al., J.Chem.Phys. 118, 10174 (2003))

3. Results

Story 1: MgOB1 vs B2 (not Vitamins!)

B1 – structure type NaCl.B2 – structure type CsCl. Unique stability of the B1 structure! Ideal as a pressure calibrant.

B1

B2

Phase diagram of MgO

Oganov et al., J.Chem.Phys. 118, 10174 (2003)

♦Only B1 phase in the Earth.

Story 2: Phase diagram of SiO2

No seismic discontinuities from SiO2transitions.Breakdown of close packing at >200 GPa!

Oganov et al., Submitted to PRL (2004)

Pyrite-type structure (210 GPa<P )

Breakdown of Close PackingAtoms don’t behave as spheres!Non-close-packed

structures far denser!

From Oganov et al., submitted to PRL (2004).

Seeing Atoms and Bonds

Oganov et al., submitted to PRL (2004).

•Aspherical atoms. •No O-O bonds, despite (3,-1) critical points. •Si charge: +3.17 (Bader), +4.02 (Born).

Localised Orbital Locator

•Schmider & Becke (2000,2002).•Own implementation in VASP.

Story 3: MgSiO3 perovskite

♦ (Mg,Fe)SiO3 perovskite ~40 vol.% of the Earth.

Three issues:♦ Symmetry of perovskite♦ Decomposition of perovskite♦ Post-perovskite phase

Perovskite crystals (CaTiO3)

1. SymmetryIdeal structure – cubic (Pm3m). MgSiO3 perovskite at ambient conditions – Pbnm.Higher symmetry at high P-T ?

Cubic (Pm3m) Tetragonal (I4/mcm) Orthorhombic (Pbnm)

1. Symmetry

MgSiO3 perovskite at 88 GPa and 3500 K

MgSiO3: decompositionDecomposition at high-P-T? Theory: NO! ∆S=-5 Jmol-1K-1 (100 GPa, 3000 K).

Enthalpy of decomposition of MgSiO3perovskite. Oganov et al., In prep. (2004)

MgSiO3: Post-perovskite phase

S.Ono (2004): proposed that MgSiO3 could adopt Fe2O3-III structure.Post-perovskite phase ~75 vol.% of D’’ layer!Experimentally confirmed by Oganov & Ono (2004) and Murakami et al. (2004).

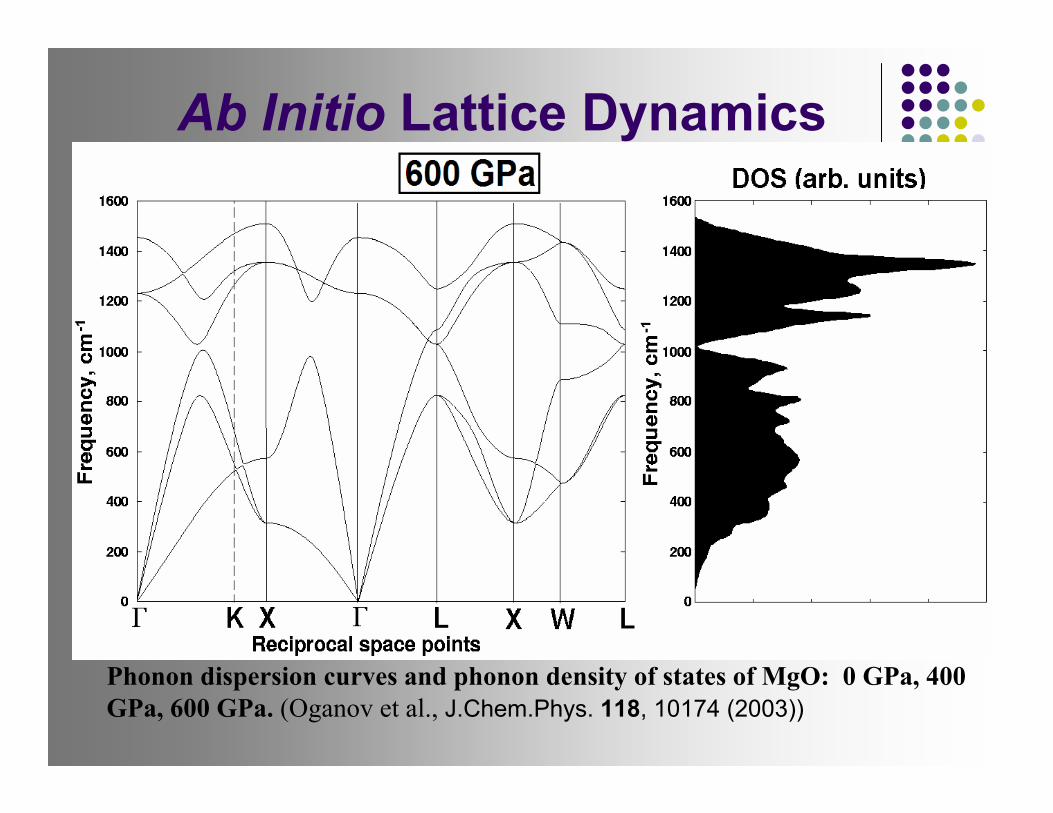
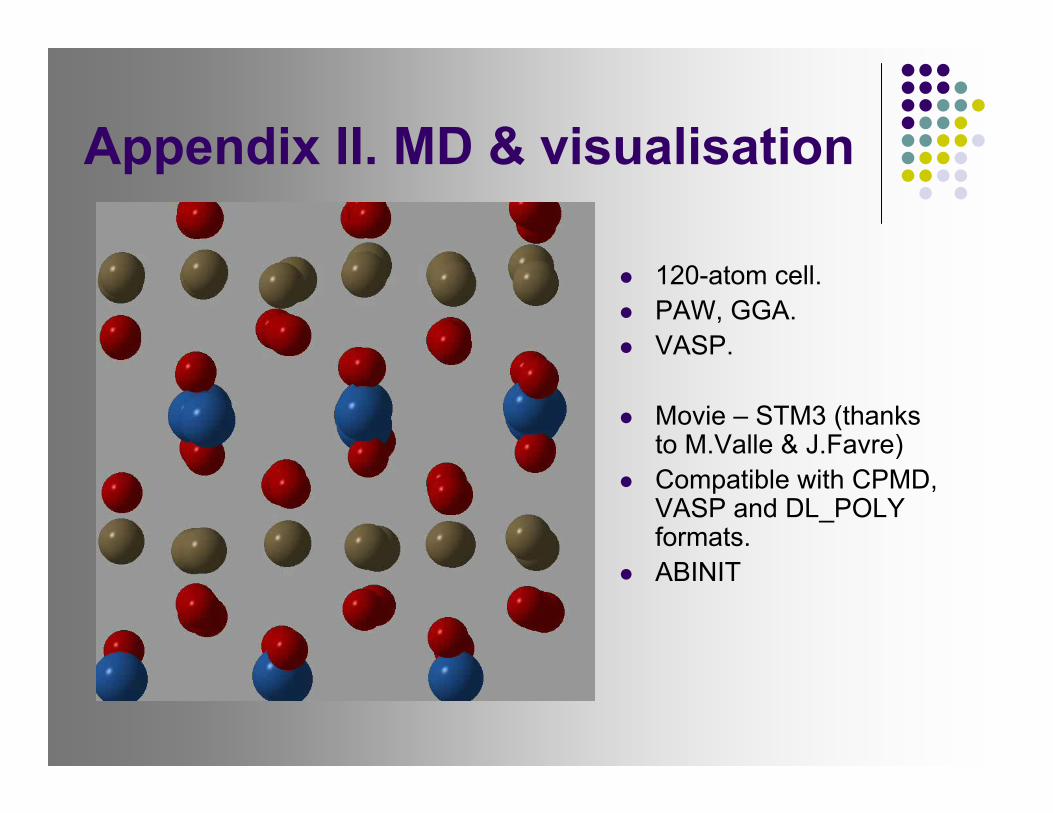
Structure of post-perovskite phase of MgSiO3.(Oganov & Ono, subm. to Nature, 2004).

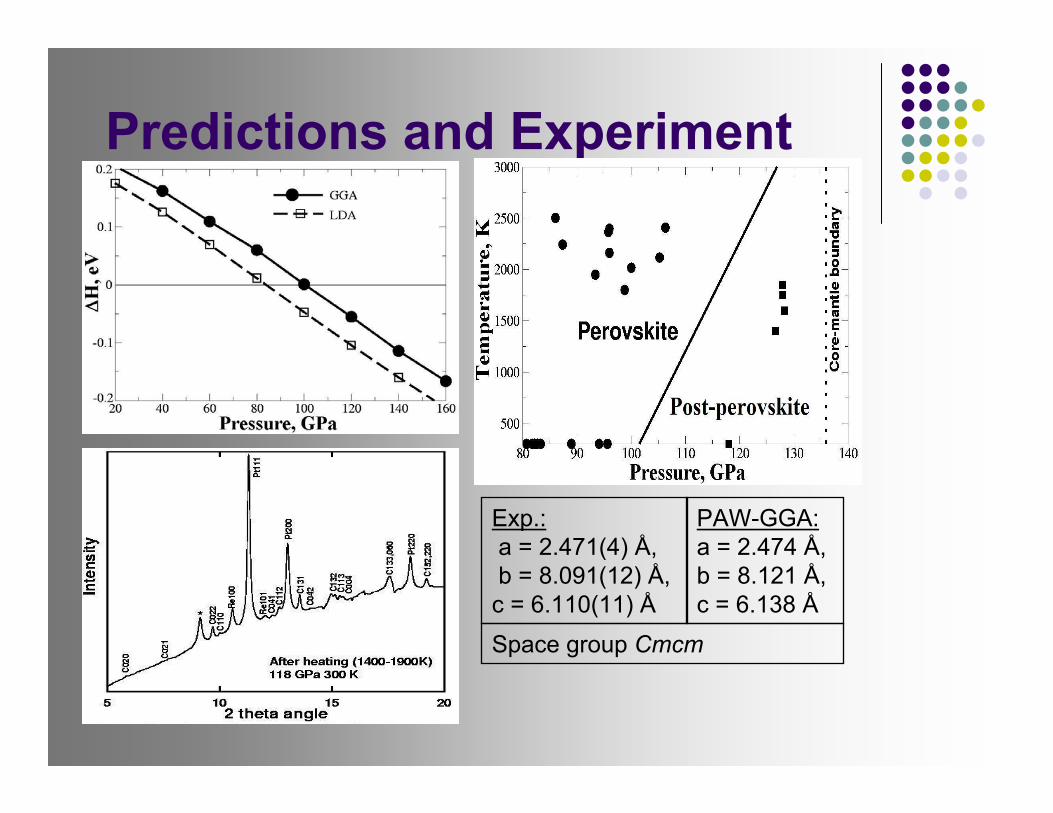
Predictions and Experiment

Exp.:a = 2.471(4) Å, b = 8.091(12) Å, c = 6.110(11) Å

PAW-GGA:a = 2.474 Å, b = 8.121 Å, c = 6.138 Å

Space group Cmcm

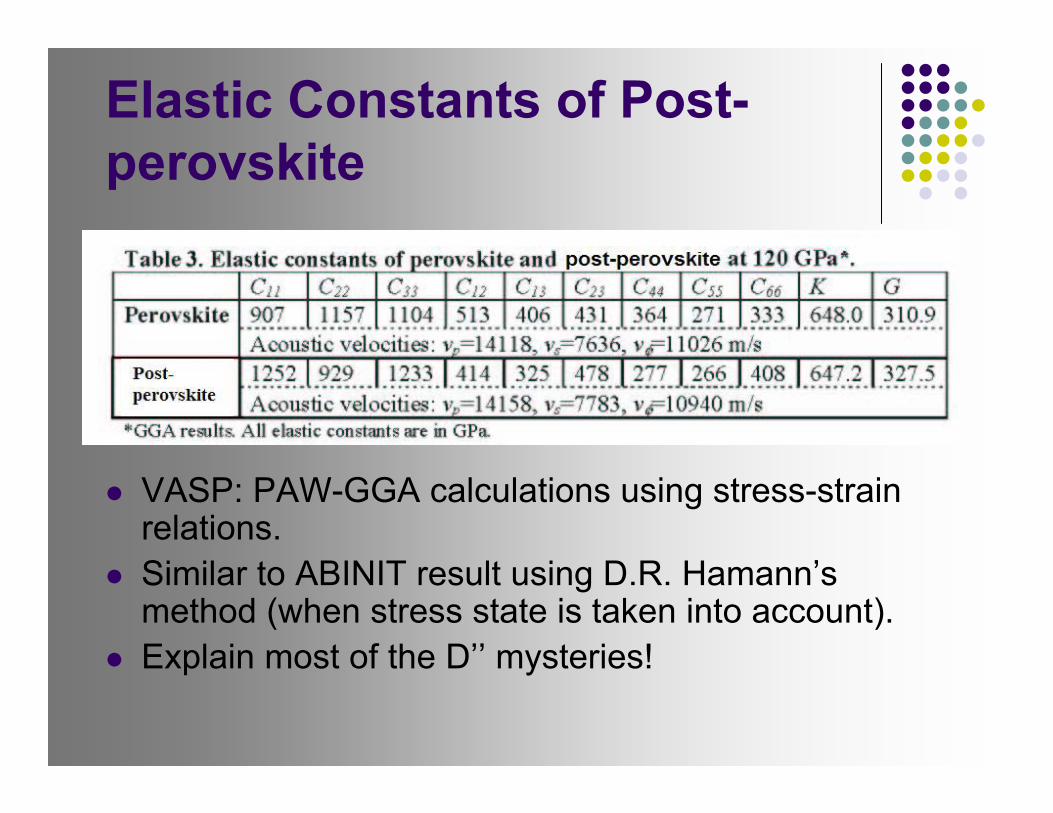
Elastic Constants of Post-perovskite

VASP: PAW-GGA calculations using stress-strain relations.Similar to ABINIT result using D.R. Hamann’smethod (when stress state is taken into account).Explain most of the D’’ mysteries!

MgSiO3: Post-perovskite phase Matches D’’ discontinuity: 2740 km depth, 1.4% jump in vs, strong topography.Explains seismic anisotropy of D’’ and its other enigmas. D’’ evolves with time.

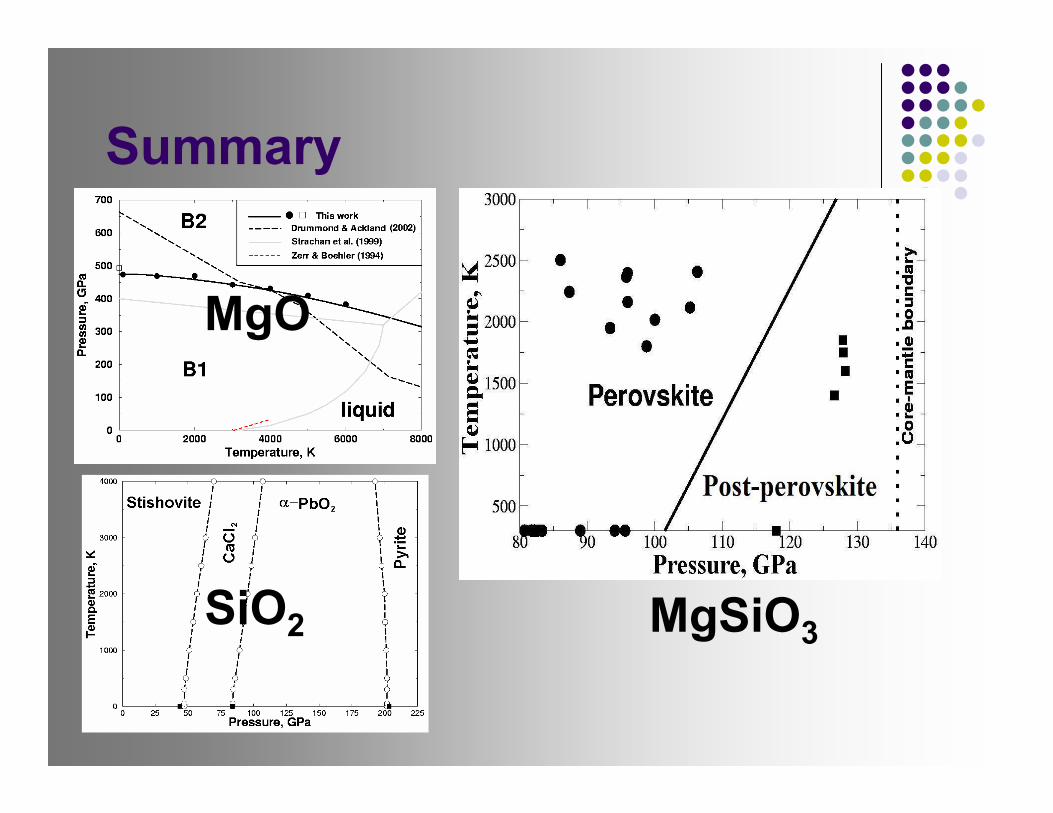
Theoretical and experimental phase diagram of MgSiO3.

Summary

SiO2 MgSiO3

MgO

Further Work and Challenges

Structure prediction – Genetic Algorithms?Solid solutions (Monte Carlo?).Strongly correlated systems – (Mg,Fe)O etc.

Appendix I. Accuracy.MgO, 1 atm, 300 K:Cv=36.58/36.87 theory/exp.S =26.81/27.13

Stishovite (SiO2), 1 atm, 300 K:Cv=41.3/42.2 theory/exp.S = 24.6/25.9

Appendix II. MD & visualisation

120-atom cell.PAW, GGA.VASP.

Movie – STM3 (thanks to M.Valle & J.Favre)Compatible with CPMD, VASP and DL_POLY formats. ABINIT

Appendix III. Elasticity under pressure

Non-uniqueness of the definition (strain type, differentiation details) when pressure (P) is present.


Recommended