24
Ab initio Simulation of Helium-Ion Microscopy Images: The Case of Suspended Graphene Mustafa EROL
| Date post: | 14-Apr-2018 |
| Category: |
Documents |
| Upload: | mustafa-erol |
| View: | 215 times |
| Download: | 0 times |
7/27/2019 Ab Initio Simulation of Helium-Ion Microscopy Images
http://slidepdf.com/reader/full/ab-initio-simulation-of-helium-ion-microscopy-images 1/24
Ab initio Simulation of Helium-Ion
Microscopy Images: The Case of
Suspended Graphene
Mustafa EROL

7/27/2019 Ab Initio Simulation of Helium-Ion Microscopy Images
http://slidepdf.com/reader/full/ab-initio-simulation-of-helium-ion-microscopy-images 2/24
Hong Zhang, Yoshiyuki Miyamoto,
Angel Rubio
Vice-president for ScientificDevelopment ETSF -
European Theoretical
Spectroscopy Facility
Hong Zhang Yoshiyuki Miyamoto

7/27/2019 Ab Initio Simulation of Helium-Ion Microscopy Images
http://slidepdf.com/reader/full/ab-initio-simulation-of-helium-ion-microscopy-images 3/24
MOTIVATION
• The development of nondestructive imagining tecniques that provides themaximum amount of information about the structural and dynamic properties of raw nanostructures.
• Scaning Electron Microscopy (SEM) is a usefull nondestructive imaging method.
• The spatial resolution of SEM is not comparable with that of high-resolutiontransmission electron microscopy (HRTEM), that needs destructive pretreatment
of samples.• The advantage of the HIM analysis of graphene over HRTEM is that it does not
require sample preparation before measurement.
• Compared with (SEM), helium ion microscopy (HIM) produces higher contrastimages.
• The HIM measurements of nanostructures are nondestructive unless the flux of the He+ beam is high.
• The technique is nondestructive because of the small ion-ion collision cross sectionat a He+ kinetic energy of around 30 keV, which is the normal operating energy forHIM.

7/27/2019 Ab Initio Simulation of Helium-Ion Microscopy Images
http://slidepdf.com/reader/full/ab-initio-simulation-of-helium-ion-microscopy-images 4/24
HIMextreme high resolution“XHR” SEM
FIG 1: Images of the Pt surface at grain boundaries.

7/27/2019 Ab Initio Simulation of Helium-Ion Microscopy Images
http://slidepdf.com/reader/full/ab-initio-simulation-of-helium-ion-microscopy-images 5/24
HIMSEM
FIG 2: First Line: Chinese hamster ovary CHO cells
Second Line: cross section of dynamic random access memory DRAM cells.
7/27/2019 Ab Initio Simulation of Helium-Ion Microscopy Images
http://slidepdf.com/reader/full/ab-initio-simulation-of-helium-ion-microscopy-images 6/24
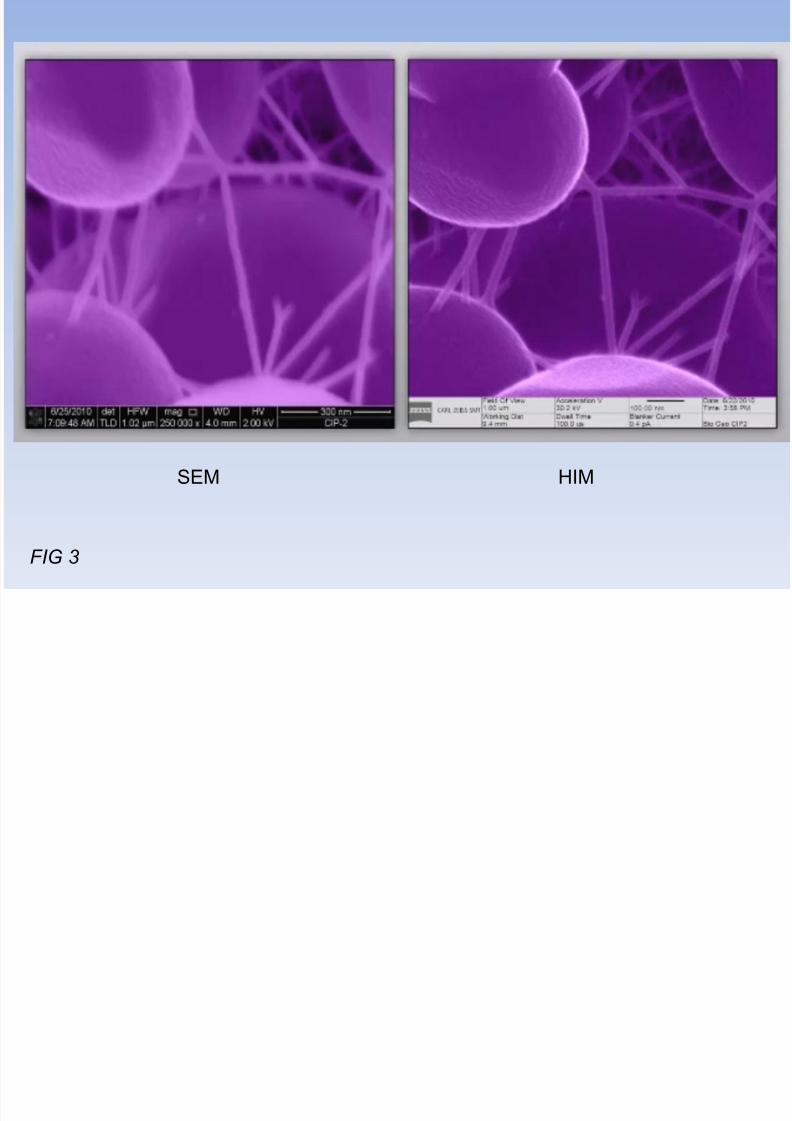
HIMSEM
FIG 3
7/27/2019 Ab Initio Simulation of Helium-Ion Microscopy Images
http://slidepdf.com/reader/full/ab-initio-simulation-of-helium-ion-microscopy-images 7/24
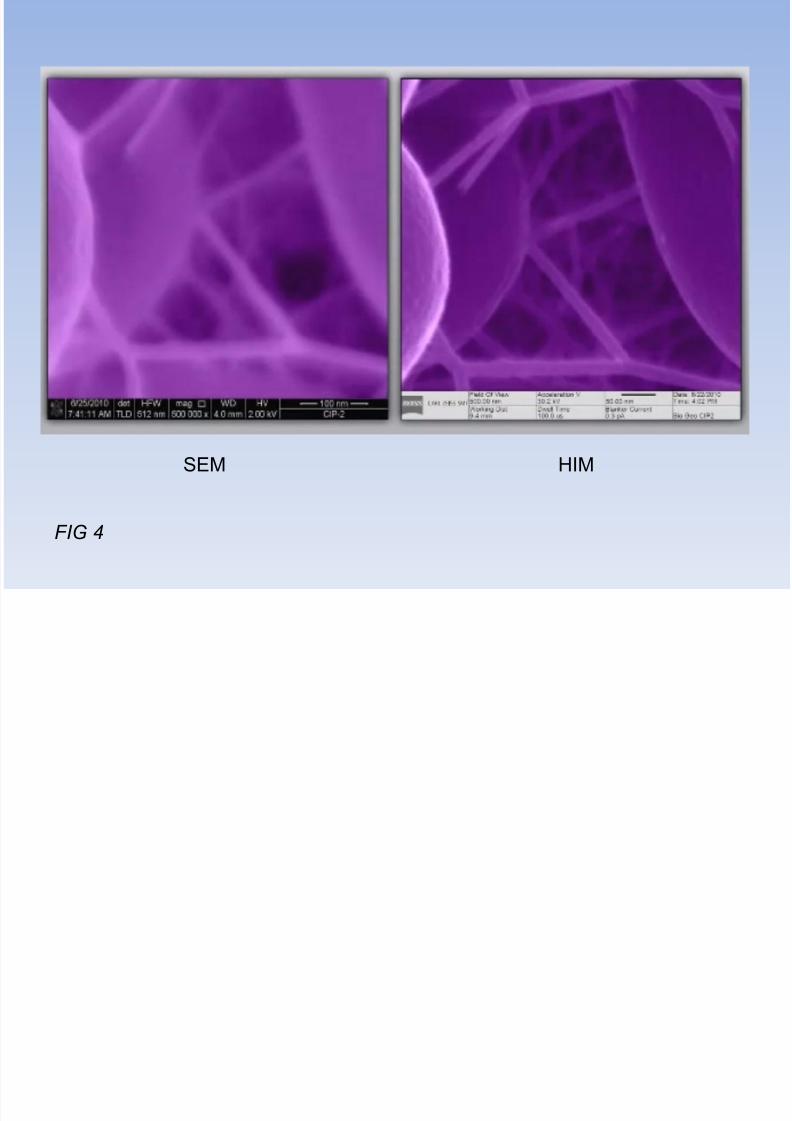
HIMSEM
FIG 4

7/27/2019 Ab Initio Simulation of Helium-Ion Microscopy Images
http://slidepdf.com/reader/full/ab-initio-simulation-of-helium-ion-microscopy-images 8/24

7/27/2019 Ab Initio Simulation of Helium-Ion Microscopy Images
http://slidepdf.com/reader/full/ab-initio-simulation-of-helium-ion-microscopy-images 9/24
• Cross sections of interaction between helium 1s orbital and graphene
valence orbitals, as well as ion-ion, and ion-electron interactions are
automatically taken into account with different impact points. This
approach has never been applied to interpret HIM image.

7/27/2019 Ab Initio Simulation of Helium-Ion Microscopy Images
http://slidepdf.com/reader/full/ab-initio-simulation-of-helium-ion-microscopy-images 10/24
Theoretical Informations
• For the TDDFT-molecular dynamics (MD) simulation, it was necessary to
prepare the initial electron wave function conditions for the system with
He+ above the graphene sheet.
• The series of wave functions for He+,
and its valence charge density,

7/27/2019 Ab Initio Simulation of Helium-Ion Microscopy Images
http://slidepdf.com/reader/full/ab-initio-simulation-of-helium-ion-microscopy-images 11/24
and the series of the wave functions for the graphene sheet,
and its valence charge,
were individually computed in the common unit cell.
• Both He+ and graphene were located in the same cell with theHamiltonians made of the sum of the valence charge densities,
7/27/2019 Ab Initio Simulation of Helium-Ion Microscopy Images
http://slidepdf.com/reader/full/ab-initio-simulation-of-helium-ion-microscopy-images 12/24
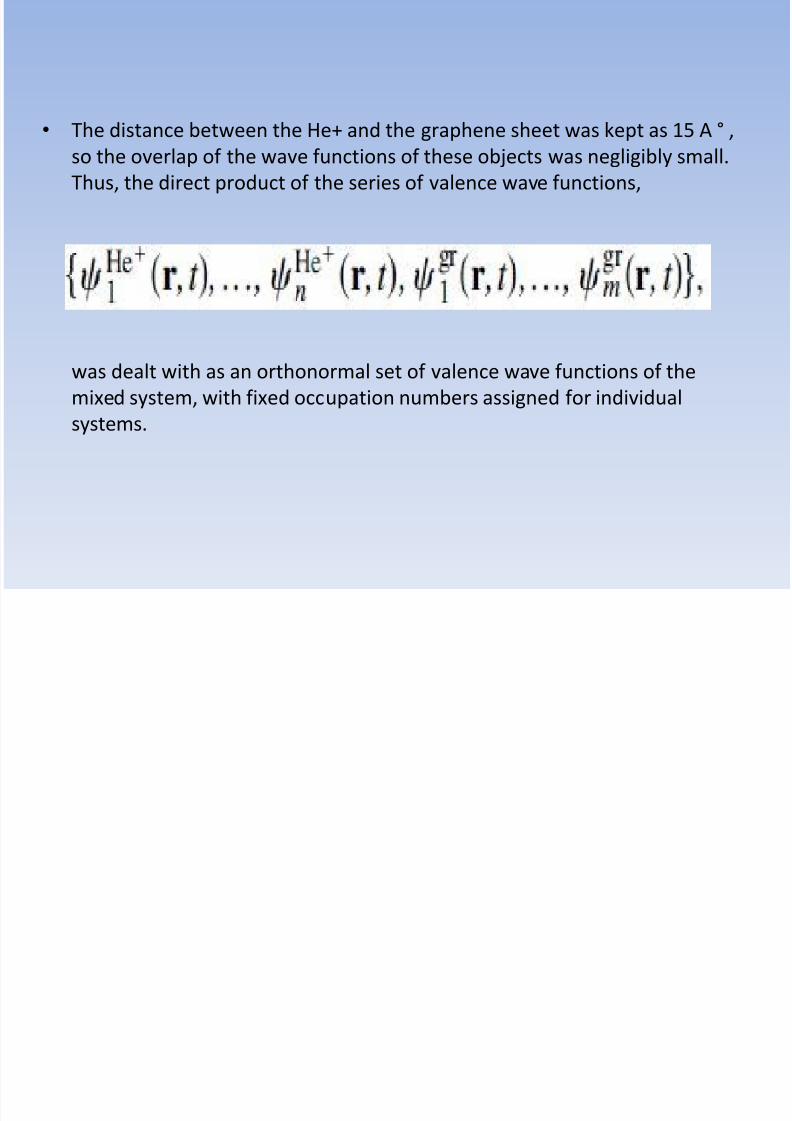
•The distance between the He+ and the graphene sheet was kept as 15 A ° ,so the overlap of the wave functions of these objects was negligibly small.
Thus, the direct product of the series of valence wave functions,
was dealt with as an orthonormal set of valence wave functions of the
mixed system, with fixed occupation numbers assigned for individual
systems.

7/27/2019 Ab Initio Simulation of Helium-Ion Microscopy Images
http://slidepdf.com/reader/full/ab-initio-simulation-of-helium-ion-microscopy-images 13/24
• Periodic boundary conditions were used; therefore a super-cell consisting
of a 5×5 graphene unit cell and a vacuum region of 30 A ° was used to
prevent a sudden charge transfer from the graphene sheet to the He+
before the TDDFT-MD simulation.
• The low dose of He+ ion was assumed in this Letter, so series of He+
impact after electron emission was not considered.

7/27/2019 Ab Initio Simulation of Helium-Ion Microscopy Images
http://slidepdf.com/reader/full/ab-initio-simulation-of-helium-ion-microscopy-images 14/24
• FIG. 5 : (a) Impact points A-F of the He+ ion. The numbers are the corresponding valence
charge (electrons per A ° ), at a height of 8A ° from the graphene sheet. The height is chosen
to avoid spurious effects from the periodic boundary conditions used in the present Letter. (b)
The distribution of the valence charge density (lateral axis) plotted along the axis normal to
the graphene sheet (vertical axis) for impact points A-F.
• The plots shown in the panels are averaged parallel to the graphene sheet for snapshots at
t =2.9 fs when the He atom has already crossed the graphene layer and reached a distance of
14A ° , far from it. The dotted line denotes the graphene sheet, and the dashed-dotted line
denotes where the charge density of the emitted electron shows a peak. (c) Contour map of
the intensity profile of the secondary emitted electron as a function of the impact points of
the helium ion, which produces a HIM image. The maximum and minimum values of the
contour lines are shown in electrons per angstrom. The values of the contour lines are on alinear scale.

7/27/2019 Ab Initio Simulation of Helium-Ion Microscopy Images
http://slidepdf.com/reader/full/ab-initio-simulation-of-helium-ion-microscopy-images 15/24
FIG. 6: (a) Time evolution of the height distribution of the valence charge for the He+ion colliding with site E in Fig. 5(a). The height of the graphene was the zero level.
The change in the He atom position is indicated by arrows. The He ion lost about 88
eV in kinetic energy; however, this energy-loss introduces a very small change in the
He trajectory displayed in this figure. (b) The same simulation starting with a neutral
He atom.
h l h f h l d l d d h

7/27/2019 Ab Initio Simulation of Helium-Ion Microscopy Images
http://slidepdf.com/reader/full/ab-initio-simulation-of-helium-ion-microscopy-images 16/24
• They analyze the origin of the electron emission displayed in Figs. 5and 6. When
the charge density around the He atom at t=2.9 fs within a radius of 3 A ° was
partially integrated, the He nucleus acquired 1.2 –1.4 electrons, depending on the
impact points. This incomplete neutralization of the He ion after passing the
graphene sheet suggests a small secondary electron emission started with the
neutralization of the He ion.
• The incomplete neutralization is partly caused by the high speed of the He+ ion,
and by the atomic-layer thickness of the graphene sheet.
• This neutralization will not structurally damage the graphene. Thus, we expect that
the HIM measurements will be nondestructive.
• Thus, the interaction time is too short to achieve complete charge transfer. The
TDDFT simulation with lower ion speeds showed a larger amount of charge transfer
from the graphene sheet .
• During the impact of the He+ ion, the ion’s kinetic energy decreased by around 88
eV, which is a measure of the stopping power due to electron excitation in
graphene and in the projectile ion .
7/27/2019 Ab Initio Simulation of Helium-Ion Microscopy Images
http://slidepdf.com/reader/full/ab-initio-simulation-of-helium-ion-microscopy-images 17/24
FIG 7

7/27/2019 Ab Initio Simulation of Helium-Ion Microscopy Images
http://slidepdf.com/reader/full/ab-initio-simulation-of-helium-ion-microscopy-images 18/24
CONCLUSION
• HIM can produce images of a suspended graphene sheet. They haveperformed an extensive first-principles simulation based on TDDFT for the
electron-ion dynamics of He+ ion collision with a suspended graphene
sheet displays the honeycomb pattern of graphene.
• They predict that resolution of HIM could be competitive to HRTEM when
highly focused ion beam technology is applied and measuring a latticeimage of suspended graphene by HIM is feasible.
• Atomic level resolution of suspended graphene has been achieved by
scanning tunneling microscope (STM). One advantage of HIM is its
nondestructive nature with a low dose of He ions while STM needs high
attention in operating the tip to avoid mechanical interaction andsubsequent oscillation on the graphene sheet . Both STM and HIM are
very sensitive to contamination of the graphene sheet, which influences
the valence electronic structure and therefore the corresponding STM and
HIM images.

7/27/2019 Ab Initio Simulation of Helium-Ion Microscopy Images
http://slidepdf.com/reader/full/ab-initio-simulation-of-helium-ion-microscopy-images 19/24
• Thank you for listening

7/27/2019 Ab Initio Simulation of Helium-Ion Microscopy Images
http://slidepdf.com/reader/full/ab-initio-simulation-of-helium-ion-microscopy-images 20/24
7/27/2019 Ab Initio Simulation of Helium-Ion Microscopy Images
http://slidepdf.com/reader/full/ab-initio-simulation-of-helium-ion-microscopy-images 21/24
»QUESTIONS ?

7/27/2019 Ab Initio Simulation of Helium-Ion Microscopy Images
http://slidepdf.com/reader/full/ab-initio-simulation-of-helium-ion-microscopy-images 22/24
• Figures 1(a) and 1(b) show the impact points (labeled as A-F) and
snapshots of the height distribution of electrons at t=2.9 fs, when the He+
is 14 A ° away from the sheet. The charge distribution was taken as the
planar average. At this time, no significant kinetic energy was transferred
to the C atoms of the graphene sheet, because of the very small cross
section of the ion-ion interaction for the high incident kinetic energy of
He+ (30 keV).
• Figure 1(b) also shows that the emitted electron distribution increased
from impact points A to F. The depicted contour lines for secondary
emitted electrons in Fig. 1 were estimated by interpolating the charge
distribution at a height of 8 A ° for all the impact points [Fig. 1(c)]. Theheight is chosen to avoid spurious effects from the periodic boundary
conditions used in the present Letter.

7/27/2019 Ab Initio Simulation of Helium-Ion Microscopy Images
http://slidepdf.com/reader/full/ab-initio-simulation-of-helium-ion-microscopy-images 23/24
• They analyze the origin of the electron emission displayed in Figs. 1 and 2.
When the charge density around the He atom at t=2.9 fs within a radius
of 3 A ° was partially integrated, the He nucleus acquired 1.2 –1.4
electrons, depending on the impact points. This incomplete neutralization
of the He ion after passing the graphene sheet suggests a small secondary
electron emission started with the neutralization of the He ion.
• The incomplete neutralization is partly caused by the high speed of the
He+ ion, and by the atomic-layer thickness of the graphene sheet.
• This neutralization will not structurally damage the graphene. Thus, we
expect that the HIM measurements will be nondestructive.
• Thus, the interaction time is too short to achieve complete charge transfer.
The TDDFT simulation with lower ion speeds showed a larger amount of
charge transfer from the graphene sheet .
• During the impact of the He+ ion, the ion’s kinetic energy decreased by
around 88 eV, which is a measure of the stopping power due to electron
excitation in graphene and in the projectile ion .
7/27/2019 Ab Initio Simulation of Helium-Ion Microscopy Images
http://slidepdf.com/reader/full/ab-initio-simulation-of-helium-ion-microscopy-images 24/24
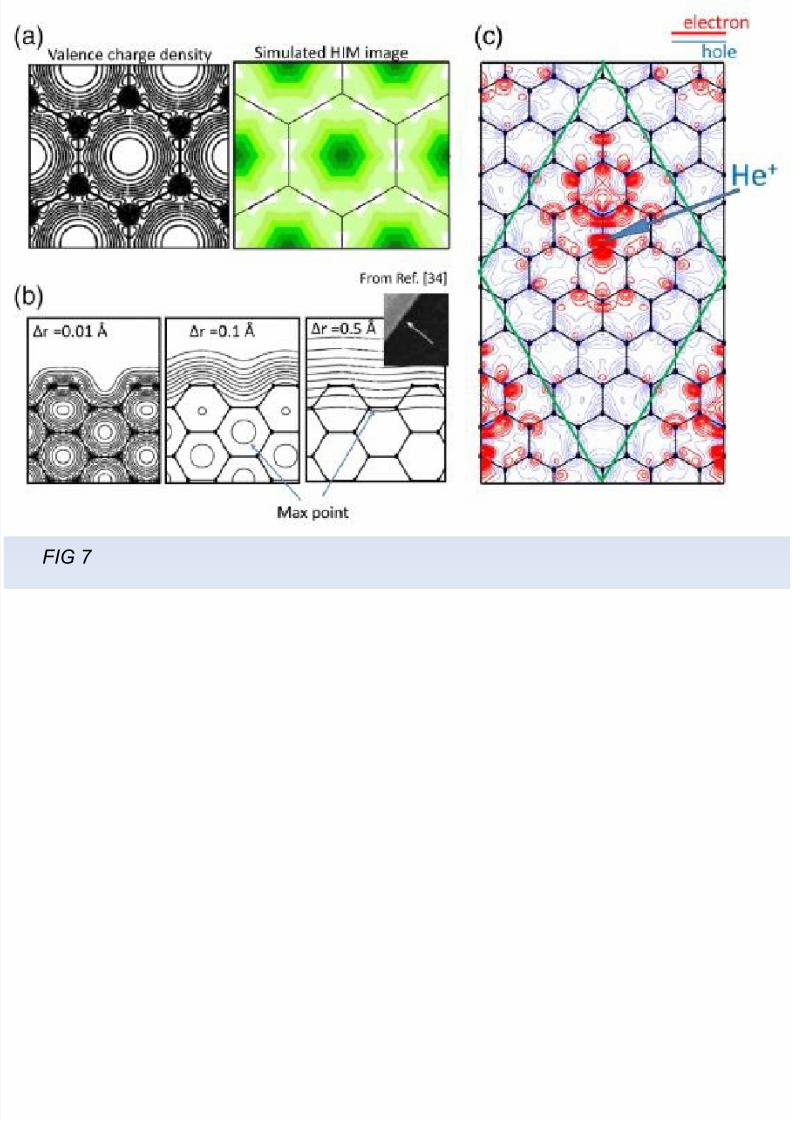
• The high resolution demonstrated by simulation is still challenging with
the current experimental setup, but the similarity of our simulated HIM
image with the valence charge profile of graphene [see Fig. 3(a)] allows us
to do fast estimations of the experimental HIM images. The smeared
image of valance charge density of a graphene edge shown in Fig. 3(b) can
show the observed sharpness of the graphene edge consistent with the
beam size. We hope the challenge of reaching sub-nm resolution will be
achieved soon. According to our simulation, charge redistribution
occurred in the graphene sheet in addition to the impact induced electron
emission in the vacuum region. Figure 3(c) shows the charge redistribution
in the graphene sheet calculated by subtracting the charge density beforethe He+ collision (t=0 in the TDDFT-MD simulation) from the charge
density at t=2.9 fs with impact point E in Fig. 1(a).


