AB SEB bankas Annual report 2020 Translation note Financial statements have been prepared in Lithuanian and English languages. In all matters of interpretation of information, views or opinions, the Lithuanian language version of the financial statements takes precedence over the English language version.
Transcript
AB SEB bankas Annual report
2020
Translation note
Financial statements have been prepared in Lithuanian and English languages. In all matters of interpretation of information, views or opinions, the
Lithuanian language version of the financial statements takes precedence over the English language version.
AB SEB bankas
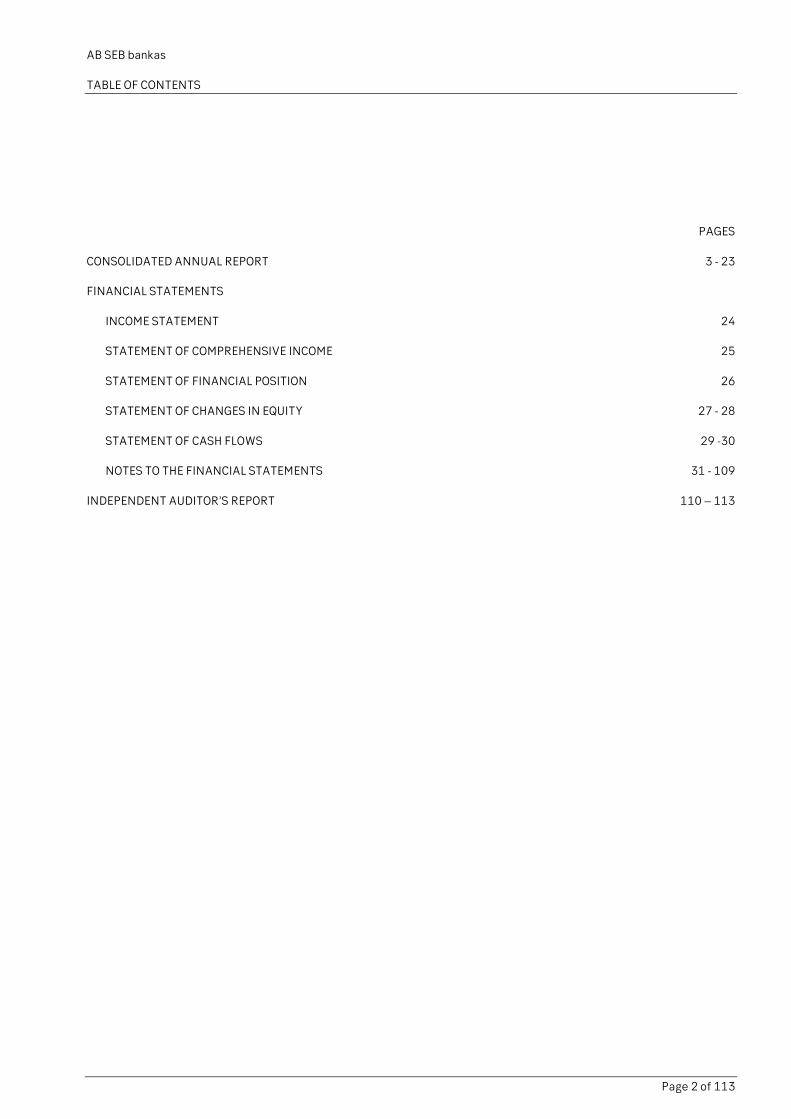
TABLE OF CONTENTS
Page 2 of 113
PAGES
CONSOLIDATED ANNUAL REPORT 3 - 23
FINANCIAL STATEMENTS
INCOME STATEMENT 24
STATEMENT OF COMPREHENSIVE INCOME 25
STATEMENT OF FINANCIAL POSITION 26
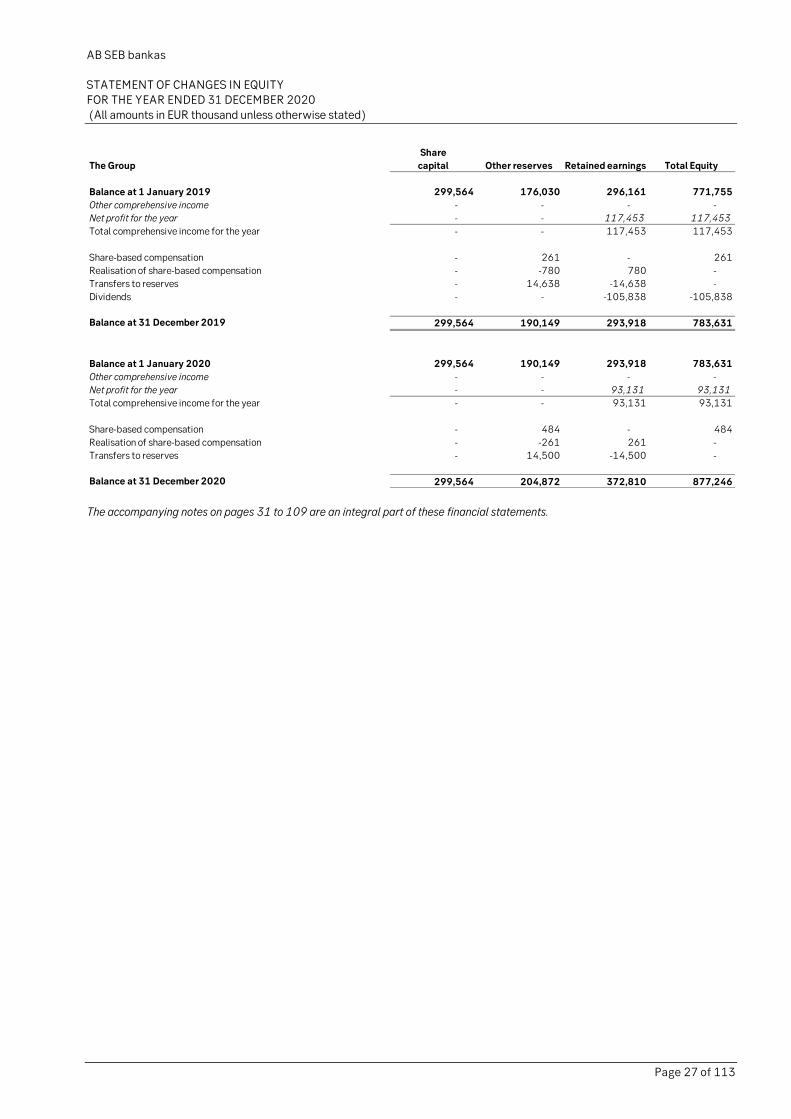
STATEMENT OF CHANGES IN EQUITY 27 - 28
STATEMENT OF CASH FLOWS 29 -30
NOTES TO THE FINANCIAL STATEMENTS 31 - 109
INDEPENDENT AUDITOR’S REPORT 110 – 113
AB SEB bankas
CONSOLIDATED ANNUAL REPORT FOR THE YEAR ENDED 31 DECEMBER 2020
(all amounts in EUR thousand unless otherwise stated)
Page 3 of 113
CONSOLIDATED ANNUAL REPORT OF AB SEB BANKAS GROUP FOR THE YEAR ENDED 31 DECEMBER 2020
1. Reporting period covered by the Consolidated Annual Report
This Consolidated Annual Report (hereinafter the Report) has been prepared for the year ended 31 December 2020. All numbers presented are as of 31 December 2020 or for the year then ended, unless specified otherwise. The Consolidated Annual Report
covers consolidated information on AB SEB Bankas (also referred as the Bank) and its subsidiary UAB “SEB investicijų valdymas”
– together referred as the Group.
2. Information on branches and representative offices
As of 31 December 2020, the Bank had three regional branches: AB SEB bankas Eastern Region Branch (address
Konstitucijos ave. 24, LT-08105 Vilnius), AB SEB bankas Middle Region Branch (address Nemuno str. 3, LT-44295 Kaunas), and
AB SEB bankas Western Region Branch (address H. Manto str. 7, LT-92128 Klaipėda).
As at the end of the year 2020, the Bank had 23 branches across Lithuania, 100 per cent of them were financial advisory branches where cash transactions are performed in self-service zones.
3. Objective overview of the Group’s status, activities and development
In 2020, AB SEB bankas Group in Lithuania offered a full range of banking services to private individuals and corporate customers
as well as financial institutions.
AB SEB bankas Group in Lithuania consists of AB SEB bankas and UAB “SEB investicijų valdymas”. Also, there are other SEB Group
companies operating in Lithuania, namely: life insurance and pension services company “SEB Life and Pension Baltic SE” Lithuanian
branch, SEB Global Services in Vilnius (legal name “Skandinaviska Enskilda Banken AB” Vilnius branch), which provides business
support services (transactions, IT, human resources administration, finance and accounting) to the SEB Group — its subsidiary companies and subdivisions in twenty countries worldwide.
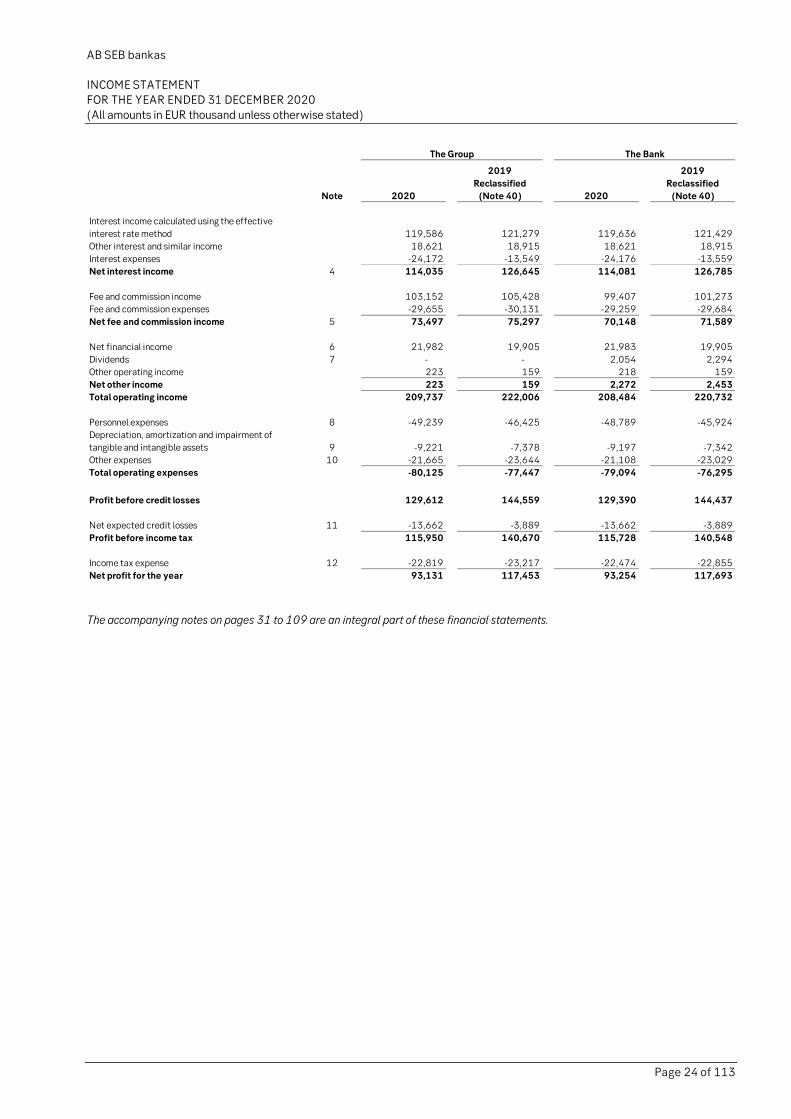
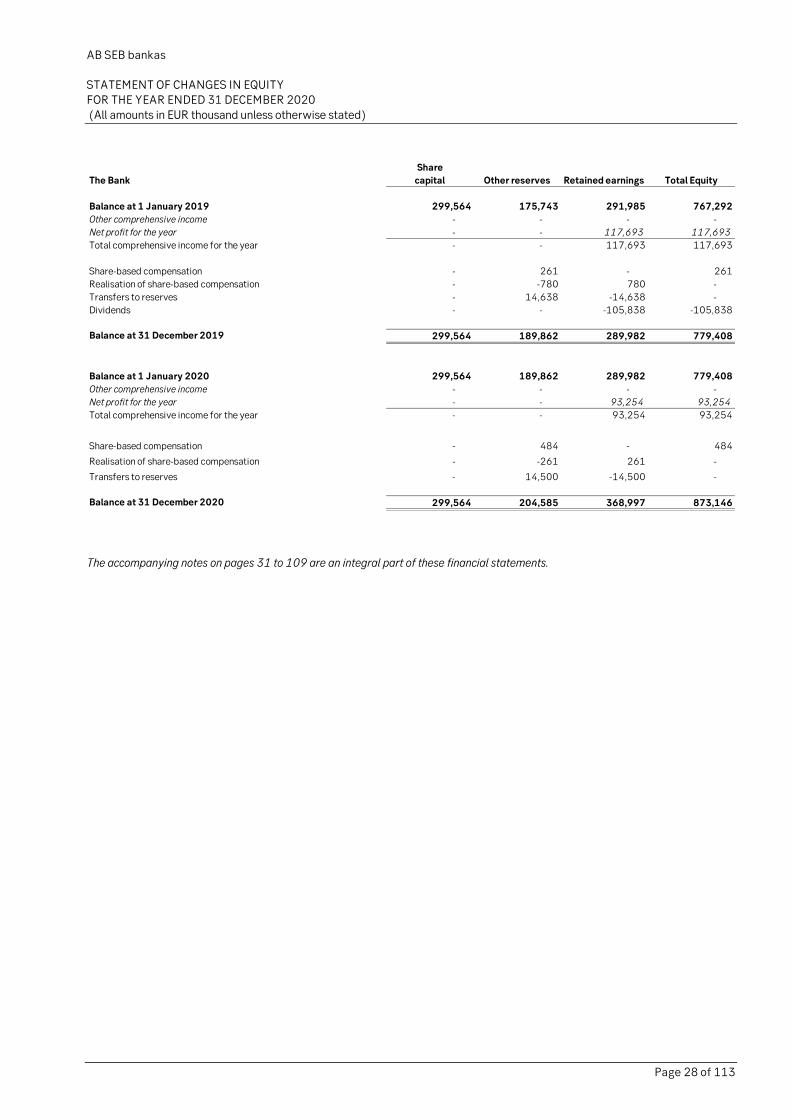
In 2020, net profit earned by the Bank was EUR 93.3m, and that earned by the Group was EUR 93.1m. In 2019, net profit earned
by the Bank was EUR 117.7m, and that earned by the Group was EUR 117.5m.
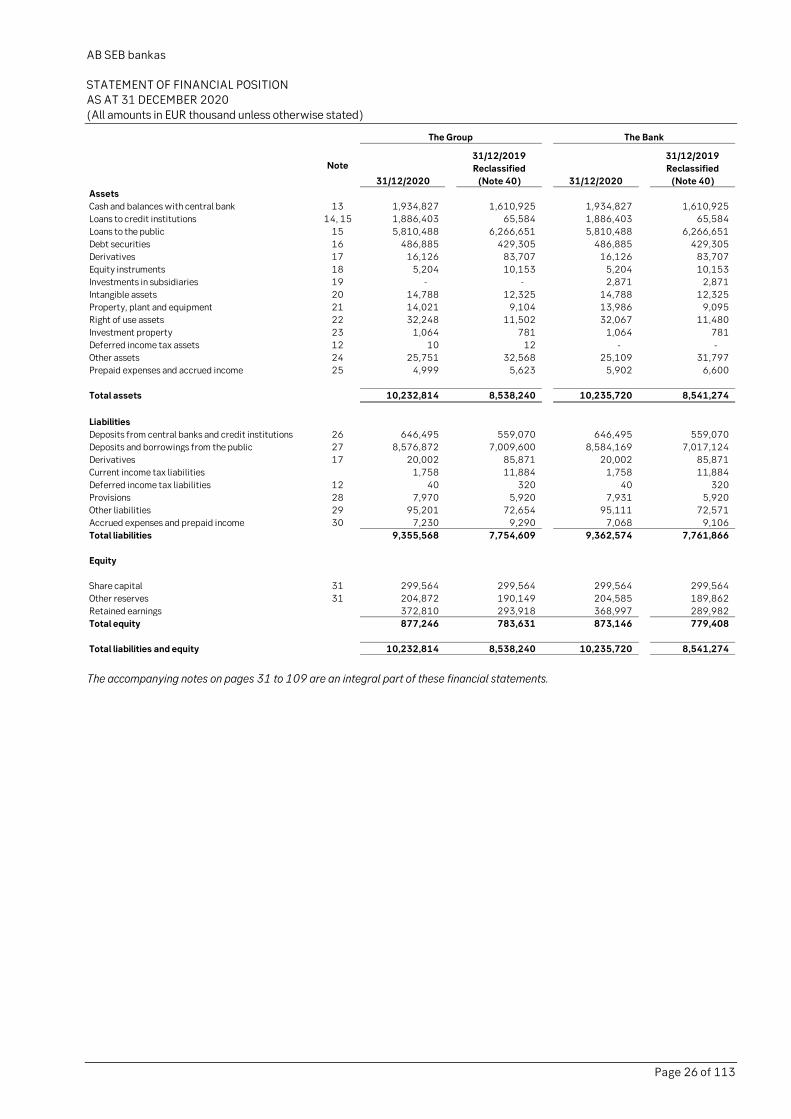
Equity of the Group as of 31 December 2020 amounted to EUR 877m (784).
Assets of the Group as of 31 December 2020 totalled EUR 10.2bn (8.5).
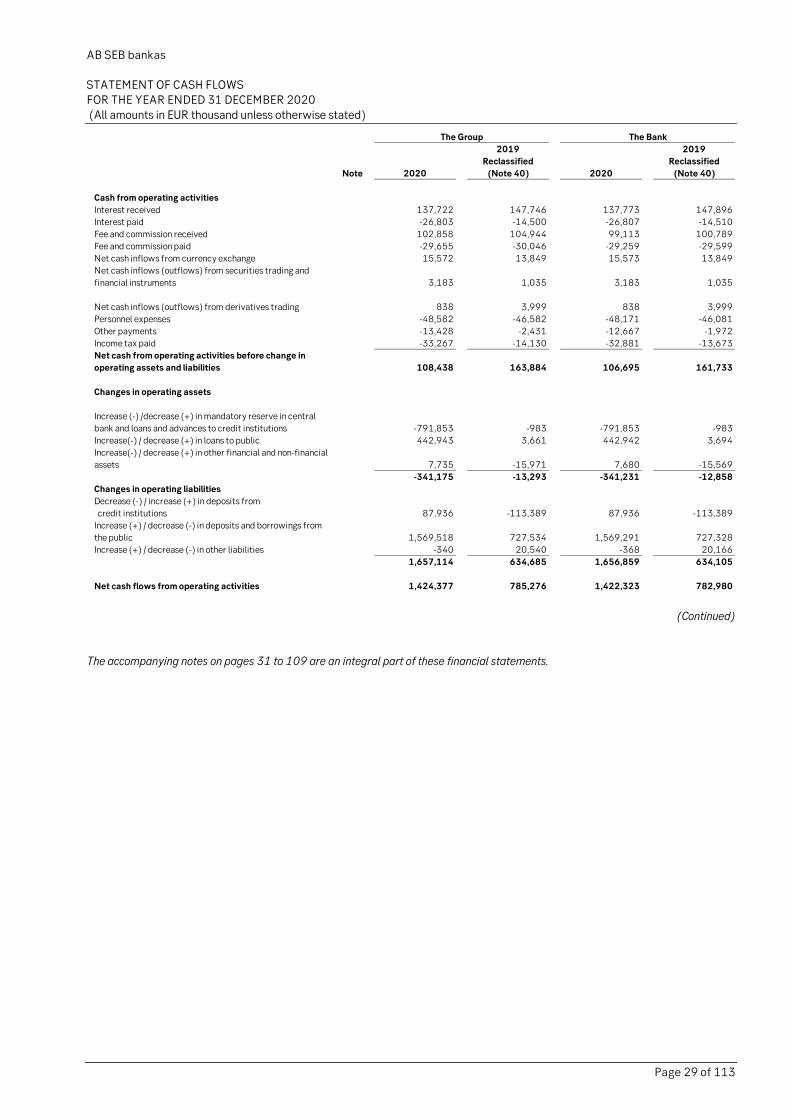
In 2020, Bank’s and Group’s liquidity requirements were met.
Income of the Group in the year 2020 made up EUR 209.7m, and in the year 2019 – EUR 221.9m.
As of 31 December 2020, net worth of the Bank’s loan and leasing portfolio totalled EUR 5.8bn (6.3).
Bank’s deposit portfolio as of 31 December 2020 amounted to EUR 8.6bn (7.0).
Due to global COVID-19 outbreak, the Bank, as many other financial institutions in Lithuania, saw a decline in financial results, in
comparison to 2019. The downturn was mainly caused by decrease in income and deferment of loans. In 2020, Group’s assets
and deposit portfolio grew, however, net of the loan and lease portfolio has decreased.
On the other hand, the decrease in income was less than forecasts in spring of 2020 predicted, when the COVID-19 outbreak
started in the country. Throughout the year, the Bank was focused on optimization of operations and diversification of income
structure.
Despite shrinking economy, the income of population remained relatively stable. The quarantine has reduced household spending, permitting savings and focus on financial security. This is reflected by 20 per cent increase in deposits at the Bank in 2020.
Towards second half of the year, population regained activity in real estate sector. The portfolio of housing loans, issued by the
Bank in 2020, grew by 7 per cent in comparison to 2019.
Businesses remained more cautious, especially those directly struck by the pandemic and following restrictions on operations. Therefore, a decline in demand for new business loans was observed in the Bank, caused by halted investment projects of business
clients.
The year 2020 was marked by the two key events in the Bank: launch of bank’s new IT platform followed by the COVID-19
pandemic. As one of Lithuania’s leading financial institutions, the Bank assumed an active role in COVID-19-related risk management, as well as mitigating financial and economic implications of the outbreak for clients and Lithuanian society.
AB SEB bankas
CONSOLIDATED ANNUAL REPORT FOR THE YEAR ENDED 31 DECEMBER 2020
(all amounts in EUR thousand unless otherwise stated)
Page 4 of 113
On 17 February 2020 new IT platform, operating most of its banking services and business processes, was successfully launched
in the Bank. With total investment of EUR 40m to the process, the new platform allowed significant expansion of digital services
offered to bank’s clients, including more flexible and convenient management of accounts, deposits, and investment portfolios. Launch of the new platform in Lithuania has completed the unification of IT infrastructure in the Baltics, opening ways for faster
development of the new products and services offered to the market.
Launch of the new IT platform was implemented in just right time, as in March 2020 the quarantine was declared in Lithuania due
to global COVID-19 outbreak. Since the very beginning of the pandemic, the Bank took a proactive role both in ensuring smooth daily banking operations, supporting Lithuania’s economy and businesses, while ensuring safety of Bank’s customers and
employees.
From the very beginning of the outbreak in Lithuania in March 2020, the Bank declared that it will assist its retail and corporate
clients in facing challenges related with the pandemic. On 20 April 2020 the Bank signed the moratorium initiated by the Association of Lithuanian Banks. According to the moratorium, private bank’s customers were offered an opportunity to postpone
their mortgage principal payments up to one year, leasing payments and payments of the principal amount of consumer loans - up
to six months without changing the terms of the agreements. In 2020 the Bank has postponed more than 2.3 thousand different
loan agreements for private customers and 2.7 thousand loan agreements for corporate clients.
The Bank has joined the State in its effort to implement aid programs for local businesses. The bank has signed agreements with
INVEGA, a financial entity incorporated by the State, to offer financing companies facing economic challenges, providing
businesses with State-guaranteed loans and leasing. The amount of financing the Bank was able to offer in terms of this agreement,
totalled to EUR 11,3m.
The Bank has ensured the contingency of its operations and smooth delivery of service during the quarantine period by transferring
majority of consultations online. In 2020, the Bank delivered 28 thousand remote consultation to private and corporate clients –
twice as much as in 2019. Instead of coming to the bank's branch, customers solved everyday financial questions remotely – in
2020, the Bank received 44 per cent more customer calls and messages through digital channels. It has also become common for customers to register online for a visit to a bank branch, and companies have been able to sign service contracts remotely.
Number of measures were taken to ensure safety and well-being of the Bank’s employees: from remote work and more flexible
schedules, to reimbursement of medical consultations, COVID-19 tests, and acquisition of additional protective equipment,
establishment of free-of-charge mental welfare hotline.
The Bank continued to fulfil its commitments towards organizations and Non-Government Organizations with which the bank has
agreed on sponsorship or support in 2020. The Bank directly contributed to the country’s effort in overcoming the outbreak by
transferring financial aid of EUR 100 thousand to State COVID-19 Relief Fund. The Bank has also contributed to the education of
Lithuanian schoolchildren during the quarantine by joining a public initiative and donating computers that were distributed to children learning at home during the outbreak.
The outbreak, however, did not hinder Bank’s effort to further expand its digital services and contribute to development of
Lithuania’s business and society.
To increase safety and efficiency of the Bank’s operations, SEB expanded application of robotized solutions in the banking. 11 robots were operating in the Bank, successfully executing over 150 thousand tasks in year 2020. This saved more than 6,5
thousand working hours, allowing Bank’s employees to direct their focus and effort on tasks with more added value.
Starting from November 2019, our customers can communicate with the bank via Bank’s chatbot. The number of chats by the end
of 2020 has been almost 105 thousand in Lithuania, out of which only 2.9 per cent were redirected to Bank employees.
The development of new solutions via the Application Programming Interface (API) in the Banks’ systems in relation to open
banking during 2020 enabled Bank’s clients – private individuals and companies – to view the balance and statements of their
accounts with the Bank at other financial service providers’ Internet banks, mobile apps and other channels, also, to initiate
payment orders from such accounts. Bank’s clients became the first in Lithuania to be able to manage their accounts opened with the Bank through another bank’s e-banking system. From 2020 both retail and corporate clients are able to view and manage their
accounts, held in other banks, via SEB internet bank account.
Introduced in the beginning of 2017, SEB mobile application underwent further improvements and updates. In 2020 the possibility
to make transfers using only phone number of a recipient was introduced to Bank’s clients. Development of mobile application continued further with introduction of digital coin jar function and investment result statements. More than 380 thousand private
individuals and corporate entities currently are active users of SEB mobile application.
The challenges posed by the pandemic have not diminished the Bank's commitment to sustainability, the Bank increased its focus
on sustainable development even further. In 2020 the Bank introduced green loans to Lithuanian companies, aimed at financing projects reducing businesses’ environmental footprint and ensure sustainable development.
AB SEB bankas
CONSOLIDATED ANNUAL REPORT FOR THE YEAR ENDED 31 DECEMBER 2020
(all amounts in EUR thousand unless otherwise stated)
Page 5 of 113
By the end of summer, a new headquarter building of the Bank was opened in Vilnius, capital of Lithuania. The new headquarter is
one of the most sustainable buildings in the Baltics. The evaluation of the building took 3 years, ensuing with highest possible,
Outstanding certificate BREEAM International New Construction – first of the kind in the Baltic states.
Concerned with the increase of online fraud cases during the outbreak, in 2020 the Bank continued its active engagement in
prevention and education of society. Among other Bank’s activities, an online communication campaign with an interactive online
financial security test was launched. More than 120 thousand residents of Lithuania participated in the test.
The Bank also remained actively engaged in development of entrepreneurship in Lithuania. In 2020, 12 companies took part in Bank’s Business Growth Programme for small and medium enterprises that are willing to take an extra step and find new ways of
development. 7 of them addresses sustainability issues. In 2020, the Bank continued to sponsor activities of Lithuanian Junior
Achievement that is teaching 9-12 grade pupils entrepreneurship skills. It is estimated that last year more than 23 thousand pupils
from 400 schools took part in the activities. More than 300 business volunteers, including Bank’s employees, took part in the activities, as well as 7 regional innovation and entrepreneurship camps, 3 exhibition events and the virtual challenge “Challenge
the Challenge” were held.
In 2020, the Bank has won significant global and national awards: SEB was announced the strongest company in Lithuanian
financial market (by business magazine Verslo žinios), SEB was awarded with the title of the Best Bank in Lithuania (by Euromoney) and The Best Foreign Exchange Provider in Lithuania (by Global Finance), SEB also was awarded for distinguished
leadership during COVID-19 outbreak in 2020 (by Global Finance).
In 2020, the Bank stayed as one of the most attractive employers in Lithuania in a survey The Most Desirable Employer in Financial
sector (by business magazine Verslo žinios) and was ranked as The Best Employer Brand in the Baltics (by Baltic Brand Awards).
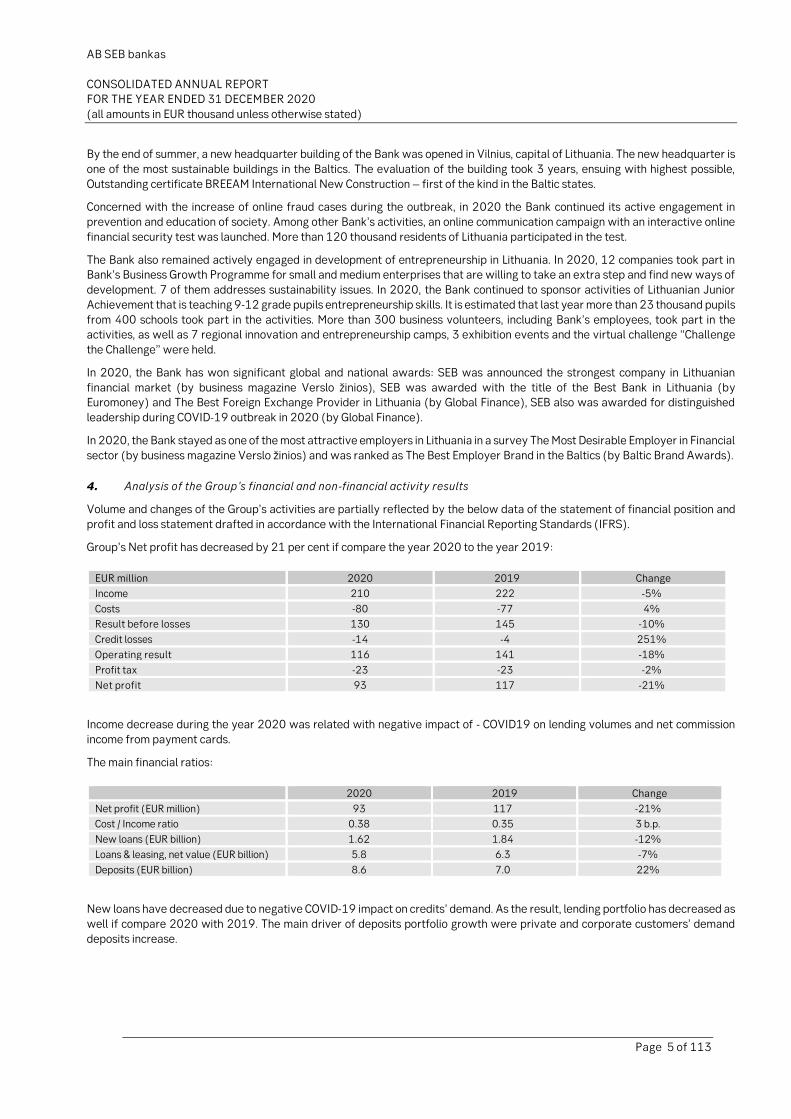
4. Analysis of the Group’s financial and non-financial activity results
Volume and changes of the Group’s activities are partially reflected by the below data of the statement of financial position and
profit and loss statement drafted in accordance with the International Financial Reporting Standards (IFRS).
Group’s Net profit has decreased by 21 per cent if compare the year 2020 to the year 2019:
EUR million 2020 2019 Change
Income 210 222 -5%
Costs -80 -77 4%
Result before losses 130 145 -10%
Credit losses -14 -4 251%
Operating result 116 141 -18%
Profit tax -23 -23 -2%
Net profit 93 117 -21%
Income decrease during the year 2020 was related with negative impact of - COVID19 on lending volumes and net commission
income from payment cards.
The main financial ratios:
2020 2019 Change
Net profit (EUR million) 93 117 -21%
Cost / Income ratio 0.38 0.35 3 b.p.
New loans (EUR billion) 1.62 1.84 -12%
Loans & leasing, net value (EUR billion) 5.8 6.3 -7%
Deposits (EUR billion) 8.6 7.0 22%
New loans have decreased due to negative COVID-19 impact on credits’ demand. As the result, lending portfolio has decreased as
well if compare 2020 with 2019. The main driver of deposits portfolio growth were private and corporate customers’ demand
deposits increase.
AB SEB bankas
CONSOLIDATED ANNUAL REPORT FOR THE YEAR ENDED 31 DECEMBER 2020
(all amounts in EUR thousand unless otherwise stated)
Page 6 of 113
Some ratios representing the Group‘s and the Bank’s result are presented in the table below:
Mo major events occurred since the end of financial year.
6. Group’s activity plans and forecasts
The focus of the SEB Bank Group in Lithuania will remain customer excellence. By offering modern services in a convenient and professional way, trying to satisfy each customer’s needs, the Group will implement its vision: to deliver world-class service to our
customers.
The SEB Bank’s Group seeking to implement the above vision and taking into consideration the SEB Group’s goals will follow the
below main trends:
• Operational excellence
o Regulatory excellence. Focus will be paid to following areas: AML/KYC investments – these include employees number increase, competence and internal procedures improvement as well as online monitoring
maintenance; platform development for Liquidity & Capital management,
o Common Baltic platforms and products. Baltic Core roll-out in Lithuania in year 2020 will serve as the main
driver to simplify and align products governance between three Baltic countries,
o Employee well-being and I&D. This goal includes strengthening employer branding and introducing activity-
based seating by moving to new head office in Vilnius. Moreover, new competence workforce bringing to the
organization will be focus area as well.
• Advisory leadership
o Digital sales. Focus to digitalization & advisory, scaling up number of robotics and automation processes,
o New public Web launch,
o Sustainability leadership. Customer portfolio assessment of large corporate as well as SME credit customers.
• Extended presence
o Open banking & Re-defining development. This means to use possibilities for further Bank’s development
through partnership with third parties.
7. Information about the entity’s research and development (R&D) activities
The Group did not undertake any R&D activities.
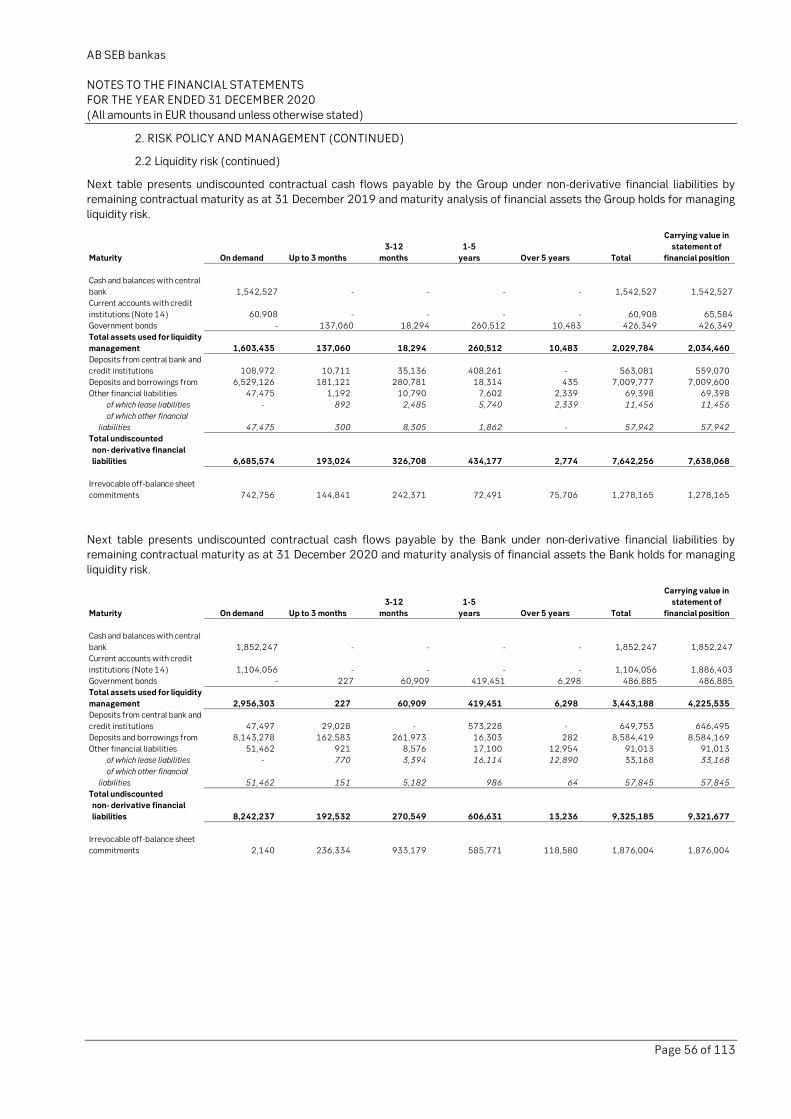
8. Financial risk management objectives, hedge instruments in case of which hedge accounting is applied as well as
the entity’s price risk, liquidity risk and monetary risk scale
The Group manages its financial risk as described in section Financial risk management in Note 2 to the Year 2020 consolidated financial reporting. Said section includes also a description of financial risk management objectives, hedging transactions applied
as well as the Group’s credit risk and market risk level.
9. Data on the acquisition/assignment of own shares.
The Bank has none and during the year 2020 did not acquire its own shares. In addition, the Bank’s subsidiary companies have not acquired the Bank’s shares. During the reporting period, the Bank and its subsidiary companies did not buy or sell their own shares.
AB SEB bankas
CONSOLIDATED ANNUAL REPORT FOR THE YEAR ENDED 31 DECEMBER 2020
(all amounts in EUR thousand unless otherwise stated)
Page 7 of 113
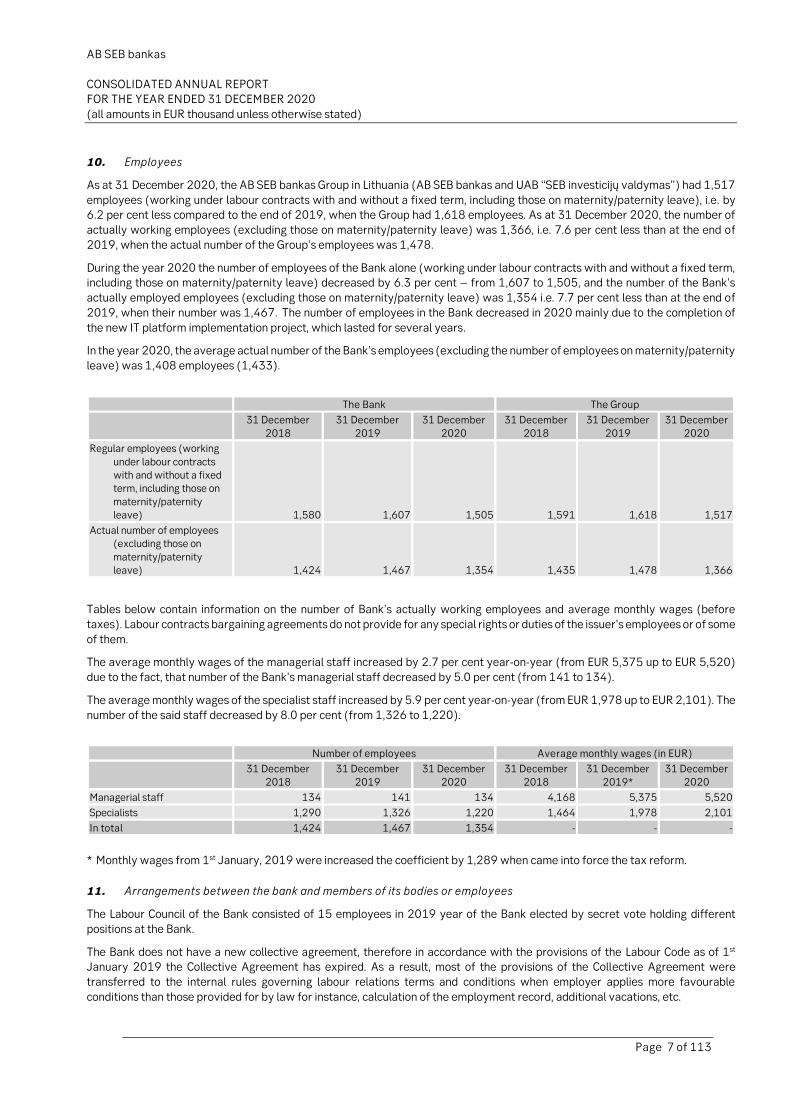
10. Employees
As at 31 December 2020, the AB SEB bankas Group in Lithuania (AB SEB bankas and UAB “SEB investicijų valdymas”) had 1,517
employees (working under labour contracts with and without a fixed term, including those on maternity/paternity leave), i.e. by 6.2 per cent less compared to the end of 2019, when the Group had 1,618 employees. As at 31 December 2020, the number of
actually working employees (excluding those on maternity/paternity leave) was 1,366, i.e. 7.6 per cent less than at the end of
2019, when the actual number of the Group’s employees was 1,478.
During the year 2020 the number of employees of the Bank alone (working under labour contracts with and without a fixed term, including those on maternity/paternity leave) decreased by 6.3 per cent – from 1,607 to 1,505, and the number of the Bank's
actually employed employees (excluding those on maternity/paternity leave) was 1,354 i.e. 7.7 per cent less than at the end of
2019, when their number was 1,467. The number of employees in the Bank decreased in 2020 mainly due to the completion of
the new IT platform implementation project, which lasted for several years.
In the year 2020, the average actual number of the Bank’s employees (excluding the number of employees on maternity/paternity
leave) was 1,408 employees (1,433).
The Bank The Group
31 December
2018
31 December
2019
31 December
2020
31 December
2018
31 December
2019
31 December
2020
Regular employees (working
under labour contracts with and without a fixed term, including those on
Tables below contain information on the number of Bank’s actually working employees and average monthly wages (before
taxes). Labour contracts bargaining agreements do not provide for any special rights or duties of the issuer’s employees or of some
of them.
The average monthly wages of the managerial staff increased by 2.7 per cent year-on-year (from EUR 5,375 up to EUR 5,520)
due to the fact, that number of the Bank’s managerial staff decreased by 5.0 per cent (from 141 to 134).
The average monthly wages of the specialist staff increased by 5.9 per cent year-on-year (from EUR 1,978 up to EUR 2,101). The
number of the said staff decreased by 8.0 per cent (from 1,326 to 1,220).
Number of employees Average monthly wages (in EUR)
31 December
2018 31 December
2019 31 December
2020 31 December
2018 31 December
2019* 31 December
2020
Managerial staff 134 141 134 4,168 5,375 5,520
Specialists 1,290 1,326 1,220 1,464 1,978 2,101
In total 1,424 1,467 1,354 - - -
* Monthly wages from 1st January, 2019 were increased the coefficient by 1,289 when came into force the tax reform.
11. Arrangements between the bank and members of its bodies or employees
The Labour Council of the Bank consisted of 15 employees in 2019 year of the Bank elected by secret vote holding different
positions at the Bank.
The Bank does not have a new collective agreement, therefore in accordance with the provisions of the Labour Code as of 1st January 2019 the Collective Agreement has expired. As a result, most of the provisions of the Collective Agreement were
transferred to the internal rules governing labour relations terms and conditions when employer applies more favourable
conditions than those provided for by law for instance, calculation of the employment record, additional vacations, etc.
AB SEB bankas
CONSOLIDATED ANNUAL REPORT FOR THE YEAR ENDED 31 DECEMBER 2020
(all amounts in EUR thousand unless otherwise stated)
Page 8 of 113
Consultations with the Bank’s administration is one of the main areas’ activities of the Labour Council. The Labour Council
periodically meets with the president of the Bank or his delegated representatives of other units. At such meetings, future changes,
also questions as well as observations from employees to members of the Labour Council are discussed.
In 2020 Bank employees have established trade union which started dialogue with the Bank and agreed to start collective
agreement bargaining during 2021.
There are no separate arrangements regarding severance pays executed with the Issuer’s bodies, members of committees or
employees, should they resign or be dismissed without a motivated reason.
12. Information on the Remuneration policy and its implementation
The information has been drawn up and announced implementing the requirements of Item 14 of Resolution of the Board of the
Bank of Lithuania ‘Regarding minimum requirements for policies of remuneration to credit institution and of financial brokerage companies employees’ No. 03-82, dated 8 May 2015’.
The SEB Group has its approved remuneration policy, which aligned with the remuneration policy of the Bank's shareholder
Skandinaviska Enskilda Banken AB (publ). Equally the remuneration policy implements legal acts of the Board of the Bank of
Lithuania regulating the requirements for the remuneration policy.
The SEB Group’s vision is to deliver world-class service to our customers. Implementation of this vision is important for the Group
to attract, retain, and develop talented employees and to reward them. The goal of the Group’s Remuneration Policy is to establish
the main principles of pay for work, seeking to reward for a sustainable, long-term value-added creation that meets interests of
shareholders and investors. The Policy shall promote sound and effective risk management as well as desired performance, conduct and behaviour. Further, the Policy shall prevent the risk that the remuneration models drive excessive risk-taking or
conflicts of interest detriment to the best interest of SEBs clients. As well as, the Group aims that the remuneration to its employees
is competitive in the markets and segments where the Group operates in order to motivate high performing employees.
Information concerning the decision-making process used for determining the remuneration policy, including information on the remuneration committee (composition and mandate)
The Group is guided by the remuneration policy that was approved by the Bank's supervisory council on 10th February 2020. All
of the Group companies have implemented the remuneration policy requirements. When developing said remuneration policy, no
services of external advisers were resorted to.
The Bank's Human Resources Department together with the Compliance and Risk control units, annually reviews the Group’s
remuneration policy and submits proposals on the policy changes. The remuneration policy is approved by the Bank's supervisory
council, upon approval of the Group’s remuneration committee. The management board of the Bank is responsible for the
implementation of the remuneration policy.
Remuneration and Human Resources Committee (31 December 2020)
The Remuneration and Human Resources Committee (‘Remuneration committee’) provides assistance to the supervisory council
regarding remuneration, leadership, business continuity and other issues related to the staff as well as proposes candidates to the
vacant Bank’s bodies and recommends discussing them in the respective Bank’s bodies. Remuneration committee also performs other functions provided for by the remuneration committee regulations and relevant legal acts.
Candidates to members of the remuneration committee are approved by the supervisory council of the Bank. Persons related to
the Bank or its subsidiary companies by labour relations as well as members of the Bank's management board may not be elected
chairman or members of the remuneration committee.
None of the members of the remuneration committee has shares in the Bank.
MATS EMIL TORSTENDAHL
Skandinaviska Enskilda Banken AB (publ) Executive Vice President, Co-head of Corporate & Private Customers.
JUHA LASSI JONAHHES KOTAJOKI
Member of the Supervisory Council of AB SEB bankas.
NINA HAMMARSTRÖM
Member of the Supervisory Council of AB SEB bankas.
UAB “SEB Investicijų valdymas” has no remuneration committee, therefore, the functions of a Remuneration Committee provided for by legal acts are performed by the Supervisory Council of UAB “SEB Investicijų valdymas”.
AB SEB bankas
CONSOLIDATED ANNUAL REPORT FOR THE YEAR ENDED 31 DECEMBER 2020
(all amounts in EUR thousand unless otherwise stated)
Page 9 of 113
Information on the relation between the remuneration and performance results
SEB Group continuously follows up and secures that the variable remuneration models do not put the employees in conflict of
interest with its customers, promote appropriate code of conduct behaviour and do not incentivise excessive risk taking. SEB’s control functions shall support this follow up. The Remuneration Committee shall in consultation with the Risk and Capital
Committee examine whether incentives provided by the remuneration systems appropriately take into consideration risk, capital,
liquidity and the likelihood and timing of earnings.
Business performance results shall be established by combining the individual performance and balanced risk taking. Remuneration shall be established for encouraging both immediate results, as well as long term results, and for encouraging long-
term strategic decisions to ensure a sustained business performance. Total remuneration paid for a specified period shall be
established taking into consideration several year results and shall not jeopardize the ability for SEB to achieve a positive result of
the Bank on the aggregated level during a business cycle.
Individual evaluation is used as a foundation for setting group employee’s remuneration. Individual performance shall be evaluated
based on the financial and non-financial indicators within the SEB’s target areas derived from the applicable business plan and the
ambition to deliver world-class service to our customers. Individual behaviour shall be evaluated based on the SEB’s core values
as a starting point.
The most important design characteristics of the remuneration system, including information on the criteria used for
performance measurement and adjustment, deferral policy and vesting criteria
The Group employees’ remuneration consists of the following three elements:
• base salary (or hourly rate);
• variable remuneration, which may be allocated according to the following programmes:
o All Employee Programme – SEB’s profit allocation programme for all employees of the Group;
o individual programme, which is participated by a targeted group of employees and includes variable salary, which may consist of two parts: salary in cash and salary in shares or in any other financial instruments paid
out after a certain set period of time;
• additional benefits.
Base salary (or hourly rate) – it is the wages (base pay) established in an employee’s labour contract.
Variable remuneration – it is a variable portion of remuneration, which may be paid to employees as an extra to the remuneration
by position – in bonuses, rights to the Bank's shares, equity-linked financial instruments, other financial or non-cash instruments, and the amount of which depends on an individual employee’s input to the performance of his/her subdivision or of the Group.
The special requirements for payment of variable remuneration is applied to the Group’s Identified Staff are set in the
Remuneration Policy.
SEB’s All Employee Programme (‘AEP’) is a collective profit allocation programme meant for all SEB employees. The AEP outcome depends on factors indicated in the business plan of Skandinaviska Enskilda Banken AB (publ). 50 per cent of outcome is
disbursed in cash, another 50 per cent share is held for a tree-year period and will be disbursed in cash calculating based on the
total return of A class shares (TSR) of Skandinaviska Enskilda Banken AB (publ), i.e. based on a change in the price of a share as
well as on the allocation of reinvested dividends for SEB shares.
Additional benefit – it includes additional health insurance, pension saving contribution, additional annual vacation, additional
paid vacation to students and other possible benefits.
The remuneration policy establishes that principles for the determination and payment of variable remuneration to risk-takers
must be in line with the Group’s long-term continued activities interests, business strategy, objectives, values, and would encourage reliable and effective risk management, and employees would not be encouraged to take risk that is excessive and
unacceptable to the Group.
Variable remuneration to the Group’s employees whose professional activities and/or decisions taken may have a significant
impact on the risks assumed by the Group is established according to the impact of their decisions on risk. An employee is considered to be able to take decisions that have a significant impact on the risk assumed by the Group (i.e. a’ Identified staff’), if
the employee meets at least one of the following criteria:
• employees with leading strategic positions in the Group;
• heads of key business subdivisions with the authority to take decisions that may have a material impact on the group’s
activity results;
AB SEB bankas
CONSOLIDATED ANNUAL REPORT FOR THE YEAR ENDED 31 DECEMBER 2020
(all amounts in EUR thousand unless otherwise stated)
Page 10 of 113
• employees with risk control functions;
• risk-takers, i.e. employees with the right to conclude transactions or assume obligations and/or take decisions and able to have a significant impact on the risk assumed by the bank;
• chairmen of the Group’s New Product/Service Approval Committees and members of the Committees;
• employees whose remuneration is equal or exceeds the remuneration of the Group’s employees in leading strategic
positions.
Variable remuneration for Identified staff is calculated based on the appraisal of a relevant employee’s performance over no less
than three to five years, and the actual variable remuneration is paid in portions – over a period that matches the Group’s operation
cycle and operational risk. No less than 50 per cent of the remuneration to such employees must consist of shares or any other
financial instruments.
The deferred variable remuneration portion is allocated proportionately over the entire deferral period, and its payment is started
no earlier than after one year since the end of a relevant employee’s performance appraisal and shall be affected no more than
once a year.
In case of financial instruments that constitute a portion of the variable remuneration, a no less than 12 months’ deferral period is applied. Such period is reckoned since the time of granting the rights to the financial instruments. This provision applies both to the
deferred variable remuneration portion and to the variable remuneration portion that is not subject to deferral.
The ratios between fixed and variable remuneration
Variable pay shall not exceed 50 per cent of annual base salary. Remuneration Human Resources Committee may decide on a different variable compensation and official proportions, but variable pay shall not exceed 100 per cent of annual base salary.
Guaranteed variable pay is not paid in the Group.
Information on the performance criteria on which the entitlement to shares, options or variable components of remuneration
is based
Group has right to suspend payment of variable pay, a portion or total variable pay if performance of a specific person, business
unit or a Group generates loss, including not limited to remuneration in cash and in other financial instruments.
Variable pay, as well as the deferred portion, shall be disbursed and approved if the Group’s financial standing is sustainable and
shall be related to the performance results of the Group companies, business unit or employee. Variable pay in accordance with acts of law of the Republic of Lithuania shall be decreased and shall not be paid if the Group activity results do not meet the ratios
established in the Group’s business strategy, generates loss, the employee acted in bad faith or his activities resulted in losses for
the Group.
All pay outs are subject to risk adjustment which might reduce the final pay-out of the deferred amount. SEB’s implementation of the current regulations on risk adjustment of variable compensation stipulates that the deferred amount may be disbursed
considering the following terms:
• sustainability of the Bank's and/or the Group’s financial standing;
• implemented annual objectives of an employee, also, adherence to the requirements of the internal legal acts.
Prior to the disbursement of each deferred portion of the variable remuneration and in each case related to its disbursement the
above-indicated terms are assessed.
The employee shall not be allowed to use any individual security strategies or insurance against decrease in variable pay seeking to prevent risk effect established in the variable pay calculation models.
General quantitative information on remuneration 2020
Comments and definitions on tables below:
• All amounts are presented excluding employer’s social costs;
• Number of employees are defined at date December 31, 2020.
AB SEB bankas
CONSOLIDATED ANNUAL REPORT FOR THE YEAR ENDED 31 DECEMBER 2020
(all amounts in EUR thousand unless otherwise stated)
Page 11 of 113
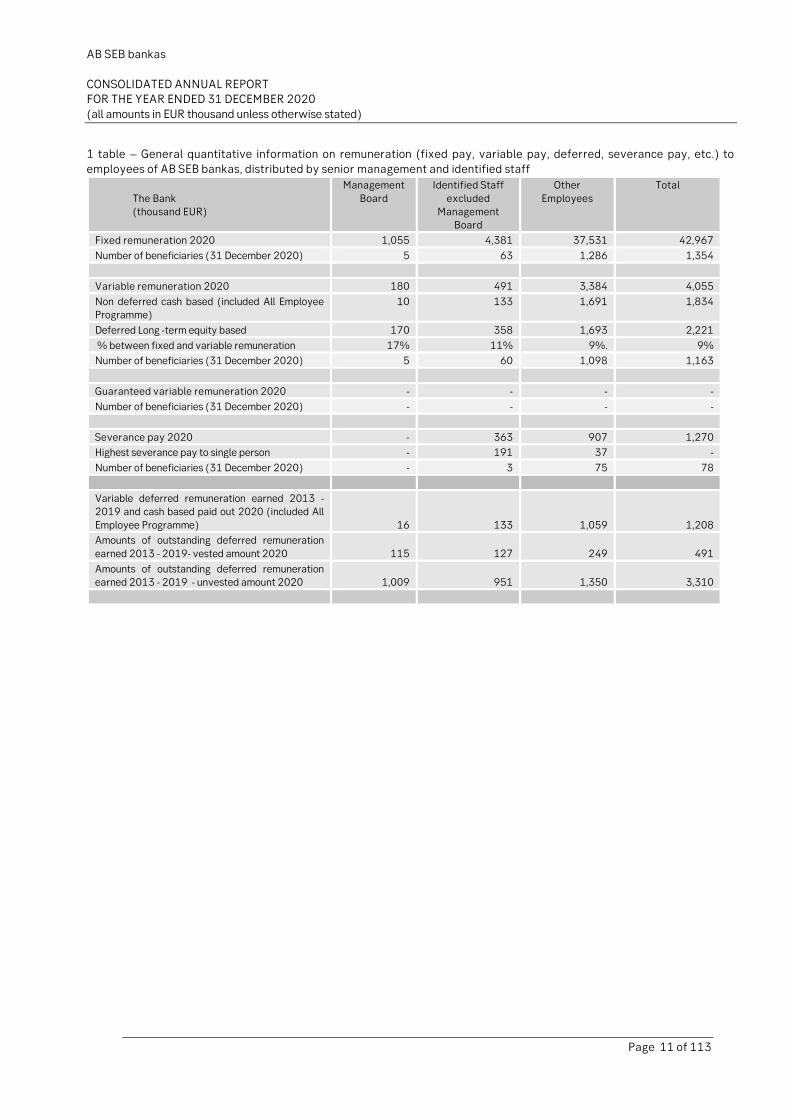
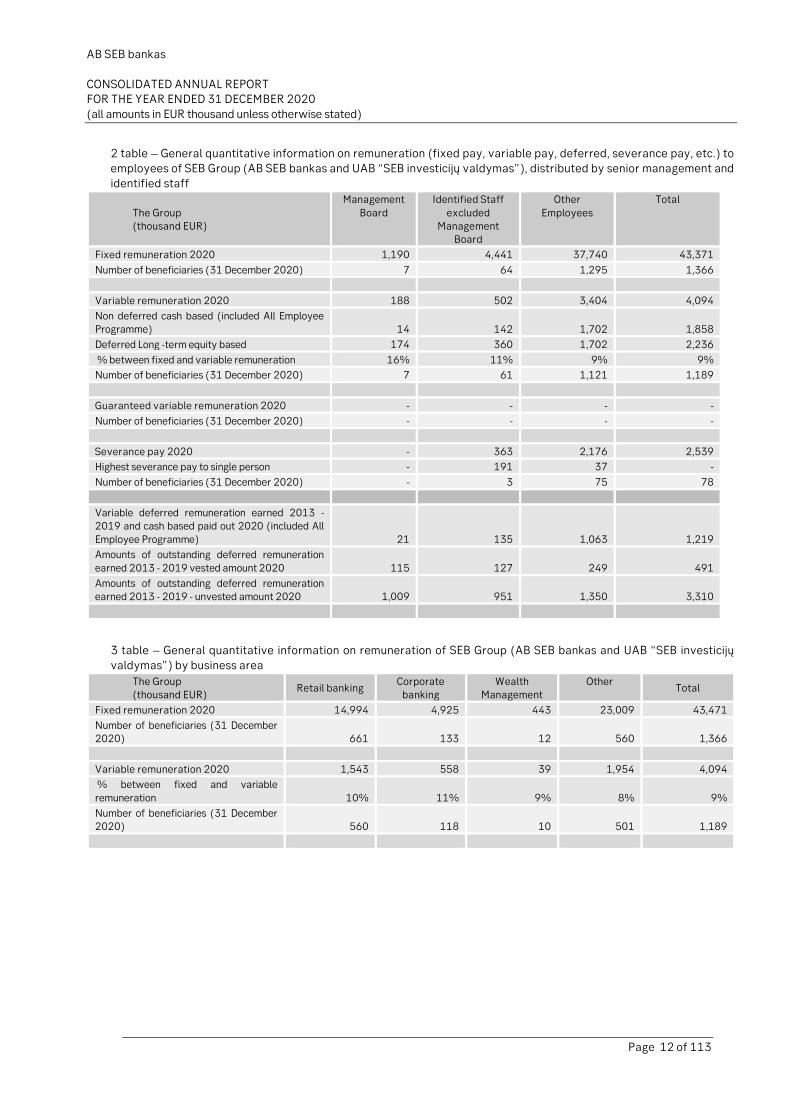
1 table – General quantitative information on remuneration (fixed pay, variable pay, deferred, severance pay, etc.) to
employees of AB SEB bankas, distributed by senior management and identified staff
The Bank (thousand EUR)
Management
Board
Identified Staff
excluded Management
Board
Other
Employees
Total
Fixed remuneration 2020 1,055 4,381 37,531 42,967
Number of beneficiaries (31 December 2020) 5 63 1,286 1,354
Variable remuneration 2020 180 491 3,384 4,055
Non deferred cash based (included All Employee Programme)
10 133 1,691 1,834
Deferred Long -term equity based 170 358 1,693 2,221
% between fixed and variable remuneration 17% 11% 9%. 9%
Number of beneficiaries (31 December 2020) 5 60 1,098 1,163
Guaranteed variable remuneration 2020 - - - -
Number of beneficiaries (31 December 2020) - - - -
Severance pay 2020 - 363 907 1,270
Highest severance pay to single person - 191 37 -
Number of beneficiaries (31 December 2020) - 3 75 78
Variable deferred remuneration earned 2013 - 2019 and cash based paid out 2020 (included All
Number of beneficiaries (31 December 2020) 560 118 10 501 1,189
AB SEB bankas
CONSOLIDATED ANNUAL REPORT FOR THE YEAR ENDED 31 DECEMBER 2020
(all amounts in EUR thousand unless otherwise stated)
Page 13 of 113
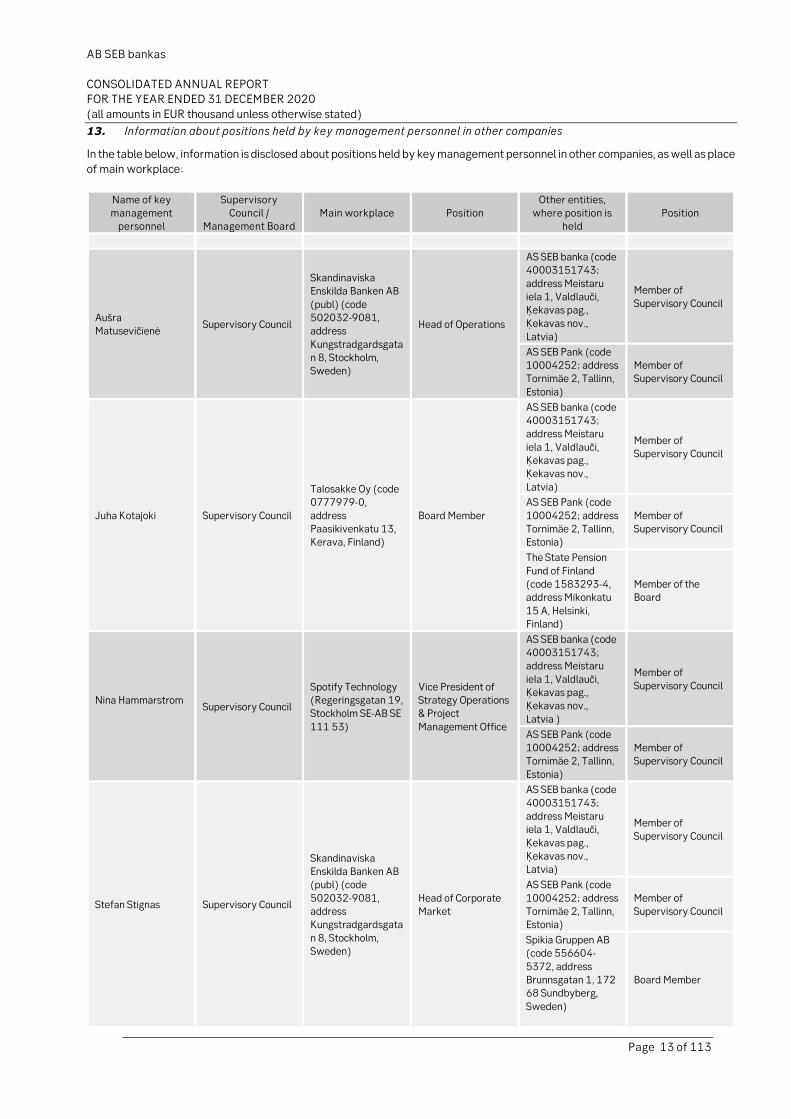
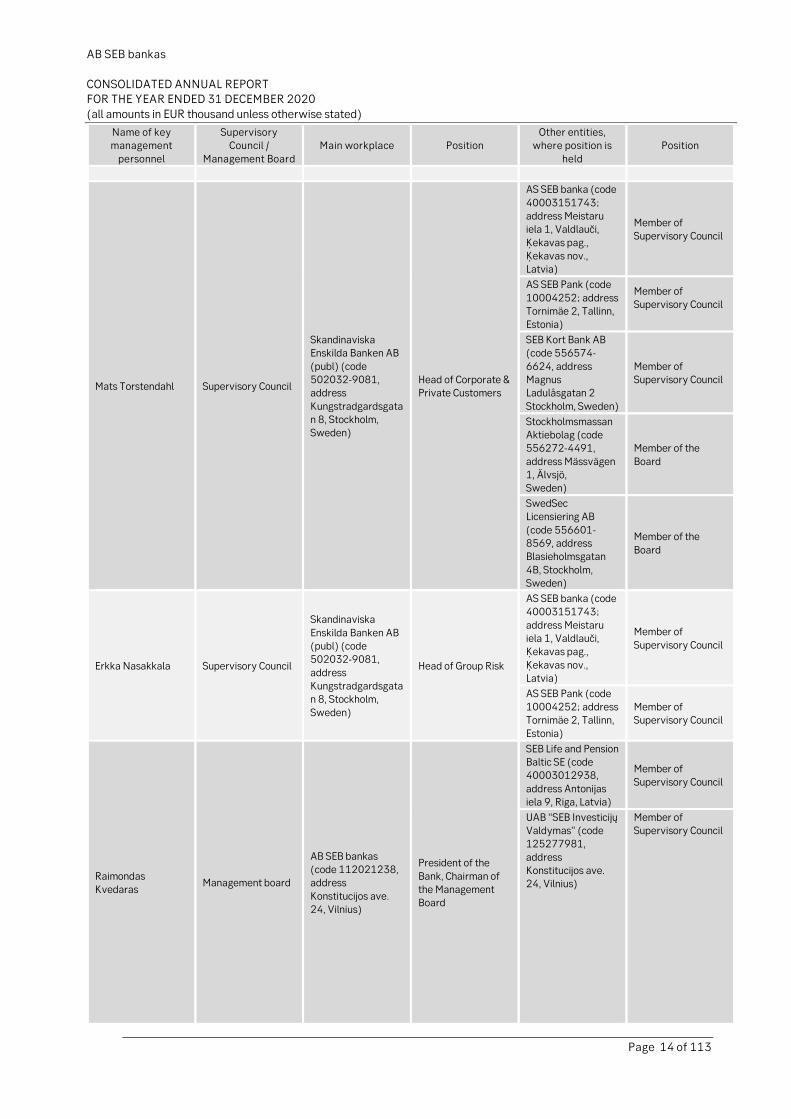
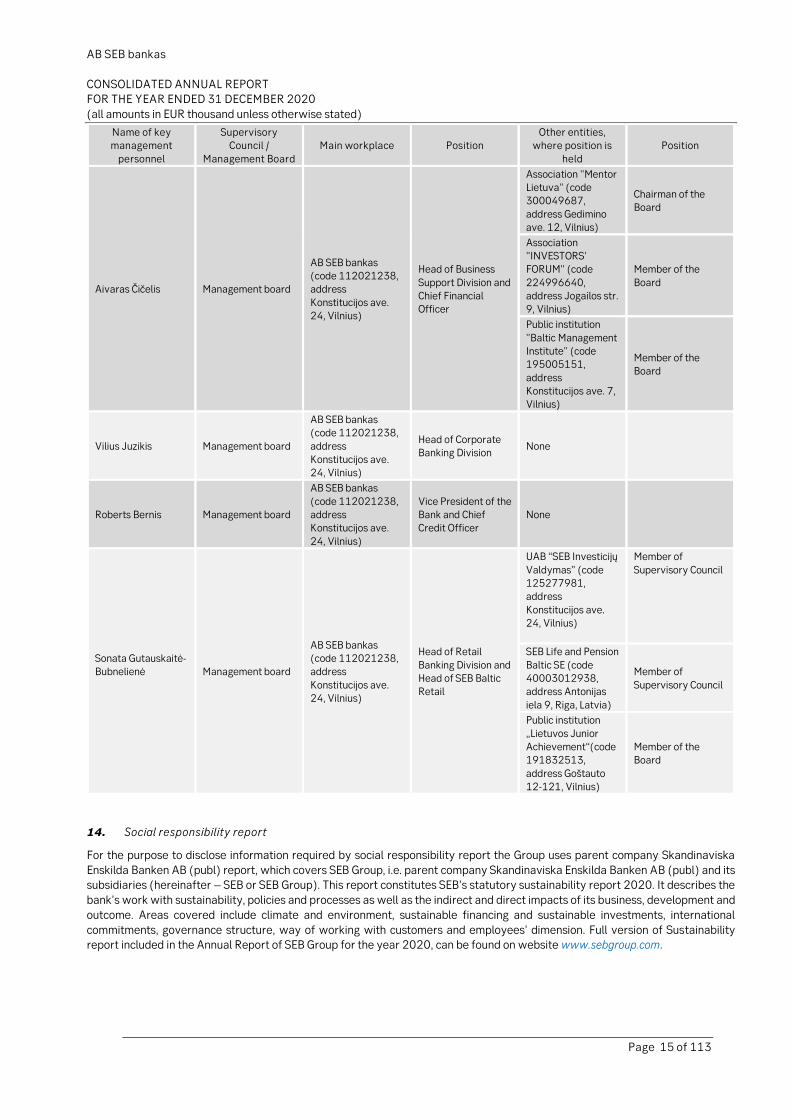
13. Information about positions held by key management personnel in other companies
In the table below, information is disclosed about positions held by key management personnel in other companies, as well as place
of main workplace:
Name of key management
personnel
Supervisory Council /
Management Board Main workplace Position
Other entities, where position is
held Position
Aušra Matusevičienė
Supervisory Council
Skandinaviska Enskilda Banken AB
(publ) (code 502032-9081, address
Kungstradgardsgatan 8, Stockholm, Sweden)
Head of Operations
AS SEB banka (code 40003151743;
address Meistaru iela 1, Valdlauči, Ķekavas pag.,
Ķekavas nov., Latvia)
Member of
Supervisory Council
AS SEB Pank (code 10004252; address Tornimäe 2, Tallinn,
Estonia)
Member of Supervisory Council
Juha Kotajoki Supervisory Council
Talosakke Oy (code 0777979-0,
address Paasikivenkatu 13, Kerava, Finland)
Board Member
AS SEB banka (code 40003151743; address Meistaru
iela 1, Valdlauči, Ķekavas pag., Ķekavas nov.,
Latvia)
Member of Supervisory Council
AS SEB Pank (code
10004252; address Tornimäe 2, Tallinn, Estonia)
Member of Supervisory Council
The State Pension
Fund of Finland (code 1583293-4, address Mikonkatu
15 A, Helsinki, Finland)
Member of the Board
Nina Hammarstrom
Supervisory Council
Spotify Technology (Regeringsgatan 19, Stockholm SE-AB SE
111 53)
Vice President of Strategy Operations & Project
Management Office
AS SEB banka (code 40003151743; address Meistaru
iela 1, Valdlauči, Ķekavas pag., Ķekavas nov.,
Latvia )
Member of Supervisory Council
AS SEB Pank (code 10004252; address Tornimäe 2, Tallinn,
Estonia)
Member of Supervisory Council
Stefan Stignas Supervisory Council
Skandinaviska Enskilda Banken AB (publ) (code
502032-9081, address Kungstradgardsgata
n 8, Stockholm, Sweden)
Head of Corporate Market
AS SEB banka (code
40003151743; address Meistaru iela 1, Valdlauči,
Ķekavas pag., Ķekavas nov., Latvia)
Member of Supervisory Council
AS SEB Pank (code
10004252; address Tornimäe 2, Tallinn, Estonia)
Member of Supervisory Council
Spikia Gruppen AB (code 556604-
5372, address Brunnsgatan 1, 172 68 Sundbyberg,
Sweden)
Board Member
AB SEB bankas
CONSOLIDATED ANNUAL REPORT FOR THE YEAR ENDED 31 DECEMBER 2020
(all amounts in EUR thousand unless otherwise stated)
Page 14 of 113
Name of key management
personnel
Supervisory Council /
Management Board
Main workplace Position Other entities,
where position is
held
Position
Mats Torstendahl Supervisory Council
Skandinaviska Enskilda Banken AB
(publ) (code 502032-9081, address
Kungstradgardsgatan 8, Stockholm, Sweden)
Head of Corporate & Private Customers
AS SEB banka (code
40003151743; address Meistaru iela 1, Valdlauči,
Ķekavas pag., Ķekavas nov., Latvia)
Member of Supervisory Council
AS SEB Pank (code
10004252; address Tornimäe 2, Tallinn, Estonia)
Member of Supervisory Council
SEB Kort Bank AB (code 556574-
6624, address Magnus Ladulåsgatan 2
Stockholm, Sweden)
Member of Supervisory Council
Stockholmsmassan Aktiebolag (code 556272-4491,
address Mässvägen 1, Älvsjö, Sweden)
Member of the
Board
SwedSec Licensiering AB
(code 556601-8569, address Blasieholmsgatan
4B, Stockholm, Sweden)
Member of the
Board
Erkka Nasakkala Supervisory Council
Skandinaviska
Enskilda Banken AB (publ) (code 502032-9081,
address Kungstradgardsgatan 8, Stockholm,
Sweden)
Head of Group Risk
AS SEB banka (code 40003151743;
address Meistaru iela 1, Valdlauči, Ķekavas pag.,
Ķekavas nov., Latvia)
Member of
Supervisory Council
AS SEB Pank (code 10004252; address Tornimäe 2, Tallinn,
Estonia)
Member of Supervisory Council
Raimondas Kvedaras
Management board
AB SEB bankas (code 112021238, address
Konstitucijos ave. 24, Vilnius)
President of the
Bank, Chairman of the Management Board
SEB Life and Pension Baltic SE (code 40003012938,
address Antonijas iela 9, Riga, Latvia)
Member of Supervisory Council
UAB “SEB Investicijų Valdymas” (code 125277981,
address Konstitucijos ave. 24, Vilnius)
Member of Supervisory Council
AB SEB bankas
CONSOLIDATED ANNUAL REPORT FOR THE YEAR ENDED 31 DECEMBER 2020
(all amounts in EUR thousand unless otherwise stated)
Page 15 of 113
Name of key management
personnel
Supervisory Council /
Management Board
Main workplace Position Other entities,
where position is
held
Position
Aivaras Čičelis Management board
AB SEB bankas (code 112021238, address
Konstitucijos ave. 24, Vilnius)
Head of Business
Support Division and Chief Financial Officer
Association "Mentor Lietuva" (code 300049687,
address Gedimino ave. 12, Vilnius)
Chairman of the Board
Association "INVESTORS' FORUM" (code
224996640, address Jogailos str. 9, Vilnius)
Member of the
Board
Public institution
"Baltic Management Institute" (code 195005151,
address Konstitucijos ave. 7, Vilnius)
Member of the Board
Vilius Juzikis Management board
AB SEB bankas (code 112021238,
address Konstitucijos ave. 24, Vilnius)
Head of Corporate Banking Division
None
Roberts Bernis Management board
AB SEB bankas
(code 112021238, address Konstitucijos ave.
24, Vilnius)
Vice President of the Bank and Chief Credit Officer
None
Sonata Gutauskaitė-Bubnelienė
Management board
AB SEB bankas (code 112021238, address
Konstitucijos ave. 24, Vilnius)
Head of Retail
Banking Division and Head of SEB Baltic Retail
UAB “SEB Investicijų
Valdymas” (code 125277981, address
Konstitucijos ave. 24, Vilnius)
Member of
Supervisory Council
SEB Life and Pension
Baltic SE (code 40003012938, address Antonijas
iela 9, Riga, Latvia)
Member of
Supervisory Council
Public institution
„Lietuvos Junior Achievement“(code 191832513,
address Goštauto 12-121, Vilnius)
Member of the Board
14. Social responsibility report
For the purpose to disclose information required by social responsibility report the Group uses parent company Skandinaviska
Enskilda Banken AB (publ) report, which covers SEB Group, i.e. parent company Skandinaviska Enskilda Banken AB (publ) and its subsidiaries (hereinafter – SEB or SEB Group). This report constitutes SEB’s statutory sustainability report 2020. It describes the
bank’s work with sustainability, policies and processes as well as the indirect and direct impacts of its business, development and
outcome. Areas covered include climate and environment, sustainable financing and sustainable investments, international
commitments, governance structure, way of working with customers and employees’ dimension. Full version of Sustainability report included in the Annual Report of SEB Group for the year 2020, can be found on website www.sebgroup.com.
CONSOLIDATED ANNUAL REPORT FOR THE YEAR ENDED 31 DECEMBER 2020
(all amounts in EUR thousand unless otherwise stated)
Page 16 of 113
Sustainability Report
SEB has a strong ambition to contribute to a prosperous and sustainable future for people, businesses and society.
We are committed to supporting our customers in the transition to a low-carbon economy by offering advisory leadership,
innovative and sustainable financing and investment solutions. Our aim is to create value for all our stakeholders.
We are convinced that companies that incorporate sustainability into their operations and business decisions have the
prerequisites to be more successful in the long term. To us, the integration of economic, social and environmental aspects into our business is fundamental. SEB's sustainability strategy sets out the areas where we have the opportunity to impact in the short,
medium and long term. By adapting the strategy for our financing and investment activities in accordance with the UN Sustainable
Development Goals (SDGs) and with the Paris Agreement, we aim to create sustainable value for our stakeholders. This includes
the areas of climate and environment, human rights, social relations and anti-corruption.
Striving to reorient capital flows
Through our business in sustainable financing and investments, advisory, innovation and people, we serve private, corporate and
institutional customers in our market and international network and strive to reorient capital flows to support sustainable
purposes, in line with the bank’s vision and business strategy. We focus on growing our offering while continuing the integration of sustainability risks into processes and ways of working. Concurrently, we strive to avoid causing, contributing or being directly
linked to negative impacts on people and environment from our activities, products and services.
Several areas serve as the foundation for our long-term achievements. Financial strength and resilience, risk management,
business ethics and conduct, and crime prevention are all considered to be important in the long term for our stakeholders and are thus material for our business.
Impact in two dimensions
SEB has direct and indirect impacts on stakeholders, and regards impacts in two dimensions: on the one hand SEB’s and our
stakeholders’ impacts on the planet and society, and on the other hand the impacts that the planet and society have on SEB’s stakeholders and on its customers’ business models and thereby repayment capacity.
In 2020, we focused our impact assessment work on climate issues. Our main indirect impact concerns primarily the products and
services that we provide. In financing, our main credit exposure relates to lending to companies in a diverse range of sectors where
climate impact is a common denominator.
Mitigating climate change is a key priority for us. In investments, the indirect impacts also largely pertain to climate change. The
main indirect impact of SEB’s fund company is global, with a focus on Europe and the Nordic countries.
For 2021 the ambition is to extend our sustainability impact analysis work to other areas related to for example social and
governance issues. For a full description of SEB's management of climate impact aspects, see subgroup.com, in SEB Group Annual report.
International commitments and collaboration
We believe that global challenges need global collaboration and we recognize the importance of participating in and supporting
international commitments. The Paris Agreement and the Sustainable Development Goals (SDGs) are predominant guiding principles for SEB. In addition, we support and have signed a broad range of international agreements and commitments that guide
us in our work.
International agreements and commitments
SEB supports the following international agreements:
The UN Sustainable Development Goals, the Paris Agreement, the UN Universal Declaration of Human Rights, the UN Guiding
Principles on Business and Human Rights, the ILO Core Conventions on Labour Standards, the Children’s Rights and Business
Principles and the OECD Guidelines for Multinational Enterprises.
Additionally, SEB has joined or publicly endorsed:
The UN Global Compact, the UNEP FI Principles for Responsible Banking, the Principles for Responsible Investments (PRI), the
Equator Principles, the Task Force on Climate-related Financial Disclosures (TCFD) and the Poseidon Principles.
AB SEB bankas
CONSOLIDATED ANNUAL REPORT FOR THE YEAR ENDED 31 DECEMBER 2020
(all amounts in EUR thousand unless otherwise stated)
Page 17 of 113
Transforming our business
SEB is strongly committed to accelerating the pace of change to reach a low-carbon economy. We have continuous focus on
transforming our own business, on innovation and on assisting our customers in their transition to a better society. In 2020, SEB Group established a new central sustainability organization, and strengthened processes and policies. We intensified the work on
classifying the credit portfolio whereby we analyse our corporate customers’ current climate impacts as well as their future
transition plans.
We continued to contribute to the growth of sustainable financing solutions and at year-end SEB Group were the seventh largest underwriter of green bonds in the world since inception in 2008.
At the end of 2020, SEB Investment Management established an updated Sustainability Policy through which the investment rules
will be sharpened for all SEB’s funds.
For SEB employees, special focus was put on increasing knowledge about climate change. A research-based training, mandatory for all employees, was launched globally.
SEB sets and publishes targets and outcome for areas where we have the most significant impacts. Our ambition is to further
increase transparency and disclosures of progress. These efforts will be aligned with future national and international
requirements and expectations.
SEB and the UN Sustainable Development Goals
The UN Sustainable Development Goals (SDGs), formulated in 2015, form the framework for nations, businesses and societies on
how to achieve long-term economic growth, social inclusion and environmental protection. The 17 SDGs define the main objectives
which are broken down into 169 targets with the aim to identify concrete actions. The financial sector has a decisive role to play in closing the existing investment gap to reach the main objectives.
SEB’s main contribution to the SDGs is by supporting its customers in their transition. By signing the Principles for Responsible
Banking, we have also committed to aligning our business strategy and contributing to the SDGs.
We have identified and prioritized five of the goals that are clearly linked to our business strategy and sustainability work, and where we have a great opportunity to make an impact. They are related to the bank’s strong heritage of creating long-term growth
and innovation as well as maintaining responsibility and international outlook.
1. Climate action is addressed throughout our business, from our long history and pioneering role in green financing, to the
more recent work on classifying our corporate customers’ climate impact. In our investments we take a restrictive approach to companies engaged in fossil fuels.
2. Through our business we drive economic development and contribute to creating new jobs and growth in society, for
example by supporting entrepreneurs. Our microfinance funds give individuals and companies access to capital and
financial services.
3. Through our history of maintaining long-term relationships with industrial companies we contribute to strengthened
infrastructure and enable technological advancements. We cherish the innovation capacity in society. In 2020, we
established SEB Greentech to support Nordic companies in the green technology sector
4. We work to reduce corruption and bribery in all their forms. We protect our business and are committed to preventing money laundering, cybercrime, sabotage, intrusion attempts and financing of terrorism
5. Trough the Financial Equality initiative, SEB discovered the fact that 28% of SEB customer companies ultimate beneficial
owners are females, 22% of SEB customer companies are owned only by females.
Engaging with stakeholders
We are engaged in continuous dialogues with key stakeholders in order to ensure that we prioritise the most important issues and
secure responsible business. In 2020, all stakeholder groups were affected by the COVID-19 pandemic, both in terms of areas that
were addressed and the way we interacted with them.
Customers
During the year customers increasingly looked for availability, proactivity and support from banks in the light of the pandemic. In
addition, large corporate customers and financial institutions also increasingly required an understanding of their specific
challenges and strong industrial competence from SEB. With respect to sustainability, their need for support and relevant advisory
services remained strong. We made considerable efforts to meet these needs, for example through our work with classifying the credit portfolio. For more information see in the web page: www.sebgroup.com in SEB Group Sustainability Annual report.
CONSOLIDATED ANNUAL REPORT FOR THE YEAR ENDED 31 DECEMBER 2020
(all amounts in EUR thousand unless otherwise stated)
Page 18 of 113
For private customers the bank made improvements in its digital services, particularly the mobile app. During the pandemic year,
about 2,300 private individuals and 2,700 our corporate customers used deferral of payments in Lithuania.
Investors, shareholders and analysts
The focus of investors, shareholders and analysts was predominantly on COVID-19 and its impact on economic development and
how our customers, especially corporates, were affected, particularly concerning the risk for higher credit losses. Another area
was the strong recommendation by authorities to refrain from paying dividends, even for well capitalized banks like SEB.
Sustainability continued to be an area of central focus. Dialogues also focused on governance, anti-money laundering capabilities and potential investment needs in the light of the outcomes of the reviews by the Swedish and the Baltic countries’ Financial
Services Authorities.
Employees
SEB's annual employee survey showed high scores for engagement and satisfaction. Among areas of improvement, employees noted cross-functional collaboration and further improvement of the customer experience. A special survey on employee
satisfaction during the pandemic showed that employees generally feel well-supported, but that they are also looking for better
collaboration. The digital interaction increased overall.
Society – regulators, media
We engage with regulators and supervisors at the national as well as international levels through bilateral and multilateral
meetings and in various industry forums. Among emphasized topics were anti-money laundering, integration of sustainability and
climate risk in processes, and disclosure and investment advice. Focus in media interactions was on the impact of COVID-19 on
SEB, our customers, the economy and society at large. Of key interest were also areas such as anti-money laundering, crime prevention and sustainability.
Sustainability governance
To accelerate the pace of the transformation, SEB established a considerably strengthened sustainability organization in 2020 –
Sustainable Banking. This central team gathers SEB’s expertise and takes a holistic approach both strategically and commercially.
The Board of Directors is responsible for establishing a strategy for corporate sustainability and an organization to execute this
strategy. The Board approves SEB’s business plan, including sustainability strategy considerations, the Corporate Sustainability
Policy and the Sustainability Report, which is included in the Annual Report. The Board is regularly updated on corporate
sustainability matters.
The President and Chief Executive Officer is responsible for execution of the sustainability strategy and implementation of the
governance structure set by the Board. The President has established a Group Executive Sustainability Committee (GESC) to
manage execution of the sustainability strategy. The GESC is a decision-making body that is chaired by the President. The President
approves SEB’s position statement on climate change.
Sustainable Banking is an operational body, responsible for coordinating and driving the overall sustainability agenda in close
collaboration with the divisions, group staff and support functions. The Chief Sustainability Officer heads this unit and is a member
of the GESC and SEB’s Group Risk Committee.
Through the Sustainability Product Committee (SPC) SEB centralises assessments of new products. SPC is a committee that decides on the right for SEB units to use any sustainability reference in the marketing or distribution of products or services, such as,
reference to the ESG (Environmental, Social, Governance) factors, the SDGs and the EU Taxonomy. Each Head of Division, Head of
Group Support function and Head of Group Staff function is responsible for ensuring that procedures and controls are in place in order
to implement and adhere to the sustainability objectives, strategy and policies set by the Board, the President and the GESC.
The Customer Risk Acceptance Committee in the bank assess and decide on new customers or transactional proposals from a
sustainability risk perspective before bringing the on- boarding or transaction for decision by the relevant decision body.
Investment Management is an SEB division and thereby included in SEB’s governance structure. The division operates in the form
of a subsidiary, SEB Investment Management AB. The fund company is a separate legal entity with its own board of directors. The company operates in accordance with the Sustainability Policy for SEB Investment Management and Principles for Shareholder
Engagement for SEB Investment Management. Within the executive management team, the Head of Sustainability and
Governance is responsible for developing and coordinating this work, including climate change. For a full description of governance
in SEB Investment Management AB, see www.sebgroup.com.
CONSOLIDATED ANNUAL REPORT FOR THE YEAR ENDED 31 DECEMBER 2020
(all amounts in EUR thousand unless otherwise stated)
Page 19 of 113
Policy framework
SEB's policy framework (see below) provides guidelines on best practice and on the international conventions and standards that
we encourage companies to follow. We aim to work with our customers and portfolio companies towards improved business practices and continuously review policies in order to strengthen the business and to be aligned with international and national
requirements. In 2020, two new sector policies were published, on Gambling and Tobacco, and in early 2021 a review of the sector
policy on Fossil Fuel was finalized. An updated framework for the implementation of SEB's policies will be introduced in 2021.
SEB's steering documents for sustainability
Policies: the Corporate Sustainability Policy, the Credit Policy on Corporate Sustainability, the Customer Acceptance Standards,
the Environmental Policy, the Human Rights Policy, the Inclusion and Diversity Policy, the Code of Conduct, the Code of Conduct for
Suppliers and the Tax Policy.
Position statements: Child Labour, Climate Change, Fresh Water and the UK Modern Slavery Act.
Sector policies: Arms and Defence, Forestry, Fossil Fuel, Gambling, Mining and Metals, Renewable Energy, Shipping, Tobacco.
Sustainable financing
Sustainable financing is an increasingly important driver in the transition to a low-carbon economy, both in the global market and
in SEB’s business.
In close cooperation and dialogue with our customers, we are committed to finding solutions that are tailored to their needs and
that offer the possibility to contribute to positive impacts. Responsible financing and lending are cornerstones of our business.
SEB’s group-wide policies define how the bank is to take sustainability risks into account in financing activities. All transactions are
to meet the policies. SEB takes a restrictive stance to doing business in industries with a high risk for corruption, negative human rights and labour rights impacts, and businesses that operate in jurisdictions with weak, low or no respect for human rights, without
proper mitigations in place.
In 2020, SEB further integrated sustainability risk aspects into processes and customer dialogues. The main focus was on climate
change. Through the work with our sustainability classification model (see full description subgroup.com) it is clear that this topic in our customer dialogues allows us to deepen our relationships. By jointly developing an understanding of what areas in a
particular industry drive financial performance we create a better understanding of our customers' risks and potential
performance.
This dialogue has proven valuable for our customers when they create metrics and reporting in order to help investors understand the value of their work in this area. This will also allow the customers to link ambitions to a wider range of appropriate financing
solutions.
Sustainable financing solutions
SEB offers sustainable financial solutions for private and corporate customers and for institutions. For large corporate and institutional customers the landscape of sustainable financing solutions continues to broaden. The green bond market is being
expanded.
SEB’s own green bond is financing green loans
As part of SEB Group funding strategy, in 2017 SEB Group issued our first green bond of EUR 500 million. Backed by SEB’s sustainability strategy, Environmental Policy and accompanying sector policies, the Green Bond Framework ensures that SEB’s
green bond, by financing green loans, is used for low-carbon and climate change resilient projects and investments. In addition, the
green bonds should promote environmental and ecosystem improvements and thereby also support the SDGs.
In 2020, we granted the first green loan in the Baltic region with the purpose to finance the construction of solar parks in Estonia. Also the green loan was issued to finance wind power parkin Lithuania. At year-end SEB’s Group green loan portfolio amounted to
SEK 21 billion, an increase of almost SEK 8 billion since 2017.
Equator Principles
For project financing SEB has adhered to the Equator Principles (EP) since 2007, a voluntary set of guidelines used by financial institutions to assess the social and environmental impacts of large projects and to assist the customers in managing them.
In 2020 the updated version of the Equator Principles, EP4, was implemented by the member financial institutions. Changes in EP4
are mainly in the areas of human rights, climate change, indigenous peoples and biodiversity.
AB SEB bankas
CONSOLIDATED ANNUAL REPORT FOR THE YEAR ENDED 31 DECEMBER 2020
(all amounts in EUR thousand unless otherwise stated)
Page 20 of 113
In 2020, we conducted four project finance transactions under the Equator Principles, three in category B (projects with potential
limited adverse environmental and social risks) and one in category C (projects with minimal or no social or environ- mental
impacts). As regards project related corporate loans, we were involved in one category A transaction (projects with potential significant adverse environmental and social risks).
Sustainable investments
SEB's fund company, SEB Investment Management, is one of the Nordic region's largest institutional investors with SEK 672 billion
in assets under management for private, corporate and institutional customers. SEB in Lithuania follows Sustainability principles described in this SEB Group Sustainability Annual Report.
As customers are increasingly demanding sustainable products, SEB Investment Management strives to integrate such aspects
into all types of investments and asset classes. The investment strategies are based on the inclusion of companies that conduct
good work in this area or have well-defined transition plans, exclusion of industries and companies that do not meet the fund company's sustainability criteria, and continuous engagement in the companies in which we invest.
The fund company strives to improve its work by constantly updating strategies, improving processes and developing new
products for the customers. In the coming years, new EU regulations on transparency and reporting will also enter into force, which
will affect our work.
SEB became a signatory of the UN Principles for Responsible Investment (PRI) in 2008 and has since reported annually on its
compliance with the six principles. In PRI's classification of sustainable investments in 2020, SEB's fund company received the
highest possible rating (A+) for strategy and governance, and a rating of A in all other categories.
In 2020, four of SEB’s six index funds were converted to index tracker funds. These funds now exclude companies engaged in the extraction of fossil fuels as well as energy companies that generate power from fossil fuels.
In December 2020, a strengthened Sustainability Policy was adopted by the fund company’s board of directors along with a
climate strategy. Going forward we will apply the same methods and exclusions for all funds, which for instance means that all
funds will exclude companies that produce or extract fossil fuel. For more information see sebgroup.com.
Focus on inclusion
The fund company invests in companies that actively manage environmental, social and governance factors in their operations.
We believe that these will be more successful over time and thereby create value for customers, companies and society. Analysis
of sustainability risks and opportunities is integrated in the management of all SEB funds. In 2020, certain funds, such as sustainability funds, were managed using stricter exclusion and inclusion criteria. Assets under management in these funds
amounted to SEK 304 billion at year-end, or 45 per cent of the fund company’s total assets under management.
Criteria for exclusion
All of SEB's funds managed by the fund company exclude companies involved in the production or marketing of controversial weapons and the development or production of nuclear weapons programmes. In 2020, SEB funds did not invest in companies
that extract thermal coal, i.e. mining operations where coal accounts for more than five per cent of the company's or group's
turnover, nor in tobacco companies and companies that produce cannabis for non-medical use. The funds also did not invest in
companies that fail to respect international conventions and guidelines, such as the UN Global Compact, OECD Guidelines for Multinational Enterprises, the UN Universal Declaration of Human Rights, the UN's Guiding Principles on Business and Human
Rights, the ILO Core Conventions on Labour Standards and Children’s Rights and Business Principles. In 2020, 100 per cent (100)
of SEB's funds were managed in accordance with human rights criteria. In 2020, SEB's sustainability funds also excluded
companies where more than five per cent of their turnover came from alcohol, weapons, gambling or pornography. In addition, these funds did not invest in companies that extract fossil fuels. The fund company reviews its holdings every six months through
its advisor ISS ESG. For renewed exclusion criteria 2021, see www.sebgroup.com.
CONSOLIDATED ANNUAL REPORT FOR THE YEAR ENDED 31 DECEMBER 2020
(all amounts in EUR thousand unless otherwise stated)
Page 21 of 113
Ownership and engagement
SEB Investment Management works actively to influence the companies in which it invests. In Swedish and Nordic companies,
where the fund company is often one of the largest shareholders, this commitment is implemented directly through dialogues with the company's executive management and board. The fund company also actively participates as an owner through votesat
annual general meetings of shareholders. In 2020, the fund company voted at 286 annual and extraordinary general meetings,
and participated on nomination committees in 33 listed Swedish companies.
Collaboration
For investments outside the Nordic region, we collaborate with other investors through organizations such as The Institutional
Investors Group on Climate Change (IIGCC, see below), PRI Clearinghouse, and Federated Hermes Equity Ownership Services.
During the year, SEB conducted more than 2,000 dialogues (direct and indirect) with portfolio companies.
The Investors Policy Dialogue on Deforestation (IPDD) is a unique investor commitment that coordinates dialogues with governments, public authorities and industry associations on systematic and sustainable land use and management of natural
resources. In partnership with other institutional investors, we have had several meetings with the Brazilian government and the
central bank to combat deforestation, fires and the loss of biodiversity in the Amazon.
We are also part of Swedish Investors for Sustainable Development (SISD), where we collaborate with other Swedish institutional investors and the Swedish International Development Cooperation Agency (SIDA).
Customer survey
Every year SEB Investment Management conducts a survey in which we ask private customers with holdings in equity funds which
of the SDGs they believe we should focus on in the company dialogues. As in previous years the survey showed that customers want SEB to contribute to combating climate change and promoting clean water and sanitation and good education. Biodiversity
was also highly ranked.
Based in part on the response of the customer survey, we are collaborating with the Institutional Investors Group on Climate
Change (IIGCC). This is part of the Climate Action 100+ initiative for active advocacy work with the 161 companies that account for the largest carbon dioxide emissions globally, mainly companies in the gas and oil industry, which together account for 80 per
cent of industrial emissions worldwide. These are judged to have great opportunities to drive the transition to fossil-free energy.
As a result of the initiative, Nestlé, among others, has committed itself to being climate neutral by 2050.
SEB is also involved in the international organisation CDP's water programme. During 2020, data was collected from nearly 1,000 companies worldwide on how they are working to reduce their water consumption. Every year CDP compiles this information and
through an independent method distributes points to show the companies' progress.
Advisory and innovation
Our ability to meet our customers’ sustainability preferences is key for the future, and our advisory and innovation capacity will be crucial. This is why we develop products and services that help customers make informed decisions and that contribute to counter
global warming, promote equality and support green- tech entrepreneurs, for example.
The foundation for the advisory role consists of our efforts to identify and assess areas related to climate change and the
environment, human rights, labour rights, social relations and anti-corruption that may have negative impacts through our business. We expect our customers to respect human rights and labour rights through appropriate due diligence systems, and we are
committed to identifying and managing corruption risks in transactions.
SEB acts on findings based on prioritisation, proportionality and level of influence in order to prevent, mitigate and remediate
potential negative impacts. Our history of long-term relation- ships is important when our dialogues now increasingly include sustainability aspects.
AB SEB bankas
CONSOLIDATED ANNUAL REPORT FOR THE YEAR ENDED 31 DECEMBER 2020
(all amounts in EUR thousand unless otherwise stated)
Page 22 of 113
GROWTH programme for SME customers
SEB strongly believes that entrepreneurial minds and innovative companies are key in creating a better world. In Lithuania, since
2018 we have partnered with innovation consulting firm Civitta to launch SEB Growth Program. It is dedicated to small and medium enterprises to help them grow their business through innovation. So far, 63 companies have participated in the program which
consists of seminars by international lecturers, workshops, pitching sessions and much more. Our lectures are also available for
wider public to watch digitally. Participants have consistently rated their experience very highly – score of at least 9.2 (out of 10)
since inception. More and more companies are developing products related to sustainability hence we have decided that from 2021 we will include sustainability module to ensure our participants have the right skills, knowledge and motivation to develop
their companies in sustainable manner.
People and competence
As an employer, SEB has a responsibility to ensure that all employees are treated equally and with respect, and with equal opportunities for all. Everyone should feel included and be given the same opportunities for professional and personal
development. Values and behaviours as well as individual ability and ambition are important long-term success factors for being
part of our team.
Our employees are at the core for our ability to be a successful company that can support our customers in fulfilling their ambitions. Continuous learning, inclusion and diversity and a healthy work environment are among the areas we focus on (for more
information see subgroup.com).
Building competence among employees
SEB maintains a strong focus on strengthening responsible business behaviours and sustainability competence among employees. This is driven by increased expectations and demands from customers in all segments as well as from other stakeholders, such as
investors and regulators.
Since long the bank has a mandatory training in Code of Conduct in place, and in 2020 special focus was put on increasing
knowledge about climate change. Consequently, SEB launched a training that is now mandatory for all 15,500 employees globally. The training consists of a digital lecture with Lisen Schultz, researcher and scientist at the Stockholm Resilience Centre, and founder
and director of the Executive Programme in Resilient Thinking. Based on decades of research as well as the latest findings, the
training gives a comprehensive view of how the climate is changing, current and future effects, and what SEB as a bank can do to
contribute.
Training for increased knowledge and awareness
In connection with our work on classifying our corporate customers’ climate impact, during the year a tailor-made training was
launched to support customer executives and advisors prior to customer dialogues related to climate change. Work- shops and
seminars were also carried out in all divisions with corporate customers.
In the Baltic countries, major internal communication efforts during recent years have led to increased awareness among
employees, which was noted in the employee Insight survey in 2020. Public sustainability webinars were also launched with the
key objective to raise the awareness about sustainability in society. About 12,000 people attended.
Going forward, SEB will further expand the range of sustainability-related training for employees, adapted according to roles and needs.
Junior Achievement Lithuania
SEB Bank is a permanent contributor to the fostering of the young generation’s entrepreneurship and is patron of Junior
Achievement Lithuania (JA Lithuania), a non-governmental organisation, which implements economic and entrepreneurship education programmes for young people. Initiative JA Lithuania exists more than two decades. It is aimed at providing Lithuanian
schoolchildren with theoretical and practical knowledge in economics and financial literacy, develop their entrepreneurial
attitudes, stimulate creative out-of-the-box and innovative thinking. Every year, JA Lithuania programmes reach about 20,000
schoolchildren from more than 350 schools, and their education process is supported by more than 300 teachers. Schoolchildren gain practical experience at educational companies that are created every year. Also, the education process for young people
involves business leaders with their advice, mentorship and possibilities for practice.
Integrating sustainability KPIs
SEB sees the importance of aligning incentive structures with its sustainability ambitions. Sustainability KPIs are integrated in the long-term incentive structures for members of SEB’s Group Executive Committee (GEC). In 2020, this was further integrated also
for managers who report to members of the GEC.
AB SEB bankas
CONSOLIDATED ANNUAL REPORT FOR THE YEAR ENDED 31 DECEMBER 2020
(all amounts in EUR thousand unless otherwise stated)
Page 23 of 113
Suppliers
SEB has established procedures to evaluate and select suppliers and contractors, based on financial, environmental, governance
and social aspects. These aspects include human rights, labour rights, social relations and anti-corruption and are to be taken into account in procurement decisions along with other risk factors and commercial aspects. We monitor suppliers’ processes and
performance where appropriate. These standards are described in SEB’s Code of Conduct for Suppliers.
To identify sustainability risks among our suppliers, SEB starts with an initial assessment. The sustainability risk level for each
supplier is determined by country, industry sector and business criticality. Suppliers identified as having a potential elevated risk level in the risk assessment are subject to an enhanced assessment. SEB’s largest suppliers are mainly in professional services,
facilities management, IT and banking services.
In 2021, SEB aims to further strengthen routines within select- ed areas. For instance, SEB’s Group Technology – responsible for
IT procurement and cloud providers, among other areas– has the ambition to deepen its assessment of key suppliers.
Climate disclosure – TCFD Report
The Financial Stability Board (FSB) established the industry-led Task Force on Climate-related Financial Disclosures (TCFD) in
2015 in order to develop recommendations for more transparent and informative climate-related financial disclosures. With
reliable climate-related financial information at hand, financial markets will be able to better understand and correctly price climate-related risks and opportunities. Investors, lenders and insurers will have a clearer idea of what companies will endure
when regulations come into force, new technologies emerge and customer behaviours shift.
SEB endorsed the recommendations of the TCFD in 2018 and is committed to implementing these under the sponsorship of the
Chief Risk Officer. The recommendations focus on four pillars: strategy, governance, risk management as well as metrics and targets. In 2020, SEB took important steps towards implementing the TCFD recommendations. The bank is committed to
continuing this journey.
This TCFD report covers the SEB Group including the subsidiary SEB Investment Management (the fund company). For a full
description of TCFD Report, see subgroup.com.
President of AB SEB bankas Raimondas Kvedaras
Head of Business Support Division and Chief Financial Officer of AB SEB bankas Aivaras Čičelis
Vilnius, 10 March 2021
AB SEB bankas
INCOME STATEMENT
FOR THE YEAR ENDED 31 DECEMBER 2020
(All amounts in EUR thousand unless otherwise stated)
Page 24 of 113
The accompanying notes on pages 31 to 109 are an integral part of these financial statements.
Increase (+) / decrease (-) in deposits and borrowings from
the public 1,569,518 727,534 1,569,291 727,328
Increase (+) / decrease (-) in other liabilities -340 20,540 -368 20,166
1,657,114 634,685 1,656,859 634,105
Net cash flows from operating activities 1,424,377 785,276 1,422,323 782,980
The Group The Bank
AB SEB bankas
STATEMENT OF CASH FLOWS
FOR THE YEAR ENDED 31 DECEMBER 2020
(All amounts in EUR thousand unless otherwise stated)
Page 30 of 113
(Concluded)
The accompanying notes on pages 31 to 109 are an integral part of these financial statements.
Note 2020
2019
Reclassified
(Note 40) 2020
2019
Reclassified
(Note 40)
Investing activities
Purchase of property, plant and equipment and intangible
assets -12,230 -8,870 -12,230 -8,868
Dividends received 7 - - 2,054 2,294
Net cash outflow from debt securities -54,450 -97,250 -54,450 -97,250
Net cash flows used in investing activities -66,680 -106,120 -64,626 -103,824
Financing activities
Dividends paid - -105,838 - -105,838
Lease payments -4,829 -4,209 -4,829 -4,209
Net cash flows used in financing activities -4,829 -110,047 -4,829 -110,047
Net increase in cash and cash equivalents 1,352,868 569,109 1,352,868 569,109
Cash and cash equivalents at 1 January 1,603,435 1,034,326 1,603,435 1,034,326
Cash and cash equivalents at 31 December 2,956,303 1,603,435 2,956,303 1,603,435
Specified as follows:
Balance available for withdrawal with the Central Bank 13 1,712,839 1,386,412 1,712,839 1,386,412
Cash on hand 13 139,408 156,115 139,408 156,115
Current accounts with other banks 14 1,104,056 60,908 1,104,056 60,908
2,956,303 1,603,435 2,956,303 1,603,435
The BankThe Group
AB SEB bankas
NOTES TO THE FINANCIAL STATEMENTS
FOR THE YEAR ENDED 31 DECEMBER 2020
(All amounts in EUR thousand unless otherwise stated)
Page 31 of 113
CORPORATE INFORMATION
AB SEB bankas (the Bank) is a joint-stock company registered in the Enterprise Register of the Republic of Lithuania,
Konstitucijos pr. 24 (31 December 2019 - Gedimino ave. 12), Vilnius. The Bank is registered with registration number
112021238. The Bank and its subsidiaries (the Group) are engaged in banking and financial services business. As at 31 December 2020 and 2019, the Bank holds investments in the following subsidiaries:
The sole shareholder of the Bank is Skandinaviska Enskilda Banken AB (publ) (SEB Group), who is also the ultimate controlling
party, registered in Sweden.
These consolidated and separate financial statements for the year ended 31 December 2020 have been approved by the
Management Board on 10 March 2021 and are subject to approval by the shareholder.
1. SIGNIFICANT ACCOUNTING POLICIES
1.1 Statement of compliance
The financial statements have been prepared in accordance with and comply with International Financial Reporting Standards
(IFRS), adopted in the European Union.
1.2 Basis of preparation
These financial statements are prepared on historical cost basis, except for the certain financial assets and liabilities (including derivative instruments) measured at fair value. The accounting policies used in the preparation of the financial statements for the
year ended 31 December 2020 are consistent with those used in the annual financial statements for the year ended 31 December
2019 apart from the certain presentation changes disclosed in Note 40.
The financial statements are presented in thousands of euro, unless otherwise stated.
1.3 Consolidation
The subsidiaries being consolidated are listed under section “Corporate Information”. Investments in subsidiaries in the Bank’s
separate financial statements are accounted for using the cost method less impairment and are initially recognized at cost.
These financial statements present the consolidated financial statements of the parent company and its subsidiary and separate financial statements of the parent company.
Subsidiaries are companies, over which the Group has control. The Group controls an entity when it is exposed to, or has rights to,
variable returns from its involvement and has the ability to use its power to affect the amount of the returns. Control is deemed to
exist when the parent company (i) has power to direct relevant activities of the investee that significantly affect their returns, (ii) has exposure or rights to variable returns from its involvement with the investees, and (iii) has the ability to use its power over
the investees to affect the amount of investor’s returns.
The financial statements of the parent company and the consolidated subsidiaries refer to the same period and have been drawn
up according to the accounting policies applicable to the Group. A subsidiary is included in the consolidated accounts from the time of acquisition, being the date when the parent company gains control over the subsidiary. The subsidiary is included in the
consolidated accounts until the date when control over the company ceases to exist.
Business combinations are accounted for using the acquisition method. The acquisition value is measured as the fair value of the
assets given, equity instruments issued, and liabilities incurred or assumed.
The identifiable assets acquired, and the liabilities and contingent liabilities assumed in a business combination are measured
initially at their fair values on acquisition date, irrespective of any non-controlling interest. Intra-group transactions, balances and
unrealised gains and losses on transactions between Group companies are eliminated.
Company name Registry code Address Activity
UAB SEB Investicijų valdymas 125277981 Konstitucijos ave. 24, VilniusProvision of investment's
management services
AB SEB bankas
NOTES TO THE FINANCIAL STATEMENTS
FOR THE YEAR ENDED 31 DECEMBER 2020
(All amounts in EUR thousand unless otherwise stated)
Page 32 of 113
1. SIGNIFICANT ACCOUNTING POLICIES (CONTINUED)
1.4 Foreign currency translation
The functional and presentation currency of the parent company and subsidiaries is Euro. Foreign currency transactions are
translated into the functional currency using the exchange rates of the European Central Bank prevailing at the dates of the
transactions. On subsequent reporting dates, monetary items in foreign currency are translated using the closing rate. Non-monetary items, which are measured in terms of historical cost in foreign currency, are translated using the exchange rate on the
date of the transaction. Non-monetary items, which are measured at fair value in a foreign currency, are translated applying the
exchange rate of the European Central Bank on the date on which the fair value is determined.
Gains and losses arising as a result of exchange rate differences on settlement or translation of monetary items are recognised in profit or loss. Translation differences on non-monetary items, classified as financial assets or financial liabilities at fair value
through profit or loss, are included in the change in fair value of those items.
1.5 Cash and cash equivalents
For the purposes of presentation in the cash flow statement, cash and cash equivalents are cash on hand, overnight deposits, correspondent accounts with the Central Banks and correspondent accounts with other banks, which are readily convertible to
known amounts of cash and which are subject to insignificant risk of changes in value.
1.6 Financial assets
Financial assets are recognised in the statement of financial position when the Group and the Bank become a party to the contractual provisions of the instrument and are measured at fair value on initial recognition. Transaction costs are included in the
fair value on initial recognition except for financial assets at fair value through profit or loss, where transaction costs are expensed
in profit or loss. Financial assets are derecognised when the rights to receive cash flows have expired, the Group and the Bank
have transferred substantially all risks and rewards and upon substantial modification. Financial assets at fair value are recognised in the statement of financial position on trade date with exception of loans, which are recognized on settlement date. Financial
assets measured at amortised cost are recognised on the settlement date.
The Group and the Bank classify and subsequently measure their financial assets in the following categories:
- financial instruments at fair value through profit or loss (‘FVPL’);
- amortised cost (‘AC’).
The classification will depend on if the financial asset is a debt instrument, an equity instrument or a derivative.
1.6.1 Debt instruments (loans and debt securities)
The classification is based on a combination of assessing the business model for managing the financial assets and whether the contractual cash flow characteristics consist of solely payments of principal and interest (‘SPPI’). The business model assessment
is performed for homogenous portfolios identified based on how the business is managed in the divisions of the Group and the
Bank. The assessment is based on reasonable scenarios taking into consideration how the portfolio is evaluated and reported to
management; the risks affecting the performance of the portfolio and how these risks are managed; how managers are compensated; and the frequency, value and timing of sales including the reasons for the sales. In determining if the cash flows
consist solely of principal and interest, the principal is defined as the fair value of the debt instrument at initial recognition, which
can change over the life if there are repayments or capitalisation of interest. Interest cash flows are consistent with components
per a basic lending arrangement including consideration for time value of money, credit risk, liquidity risk as well as administrative costs and profit margin. If there are contractual features introducing an exposure to other risks or volatility, it is not considered to
consist of solely payments of principal and interest. Debt instruments are presented in the statement of financial position items:
Loans to credit institutions, Loans to the public and Debt securities, and include instruments in the following measurement
categories.
AB SEB bankas
NOTES TO THE FINANCIAL STATEMENTS
FOR THE YEAR ENDED 31 DECEMBER 2020
(All amounts in EUR thousand unless otherwise stated)
Page 33 of 113
1. SIGNIFICANT ACCOUNTING POLICIES (CONTINUED)
1.6 Financial assets (continued)
1.6.1 Debt instruments (continued)
Fair value through profit or loss: Debt instruments are classified in this category if not meeting the criteria for amortised cost or fair
value through other comprehensive income. This is the case if the business model is held for trading; where financial assets are considered held for trading if they are held with the intention to be sold in the short-term and for the purpose of generating profits.
Debt instruments are mandatorily measured at fair value through profit or loss if the assets are managed and evaluated on a fair
value basis or the assets are held with an intention to sell alternatively if the cash flows do not consist of solely payments of
principal and interest. Debt instruments that would otherwise be classified as fair value through other comprehensive income or amortised cost are also included in this category if, upon initial recognition, designated at fair value through profit or loss (fair value
option). The fair value option can be applied only in situations where such designation reduces measurement inconsistencies.
Amortised cost: Debt instruments are classified in this category if both of the following criteria are met:
(a) the business model objective is to hold assets to collect contractual cash flows; and
(b) the contractual cash flow characteristics consist of solely payments of principal and interest. The gross carrying amount of
these assets is measured using the effective interest method and adjusted for expected credit losses.
Financial instruments by IFRS 9 measurement categories are presented in the Note 33.
1.6.2 Equity instruments
Equity instruments are classified as financial assets at fair value through profit or loss. An irrevocable election can be made on
initial recognition to classify equity instruments (not held for trading) at fair value through other comprehensive income.
1.6.3 Derivatives
Derivatives are classified as fair value through profit or loss (held for trading) unless designated as hedging instruments.
1.6.4 Modification
The Group and the Bank may renegotiate loans and modify contractual terms. If the new terms are substantially different from the
original terms, the Group and the Bank derecognize the original financial asset and recognises a new asset. The Group and the Bank
also assess whether the new financial asset is credit-impaired at initial recognition. If the terms are not substantially different, the modification does not result in derecognition and the Group and the Bank recalculate the gross carrying amount based on the new
cash flows using the original effective interest rate of the financial asset and recognises a modification gain or loss.
1.6.5 Write-off
The Group and the Bank writes off financial assets measured at amortised cost, in whole or in part, when it is unlikely to collect debt from the borrower and it cannot be recovered from a sale of collateral. Write-offs constitute derecognition event and shall
include amounts caused both by reductions of the carrying amount of financial assets recognised directly in profit or loss as well
as reductions in the amounts of the allowance accounts for credit losses taken against the carrying amount of financial assets.
The Group and the Bank may write-off financial assets that are still subject to enforcement activity. The outstanding contractual amounts of such assets written off during the year ended 31 December 2020 was EUR 1,371 thousand (8,235). The Group and
the Bank still seeks to recover amounts it is legally owed in full, but which have been partially written off due to no reasonable
expectation on full recovery.
AB SEB bankas
NOTES TO THE FINANCIAL STATEMENTS
FOR THE YEAR ENDED 31 DECEMBER 2020
(All amounts in EUR thousand unless otherwise stated)
Page 34 of 113
1. SIGNIFICANT ACCOUNTING POLICIES (CONTINUED)
1.7 Financial guarantees
Financial guarantees are contracts that require the Group and the Bank to make specified payments to reimburse the holder for a
loss it incurs because a specified debtor fails to make payment when due in accordance with the terms of a debt instrument.
Financial guarantee liabilities are initially recognised at their fair value (which most often equals the premium received) and subsequently at the higher of the amount determined in accordance with the expected credit loss model under IFRS 9 Financial
Instruments and the amount initially recognised less, where appropriate, the cumulative amount of income recognised. The
contractual amounts according to financial guarantees are not recognised in the statement of financial position but disclosed as
obligations.
1.8 Expected credit loss
1.8.1 Measurement
The impairment requirements are based on an expected credit loss (ECL) model. The guiding principle of the ECL model is to reflect
the general pattern of deterioration or improvement in the credit quality of financial instruments. All financial assets measured at amortised cost, as well as lease receivables, financial guarantees contracts and certain loan commitments are in scope for
expected credit loss.
ECLs on financial assets measured at amortised cost and lease receivables are presented as allowances, i.e., as an integral part of
the measurement of those assets in the statement of financial position. The allowance reduces the gross carrying amount. ECLs on loan commitments and financial guarantee contracts are presented as provisions, i.e., as a liability, in the statement of financial
position. Adjustment to the loss allowance and provision due to changes in ECLs is recognised in the income statement as Net
expected credit losses.
The assessment of credit risk, and the estimation of ECL, has to be unbiased and probability-weighted, and shall incorporate all available information, which is relevant to the assessment, including information about past events, current conditions and
reasonable and supportable forecasts of future events and economic conditions at the reporting date. SEB Group uses both models
and expert credit judgement (ECJ) for calculating ECLs.
The ECL model has a three-stage approach based on changes in the credit risk. A 12-month ECL (Stage 1) applies to all items, unless there is a significant increase in credit risk since initial recognition. For items where there is a significant increase in credit
risk (Stage 2) or in default (Stage 3), lifetime ECL applies.
1.8.2 Significant increase in credit risk
At the end of each reporting period, the Group and the Bank perform an assessment of whether credit risk has increased significantly since initial recognition. The assessment of whether there has been a significant change in credit risk is based on
quantitative and qualitative indicators. Both historic and forward-looking information is used in the assessment.
For arrangements with an initial origination date as at 1 January 2018 or later, the primary indicator is changes in lifetime
probability of default (PD) by comparing the scenario-weighted annualised lifetime PD at the reporting date with the scenario-weighted annualised lifetime PD at initial recognition. For arrangements with an initial origination date prior to 1 January 2018,
changes in Group’s and Bank’s internal risk classifications since initial origination are used as the primary indicator.
Regardless of the quantitative indicator, a significant increase in credit risk is triggered if the following backstop indicators occur:
- payments are past due >30 days but <90 days; or - financial assets have been classified as watch-listed; or
- financial assets are forborne (where due to the customer’s financial difficulties the contractual terms of the loans have
been revised and concessions given).
Backstop indicators normally overlap with the quantitative indicator of significant increase in credit risk.
In case there has been a significant increase in credit risk since initial recognition, an allowance for lifetime ECL shall be recognised
and the financial instrument is transferred to Stage 2. The approach is symmetrical, meaning that in subsequent reporting periods,
if the credit quality of the financial instrument improves such that there is no longer a significant increase in credit risk since initial
recognition, the financial assets move back to Stage 1.
AB SEB bankas
NOTES TO THE FINANCIAL STATEMENTS
FOR THE YEAR ENDED 31 DECEMBER 2020
(All amounts in EUR thousand unless otherwise stated)
Page 35 of 113
1. SIGNIFICANT ACCOUNTING POLICIES (CONTINUED)
1.8 Expected credit loss (continued)
1.8.2 Significant increase in credit risk (continued)
If credit quality of financial instrument deteriorates further, the financial instrument is transferred to Stage 3. Transfer to Stage 3
is triggered if the following indications occur:
- Payments are past due more than 90 days;
- Financial instrument is in default (PD = 100 per cent).
1.8.3 Definition of default
Financial instruments in default are in Stage 3. The Group and the Bank apply a definition of default for accounting purposes that is consistent with how it is defined in the Capital requirements regulation No 575/2013, which includes financial assets past due
more than 90 days. All financial assets in Stage 3 are considered credit-impaired.
1.8.4 Modelling
The ECL is calculated as a function of the probability of default (PD), the exposure at default (EAD) and the loss given default (LGD), as well as the timing of the loss. The Group’s and the Bank’s IFRS 9 methodology for ECL measurement is based on existing
internal rating-based risk models (IRB) to the extent allowed under IFRS 9. As the objectives of these frameworks differ, the
manner in which the expected credit losses are calculated also differs and appropriate adjustments are made to the IRB
parameters to meet IFRS 9 requirements. Adjustments include the conversion of through-the-cycle and downturn parameters used in IRB risk models to point-in-time parameters used under IFRS 9 that considers forward-looking information.
PD represents the likelihood that a loan will not be repaid and will go into default in either a 12-month or a lifetime horizon. The
expected PD for each individual instrument incorporates a consideration of past events, current market conditions and reasonable
and supportable information about future economic conditions. The Group and the Bank use IFRS 9 specific PD models. The models are calibrated based on a combination of geography, assets class and product type. EAD represents an estimate of the outstanding
amount of credit exposure at the time a default may occur. For off-balance sheet amounts, EAD includes an estimate of any further
amounts to be drawn at the time of default. For IFRS 9, EAD models are adjusted for a 12-month or lifetime horizon. LGD is the
amount that may not be recovered in the event of default. LGD takes into consideration the amount and quality of any collateral held as well as the probability of cure, whereby the borrower repays all his past due obligations on the defaulted loan and
recommences contractual repayments. The Group and the Bank use existing LGD models adjusted to meet IFRS 9 requirements.
When measuring ECL, the Group and the Bank use the maximum contractual period during which the Group and the Bank is exposed
to risk. All contractual terms are considered when determining the expected life, including prepayment options and extension and rollover options. For revolving facilities, such as credit cards, and retail mortgage facilities the expected life is modelled based on
historical behavior. The residual behavioral expected life for such facilities is based on historically observed survival curve and it
is affected by the time since origination of the arrangement.
1.8.5 Forward-looking information
The SEB Group uses internally developed macroeconomic forecasts as the basis for the forward-looking information incorporated
in the ECL measurement. In order to ensure an unbiased estimation of credit losses under IFRS 9, at least three scenarios are used.
One of the scenarios is the base case scenario, representing the most likely outcome, which is also applied in the financial planning
and budgeting process, while other case scenarios represent more positive or negative outcomes.
The forward-looking scenarios are prepared by SEB Group Economic Research Department. The scenarios are approved by the
SEB Group Risk Committee.
AB SEB bankas
NOTES TO THE FINANCIAL STATEMENTS
FOR THE YEAR ENDED 31 DECEMBER 2020
(All amounts in EUR thousand unless otherwise stated)
Page 36 of 113
1. SIGNIFICANT ACCOUNTING POLICIES (CONTINUED)
1.8 Expected credit loss (continued)
1.8.5 Forward-looking information (continued)
A scenario consists of a qualitative description of the macroeconomic development and a quantitative part, with forecasts of key
macroeconomic variables for three subsequent years, as well as the likelihood of occurrence (scenario- weight). The scenarios are reviewed and updated on a quarterly basis. In case of significant changes in the macroeconomic environment and outlook, the
scenarios will be updated more frequently. The scenario variables are benchmarked to various external sources of similar forward-
looking scenarios, e.g. from OECD, IMF, EU, national central banks, ECB and governments/ministries of Finance.
1.8.6 Expert credit judgement
The Group and the Bank use both models and expert credit judgement (ECJ) in order to determine ECLs. The degree of judgement
that is required to estimate ECL depends on the model outcome, materiality and the availability of detailed information. The model
provides guidance and transparency as to how economic events could affect the impairment of financial assets. Model overlay
may be applied to the modelled outcome to incorporate an estimated impact of factors not captured by the model. Such judgemental adjustment to the model-generated ECLs may be applied to significant exposures at a counterparty level. The
overlays are decided by the relevant credit committee using the model ECLs as guidance. In addition, there may be a need for
overlays at a portfolio level, which is decided by the SEB Group Risk Committee.
1.9 Financial liabilities
Financial liabilities are measured at fair value on initial recognition. In case the financial liabilities are measured at fair value through
profit or loss, transaction costs directly attributable to the acquisition or the issuance of the financial liability are recognised in
profit or loss. For other financial liabilities direct transaction cost are recognised as a deduction from the fair value.
Financial liabilities are derecognised when extinguished, that is, when the obligation is discharged, cancelled or expired.
The Group and the Bank classify and subsequently measure their financial liabilities in the following categories:
Financial liabilities at fair value through profit or loss
Financial liabilities at fair value through profit or loss are classified as held for trading. Financial liabilities held for trading are
derivatives not designated as hedging instruments.
Other financial liabilities
The category other financial liabilities primarily include the Group’s and the Bank’s short-term and long-term borrowings. After
initial recognition, other financial liabilities are measured at amortised cost, using the effective interest method. Statement of
financial position’s Items Deposits from central banks and credit institutions, Deposits and borrowings from the public, Other liabilities and Debt securities issued are included in this category.
1.10 Fair value measurement
The objective of the fair value measurement is to arrive at the price at which an orderly transaction would take place between
market participants at the measurement date under current market conditions. The best evidence of fair value is a quoted price for the instrument being measured in an actively traded market. Where the market for a financial instrument is not active, fair
value is calculated using an established valuation technique. These valuation techniques involve a degree of estimation, the extent
of which depends on the instrument’s complexity and the availability of market-based data. When valuing financial liabilities at fair
value own credit standing is reflected. Given the uncertainty and subjective nature of valuing financial instruments at fair value, it is possible that the outcomes in the next financial year could differ from the assumptions used.
For some of the Group’s and Bank’s financial assets and liabilities, especially for certain derivatives, quoted prices are not available,
and valuation models are used to estimate fair value. As part of the fair value measurement, valuation adjustments are made when
valuing derivative financial instruments, to incorporate counterparty and own credit risk. The methodologies for estimating valuation adjustments are continuously revised as a result of changing market practices in response to regulatory and accounting
policy changes, as well as general market developments.
AB SEB bankas
NOTES TO THE FINANCIAL STATEMENTS
FOR THE YEAR ENDED 31 DECEMBER 2020
(All amounts in EUR thousand unless otherwise stated)
Page 37 of 113
1. SIGNIFICANT ACCOUNTING POLICIES (CONTINUED)
1.11 Offsetting financial transactions
Financial assets and liabilities are offset, and the net amount reported in the statement of financial position when there is a legal
right to offset transactions and an intention to settle net or realise the asset and settle the liability simultaneously.
1.12 Property, plant and equipment
Property, plant and equipment are initially recognized at cost, consisting of the purchase price, non-refundable taxes and other
direct costs related to taking the asset in to use. Subsequently property, plant and equipment is measured at cost and depreciated
according to plan on a straight-line basis over the estimated useful life of the asset. The depreciation period for buildings is up to
50 years, for other property, plant and equipment - between 2 and 10 years. Subsequent costs are included in the asset’s carrying amount or recognised as a separate asset, as appropriate, only when it is probable that future economic benefits associated with
the item will flow to the entity and the cost of the item can be measured reliably. All other repairs and maintenance are charged to
the income statement during the reporting period in which they are incurred. Gains and losses on disposals are determined by
comparing proceeds with carrying amount and are included in the income statement.
Property, plant and equipment is tested for impairment whenever there is an indication of impairment.
1.13 Intangible assets
Intangible assets are identifiable, non-monetary assets without physical substance. For an intangible asset to be recognised an
entity must be able to demonstrate control of the intangible asset, which implies that the entity has the ability to ensure that the future economic benefits flowing from the underlying resource will accrue to the company. Intangible assets, other than goodwill,
are only recognised in the statement of financial position if it is probable that the future economic benefits attributable to the asset
will accrue to the Group and the Bank and if the acquisition cost of the asset can be measured reliably.
Intangible assets are measured initially at acquisition cost, and thereafter at cost less any accumulated amortisation and any accumulated impairment losses.
Intangible assets with finite useful lives, i.e. all intangible assets except goodwill, are amortised on a straight-line basis over their
useful lives (3 years) and tested for impairment annually and whenever events or changes in circumstances indicate that the
carrying amount may not be recoverable. Internally generated intangible assets, such as software development, are amortised over a period of 8 years.
The recoverable amount of an intangible asset is determined if there is indication of a reduction in the value of the asset. An
impairment loss is recognised if the carrying amount exceeds the recoverable amount of the asset.
1.14 Investment properties
Investments in properties held in order to receive rental income and/or for capital appreciation are reported as investment
properties. Investment property is initially measured at its cost, including transaction costs. Subsequent to initial recognition,
investment property is measured at historical cost less accumulated depreciation and impairment losses. If any indication exists
that investment properties may be impaired, the Group and Bank estimates the recoverable amount as the higher of value in use and fair value less costs to sell. The carrying amount of an investment property is written down to its recoverable amount through
a charge to profit or loss for the year. An impairment loss recognised in prior years is reversed if there has been a subsequent
change in the estimates used to determine the asset’s recoverable amount. Subsequent expenditure is capitalised only when it is
probable that future economic benefits associated with will flow to the Group and Bank and the cost can be measured reliably.
All other repairs and maintenance costs are expensed when incurred. If an investment property becomes owner-occupied, it is
reclassified to premises and equipment.
Expected useful lives of the investment property groups – between 25-50 years.
AB SEB bankas
NOTES TO THE FINANCIAL STATEMENTS
FOR THE YEAR ENDED 31 DECEMBER 2020
(All amounts in EUR thousand unless otherwise stated)
Page 38 of 113
1. SIGNIFICANT ACCOUNTING POLICIES (CONTINUED)
1.15 Impairment of non-financial assets
Assets that are subject to amortisation and depreciation are reviewed for impairment whenever events or changes in
circumstances indicate that the carrying amount may not be recoverable. In such circumstances, the recoverable value of the asset
is assessed and compared to its carrying value. An impairment loss is recognised for the amount by which the asset’s carrying amount exceeds its recoverable amount. The recoverable amount is the higher of an asset’s fair value less costs to sell and value
in use. For the purposes of assessing impairment, assets are grouped at the lowest levels for which there are separately
identifiable cash flows. Non-financial assets other than goodwill that suffered impairment are reviewed for possible reversal of
the impairment at each reporting date.
1.16 Leasing
1.16.1 The Group and the Bank as lessor
The receivables from the financial lease agreements are recognised in net present value of the minimum lease payments, from
which the payments of principal received have been deducted, plus unguaranteed residual value at the end of contract. Lease payments collected are allocated between repayment of principal and financial income. Financial income is recognised over the
rental period based on the pattern reflecting a constant periodic rate of return on the lessor’s net investment in the financial lease.
Initial service fees collected at issuance are included into the calculation of effective interest rate and lessor’s net investment.
Lessor’s direct expenses, related to the contract, are part of effective interest rate and are booked as decrease of leasing income over the period of leasing contract. Allowances for lease receivables are presented on the respective line of statement of financial
position at negative value.
The lease receivable from the client is recognised in the statement of financial position as of the moment of delivering the assets
being the object of the agreement to the client. In case of transactions, in which the assets being the object of the agreement having a long delivery term have not yet been delivered to the client, the payments received from the lessees under these agreements
are recognised in the statement of financial position as prepayments of buyers in line “Other liabilities”. The amounts paid by the
leasing firm for the assets under lease agreements not yet delivered are recognised in the statement of financial position as
prepayments to suppliers on the line “Other assets”.
1.16.2 The Group and the Bank as lessee
Leases are recognised as a right-of-use asset and a corresponding liability at the date at which the leased asset is available for use
by the Group and the Bank. Each lease payment is allocated between the liability and finance cost. The finance cost is charged to
the income statement over the lease period so as to produce a constant periodic rate of interest on the remaining balance of the liability for each period. The lease payments are discounted using the interest rate implicit in the lease, if that rate can be
determined, or the Group’s and the Bank’s incremental borrowing rate. The right-of-use asset is depreciated over the shorter of
the asset's useful life and the lease term on a straight-line basis. The lease payments include fixed payments less any lease
incentives receivable and variable lease payments that depend on an index or a rate.
The Group and the Bank have elected not to recognize right-of-use assets and lease liabilities for short-term leases that have a
lease term of 12 months or less and leases for low-value assets. The Group and the Bank recognize the lease payments associated
with these leases as an expense on a straight-line basis over the lease term.
1.17 Provisions
Provisions are recognised for present obligations arising as consequences of past events where it is more likely than not that a
transfer of economic benefit will be necessary to settle the obligation, and it can be reliably estimated.
Provisions are determined by discounting the expected future cash flows at pre-tax rate that reflects current market assessments
of the time value of money and, where appropriate, the risks specific to the liability.
Provisions are made for undrawn loan commitments and similar facilities if it is probable that the facility will be drawn by a debtor
in financial difficulties. ECLs on loan commitments and financial guarantee contracts are presented as provisions. Provisions and
changes in provisions are recognised in the income statement as Net credit losses.
Provisions are evaluated at each reporting date and are adjusted as necessary.
AB SEB bankas
NOTES TO THE FINANCIAL STATEMENTS
FOR THE YEAR ENDED 31 DECEMBER 2020
(All amounts in EUR thousand unless otherwise stated)
Page 39 of 113
1. SIGNIFICANT ACCOUNTING POLICIES (CONTINUED)
1.18 Operating income
1.18.1 Interest income and interest expenses
The effective interest method is applied to recognise interest income and interest expenses in profit or loss for financial assets and
financial liabilities measured at amortised cost.
The effective interest method is a method of calculating the amortised cost of a financial asset or a financial liability and of
allocating interest income and interest expenses. The effective interest rate is the rate that discounts estimated future cash
payments or receipts through the expected life of the financial instrument to the net carrying amount of the financial instrument.
The calculation of the effective interest rate includes transaction costs, fees to be received and paid that are an integral part of the effective interest rate. However, expected credit losses are not taken into account.
If a financial asset subsequently has become credit impaired the interest income is recognised applying the effective interest rate
to the amortised cost, i.e. gross carrying amount adjusted for the loss allowance. In case a financial asset is credit-impaired at initial
recognition, the expected credit losses are included in the estimated cash flows to calculate a credit adjusted effective interest rate, which then is applied to recognise the interest income.
1.18.2 Fee and commission income
The recognition of revenue from contracts with customers is reported as fee and commission income. This does not apply for
revenue from leasing contracts or financial instruments and other contractual obligations within the scope of IFRS 9 Financial Instruments.
Fees that are included in the calculation of the effective interest rate of a financial instrument measured at amortised cost, such
as loan origination fees, are allocated over the expected tenor of the instrument applying the effective interest method and
presented in Net Interest income.
Fee and commission income is recognised to depict the transfer of promised services to the customers in an amount that reflects
the consideration to which SEB expects to be entitled in exchange for the service. Group’s and Bank’s revenue contracts do not
typically include multiple performance obligations. The major types of fees by timing of revenue recognition are described below.
Fee and commission income from services where performance obligations are satisfied over time
Performance obligations are satisfied over time where the customer simultaneously receives and consumes the benefits provided
by the Group's and Bank’s performance as the Group and the Bank performs.
Securities revenue: revenue from asset management, custody and advisory services is recognized over time. Performance based
fees are recognised when it is highly probable that a significant reversal of recognised revenue will not occur, which is when the performance criteria are fulfilled.
Deposit revenue: fee income charged for the current account handling is recognized over time.
Payment revenue: payment service plans fee, subscription fees are recognized over time.
Lending revenue: commitment fees related to the undrawn portion of the loan commitment and, as such, change based on the portion of the unused commitment at that time. In such circumstances, the fee is not related to the amount being lent, but relates
to a service being provided by the Group and the Bank, and is accounted for as a service over time in accordance with IFRS 15.
Guarantees revenue: income from issued financial guarantees is amortised over the duration of the instrument and recognized over
time.
Fee and commission income from providing services where performance obligations are satisfied at a point in time
Services provided where the Group's and Bank’s performance obligations are satisfied at a point in time are recognized once
control of the services is transferred to the customer. This is typically on completion of the underlying transaction or service.
Card payments revenue: fee income from cards transactions, interchange fees, income from cash management activities is generally recognized when the service is provided.
Payments revenue: income from money transfer services is recognized at the time of transaction.
AB SEB bankas
NOTES TO THE FINANCIAL STATEMENTS
FOR THE YEAR ENDED 31 DECEMBER 2020
(All amounts in EUR thousand unless otherwise stated)
Page 40 of 113
1. SIGNIFICANT ACCOUNTING POLICIES (CONTINUED)
1.18.2 Fee and commission income (continued)
Other revenue: other fees and commissions are mainly recognized at point in time, when control of the service is transferred to the
customer.
Expenses that are directly related to the generation of fee and commission income are recognised as fee and commission expense.
1.18.3 Net financial income
Gains and losses arising from changes in fair value of financial assets and liabilities measured at fair value through profit or loss
are reported under the item Net financial income.
1.18.4 Dividend income
Dividends are recognised when the entity’s right to receive payment is established.
1.19 Employee benefits
1.19.1 Short-term benefits
Liabilities for wages and salaries, including non-monetary benefits, annual leave and accumulating sick leave that are expected to be settled wholly within 12 months after the end of the period in which the employees render the related service are recognised
in respect of employees’ services up to the end of the reporting period and are measured at the amounts expected to be paid when
the liabilities are settled. The liabilities are presented as Accrued expenses and prepaid income in the statement of financial
position.
1.19.2 Termination benefits
Termination benefits are payable whenever an employee’s employment is terminated before the normal retirement date or
whenever an employee accepts voluntary redundancy in exchange for these benefits. The Group and the Bank recognize
termination benefits when it is demonstrably committed either to terminate the employment of current employees according to a detailed formal plan without possibility of withdrawal or to provide termination benefits as a result of an offer made to encourage
voluntary redundancy.
1.19.3 Defined contribution plans
The Group and the Bank is paying into the defined contribution plans or life insurance contracts on behalf of its employees. A defined contribution plan is a pension plan where the Group and the Bank pays a contribution to SEB Life and Pension Baltic SE
Lithuanian branch and has no further obligation once the contribution is paid. Pension costs for defined contribution plans of life
insurance premiums are recognised as an expense during the period the employees carry out the service to which the payment
relates.
1.19.4 Share-based payments
The Group and the Bank operate a number of share-based incentive programmes based on Skandinaviska Enskilda Banken AB
(publ) shares, under which it awards SEB equity instruments to its employees. Only key persons can participate in those
programmes. The programmes, referred to above, are the Share Deferral Program (SDP) and Share Matching Program (SMP). Equity-settled share-based incentive programmes entitle employees to receive SEB equity instruments. Cash-settled share-based
incentive programmes entitle employees to receive cash based on the price or value of equity instruments of SEB. Fair value of
these rights is determined by using appropriate valuation models, taking into account the terms and conditions of the award and
the Group’s and the Bank’s estimate of the number of rights that will eventually vest, which is reassessed at each reporting date. Social security costs, if applicable, are accounted for over the vesting period and the provision for social security costs is
reassessed on each reporting date to ensure that the provision is based on the rights’ fair value at the reporting date. The recording
of expenses will last until the end of the qualification period of the respective programs.
The cost of equity-settled share-based incentive programmes is measured by reference to the fair value of equity instruments on the date they are granted and recognised as an expense on a straight-line basis over the vesting period with a corresponding
increase in equity. The vesting period is the period that the employees have to remain in service in SEB in order for their rights to
vest. For cash-settled share-based incentive programmes, the services acquired, and liability incurred are measured at the fair
value of the liability and recognised as an expense over the vesting period, during which the employees render service. Until settlement, the fair value of the liability is remeasured, with changes in fair value recognised in the income statement.
AB SEB bankas
NOTES TO THE FINANCIAL STATEMENTS
FOR THE YEAR ENDED 31 DECEMBER 2020
(All amounts in EUR thousand unless otherwise stated)
Page 41 of 113
1. SIGNIFICANT ACCOUNTING POLICIES (CONTINUED)
1.20 Taxes
The Group’s and the Bank’s tax for the period consists of current and deferred tax. Current tax assets and liabilities for the current
and prior periods are measured at the amount expected to be paid to or from tax authorities using the tax rates and tax laws that
have been enacted or substantively enacted at the reporting date. Current tax is calculated based on the taxable results for the period. Deferred tax arises due to temporary differences between the tax bases of assets and liabilities and their carrying amounts.
Current tax and deferred tax are generally recognised in profit or loss. However, tax that relates to items recognised in other
comprehensive income is also reported directly in other comprehensive income. Deferred tax assets are recognised in the
statement of financial position to the extent that it is probable that future taxable profits will be available, against which they can be utilized.
1.21 Fiduciary activities
The Group and the Bank provides asset management services and offers fund management services. The assets owned by third
parties, but managed by the Group and the Bank, and income arising thereon, are excluded from these financial statements, as they are not assets of the Group and the Bank. Assets managed by the Group and the Bank and commissions received from
fiduciary activities are disclosed in Note 32. Commission income is presented in fee and commission income.
1.22 Share capital, equity reserves and dividends
Ordinary shares are classified as equity. Incremental costs directly attributable to the issue of new shares are shown in equity as a deduction, net of tax, from the proceeds. Any excess of the fair value of consideration received over the par value of shares
issued is recorded as share premium in equity.
The reserves recorded in equity on the Group’s and Bank’s statement of financial position include:
Reserve capital
Reserve capital, in accordance with the legislation for banks operating in Lithuania, can only be offset with the future losses or
used for the increase of share capital.
Legal reserve
Legal reserve, in accordance with the legislation for banks operating in Lithuania can only be offset with the future losses. Annual contributions in amount not less than 1/20 per cent of distributable profit are mandatory according to the Law on Banks of the
Republic of Lithuania.
General and other reserves
General and other reserves represent general reserve for possible losses, that can only be offset with the current losses, and share based compensation reserve , that will be paid in the share capital equivalent of Skandinaviska Enskilda Banken AB (publ) Class A
shares to employees participating in the share based premium program.
Dividends are recorded in equity in the period in which they are declared. Any dividends declared after the end of the reporting
period and before the financial statements are authorised for issue, are disclosed in the subsequent events note.
1.23 Adoption of new and revised standards and interpretations
1.23.1 Standards and interpretations effective for annual periods beginning on or after 1 January 2020
Conceptual Framework in IFRS standards. The IASB issued the revised Conceptual Framework for Financial Reporting on 29 March
2018. The Conceptual Framework sets out a comprehensive set of concepts for financial reporting, standard setting, guidance for preparers in developing consistent accounting policies and assistance to others in their efforts to understand and interpret the
standards. IASB also issued a separate accompanying document, Amendments to References to the Conceptual Framework in
IFRS Standards, which sets out the amendments to affected standards in order to update references to the revised Conceptual
Framework. Its objective is to support transition to the revised Conceptual Framework for companies that develop accounting policies using the Conceptual Framework when no IFRS Standard applies to a particular transaction. For preparers who develop
accounting policies based on the Conceptual Framework, it is effective for annual periods beginning on or after 1 January 2020.
Management has assessed, that there is no material effect on the financial statements of the Group and the Bank.
AB SEB bankas
NOTES TO THE FINANCIAL STATEMENTS
FOR THE YEAR ENDED 31 DECEMBER 2020
(All amounts in EUR thousand unless otherwise stated)
Page 42 of 113
1. SIGNIFICANT ACCOUNTING POLICIES (CONTINUED)
1.23.1 Standards and interpretations effective for annual periods beginning on or after 1 January 2020 (continued)
IFRS 3: Business Combinations (Amendments). The IASB issued amendments in Definition of a Business (Amendments to IFRS 3)
aimed at resolving the difficulties that arise when an entity determines whether it has acquired a business or a group of assets.
The Amendments are effective for business combinations for which the acquisition date is in the first annual reporting period beginning on or after 1 January 2020 and to asset acquisitions that occur on or after the beginning of that period, with earlier
application permitted. Management has assessed, that there is no material effect on the financial statements of the Group and the
Bank.
IAS 1 Presentation of Financial Statements and IAS 8 Accounting Policies, Changes in Accounting Estimates and Errors: Definition of ‘material’ (Amendments). The Amendments are effective for annual periods beginning on or after 1 January 2020 with earlier
application permitted. The Amendments clarify the definition of material and how it should be applied. The new definition states
that, ’Information is material if omitting, misstating or obscuring it could reasonably be expected to influence decisions that the
primary users of general-purpose financial statements make on the basis of those financial statements, which provide financial information about a specific reporting entity’. In addition, the explanations accompanying the definition have been improved. The
Amendments also ensure that the definition of material is consistent across all IFRS Standards. Management has assessed, that
there is no material effect on financial statements of the Group and the Bank.
Interest Rate Benchmark Reform - IFRS 9, IAS 39 and IFRS 7 (Amendments). In September 2019, the IASB issued amendments to IFRS 9, IAS 39 and IFRS 7, which concludes phase one of its work to respond to the effects of Interbank Offered Rates (IBOR)
reform on financial reporting. The amendments published, deal with issues affecting financial reporting in the period before the
replacement of an existing interest rate benchmark with an alternative interest rate and address the implications for specific
hedge accounting requirements in IFRS 9 Financial Instruments and IAS 39 Financial Instruments: Recognition and Measurement, which require forward-looking analysis. The amendments provide temporary reliefs, applicable to all hedging relationships that
are directly affected by the interest rate benchmark reform, which enable hedge accounting to continue during the period of
uncertainty before the replacement of an existing interest rate benchmark with an alternative nearly risk-free interest rate. There
are also amendments to IFRS 7 Financial Instruments: Disclosures regarding additional disclosures around uncertainty arising from the interest rate benchmark reform. The amendments are effective for annual periods beginning on or after 1 January 2020 and
must be applied retrospectively. Phase two (ED) focuses on issues that could affect financial reporting when an existing interest
rate benchmark is replaced with a risk-free interest rate (an RFR). Management has assessed, that there is no material effect on
financial statements of the Group and the Bank.
There are no other new or revised standards or interpretations have that are effective for the first time for the financial year
beginning on or after 1 January 2020 that would be expected to have material impact to the Group and the Bank.
1.23.2 New accounting pronouncements
Certain new or revised standards and interpretations have been issued that are mandatory for the Group’s and the Bank’s annual periods beginning on or after 1 January 2021 and which the Group and the Bank have not early adopted.
Amendment in IFRS 10 Consolidated Financial Statements and IAS 28 Investments in Associates and Joint Ventures: Sale or
Contribution of Assets between an Investor and its Associate or Joint Venture. The amendments address an acknowledged
inconsistency between the requirements in IFRS 10 and those in IAS 28, in dealing with the sale or contribution of assets between an investor and its associate or joint venture. The main consequence of the amendments is that a full gain or loss is recognized
when a transaction involves a business (whether it is housed in a subsidiary or not). A partial gain or loss is recognized when a
transaction involves assets that do not constitute a business, even if these assets are housed in a subsidiary. In December 2015
the IASB postponed the effective date of this amendment indefinitely pending the outcome of its research project on the equity method of accounting. The amendments have not yet been endorsed by the EU. Management is assessing if there will be a material
effect on the financial statements of the Group and the Bank.
IAS 1 Presentation of Financial Statements: Classification of Liabilities as Current or Non-current (Amendments). The amendments are
effective for annual reporting periods beginning on or after January 1, 2022 with earlier application permitted. However, in response to the COVID-19 pandemic, the IASB has deferred the effective date by one year, i.e. 1 January 2023, to provide
companies with more time to implement any classification changes resulting from the amendments. The amendments aim to
promote consistency in applying the requirements by helping companies determine whether, in the statement of financial position,
debt and other liabilities with an uncertain settlement date should be classified as current or non-current. The amendments affect the presentation of liabilities in the statement of financial position and do not change existing requirements around measurement
or timing of recognition of any asset, liability, income or expenses, nor the information that entities disclose about those items. Also,
the amendments clarify the classification requirements for debt which may be settled by the company issuing own equity
instruments. These Amendments have not yet been endorsed by the EU. Management is assessing if there will be a material effect on the financial statements of the Group and the Bank.
AB SEB bankas
NOTES TO THE FINANCIAL STATEMENTS
FOR THE YEAR ENDED 31 DECEMBER 2020
(All amounts in EUR thousand unless otherwise stated)
Page 43 of 113
1. SIGNIFICANT ACCOUNTING POLICIES (CONTINUED)
1.23.2 New accounting pronouncements (continued)
IFRS 3 Business Combinations; IAS 16 Property, Plant and Equipment; IAS 37 Provisions, Contingent Liabilities and Contingent Assets
as well as Annual Improvements 2018-2020 (Amendments). The amendments are effective for annual periods beginning on or
after 1 January 2022 with earlier application permitted. The IASB has issued narrow-scope amendments to the IFRS Standards as follows:
- IFRS 3 Business Combinations (Amendments) update a reference in IFRS 3 to the Conceptual Framework for Financial
Reporting without changing the accounting requirements for business combinations.
- IAS 16 Property, Plant and Equipment (Amendments) prohibit a company from deducting from the cost of property, plant and equipment amounts received from selling items produced while the company is preparing the asset for its intended use.
Instead, a company will recognise such sales proceeds and related cost in profit or loss.
- IAS 37 Provisions, Contingent Liabilities and Contingent Assets (Amendments) specify which costs a company includes in
determining the cost of fulfilling a contract for the purpose of assessing whether a contract is onerous. - Annual Improvements 2018-2020 make minor amendments to IFRS 1 First-time Adoption of International Financial
Reporting Standards, IFRS 9 Financial Instruments, IAS 41 Agriculture and the Illustrative Examples accompanying IFRS 16
Leases.
The amendments have not yet been endorsed by the EU. Management is assessing if there will be a material effect on the financial statements of the Group and the Bank.
IFRS 16 Leases-COVID 19 Related Rent Concessions (Amendment). The amendment applies, retrospectively, to annual reporting
periods beginning on or after 1 June 2020. Earlier application is permitted, including in financial statements not yet authorized for
issue at 28 May 2020. IASB amended the standard to provide relief to lessees from applying IFRS 16 guidance on lease modification accounting for rent concessions arising as a direct consequence of the COVID-19 pandemic. The amendment provides
a practical expedient for the lessee to account for any change in lease payments resulting from the COVID-19 related rent
concession the same way it would account for the change under IFRS 16, if the change was not a lease modification, only if all of
the following conditions are met:
- The change in lease payments results in revised consideration for the lease that is substantially the same as, or less than, the
consideration for the lease immediately preceding the change.
- Any reduction in lease payments affects only payments originally due on or before 30 June 2021.
- There is no substantive change to other terms and conditions of the lease.
Management is assessing if there will be a material effect on the financial statements of the Group and the Bank.
Interest Rate Benchmark Reform – Phase 2 – IFRS 9, IAS 39, IFRS 7, IFRS 4 and IFRS 16 (Amendments). In August 2020, the IASB
published Interest Rate Benchmark Reform – Phase 2, Amendments to IFRS 9, IAS 39, IFRS 7, IFRS 4 and IFRS 16, completing its
work in response to IBOR reform. The amendments provide temporary reliefs which address the financial reporting effects when an interbank offered rate (IBOR) is replaced with an alternative nearly risk-free interest rate (RFR). In particular, the amendments
provide for a practical expedient when accounting for changes in the basis for determining the contractual cash flows of financial
assets and liabilities, to require the effective interest rate to be adjusted, equivalent to a movement in a market rate of interest.
Also, the amendments introduce reliefs from discontinuing hedge relationships including a temporary relief from having to meet the separately identifiable requirement when an RFR instrument is designated as a hedge of a risk component. Furthermore, the
amendments to IFRS 4 are designed to allow insurers who are still applying IAS 39 to obtain the same reliefs as those provided by
the amendments made to IFRS 9. There are also amendments to IFRS 7 Financial Instruments: Disclosures to enable users of
financial statements to understand the effect of interest rate benchmark reform on an entity’s financial instruments and risk management strategy. The amendments are effective for annual periods beginning on or after 1 January 2021 with earlier
application permitted. While application is retrospective, an entity is not required to restate prior periods. Management is assessing
if there will be a material effect on the financial statements of the Group and the Bank.
AB SEB bankas
NOTES TO THE FINANCIAL STATEMENTS
FOR THE YEAR ENDED 31 DECEMBER 2020
(All amounts in EUR thousand unless otherwise stated)
Page 44 of 113
1.24 Critical accounting estimates and judgements in applying accounting policies
1.24.1 Expected credit loss model
When calculating expected credit loss (ECL) there are a number of key concepts that require a high level of judgement. Estimating
expected credit loss is, by its very nature, uncertain and the accuracy of these estimates depends on many factors, e.g. macroeconomic forecasts and involves complex modelling and judgements. At the end of each reporting period the Group and the
Bank performs an assessment of whether credit risk has increased significantly since initial recognition by considering the change
in the risk of default occurring over the remaining life of the financial instrument, using key risk indicators that are used in the
Group’s and Bank’s existing risk management processes. Another area requiring significant judgement is the incorporation of forward-looking information and macroeconomic scenarios. IFRS 9 requires an unbiased and probability-weighted estimate of
credit losses by evaluating a range of possible outcomes that incorporates forecasts of future economic conditions. SEB Group
uses internally developed macroeconomic forecasts as the basis for the forward-looking information in the ECL measurement. SEB
Group uses both models and expert credit judgement (ECJ) in order to determine ECLs. The objective of applying ECJ is to incorporate the estimated impact of factors not captured in the modelled ECL. The degree of judgement that is required to estimate
expected credit losses depends on the outcome from calculations, materiality and the availability of detailed information. The
models, assessment and assumptions are regularly reviewed by the risk organization of the SEB Group and approved by the SEB
Group Risk Committee. The assumptions and sensitivity analysis are further described in Note 2.1.
1.24.2 Fair value of derivatives
The fair values of financial derivatives that are not quoted in active markets are determined by using valuation techniques. All such
not quoted derivative financial transactions are entered with third parties and mirror transactions are entered with SEB Group.
Where valuation techniques (for example, models) are used to determine fair values, they are validated and periodically reviewed by qualified personnel independent of the area that created them. All models are certified before they are used, and models are
calibrated to ensure that outputs reflect actual data and comparative market prices. For pricing of options Black-Scholes model is
used, with only observable market data (e.g. historical volatility, market interest rates, market prices). Further details of major
assumptions of fair values of derivatives provided in the Note 3 Fair value measurement of assets and liabilities.
AB SEB bankas
NOTES TO THE FINANCIAL STATEMENTS
FOR THE YEAR ENDED 31 DECEMBER 2020
(All amounts in EUR thousand unless otherwise stated)
Page 45 of 113
2. RISK POLICY AND MANAGEMENT
The Group and the Bank define risk as the possibility of a negative deviation from an expected financial outcome. Group’s and
Bank’s profitability is directly dependent upon its ability to evaluate, manage and price the risks encountered, while maintaining
an adequate capital and liquidity position to meet unforeseen events. The Supervisory Board is responsible for setting the
maximum acceptable levels of risks to be taken by the bank. The risk tolerance statements convey the direction and level of risk, funding structure, and necessary liquidity and capital buffers.
The Group’s and Bank’s main risk is credit risk. Other risks include market risk, operational risk, business risk, and liquidity risk. In
order to cover the risks, the Group and the Bank hold a capital buffer and liquidity reserves in case of unforeseen events. The Group
and the Bank strive to continuously identify and manage risks in their operations, both existing and emerging risks, in a designated risk management process. The aggregate risk profile of the Group and the Bank are regularly monitored and reported to the
management bodies. In the annual capital adequacy process, the capital needs are evaluated based on the risk profile and future
business strategy, taking into consideration the financial stability requirements of the regulators, debt investors, business
counterparties and shareholders ’required rate of return.
AB SEB bankas
NOTES TO THE FINANCIAL STATEMENTS
FOR THE YEAR ENDED 31 DECEMBER 2020
(All amounts in EUR thousand unless otherwise stated)
Page 46 of 113
2. RISK POLICY AND MANAGEMENT (CONTINUED)
Risk profile
Risk type Risk tolerance statements in brief
SEB Bankas Group shall
2020 development and position
Credit risk and asset quality
Have a robust credit culture based on long-term relationships, knowledge about the
customers and focus on their repayment
ability. This will lead to a high-quality credit
portfolio.
• The Group and the Bank have a wellbalanced credit portfolio with main
exposure to corporates and households in
Lithuania.
• Despite COVID-19 pandemic credit portfolio quality remained strong.
• The Group and the Bank strengthened
monitoring of credit metrics.
• To accommodate potential losses from pandemic the Group and the Bank has
accounted for additional provisions.
Market risk Achieve low earnings volatility by
generating revenues based on customer-
driven business.
• Market risk arises in SEB's customer-
driven trading activity and its liquidity
portfolio. Generally, Group's and Bank’s market risk is low.
• Interest rate risk arises due to mismatches
in rates and maturities in the bank's assets
and liabilities and is managed by the Treasury function.
Operational and
reputational risk
Strive to mitigate operational risks in all
business activities and maintain the bank’s
reputation.
• Continuously working to maintain an
effective internal control framework and
ensure a structured and consistent usage of risk mitigating tools and processes for all
identified operational risks.
• Managing and mitigating IT, cyber and
information risks are key priorities to ensure secure and available information, services
and products for customers.
• To manage effects from COVID-19
pandemic additional business continuity measures were implemented, including
critical function physical split and adjusted
service model.
Liquidity and funding
risk
Have a soundly structured liquidity
position and sufficient liquid reserves to meet potential net outflows in a stressed
scenario.
• Strong liquidity position, large buffers
above regulatory ratios
• Group’s and Bank’s primary funding
sources are customer deposits and
wholesale funding.
Aggregated risk and
capital adequacy
Maintain satisfactory capital strength in
order to sustain aggregated risks and guarantee the bank’s long-term survival and
its position as a financial counterparty, while
operating within regulatory requirements.
• The Group and the Bank are strongly
capitalised in relation to regulatory capital requirements.
• The aim is to hold a capital adequacy
buffer of around 100 basis points above the
regulatory requirement.
AB SEB bankas
NOTES TO THE FINANCIAL STATEMENTS
FOR THE YEAR ENDED 31 DECEMBER 2020
(All amounts in EUR thousand unless otherwise stated)
Page 47 of 113
2. RISK POLICY AND MANAGEMENT (CONTINUED)
2.1 Credit risk
Definition
Credit risk is the risk of loss due to the failure of an obligor to fulfil its obligations towards the Group and the Bank. The definition
also comprises counterparty risk derived from the trading operations, country risk, settlement risk, and credit concentration risk.
Credit risk is the main risk in the Group and the Bank, which arises in the lending and commitments to customers, including
corporates, financial institutions, public sector entities and private individuals. This is referred to as the credit portfolio. Group’s
and Bank’s total credit exposure consists of the credit portfolio as well as debt instruments.
Risk management
Credit policies and approval process
The main principle in the Group’s and Bank’s credit policy is that all lending is based on credit analysis and is proportionate to the
customer’s cash flow and ability to repay. The customer shall be known by the bank and the purpose of the loan shall be fully
understood. The business units take full responsibility of the credit risk until repayment.
A credit approval is based on an evaluation of the customer’s creditworthiness and type of credit. Relevant factors include the
customer’s current and anticipated financial position and protection provided by covenants and collateral. A credit approval takes
the proposed transaction into account as well as the customer’s total business with the bank. The credit decision also includes a
risk classification of the customer based on this analysis. The process differs depending on the type of customer (e.g., retail, corporate or institutional), risk level, and size and type of transaction. For larger corporate customers, independent and
professional credit analysis is particularly important, and decisions are mostly taken by a credit committee. For households and
small businesses, the credit approval is often based on credit scoring models. Deciding on the risk taking is performed collegially
by credit committees or by the authorised persons in accordance with the decision-making limits established by the bank’s management.
The Group’s and Bank’s credit policies reflect the Group’s and Bank’s approach to sustainability as described in the Corporate
Sustainability Policy, the Environmental Policy, the Human Rights Policy, and the Credit Policy on Corporate Sustainability. Position
statements on climate change, child labour and access to fresh water as well as number of industry sector policies shall be considered in the credit granting process and are also used in customer dialogues. Environmental, social and governance risks shall
be considered in the credit analysis.
Risk mitigation
In order to reduce the credit risk, a number of credit risk mitigation techniques are used. The method used depends on its suitability for the product and the customer in question, its legal enforceability, and on the Group’s and the Bank’s experience and capacity
to manage and control the particular technique. The most important credit risk mitigation techniques are collateral pledges and
guarantees. The most common types of pledges are real estate, floating charges (commercial pledge – account receivables,
inventories, machinery, equipment and vehicles) and financial securities. The main guarantors are state, municipalities and credit institutions whose creditworthiness is assessed by the same methods and the frequency as the same customer group borrower’s
creditworthiness. For large corporate customers, credit risk is often mitigated by the use of covenants.
The Group’s and the Bank’s policies regarding obtaining collateral have not significantly changed during the reporting period and
there has been no significant change in the overall quality of the collateral held by the Group and the Bank since the prior period.
Limits and monitoring
To manage the credit risk for individual customers or customer groups, a limit is established that reflects the maximum exposure
that the Group and the Bank are willing to accept.
The Group and the Bank continuously review the quality of its credit exposures. All limits and risk classes are reviewed at least annually by a credit approval body (a credit committee consisting of at least two bank officers as authorised by the Credit
Instruction, adopted by the Management Board).
For regular monitoring of private individuals and small corporates - retail portfolio - the behavioural scoring models are in use. The
models are based on the application scoring models used in loans analysis process. Client executives have an obligation to update financials of small corporates at least once a year. Behavioural score is calculated quarterly for all private individuals and small
corporates loans.
Client executives have an obligation to review collateral values at least once a year and update if necessary. Collateral values of
real estate are being adjusted with indexes calculated in-house based on transaction statistics of Centre of Registry.
AB SEB bankas
NOTES TO THE FINANCIAL STATEMENTS
FOR THE YEAR ENDED 31 DECEMBER 2020
(All amounts in EUR thousand unless otherwise stated)
Page 48 of 113
2. RISK POLICY AND MANAGEMENT (CONTINUED)
2.1 Credit risk (continued)
Weak or impaired exposures are subject to more frequent reviews. The objective is to identify credit exposures with an elevated
risk of loss at an early stage and to work together with the customer towards a solution that enables the customer to meet its
financial obligations and the Group and the Bank to avoid or limit credit losses. Problem exposures and recovering written-off loans are handled by Special Credit Management Division by using several methods: negotiations with clients, rehabilitation, execution,
bankruptcy proceedings. Special Credit Management Division specialists are involved with problem loans (or potential problem
loans) at the early stage to ensure most valuable outcome for both the client and the bank.
Allowances are made for expected credit losses of financial assets in scope of the accounting standard IFRS 9 Financial Instruments. The guiding principle of the expected credit loss model is to reflect the general pattern of deterioration or
improvement in the credit quality of the assets.
Loans where the contractual terms have been amended in favour of the customer due to financial difficulties are referred to as
forborne loans. Forbearance measures range from amortisation holidays (the most common measure) to refinancing with new terms and debt forgiveness. A relevant credit approval body shall approve the forbearance measures as well as the classification
of the loan as being forborne or not.
Credit portfolio analysis and stress tests
The risk organisation regularly reviews and assesses the aggregate credit portfolio based on industry, geography, risk class, product type, size and other parameters. Risk concentrations in geographic and industry sectors as well as in large single names
are thoroughly analysed, both in respect of direct and indirect exposures and in the form of collateral, guarantees and credit
derivatives.
Stress tests of the credit portfolio, including reverse stress tests, are performed regularly as a part of the Group’s and the Bank’s annual internal capital adequacy assessment process. Specific analyses and stress tests of certain sectors or sub-portfolios are
performed as required.
Risk measurement
Credit risk is measured for all exposures, both in the banking book and the trading book.
The Group and the Bank divide loan portfolio into two broad segments:
1) non-retail portfolio including loans to legal entities belonging to counterparty group’s with credit risk assumed by the Group and
the Bank exceeding 500 000 euros (500 000); and
2) retail portfolio consisting of small businesses’ and private individuals’ sub-segments.
An internal ratings-based (IRB) risk classification system approved by the regulator is used for the majority of the Group’s and the
Bank’s portfolios and reflects the risk of default on payment obligations. The Group and the Bank received approval for a significant
amendment of its risk classification system for the non-retail portfolio in January 2019 and it was implemented in February 2020.
For significant corporate portfolios, the risk classification system contains specific rating tools and PD (probability of default) scales. Larger and mid-sized counterparties are measured on a risk class scale of 1–16, while Small and Medium-sized Enterprises
(SMEs) are measured on a scale of 1–12. According to the previously used risk classification system also Small and Medium-sized
Enterprises (SMEs) were measured on a scale of 1–16 as described in previous year’s annual report. Defaulted counterparties are
given the highest risk class, and the three risk classes prior to default are defined as “watch list”. For each risk class scale, the Group and the Bank makes individual one-year, through-the-cycle probability of default estimates, which are based on more than
20 years of internal and external data.
For private individuals and small businesses, the Group and the Bank uses credit scoring systems to estimate PD for the customer.
The scoring model for small businesses considers financial condition based on last two annual reports, credit history with the bank and based on external credit history register, experience of the customer. The outcome of the scoring model is credit score,
expressing risk level and determining decision-making level. Depending on the score clients are divided into quality classes A, B, C
and D, where A is the best and D is the worst quality class. Customers with insufficient information for score calculation are included
to the worst quality class.
In analysing loans to private individuals, the credit scoring and left-to-live model (this measures the customer’s ability to service
the loan taking into account net income and cost of living) is used. The output of the model is credit score. Based on the score the
clients are divided into quality classes A, B, C, and D, where A is the best and D is the worst quality class.
AB SEB bankas
NOTES TO THE FINANCIAL STATEMENTS
FOR THE YEAR ENDED 31 DECEMBER 2020
(All amounts in EUR thousand unless otherwise stated)
Page 49 of 113
2. RISK POLICY AND MANAGEMENT (CONTINUED)
2.1 Credit risk (continued)
Counterparty risk in derivative contracts
The Group and the Bank enter into derivatives contracts primarily to support customers in the management of their financial
exposures and then normally manages the resulting positions by entering offsetting contracts with the parent company.
Counterparty credit risk in derivative contracts is the risk of a counterparty not living up to its contractual obligations where the
Group and the Bank have a claim on the counterparty. The claim on the counterparty corresponds to a net positive exposure in
favour of the Group and the Bank. Since the market value of a derivative fluctuates during the term to maturity, the uncertainty of
future market conditions must be taken into account and a credit risk equivalent is calculated.
Credit risk related to derivatives is presented in Note 3 Fair value measurement of assets and liabilities. So, in the Credit risk
chapter we concentrate on the credit risk arising from loans and receivables from customers and credit institutions (other credit
institutions).
Counterparty risk in derivative contracts affects the profit and loss through credit/debit valuation adjustments (CVA/DVA) reflecting the credit risk associated with derivative positions. These adjustments depend on market risk factors such as interest
rate, foreign exchange rates and credit spreads.
Measurement of ECL allowances
The Group and the Bank uses both models and expert credit judgement (ECJ) for calculating ECL allowances. The degree of judgement depends on model outcome, materiality and information available and ECJ may be applied to incorporate factors not
captured by the models. In 2020, ECJ was used to estimate model overlays to capture potential negative effects on the asset
quality arising from the uncertain economic outlook in light of the COVID-19-pandemic. The model overlays were determined
through top-down scenario analysis combined with bottom-up customer analysis of larger corporate customers and exposed sector analysis for other customer segments.
Key macroeconomic variable assumptions for calculating ECL allowances
The SEB Group uses internally developed macroeconomic forecasts as the basis for the forward-looking information incorporated
in the ECL measurement. In order to ensure an unbiased estimation of credit losses under IFRS 9, at least three scenarios are used with different probability weightings. One of the scenarios is the base case scenario, representing the most likely outcome, which
is also applied in the financial planning and budgeting process, while the other case scenarios represent more positive or negative
outcomes. The probability weights assigned to each scenario are determined using a combination of statistical analysis and expert
judgment. The scenarios are reviewed four times a year, or more frequently when appropriate due to rapid or significant changes in the economic environment.
The three scenarios that are currently used are based on different assumptions around how rapidly economies will reopen
following the pandemic, which may depend both on strategic trade-offs between medical and economic aspects, but also on the
continued spread of the coronavirus and the vaccination process. The base scenario assumes that the world must go through the winter without mass vaccinations and the risk of a worsening pandemic situation. Large scale vaccination is assumed to be
available during the second half of 2021, reducing the need for restrictions.
The most significant macroeconomic variable assumptions of the Base scenario used as at 31 December 2020, are set out below.
Individual scenarios for SEB’s home markets are used.
Source: SEB's Nordic Outlook from November 2020
Lithuania 2021 2022 2023
Domestic GDP growth 3.0% 3.3% 3.5%
Commercial real estate price growth 2.5% 3.0% 3.5%
Residential real estate price growth 5.0% 5.0% 5.0%
Nominal wage growth 4.5% 6.0% 4.5%
Inflation rate 2.0% 2.4% 2.5%
AB SEB bankas
NOTES TO THE FINANCIAL STATEMENTS
FOR THE YEAR ENDED 31 DECEMBER 2020
(All amounts in EUR thousand unless otherwise stated)
Page 50 of 113
2. RISK POLICY AND MANAGEMENT (CONTINUED)
2.1 Credit risk (continued)
The most significant assumptions affecting the ECL allowance of the non-retail, retail corporates and private individuals portfolios,
respectively, are as follows:
Non-retail and retail corporates portfolios:
(i) GDP impact on companies' performance
(ii) Commercial real estate price development impact on collateral valuations
Private individuals’ portfolios:
(i) Unemployment rate impact on borrowers' ability to meet their contractual repayments
(ii) Household consumption expenditure growth impact on borrowers' ability to meet their contractual obligations
(iii) Residential real estate price growth impact on mortgage collateral valuations
The positive scenario assumes that large scale vaccinations start early 2021 and are more effective or that economic policy
stimulus is more effective than estimated. The negative scenario reflects the risk that the pandemic will take off again during the
winter in such a severe way and that vaccines are not as effective so that new lockdowns and tougher restrictions are necessary resulting in a direct effect on GDP and severe negative impact on confidence both in the real economy and in financial markets.
In the calculation of ECL allowances as of 31 December 2020, the probabilities of the three scenarios were 55 per cent for the
base scenario, 20 per cent for the positive scenario, and 25 per cent for the negative scenario.
Sensitivity analysis of macroeconomic assumptions
In general, a worsening of the outlook on forecasted macroeconomic variables for each scenario or an increase in the probability
of the negative scenario occurring will both increase the number of loans migrating from Stage 1 to Stage 2 and increase the
estimated ECL allowances. On the other hand, an improvement in the outlook on forecasted macroeconomic variables or an
increase in the probability of the positive scenario occurring will have the opposite positive impact.
Should the positive and negative scenarios be assigned 100 per cent probability of occurring, the model calculated ECL allowances
would decrease by 3 per cent and increase by 4 per cent, respectively compared to the weighted scenario.
Key assumptions for triggering significant increase in credit risk (SICR)
For arrangements with initial origination date as at 1 January 2018 or later, the primary indicator is changes in lifetime probability
of default (PD) by comparing the scenario weighted annualised lifetime PD at the reporting date with the scenario weighted
annualised lifetime PD at initial recognition. For arrangements with an initial origination date prior to 1 January 2018 changes in SEB internal risk classification since initial origination are used as the primary indicator.
Quantitative measures for triggering significant increase in credit risk (SICR)
For arrangements originated prior to 1 January 2018
For arrangements originated on or after 1 January 2018
1) Placement of a financial asset on watch list automatically classifies it as a significant increase in credit risk and places it in Stage
2.
ECL allowances resulting
from scenario, thous. EUR
Difference from the
probability weighted
ECL allowances, %
Lithuania Negative scenario 67,859 4%
Positive scenario 63,037 -3%
AB SEB bankas
NOTES TO THE FINANCIAL STATEMENTS
FOR THE YEAR ENDED 31 DECEMBER 2020
(All amounts in EUR thousand unless otherwise stated)
Page 51 of 113
2. RISK POLICY AND MANAGEMENT (CONTINUED)
2.1 Credit risk (continued)
Regardless of the quantitative indicator, a significant increase in credit risk is triggered if the following back-stop indicators occur:
- payments are past due >30 days but < 90 days, or
- financial assets are forborne (where due to the customer’s financial difficulties the contractual terms of the loans have been revised and concessions given).
Back stop indicators normally overlap with the quantitative indicator of significant increase in credit risk.
Following the COVID-19 pandemic, governments have enabled measures to support corporates and private individuals. In line with
European Banking Authority’s (EBA) guidelines, such measures do not automatically trigger a significant increase in credit risk, and thereby a transfer to stage 2 and increased ECL allowances.
Concentration of financial assets, loan commitments and financial guarantees by economic sector
The Group and the Bank
2020
Balances with central bank, loans
to credit institutions, loans to the
public Debt securities
Loan commitments and
financial guarantees
Non-financial corporations
Agriculture, forestry and fishing 119,987 - 26,949
Mining and quarrying 4,288 - 10,247
Manufacturing 367,779 - 223,599
Electricity, gas, steam and air condition 161,403 - 301,464
Water supply 12,520 - 10,341
Construction 46,015 - 48,914
Wholesale and retail trade 603,892 - 697,090
Transport and storage 411,679 - 139,368
Accommodation and food service activities 37,823 - 288
Information and communication 34,005 - 15,201
Financial and insurance activities 4,759 - 10
Real estate activities 762,400 - 81,633
Professional, scientific and technical activities 26,879 - 44,071
Administrative and support service activities 79,498 - 30,307
Education 1,189 - 197
Human health services and social work activities 5,660 - 2,956
Arts, entertainment and recreation 4,922 - 110
Other services 12,368 - 9,715
Households 3,032,063 - 128,687
General governments 78,893 486,885 6,394
Credit institutions 1,886,403 - 84,961
Central banks 1,795,419 - -
Other financial corporations 2,466 - 720
Total as at 31 December 9,492,310 486,885 1,863,222
AB SEB bankas
NOTES TO THE FINANCIAL STATEMENTS
FOR THE YEAR ENDED 31 DECEMBER 2020
(All amounts in EUR thousand unless otherwise stated)
Page 52 of 113
2. RISK POLICY AND MANAGEMENT (CONTINUED)
2.1 Credit risk (continued)
Large exposures
Large exposures contain exposures due from central bank, central government, parent company of the bank and its subsidiaries
and other non-financial customers (loans, interests, securities, derivatives and off-balance sheet commitments, which may turn
into claims).
The Group and the Bank
2019
Balances with central bank, loans
to credit institutions, loans to the
public Debt securities
Loan commitments and
financial guarantees
Non-financial corporations
Agriculture, forestry and fishing 121,115 - 11,893
Mining and quarrying 7,409 - 8,903
Manufacturing 422,177 - 188,255
Electricity, gas, steam and air condition 325,849 839 144,637
Water supply 12,618 - 5,852
Construction 50,950 - 61,690
Wholesale and retail trade 890,460 - 437,671
Transport and storage 493,160 725 90,460
Accommodation and food service activities 38,480 - 1,003
Information and communication 49,718 - 15,678
Financial and insurance activities 4,952 - 286
Real estate activities 783,781 - 59,792
Professional, scientific and technical activities 16,802 - 38,751
Administrative and support service activities 92,227 - 27,879
Education 1,455 - 30
Human health services and social work activities 4,329 - 363
Arts, entertainment and recreation 5,486 - 74
Other services 14,295 - 9,487
Households 2,869,112 - 123,879
General governments 59,400 426,349 12,277
Credit institutions 65,584 - 28,737
Central banks 1,454,810 - -
Other financial corporations 2,876 1,392 3,109
Total as at 31 December 7,787,045 429,305 1,270,704
The Group
Number/Amount
% from net own
funds Number/Amount
% from net own
funds
Number of customers with large exposures 7 13
Due from customers with large exposures 762,973 93 1,214,405 158
762,973 93 1,214,405 158
Own funds included in calculation of capital adequacy 821,205 767,606
31/12/2020 31/12/2019
The Bank
Number/Amount
% from net own
funds Number/Amount
% from net own
funds
Number of customers with large exposures 7 13
Due from customers with large exposures 762,973 93 1,214,405 159
762,973 93 1,214,405 159
Own funds included in calculation of capital adequacy 817,104 763,383
31/12/2020 31/12/2019
AB SEB bankas
NOTES TO THE FINANCIAL STATEMENTS
FOR THE YEAR ENDED 31 DECEMBER 2020
(All amounts in EUR thousand unless otherwise stated)
Page 53 of 113
2. RISK POLICY AND MANAGEMENT (CONTINUED)
2.1 Credit risk (continued)
The following is exempted from large exposures:
- claims to the parent company of the bank and their subsidiaries in so far as they are covered by the supervision on a consolidated
basis to which the bank itself is subject in accordance with CRR (Capital Requirements Regulation) and if the requirements of the European Central Bank’s Regulation (EU) 2016/445 Article 9 Part 3 are fulfilled;
- due from central bank and central government authorities, which, unsecured, would be assigned a 0 per cent risk weight under
Part 3, Title II, Chapter 2 of CRR;
- other exposures according to CRR article 400.
Large credit risk exposure is defined by the Regulation No 575/2013 of the European Parliament and of the Council (CRR) and is
the total exposure of a client or group of connected clients to the Group and the Bank which exceeds 10 per cent of the group's
eligible capital, EUR 821,205 thousand as at 31 December 2020 (767,606), see Note 39. All instruments where credit risk may
arise to the Group are taken into consideration. The limit of the total exposure of one client or group of connected clients is 25 per cent of the Group’s eligible capital. Total exposure of any client or group of connected clients did not exceed the regulatory limit of
25 per cent of the capital in the Group.
Maximum exposure to credit risk before collateral held and other credit enhancements
31/12/2020 31/12/2019 31/12/2020 31/12/2019
Subject to ECL allowances:
Balances with the Central Bank 1,795,419 1,454,810 1,795,419 1,454,810
Loans to credit institutions 1,104,056 60,908 1,104,056 60,908
Loans to the public
General governments 78,893 59,400 78,893 59,400
Credit institutions 782,347 4,676 782,347 4,676
Other financial corporations 2,466 2,876 2,466 2,876
Other financial assets 22,991 30,399 23,154 30,622
Not subject to ECL allowances:
Debt securities 486,885 429,305 486,885 429,305
Derivatives 16,126 83,707 16,126 83,707
Credit risk exposures relating to off-balance
sheet items
Agreements to grant loans 1,441,291 936,857 1,441,291 936,857
Guarantees issued 1,748 260,718 1,748 260,718
Letters of credit issued 105,181 54,208 105,181 54,208
Commitments related to leasing 327,784 26,382 327,784 26,382
Total as at 31 December 11,894,316 9,608,621 11,894,479 9,608,844
The BankThe Group
AB SEB bankas
NOTES TO THE FINANCIAL STATEMENTS
FOR THE YEAR ENDED 31 DECEMBER 2020
(All amounts in EUR thousand unless otherwise stated)
Page 54 of 113
2. RISK POLICY AND MANAGEMENT (CONTINUED)
2.2 Liquidity risk
Definition
Liquidity risk is the risk that the Group and the Bank are unable to refinance its existing assets or is unable to meet the demand for
additional liquidity. Liquidity risk also entails the risk that the Group and the Bank are forced to borrow at unfavourable rates or is forced to sell assets at a loss in order to meet its payment commitments.
Liquidity management and risk measurement
The Supervisory Board has established a comprehensive framework for managing Group’s and Bank’s liquidity requirements and
risks in the short- and long-term. The aim of Group’s and Bank’s liquidity risk management is to ensure that the Group and the Bank have a controlled liquidity risk situation, with adequate volumes of liquid assets to meet its liquidity requirements in all foreseeable
circumstances, without incurring substantial cost.
The liquidity risk is managed through the limits set by the Management Board. The treasury function has the overall responsibility
for liquidity management and funding. Risk department measures limit utilisation based on different market conditions and liquidity stress tests on a daily basis. The liquidity risk position is reported quarterly to ALCO (Asset and Liability Committee) and to the Risk
Committee of the Supervisory Board.
Liquidity management and the structuring of the statement of financial position from a liquidity point of view are built on three
basic perspectives:
(i) the structural liquidity perspective, in which stable funding is put in relation to illiquid assets;
(ii) the Group’s and the Bank’s tolerance for short-term stress in the form of a shutdown of the wholesale and interbank
(iii) the Group’s and the Bank’s tolerance to a severe stress scenario (survival horizon) where, in addition to a shutdown
of the funding market, the bank experiences a severe outflow of deposits.
Structural liquidity risk
In order to maintain a sound structural liquidity position, the structure of the liability side should be based on the composition of
assets. The more long-term lending and other illiquid assets, the more stable funding is required. In the Group and the Bank, this is
measured as the Core Gap ratio, which is conceptually equivalent to the Net Stable Funding Ratio (NSFR), i.e., a ratio between
stable funding (over 1 year maturity) and illiquid assets (over 1 year maturity). The difference between the internal Core Gap ratio and the external NSFR is that the Core Gap ratio is calculated on a more detailed level based on internal statistics, which results in
different weightings of available and required stable funding.
Wholesale funding dependence
The Group and the Bank measure wholesale funding dependence as the loan to deposit ratio which, is calculated by dividing the bank’s total loans to the public by its total deposits from the public. A ratio below 100 per cent means that lending to the public is
being fully financed by deposits from the same segment, i.e. there is no reliance on other types of funding (typically wholesale
funding).
Stressed survival horizon
Severe stress can be modelled by combining assumptions of a wholesale funding market shutdown with assumptions of deposit
outflows, drawdowns on commitments, etc. The outcome is captured by the regulatory defined Liquidity Coverage Ratio (LCR)
where, in a stressed scenario, modelled net outflows during a 30-day period are related to the amount of total liquid assets. The
Group and the Bank also measure the time it would take for the liquid assets to be depleted in a severely stressed scenario, expressed as the stressed survival horizon.
Internal liquidity adequacy assessment process
Liquidity risk is not primarily mitigated by capital. However, there are strong links between a bank’s capital and liquidity position.
Hence, an internal liquidity adequacy assessment process (ILAAP) complements the ICAAP (Internal Capital Adequacy Assessment Process). The ILAAP is designed to identify potential gaps against SEB’s long-term desired level of liquidity adequacy,
taking into account that effective liquidity management is a continuous process.
AB SEB bankas
NOTES TO THE FINANCIAL STATEMENTS
FOR THE YEAR ENDED 31 DECEMBER 2020
(All amounts in EUR thousand unless otherwise stated)
Page 55 of 113
2. RISK POLICY AND MANAGEMENT (CONTINUED)
2.2 Liquidity risk (continued)
Retail deposits, which are stable to large extent, are the most important financing source for the Group and the Bank. Belonging to
the international banking group gives the Group and the Bank additional assurance to manage long-term liquidity. Liquidity is managed in co-operation with SEB Group Treasury. Through the parent company the Group and the Bank have better access to
the international money markets than on individual basis.
Next table presents undiscounted contractual cash flows payable by the Group under non-derivative financial liabilities by
remaining contractual maturity as at 31 December 2020 and maturity analysis of financial assets the Group holds for managing liquidity risk.
Liquidity risk management measures
31/12/2020 31/12/2019 31/12/2020 31/12/2019
Core Gap ratio 167% 118% 167% 118.0%
Loan to deposit ratio 68% 90% 68% 90.0%
Liquidity Coverage ratio 657.13% 223.52% 655.87% 222.93%
(All amounts in EUR thousand unless otherwise stated)
Page 56 of 113
2. RISK POLICY AND MANAGEMENT (CONTINUED)
2.2 Liquidity risk (continued)
Next table presents undiscounted contractual cash flows payable by the Group under non-derivative financial liabilities by
remaining contractual maturity as at 31 December 2019 and maturity analysis of financial assets the Group holds for managing
liquidity risk.
Next table presents undiscounted contractual cash flows payable by the Bank under non-derivative financial liabilities by remaining contractual maturity as at 31 December 2020 and maturity analysis of financial assets the Bank holds for managing
(All amounts in EUR thousand unless otherwise stated)
Page 58 of 113
2. RISK POLICY AND MANAGEMENT (CONTINUED)
2.2 Liquidity risk (continued)
Next table presents undiscounted derivative instruments analysis for the Group and the Bank as at 31 December 2019.
2.3 Market risk
Definition
Market risk is the risk of losses in balance sheet positions and obligations, arising from adverse movements in market prices. Market
risk can arise from changes in interest rates, foreign exchange rates, credit spreads, commodity and equity prices, implied
volatilities, inflation and market liquidity. A clear distinction is made between market risks related to trading activity, i.e., trading book risks, and structural market and net interest income risks, i.e., banking book risks. Whereas positions in the trading book are
held with a trading intent and under a daily mark-to-market regime, positions in the banking book do not have a trading intent and
are typically held at amortised cost.
Risk management
Market risks in the trading book arises from bank’s customer-driven trading activities. Market risk also arises in the form of interest
rate risk in the banking book as a result of balance sheet mismatches in currencies, interest terms and interest rate periods. The
treasury function has overall responsibility for managing these risks. The risk is managed by setting the proper risk management
framework, daily monitoring and follow up on utilization levels and actions taken if the utilization is too high. The treasury function also manages a liquidity portfolio, which is part of bank’s liquidity reserve. The market risk from the liquidity portfolio comes from
credit spread risk and interest rate risk in pledgeable and highly liquid bonds.
Bank’s risk appetite is defined in the Tolerance statement. Management defines how much market risk is acceptable by setting the
overall market risk limits and general instructions as part of bank’s risk appetite. Risk Committee of the Supervisory Board sets tolerance levels within given market risk limits.
The Group and the Bank measure the risks using different methods of risk valuation and management pursuant to the type of risk.
Important role in risk prevention is diversification of risk assets and limitation for trading positions.
The risk organisation measures, follows up and reports the market risk taken by the various units within the Group and the Bank on a daily basis. The risk control function monitors limit compliance and market prices at closing as well as valuation standards and
the introduction of new products. Market risks are reported at least on a quarterly basis to the ALCO and to the Risk Committee of
the Supervisory Board.
AB SEB bankas
NOTES TO THE FINANCIAL STATEMENTS
FOR THE YEAR ENDED 31 DECEMBER 2020
(All amounts in EUR thousand unless otherwise stated)
Page 59 of 113
2. RISK POLICY AND MANAGEMENT (CONTINUED)
2.3 Market risk (continued)
Risk measurement
When assessing the market risk exposure, the Group and the Bank use measures that capture losses under normal and stressed
market conditions. Market risks under normal market circumstances are measured using Value at Risk (VaR) as well as specific measures that are relevant for the various risk types. These measures are complemented by stress tests and scenario analyses,
in which potential losses under extreme market conditions are estimated. Since no measurement method can cover all risks at all
times, several approaches are used, and the results are assessed based on judgment and experience.
Value at Risk and Stressed Value at Risk
VaR expresses the maximum potential loss that could arise during a certain time period with a given degree of probability. SEB
Group uses a historical simulation VaR model with a ten-day time horizon and 99 per cent confidence interval to measure, limit and
report VaR. The model aggregates market risk exposure for all risk types and covers a wide range of risk factors in all asset classes.
SEB Group also uses a stressed VaR measure, where VaR is calculated for the current portfolio using market data from a historic, turbulent time period covering the Lehman Brothers’ default. The VaR model is subject to validation using back-testing analysis.
A limitation of the Group’s and Bank’s VaR model is that it uses historical data to estimate potential market changes. As such, it
may not predict all outcomes, especially in a rapidly changing market. In addition, VaR does not take into account any actions to
reduce risk as the model assumes that the portfolio is unchanged.
Value at Risk assessment results on total portfolios positions:
Scenario analysis and Stress tests
Scenario analysis and stress tests are a key part of the risk management framework, complementing the VaR measure. In
particular, they test the portfolios using scenarios other than those available in the VaR simulation window, and cover longer time
horizons. The Group and the Bank stress their portfolios by applying extreme movements in market factors which have been
observed in the past (historical scenarios) as well as extreme movements that could potentially happen in the future (hypothetical or forward-looking scenarios).
This type of analysis provides management with a view on the potential impact that large market moves in individual risk factors,
as well as broader market scenarios, could have on a portfolio.
Specific risk measures
VaR and stress tests are complemented by specific risk measures including Delta 1 per cent and NII sensitivity for interest risk,
and single and aggregated FX for currency risk.
In addition, all units that handle risk for financial instruments valued at market are limited by a stop-loss limit. The stop-loss limit
indicates the maximum loss a unit can incur before mitigating actions are taken.
2.3.1 Foreign exchange risk
Foreign exchange risk arises both through the Group’s and the Bank’s foreign exchange trading and because Group’s and Bank’s
activities are carried out in various currencies. Group’s and Bank’s main objective for taking foreign exchange risk is to facilitate
smooth foreign exchange trading for its customers and to manage the flows from customers’ deals effectively. Together with the customers’ deals related flows the Group and the Bank manage the structural foreign exchange risk inherent in the structure of
the statement of financial position and earnings.
31/12/2020 31/12/2019
Interest rate risk (stand-alone) 2,323 1,870
Credit spread risk (stand-alone) - 11
Foreign exchange risk (stand-alone) 20 17
Equity price risk (stand-alone) 1,223 984
Diversification effect -925 -1,023
Total 2,641 1,859
The Group and the Bank
AB SEB bankas
NOTES TO THE FINANCIAL STATEMENTS
FOR THE YEAR ENDED 31 DECEMBER 2020
(All amounts in EUR thousand unless otherwise stated)
Page 60 of 113
2. RISK POLICY AND MANAGEMENT (CONTINUED)
2.3 Market risk (continued)
2.3.1 Foreign exchange risk (continued)
Market risks arising from the foreign exchange positions are measured internally within the overall VaR framework. As a
complement ALCO has set limits for open foreign currency positions by individual currencies and also on an aggregated level as a sum of long or short positions, depending of which one is higher on absolute terms. Management of open foreign currency positions
is the responsibility of the Markets department, analysis and limit follow-up is performed by the Risk department.
The table below summarises Group’s and Bank’s exposure to foreign currency exchange rate risk at the 31 December 2020.
The table below summarises Group’s and Bank’s exposure to foreign currency exchange rate risk at the 31 December 2019.
2.3.2 Interest rate risk
Interest rate risk refers to the risk that the value of the Group’s and the Bank’s assets, liabilities and interest-related derivatives
will be negatively affected by changes in interest rates or other relevant risk factors.
The majority of the Group’s and Bank’s interest rate risks are structural and arise within the banking operations when there is a
mismatch between the interest fixing periods of assets and liabilities, including derivatives.
The Group and the Bank use Delta 1% methodology for measuring the assets-liability mismatch risk, arising from the structure of
Assets exposed to interest rate risk (Financial Assets) and Liabilities exposed to interest rate risk (Financial Liabilities) to reflect change in economic value due to change in interest rates. Delta 1% is defined as the change in market value arising from an adverse
one percentage unit parallel shift in all interest rates in each currency. Delta 1% method enables to effectively measure the impact
of interest rate changes to Assets exposed to interest rate risk and Liabilities exposed to interest rate risk. Delta 1% should be
kept within the limit set by the Management Board.
The Group and the Bank also uses NII sensitivity metrics to reflect change in the net interest income due to the change of interest
rates. For 2020 NII sensitivity was defined as change in value of annual Net Interest Income per 200 bps parallel shift of interest
rates with additional assumptions, e.g. interest rate floors accounting for very low current yield level. The Group and the Bank does
not have a limit on NII sensitivity, but instead a risk tolerance measure relative to Risk Exposure Amount (REA) is established by the Risk Committee of the Supervisory Board.
Daily management of interest rate risk is the responsibility of the Treasury department, and measuring and analysing that of the
Risk department.
CurrencyRates
Position
Percentage of
capital Position
Percentage of
capital
U.S. Dollars (USD) 1.2271 18 0.00 18 0.00
The remaining long positions N/A 468 0.06 468 0.06
The remaining short positions N/A -435 -0.06 -435 -0.06
Open position N/A 486 0.06 486 0.06
The Group The Bank
CurrencyRates
Position
Percentage of
capital Position
Percentage of
capital
U.S. Dollars (USD) 1.1189 -1,721 -0.26 -1,721 -0.27
The remaining long positions N/A 1,122 0.17 1,122 0.17
The remaining short positions N/A -1,126 -0.17 -1,126 -0.17
Open position N/A 2,847 -0.43 2,847 -0.44
The Group The Bank
Interest rate sensitivity 31/12/2020 31/12/2019
Net effect on the economic value of equity (delta 1%) -21,161 -23,603
AB SEB bankas
NOTES TO THE FINANCIAL STATEMENTS
FOR THE YEAR ENDED 31 DECEMBER 2020
(All amounts in EUR thousand unless otherwise stated)
Page 61 of 113
2. RISK POLICY AND MANAGEMENT (CONTINUED)
2.3 Market risk (continued)
2.3.2 Interest rate risk (continued)
The Group’s and the Bank’s Delta 1% has been negative which means that the average duration of Assets exposed to interest rate
risk is higher than average duration of Liabilities exposed to interest rate risk and the Group and the Bank are more exposed to interest rate increase. The biggest contributors to the Delta 1% figure are loans from the asset side and deposits and funding from
the parent company from the liabilities side, which balance the mismatch from loans. Further information on interest rate
sensitivity can be found through table below “Exposure to interest rate risk by interest fixation period”. It includes the Group’s and
the Bank’s financial assets and liabilities at carrying amounts, categorised by the earlier of contractual repricing or maturity date.
Exposure to interest rate risk by interest fixation period
The following table illustrates exposure to interest rate by interest fixation period for the Group as at 31 December 2020
(excluding instruments, not sensible to the interest rates):
The following table illustrates exposure to interest rate by interest fixation period for the Group as at 31 December 2019
(excluding instruments, not sensible to the interest rates):
Maturity Within 1 month 1 - 3 months 3 - 6 months 6 - 12 months 1 - 5 years Over 5 years Total
Financial assets
Balances with central bank 1,795,419 - - - - - 1,795,419
Total interest repricing gap -4,027,061 2,199,382 1,035,485 331,771 167,879 510,920 218,376
AB SEB bankas
NOTES TO THE FINANCIAL STATEMENTS
FOR THE YEAR ENDED 31 DECEMBER 2020
(All amounts in EUR thousand unless otherwise stated)
Page 62 of 113
2. RISK POLICY AND MANAGEMENT (CONTINUED)
2.3 Market risk (continued)
2.3.2 Interest rate risk (continued)
The following table illustrates exposure to interest rate by interest fixation period for the Bank as at 31 December 2020 (excluding
instruments, not sensible to the interest rates):
The following table illustrates exposure to interest rate by interest fixation period for the Bank as at 31 December 2019:
2.3.3 Equity price risk
Equity price risk arises within market making and trading in equities and related instruments.
The Group and the Bank do not have equities in trading book. The reported VaR exposure in equities arises from banking book
position in strategic investments.
2.4 Operational risk
Definition
Operational risk is the risk of loss resulting from inadequate or failed internal processes, people and systems (e.g., breakdown of
IT systems, mistakes, fraud, other deficiencies in internal control) or from external events (natural disasters, external crime, etc.). The definition includes conduct, compliance, legal and financial reporting, information-, cyber- and physical security, and venture
execution risk, but excludes strategic and reputational risk.
Maturity Within 1 month 1 - 3 months 3 - 6 months 6 - 12 months 1 - 5 years Over 5 years Total
Financial assets
Balances with central bank 1,795,419 - - - - - 1,795,419
Total interest repricing gap -4,034,585 2,199,382 1,035,485 331,771 167,879 510,920 210,852
AB SEB bankas
NOTES TO THE FINANCIAL STATEMENTS
FOR THE YEAR ENDED 31 DECEMBER 2020
(All amounts in EUR thousand unless otherwise stated)
Page 63 of 113
2. RISK POLICY AND MANAGEMENT (CONTINUED)
2.4 Operational risk (continued)
Risk management
Operational risk is inherent in all of the Group’s and the Bank’s operations and the responsibility to manage operational risks rests
with all managers throughout the bank. The Group and the Bank aim to maintain a sound risk culture with low operational risk and loss level through an effective internal control environment by ensuring a structured and consistent usage of risk mitigating tools
and processes.
All new or changed products, processes and/or systems as well as reorganisations are evaluated in a group-common New Product
Approval Process (NPAP). The aim is to identify potential operational risks and ensure that proactive measures are taken to protect the Group and the Bank from entering into unintended risk-taking that cannot be immediately managed by the organisation.
The process is also used for yearly reviews of significant outsourcing arrangements in the Group and the Bank.
All business units with significant risk embedded in their operations shall regularly complete Risk and Control Self-Assessments
(RCSA) according to a group-wide methodology. The assessments are designed to identify and mitigate significant operational risks embedded in the Group’s and the Bank’s various business and support processes. There is comprehensive participation by
each business unit throughout the organisation. The RCSA framework is used to analyse the Group’s and the Bank’s operational
risk profile and help achieve operational excellence and high performance.
The Group and the Bank ensure that the organisation is prepared to respond to and operate throughout a period of major disruption by identifying critical activities and maintaining updated and tested business continuity plans in a group-wide system for this
purpose.
All employees are required to escalate and register risk-related events or incidents so that risks can be properly identified,
assessed, monitored, mitigated and reported. The Group and the Bank use a group-wide IT application to capture risk events and other operational risk data for analysis.
The Group and the Bank conduct regular training and education in key areas, including mandatory training for all staff in general
operational risk, information security, fraud prevention, anti-money laundering, know-your-customer procedures, GDPR and SEB’s
Code of Business Conduct. The Group and the Bank also have a formal whistle-blower procedure that encourages employees to report improprieties and unethical or illegal conduct.
The Group’s and the Bank’s approach to meet cyber and other security threats is to prioritise technical protection, raise awareness
and continuously enhance the cyber risk culture among both employees and customers. Necessary security updates, system
upgrades, and implementation of new features and secure measurements are performed on a regular basis. The Group and the Bank continuously work to enhance and improve its already well-established processes for mitigating, evaluating and following up
on existing and future cyber risks.
The risk department is responsible for measuring and reporting the Group’s and the Bank’s operational risks. Significant incidents
and the risk level are analysed and reported quarterly to the ALCO and to the Management Board and the Risk Committee of the Supervisory Board. In 2020, the total operational losses from operational incidents amounted to 518 thousand euros (290).
Risk measurement
The Group and the Bank use the Advanced Measurement Approach (AMA) to calculate the regulatory capital requirement for
operational risk.
Regulatory supervision
The Group and the Bank are subject to various legal requirements. Over the past years, the rules and regulations of the financial
industry have expanded and further sharpened, and the regulators have increased their supervision. This is a development, which
is expected to continue to evolve. Supervisory authorities regularly conduct reviews of Group’s and Bank’s regulatory compliance, including areas such as financial stability, market conduct related activities, anti-money laundering and terrorist financing,
international sanctions and data privacy. The Group and the Bank have policies and procedures in place with the purpose to always
comply with applicable rules and regulations. It cannot, however, be ruled out that current and future supervisory reviews could
lead to criticism or sanctions.
Bank of Lithuania has finalized Anti Money Laundering on-site inspection during second quarter of 2020. No warning or any other
sanction have been imposed on the Bank. The main part of the Action Plan implementing measures (deadline: 31 October 2020)
has been delivered and accepted by the Bank of Lithuania, respective findings are closed. Implementation of 2 remaining Action
plan measures is still ongoing (latest deadline: end of June 2021).
AB SEB bankas
NOTES TO THE FINANCIAL STATEMENTS
FOR THE YEAR ENDED 31 DECEMBER 2020
(All amounts in EUR thousand unless otherwise stated)
Page 64 of 113
2. RISK POLICY AND MANAGEMENT (CONTINUED)
2.5 Business risk
Definition
Business risk is the risk of lower revenues due to reduced volumes, price pressure or competition. Business risk includes venture
decision risk (related to undertakings such as acquisitions, large IT projects, transformations, outsourcing, etc.). Strategic risk is close in nature to business risk, but focuses on large-scale or structural risk factors. Reputational risk is the risk arising from
negative perception of the Group and the Bank or the industry in general.
Risk management
Business, strategic and reputational risks are inherent in doing business. Digitalisation of the banking industry is accelerating, and new types of competitors are emerging. The extensive new regulatory framework for banking and financial institutions is
significantly affecting the industry. Corporate sustainability plays an increasingly important part of a company’s reputation. The
Group and the Bank continuously work to mitigate business, strategic and reputational risks in many ways, for example, with
regular strategic business reviews, proactive cost management, an agile step-by-step IT development approach, an ambitious corporate sustainability agenda and active dialogues on regulatory matters.
2.6 Capital adequacy and capital management
Group’s and Bank’s capital adequacy target, capital allocation and return on allocated capital are risk-based measures built on an
assessment of all identified risks incurred in the operations. Capital management is forward-looking and aligned with short-term and long-term business plans and the macroeconomic environment. Management of the Group and the Bank uses an internal model
to calculate how much capital is necessary to cover its risks (so called Economic Capital). Stress testing is an important parameter
when assessing capital adequacy and setting capital targets. This is evaluated in the annual internal capital adequacy assessment
process (ICAAP).
As part of the capital planning, the Group and the Bank maintains a recovery plan which assesses possible capital contingency
measures and outlines governance in the event of a stressed capital situation.
Capital management ensures that capital is used where it can generate the best risk-adjusted returns. The management of the
Group and the Bank uses an internal capital allocation framework (business equity) that allocates the capital needed based on the risks taken by the business units.
Capital adequacy refers to the sufficiency of the Group’s and Bank’s capital resources to cover credit risks, operational and market
risks arising from the portfolio of assets of the Group and the Bank and the exposure from commitments and contingent liabilities
of the Group.
The Group’s and Bank’s capital adequacy ratios are being calculated in accordance with Basel III (CRR 575/2013) requirements.
In accordance with the Basel III requirements, the Group’s and the Bank’s risk based capital adequacy ratios as at 31 December
2020 were 21.43 per cent (22.8) and 21.36 per cent (22.7) respectively which is above the minimum required to maintain a
capital adequacy ratio of 8 per cent of risk weighted assets and commitments and contingent liabilities (See Note 39). In addition, the Group and the Bank shall comply with the combined buffer requirement: Capital conservation buffer – 2.5 per cent and other
systemically important institution (O-SII) buffer – 2.0 per cent.
2.7 Individual minimum requirement for own funds and eligible liabilities (MREL) on a sub-consolidated basis
The Bank recovery and resolution directive (BRRD) requires banks to meet MREL targets to absorb losses and restore their capital position, allowing them to continuously perform their critical economic functions during and after a crisis. MREL represents one of
the key tools in enhancing banks’ resolvability. In 2017, the Single Resolution Board (SRB) developed its MREL policy and adopted
its first binding decisions for major banking groups.
As MREL decisions must be reviewed annually, the SRB considers any relevant supervisory decision affecting the banks within its remit or any change in the banks’ financial structures and risk profiles.
MREL shall be calculated as the amount of own funds and eligible liabilities expressed as a percentage of the institution's total
liabilities and own funds (TLOF). The Bank has been compliant with the individual MREL since September 30, 2020.
AB SEB bankas
NOTES TO THE FINANCIAL STATEMENTS
FOR THE YEAR ENDED 31 DECEMBER 2020
(All amounts in EUR thousand unless otherwise stated)
Page 65 of 113
3. FAIR VALUE MEASUREMENT OF ASSETS AND LIABILITIES
The objective of the fair value measurement is to arrive at the price at which an orderly transaction would take place between market participants at the measurement date under current market conditions.
The Group and the Bank has an established control environment for the determination of fair values of financial instruments that
includes a review, independent from the business, of valuation models and prices. If the validation principles are not adhered to,
exceptions of material and principal importance require approval from the respective decision-making bodies.
In order to arrive at the fair value of a financial instrument the Group and the Bank use different methods; quoted prices in active
markets, valuation techniques incorporating observable data and valuation techniques based on internal models. For disclosure
purposes, financial instruments carried at fair value are classified in a fair value hierarchy according to the level of market
observability of the inputs. Risk control function classifies and continuously reviews the classification of financial instruments in the fair value hierarchy.
An active market is one in which transactions occur with sufficient volume and frequency to provide pricing information on an
ongoing basis. The objective is to arrive at a price at which a transaction without modification or repackaging would occur in the
principal market for the instrument to which the Group and the Bank have immediate access.
Fair value is generally measured for individual financial instruments; in addition, portfolio adjustments are made to cover the credit
risk. To reflect counterparty risk and own credit risk in OTC derivatives, adjustments are made based on the net exposure towards
each counterpart. These adjustments are calculated on a counterparty level based on estimates of exposure at default, probability
of default and recovery rates. Probability of default and recovery rate information is generally sourced from the Credit Default Swap (CDS) markets. For counterparties where this information is not available or considered unreliable due to the nature of the
exposure, alternative approaches are taken where the probability of default is based on generic credit indices for specific industry
and/or rating.
When valuing financial liabilities at fair value own credit standing is reflected.
Level 1: Quoted market prices
Valuations in Level 1 are determined by reference to unadjusted quoted market prices for identical instruments in active markets
where the quoted prices are readily available, and the prices represent actual and regularly occurring market transactions on an
arm’s length basis.
Examples of Level 1 financial instruments are listed equity securities, debt securities, and exchange-traded derivatives.
Instruments traded in an active market for which one or more market participants provide a binding price quotation on the
reporting date are also examples of Level 1 financial instruments.
Level 2: Valuation techniques with observable inputs
In Level 2 valuation techniques, all significant inputs to the valuation models are observable either directly or indirectly. Level 2
valuation techniques include using discounted cash flows, option pricing models, recent transactions and the price of another
instrument that is substantially the same.
Examples of observable inputs are foreign currency exchange rates, binding securities price quotations, market interest rates (Libor, etc.), and volatilities implied from observable option prices for the same term and actual transactions with one or more
external counterparts executed by SEB Group. An input can transfer from being observable to being unobservable during the
holding period due to e.g. illiquidity of the instrument. Examples of Level 2 financial instruments are most OTC derivatives such as
options and interest rate swaps based on the Libor swap rate or a foreign-denominated yield curve.
Level 3: Valuation techniques with significant unobservable inputs
Level 3 valuation techniques incorporate significant inputs that are unobservable. These techniques are generally based on
extrapolating from observable inputs for similar instruments, analysing historical data or other analytical techniques. Examples of
Level 3 financial instruments are more complex OTC derivatives, long dated options for which the volatility is extrapolated or derivatives that depend on an unobservable correlation. Other examples are instruments for which there is currently no active
market or binding quotes, such as unlisted equity instruments and private equity holdings.
AB SEB bankas
NOTES TO THE FINANCIAL STATEMENTS
FOR THE YEAR ENDED 31 DECEMBER 2020
(All amounts in EUR thousand unless otherwise stated)
Page 66 of 113
3. FAIR VALUE MEASUREMENT OF ASSETS AND LIABILITIES (CONTINUED)
If the fair value of financial instruments includes more than one unobservable input, the unobservable inputs are aggregated in
order to determine the classification of the entire instrument. The level in the fair value hierarchy within which a financial
instrument is classified is determined based on the lowest level of input that is significant to the fair value in its entirety.
The table below summarises the hierarchy of fair value measurement of asset and liabilities presented on the Group’s and the Bank’s statement of financial position at fair value:
Transfers between levels may occur when there are indications that market conditions have changed, e.g. a change in liquidity.
Fair value of investments
Fair values for investments listed in an active market are based on quoted market prices. If the market for a financial instrument is
not active, fair value is established by using valuation techniques based on discounted cash flow analysis, net asset value, valuation
with reference to financial instruments that is substantially the same, and valuation with reference to observable market
transactions in the same financial instrument.
If the net present value of estimated cash flows differs by +/-5 per cent while other factors are unchanged the change in fair value
of the material level 3 instruments for the Group and the Bank would be estimated higher or lower by EUR 258 thousand (506).
31 December 2020
Quoted price in active
markets
(Level 1)
Valuation techniques
using observable inputs
(Level 2)
Valuation techniques
using non-observable
inputs Total
Assets
Debt securities 486,885 - - 486,885
Derivatives 18 16,108 - 16,126
Equity instruments - - 5,204 5,204
Total 486,903 16,108 5,204 508,215
Liabilities
Derivatives 19 19,983 - 20,002
Total 19 19,983 - 20,002
Fair value measurement at the end of reporting period based on:
31 December 2019
Quoted price in active
markets
(Level 1)
Valuation techniques
using observable inputs
(Level 2)
Valuation techniques
using non-observable
inputs
(Level 3) Total
Assets
Debt securities 429,305 - - 429,305
Derivatives 20 83,687 - 83,707
Equity instruments - - 10,153 10,153
Total 429,325 83,687 10,153 523,165
Liabilities
Derivatives 7 85,864 - 85,871
Total 7 85,864 - 85,871
Fair value measurement at the end of reporting period based on:
AB SEB bankas
NOTES TO THE FINANCIAL STATEMENTS
FOR THE YEAR ENDED 31 DECEMBER 2020
(All amounts in EUR thousand unless otherwise stated)
Page 67 of 113
3. FAIR VALUE MEASUREMENT OF ASSETS AND LIABILITIES (CONTINUED)
The table below represents the changes of the Group’s and Bank’s Level 3 instruments for the year ended 31 December 2020 and
2019:
Unrealised gain on equity instruments recognized in the income statement is presented within ‘Net financial income’ line.
The table below summarizes the carrying amounts and fair values of those financial assets and liabilities presented on the Group’s
statement of financial position at amortized cost:
The table below summarizes the carrying amounts and fair values of those financial assets and liabilities presented on the Bank’s
statement of financial position at amortized cost:
Equity
instruments
1 January 2019 6,914
Gains (losses) in income statement - unrealised 3,051
Exchange rate differences 188
31 December 2019 10,153
Balance as at 1 January 2020 10,153
Transfer from Level 3 -4,985
Gains (losses) in income statement - unrealised 662
Exchange rate differences -626
Balance as at 31 December 2020 5,204
Carrying Value Fair value Carrying Value Fair value
Balances with the Central Bank 1,795,419 1,795,419 1,454,810 1,457,349
Loans to credit institutions 1,886,403 1,886,063 65,584 65,660
Loans to the public 5,810,488 5,656,672 6,266,651 5,683,073
General governments 78,893 78,902 59,400 56,539
Other financial corporations 2,466 2,413 2,876 2,881
Total financial assets valued at amortised cost 9,492,310 9,338,154 7,787,045 7,206,082
Deposits from central banks and credit institutions 646,495 660,619 559,070 564,150
Current and demand deposits 8,135,690 8,184,064 6,300,892 6,311,726
Term deposits from the public 441,182 442,263 708,708 709,720 Total financial liabilities valued at amortised cost 9,223,367 9,286,946 7,568,670 7,585,596
31/12/2020 31/12/2019
Carrying Value Fair value Carrying Value Fair value
Balances with the Central Bank 1,795,419 1,795,419 1,454,810 1,457,349
Loans to credit institutions 1,886,403 1,886,063 65,584 65,660
Loans to the public 5,810,488 5,656,672 6,266,651 5,683,073
General governments 78,893 78,902 59,400 56,539
Other financial corporations 2,466 2,413 2,876 2,881
Total financial assets valued at amortised cost 9,492,310 9,338,154 7,787,045 7,206,082
Deposits from central banks and credit institutions 646,495 660,619 559,070 564,150
Current and demand deposits 8,135,690 8,184,064 6,308,416 6,319,263
Term deposits from the public 448,479 442,263 708,708 709,720
Total financial liabilities valued at amortised cost 9,230,664 9,286,946 7,576,194 7,593,133
31/12/2020 31/12/2019
AB SEB bankas
NOTES TO THE FINANCIAL STATEMENTS
FOR THE YEAR ENDED 31 DECEMBER 2020
(All amounts in EUR thousand unless otherwise stated)
Page 68 of 113
3. FAIR VALUE MEASUREMENT OF ASSETS AND LIABILITIES (CONTINUED) The Group and the Bank conduct assessment of fair value of financial assets and liabilities which are not presented in the Group’s and Bank’s statement of financial position at their fair value. All financial instruments not measured at fair value are specified at
Level 3 in hierarchy of valuation of fair value, because of using unobservable inputs.
When calculating fair value for floating interest rate loans and for fixed-interest rate lending, future cash flows are discounted
based on the market interest curve, which has been adjusted for applicable margins of new lending. Fixed-interest rate deposits, floating interest rate and fixed-interest rate balances due to credit institutions, have been calculated similarly.
AB SEB bankas
NOTES TO THE FINANCIAL STATEMENTS
FOR THE YEAR ENDED 31 DECEMBER 2020
(All amounts in EUR thousand unless otherwise stated)
Page 69 of 113
4. NET INTEREST INCOME
5. NET FEE AND COMMISSION INCOME
2020 2019 2020 2019
Interest income:
Loans to the public 117,205 117,127 117,205 117,127
Loans to credit institutions and central banks 1,056 3,321 1,056 3,321
Negative interest income 1,325 831 1,375 981
Total interest income calculated using the effective interest rate
method 119,586 121,279 119,636 121,429
Loans to the public (leasing portfolio) 16,812 14,839 16,812 14,839
Debt securities 1,809 4,076 1,809 4,076
Total other interest and similar income 18,621 18,915 18,621 18,915
Total interest income 138,207 140,194 138,257 140,344
Interest expenses:
Deposits from credit institutions -6,455 -2,903 -6,455 -2,903
Deposits and borrowings from the public -451 -1,175 -451 -1,175
Total 13,052 5,370 3,561.00 21,983 14,564 6,356 -1,015 19,905
The Bank
2020 2019
2020 2019
UAB "SEB investicijų valdymas" 2,054 2,294
Total dividend income 2,054 2,294
2020 2019 2020 2019
Salary expenses -45,756 -42,774 -45,343 -42,304
Social security expenses -836 -1,201 -828 -1,193
Defined contribution plan expenses -956 -847 -947 -838
Share-based payments -485 -261 -485 -261
Other personnel expenses -1,206 -1,342 -1,186 -1,328
Total -49,239 -46,425 -48,789 -45,924
The Group The Bank
AB SEB bankas
NOTES TO THE FINANCIAL STATEMENTS
FOR THE YEAR ENDED 31 DECEMBER 2020
(All amounts in EUR thousand unless otherwise stated)
Page 71 of 113
8. PERSONNEL EXPENSES (CONTINUED)
Compensation to key management personnel is disclosed in Note 37.
Share-based payments
SEB Group has developed long-term equity-based programs as part of remuneration system to build long-term commitment to
SEB. The long-term equity based variable compensation at SEB shall be determined based on long-term equity based variable compensation program principles developed by the SEB Group and has to be agreed specifically with the employee, towards whom
it is applied. The program, referred to above, is the Share Deferral Program (SDP).
The purpose of the program is to reward senior managers and key employees and to encourage all employees to become
shareholders in SEB, thereby aligning employee interests with those of shareholders.
The above-described share-based payments are treated as equity-settled because the Group and the Bank has no obligation to
settle the transactions related to the Share Deferral Program.
The following table illustrates the number and weighted average exercise prices (WAEP) of, and movements in share options
during the year:
The weighted average remaining contractual life for the share options outstanding as at 31 December 2020 was 4.80 years
(4.99).
The range of exercise prices for options outstanding at the end of the year was EUR 6.48 to EUR 9.49 (7.93 to 9.16).
9. DEPRECIATION, AMORTIZATION AND IMPAIRMENT OF TANGIBLE AND INTANGIBLE ASSETS
Number WAEP Number WAEP
Outstanding at 1 January 389,492 343,824
Granted during the year 165,810 217,993
Forfeited during the year -56,801 -125,825
Exercised during the year* -50,130 7.54 -46,500 8.61
Expired during the year - -
Outstanding at 31 December 448,371 389,492
Exercisable at 31 December 56,381 30,265
2020 2019
2020 2019 2020 2019
Amortization of intangible assets (Note 20) -1,423 -564 -1,423 -564
Depreciation of tangible assets (Note 21) -2,802 -2,661 -2,796 -2,651
Depreciation of right of use assets (Note 22) -4,967 -4,126 -4,949 -4,100
Depreciation of investment property (Note 23) -29 -27 -29 -27
Total -9,221 -7,378 -9,197 -7,342
The Group The Bank
AB SEB bankas
NOTES TO THE FINANCIAL STATEMENTS
FOR THE YEAR ENDED 31 DECEMBER 2020
(All amounts in EUR thousand unless otherwise stated)
Page 72 of 113
10. OTHER EXPENSES
During the year 2020 and 2019 the Group and the Bank have acquired following services from its auditor Ernst & Young Baltic
UAB:
11. NET EXPECTED CREDIT LOSSES
Net ECL level is calculated as Net credit impairments in relation to the opening balance of the year of loans to the public and loans
to credit institutions measured at amortised cost, financial guarantees and loan commitments, net of ECL allowances.
2020 2019 2020 2019
IT costs -7,903 -9,028 -7,788 -8,989
Cost of premises -4,104 -3,393 -4,091 -3,358
Supervisory and regulatory fees -1,817 -1,847 -1,817 -1,847
Direct cost of equipment and stationary -1,585 -1,476 -1,571 -1,466
Marketing -1,301 -1,169 -1,286 -1,085
Information services -694 -626 -634 -577
Consultants -504 -368 -504 -368
Travel and entertainment -198 -1,480 -196 -1,468
Other operating expenses -3,559 -4,257 -3,221 -3,871
of which
Transportation expenses -573 -738 -571 -739
Operational risk expenses -518 -290 -518 -290
Audit expenses -175 -137 -139 -115
Total -21,665 -23,644 -21,108 -23,029
The Group The Bank
2020 2019 2020 2019
Audit services -175 -105 -139 -83
Non-audit assurance services and other non-audit services -17 -5 -17 -5
Total services purchases -192 -110 -156 -88
The Group The Bank
2020 2019 2020 2019
Impairment gain or loss - Stage 1 -9,198 62 -9,198 62
Impairment gain or loss - Stage 2 -2,591 357 -2,591 357
Impairment gain or loss - Stage 3 -3,267 -6,347 -3,267 -6,347
Impairment gains or losses (IFRS 9) -15,056 -5,928 -15,056 -5,928
Write-offs and recoveries
Total write-offs -5,958 -21,674 -5,958 -21,674
Reversal of allowances for write-offs 5,958 21,657 5,958 21,657
Write-offs previously not provided for - -17 - -17
Recoveries from previous write-offs 1,394 2,056 1,394 2,056
Net write-offs 1,394 2,039 1,394 2,039
Net expected credit losses -13,662 -3,889 -13,662 -3,889
Net ECL level, % -0.18% -0.05% -0.18% -0.05%
The Group The Bank
AB SEB bankas
NOTES TO THE FINANCIAL STATEMENTS
FOR THE YEAR ENDED 31 DECEMBER 2020
(All amounts in EUR thousand unless otherwise stated)
Page 73 of 113
12. INCOME TAX EXPENSE
The tax on the Group’s and the Bank’s profit before tax differs from the theoretical amount that would arise using the basic tax rate as follows:
Standard income tax rate in Lithuania is 15 per cent. Starting from 1 January 2020, additional temporary 5 per cent income tax rate is applied for financial institutions in Lithuania. Additional income tax rate is expected to be charged for three years until the
end of year 2023. In 2020 and 2019 effective tax rate does not differ significantly from the nominal tax rate.
Deferred tax asset
Deferred tax liability
As at 31 December 2020 and 2019, deferred income tax was calculated using 20 percent income tax rate if realisation is expected
until the end of year 2023 and using 15 percent rate for later realisation.
2020 2019 2020 2019
Current year tax charge 23,364 20,224 23,019 19,858
Previous years related tax charge -266 640 -265 642
Change in deferred tax assset and liability balance -279 2,353 -280 2,355
Total income tax charge 22,819 23,217 22,474 22,855
The BankThe Group
2020 2019 2020 2019
Profit before tax 115,950 140,670 115,728 140,548
Tax calculated at a tax rate of 20% 23,190 21,101 23,146 21,082
Income not subject for tax -357 -287 -768 -631
Expenses not deductible for tax purposes 96 948 91 947
Correction of used deferred tax 156 805 270 805
Deferred tax expense (income) relating to changes in tax rates
(2019 - 15%; 2020 - 20%) - 10 - 10
Correction of previous period income tax -266 640 -265 642
Total income tax charge 22,819 23,217 22,474 22,855
The BankThe Group
2020 2019 2020 2019
Assets at 1 January 12 2,045 - 2,035
Income statement charge -2 -2,033 - -2,035
Asset at 31 December 10 12 - -
The BankThe Group
2020 2019 2020 2019
Liability at 1 January 320 0 320 0
Income statement charge -280 320 -280 320
Liability at 31 December 40 320 40 320
The BankThe Group
AB SEB bankas
NOTES TO THE FINANCIAL STATEMENTS
FOR THE YEAR ENDED 31 DECEMBER 2020
(All amounts in EUR thousand unless otherwise stated)
Page 74 of 113
12. INCOME TAX EXPENSE (CONTINUED)
13. CASH AND BALANCES WITH CENTRAL BANK
Eurosystem‘s minimum reserve requirements comprise 1 percent (the same for the year 2019) of balance of current accounts,
deposits with agreed maturity or period of notice up to 2 years, debt securities issued with maturity up to 2 years, calculated on
the basis of the bank‘s statement of financial position prior to the start of the new maintenance period. ECB‘s remuneration rate
for six time larger calculated reserve requirements amount is 0.0 percent, while deposit facility rate for the rest of amount on Targte2 account is minus 0.5 percent.
14. LOANS TO CREDIT INSTITUTIONS
Amounts due from credit institutions at 31 December 2020 have been due from counterparties with the rating not lower than
BBB- based on rating agency Standard & Poor’s ratings except for EUR 1.1 million that are due from the counterparties which are
not rated and EUR 0.3 million from counterparties which are under non-investment grade.
Amounts due from credit institutions at 31 December 2019 have been due from counterparties with the rating not lower than BBB+ based on rating agency Standard & Poor’s ratings except for EUR 8.3 million that are due from the counterparties which are
not rated (8.0 million of them are due from other SEB Group companies). There were no due amounts from counterparty’s that are
under non - investment grade.
The balances above do not include any past due or impaired items.
31/12/2020 31/12/2019 31/12/2020 31/12/2019
Deferred tax assets
Accrued expense 2,974 3,113 2,961 3,101
Impairment losses 213 12 213 12
Revaluation of derivatives 776 408 776 408
Total deferred tax assets 3,963 3,533 3,950 3,521
Deferred tax liability
Amortisation and depreciation 2,317 1,828 2,314 1,828
Other accruals 367 274 367 274
Revaluation of securities accounted at fair value 1,309 1,739 1,309 1,739
Total deferred tax liability 3,993 3,841 3,990 3,841
Net deferred tax asset (liability) -30 -308 -40 -320
Total loans to public and credit institutions 6,592,835 6,271,327 6,592,835 6,271,327
The Group The Bank
AB SEB bankas
NOTES TO THE FINANCIAL STATEMENTS
FOR THE YEAR ENDED 31 DECEMBER 2020
(All amounts in EUR thousand unless otherwise stated)
Page 76 of 113
15. LOANS TO THE PUBLIC AND CREDIT INSTITUTIONS (CONTINUED)
The table below shows gross carrying amounts for Group’s and Bank’s exposures on-balance-sheet measured at amortised cost and nominal amounts for exposures off-balance-sheet divided by stage
as a mean to put ECL allowances in context to total exposure as at 31 December 2020.
(All amounts in EUR thousand unless otherwise stated)
Page 77 of 113
15. LOANS TO THE PUBLIC AND CREDIT INSTITUTIONS (CONTINUED)
The table below shows gross carrying amounts for Group’s and Bank’s exposures on-balance-sheet measured at amortised cost and nominal amounts for exposures off-balance-sheet divided by stage
as a mean to put ECL allowances in context to total exposure as at 31 December 2019:
(All amounts in EUR thousand unless otherwise stated)
Page 78 of 113
15. LOANS TO THE PUBLIC AND CREDIT INSTITUTIONS (CONTINUED)
Table below shows Group’s and Bank’s movements of allowance accounts for on-balance-sheet exposures and off-balance-sheet
exposures.
During the year 2020 there were no significant changes in gross carrying amounts of loans to public, which contributed significantly to changes in the loss allowance. Changes in the loss allowance were mainly affected by assessing the possible
negative impact of COVID-19, which resulted in loss allowance increase.
(Continued)
The Group and the Bank
Stage 1 (12-
month ECL)
Stage 2 (lifetime
ECL)
Stage 3 (credit
impaired/lifetime
ECL) Total
General governments
ECL allowance as at 1 January 2020 -6 - - -6
New and derecognised financial assets, net 1 - - 1
Changes due to change in credit risk - - - -
Changes due to modifications - - - -
Changes due to methodology change - - - -
Exchange rate differences - - - -
Total -5 - - -5
Credit institutions
ECL allowance as at 1 January 2020 - - - -
New and derecognised financial assets, net -19 - - -19
Changes due to change in credit risk - - - -
Changes due to modifications - - - -
Changes due to methodology change - - - -
Exchange rate differences - - - -
Total -19 - - -19
Other financial corporations
ECL allowance as at 1 January 2020 -1 - - -1
New and derecognised financial assets, net - - - -
Changes due to change in credit risk -2 - - -2
Changes due to modifications - - - -
Changes due to methodology change - - - -
Exchange rate differences - - - -
Total -3 - - -3
Non-financial corporations
ECL allowance as at 1 January 2020 -1,279 -403 -29,641 -31,323
New and derecognised financial assets, net 285 542 2,185 3,012
Changes due to change in credit risk -4,061 -3,340 -1,908 -9,309
Changes due to modifications - -115 - -115
Changes due to methodology change 21 - -8 13
Exchange rate differences - - 3 3
Total -5,034 -3,316 -29,369 -37,719
Households
ECL allowance as at 1 January 2020 -1,046 -1,952 -18,979 -21,977
New and derecognised financial assets, net -317 64 2,484 2,231
Changes due to change in credit risk -2,794 -1,028 62 -3,760
Changes due to modifications - - - -
Changes due to methodology change 1 2 -2 1
Exchange rate differences - -2 - -2
Total -4,156 -2,916 -16,435 -23,507
Total loans
ECL allowance as at 1 January 2020 -2,332 -2,355 -48,620 -53,307
New and derecognised financial assets, net -50 606 4,669 5,225
Changes due to change in credit risk -6,857 -4,368 -1,846 -13,071
Changes due to modifications - -115 - -115
Changes due to methodology change 22 2 -10 14
Exchange rate differences - -2 3 1
Total -9,217 -6,232 -45,804 -61,253
AB SEB bankas
NOTES TO THE FINANCIAL STATEMENTS
FOR THE YEAR ENDED 31 DECEMBER 2020
(All amounts in EUR thousand unless otherwise stated)
Page 79 of 113
15. LOANS TO THE PUBLIC AND CREDIT INSTITUTIONS (CONTINUED)
(Concluded)
The Group and the Bank
Stage 1 (12-
month ECL)
Stage 2 (lifetime
ECL)
Stage 3 (credit
impaired/lifetime
ECL) Total
Financial guarantees and loan commitments
ECL allowance as at 1 January 2020 -389 -1,640 -611 -2,640
New and derecognised financial assets, net -18 47 4,566 4,595
Changes due to change in credit risk -2,296 1,414 -4,687 -5,569
Changes due to methodology change 2 -176 - -174
Exchange rate differences 2 11 82 95
Total -2,699 -344 -650 -3,693
Total loans and financial guarantees and loan commitments
ECL allowance as at 1 January 2020 -2,721 -3,995 -49,231 -55,947
New and derecognised financial assets, net -68 653 9,235 9,820
Changes due to change in credit risk -9,153 -2,954 -6,533 -18,640
Changes due to modifications - -115 - -115
Changes due to methodology change 24 -174 -10 -160
Exchange rate differences 2 9 85 96
Total -11,916 -6,576 -46,454 -64,946
AB SEB bankas
NOTES TO THE FINANCIAL STATEMENTS
FOR THE YEAR ENDED 31 DECEMBER 2020
(All amounts in EUR thousand unless otherwise stated)
Page 80 of 113
15. LOANS TO THE PUBLIC AND CREDIT INSTITUTIONS (CONTINUED)
During the year 2019 there were no significant changes in gross carrying amounts of loans to public, which contributed
significantly to changes in the loss allowance. Changes in the loss allowance were mainly affected by the write-offs in amount of
EUR 21,657 thousand and impairment adjustments for written off loans.
(Continued)
The Group and the Bank
Stage 1 (12-
month ECL)
Stage 2 (lifetime
ECL)
Stage 3 (credit
impaired/lifetime
ECL) Total
General governments
ECL allowance as at 1 January 2019 -6 - - -6
New and derecognised financial assets, net -1 - - -1
Changes due to change in credit risk 1 - - 1
Total -6 - - -6
Credit institutions
ECL allowance as at 1 January 2019-1 - - -1
Exchange rate differences 1 - - 1
Total - - - -
Other financial corporations
ECL allowance as at 1 January 2019 - - -1 -1
New and derecognised financial assets, net -6 - 1 -5
Changes due to change in credit risk 5 - - 5
Total -1 - - -1
Non-financial corporations
ECL allowance as at 1 January 2019 -1,335 -743 -38,781 -40,859
New and derecognised financial assets, net -376 211 19,222 19,057
Changes due to change in credit risk 377 302 -10,255 -9,576
Changes due to modifications - -174 - -174
Changes due to methodology change 57 - 239 296
Exchange rate differences -2 1 -66 -67
Total -1,279 -403 -29,641 -31,323
Households
ECL allowance as at 1 January 2019 -1,101 -1,939 -20,617 -23,657
New and derecognised financial assets, net -356 -60 4,080 3,664
Changes due to change in credit risk 407 46 -2,447 -1,994
Changes due to modifications - - -3 -3
Changes due to methodology change 2 1 - 3
Exchange rate differences 2 - 8 10
Total -1,046 -1,952 -18,979 -21,977
Total loans
ECL allowance as at 1 January 2019 -2,443 -2,682 -59,399 -64,524
New and derecognised financial assets, net -739 151 23,303 22,715
Changes due to change in credit risk 790 348 -12,702 -11,564
Changes due to modifications - -174 -3 -177
Changes due to methodology change 59 1 239 299
Exchange rate differences 1 1 -58 -56
Total -2,332 -2,355 -48,620 -53,307
AB SEB bankas
NOTES TO THE FINANCIAL STATEMENTS
FOR THE YEAR ENDED 31 DECEMBER 2020
(All amounts in EUR thousand unless otherwise stated)
Page 81 of 113
15. LOANS TO THE PUBLIC AND CREDIT INSTITUTIONS (CONTINUED)
(Concluded)
The table below shows Group’s and Bank’s gross carrying amounts and ECL allowances for credit-impaired loans divided by stage
3 and the fair value of collaterals for these assets as at 31 December 2020:
The table below shows Group’s and Bank’s gross carrying amounts and ECL allowances for credit-impaired loans divided by stage 3 and the fair value of collaterals for these assets as at 31 December 2019:
The Group and the Bank
Stage 1 (12-
month ECL)
Stage 2 (lifetime
ECL)
Stage 3 (credit
impaired/lifetime
ECL) Total
Financial guarantees and loan commitments
ECL allowance as at 1 January 2019 -341 -1,656 -4,965 -6,962
New and derecognised financial assets, net -215 50 6,147 5,982
Changes due to change in credit risk 154 -19 -1,673 -1,538
Changes due to methodology change 12 - - 12
Exchange rate differences 1 -15 -120 -134
Total -389 -1,640 -611 -2,640
Total loans and financial guarantees and loan commitments
ECL allowance as at 1 January 2019 -2,784 -4,338 -64,364 -71,486
New and derecognised financial assets, net -954 201 29,450 28,697
Changes due to change in credit risk 944 329 -14,375 -13,102
Total investment grade 6,063,189 140,083 42,529 6,245,801
Total standard monitoring 2,140,099 10,104 - 2,150,203
Total watch list 4,158 56,187 - 60,345
Total default - - 64,654 64,654
Total 8,207,446 206,374 107,183 8,521,003
The Group and the Bank
AB SEB bankas
NOTES TO THE FINANCIAL STATEMENTS
FOR THE YEAR ENDED 31 DECEMBER 2020
(All amounts in EUR thousand unless otherwise stated)
Page 83 of 113
15. LOANS TO THE PUBLIC AND CREDIT INSTITUTIONS (CONTINUED)
31 December 2019
Stage 1 (12-
month ECL)
Stage 2 (lifetime
ECL)
Stage 3 (credit
impaired/lifetime
ECL) Total
Risk classification category
Central banks
Investment grade - - - -
Standard monitoring - - - -
Watch list - - - -
Default - - - -
- - - -
General governments
Investment grade 58,142 29 - 58,171
Standard monitoring 1,231 4 - 1,235
Watch list - - - -
Default - - - -
59,373 33 - 59,406
Credit institutions
Investment grade 4,517 - - 4,517
Standard monitoring 159 - - 159
Watch list - - - -
Default - - - -
4,676 - - 4,676
Other financial corporations
Investment grade 100 2 - 102
Standard monitoring 2,732 43 - 2,775
Watch list - - - -
Default - - - -
2,832 45 - 2,877
Non-financial corporations
Investment grade 522,732 17,420 48 540,200
Standard monitoring 2,714,125 15,274 10 2,729,409
Watch list 629 34,664 - 35,293
Default - - 61,684 61,684
3,237,486 67,358 61,742 3,366,586
Households
Investment grade 261 110 176 547
Standard monitoring 2,593,257 243,962 2,207 2,839,426
Watch list - 551 - 551
Default 75 614 49,876 50,565
2,593,593 245,237 52,259 2,891,089
Total Loans to public and credit institutions by risk
classification category
Investment grade 585,752 17,561 224 603,537
Standard monitoring 5,311,504 259,283 2,217 5,573,004
Watch list 629 35,215 - 35,844
Default 75 614 111,560 112,249
Total 5,897,960 312,673 114,001 6,324,634
Financial guarantees and Loan commitments
Investment grade 453,238 42,777 20 496,035
Standard monitoring 755,920 7,126 - 763,046
Watch list 1,366 8,662 - 10,028
Default 8 23 4,204 4,235
1,210,532 58,588 4,224 1,273,344
Total by risk classification category
Total investment grade 1,038,990 60,338 244 1,099,572
Total standard monitoring 6,067,424 266,409 2,217 6,336,050
Total watch list 1,995 43,877 - 45,872
Total default 83 637 115,764 116,484
Total 7,108,492 371,261 118,225 7,597,978
The Group and the Bank
AB SEB bankas
NOTES TO THE FINANCIAL STATEMENTS
FOR THE YEAR ENDED 31 DECEMBER 2020
(All amounts in EUR thousand unless otherwise stated)
Page 84 of 113
16. DEBT SECURITIES
As at 31 December 2020 and 2019 majority of the Group’s and the Bank’s financial assets designated at fair value through profit
or loss represent investments in Lithuanian and Latvian Government securities.
The revaluation result on financial assets at fair value through profit or loss is accounted in income statement under Net financial
income.
The table below presents an analysis of Bank’s trading debt securities and financial assets at fair value through profit or loss by
rating agency designation at 31 December 2020 and 2019, based on Standard & Poor’s ratings or their equivalent:
17. DERIVATIVES
The Group and the Bank utilise the following derivative instruments for both hedging and non-hedging purposes.
Group’s and Bank’s derivative financial instruments:
31/12/2020 31/12/2019 31/12/2020 31/12/2019
Fair value through profit or loss held for trading 11,010 43,947 11,010 43,947
Fair value through profit or loss mandatorily 475,875 385,358 475,875 385,358
Total 486,885 429,305 486,885 429,305
The Group The Bank
31/12/2020 31/12/2019
A+ 461,067 429,305
AAA 25,308 -
BBB- 510 -
Total 486,885 429,305
31 December 2020 Purchase Sale Assets Liabilities
Interest related 1,310,967 1,310,967 11,657 15,917
Currency related 254,339 253,942 4,469 4,085
Total 1,565,306 1,564,909 16,126 20,002
Notional amount Fair value
31 December 2019 Purchase Sale Assets Liabilities
Interest related 1,064,036 1,066,036 10,753 13,846
Currency related 975,885 975,324 72,954 72,025
Total 2,039,921 2,041,360 83,707 85,871
Notional amount Fair value
AB SEB bankas
NOTES TO THE FINANCIAL STATEMENTS
FOR THE YEAR ENDED 31 DECEMBER 2020
(All amounts in EUR thousand unless otherwise stated)
Page 85 of 113
18. EQUITY INSRUMENTS
The table below shows breakdown of equity instruments as at 31 December 2020 and 2019.
Equity instruments in VISA Inc. amount to EUR 5,146 thousand. Visa Inc. long-term rating is AA- based on Standard & Poor’s ratings.
More information about VISA Inc. shares is provided in the Note 3 Fair value measurement of assets and liabilities.
19. INVESTMENTS IN SUBSIDIARIES
UAB “SEB investicijų valdymas” is a fully owned subsidiary of the Bank, engaged in provision of investments’ management services.
31/12/2020 31/12/2019 31/12/2020 31/12/2019
Fair value through profit or loss mandatorily 5,204 10,153 5,204 10,153
Total equity instruments 5,204 10,153 5,204 10,153
The Group The Bank
31/12/2020 31/12/2019 31/12/2020 31/12/2019
Securities accounted for under cost method:
UAB "SEB investicijų valdymas" - - 2,871 2,871
Total investments in subsidiaries - - 2,871 2,871
The Group The Bank
AB SEB bankas
NOTES TO THE FINANCIAL STATEMENTS
FOR THE YEAR ENDED 31 DECEMBER 2020
(All amounts in EUR thousand unless otherwise stated)
Page 86 of 113
20. INTANGIBLE ASSETS
As at 31 December 2020 and 2019, intangible assets of the Group and the Bank consisted of the following:
In 2020 the Bank has finalized and launched new core IT platform, which operates majority of its banking services and business processes. With the launch of the new IT platform in Lithuania, SEB Group has completed its IT system alignment process in all the
three Baltic countries. The carrying amount of core IT platform was EUR 12,800 thousand as at 31 December 2020, its estimated
useful life is 8 years.
During the year 2020 acquisitions from internal developments amounted to EUR 1,162 thousand (2,099).
The Group The Bank
Intangible assets Intangible assets
2020
Balance at 1 January 2020 53,857 53,805
Additions 3,886 3,886
Retirements and disposals -32,159 -32,155
Acquisition cost at 31 December 2020 25,584 25,536
Balance at 1 January 2020 -41,532 -41,480
Amortisation (Note 9) -1,423 -1,423
Retirements and disposals 32,159 32,155
Accumulated amortisation and impairment at 31 December
2020-10,796 -10,748
Net book value at 31 December 2020 14,788 14,788
2019
Balance at 1 January 2019 47,937 47,885
Additions 6,332 6,332
Retirements and disposals -412 -412
Acquisition cost at 31 December 2019 53,857 53,805
Balance at 1 January 2019 -41,380 -41,328
Amortisation (Note 9) -564 -564
Retirements and disposals 412 412
Accumulated amortisation and impairment at 31 December
2019-41,532 -41,480
Net book value at 31 December 2019 12,325 12,325
AB SEB bankas
NOTES TO THE FINANCIAL STATEMENTS
FOR THE YEAR ENDED 31 DECEMBER 2020
(All amounts in EUR thousand unless otherwise stated)
Page 87 of 113
21. PROPERTY, PLANT AND EQUIPMENT
As at 31 December 2020 and 2019, property and equipment of the Group consisted of the following:
Land Other equipment Total
2020
Balance at 1 January 2020 46 22,966 23,012
Additions - 8,377 8,377
Reclassifications - -234 -234
Retirements and disposals - -9,121 -9,121
Acquisition cost at 31 December 2020 46 21,988 22,034
Balance at 1 January 2020 - -13,908 -13,908
Depreciation (Note 9) - -2,802 -2,802
Reclassifications - 101 101
Retirements and disposals - 8,596 8,596
Accumulated depreciation and impairment at 31 December 2020 - -8,013 -8,013
Net book value at 31 December 2020 46 13,975 14,021
2019
Balance at 1 January 2019 46 27,719 27,765
Additions - 2,538 2,538
Reclassifications - -40 -40
Retirements and disposals - -7,251 -7,251
Acquisition cost at 31 December 2019 46 22,966 23,012
Balance at 1 January 2019 - -18,032 -18,032
Depreciation (Note 9) - -2,661 -2,661
Reclassifications - 23 23
Retirements and disposals - 6,762 6,762
Accumulated depreciation and impairment at 31 December 2019 - -13,908 -13,908
Net book value at 31 December 2019 46 9,058 9,104
The Group
AB SEB bankas
NOTES TO THE FINANCIAL STATEMENTS
FOR THE YEAR ENDED 31 DECEMBER 2020
(All amounts in EUR thousand unless otherwise stated)
Page 88 of 113
21. PROPERTY, PLANT AND EQUIPMENT (CONTINUED)
As at 31 December 2020 and 2019, property and equipment of the Bank consisted of the following:
Land Other equipment Total
2020
Balance at 1 January 2020 46 22,893 22,939
Additions - 8,344 8,344
Reclassifications - -234 -234
Retirements and disposals - -9,076 -9,076
Acquisition cost at 31 December 2020 46 21,927 21,973
Balance at 1 January 2020 - -13,844 -13,844
Depreciation (Note 9) - -2,796 -2,796
Reclassifications - 102 102
Retirements and disposals - 8,551 8,551
Accumulated depreciation and impairment at 31 December 2020 - -7,987 -7,987
Net book value at 31 December 2020 46 13,940 13,986
2019
Balance at 1 January 2019 46 27,580 27,626
Additions - 2,536 2,536
Reclassifications - -40 -40
Retirements and disposals - -7,183 -7,183
Acquisition cost at 31 December 2019 46 22,893 22,939
Balance at 1 January 2019 - -17,940 -17,940
Depreciation (Note 9) - -2,651 -2,651
Reclassifications - 23 23
Retirements and disposals - 6,724 6,724
Accumulated depreciation and impairment at 31 December 2019 - -13,844 -13,844
Net book value at 31 December 2019 46 9,049 9,095
The Bank
AB SEB bankas
NOTES TO THE FINANCIAL STATEMENTS
FOR THE YEAR ENDED 31 DECEMBER 2020
(All amounts in EUR thousand unless otherwise stated)
Page 89 of 113
22. LEASES
In June 2020 the Group and the Bank started to lease the Business centre, which was constructed according to the agreed
specifications. Initial lease term is 10 years.
Lessor portfolio mainly includes transport vehicles, machinery and facilities. Residual value risk is not significant, because of the existence of secondary market.
Undiscounted lease payments expected after reporting date and
within
year 1 295,043 283,178 295,043 283,178
year 2 227,668 237,006 227,668 237,006
year 3 135,009 174,393 135,009 174,393
year 4 65,659 40,536 65,659 40,536
year 5 29,295 59,871 29,295 59,871
year >5 10,483 8,544 10,483 8,544
Total undiscounted lease payments receivable 763,157 803,528 763,157 803,528
Unearned finance income -23,794 -24,357 -23,794 -24,357
Net investment in leasing 739,363 779,171 739,363 779,171
Finance income (interest income) on the net investment16,812 14,839 16,812 14,839
The Group The Bank
AB SEB bankas
NOTES TO THE FINANCIAL STATEMENTS
FOR THE YEAR ENDED 31 DECEMBER 2020
(All amounts in EUR thousand unless otherwise stated)
Page 90 of 113
23. INVESTMENT PROPERTY
As at 31 December 2020 and 2019, investment property of the Group and the Bank consisted of the following:
The fair value of investment property was established in compliance with the procedures adopted within the SEB Group. The fair
value of investment property does not differ materially from its book value as at 31 December 2020 and 31 December 2019.
The major amount of investment property is foreclosed leased assets (land and buildings) taken over from the clients. The Bank is aiming to realise foreclosed assets.
The Group The Bank
Investment
property
Investment
property
2020
Balance at 1 January 2020 1,150 1,150
Additions (taken over) 606 606
Retirements and disposals -305 -305
Acquisition cost at 31 December 2020 1,451 1,451
Balance at 1 January 2020 -369 -369
Depreciation (Note 9) -29 -29
Retirements and disposals 11 11
Accumulated depreciation and impairment at 31 December 2020 -387 -387
Net book value at 31 December 2020 1,064 1,064
2019
Balance at 1 January 2019 1,611 1,611
Additions (taken over) 523 523
Retirements and disposals -984 -984
Acquisition cost at 31 December 2019 1,150 1,150
Balance at 1 January 2019 -540 -540
Depreciation (Note 9) -27 -27
Retirements and disposals 198 198
Accumulated depreciation and impairment at 31 December 2019 -369 -369
Net book value at 31 December 2019 781 781
AB SEB bankas
NOTES TO THE FINANCIAL STATEMENTS
FOR THE YEAR ENDED 31 DECEMBER 2020
(All amounts in EUR thousand unless otherwise stated)
Page 91 of 113
24. OTHER ASSETS
There are no significant overdue or impaired amounts.
The carrying values of Other financial assets approximates their fair value.
25. PREPAID EXPENSES AND ACCRUED INCOME
26. DEPOSITS FROM CENTRAL BANKS AND CREDIT INSTITUTIONS
27. DEPOSITS AND BORROWINGS FROM THE PUBLIC
Deposits and borrowings from the public by type of customer:
According to the Republic of Lithuania Law on Insurance of Deposits and Liabilities to Investors the Bank has to make annual
payments to funds of Deposit Insurance and Liabilities to Investors. Since 2015, all deposits, which are the object of Deposit
Insurance according to the law, nominated in all the currencies, but not exceeding EUR 100 thousand equivalent, are covered.
31/12/2020 31/12/2019 31/12/2020 31/12/2019
Sub-lease receivables 667 81 848 102
Trade receivables 1,062 1,261 302 496
Client receivables 19,969 2,272 19,969 2,272
Cash in transit 5 25,266 5 25,266
Other assets 4,048 3,688 3,985 3,661
Total 25,751 32,568 25,109 31,797
The Group The Bank
31/12/2020 31/12/2019 31/12/2020 31/12/2019
Prepaid expenses 3,044 4,023 3,024 4,012
Accrued income 1,955 1,600 2,878 2,588
Total 4,999 5,623 5,902 6,600
The Group The Bank
31/12/2020 31/12/2019 31/12/2020 31/12/2019
Current and demand deposits 47,601 110,099 47,601 110,099
Term deposits 598,894 448,971 598,894 448,971
Total 646,495 559,070 646,495 559,070
The Group The Bank
31/12/2020 31/12/2019 31/12/2020 31/12/2019
General governments 284,092 406,810 284,092 406,810
Other financial corporations 217,107 169,412 224,404 176,936
(All amounts in EUR thousand unless otherwise stated)
Page 92 of 113
28. PROVISIONS
As at 31 December 2020 and 2019, provisions consisted of the following:
Provisions for off-balance sheet items have been made in respect of ECL arising from contingent liabilities and contractual
commitments, including guarantees and credit commitments.
Movement of provisions for off-balance sheet liabilities for the year 2020 and 2019 is presented in Note 15.
Other provisions comprise pension reserve, formed in 2020 according to Labour Law of Republic of Lithuania requirement - at the
time of employee retirement, employer has obligation for 2 salaries payout. Payout amount is accrued during the period of
employment.
Movement of provisions for long-term employee benefits and other provisions is presented below. Accounting policy for long-term employee benefits is disclosed in Note 1.19.3 Defined contribution plans.
29. OTHER LIABILITIES
The carrying values of Other financial liabilities approximates their fair value
30. ACCRUED EXPENSES AND PREPAID INCOME
31/12/2020 31/12/2019 31/12/2020 31/12/2019
Provisions for off-balance sheet liabilities 3,693 2,640 3,693 2,640
Provisions for long-term employee benefits 3,679 3,280 3,640 3,280
(All amounts in EUR thousand unless otherwise stated)
Page 93 of 113
31. ISSUED CAPITAL AND RESERVES
Authorised shares
100 per cent of authorised shares of the Bank is owed by Skandinaviska Enskilda Banken AB (publ), registered in Sweden.
Other capital reserves
Number of shares
Percentage of
total number Paid-in capital Number of shares
Percentage of
total number Paid-in capital
Ordinary shares of 19.4 EUR
par value each, fully paid 15,441,423 100% 299,564 15,441,423 100% 299,564
31/12/2020 31/12/2019
The Group Reserve capital Legal reserve
General and other
reserves Total
Balance at 1 January 2019 637 171,908 3,485 176,030
Share-based compensation - - 261 261
Realisation of share-based compensation - - -780 -780
Transfers to reserves - 14,638 - 14,638
Balance at 31 December 2019 637 186,546 2,966 190,149
Balance at 1 January 2020 637 186,546 2,966 190,149
Share-based compensation - - 484 484
Realisation of share-based compensation - - -261 -261
Transfers to reserves - 14,500 - 14,500
Balance at 31 December 2020 637 201,046 3,189 204,872
The Bank Reserve capital Legal reserve
General and other
reserves Total
Balance at 1 January 2019 637 171,622 3,484 175,743
Share-based compensation - - 261 261
Realisation of share-based compensation - - -780 -780
Transfers to reserves - 14,638 - 14,638
Balance at 31 December 2019 637 186,260 2,965 189,862
Balance at 1 January 2020 637 186,260 2,965 189,862
Share-based compensation - - 484 484
Realisation of share-based compensation - - -261 -261
Transfers to reserves - 14,500 - 14,500
Balance at 31 December 2020 637 200,760 3,188 204,585
AB SEB bankas
NOTES TO THE FINANCIAL STATEMENTS
FOR THE YEAR ENDED 31 DECEMBER 2020
(All amounts in EUR thousand unless otherwise stated)
Page 94 of 113
32. ASSETS UNDER MANAGEMENT
For the year ended 31 December 2020 the management fee for funds management in the Group amounted to EUR 7,270 thousand (7,890), and for the Bank to EUR 542 thousand (193). It is included in Net fee and commission income line in the income statement.
33. FINANCIAL INSTRUMENTS BY MEASUREMENT CATEGORIES
Distribution of Group’s and Bank’s assets, liabilities and equity by measurement categories is presented in the tables below.
31/12/2020
(unaudited)31/12/2019 31/12/2020 31/12/2019
Pension funds 1,216,068 1,038,528 - -
Customer portfolios managed on a discretionary basis 335,581 318,257 32,123 17,114
Other investment vehicles 63,493 58,971 63,493 58,971
Total 1,615,142 1,415,756 95,616 76,085
The Group The Bank
The Group
Assets FVHFT* FVMPL** AmC*** Total
Cash and balances with central bank - - 1,934,827 1,934,827
Loans to credit institutions - - 1,886,403 1,886,403
Loans to the public - - 5,810,488 5,810,488
Debt securities 11,010 475,875 - 486,885
Derivatives 16,126 - - 16,126
Equity instruments - 5,204 - 5,204
Other financial assets - - 21,036 21,036
Total financial assets 27,136 481,079 9,652,754 10,160,969
Other assets (non-financial) - - - 71,845
Total 27,136 481,079 9,652,754 10,232,814
Liabilities FVHFT* FVMPL** AmC*** Total
Deposits from central banks and credit institutions - - 646,495 646,495
Deposits and borrowings from the public - - 8,576,872 8,576,872
Derivatives 20,002 - - 20,002
Other financial liabilities - - 91,195 91,195
Total financial liabilities 20,002 - 9,314,562 9,334,564
Other liabilities (non-financial) - - - 21,004
Equity - - - 877,246
Total 20,002 - 9,314,562 10,232,814
31/12/2020
AB SEB bankas
NOTES TO THE FINANCIAL STATEMENTS
FOR THE YEAR ENDED 31 DECEMBER 2020
(All amounts in EUR thousand unless otherwise stated)
Page 95 of 113
33. FINANCIAL INSTRUMENTS BY MEASUREMENT CATEGORIES (CONTINUED)
The Group
Assets FVHFT* FVMPL** AmC*** Total
Cash and balances with central bank - - 1,610,925 1,610,925
Loans to credit institutions - - 65,584 65,584
Loans to the public - - 6,266,651 6,266,651
Debt securities 43,947 385,358 - 429,305
Derivatives 83,707 - - 83,707
Equity instruments - 10,153 - 10,153
Other financial assets - - 28,799 28,799
Total financial assets 127,654 395,511 7,971,959 8,495,124
Other assets (non-financial) - - - 43,116
Total 127,654 395,511 7,971,959 8,538,240
Liabilities FVHFT* FVMPL** AmC*** Total
Deposits from central banks and credit institutions - - 559,070 559,070
Deposits and borrowings from the public - - 7,009,600 7,009,600
Derivatives 85,871 - - 85,871
Other financial liabilities - - 69,398 69,398
Total financial liabilities 85,871 - 7,638,068 7,723,939
Other liabilities (non-financial) - - - 30,670
Equity - - - 783,631
Total 85,871 - 7,638,068 8,538,240
31/12/2019
The Bank
Assets FVHFT* FVMPL** AmC*** Total
Cash and balances with central bank - - 1,934,827 1,934,827
Loans to credit institutions - - 1,886,403 1,886,403
Loans to the public - - 5,810,488 5,810,488
Debt securities 11,010 475,875 - 486,885
Derivatives 16,126 - - 16,126
Equity instruments - 5,204 - 5,204
Other financial assets - - 20,276 20,276
Total financial assets 27,136 481,079 9,651,994 10,160,209
Other assets (non-financial) - - - 75,511
Total 27,136 481,079 9,651,994 10,235,720
Liabilities FVHFT* FVMPL** AmC*** Total
Deposits from central banks and credit institutions - - 646,495 646,495
Deposits and borrowings from the public - - 8,584,169 8,584,169
Derivatives 20,002 - - 20,002
Other financial liabilities - - 84,978 84,978
Total financial liabilities 20,002 - 9,315,642 9,335,644
Other liabilities (non-financial) - - - 26,930
Equity - - - 873,146
Total 20,002 - 9,315,642 10,235,720
31/12/2020
AB SEB bankas
NOTES TO THE FINANCIAL STATEMENTS
FOR THE YEAR ENDED 31 DECEMBER 2020
(All amounts in EUR thousand unless otherwise stated)
Page 96 of 113
33. FINANCIAL INSTRUMENTS BY MEASUREMENT CATEGORIES (CONTINUED)
*FVHFT - Fair Value Through Profit or Loss Held for Trading **FVMPL - Fair Value Through Profit or Loss Mandatorily ***AmC - Amortised Cost
The Bank
Assets FVHFT* FVMPL** AmC*** Total
Cash and balances with central bank - - 1,610,925 1,610,925
Loans to credit institutions - - 65,584 65,584
Loans to the public - - 6,266,651 6,266,651
Debt securities 43,947 385,358 - 429,305
Derivatives 83,707 - - 83,707
Equity instruments - 10,153 - 10,153
Other financial assets - - 28,034 28,034
Total financial assets 127,654 395,511 7,971,194 8,494,359
Other assets (non-financial) - - - 46,915
Total 127,654 395,511 7,971,194 8,541,274
Liabilities FVHFT* FVMPL** AmC*** Total
Deposits from central banks and credit institutions - - 559,070 559,070
Deposits and borrowings from the public - - 7,017,124 7,017,124
Derivatives 85,871 - - 85,871
Other financial liabilities - - 69,214 69,214
Total financial liabilities 85,871 - 7,645,408 7,731,279
Other liabilities (non-financial) - - - 30,587
Equity - - - 779,408
Total 85,871 - 7,645,408 8,541,274
31/12/2019
AB SEB bankas
NOTES TO THE FINANCIAL STATEMENTS
FOR THE YEAR ENDED 31 DECEMBER 2020
(All amounts in EUR thousand unless otherwise stated)
Page 97 of 113
34. CURRENT AND NON-CURRENT ASSETS AND LIABILITIES
The GroupCurrent assets
Non-current
assets Total Current assets
Non-current
assets Total
Assets
Cash and balances with
central bank 1,934,827 - 1,934,827 1,610,925 - 1,610,925
Loans to credit institutions 1,886,403 - 1,886,403 65,584 - 65,584
Loans to the public 1,386,003 4,424,485 5,810,488 1,536,092 4,730,559 6,266,651
Current income tax liabilities 1,758 - 1,758 11,884 - 11,884
Deferred income tax
liabilities - 40 40 - 320 320
Provisions 3,204 4,727 7,931 2,294 3,626 5,920
Other liabilities 64,743 30,368 95,111 54,537 18,034 72,571
Accrued expenses and
prepaid income 6,959 109 7,068 6,322 2,784 9,106
Total liabilities 8,725,028 637,546 9,362,574 7,305,598 456,268 7,761,866
Net -3,423,369 4,296,515 873,146 -3,828,739 4,608,147 779,408
31/12/2020 31/12/2019
AB SEB bankas
NOTES TO THE FINANCIAL STATEMENTS
FOR THE YEAR ENDED 31 DECEMBER 2020
(All amounts in EUR thousand unless otherwise stated)
Page 99 of 113
35. OFFSETTING FINANCIAL ASSETS AND FINANCIAL LIABILITIES
The following financial assets and liabilities of the Group and the Bank as at 31 December 2020 are subject to offsetting, enforceable master netting arrangements and similar agreements:
The following financial assets and liabilities of the Group and the Bank as at 31 December 2019 are subject to offsetting, enforceable master netting arrangements and similar agreements:
Assets
Gross amounts of
recognised financial assets
Gross amounts of
recognised financial
liabilities set off in the
balance sheet
Net amounts of financial
assets recognised in the
balance sheet
Related amounts not set off
in the balance sheet Cash collateral received Net amount
TOTAL 269,442 249,407 20,035 10 31 20,025 12 20,002
Enforceable master netting arrangement and similar arrangement
Enforceable master netting arrangement and similar arrangement
AB SEB bankas
NOTES TO THE FINANCIAL STATEMENTS
FOR THE YEAR ENDED 31 DECEMBER 2020
(All amounts in EUR thousand unless otherwise stated)
Page 100 of 113
35. OFFSETTING FINANCIAL ASSETS AND FINANCIAL LIABILITIES (CONTINUED)
The tables above show financial assets and liabilities that are presented net in the statement of financial position or with potential
rights to offset associated with enforceable master netting arrangements or similar arrangements, together with related
collateral. Financial assets and liabilities are presented net in the statement of financial position when the Bank has legally
enforceable rights to set-off, in the ordinary cause of business and in the case of bankruptcy, and intends to settle on a net basis or to realize the assets and settle the liabilities simultaneously.
Financial assets and liabilities subject to enforceable master netting arrangements or similar arrangements that are not presented
net in the statement of financial position are arrangements that are usually enforceable in the case of bankruptcy or default but
not in the ordinary course of business or arrangements where SEB does not have the intention to settle the instruments simultaneously.
36. RECONCILIATION OF LIABILITIES ARISING FROM FINANCING ACTIVITIES
The table below details changes in the Group’s and Bank’s liabilities arising from financing activities, including both cash and non-
cash changes:
Other changes comprise new lease contracts entered during the reporting period and effect of remeasurement of contracts.
Other changes comprise changes in accrued interest.
37. RELATED PARTIES
The following are considered to be related parties to the Group and the Bank:
- key management personnel;
- parent company;
- companies consolidated by the parent company;
- subsidiaries;
- associates to parent company.
Key management personnel are considered to be Board members of the Bank.
Transactions with related parties
A number of banking transactions are entered into with related parties in the normal course of business. The following table
provides the total amount of transactions and year-end balances that have been entered into with related parties for the relevant
(All amounts in EUR thousand unless otherwise stated)
Page 106 of 113
39. CAPITAL ADEQUACY (CONTINUED)
The table below summarises the components of capital adequacy calculation and the ratios of the Group and the Bank for the year
ended 31 December 2020 and 2019:
Own funds and Capital ratio for the year 2019 were adjusted comparing to those reported in 2019 financial statements, because dividends were not paid out because of regulatory restrictions, so audited profit was included in own funds and capital ratio
increased.
As at 31 December 2020 and 2019 and throughout 2020 and 2019, the Group and the Bank were compliant with the capital
adequacy minimum requirements.
31/12/2020 31/12/2019 31/12/2020 31/12/2019
Capital base
1. Own funds 821,205 767,606 817,104 763,383
1.1. Tier 1 capital 810,821 756,338 806,720 752,115
1.1.2. Common equity Tier 1 capital 810,821 756,338 806,720 752,115
2. Tier 2 capital 10,384 11,268 10,384 11,268
Risk weighted assets (RWA)
Total risk exposure amount
1. Risk weighted exposure amounts for credit, counterparty credit
and dilution risks and free deliveries 3,629,895 3,153,372 3,629,588 3,153,547
of which capital conservation buffer requirement 2.5% 2.5% 2.5% 2.5%
of which systemic risk buffer requirement 0.0% 0.0% 0.0% 0.0%
of which countercyclical capital buffer requirement 0.0% 1.0% 0.0% 1.0%
of which other systemically important institution buffer 2.0% 2.0% 2.0% 2.0%
The Group The Bank
AB SEB bankas
NOTES TO THE FINANCIAL STATEMENTS
FOR THE YEAR ENDED 31 DECEMBER 2020
(All amounts in EUR thousand unless otherwise stated)
Page 107 of 113
40. RECLASSIFICATION OF COMPARATIVE INFORMATION
In 2020 financial statements, the Group and the Bank continued alignment of presentation of primary financial statements and
disclosure notes with SEB group banks in Baltic states. As a result of alignment, the Group and the Bank have made certain
reclassifications in the Statement of financial position and Income statement. The management believes that these
reclassifications provide reliable and more relevant information. The corresponding figures were adjusted to reflect the new classification. Due to unreasonably high effort required for preparation, and low informativeness, Statement of financial position
as at 1 January 2019 is not presented for comparative purposes.
Details of reclassifications made are presented in the tables below.
Statement of financial position
Reclassification of Other assets and Other liabilities
In course of alignment with SEB group banks in Baltic states, it was agreed to change presentation of “Other financial assets” and “Other non-financial assets” and present “Other assets” and “Prepaid expenses and accrued income” lines on the face of statement
of financial position. This resulted in some movements between the lines, however total amount remained unchanged.
“Other financial liabilities” and “Other non-financial liabilities” lines in the statement of financial position were reclassified to “Other
liabilities” and “Accrued expenses and prepaid income”. This resulted in some movements between the lines, however total amount remained unchanged.
31/12/2019
reported
Change in
classification
31/12/2019
reclassified
31/12/2019
reported
Change in
classification
31/12/2019
reclassified
Assets
Other financial assets 30,874 -30,874 - 31,862 -31,862 -
Other non-financial assets 7,317 -7,317 - 6,535 -6,535 -
Other assets - 32,568 32,568 - 31,797 31,797
Prepaid expenses and accrued income - 5,623 5,623 - 6,600 6,600
Total assets 38,191 - 38,191 38,397 - 38,397
Liabilities
Other financial liabilities 63,083 -63,083 - 63,083 -63,083 -
Other non-financial liabilities 18,861 -18,861 - 18,594 -18,594 -
Other liabilities - 72,654 72,654 - 72,571 72,571
Accrued expenses and prepaid income - 9,290 9,290 - 9,106 9,106
Total liabilities 81,944 - 81,944 81,677 - 81,677
The Group The Bank
AB SEB bankas
NOTES TO THE FINANCIAL STATEMENTS
FOR THE YEAR ENDED 31 DECEMBER 2020
(All amounts in EUR thousand unless otherwise stated)
Page 108 of 113
40. RECLASSIFICATION OF COMPARATIVE INFORMATION (CONTINUED)
Income statement
Following reclassifications were made in the income statement as a result of presentation alignment:
1) personnel training, share-based payments expenses and some other personnel related expenses were reclassified from Other expenses to Personnel expenses;
2) banking risk insurance expenses were reclassified from Fee and commission expenses to Other expenses;
3) dividend income from equity instruments was reclassified from Other operating income to Net financial income;
4) some other minor reclassifications.
Changes in the income statement have triggered reclassifications in the Net cash from operating activities before change in
operating assets and liabilities in the statement of cash flows:
2019 Reported Reclassification
2019
Reclassified 2019 Reported Reclassification
2019
Reclassified
Interest income calculated using the effective interest rate method121,172 107 121,279 121,323 106 121,429
Other interest and similar income 18,915 - 18,915 18,915 - 18,915
Other payments -3,281 -2,776 850 804 -2,431 -1,972
Income tax paid -14,130 -13,673 - - -14,130 -13,673
Net cash from operating activities before change in
operating assets and liabilities 163,884 161,733 - - 163,884 161,733
ReclassifiedReported Reclassification
AB SEB bankas
NOTES TO THE FINANCIAL STATEMENTS
FOR THE YEAR ENDED 31 DECEMBER 2020
(All amounts in EUR thousand unless otherwise stated)
Page 109 of 113
41. EVENTS AFTER THE REPORTING DATE
No significant events occurred between the end of reporting period and date when the financial statements were authorised for
issue.
*****
The financial statements were approved by the Board of the Bank on 10 March 2021 and signed by:
President of AB SEB bankas Raimondas Kvedaras
Head of Business Support Division and Chief Financial Officer of AB SEB bankas Aivaras Čičelis
A member firm of Ernst & Young Global Limited
UAB „Ernst & Young Baltic“ Aukštaičių g. 7 LT-11341 Vilnius Lietuva Tel.: (8 5) 274 2200 Faks.: (8 5) 274 2333 [email protected] www.ey.com Juridinio asmens kodas 110878442 PVM mokėtojo kodas LT108784411 Juridinių asmenų registras
Ernst & Young Baltic UAB Aukštaičių St. 7 LT-11341 Vilnius Lithuania Tel.: +370 5 274 2200 Fax: +370 5 274 2333 [email protected] www.ey.com Code of legal entity 110878442 VAT payer code LT108784411 Register of Legal Entities
INDEPENDENT AUDITOR’S REPORT
To the shareholder of AB SEB bankas Report on the Audit of the Company’s and Consolidated Financial Statements
Opinion
We have audited the accompanying separate financial statements of AB SEB bankas, a public limited liability company registered in the Republic of Lithuania (hereinafter the Company), and the consolidated financial statements of AB SEB bankas and its subsidiaries (hereinafter the Group), which comprise the statements of financial position as of 31 December 2020, the statements of income, comprehensive income, changes in equity and cash flows for the year then ended, and notes to the financial statements, including a summary of significant accounting policies. In our opinion, the accompanying financial statements present fairly, in all material respects, the financial position of the Company and the Group as at 31 December 2020 and their financial performance and their cash flows for the year then ended in accordance with International Financial Reporting Standards as adopted by the European Union. Basis for opinion
We conducted our audit in accordance with International Standards on Auditing (ISAs) and Regulation (EU) No 537/2014 of the European Parliament and of the Council of 16 April 2014 on specific requirements regarding statutory audit of public-interest entities (regulation (EU) No 537/2014 of the European Parliament and of the Council). Our responsibilities under those standards are further described in the Auditor’s responsibilities for the audit of the financial statements section of our report. We are independent of the Company and the Group in accordance with the International Code of Ethics for Professional Accountants (including International Independence Standards) (IESBA Code) together with the requirements of the Law on Audit of the financial statements of the Republic of Lithuania that are relevant to the audit in the Republic of Lithuania, and we have fulfilled our other ethical responsibilities in accordance with the Law on Audit of the financial statements of the Republic of Lithuania and the IESBA Code. We believe that the audit evidence we have obtained is sufficient and appropriate to provide a basis for our opinion. Key audit matters
Key audit matters are those matters that, in our professional judgment, were of most significance in our audit of the financial statements of the current period. These matters were addressed in the context of our audit of the financial statements as a whole, and in forming our opinion thereon, and we do not provide a separate opinion on these matters. We have fulfilled the responsibilities described in the Auditor’s responsibilities for the audit of the financial statements section of our report, including in relation to these matters. Accordingly, our audit included the performance of procedures designed to respond to our assessment of the risks of material misstatement of the financial statements. The results of our audit procedures, including the procedures performed to address the matters below, provide the basis for our audit opinion on the accompanying financial statements.
A member firm of Ernst & Young Global Limited
Key audit matter How the matter was addressed in the audit
The carrying amount of loans to the public as at 31 December 2020 amounted to EUR 5 810 million, the impairment charge recognized in 2020 amounted to EUR 15 million and the total impairment loss allowance as at 31 December 2020 amounted to EUR 61.2 million in the Group`s financial statements.
The basis of the Bank’s and the Group’s impairment provision policy is presented in the accounting policies section in Notes 1.8 and 1.24.1 to the financial statements. Critical accounting estimates and judgments, disclosures of loans and guarantees and the credit risk management are set out in Notes 2.1, 11 and 15 to the financial statements.
Loan receivables are significant to the total assets of the consolidated and the Bank’s financial statements.
We identified this area to be significant for the audit because the recognition and measurement of allowances for loan loss impairment reflected in the Group’s and the Company’s expected credit loss model are associated with significant estimation, as they require the management to exercise judgement and apply complex and subjective assumptions both about the timing and amounts of such impairment. Key areas of judgement include the identification of exposures with a significant deterioration in credit quality, assumptions used in the expected credit loss model such as the financial condition of the counterparty, expected future cash flows and forward-looking macroeconomic factors.
Due to the above circumstances, we considered loan impairment assessment to be a key audit matter.
Our audit procedures included, among others, the following:
We gained understanding and tested the key controls over the loan issuance, booking and monitoring and loan impairment provisioning processes.
We obtained and read the Group’s and the Company’s impairment policy that is based on IFRS 9. With the support of IFRS 9 specialists, we assessed the compliance of the policy and the model with the requirements of IFRS 9 by assessing each significant model component: exposure at default, probability of default and loss given default, definitions of default and significant increase in credit risk, use of macroeconomic scenarios.
In addition to testing key controls, for a sample of loans we performed testing of the loan portfolio by comparing inputs to internal and external data, including contract dates, risk classes for non-retail exposures and risk pool rates for retail exposures, collateral values and types, performing / non performing status and other inputs used in the expected credit loss (ECL) calculator as at 31 December 2020.
For a sample of loans and model outputs with the support of specialists we performed recalculations of the ECL. The ECL adjustments related to expert credit judgement were also analysed. Our analysis considered management’s assumptions of the ECL adjustments.
We performed analytical procedures, such as a comparison of loan loss impairment allowance balances to industry levels, comparison to prior year, movements between stages, etc.
We have assessed the model overlay adjustments made by the Group, e.g. pertaining to its assessed effect of the COVID-19 pandemic on the ECL.
We also assessed the adequacy of the financial statement disclosures in Notes 1.8, 1.24.1, 2.1, 11 and 15.
Other information
Other information consists of the information included in the Company’s and Group’s 2020 Annual Report, including Corporate Social Responsibility Report, other than the financial statements and our auditor’s report thereon. Management is responsible for the other information presentation.
Our opinion on the financial statements does not cover the other information and we do not express any form of assurance conclusion thereon, except as indicated below. In connection to our audit of the financial statements, our responsibility is to read the other information and, in doing so, consider whether the other information is materially inconsistent with the financial statements or our knowledge obtained in the audit or otherwise appears to be materially misstated. If, based on the work we have performed, we conclude that there is a material misstatement of this other information, we are required to report that fact. We have nothing to report in this regard.
A member firm of Ernst & Young Global Limited
We also have to evaluate, if the financial information included in the Company’s and Group’s Annual Report, corresponds to the financial statements for the same financial year and if the Company’s and Group’s Annual Report was prepared in accordance with the relevant legal requirements. In our opinion, based on the work performed in the course of the audit of financial statements, in all material respects:
• The financial information included in the Company’s and Group’s Annual Report corresponds to the financial information included in the financial statements for the same year; and • The Company’s and Group’s Annual Report was prepared in accordance with the requirements of the Law on Consolidated Financial Reporting by Groups of Undertakings of the Republic of Lithuania and the Law on Financial Reporting by Undertakings of the Republic of Lithuania.
We also need to check that the Corporate Social Responsibility Report has been provided. If we identify that Corporate Social Responsibility Report has not been provided, we are required to report that fact. We have nothing to report in this regard. Responsibilities of management and those charged with governance for the financial statements
Management is responsible for the preparation and fair presentation of the financial statements in accordance with International Financial Reporting Standards as adopted by the European Union, and for such internal control as management determines is necessary to enable the preparation of financial statements that are free from material misstatement, whether due to fraud or error. In preparing the financial statements, management is responsible for assessing the Company’s and the Group’s ability to continue as a going concern, disclosing, as applicable, matters related to going concern and using the going concern basis of accounting unless management either intends to liquidate the Company and/or the Group or to cease operations, or has no realistic alternative but to do so. Those charged with governance are responsible for overseeing the Company’s and the Group’s financial reporting process. Auditor’s responsibilities for the audit of the financial statements
Our objectives are to obtain reasonable assurance about whether the financial statements as a whole are free from material misstatement, whether due to fraud or error, and to issue an auditor’s report that includes our opinion. Reasonable assurance is a high level of assurance, but is not a guarantee that an audit conducted in accordance with ISAs will always detect a material misstatement when it exists. Misstatements can arise from fraud or error and are considered material if, individually or in the aggregate, they could reasonably be expected to influence the economic decisions of users taken on the basis of these financial statements. As part of an audit in accordance with ISAs, we exercise professional judgment and maintain professional skepticism throughout the audit. We also: • Identify and assess the risks of material misstatement of the financial statements, whether due to fraud or error, design and perform audit procedures responsive to those risks, and obtain audit evidence that is sufficient and appropriate to provide a basis for our opinion. The risk of not detecting a material misstatement resulting from fraud is higher than for one resulting from error, as fraud may involve collusion, forgery, intentional omissions, misrepresentations, or the override of internal control. • Obtain an understanding of internal control relevant to the audit in order to design audit procedures that are appropriate in the circumstances, but not for the purpose of expressing an opinion on the effectiveness of the Company’s and Group’s internal control. • Evaluate the appropriateness of accounting policies used and the reasonableness of accounting estimates and related disclosures made by management. • Conclude on the appropriateness of management’s use of the going concern basis of accounting and, based on the audit evidence obtained, whether a material uncertainty exists related to events or conditions that may cast significant doubt on the Company’s and/or the Group’s ability to continue as a going concern. If we conclude that a material uncertainty exists, we are required to draw attention in our auditor’s report to the related disclosures in the financial statements or, if such disclosures are inadequate, to modify our opinion. Our conclusions are based on the audit evidence obtained up to the date of our auditor’s report. However, future events or conditions may cause the Company and/or the Group to cease to continue as a going concern. • Evaluate the overall presentation, structure and content of the financial statements, including the disclosures, and
A member firm of Ernst & Young Global Limited
whether the financial statements represent the underlying transactions and events in a manner that achieves fair presentation. • Obtain sufficient appropriate audit evidence regarding the financial information of the entities or business activities within the Group to express an opinion on the consolidated financial statements. We are responsible for the direction, supervision and performance of the group audit. We remain solely responsible for our audit opinion. We communicate with those charged with governance regarding, among other matters, the planned scope and timing of the audit and significant audit findings, including any significant deficiencies in internal control that we identify during our audit. We also provide those charged with governance with a statement that we have complied with relevant ethical requirements regarding independence, and to communicate with them all relationships and other matters that may reasonably be thought to bear on our independence, and where applicable, actions taken to eliminate threats or safeguards applied. From the matters communicated with those charged with governance, we determine those matters that were of most significance in the audit of the financial statements of the current period and are therefore the key audit matters. We describe these matters in our auditor’s report unless law or regulation precludes public disclosure about the matter or when, in extremely rare circumstances, we determine that a matter should not be communicated in our report because the adverse consequences of doing so would reasonably be expected to outweigh the public interest benefits of such communication. Report on Other Legal and Regulatory Requirements
Other requirements of the auditor's report in accordance with Regulation (EU) No 537/2014 of the European Parliament and of the Council.
Appointment and approval of the auditor In accordance with the decision made by shareholder we have been chosen to carry out the audit of Company’s and the Group’s financial statements for the first time in 2019. Our appointment to carry out the audit of the Company’s and the Group’s financial statements in accordance with the decision made by shareholder has been renewed annually and the period of total uninterrupted engagement is 2 years.
Consistency with the audit report submitted to the audit committee We confirm that our opinion in the section ‘Opinion’ is consistent with the additional Audit report which we have submitted to the Company, the Group and the Audit Committee.
Non audit services We confirm that to the best of our knowledge and belief, services provided to the Company and the Group are consistent with the requirements of the law and regulations and do not comprise non-audit services referred to in the Article 5(1) of the Regulation (EU) No 537/2014 of the European Parliament and of the Council. We have provided the services that are disclosed in Note 10 of the financial statements. The partner in charge of the audit resulting in this independent auditor’s report is Jonas Akelis. UAB ERNST & YOUNG BALTIC Audit company’s licence No. 001335
Jonas Akelis Auditor’s licence No. 000003 10 March 2021
AB SEB bankas, Konstitucijos ave. 24, LT-08105 Vilnius, Lithuania