330


Decision Regulation Impact StatementEnergy Efficiency of Commercial Buildings
Prepared forAustralian Building Codes Board13 November 2018
THE CENTRE FOR INTERNATIONAL ECONOMICSwww.TheCIE.com.au
www.TheCIE.com.au

The Centre for International Economics is a private economic research agency that provides professional, independent and timely analysis of international and domestic events and policies.The CIE’s professional staff arrange, undertake and publish commissioned economic research and analysis for industry, corporations, governments, international agencies and individuals.
© Centre for International Economics 2019This work is copyright. Individuals, agencies and corporations wishing to reproduce this material should contact the Centre for International Economics at one of the following addresses.
CANBERRACentre for International Economics Ground Floor, 11 Lancaster Place Majura ParkCanberra ACT 2609 GPO Box 2203 Canberra ACT Australia 2601Telephone +61 2 6245 7800 Facsimile +61 2 6245 7888
SYDNEYCentre for International Economics Level 7, 8 Spring Street Sydney NSW 2000Telephone +61 2 9250 0800 Email [email protected]
Websitewww.TheCIE.com.auEmail [email protected]
DISCLAIMERWhile the CIE endeavours to provide reliable analysis and believes the material it presents is accurate, it will not be liable for any party acting on such information.
www.TheCIE.com.au
Decision Regulation Impact Statement 3

Contents
AbbreviationsExecutive summary
Statement of the problemObjective and optionsApproach to the impact and cost-benefit analysesEstimated impactsConclusions
1 Background and introductionScopeEnergy efficiency in the National Construction CodeProposed changes to the NCCRequirement for a Regulation Impact Statement
2 Statement of the problemThe rationale for minimum energy efficiency standards for commercial buildingsThe case for changeSummary and focus of the RIS
3 Objectives and optionsObjectivesOptions
4 Approach to the cost-benefit analysisGeneral approach to the CBAEstablishing a baselineEstimating the impacts of proposed changes to the NCCThe impacts of the non-regulatory option
5 Change in construction costsModelled change in construction costsInsights from the case studiesAre lower construction costs plausible?Learning ratesOther potential costs
6 Energy saving benefitsEnergy savings
www.TheCIE.com.au
iv Decision Regulation Impact Statement

Measuring the benefitsAggregate energy savings
7 Other impactsChange in administrative costsSimplification/clarification of requirementsRe-training costsImpact on competitionPotential for unintended consequences
8 Cost-benefit analysisBuilding level net impactsAggregating benefits and costsSensitivity analysisHigh level assessment of the non-regulatory optionAssessment against the ‘competition test’Limitations of the analysis
9 Implementation and reviewImplementation of the proposed changes to the NCCReview of the new minimum standards
10 ConclusionsA Review of direct evidence on causes of the energy efficiency gap
Alternative explanationsB Summary of proposed changes to the DTS ProvisionsC Summary of consultation submissionsD Are modelled energy savings realised?
Over-estimation of energy savingsThe performance gapAustralian evidenceReasons why predicted energy savings may not be realised
E Commercial building construction projectionsBackground and approachEstimates of net additions by Climate ZoneRetired floor spaceTotal additionsRefurbishments
F Survey of building surveyorsSurvey instrumentResponse rateResults
www.TheCIE.com.au
Decision Regulation Impact Statement v

G Building detailsBuilding geometry
H Valuing the benefits of saving energyResource cost savings
I Net private benefits by state, Climate Zone and building type
BOXES, CHARTS AND TABLES1 Net benefit/costs of proposed changes to the NCC2 Estimated emissions reductions1.1 Commercial buildings2.1 Global context2.2 Summary of market and behavioural failures by building type2.3 Cost-effective energy savings in 2020 relative to BCA 20102.4 Estimated change in annual energy use2.5 Estimated change in greenhouse gas emissions2.6 Preferred option to proposed changes3.1 New Verification Methods4.1 Distribution of office building by NABERS rating4.2 Distribution of shopping centres by NABERS rating4.3 Approach to achieving compliance with Section J of the NCC4.4 Building geometry details4.5 WWR across different building sub-types4.6 Projected new commercial buildings by building class4.7 Projected new commercial buildings by Climate Zone5.1 Cost change per square metre of floor space5.2 Change in construction costs — hotel (3A)5.3 Change in construction costs — office building (5A) with 40 per
cent WWR5.4 Change in construction costs — office building (5A) with 56 per
cent WWR5.5 Change in construction costs — office buildings5.6 Change in construction costs — retail (6B)5.7 Change in construction costs — healthcare building (9aC)5.8 Change in construction costs — school classroom (9bH)5.9 Increase in construction costs from selected case studies5.10 Proposed building compared to NCC2019 reference building5.11 Relationship between window price and SHGC and U-Value5.12 Decomposition of construction costs6.1 Modelled annual energy savings — summary6.2 Modelled energy savings — hotels
www.TheCIE.com.au
vi Decision Regulation Impact Statement

6.3 Modelled energy savings — office buildings (40 per cent WWR)6.4 Modelled energy savings — office buildings (56 per cent WWR)6.5 Modelled energy savings — retail6.6 Modelled energy savings — healthcare facilities6.7 Modelled energy savings — schools6.8 Relationship between predicted and actual greenhouse gas
emissions6.9 Impact on energy consumption and emissions from case studies6.10 Aggregate electricity savings over time6.11 Aggregate gas savings over time6.12 Aggregate GHG emissions savings over time6.13 Aggregate emissions reductions7.1 Estimated administrative cost savings7.2 Transitional costs incurred by government7.3 Estimated training costs incurred by industry7.4 Allocation of training costs across jurisdictions7.5 Estimated number of stakeholders directly affected by proposed
changes7.6 Indicative salaries for relevant professions8.1 Building-level net impacts — New South Wales8.2 Building-level net impacts — Victoria8.3 Building-level net impacts — Queensland8.4 Building-level net impacts — South Australia8.5 Building-level net impacts — Western Australia8.6 Building-level net impacts — Tasmania8.7 Building-level net impacts — Australian Capital Territory8.8 Building-level net impacts — Northern Territory8.9 Services/façade decomposition — hotel8.10 Services/façade decomposition — office building8.11 Services/façade decomposition — retail building8.12 Services/façade decomposition — healthcare building8.13 Services/façade decomposition — school8.14 Net benefit/costs of proposed changes to the NCC8.15 Benefit-cost ratios8.16 Net benefit/costs of proposed changes to the NCC by building
type8.17 Estimated proportion of construction activity incurring a net cost8.18 Share of non-government owned buildings8.19 Annual regulatory burden8.20 Net benefits under alternative insulation cost scenario8.21 Break-even additional construction cost
www.TheCIE.com.au
Decision Regulation Impact Statement vii

8.22 Net benefit/costs under various energy price estimates8.23 Net benefit/costs under various social cost of carbon series8.24 Net benefit/costs under various discount rates8.25 Change in energy consumption and GHG emissions from first
NABERS rating8.26 Number of unique buildings and tenancies with a NABERS rating9.1 Guidance material being developed by ABCBB.1 Summary of proposed changesC.1 Preferred option to proposed changesC.2 WWR across different building sub-typesC.3 Average WWR suggested by G. JamesC.4 Average WWR suggested by PCAC.5 Likely responses of building designsC.6 Realisation of modelled outcomesC.7 Other unintended impactsD.1 Relationship between predicted and actual GHG emissionsD.2 Relationship between predicted and actual GHG emissions —
excluding outliersD.3 Relationship between predicted and actual GHG emissions — as
designedD.4 Relationship between predicted and actual GHG emissions — as
builtD.5 NABERS Commitment AgreementsE.1 Categories of commercial buildings and base data sourceE.2 Estimated commercial building floor space in 2017E.3 Growth assumptions by building class underpinning the
projections excluding replacementE.4 Projected net additions to the building stock by building classE.5 Components of net additions to building stockE.6 Increase in floor area per personE.7 Growth in resident population by Climate ZoneE.8 Net additions to the commercial building stock by Climate ZoneE.9 Additions as a percentage of the building stock over timeE.10 Total additions to the commercial building stock by building type
(‘000 m2)E.11 Total additions to the commercial building stock by Climate
Zone (‘000 m2)E.12 Potential impact of changes to the NCC on major
refurbishments, in 2042E.13 Estimated floor area to be affected by proposed changes
(including major refurbishments), by building typeE.14 Estimated floor area to be affected by proposed changes
(including major refurbishments), by Climate Zone
www.TheCIE.com.au
viii Decision Regulation Impact Statement

F.1 Summary of survey designF.2 Response rates by building typeF.3 Survey resultsF.4 Compliance pathway by building typeF.5 Building design relative to NCC minimum standardsG.1 Building geometryG.2 Hotel and office building (3A and 5A)G.3 Retail building (6B)G.4 Healthcare building (9aC)G.5 School building (9bH)G.6 Baseline window-to-wall ratiosG.7 ABCB Climate ZonesH.1 Long-run marginal costH.2 Retail electricity price projections — small usersH.3 Retail electricity price projections — large usersH.4 Retail electricity price projections — average of small and large
usersH.5 Gas price projectionsH.1 Electricity emissions factors for end usersH.2 Electricity emissions factors over timeH.3 Natural gas emissions factorsH.6 Social cost of carbon estimatesI.1 Net benefits to New South Wales — low realisation scenarioI.2 Net benefits to New South Wales — medium realisation scenarioI.3 Net benefits to New South Wales — high realisation scenarioI.4 Net benefits to Victoria — low realisation scenarioI.5 Net benefits to Victoria — medium realisation scenarioI.6 Net benefits to Victoria — high realisation scenarioI.7 Net benefits to Queensland — low realisation scenarioI.8 Net benefits to Queensland — medium realisation scenarioI.9 Net benefits to Queensland — high realisation scenarioI.10 Net benefits to South Australia — low realisation scenarioI.11 Net benefits to South Australia — medium realisation scenarioI.12 Net benefits to South Australia — high realisation scenarioI.13 Net benefits to Western Australia — low realisation scenarioI.14 Net benefits to Western Australia — medium realisation scenarioI.15 Net benefits to Western Australia — high realisation scenarioI.16 Net benefits to Tasmania — low realisation scenarioI.17 Net benefits to Tasmania — medium realisation scenarioI.18 Net benefits to Tasmania — high realisation scenario
www.TheCIE.com.au
Decision Regulation Impact Statement ix

I.19 Net benefits to Australian Capital Territory — low realisation scenario
I.20 Net benefits to Australian Capital Territory — medium realisation scenario
I.21 Net benefits to Australian Capital Territory — high realisation scenario
I.22 Net benefits to Northern Territory — low realisation scenarioI.23 Net benefits to Northern Territory — medium realisation
scenarioI.24 Net benefits to Northern Territory — high realisation scenario
www.TheCIE.com.au
x Decision Regulation Impact Statement

Abbreviations
ABCB Australian Building Codes BoardACCC Australian Competition and Consumer CommissionAEMC Australian Energy Market CommissionAEMO Australian Energy Market OperatorAER Australian Energy RegulatorAIRAH Australian Institute of Refrigeration, Air-conditioning and HeatingASHRAE American Society of Heating, Refrigerating and Air-Conditioning
EngineersBASIX Building Sustainability IndexBCA Building Code of Australia. BCA includes the National
Construction Code (NCC) Volume One (primarily applies to Class 2 to 9 buildings and structures) and Volume Two (primarily apples to Class 1 buildings and Class 10 structures)
BCR Benefit-cost ratioCBA Cost benefit analysisCBD Commercial Building Disclosure ProgramCIE The Centre for International EconomicsCLF Conservation load factorCO2-e Carbon dioxide equivalentCOAG The Council of Australian GovernmentsCOP Coefficient of performanceCZ Climate ZoneDEE Department of the Environment and EnergyDTS Deemed-to-satisfyEA Energy ActionEUI Energy use intensityGBCA Green Building Council of AustraliaGHG Greenhouse gasGST Goods and services taxGVA Gross value addedHVAC Heating, ventilation, and air conditioning
www.TheCIE.com.au
Decision Regulation Impact Statement 1

IPD Illumination power density, measured in watts per square metre (W/m2)
LED Light emitting diode, a semiconductor device that converts electricity into light
LEED Leadership in Energy and Environmental DesignLRMC Long run marginal costMEPS Minimum Energy Performance StandardsNABERS National Australian Built Environment Rating SystemNCC National Construction Code. The NCC is comprised of the Building
Code of Australia (BCA), Volume One and Two; and the Plumbing Code of Australia (PCA), Volume Three.
NEM National Electricity MarketNEPP National Energy Productivity PlanNLA Net lettable areaNPV Net present valueOBPR Office of Best Practice RegulationOCC Opportunity cost of capitalOEH NSW Office of Environment and HeritagePC Productivity CommissionPAC Packaged air-conditioning, including air-cooled (APAC) and water-
cooled (WPAC)PMV Predicted Mean Vote – a model using heat-balance equations and
empirical studies about skin temperature to define human comfort
RAR Room aspect ratio. Total area of a room (A) divided by the product of height (floor to ceiling, H) and perimeter (C): A/(HxC)
RET Renewable Energy TargetRIS Regulation impact statementR-Value The R-Value is a measure of thermal resistance, or ability of heat
to transfer from hot to cold, through materials (such as insulation) and assemblies of materials (such as walls and floors). The higher the R-Value, the more a material prevents heat transfer.
SA Sensitivity analysisSCC Social cost of carbon
www.TheCIE.com.au
2 Decision Regulation Impact Statement

SHGC Solar Heat Gain Coefficient – how readily heat from direct sunlight (solar radiation) flows through a window system. Value between 0 and 1. The lower a window’s SHGC, the less solar heat it transmits.
SRMC Short run marginal costUNFCCC United Nations Framework Convention on Climate ChangeUSEPA United States Environmental Protection AgencyU-Value The U-Value is the overall heat transfer coefficient that describes
how well a building element conducts heat or the rate of transfer of heat (in watts) through one square metre of a structure divided by the difference in temperature across the structure.It measures how readily a window system conducts heat. It is a measure of the rate of non-solar heat loss or gain through it. The lower a U-Value, the better. U-Value is the reciprocal of R-Value.
VM Verification MethodWACC Weighted average cost of capitalWWR Window to wall ratio – calculated based on the window area
divided by the total façade area exposed to conditioned air, which includes the plenum space in the same orientation. As a result, a WWR of 75 per cent corresponds to 100 per cent glazing to the occupied space and an opaque wall to the plenum space.
www.TheCIE.com.au
Decision Regulation Impact Statement 3

Executive summary
The Australian Building Codes Board (ABCB) has been requested to consider potential stringency changes to the energy efficiency provisions in relation to commercial buildings in the 2019 edition of the National Construction Code (NCC).1 More specifically, the ABCB was tasked to develop updates to the energy efficiency provisions in the NCC that are economically feasible. The CIE interprets the criteria of economically feasible as the total social benefits (including private benefits such as energy savings and public benefits such as reducing greenhouse gas emissions) being higher than the associated costs. The review of Section J of the NCC was proposed under Measure 31 of the National Energy Productivity Plan 2015-20302 (NEPP) Work Plan.Commercial buildings in the scope covered by this analysis are defined as common areas of Class 2 (residential buildings), Class 3 buildings (hotels and other commercial accommodation facilities), Class 5 buildings (offices), Class 6 (retail buildings such as shops, restaurants and cafés), Class 7 buildings (carparks and warehouses), Class 8 buildings (factories) and Class 9 buildings (health care, education, sporting facilities and aged care buildings).3 Increasing the stringency of the NCC could also contribute to Australia meeting its commitment to reduce greenhouse gas (GHG) emissions by 26 to 28 per cent below the 2005 level by 2030 under the Paris Climate Agreement.Furthermore, the stringency of the energy efficiency requirements of Section J of the NCC has not been increased since 2010. Since that time:■ energy prices have increased significantly, while the cost of some
energy efficient technologies has declined; and
1 ABCB 2016, Annual Business Plan 2016-17, p. 2.2 Council of Australian Governments Energy Council 2015, National Energy
Productivity Plan 2015-2030: Boosting competitiveness, managing costs and reducing emissions, December, Available at http://www.coagenergycouncil.gov.au/sites/prod.energycouncil/files/publications/documents/National%20Energy%20Productivity%20Plan%20release%20version%20FINAL_0.pdf
3 Common areas of Class 2 buildings are not separately reported in this Regulation Impact Statement (RIS) as they have similar characteristics to other commercial building classifications, for example a Class 3.
www.TheCIE.com.au
4 Decision Regulation Impact Statement

■ various modelling has shown there may be scope for significant cost-effective energy efficiency improvements in commercial buildings.
Statement of the problemThe rationale for minimum energy efficiency standards is based on the proposition that industry would not make socially optimal energy efficiency decisions in commercial buildings without government intervention (this is often referred to as the ‘energy efficiency gap’). That is, there are energy efficiency opportunities where the benefits to the community (including public benefits) outweigh the associated costs that are brought up by the change in regulation.A key market failure contributing to the ‘energy efficiency gap’ is that the costs to the community associated with GHG emissions are not factored into energy prices under current policy settings. This provides an incentive to over-consume energy and under-invest in energy efficiency.In addition, there may be other market failures or behavioural failures/anomalies that prevent industry from making privately optimal energy efficiency decisions (this is referred to as the ‘energy efficiency paradox’), although direct evidence is limited. Nevertheless, plausible market failures or behavioural failures/anomalies that contribute to the ‘energy efficiency paradox’ include the following:■ Bounded rationality/heuristic decision-making — energy efficiency is
highly technical and in the face of complexity, some decision-makers could revert to mental short-cuts (heuristics) when making decisions, such as simply building to the code requirements.
■ Split incentives/information asymmetries — where building owners/managers are responsible for energy efficiency decisions, but energy bills are passed onto tenants, there may be limited incentive to invest in improved energy efficiency. While the Commercial Building Disclosure (CBD) Program addresses this market failure for larger office buildings, it could potentially manifest in other commercial buildings particularly smaller office buildings and other leased premises, such as retail buildings.
This suggests there is potentially increased scope for government intervention to achieve a ‘win-win’ outcome, where there are net private benefits in addition to reduced GHG emissions.
Objective and optionsCOAG Best Practice Guidelines (2007) require that a Regulation Impact Statement (RIS) identify a range of viable options to address the problem, including, as appropriate, non-regulatory, self-regulatory and co-regulatory
www.TheCIE.com.au
Decision Regulation Impact Statement 5

options.4 In the context of a RIS examining proposed changes to the NCC, it is important to consider alternative options, to not only establish that the proposed changes to the NCC deliver a net benefit to the community, but also that changing the NCC is the best approach to achieving the government’s objectives (i.e. the approach that delivers the highest net benefits).The objectives of the NCC energy efficiency provisions and the stated objectives of the NEPP are broad and could encompass a wide range of measures, including measures unrelated to commercial buildings. However, this analysis narrows the focus to proposals that improve the energy efficiency of commercial buildings.Furthermore, other options that could contribute to better energy efficiency outcomes in a more ‘light-handed’ way include:■ expansion of the current Commercial Building Disclosure (CBD) Program
to other buildings; and■ expansion of the energy efficiency rating scheme NABERS to cover
other building types.However, these alternative options are being considered separately under Measure 9 of the NEPP. The expansion of the CBD program as a compulsory government regulation change requires a separate RIS.The options considered under this RIS therefore include:1 The status quo2 The proposed amendments to the NCC energy efficiency provisions for
commercial buildings developed by ABCB and its energy efficiency consultant Energy Action (EA)
3 Collating the work undertaken by the ABCB in developing the amendments to the NCC into a handbook for adoption by industry on a voluntary basis.
Approach to the impact and cost-benefit analysesThe analyses are conducted through a multi-step approach including:■ early consultations with stakeholders from industry and government
agencies to gather relevant views on the proposed amendments and information necessary to inform the cost-benefit analysis (CBA);
4 Council of Australian Governments 2007, Best Practice Regulation, A Guide for Ministerial Councils and National Standard Setting Bodies, October 2007, p. 10.
www.TheCIE.com.au
6 Decision Regulation Impact Statement

■ review of energy modelling conducted by EA to identify key issues affecting the results and to incorporate EA modelling results into the CBA in a more meaningful manner;
■ gathering and reviewing of information from other sources to better understand the status quo of commercial buildings, so as to establish a better baseline for the CBA;
■ preparing a Consultation RIS report for formal consultation;■ revising energy modelling in response to the submissions in the
consultation; and ■ updating the impact and cost-benefit analysis according to findings in
the new energy modelling and case studies.The CBA estimates are largely based on EA’s5 core modelling of five building archetypes, representing: a hotel (3A), an office building (5A), a retail building (6B), a healthcare building (9aC) and a school (9bH). The general approach to the modelling has been refined since the Consultation RIS, with some key methodological features as follows.■ The modelling for the Consultation RIS suggested that the
window-to-wall ratio (WWR) was likely to be a key factor influencing the results. The assumptions around the WWR have been revised significantly, so that the baseline more closely reflects current practice and the impacts of the proposed changes to the code reflect a more plausible response to the revised code requirements.– In the Consultation RIS, the assumptions in relation to WWRs were as
follows:… The approach to setting the baseline WWRs was based on the
highest achievable for each façade under the existing code.… For most building archetypes, industry were assumed to respond to
the new approach to glazing reflected in the proposed code by reducing WWRs to either 30 per cent or 45 per cent, which allowed improved energy performance at lower cost.
– In the Consultation RIS we argued that there were likely to be costs involved in reducing the window size (such as reduced amenity and/or lower rental rates) that were difficult to quantify. Stakeholder submissions also argued that it was unlikely that industry would reduce WWRs to any significant extent.
5 Energy Action is an energy efficiency consultancy and was commissioned by the ABCB to investigate and report back with recommendations on three areas that would inform changes to Section J in NCC 2019: (i) quantifying the Performance Requirements; (ii) increasing the number of Verification Methods; and (iii) improving the Deemed-to-Satisfy Provisions.
www.TheCIE.com.au
Decision Regulation Impact Statement 7

… In the revised modelling the baseline WWRs broadly reflect the average across each building type, as indicated by an EA survey.
… Under the revised models, the WWR was held constant.■ The approach to glazing selection in the revised modelling was based
on the lowest cost compliant option under the existing code (i.e. the baseline) and under the proposed code across all building archetypes. By contrast, the modelling for the Consultation RIS was based on the glazing option that was closest to the proposed stringency for some buildings (e.g. it was possible that some lower performing and higher cost product or higher performing and lower cost product may have been available).
■ As in the Consultation RIS, our baseline assumes voluntary uptake of LED lighting in commercial buildings, consistent with industry expectations.
■ Insulation material cost assumptions were updated, replacing the need for sensitivity testing.
■ The available (albeit limited) evidence suggests that the relationship between simulated and actual energy consumption is relatively weak and that as low as only around half of predicted energy savings may be realised in practice. The potential for engineering estimates to overstate the energy savings from improved energy efficiency is a modelling issue raised in international literature. As in the Consultation RIS, we report benefit estimates under three alternative scenarios, with most submissions to the Consultation RIS suggesting low to medium realisation is a more likely scenario.– Under the first (low) scenario, we assume that 49 per cent of
modelled energy savings are achieved in practice. This is consistent with the relationship between modelled and actual GHG emission savings implied by the Green Star data.6
– Under the second (medium) scenario, we assume that 75 per cent of modelled energy savings are achieved in practice. This is consistent with the relationship between modelled and actual GHG emissions implied by the Green Star data when the five outliers have been excluded.
– Under the third (high) scenario, modelled energy savings are assumed to be achieved fully in practice.
■ Compliance cost estimates are largely based on EA modelling. This modelling suggests that construction costs may fall due to changes in the methodology of setting the stringency, in particular for wall and glazing. By contrast, costs for services will in general increase due to
6 See Appendix B.
www.TheCIE.com.au
8 Decision Regulation Impact Statement

change in stringency. In some cases, the fall in facades costs outweights the rise in services costs, leading to fall in total construction costs.
In addition to the core modelling, additional modelling was undertaken as follows.■ To address concerns about compliance costs for premium office
buildings, which tend to be more extensively glazed than other commercial buildings, an office building was modelled with higher WWRs.
■ Stakeholders also requested further disaggregation across the different elements of the Deemed-to-Satisfy (DTS) provisions. EA therefore completed additional simulations, which allowed a decomposition of energy savings and costs between services and the façade to provide additional insights.
Building level benefits (including mainly energy savings, greenhouse gas emissions and savings in administrative costs) and costs (including mainly the change in construction costs) are then converted to unit benefits and unit costs per square metre of net lettable area (NLA) for each building class in every Climate Zone. These unit benefits and costs are then applied to the projected area of new commercial building by building class and jurisdiction/Climate Zone to estimate total benefits and costs for each building class in each state or territory. National benefits and costs are an aggregation of benefits and costs across building class and jurisdiction.Finally, sensitivity analyses are conducted to test how sensitive the results are to key factors such as compliance costs, energy prices, the social cost of carbon and discount rates.
Estimated impactsCosts and benefits are estimated in Net Present Value (NPV) terms over the 40-year life of buildings constructed during a ten-year regulatory period, using a discount rate of 7 per cent. The CBA results under each of the realisation scenarios described above are shown in table .■ Under the low realisation scenario (where only 49 per cent of modelled
energy savings are achieved):– the proposed changes to the NCC are estimated to deliver a net
benefit to the community of around $769 million– additional global benefits from reduced greenhouse gas (GHG)
emissions are estimated at around $369 million.■ Under the medium realisation scenario (where 75 per cent of modelled
energy savings are achieved):
www.TheCIE.com.au
Decision Regulation Impact Statement 9

– the proposed changes to the NCC are estimated to deliver a net benefit to the community of around $1.42 billion
– additional global benefits from reduced GHG emissions are estimated at around $553 million.
■ Under the high realisation scenario (where the full modelled energy savings are achieved):– the proposed changes to the NCC are estimated to deliver a net
benefit to the community of around $2.1 billion– additional global benefits from reduced GHG emissions are estimated
at around $738 million.The proposed changes to the NCC are estimated to deliver significant net benefits even under the (possibly more plausible) low and medium scenarios. Furthermore, the proposed changes are estimated to deliver net benefits in every jurisdiction under all scenarios.EA’s modelling suggests that significant energy efficiency improvement can be made in commercial buildings at a relatively modest additional cost. The modest increase in construction costs is largely an impact of improvement in the methodology of setting the stringency. For example, EA’s study found that solar heat gain coefficient (SHGC) is a more important parameter for window performance than U-Value, while the cost of window products in the market appears to be highly related to U-Value rather than SHGC. By changing the focus of the code from U-Value to SHGC, the proposed change in specifying the stringency for glazing enables cost saving by choosing a window with better SHGC and relatively poorer U-Value. Furthermore, stringency is proposed to be set for whole façade rather than separately for wall and glazing as in the current code. In this way, substitution between glazing and insulation is possible and could further reduce construction cost.
008B001 Net benefit/costs of proposed changes to the NCCNSW Vic Qld SA WA Tas ACT NT Total
$ million
$ million
$ million
$ million
$ million
$ million
$ million
$ million
$ million
Low realisation scenario
Lifetime energy savings 352.8 301.2 339.9 77.6 186.4 12.0 17.4 23.5 1 310.8Compliance costs - 172.3 - 121.5 - 93.4 - 36.9 - 81.5 - 9.4 - 10.8 - 2.4 - 528.2Administrative cost savings 1.2 1.0 0.8 0.2 0.5 0.0 0.2 0.0 3.9Industry re-training costs -5.6 -4.9 -2.9 -0.9 -1.9 -0.2 -0.3 -0.1 -16.7Government implementation costs -0.1 -0.1 -0.1 0.0 0.0 0.0 0.0 0.0 -0.4
www.TheCIE.com.au
10 Decision Regulation Impact Statement

NSW Vic Qld SA WA Tas ACT NT Total
$ million
$ million
$ million
$ million
$ million
$ million
$ million
$ million
$ million
Net impact on community 176.0 175.6 244.5 39.9 103.5 2.4 6.6 21.0 769.4
GHG savings 97.7 101.8 99.9 14.2 41.9 1.6 6.0 5.7 368.9
Medium realisation scenario
Lifetime energy savings 529.1 451.8 509.9 116.4 279.6 18.1 26.2 35.2 1 966.2Compliance costs - 172.3 - 121.5 - 93.4 - 36.9 - 81.5 - 9.4 - 10.8 - 2.4 - 528.2Administrative cost savings 1.2 1.0 0.8 0.2 0.5 0.0 0.2 0.0 3.9Industry retraining costs -5.6 -4.9 -2.9 -0.9 -1.9 -0.2 -0.3 -0.1 -16.7Government implementation costs -0.1 -0.1 -0.1 0.0 0.0 0.0 0.0 0.0 -0.4Net impact on community 352.4 326.2 414.5 78.7 196.7 8.4 15.3 32.7 1 424.8
GHG savings 146.6 152.6 149.9 21.4 62.9 2.4 9.1 8.5 553.3
High realisation scenario
Lifetime energy savings 705.5 602.4 679.9 155.1 372.8 24.1 34.9 47.0 2 621.7Compliance costs - 172.3 - 121.5 - 93.4 - 36.9 - 81.5 - 9.4 - 10.8 - 2.4 - 528.2Administrative cost savings 1.2 1.0 0.8 0.2 0.5 0.0 0.2 0.0 3.9Industry retraining costs -5.6 -4.9 -2.9 -0.9 -1.9 -0.2 -0.3 -0.1 -16.7Government implementation costs -0.1 -0.1 -0.1 0.0 0.0 0.0 0.0 0.0 -0.4Net impact on community 528.8 476.8 584.4 117.5 289.9 14.4 24.0 44.5 2 080.2
GHG savings 195.4 203.5 199.8 28.5 83.9 3.2 12.1 11.4 737.8Note: Costs and benefits estimated in present value terms over the 40 year life of all commercial building construction over a ten year regulatory period, using a discount rate of 7 per cent. Benefits are represented as a positive number; costs are represented as a negative number. Net social benefits include net private benefits and public benefits from greenhouse gas emissionsSource: CIE estimates based on EA modelling.
The emissions reductions will make a modest contribution towards Australia’s 2030 emissions targets of 26-28 per cent below 2005 levels in 2030 under the Paris Agreement. Cumulative emissions reductions of 868-934 Mt CO2-e are required to meet the 26 per cent and 28 per cent targets respectively.7 The proposed changes to the NCC would contribute less than 1 per cent towards these targets (table ).
7 Department of the Environment and Energy, Australia’s emissions projections 2017, December 2017, p. 3.
www.TheCIE.com.au
Decision Regulation Impact Statement 11

002B002 Estimated emissions reductionsEmissions reduction
(2019-2067)
Emissions reductions
(2021-2030)
Proportion of emissions
reduction task (based on 26
per cent reduction)a
Proportion of emissions
reduction task (based on 28
per cent reduction)
Mt CO2-e Mt CO2-e Per cent Per cent
Low scenario 13.34 3.28 0.38 0.35Medium scenario 20.01 4.92 0.57 0.53High scenario 26.67 6.56 0.76 0.70
a Based on cumulative emissions reductions of 868 Mt CO2-e between 2021 and 2030 (Department of the Environment and Energy, 2017, p. 3). b Based on cumulative emissions reductions of 934 Mt CO2-e between 2021 and 2030 (Department of the Environment and Energy, 2017, p. 3).Source: Department of the Environment and Energy, Australia’s emissions projections 2017, December 2017, p.3; EA modelling, CIE estimates.
Nevertheless, the impact of the proposed changes to the NCC vary across different buildings. Even though the CBA results suggest a significant net benefit in aggregate, a proportion of construction activity could potentially incur a net cost, albeit marginal.■ EA’s modelling report suggests that:
– healthcare buildings could incur a net cost in Climate Zones 6 and 7 and possibly Climate Zones 4 and 5 (depending on the extent to which modelled energy savings are realised in practice).
– retail buildings could incur net costs in Climate Zone 7.– Where overall energy increases but greenhouse gas emissions
decrease (i.e. class 9aC in Climate Zones 6 and 7), the phenomenon is due to a fuel source change to gas from electricity. That is, these buildings use more gas for heating due to a comparatively overly stringent façade in 2016 in comparison to 2019, but less energy for cooling as the new façade methodology has a more stringent solar heat gain requirement in 2019.
– The sole instance where annual greenhouse gas emissions increase (i.e. class 6B in Climate Zone 7 where energy use decreases) the magnitude is negligible and relates to small buildings with high surface area to volume ratios in cooler climates and attributable to an overly stringent façade U-Value modelled in the NCC2016 simulations, compared to NCC2019. This result is not seen in models of larger buildings.
■ Although EA modelling suggest the proposed changes to the NCC will deliver a net benefit to other buildings (even under the low realisation scenario), some buildings will incur a net cost where the realisation rate falls below the average. We estimate that overall between 5 and 24 per cent of buildings could incur a net cost as a result of the proposed changes.
www.TheCIE.com.au
12 Decision Regulation Impact Statement

It should be noted that the NCC can only accommodate one set of technical provisions. Due to methodology changes, there is no flexibility to retain the existing methodology which would require a duplication of provisions and methods, be complex and unworkable particularly for DTS solutions or mixed- use buildings. For performance pathways, stringency updates that underlie the reference building schedules and performance quantification would be incompatible with existing methods, undermine objectives and lead to confusion in the market.Increasing the stringency of minimum standards has the potential to restrict competition or choice in materials or design. The proposed changes to the DTS provisions potentially negatively affect some suppliers or products by changing the thresholds at which products comply. However, the NCC is performance-based with Verification Methods and other pathways that allow for trading between the performance of elements in order to achieve compliance against the overarching Performance Requirement, thereby enabling flexibility in design choices to meet the targeted values. The proposed changes comply with the ‘competition test’ set out in the COAG Guidelines.The non-regulatory option considered is unlikely to deliver significant benefits. Collating the work undertaken by the ABCB in developing the amendments to the NCC into a handbook is unlikely to encourage a significant increase in the voluntary adoption of energy efficiency opportunities. General information on the benefits of energy efficiency is widely available from various sources, while specific project information is available commercially. The availability of information does not therefore appear to be a barrier to the uptake of cost-effective energy efficiency opportunities. Rather, the main barrier appears to be a failure to a failure to use the information available due to behaviour failures, such as bounded rationality and/or heuristic decision-making. A handbook would do little to overcome these barriers.
Conclusions■ Based on the analysis presented in the RIS, the proposed changes to
the NCC is the preferred option (Option 2) to improve the energy efficiency of new commercial buildings.
■ EA’s modelling suggests that significant energy efficiency improvements can be made in commercial buildings at a relatively modest additional cost, which is largely due to methodological change in setting the stringency, particularly for façades and glazing. If these modelling results are broadly representative of the impacts of the proposed changes to the NCC across all buildings, the CBA results suggest that these changes could deliver significant net benefits across all jurisdictions, even if the modelled energy savings are not fully realised in practice (as appears likely based on the evidence available).
www.TheCIE.com.au
Decision Regulation Impact Statement 13

1 Background and introduction
Australia has committed to implementing an economy wide target to reduce greenhouse gas emissions by 26 to 28 per cent below the 2005 level by 2030 and a carbon neutral economy by 2050. An effective and efficient energy policy is considered an important way to achieve this target and buildings an important contributor given their long service life.It is estimated that there are around 360 million square metres of floor space of commercial buildings in Australia which consumes about 231 PJ of energy in 2016, accounting for three quarters of total energy consumption in the commercial industry or nearly 4 per cent of total net energy consumption in Australia.8 Commercial buildings are therefore an important part of the nation’s energy efficiency policy.
ScopeFor the purpose of this work, commercial buildings are defined as Class 2 common areas, Class 3 buildings and Class 5 to 9 buildings (table ). Common areas of Class 2 buildings have similar characteristics to other commercial building classes, and are not separately reported in this RIS.
011B013 Commercial buildingsBuilding class Description
Class 2 common areas
Class 2 buildings are residential buildings. They are multi-unit residential buildings where dwellings are situated above and below each other. Class 2 buildings may also be single storey attached dwellings where there is a common space below. For example, two dwellings above a common basement or carpark.Only common areas of Class 2 buildings are considered as commercial buildings.
8 Commercial building floor space and energy consumption are CIE’s estimates based on pitt&sherry 2012, Baseline energy consumption and greenhouse gas emissions in commercial buildings in Australia. According to Australian Energy Statistics 2017, total energy consumption in commercial industry was 339.3 PJ, and total net consumption in Australia was 6 065.9 PJ in 2016. Commercial building floor space includes factories (Class 8 as defined by the NCC) while commercial industry in the Energy Statistics covers services (including wholesale trade, retail trade, accommodation and food services, information media and telecommunication, financial and insurance services, rental, hiring and real estate services, professional, scientific and technical services, administrative and support services, public administration and safety, education and training, health care and social assistance, arts and recreation services, other services).
www.TheCIE.com.au
14 Decision Regulation Impact Statement

Building class Description
Class 3 Class 3 buildings are residential buildings other than a Class 1 or Class 2 building. They are a common place of long term or transient living for a number of unrelated people. Examples include a hotel, boarding house, guest house, hostel or backpackers (that are larger than the limits for a Class 1b building (a boarding house, guest house or hostel with a floor area less than 300m2 and ordinarily having less than 12 people).
Class 5 Class 5 buildings are office buildings that are used for professional or commercial purposes, excluding Class 6, 7, 8 or 9 buildings.
Class 6 Class 6 buildings are typically retail buildings such as shops, restaurants and cafés. They are a place for the sale of retail goods or the supply of services direct to the public.
Class 7 Class 7 buildings include two sub classifications: Class 7a and Class 7b.
Class 7a Class 7a buildings are carparks.
Class 7b Class 7b buildings are typically warehouses, storage buildings or buildings for the display of goods (or produce) that is for wholesale.
Class 8 A factory is the most common way to describe a Class 8 building. It is a building in which a process (or handicraft) is carried out for trade, sale, or gain. The building can be used for production, assembling, altering, repairing, finishing, packing, or cleaning of goods or produce. It includes buildings such as a mechanic’s workshop. It may also be a building for food manufacture, such as an abattoir. A laboratory is also a Class 8 building.
Class 9 Class 9 buildings are buildings of a public nature, which include three sub classifications: Class 9a, Class 9b and Class 9c.
Class 9a Class 9a buildings are generally hospitals which are referred to in the NCC as health-care buildings.
Class 9b Class 9b buildings are assembly buildings in which people may gather for social, theatrical, political, religious or civil purposes. They include schools, universities, childcare centres, pre-schools, sporting facilities, night clubs, or public transport buildings.
Class 9c Class 9c buildings are aged care buildings. Aged care buildings are defined as residential accommodation for elderly people who, due to varying degrees of incapacity associated with the ageing process, are provided with personal care services and 24 hour staff assistance to evacuate the building during an emergency.
Source: excerpt from ABCB 2017, Understanding the NCC: Building Classifications.
Energy efficiency in the National Construction CodeMinimum energy efficiency standards for commercial buildings were first introduced in 2006 into the Building Code of Australia (BCA), which now forms part of the National Construction Code (NCC).9 The stringency of the minimum energy efficiency standards were subsequently increased in 2010.
9 ABCB 2016, NCC Volume One Energy Efficiency Provisions Handbook, Fourth Edition, p. 20.
www.TheCIE.com.au
Decision Regulation Impact Statement 15

The energy efficiency provisions of the NCC are specified in Section J. The stated objective of Section J is to “reduce greenhouse gas emissions”.10
As the NCC is a performance-based code, Performance Requirements relating to energy efficiency set out the minimum expectations a building must meet in order to comply.Under the current NCC, the Performance Requirements are not quantified. However, the means of satisfying the Performance Requirements are set out in Section J. Compliance can be achieved through either:■ The Deemed-to-Satisfy Provisions (DTS) — these are the prescriptive
means set out in J0 to J8. As the name suggests, buildings that comply with these prescriptive DTS provisions are deemed to meet the Performance Requirements.
■ Performance Solution — these are solutions (other than DTS) that comply with the Performance Requirements. These solutions must be assessed in accordance with the Assessment Methods (or a combination of) listed under Section A of the NCC using:– A Verification Method such as JV3 as one optional means of verifying
compliance with the Performance Requirements.– Others options include, evidence of suitability as described in A2.2,
other verification methods as accepted by the relevant authority, expert judgement, or comparison to the DTS. NCC Volume One Section A includes definitions and descriptions.
Proposed changes to the NCCThe Australian Building Codes Board (ABCB) has been requested to consider stringency changes to the energy efficiency provisions in NCC 2019 in relation to commercial buildings.11 More specifically, the ABCB was required to develop updates to the energy efficiency provisions in the NCC that are economically feasible.
Broader policy contextThe review of Section J of the NCC as it relates to commercial buildings is occurring in the context of several key policy developments over recent years.An important international development was the adoption of the Paris Climate Agreement in December 2015. The Paris Climate Agreement has been ratified by 168 of 197 Parties to the United Nations Framework
10 ABCB 2016, NCC Volume One Energy Efficiency Provisions Handbook, Fourth Edition, p. 41.
11 ABCB 2016, Annual Business Plan 2016-17, p. 2.
www.TheCIE.com.au
16 Decision Regulation Impact Statement

Convention on Climate Change (UNFCCC), including Australia.12 It aims to limit global warming to less than 2 degrees Celsius and pursue efforts to limit the rise to 1.5 degrees Celsius.The Paris Agreement requires all Parties to put forward their best efforts through ‘nationally determined contributions’. Australia has committed to implementing an economy-wide target to reduce greenhouse gas emissions by 26 to 28 per cent below the 2005 level by 2030.13
Relevant domestic policy developments include the following:■ The Commonwealth Government’s Energy White Paper — this was
released in April 2015, and sets out an energy policy framework for Australia. Increasing energy productivity to promote growth was one of the White Paper’s three key themes.
■ The National Energy Productivity Plan (NEPP) — as an integral part of the Energy White Paper, the Council of Australian Governments (COAG) Energy Council has developed the National Energy Productivity Plan 2015 – 2030, released in December 2015. The NEPP has set a National Energy Productivity Target to improve Australia’s energy productivity by 40 per cent between 2015 and 2030.14
The Work Plan for NEPP developed 34 measures to achieve this target. Measure 31 states that there is likely to be strong productivity and emissions reduction benefits from revising the NCC’s energy efficiency provisions for both residential and commercial buildings.15
This was based on research by pitt&sherry commissioned by the Department of the Environment and Energy that found that the energy efficiency stringency of the NCC could achieve energy savings of up to 53 per cent for commercial buildings and up to 18 per cent for residential buildings at benefit-cost ratio of 1.0.16
12 United Nations Framework Convention on Climate Change website, http://unfccc.int/paris_agreement/items/9485.php, accessed 19 October 2017.
13 Department of the Environment and Energy website, http://www.environment.gov.au/climate-change/publications/factsheet-australias-2030-climate-change-target, accessed 8 November 2017.
14 COAG Energy Council 2015, National Energy Productivity Plan 2015-2030: Boosting Competitiveness, managing costs and reducing emissions, December 2015, p. 5.
15 COAG Energy Council 2015, National Energy Productivity Plan: Work Plan, p. 20.
16 See pitt&sherry 2016, Final Report — Pathway to 2020 for Increased Stringency in New Building Energy Efficiency Standards: Benefit Cost Analysis: Commercial Buildings: 2016 Update, 10 May 2016.
www.TheCIE.com.au
Decision Regulation Impact Statement 17

Approach to the review of Section JThe ABCB engaged consultants EA to investigate and recommend changes to Section J in NCC 2019 which are economically feasible.The ABCB and its consultants undertook a detailed review of Section J including its:■ Performance Requirements;■ Verification Methods; and■ DTS provisions.The proposed changes were informed by detailed modelling with input from a Commercial Working Group that included representatives from:■ the ACT Administration■ the Commonwealth Department of the Environment and Energy■ Master Builders Australia■ Air Conditioning and Mechanical Contractors’ Association■ Building Products Innovation Council■ Lighting Council Australia■ the NSW Administration in conjunction with the NABERS Administration■ the Australian Institute of Architects■ the Australian Institute of Building■ the Australian Institute of Refrigeration Air-conditioning and Heating■ the Australian Sustainable Built Environment Council■ the Green Building Council of Australia (the administrator of the Green
Star scheme)■ the Property Council of Australia.17
Requirement for a Regulation Impact StatementThe Inter-governmental agreement under which the ABCB operates requires decisions of the Board have regard for COAG Best Practice Principles.In line with COAG Best Practice Principles administered by the Office of Best Practice Regulation (OBPR), this Regulation Impact Statement (RIS) is
17 ABCB website, https://www.abcb.gov.au/Resources/Publications/Education-Training/NCC-2019-Energy-Efficiency-Provisions-development-process, accessed 26 February 2018.
www.TheCIE.com.au
18 Decision Regulation Impact Statement

being prepared consistent with Best Practice Regulation — A Guide for Ministerial Councils and National Standard Setting Bodies (2007).
Consultation RISThe ABCB engaged the Centre for International Economics (CIE) to prepare a Consultation RIS that satisfies COAG Best Practice Regulation Guidelines (2007). A Consultation RIS was released in March 2018. The Consultation RIS set out the elements and structure for consultation on the analysis and any unknown or uncertain elements.
Decision RISThis report is a Decision RIS that builds on the analysis in the Consultation RIS. It will be considered by the ABCB Board as an input into its decision making.
Summary of stakeholder consultationThe Best Practice Regulation Guidelines require effective consultation with affected key stakeholders at all stages of the regulatory cycle (Principle 7).18 Further guidance on best practice consultation is provided in an OBPR Guidance Note.19
Consistent with best practice requirements, there has been extensive stakeholder consultation in the development of the proposed changes to the NCC (see above) and in the preparation of the Decision RIS.In September and October 2017 (prior to the release of the Consultation RIS), the CIE undertook a preliminary stakeholder consultation program. Stakeholders consulted included representatives from:■ the (then) Australian Government Department of the Environment and
Energy■ representatives on the National Energy Productivity Plan Secretariat
from NSW, South Australia and the ACT■ the Australian Sustainable Built Environment Council■ the NABERS Scheme operator (the NSW Office of Environment and
Heritage)■ the Green Building Council of Australia■ the Property Council of Australia
18 Council of Australian Governments, Best Practice Regulation: A Guide for Ministerial Councils and National Standard Setting Bodies, October 2007, p. 6.
19 Australian Government Office of Best Practice Regulation, Guidance Note — Best Practice Consultation, February 2016.
www.TheCIE.com.au
Decision Regulation Impact Statement 19

■ the Australian Institute of Architects■ the Australian Institute of Building Surveyors■ the Association of Accredited Certifiers■ the Lighting Council of Australia■ the Building Products Innovation Council (and the Australian Window
Association)■ the Australian Institute of Refrigeration, Air-Conditioning and Heating■ the Gas Appliance Manufacturers Association of Australia.In addition, we contacted representatives from Facilities Management Australia, Engineers Australia, the Australian Industry Group and the Australasian Fire and Emergency Service Authorities Council, but were unable to arrange meetings.The Consultation RIS was open for public comment from 12 March 2018 to 20 April 2018. There were 23 written submissions received from:■ JMG Consulting and Building Approval■ Frank Acitelli (Builder)■ Benmax Group Pty Ltd■ Real Project Solutions■ the Australian Sustainable Built Environment Council and ClimateWorks■ Bondor Group■ City of Parramatta Council■ Rheem Australia Pty Ltd■ BlueScope■ G. James Glass and Aluminium■ Sustainability House■ National Association of Steel-Framed Housing Inc.■ Unions NSW■ the Property Council of Australia■ Think Brick Australia, Concrete Masonry Association of Australia and
Australian Roof Tile Association■ the Green Building Council of Australia■ the Australian Small Business and Family Enterprise Ombudsman■ Anderson Energy Efficiency
www.TheCIE.com.au
20 Decision Regulation Impact Statement

■ the Housing Industry Association■ the NSW Department of Planning and Environment■ Master Builders Australia■ Environment Victoria■ the Australian Government Department of the Environment and Energy
(which provided additional information on window-to-wall ratios across different building types).
The key issues raised in submissions are addressed throughout the report and summarised in Appendix B.
Report structureThe remainder of this report is structured as follows:■ Chapter 2 sets the nature and extent of the problem the proposed
changes are seeking to address■ Chapter 3 specifies the objectives and the options■ Chapter 4 sets out the general approach to the cost-benefit analysis■ Chapter 5 estimates changes to construction costs as a result of the
proposed changes to the NCC■ Chapter 6 estimates the energy savings achieved through the proposed
changes to the NCC■ Chapter 7 discusses other potential impacts of changes to the NCC■ Chapter 8 conducts cost benefit analysis (CBA) of the proposed options■ Chapter 9 discusses implementation and review arrangements■ Chapter 10 concludes.
www.TheCIE.com.au
Decision Regulation Impact Statement 21

2 Statement of the problem
A key element of a RIS is defining the problem that Government is trying to address, including the nature and extent (potential size) of the problem.
The rationale for minimum energy efficiency standards for commercial buildingsThe rationale for minimum energy efficiency standards is based on the proposition that industry would not make socially optimal energy efficiency decisions in commercial buildings without government intervention. That is, there are energy efficiency opportunities where the benefits to the community (including public benefits) outweigh the associated costs that would not be taken up in the absence of regulation. This is often referred to as the ‘energy efficiency gap’.
Market failures and behavioural anomaliesOne view is that the energy efficiency gap is caused mainly by a range of market failures and behavioural anomalies.
Market failures relating to energy pricing
A key market failure is that the cost of consuming energy is not fully reflected in energy prices. There are unpriced negative externalities associated with energy consumption, which means that energy users do not take these costs into account in their decisions on whether to invest in energy efficiency. Various studies have identified these externalities as including:■ greenhouse gas emissions — as greenhouse gas emissions contribute
to climate change, the costs are borne by the whole (global) community (see box for a discussion on the global context); and
■ externalities associated with peak demand — network capacity and therefore infrastructure costs are driven by peak demand; however, costs relating to peak demand may not be fully reflected in energy prices.
www.TheCIE.com.au
22 Decision Regulation Impact Statement

022B024 Global context
Climate change caused by human activity is a global problem, requiring a global solution. Greenhouse gases in the atmosphere contribute to warming across the globe, regardless of where the emissions occur. In that sense, greenhouse gas abatement has the characteristics of a global public good. Specifically, greenhouse gas abatement is:■ non-excludable — individual countries cannot be excluded from
receiving the benefits of limiting climate change; and■ non-rival — one country receiving benefits from limiting climate
change does not prevent other countries from receiving the same benefits.
These characteristics mean that there is little incentive for each country individually to reduce greenhouse gas emissions to a level that will limit climate change. The costs associated with reducing greenhouse gas emissions are incurred domestically, while the benefits are spread across the globe. Each country therefore has an incentive to free-ride off the efforts of others.International Agreements are therefore a crucial mechanism for achieving global action. The Paris Climate Agreement has been ratified by 168 of 197 Parties to the United Nations Framework Convention on Climate Change (UNFCCC).20 It aims to limit global warming to less than 2 degrees Celsius and pursue efforts to limit the rise to 1.5 degrees Celsius.
Other market failures and behavioural anomalies
Notwithstanding the market failures associated with energy pricing, it is often argued that policy measures to improve energy efficiency deliver ‘win-win’ outcomes in the sense that they deliver reduced greenhouse gas emissions, as well as private benefits through bill savings that outweigh the associated capital costs.21 This implies there are energy efficiency opportunities that are privately cost effective that nevertheless fail to be adopted. This is often referred as the ‘energy efficiency paradox’.22
20 United Nations Framework Convention on Climate Change website, http://unfccc.int/paris_agreement/items/9485.php, accessed 19 October 2017.
21 See for example COAG Energy Council 2015, National Energy Productivity Plan 2015-2030: Boosting Competitiveness, managing costs and reducing emissions, December 2015, p. 6.
22 Gerarden, T.D., Newell, R.G. and Stavins, R.N. 2015, Assessing the Energy Efficiency Gap, Duke University Energy Initiative and Harvard Environmental Economics Program, January 2015, p. 1.
www.TheCIE.com.au
Decision Regulation Impact Statement 23

Frequently cited market failures and behavioural anomalies/failures that contribute to the energy efficiency paradox in relation to commercial buildings, include the following:■ Information failures, including:
– a lack of information available to consumers/tenants;– information asymmetries where the seller/landlord may have
information on the energy efficiency of a building, but the buyer/tenant does not.
■ Split incentives/principal-agent problem — this arises where the party making energy efficiency investment decisions is not responsible for paying the energy bills and can arise where the incentives affecting the builders making decisions that affect future buyers are not aligned to end-occupant/end-owner.– This split incentive problem typically occurs between building owner
or the landlord who bears the cost of any investment in energy efficiency and tenant who pays the energy bills.
– Split incentives may also occur between a building contractor and its owner and occupier. A building contractor makes many energy-related decisions, and given these energy efficient alternatives usually increase the cost of construction, the contractor has incentives to avoid these measures, especially if the measures are not immediately obvious to the owner or prospective buyers.
– Another type of split incentive could occur within large organisations, where separate parts of the organisation are responsible for capital budgets and paying energy bills.
■ Behavioural anomalies/failures — some studies suggest that behavioural anomalies contribute to under-investment in energy efficiency. Here the problem is not the availability of information, rather the available information may not be acted on due to:– misinformed consumers — this includes issues such as:… inattention — some building owner/developer may fail to consider
the benefits of future energy savings;… lack of sufficient expertise; and/or… the salience of energy costs — for many businesses, energy costs are
a relatively small component of total costs and therefore may receive little consideration from owners/developers during the building design phase.
– systematic behavioural biases — in the face of the sheer complexity of understanding energy efficiency options, some owners/developers may make sub-optimal decisions due to:
www.TheCIE.com.au
24 Decision Regulation Impact Statement

… bounded rationality — cognitive limitations may mean that owners/developers have difficulty weighing up the energy saving benefits against cost and other factors such as design attributes; and/or
… heuristic decision making — heuristics are mental short-cuts, which some owners/developers may rely on to make decisions (examples include: repeating entrenched practices or building to the minimum standards specified in the NCC).
The nature of these behavioural anomalies/failures suggests that is it not the availability of information, but the way to act on information is the key problem, which have profound implication for policy design. In the context of the building code, a regulatory change to the minimum standards may be more effective to overcome heuristic decision making than a voluntary option which provides more information or improves information availability.
Other market barriers
Industry stakeholders including Australian Sustainable Built Environment Council and Climate Works, Property Council of Australia and Green Building Council of Australia provided co-ordinated submissions that pointed to some additional barriers to improved energy efficiency in commercial buildings. These submissions note that some energy efficiency technologies may not yet be commercially attractive (relative to less energy efficient alternatives) and offer a low return on investment (relative to alternative potential projects).In making the case for government intervention it is useful to distinguish between ‘market failures’ and ‘market barriers’. Market barriers are any disincentives to the use or adoption of a good. This includes market failures and behavioural anomalies, as well as a variety of other disincentives.23
Where businesses choose not to invest in technologies that are not commercially attractive (relative to less energy efficient alternatives) and offer a low return on investment (relative to alternative potential projects), this would reflect businesses making rational choice in their own interests. As such, they can be considered market barriers, but not market failures or behavioural anomalies. Only market barriers that are also market failures or behavioural anomalies provide a sound justification for government intervention.24
23 Gillingham, K. and Sweeney, J. 2010, Market Failure and the Structure of Externalities, p. 71,
24 ibid.
www.TheCIE.com.au
Decision Regulation Impact Statement 25

Review of direct evidence on market failures and behavioural anomaliesThe co-ordinated submissions from several industry groups (ASBEC and ClimateWorks, Green Building Council of Australia and the Property Council of Australia) argued that the presence of market failures (as discussed above) are well-accepted both in Australia and internationally. These submissions contended that it is therefore unnecessary to re-establish the presence of these market failures or behavioural anomalies for each regulatory intervention.However, the proposition that there are significant privately cost-effective energy efficiency opportunities that are not voluntarily adopted by the industry due to various market failures and/or behavioural anomalies is contested in the international literature. Stakeholder views were also mixed. Most stakeholders tended to agree that there were some market failures or behavioural anomalies in relation to the energy efficiency of commercial buildings. However, others felt that the case for market failures in the commercial building sector had been poorly demonstrated (G. James Glass and Aluminium) or argued that in some cases, the choice of less energy efficient premises may be a rational choice (Master Builders Australia).The extent to which the various market failures and behavioural anomalies affect choices can also vary significantly, including:■ across different building types, due to existing policy and market
mechanisms that apply to some buildings but not others, as well as other characteristics of specific markets and sub-markets; and
■ over time due to market developments and policy changes.It is therefore important to review the direct evidence on the presence of these market and behavioural failures, consistent with the approach taken by Gerarden et. al. (2015), in their exploration of the causes of the energy efficiency gap. Based on a review of the relevant evidence and existing mechanisms designed to address them, the market failures and behavioural anomalies that apply to each building type are summarised in table 2.2, with a more detailed summary of the evidence provided in appendix A.
022B025 Summary of market and behavioural failures by building typeType of building Market failures relating to
energy pricingInformation asymmetries Behavioural anomalies
Large office buildings (greater than 1000 m2)
■ Greenhouse gas emissions not internalised into energy prices.
■ The cost of supply mostly (although
■ Information asymmetries addressed through CBD program.
■ Some evidence to suggest that energy savings are mostly capitalised into building value and rents (and vacancy
www.TheCIE.com.au
26 Decision Regulation Impact Statement

Type of building Market failures relating to energy pricing
Information asymmetries Behavioural anomalies
perhaps not fully) reflected in energy prices.
rates).■ As this market is
generally targeted at larger premium and mid-tier tenants, behavioural anomalies are less likely, but cannot be ruled out completely.
Small office buildings (less than 1000 m2)
■ Greenhouse gas emissions not internalised into energy prices.
■ The cost of supply mostly (although perhaps not fully) reflected in energy prices.
■ Small office buildings are not covered by CBD program.
■ Although voluntary rating tools (NABERS and Green Star) are available, they are not particularly targeted for the smaller or ‘bottom end’ of the market, and these tools are not used by all small office buildings, suggesting that information asymmetries will apply to this market.
■ Split incentives between builder/end owner may occur where a building is developed speculatively or where a fixed price contract is given.
■ Difficult to observe directly, but plausible that energy efficiency decisions (particularly by smaller businesses) are affected by:– bounded rationality
and heuristic decision-making; and
– inattention and non-salience of energy costs.
Shopping centres
■ Greenhouse gas emissions not internalised into energy prices.
■ The cost of supply mostly (although perhaps not fully) reflected in energy prices.
■ Although a voluntary rating tool (NABERS) is available, this tool is not used by all shopping centres, suggesting that information asymmetries/split incentives will apply in this market.
■ In addition, NABERS only applies for shopping centres above 15 000 m2, higher than the average size of shopping centres.a It also does not cover tenant energy (e.g. instore lighting).
■ Difficult to observe directly, but plausible that energy efficiency decisions are affected by:– bounded rationality
and heuristic decision-making; and
– inattention and non-salience of energy costs.
Other retail ■ Greenhouse gas ■ Information ■ Difficult to observe
www.TheCIE.com.au
Decision Regulation Impact Statement 27

Type of building Market failures relating to energy pricing
Information asymmetries Behavioural anomalies
emissions not internalised into energy prices.
■ The cost of supply mostly (although perhaps not fully) reflected in energy prices.
asymmetries/split incentives likely to be an issue in this market.
directly, but plausible that energy efficiency decisions are affected by:– bounded rationality
and heuristic decision-making; and
– inattention and non-salience of energy costs.
Government schools and hospitals
■ Greenhouse gas emissions not internalised into energy prices.
■ The cost of supply mostly (although perhaps not fully) reflected in energy prices.
■ Information asymmetries less relevant as these buildings are less likely to be leased or sold.
■ Anecdotal evidence of bounded rationality and heuristic decision-making and split incentives through Government budgeting processes.
Hotels ■ Greenhouse gas emissions not internalised into energy prices.
■ The cost of supply mostly (although perhaps not fully) reflected in energy prices.
■ Various forms of information asymmetries less relevant as these buildings are less likely to be leased or sold.– Information
asymmetries likely to apply where hotels are sold.
– A voluntary rating tool (NABERS) is available; however, relatively few hotels have obtained a NABERS rating.
– Further, information asymmetries may be particularly relevant in major refurbishments.b
■ Difficult to observe directly, but plausible that energy efficiency decisions are affected by:– bounded rationality
and heuristic decision-making; and
– inattention and non-salience of energy costs.
Other commercial buildings
■ Greenhouse gas emissions not internalised into energy prices.
■ The cost of supply mostly (although perhaps not fully) reflected in energy prices.
■ Information asymmetries likely to apply when buildings are sold.
■ Difficult to observe directly, but plausible that energy efficiency decisions are affected by:– bounded rationality
and heuristic decision-making; and
– inattention and non-salience of energy costs.
www.TheCIE.com.au
28 Decision Regulation Impact Statement

a Of approximately 13 089 m2 in gross floor area, from 22.9 million m2 across 1 753 shopping centres. See Urbis, 2015, Australian shopping centre industry, prepared for the Shopping Centre Council of Australia. http://www.scca.org.au/wp-content/uploads/2015/06/Shopping-Centre-Industry-Statisctics-August-2015_FINAL.pdf. b Jones Lang LaSalle, 2012, Maximising capex spend to impact hotel value. http://www.jll.com.au/australia/en-au/Research/JLL_Advance_Maximising_Capex_Spend_to_Impact_Hotel_Value.pdf.Source: CIE based on evidence cited above.
In general, there is a sound in-principle case for minimum energy efficiency standards for commercial buildings on the basis that retail energy prices do not reflect the full social cost of supply (including the private resource costs as well as costs to the environment). ■ In particular, the external cost of greenhouse gas emissions are not
internalised into energy prices under current policy settings.■ On the other hand, under the Australian Energy Regulator’s (AER)
current pricing principles, the costs associated with peak demand are mostly (although perhaps imperfectly) built into energy prices.
Energy prices that do not reflect the full social cost of supply creates an incentive for the commercial building industry to under-invest in energy efficiency in the absence of government intervention. Minimum energy efficiency standards can therefore encourage more socially efficient energy efficiency decisions.The potential for minimum energy efficiency regulations to deliver a ‘win-win’ outcome (i.e. net private benefits in addition to the public benefits associated with reduced greenhouse gas emissions) relies on the proposition that there are additional market failures or behavioural anomalies that prevent building owners and tenants from making privately optimal energy efficiency.■ Evidence that building industry stakeholders are not making privately
optimal energy efficiency decisions generally relies on modelling showing that bill savings associated with improved energy efficiency would outweigh the associated capital costs. However, there is limited direct evidence of market failures and/or behavioural anomalies.
■ It is difficult to find direct evidence that behavioural anomalies, such as bounded rationality and heuristic decision making; and inattention to non-salient energy costs contribute to the energy efficiency paradox, as decision-making processes cannot be directly observed. Nevertheless, consistent with the findings of the Productivity Commission25 and the views of most stakeholders, we consider these behavioural anomalies to be plausible explanations for sub-optimal energy efficiency choices across all building types, given the complexity of weighing up the costs and benefits of energy efficiency choices for commercial buildings and competing priorities of design.
25 Productivity Commission 2005, The Private Cost Effectiveness of Improving Energy Efficiency, Inquiry No. 36, 31 August 2005, p. XXV.
www.TheCIE.com.au
Decision Regulation Impact Statement 29

■ Information asymmetries and the landlord-tenant/builder-occupant split incentives problem are also likely to contribute to the energy efficiency paradox for smaller office buildings and leased retail premises (including shopping centres) and when buildings of all types are sold.– Commercial Building Disclosure (CBD) requirements do not apply to
smaller office buildings. Although voluntary rating tools (including NABERS and Green Star) are available, they are not used by all building owners/managers in this market. Also, smaller office buildings are more likely to have small business tenants, where the behavioural anomalies discussed above are most likely to apply.
– Similarly, information asymmetries are likely to apply to retail buildings, which consume around 40 per cent of the energy used by new commercial buildings. A voluntary rating tool is available for shopping centres, but not all shopping centres have obtained a rating.
■ For larger office buildings, mandatory energy efficiency disclosure requirements are likely to address information asymmetries and the landlord-tenant problem. There is some (albeit limited) evidence to suggest that energy savings are capitalised into building sale prices and rents for larger commercial buildings.
Risk of regulatory failureWhile market failures provide an ‘in principle’ justification for minimum energy efficiency standards for commercial buildings, it is also important to acknowledge the risk of regulatory failure. Regulatory failure in relation to minimum energy efficiency standards for commercial buildings could occur in several ways, including the following.■ Minimum standards are overly stringent — where minimum energy
efficiency standards are set too high, the cost of achieving the minimum standard may outweigh the benefits for at least some buildings. The optimal level of energy efficiency will vary significantly across buildings due to a wide range of factors. The NCC takes into account differences across Climate Zones and building type. However, this will not address all of the variation across buildings, with the optimal level of energy efficiency also affected by factors such as: the microclimate and energy prices in the specific location; differences in occupancy patterns within a building type; and the design preferences of the building owner. Given this variation, setting the minimum standard at the correct level is a difficult challenge.
■ The minimum standards are poorly specified — specifying minimum energy efficiency standards in a way that achieves the intended improvement in energy performance in without unduly increasing costs is a complex exercise. Poor specification of the minimum standards
www.TheCIE.com.au
30 Decision Regulation Impact Statement

could lead to some perverse outcomes. For example, EA’s modelling suggests that the glazing provisions in the current NCC overemphasise the importance of the U-value and underemphasises the importance of the solar heat gain coefficient (SHGC), particularly for daytime operating buildings. In some cases, this may be preventing developers from choosing glazing constructions that are both cheaper and perform better than the cheapest compliant option.
An additional downside of higher than necessary minimum standards is that they restrict competition by excluding products that do not meet the specified standard.
The case for changeAs outlined above, minimum energy efficiency requirements for commercial buildings have been specified in the NCC since 2006. The stringency of these minimum standards was increased in 2010, but have not been updated since. The case for change is set out below.
Policy driversAs discussed above, a number of recent policy developments are driving the case to increase the stringency of the minimum energy efficiency requirements for commercial buildings set out in the NCC.Under the Paris Agreement, Australia has committed to implementing an economy-wide target to reduce greenhouse gas emissions by 26 to 28 per cent below the 2005 level by 2030.26 The domestic challenge is to achieve these targets at least cost. Energy efficiency is often cited as a low (or in some cases negative) cost approach to achieving greenhouse gas abatement.27
In addition, the National Energy Productivity Plan (NEPP) sets a target of achieving a 40 per cent improvement in energy productivity between 2015 and 2030. Changes to the minimum energy efficiency requirements for commercial buildings in the NCC has been identified as an approach that is likely to deliver strong productivity and emissions reduction benefits.28
26 Department of the Environment and Energy website, http://www.environment.gov.au/climate-change/publications/factsheet-australias-2030-climate-change-target, accessed 8 November 2017.
27 See for example: ClimateWorks website, https://www.climateworksaustralia.org/project/national-projects/low-carbon-growth-plan-australia, accessed 8 November 2017.
28 COAG Energy Council 2005, National Energy Productivity Plan: Work Plan, p. 20.
www.TheCIE.com.au
Decision Regulation Impact Statement 31

Market developmentsThe cost effectiveness of energy efficiency measures depends fundamentally on the price of energy and the cost of energy efficient technologies and designs relative to alternatives. Since the minimum energy efficiency standards for commercial buildings were last updated:■ Energy prices have increased significantly — in particular:
– retail electricity prices have increased by between 80 and 90 per cent in real terms over the past ten years;29 and
– Gas prices have doubled in the Southern States (South Australia, New South Wales, the Australian Capital Territory, Victoria and Tasmania) over the past year and increased by over 50 per cent in Queensland.30
■ The cost of some energy efficient technologies have decreased significantly — for example:– the lighting industry reported that the cost of energy efficient light
emitting diode (LED) lighting has fallen by more than 50 per cent in recent years; and
– glazing industry representatives also reported significant reductions in the cost of energy efficient glazing in the Australian market over recent years.
As a result, the range of cost-effective energy efficiency opportunities will have expanded significantly.
Inefficiencies in the existing NCCThe review of Section J has identified a number of inefficiencies in the existing NCC, including:■ complex and ambiguous requirements that may not be easily
understood by users and may potentially be leading to inadvertent non-compliance; and
■ sub-optimal approaches to some building elements, which may be preventing users from choosing more cost-effective energy efficiency options.
This is a regulatory failure, rather than a market failure. Nevertheless, addressing these inefficiencies could deliver more energy efficient buildings at minimal (or even negative) additional cost.
29 ACCC 2017, Retail Electricity Price Inquiry: Preliminary report, 22 September 2017, p. 12.
30 ACCC 2017, Gas Inquiry 2017-2022, Interim Report, September 2017, p. 20.
www.TheCIE.com.au
32 Decision Regulation Impact Statement

Modelling showing cost effective energy efficiency opportunities in commercial buildingsEstimating the size of the energy efficiency gap for commercial buildings is a challenging exercise. In its year-long Inquiry into the private cost effectiveness of energy efficiency (completed in 2005), the Productivity Commission found that there was such uncertainty (and so many unknowns) about the size of the energy efficiency gap across the Australian economy (not just for commercial buildings) that it is impossible to say how big it is.31
Nevertheless, several studies have tried to quantify the extent to which ‘cost-effective’ energy savings could be made relative to the minimum standards currently specified in the NCC.In 2012, the (then) Department of Climate Change and Energy Efficiency commissioned a report to identify cost effective savings in the energy consumption of new buildings that could be achieved in Australia by 2020. The report covered both residential and commercial buildings (the report was updated in 2016).32
The updated report suggested substantial savings could be achieved in new commercial buildings (table 2.3). With a learning rate of 3 per cent per year (i.e. the additional cost of achieving higher energy efficiency standards declines by 3 per cent per year), by 2020:■ energy savings of around 37 per cent (in weighted average terms)
could be achieved by 2020, with savings ranging from around 17 per cent in Melbourne up to around 73 per cent in Darwin, in a scenario without carbon price.
■ energy savings of around 53 per cent (in weighted average terms) could be achieved, with savings ranging from around 29 per cent in Hobart up to around 79 per cent in Darwin, in a scenario with medium price (the shadow price of carbon begins at $5.49/t CO2-e in 2015 and rise to $30.14 in 2020, $36.67 in 2025, $44.61 in 2030 and $56.45 in 2036).33
31 Productivity Commission 2005, The Private Cost Effectiveness of Improving Energy Efficiency, Inquiry No. 36, 31 August 2005, p. XXV.
32 pitt&sherry 2016, Final Report – Pathway to 2020 for Increased Stringency in New Building Energy Efficiency Standards: Benefit Cost Analysis: Commercial Buildings: 2016 Update, final report to Department of Industry, Innovation and Science, May, available at https://www.environment.gov.au/system/files/energy/files/pathway-to-2020-for-increased-stringency-in-new-building-energy-efficiency-standards-2016-update.pdf
33 ibid.
www.TheCIE.com.au
Decision Regulation Impact Statement 33

022B026 Cost-effective energy savings in 2020 relative to BCA 2010No carbon price Medium carbon price
Per cent Per cent
Sydney (Climate Zone 5) 41 56Darwin (Climate Zone 1) 73 79Brisbane (Climate Zone 2) 53 64Adelaide (Climate Zone 5) 38 50Hobart (Climate Zone 7) 33 29Melbourne (Climate Zone 6) 17 43Perth (Climate Zone 5) 46 56Canberra (Climate Zone 7) 38 52Weighted average 37 53
Source: pitt&sherry 2016, Pathway to 2020 for Increased Stringency in New Building Energy Efficiency Standards: Benefit Cost Analysis: 2016 Update, Final Report, Prepared for the Department of Climate Change and Energy Efficiency, May, pp.6-7.
As discussed above, the ABCB was tasked with proposing changes to the NCC that were economically feasible. Based on the approach adopted by pitt&sherry changes were developed by EA, and modelled changes in annual energy use across Climate Zones and building types are shown in table 2.4.
Table 2.5 shows the associated change in greenhouse gas emissions.
022B027 Estimated change in annual energy useClimate Zone Location modelled Hotel Office Retail Health Average
Per cent Per cent Per cent Per cent Per cent
1 Darwin -25 -27 -21 -32 -242 Brisbane -33 -35 -15 -39 -243 Alice Springs -30 -21 -20 -34 -234 Wagga Wagga -34 -31 -10 -19 -165 Sydney -35 -37 -20 -37 -296 Melbourne -34 -30 -8 -21 -157 Canberra -39 -29 0 -4 -178 Thredbo -36 20 23 29 -14
Average -20Weighted average -23
a While the modelling suggests that the energy use of some buildings in Climate Zone 8 will increase, there are reductions in greenhouse gas emissions, primarily due to: more achievable glazing provisions being proposed for Climate Zone 8, which are slightly less stringent than the current provisions; and the analysis being based on more realistic accounting of gas heating, which increases raw energy, but decreases greenhouse gas emissions.
www.TheCIE.com.au
34 Decision Regulation Impact Statement

Source: EA 2017 core modelling. Average numbers are CIE calculation based on new commercial building estimates.
022B028 Estimated change in greenhouse gas emissionsClimate Zone Location modelled Hotel Office Retail Health Average
Per cent Per cent Per cent Per cent Per cent
1 Darwin -25 -27 -21 -32 -242 Brisbane -32 -35 -17 -41 -253 Alice Springs -30 -20 -24 -37 -264 Wagga Wagga -33 -37 -23 -31 -265 Sydney -35 -38 -25 -43 -336 Melbourne -33 -41 -25 -38 -297 Canberra -39 -41 -11 -25 -288 Thredbo -36 -24 3 -20 -23
Average -27Weighted average -29
Note: The more realistic accounting of gas heating (noted under Table 2.4) and the subsequent emphasis on reducing cooling energy is highlighted in Canberra. While there is no apparent reduction in energy use for retail buildings there is a significant reduction in greenhouse gas emissions. This is due to a proportionally greater use of gas for heating, which has a slightly higher energy intensity than electricity, but a much lower greenhouse gas intensity.Source: EA 2017 core modelling. Average numbers are CIE calculation based on new commercial building estimates.
These modelled energy savings and greenhouse gas emission reductions vary across Climate Zones and building classes. According to CIE estimates, retail buildings/shopping centres are the largest energy consumer of the new commercial buildings (accounting for 39 per cent of total energy consumption by new commercial buildings in 2019 and 2029, followed by warehouses (19.9 per cent in 2019 and 18.5 per cent in 2029), offices (10.5 per cent in 2019 and 10.8 per cent in 2029) and education buildings (10.4 per cent in 2019 and 10.7 per cent in 2029).
Stakeholder support for changeMost stakeholders in the submission34 to the Consultation RIS are supportive of the proposed changes to the Section J of the NCC (chart ). More details about stakeholder submissions can be found in Appendix B.
34 Five out of 23 submissions do not answer the question of preferred option.
www.TheCIE.com.au
Decision Regulation Impact Statement 35

022A029 Preferred option to proposed changes
0123456789
10
Option 1 Option 2 Objection to Option2
Option 3 Other
Numb
er of
respo
nses
Conditional support
Support support
Note: Other category includes choices not relating to Options 1, 2 or 3 or no clear indication of preference to one optionData source: CIE construction based on submissions
Limitations of the NCC to drive further energy efficiency improvementsAlthough there is an in-principle case for change, it is important to note that the NCC has limitations as a mechanism for driving further energy efficiency improvements.One limitation is the focus on building design, rather than actual performance. Energy performance of buildings actually constructed may fall short of the design for a range of reasons, including:■ variations between the building design and what is actually built■ sub-optimal operation of the building, and■ the behaviour of tenants.Improved compliance mechanisms would address only instances where there is variation between the approved building design and what is actually built.Furthermore, as noted above, the optimal level of energy efficiency could vary significantly across buildings. In general, to limit complexity, aiming for ‘best practice’ (or somewhere close to best practice), rather than a more conservative minimum standard (and potentially encourage industry to exceed it through other measures) increases the risk of regulatory failure, whereby the minimum standard is set above the optimal level for some buildings and therefore impose a net cost on those buildings.The NCC has been evolving continuously and reflects general technical improvements over time. For a particular version/point of time, the NCC
www.TheCIE.com.au
36 Decision Regulation Impact Statement

should achieve balance between technical advances and business viability/market access.
The key role for the NCC is to correct any market failures and provide a minimum standard that would not hinder the adoption of new technology which exceeded the minimum stringency. For example, the NCC has not hindered the widespread adoption of LED lighting technology. Further, building owners/designers have the option to use a Performance Solution (rather than the DTS approach) and can choose to exceed the minimum standards specified in the NCC.
A further limitation of the NCC as a policy mechanism for driving further energy efficiency improvements is the potential for increasing stringency of the minimum standards to restrict choice and therefore represent a greater restriction on competition. That said, under COAG Guidelines, regulation can restrict competition where:
■ it can be demonstrated that the benefits of the restriction to the community as a whole outweigh the costs; and
■ the objectives of the regulation can only be achieved by restricting competition adopting the option that generates the greatest net benefit to the community.35
Summary and focus of the RISThere is a sound in-principle case for minimum energy efficiency standards for commercial buildings on the basis of the negative
35 Council of Australian Governments, Best Practice Regulation: A Guide for Ministerial Councils and National Standard Setting Bodies, October 2007, pp. 12-13.
www.TheCIE.com.au
Decision Regulation Impact Statement 37

externalities associated with greenhouse gas emissions associated with energy consumption. The potential for minimum energy efficiency regulations to deliver a ‘win-win’ outcome (i.e. net private benefits in addition to the public benefits associated with reduced greenhouse gas emissions) relies on the proposition that there are additional market failures or behavioural anomalies that prevent building owners and tenants from making energy efficiency decisions in their own best interests.
Although there is limited direct evidence, stakeholders generally accept it is nevertheless plausible that these market failures and behavioural anomalies (such as bounded rationality/heuristic decision making and inattention/non-salience of energy costs for many businesses) exist and that minimum energy efficiency standards can achieve a ‘win-win’ outcome.
The available modelling — including the modelling by EA that underpins the proposed changes to the NCC — suggests that there are very significant opportunities to improve the energy efficiency of commercial buildings.
The purpose of a RIS is to determine whether proposed regulatory changes are likely to be beneficial for society overall (and whether the proposed regulatory change is the best available option for achieving the objectives). This involves providing rigorous scrutiny of the modelling findings and the assumptions that underpin them.
www.TheCIE.com.au
38 Decision Regulation Impact Statement

3 Objectives and options
ObjectivesThe proposed changes to the NCC’s energy efficiency requirements for commercial buildings are occurring in a broad policy context. In particular, improving the energy efficiency of commercial buildings is one of the actions under the NEPP (Measure 31). The stated objectives of the NEPP (relevant to commercial buildings) are to:■ reduce energy costs for businesses;■ maintain Australia’s competitiveness and growing the economy; and■ reduce carbon emissions and improving sustainability.36
Although not explicitly stated, these objectives together imply an objective of achieving privately cost-effective energy efficiency improvements (i.e. measures that achieve a ‘win-win’ outcome by delivering private net benefits, as well as contributing to reducing GHG emissions). In particular, measures that improve energy efficiency that are not privately cost-effective would be consistent with reducing carbon emissions, but imposing additional net costs on businesses would not necessarily be consistent with maintaining Australia’s competitiveness and growing the economy.Secondary objectives of the proposed changes are to address specific issues with Section J including:■ reducing complexity;■ improving the effectiveness of Section J of the NCC at delivering
outcomes.
OptionsAs the objectives of the NEPP are broad, there are a wide range of measures that could potentially contribute to the achievement of these objectives. Many of these options are unrelated to the energy efficiency provisions for commercial buildings and outside the purview of the ABCB. The RIS therefore focuses on the following options.
36 COAG Energy Council 2015, National Energy Productivity Plan 2015-2030: Boosting competitiveness, managing costs and reducing emissions, December 2015, p. 13.
www.TheCIE.com.au
Decision Regulation Impact Statement 39

Option 1: Status quoA status quo or business as usual option where there is no change to the existing energy efficiency provisions in the NCC.This status quo option will be set up as a baseline to evaluate the proposed changes as discussed in Option 2 below.
Option 2: Draft revisions to NCC 2016The review of the energy efficiency requirements in Section J of the NCC has been comprehensive and a wide range of technical changes have been proposed. These include:■ changes to the Performance Requirements; ■ new Verification Methods, as well as changes to the existing Verification
Method (JV3) that are used to demonstrate compliance with the Performance Requirements; and
■ changes to the Deemed-to-Satisfy Provisions that are used to demonstrate compliance with the Performance Requirements.
Performance Requirements
The Performance Requirements are the only mandatory component of the NCC. The proposed changes to the Performance Requirements include the following:■ A new performance metric — the current proposal is to quantify JP1 in
terms of average kilojoules per square metre per hour of building operation. For buildings in Climate Zones that represent most of the Australian population, the proposed JP1 metric will be met by achieving an energy performance of between 0-50 per cent improvement (based on 2016 DTS levels).
■ Reference to human comfort (clause JP1(b)) — this will ensure the building is fit for purpose and that reductions in energy consumption do not come at the expense of human comfort.
■ Deletion of a clause (clause JP3) that favours low greenhouse gas intensity heating energy as it is no longer viable due to the increasing price of gas and the accessibility of grid electricity with low emissions intensity.
Verification Methods
The intent of any Verification Method is to demonstrate that a Performance Solution meets the mandatory Performance Requirements. Currently, the NCC includes one Verification Method, JV3, that may be used to demonstrate that a Performance Solution complies with the NCC.
www.TheCIE.com.au
40 Decision Regulation Impact Statement

Improvements to JV3 have been proposed and a number of new verification avenues included (see box ) to reduce the need to separately demonstrate compliance with the NCC and in these circumstances avoiding duplication in assessment and approval costs.
033ANew Verification Methods
Green Star
Compliance with JP1 is verified where a building simulation report that has been reviewed and approved by the Green Building Council demonstrates that:■ The report is compliant with Green Star requirements for a
simulation; and■ The proposed building outperforms the reference building in terms of
greenhouse emissions by not less than 10 per cent; and■ The proposed building simulation demonstrates achievement of
acceptable thermal comfort better than or equal to that achieved in the reference building where acceptable thermal comfort is defined as a PMV of between -0.5 and +0.5 as defined in ASHRAE 55-2013; and
■ Compliance with workmanship and non-simulated items throughout Section J is separately demonstrated.
NABERS
NABERS Compliance with JP1 is verified where a signed NABERS Commitment Agreement to achieve a rating of not less than 5.5 Stars NABERS Energy for Offices base building exists, and: ■ The NABERS building simulation shows that 95 per cent of the
occupied area achieves acceptable thermal comfort for not less than 98 per cent of hours in which the HVAC operates (excluding morning warm-up/cool-down periods) where acceptable thermal comfort is defined as a PMV of between -1 and +1 as defined in ASHRAE 55-2013; and
■ Compliance with workmanship and non-simulated items throughout Section J is separately demonstrated; and
■ Compliance with J6 is separately demonstrated for all areas of the building where lighting energy consumption is not included within the NABERS Base Building rating energy coverage.
These new methods reduce duplication in circumstances where a building owner voluntarily chooses to obtain a Green Star or NABERS rating (or is
www.TheCIE.com.au
Decision Regulation Impact Statement 41

forced to in order to comply with mandatory disclosure requirements). Currently, where a building owner chooses to use JV3 as a method of assessment to demonstrate compliance with the NCC, they must:■ demonstrate compliance with the NCC through building modelling and a
report; and■ demonstrate compliance with Green Star or NABERS using similar
modelling and a report.
Changes to the DTS provisions
Significant changes to the DTS provisions have also been proposed, such that buildings that use this pathway meet the new Performance Requirements. The specific changes to the DTS provisions are outlined in Appendix A. Key changes include:■ changes to the glazing and façade requirements;■ changes to the minimum energy efficiency standards of the building
services; and■ changes to the maximum illumination power density for artificial
lighting.The proposed changes will apply to all Climate Zones albeit with variation in specific requirements because exclusion of particular zones was not feasible due to the following reasons:■ In general stringency updates underlying reference building schedules
and performance quantification would be incompatible with existing methods, undermine objectives and lead to confusion in the market.
■ The stringency of the DTS services provisions were selected to optimise outcomes and correct over stringency in a number of cases, which suggests poorer design outcomes need to be considered in this context.
■ Due to methodology change, there is no flexibility to retain the existing requirements for façade which would require a duplication of provisions and methods which would be complex and unworkable particularly for mixed use buildings. Fundamental changes to façade provisions mean guidance and advisory material require withdrawing or updating.
Option 3: Non-regulatory optionCOAG Best Practice Guidelines require that a RIS identifies a range of viable options, including, as appropriate, non-regulatory, self-regulatory and co-regulatory options.37 In the context of a RIS examining proposed changes to the NCC, it is important to consider alternative options to not
37 Council of Australian Governments 2007, Best Practice Regulation, A Guide for Ministerial Councils and National Standard Setting Bodies, October 2007, p. 10.
www.TheCIE.com.au
42 Decision Regulation Impact Statement

only establish that the proposed changes to the NCC deliver a net benefit to the community, but also that changing the NCC is the best approach to achieving the government’s objectives (i.e. the approach that delivers the highest net benefits).As noted above, the objectives of Section J of the NCC and the stated objectives of the NEPP are broad and could encompass a wide range of measures, including measures unrelated to commercial buildings. We narrow the focus to alternative measures that improve the energy efficiency of commercial buildings.Various studies note that the most efficient policy responses are likely to be those that directly address the relevant market failures. Based on the discussion in chapter 2, the main market failures (and behavioural anomalies) being addressed are:■ externalities associated with greenhouse gas emissions;■ bounded rationality and heuristic decision-making; and■ inattention/non-salience of energy costs for some businesses.It is difficult to directly address greenhouse gas externalities through a policy specifically targeted at commercial buildings. However, an alternative more light-handed option to encourage improved energy efficiency performance of commercial buildings would focus on providing relevant information to users and managers of commercial buildings. In this direction, two alternative options could be considered:■ expansion of the current Commercial Building Disclosure (CBD)
Program; and■ expansion of the energy efficiency rating scheme such as NABERS.However, these alternative options are being considered separately under Measure 9 of the National Energy Productivity Plan 2015-203038. The expansion of CBD is a compulsory government regulation change and thus requires a separate RIS. It should also be noted that there were some reservations from the industry to this option in the past. For example, the Shopping Centre Council of Australia in 2014 raised its concerns over the expansion of CBD to cover shopping centres, citing some impediments including:39
38 Council of Australian Governments Energy Council 2015, National Energy Productivity Plan 2015-2030: Boosting competitiveness, managing costs and reducing emissions, December, Available at http://www.coagenergycouncil.gov.au/sites/prod.energycouncil/files/publications/documents/National%20Energy%20Productivity%20Plan%20release%20version%20FINAL_0.pdf.
39 Jewell, Cameron 2014, ‘Mandatory disclosure of energy ratings for shopping centres is off the table’, The Fifth Estate, 13 February 2014, available at https://www.thefifthestate.com.au/business/government/mandatory-disclosure-of-energy-ratings-for-shopping-centres-is-off-the-table, accessed on 8
www.TheCIE.com.au
Decision Regulation Impact Statement 43

■ the landlord/tenant relationship being a highly regulated business-to-business relationship under State and Territory retail tenancy legislation;
■ State and Territory shop trading hours legislation dictating (and limiting) the retail sector’s ability to trade when it wants; and
■ not experiencing widespread demand of greater sustainability from tenants, particularly against fundamentals such as centre location/trade area, foot traffic, turnover, tenant mix and occupancy costs.
On the other hand, expansion of energy efficiency rating schemes such as NABERS is a voluntary measure, and thus more likely embraced by industries. For example, although the Shopping Centre Council opposed CBD, it acknowledged that, ‘reducing operating costs, particularly in relation to energy, water and waste, was still of concern to the sector, with NABERS and Green Star “important platforms and drivers for our members’40.As discussed previously, there are currently NABERS tools available for office buildings, shopping centres, hotels and data centres. The rating tools for other building types have yet to be developed if this option is pursued.Furthermore, there is a timing issue associated with the expansion of CBD and rating tools. A building has to be in operation for a certain period of time before a rating can be issued. In other words, they are measures to address market failure problems for existing buildings, rather than new buildings. For this reason, the expansion of CBD and rating tools could be used as a complementary measure to the NCC, rather than an alternative option to increasing its stringency.One viable option that may encourage voluntary uptake of energy efficiency opportunities would be to turn the work that underpins the proposed changes to the NCC into a voluntary handbook, as opposed to mandating higher energy efficiency requirements. Stakeholders including NSW building Administration and Master Builders Australia noted the interaction of alternative options, but saw these as contributors to a solution rather than alternatives in their own right.
November 2017.40 ibid.
www.TheCIE.com.au
44 Decision Regulation Impact Statement

4 Approach to the cost-benefit analysis
The cost-benefit analysis is conducted by first comparing the impacts of proposed changes to the NCC (Option 2) and the alternative voluntary option (Option 3) to the baseline business as usual option. The analysis aimed to identify likely impacts from the options through:■ early consultation and formal consultation with stakeholders from
industry and government agencies; ■ reviewing energy modelling results by EA;■ reviewing relevant data from other sources to assist the analysis; and■ conducting an online survey to gather additional information.These impacts are then quantified in monetary terms, i.e., costs and benefits, and aggregated over Climate Zones, building classes and over time (by applying a discount rate) to estimate the net present value (NPV) and benefit-cost ratios (BCRs).
General approach to the CBAThe CBA estimates the costs and benefits of the proposed options against the baseline of maintaining the status quo.
Time periodRISs typically use a five or ten year time horizon for measuring costs and benefits. However, buildings are typically long-lived assets, with a life of 40 or more years. EA’s analysis is based on the expected life of the ‘investment’.■ For energy efficiency measures relating to the building’s façade, this
could be around 40 years.■ For building services, this is around 25 years.This is broadly consistent with the approach used in other energy efficiency RISs. Following this method, we conduct the analysis of costs over a ten year period, but include in the benefits the full life of each building/services constructed or installed during that ten year regulatory period.
www.TheCIE.com.au
Decision Regulation Impact Statement 45

Discount rateThe nature of investments in energy efficiency (i.e. generally an upfront cost in exchange for a stream of future benefits) and the long timeframes involved mean that energy efficiency CBAs can be particularly sensitive to the discount rate.The Commonwealth Office of Best Practice Regulation (OBPR) typically requires a real discount rate of 7 per cent to be used in a RIS (this is consistent with EA’s analysis), with sensitivity analysis using 3 per cent and 10 per cent. This is intended to reflect the social discount rate. However, there is potentially a case for deviating from the OBPR’s preferred 7 per cent in this context. As for analysis conducted over periods longer than 30 years, OBPR suggests using lower discount rates. In particular, for analyses over 31-75 years, OBPR recommends using a discount rate of 5.4 per cent.41
Alternatively, as some (but not all) of the costs and benefits arising from increases in energy efficiency requirements are private (i.e. in some cases the building owner that invests in greater energy efficiency receives the benefits from future bill savings), it may be more appropriate to use estimates of the private opportunity cost of capital as the appropriate discount rate. That is, to make the claim that the proposed changes to the NCC will deliver private net benefits as well as benefits to the environment, the discount rate should reflect the private opportunity cost of capital.As noted by the Productivity Commission (2005), one view is that regulation impact assessments evaluate private cost effectiveness for the ‘average individual’, and their cost of capital — the average private opportunity cost of capital (OCC) across all members of society — will equal the social OCC.However, the Productivity Commission (2005) argues that the average private OCC could be much higher than the estimated social discount rates normally used in regulation impact assessments. Furthermore, the average private OCC (even if accurately measured) would not be sufficient to reflect the rate for all individuals above the average (and be higher than that of all those below the average rate), given the diverse circumstances of the businesses.In this regard, the US Department of Energy uses estimates of the commercial discount rate to discount future energy savings when assessing the impact of changes to appliance and equipment standards.42
41 Australian Government Office of Best Practice Regulation 2014, Environmental Valuation and Uncertainty, Guidance Note, July 2014, p. 4.
42 Fujita, K.S. 2016, Commercial Discount Rate Estimation for Energy Efficiency Standards, Lawrence Berkeley National Laboratory, 13 April 2016.
www.TheCIE.com.au
46 Decision Regulation Impact Statement

This is based on estimates of the weighted average cost of capital (WACC) for the relevant companies using the Capital Asset Pricing Model. However, the Productivity Commission (2005) notes that without a detailed and statistically representative national survey, such an approach may not be practical for Australia.In general, market interest rates are significantly lower than in 2005 when the Productivity Commission completed its Inquiry, while OBPR’s preferred discount rate has not changed. The private WACC for the relevant companies may therefore be now closer to OBPR’s preferred discount rate. The US Department of Energy estimates are in the 6-8 per cent range. These factors, together with the lack of available data for Australia weaken the case for deviating from the OBPR’s preferred discount rate. We therefore use 7 per cent as the central case discount rate, with 3 per cent and 10 per cent the alternatives for sensitivity testing.
Establishing a baselineAs outlined above, the status quo will be used as a baseline. That implies the existing NCC minimum energy efficiency requirements would remain in place.
Energy efficiency under baselineData on the extent to which buildings are currently choosing to meet or to exceed the minimum NCC standards is limited. One source of information is the NABERS database. This covers:■ most larger office buildings■ around 50 per cent of shopping centres, and■ a limited number of hotels.Chart shows the distribution of office buildings by NABERS rating for 2012, 2015 and 2017. It should be noted that due to the limitation in the dataset, the distributions are for all existing buildings and not necessarily the new buildings. In other words, the distribution for new office buildings is most likely towards better performance.
www.TheCIE.com.au
Decision Regulation Impact Statement 47

044A0410 Distribution of office building by NABERS rating
0%
5%
10%
15%
20%
25%
30%
0 1 2 3 4 5 6
Frequ
ency
of bu
ilding
s with
each
ratin
g
NABERS star rating
2012
2015
2017
4.03.3 4.2
Note: Averages are weighted by the Floor Space in terms of the Net Lettable Area. Data source: CIE, using the data from the Australian Government Department of the Environment and Energy, 2017, ‘CBD Downloadable Data Set’, available at: http://www.cbd.gov.au/registers/cbd-downloadable-data-set.
The chart shows that office buildings have kept improving in terms of NABERS rating — the average rating was 3.3 stars in 2012, and it is now 4.2 stars on average. Suppose the NCC 2016 is equivalent to 4.5 NABERS stars, the data shows that almost half (48.3 per cent) of all existing office buildings (rated) have achieved or exceed NCC 2016. For new office buildings, this proportion would be even higher. This is largely due to the government’s CBD policy which mandates compulsory disclosure for office buildings with a certain amount of floor space (originally for buildings above 2 000 m2 and then extended to 1 000 m2). It also demonstrates that the baseline is not necessarily equivalent to the minimum requirement of NCC 2016.Chart shows the distribution of shopping centres by NABERS rating for 2015 and 2016. It should be noted that there were only a small number of shopping centres registered in 2015, and as a result the distribution curve is not smooth. The average rating of shopping centres registered in the NABERS system in 2016 was 3.81 stars, compared to the average of over 4 stars for offices. This is probably due to the facts that requesting a NABERS star rating for shopping centres is voluntary, and that shopping centres were included in the rating system only recently.
www.TheCIE.com.au
48 Decision Regulation Impact Statement

044A0411 Distribution of shopping centres by NABERS rating
Note: Averages are weighted by the Floor Space in terms of the Net Lettable Area. Data source: CIE construction based on NABERS data.
There is little publicly available information on the extent to which other types of commercial buildings exceed the minimum energy efficiency standards set out in the NCC. To provide some insights on this issue, the CIE completed a survey of building surveyors. Building surveyors were specifically targeted because they see a wide range of buildings (see appendix F for further details).The survey results weighted by the number of buildings (of each type) each respondent had certified are shown in chart .
044A0412 Approach to achieving compliance with Section J of the NCC
0%10%20%30%40%50%60%70%80%90%
100%
Premiumoffice
Other office Shoppingcentre
Other retail Hospitals Schools Uni/VET Hotels
Per c
ent
PS 10-20% below standard PS 0-10% below standard PS to NCCDTS above NCC DTS to NCC
Note: PS refers to a Performance Solution. Data source: CIE Survey of building surveyors.
These results are based on a relatively small number of responses for some types of buildings. Furthermore, it is not clear whether the responses are representative of the industry more generally. Nevertheless,
www.TheCIE.com.au
Decision Regulation Impact Statement 49

they provide some indication of the performance of new buildings relative to the minimum standards specified in the NCC.Although the approach to achieving compliance with Section J of the NCC varies significantly across different buildings, it is evident from the chart that:■ most buildings are built to only achieve the minimum stringency
requirements of the NCC; and■ a large proportion of buildings achieve the compliance through the DTS
route.
Uptake of LED lighting under baseline¤Technological improvement is one factor contributing to the finding that significant improvements in energy performance can be achieved with lower construction costs. In particular, the revised NCC will reduce maximum illumination power densities, which will require LED lighting to be used for most buildings, except for cases where unique and highly designed solutions are adopted. The cost of LED lighting has fallen significantly over recent years and is estimated to be both cheaper and significantly more energy efficient than other technologies.However, there is evidence to suggest that the market is widely adopting LED lighting, even without changes to the NCC. As pointed out by EA in its Artificial Lighting Sub-report (p. 9):
…LED technology is pushing fluorescent and metal halide technology out of its position as the main technology used in commercial buildings. LED is becoming ubiquitous in the vast majority of designs for new buildings, and driving energy efficiency lighting upgrades in existing buildings as well.While the majority of suppliers still supply fluorescent and metal halide luminaires, Zumtobel Group (including Thorn Lighting) have announced that as of March 2017 they will only supply LED luminaires, technology development predictions provided to Energy Action by Pierlite indicate that fluorescent luminaires will be deleted from their range by 2019, Australume predicts a rise in the cost of their fluorescent luminaires as the demand for fluorescent technology decreases and many of the newest suppliers on the market have never offered a fluorescent or metal halide option.
This is also consistent with the views of lighting industry stakeholders gathered through the preliminary stakeholder consultation process.The Productivity Commission has previously noted that the under-estimation of the uptake of energy efficiency measures in the baseline can lead to CBAs overstating the potential for regulation to deliver cost-effective improvements in energy efficiency.43 Failing to take
43 Productivity Commission 2005, The Private Cost Effectiveness of Improving Energy Efficiency, Productivity Commission Inquiry Report No. 36, 31 August 2005, p. 236.
www.TheCIE.com.au
50 Decision Regulation Impact Statement

into account the uptake of LED lighting would incorrectly attribute the benefits of technology improvements to the proposed changes to the NCC.EA has therefore modelled the impacts of the proposed changes to the NCC assuming the use of LED lighting in the baseline to reflect the status quo.
Estimating the impacts of proposed changes to the NCCThe primary impacts of changes in the stringency from increasing the minimum energy efficiency standards could include:■ changes in construction costs and/or building design■ energy savings during the building’s operation phase, which:
– reduces energy bills for building occupants; and– reduces greenhouse gas emissions.
Other potential impacts include:■ streamlining regulatory processes; and■ simplification/clarification of the NCC requirements.
Estimating the building-level impactsTo understand the building-level impacts of the proposed changes to the NCC, we primarily draw on energy modelling by EA44, supplemented by a number of case studies relating to actual buildings.The modelling was based on compliance through the DTS pathway. EA modelled the impacts of the proposed changes to the DTS provisions of the NCC on 5 building archetypes that were broadly intended to be representative of particular commercial building sectors. The 5 building archetypes are:■ a hotel (archetype 3A);■ an office building (archetype 5A);■ a retail building (archetype 6B);■ a healthcare building (archetype 9aC); and■ a school building (archetype 9bH)Building geometry details and summarised in table and described in further detail in appendix G.
44 Energy Action 2018, Modelling & Sensitivity Analysis: NCC Section J Revision, 8 November 2018, Energy Action, Canberra.
www.TheCIE.com.au
Decision Regulation Impact Statement 51

044B0413 Building geometry detailsBuilding 3A 5A 6B 9aC 9bH
Occupancy type Hotel Office Retail Clinic SchoolNLA (m2) 9,000 9,000 1,800 950 2,790Storeys 10 10 3 1 3WWR (%) 30 56/50 and 40 30 30 30Floor length (m) 31.6 31.6 36.5 31.6 38.75Floor depth (m) 31.6 31.6 18.3 31.6 30.0Floor to floor height (m)
3.6 3.6 3.6 6.0 3.0
Ceiling height (m) 2.7 2.7 2.7 4.8 3.0Source: Energy Action 2017, Baseline Modelling Methodology and Results, Section 3.2 Geometry
Each building archetype was modelled in Climate Zones 1-7. As relatively little building activity occurs in Climate Zone 8 (mainly alpine areas), no additional modelling has been completed for this Climate Zone.
Window-to-wall ratios
Previous modelling presented in the Consultation RIS suggested that assumptions relating to the window-to-wall ratio (WWR) were an important driver of the modelling results.■ The modelling showed that improved energy performance and
significant construction cost savings could be achieved simultaneously by adopting more energy efficient designs, such as buildings with smaller windows (i.e. reducing the window-to-wall ratio).
■ This also implied that assumptions around the baseline WWR were important.– Buildings with a higher WWR in the baseline would have greater
scope to reduce the WWR to achieve compliance with the new code.– By contrast, buildings with a lower WWR would have less scope to
achieve compliance with the new code requirements through reducing the WWR and would need to comply through other means.
The building archetypes modelled are broadly intended to be representative of the various commercial building sectors. However, the baseline WWRs in the modelling for the Consultation RIS were generally based on the highest WWR achievable through the DTS provisions in the existing code for each façade. This approach led to buildings with significantly different WWRs across each façade and is unlikely to be reflect actual buildings.To control for the influence varying WWR could have on outcomes, a baseline WWR would ideally adopt the average WWR for each building type. However, WWRs and estimates vary significantly across buildings and there is no comprehensive source of information on the WWR of
www.TheCIE.com.au
52 Decision Regulation Impact Statement

buildings (or new buildings) in Australia45. Since the Consultation RIS was published, DEE commissioned EA to survey the WWR across various building types (table ). To estimate the WWR, EA used a software tool on a combination of elevation drawings, Google Streetview and photographs for a sample of buildings.Although the sample size is relatively small and there is no way of knowing whether it was representative of the broader commercial building sector, these estimates provide a reasonable basis for establishing the baseline WWR. The baseline WWRs used in the modelling broadly reflect the average of the sample for the relevant building type.
044B0414 WWR across different building sub-typesSample Average
WWRMinimum
WWRMaximum
WWR
No. Per cent Per cent Per cent
Hotels 26 27 12 40Business hotel 18 32 15 47Motel 8 16 5 29
Office 28 46 31 61Low rise office (<10 floors) 15 35 18 54Mid rise office (10-25 floors) 8 63 53 70High rise office (25+ floors) 5 57 41 69
Retail 27 30 10 52Outdoor retail strip 8 50 13 59Shopping centre 5 28 10 45Standalone retail 14 18 9 51
Hospitals 25 30 14 45Aged care 30 27 15 41Education 29 32 11 49Early learning centre 3 26 11 46Primary school 7 24 3 44Secondary school 7 25 7 43University 12 44 26 58
Source: Energy Action, Australian buildings window to wall ratios, Prepared for the Department of the Environment and Energy.
The Consultation RIS also argued that achieving compliance through reducing the WWR could lead to the loss of design features that are valued by the market (such as large windows). Costs associated with less attractive design features are generally harder to quantify, but could include: reduced amenity for building occupants and/or lower rents for building owners.
45 Nine stakeholders provided varying estimates of WWR, none cited new evidence and averages of responses were comparable to those tested in this analysis. See Appendix C
www.TheCIE.com.au
Decision Regulation Impact Statement 53

Stakeholders also generally considered it less likely that industry would respond to the proposed changes in the NCC by significantly reducing the window-to-wall ratio (WWR). The revised modelling therefore maintains a constant WWR under both the baseline scenario and under the proposed revisions to the NCC.In various consultations, there were some concerns from industry in relation to compliance costs for premium office buildings, which tend to be more extensively glazed than other types of commercial buildings. To address these concerns, EA also modelled an office building with a higher WWR as a sensitivity test.EA’s modelling suggested that the highest WWR achievable through the DTS pathway for the 5A archetype under the current code is:■ around 56 per cent for most Climate Zones; and■ around 50 per cent for Climate Zone 7.As the modelling is based on compliance through the DTS pathway, these maximum WWRs were used. Note that higher WWRs were possible under the revised code, suggesting that the revised code offers more flexibility with regard to glazing choices through the DTS pathway than the existing code.
Approach to glazing selection
Glazing selection is a key factor driving both energy consumption and cost outcomes. The basis for selecting glazing in the modelling used for the Consultation RIS varied across buildings. For the office building (5A) and the retail building (6B), the glazing choice was based on the lowest cost compliant option under the existing code (i.e. the baseline) and the proposed revisions. However, for the remaining buildings, glazing was selected to be as close as possible to the specified minimum standard.The modelling underpinning the Decision RIS uses a consistent approach to glazing selection for all buildings to ensure comparability. The lowest cost compliant glazing for each façade under both the baseline (current NCC requirements) and the proposed changes to the NCC scenario was considered the approach most likely to reflect reality for buildings complying through the DTS pathway.
LED lights
As discussed above, it is likely that LED lighting will mostly be adopted by industry, without changes to the NCC a fact reflected in the baseline of EA’s additional modelling which forms the basis of the CBA results.
www.TheCIE.com.au
54 Decision Regulation Impact Statement

Minimum energy efficiency standards for lifts
The proposed changes to the NCC involve specifying minimum energy efficiency standards for lifts; the NCC does not currently specify minimum standards for lifts. As the proposed minimum standard is either consistent with (or below) current industry practice, the minimum standard is not expected to have any impact on either construction costs or energy performance.
Decomposition of results by element
Several stakeholder submissions requested:■ a decomposition of the results into the various elements of the DTS
provisions; and/or■ separation of methodological changes from changes in stringency.Stakeholders were concerned that some beneficial improvements to the code (particularly those that could potentially deliver lower construction costs and improved energy performance simultaneously) could be effectively ‘cross-subsidising’ other proposed changes that may not be warranted if considered in isolation.EA notes that decomposing the results across each building archetype and Climate Zone would be highly resource intensive. Furthermore, given the interaction between the various elements of the code, the results from such an exercise may not be meaningful. For example, changes in the stringency of the façade would affect the capacity (and therefore the cost) of the services required for heating and cooling. As such, modelling changes to façade requirements and the services requirement separately and adding them together would give a different result to modelling the changes to both elements together.Nevertheless, to provide some insights into the relative contribution of the different elements, EA has decomposed the impacts of changes to the façade requirements from the changes to the services requirements using the following approach.EA completed additional simulations with:■ a façade that complies with the current (2016) NCC (i.e. unchanged
from the baseline); and■ services that comply with the proposed revisions to the NCC.Comparing the results of this simulation to the baseline can be interpreted as the contribution of services to energy savings and construction costs. The remaining benefits and costs can be interpreted as the contribution of the new façade requirements.This decomposition was completed for all building archetypes in Climate Zones 2, 5 and 6. These Climate Zones include all of the five mainland
www.TheCIE.com.au
Decision Regulation Impact Statement 55

state capital cities: Sydney (Climate Zone 5), Melbourne (Climate Zone 6); Brisbane (Climate Zone 2); Adelaide (Climate Zone 5); and Perth (Climate Zone 5).In addition, the work undertaken by EA to develop the proposed changes aimed to optimise each element separately. The elemental reports would therefore provide some insights into the relative impact of each element separately.
Case studies
To supplement the energy modelling, DEE and ABCB commissioned a number of case studies.■ Each case study was based on an existing building and identified the
changes required (to the building’s design or the choice of building services) in order to comply with the proposed level of stringency.
■ The modelled energy performance and (in some cases) the cost of the alternative building that would be compliant with the revised code was then compared to the actual building built under the current code.
The case studies were intended to supplement the energy modelling of stylised building archetypes through the DTS pathway by providing insights on real world compliance options using Performance Solutions and the associated costs and benefits.
Aggregating building-level estimatesBuilding level estimates are then aggregated using the projected commercial building additions and major refurbishments by building classes and Climate Zones. Appendix A discusses in detail future commercial building projections by building class and Climate Zone. Charts and summarise total additions (including replacement of retired buildings but excluding major refurbishments) to commercial buildings each year by building class and Climate Zone, respectively.
www.TheCIE.com.au
56 Decision Regulation Impact Statement

044A0415 Projected new commercial buildings by building class
0
2000
4000
6000
8000
10000
2013 2018 2023 2028
Tota
l add
itions
(000
m2)
Office Hotel HospitalsRetail Education Undercover car parksWarehouse Factories Aged care
Note: Excludes refurbishments. Data source: CIE projection.
044A0416 Projected new commercial buildings by Climate Zone
0
2000
4000
6000
8000
10000
2013 2018 2023 2028
Tota
l add
itions
(000
m2)
Zone 1 Zone 2 Zone 3 Zone 4 Zone 5 Zone 6 Zone 7 Zone 8
Note: Excludes refurbishments.Data source: CIE projection.
The impacts of the non-regulatory optionAs discussed earlier, a non-regulatory alternative option is to use the proposed changes to the NCC as the basis for a guideline to encourage industry to adopt it voluntarily.The cost of turning the proposed changes to the NCC into a handbook would presumably be relatively modest. However, the benefits would depend on the extent to which the handbook encourages industry to voluntarily improve energy efficiency. There is no rational basis to
www.TheCIE.com.au
Decision Regulation Impact Statement 57

estimate the extent to which industry would voluntarily improve energy efficiency as a direct result of the handbook.As such, the non-regulatory option has not been subjected to a formal CBA. Consistent with the approach in the Consultation RIS, a high-level assessment of the potential effectiveness of this approach has been provided instead.
www.TheCIE.com.au
58 Decision Regulation Impact Statement

5 Change in construction costs
Modelled change in construction costsConstruction costs are estimated by EA based on the cost of complying with the minimum standards under the existing code (NCC 2016) and under the proposed minimum standards (NCC 2019) through the DTS pathway. These estimates were based on market pricing information gathered from a range of sources. ■ For the building envelope, the proposed changes in the NCC lead to
changes in glazing and wall insulation, while roof and floor construction would not change.
■ EA choose from its glazing database the least cost products that complies with the relevant code requirements. The window pricing information in the database was provided by the window industry.
■ For insulation costs, EA first estimates an equation explaining the unit cost per square metre of insulation with thickness of the insulation material (which is related to the U-Value requirement) and then apply this relationship to the modelled result of thickness and area to estimate unit costs and total costs.
■ A similar approach is used to estimate the costs for each service equipment. The relationship between the unit cost (capital cost per unit of capacity) and the performance indicators is estimated according to available product specification and pricing information in the market. Total costs are then estimated according to the capacity and performance requirement resultant from the energy modelling.
More information on costing is provided in the EA modelling report Modelling and Sensitivity Analysis: NCC Section J Revision (8 November 2018) accompanying with this report.The difference in construction and capital costs between NCC 2016 and NCC 2019 compliant building models is then used in this analysis as the basis for estimating the compliance costs associated with the proposed changes in the energy efficiency provisions.The estimated change in construction costs per square metre of floor space, based on EA modelling is summarised in table and discussed in more detail below. For consistency throughout the report, cost increases are reported as a negative value and cost savings are reported as a positive value.
www.TheCIE.com.au
Decision Regulation Impact Statement 59

055B0517 Cost change per square metre of floor spaceClimate Zone 1
Climate Zone 2
Climate Zone 3
Climate Zone 4
Climate Zone 5
Climate Zone 6
Climate Zone 7
$ per m2 $ per m2 $ per m2 $ per m2 $ per m2 $ per m2 $ per m2
Hotel 10.26 - 1.77 0.97 1.10 - 4.98 0.77 12.65Office building (40% WWR) - 9.71 - 2.61 - 12.43 - 7.12 - 11.05 - 5.29 - 1.72Office building (56% WWR) 12.33 - 5.23 - 58.11 4.55 - 10.69 22.15 12.30Retail - 0.45 - 4.39 - 14.17 - 18.60 - 7.22 - 10.36 - 16.62Health care facility - 14.62 - 9.62 - 15.98 - 17.49 - 16.23 - 26.49 - 28.34School - 5.61 - 19.48 - 12.16 - 17.65 - 18.10 - 7.71 - 8.72
Note: A negative value indicates that costs have increased.Source: EA modelling.
As shown in the table, in most cases there is a small increase in construction costs as a result of the proposed changes.
Hotel (3A)EA’s modelling suggests that cost changes vary significantly across Climate Zones (table ).■ Cost changes are relatively modest in Climate Zones 2-6.
– In Climate Zone 2, the revised code requires the use of more expensive (and higher performance) glazing on all facades (the revised code requires the use of low performance double glazing, while single glazing is permitted under the existing code). However, this cost increase is offset by savings on wall insulation costs and some services as lower capacity is needed due to the more efficient facade.
– In Climate Zones 3-6, the revised code would require the use of higher performance glazing on the south façade only. This cost increase is largely offset by savings on wall insulation and changes in service costs.
■ In Climate Zones 1 and 7, the cost of complying with the revised code is estimated to be significantly lower than the existing code. This is largely because the revised code permits the use of cheaper glazing on some facades. This is only partly offset by cost increases for services.
055B0518 Change in construction costs — hotel (3A)Climate Zone 1
Climate Zone 2
Climate Zone 3
Climate Zone 4
Climate Zone 5
Climate Zone 6
Climate Zone 7
$'000 $'000 $'000 $'000 $'000 $'000 $'000
Façade
www.TheCIE.com.au
60 Decision Regulation Impact Statement

Climate Zone 1
Climate Zone 2
Climate Zone 3
Climate Zone 4
Climate Zone 5
Climate Zone 6
Climate Zone 7
$'000 $'000 $'000 $'000 $'000 $'000 $'000
Roof 0.0 0.0 0.0 0.0 0.0 0.0 0.0Floor 0.0 0.0 0.0 0.0 0.0 0.0 0.0Walls 21.6 27.2 21.6 13.1 18.6 13.1 13.1Glazing 119.2 - 118.9 - 25.9 - 9.7 - 25.9 - 9.7 111.6Façade total 140.8 - 91.7 - 4.3 3.4 - 7.3 3.4 124.7
Services
FCU - 19.9 68.2 18.2 24.1 - 9.9 20.5 11.1Cooling Tower - 5.6 7.7 1.1 - 0.2 - 4.6 - 0.5 - 1.5Chiller 0.0 - 3.2 - 6.0 - 0.9 - 3.3 - 0.1 - 3.0Boiler - 2.6 3.1 - 0.2 1.1 - 2.2 1.2 0.2Economy Cycle 0.0 0.0 0.0 0.0 0.0 0.0 0.0CO2 Sensor/Heat Exchanger a - 20.4 0.0 0.0 - 17.6 - 17.6 - 17.6 - 17.6Lighting 0.0 0.0 0.0 0.0 0.0 0.0 0.0Lifts 0.0 0.0 0.0 0.0 0.0 0.0 0.0Services total - 48.5 75.8 13.1 6.5 - 37.5 3.5 - 10.8Total 92.3 - 15.9 8.7 9.9 - 44.8 6.9 113.9
a Cost increases relate to a heat exchanger in Climate Zone 1 and a CO2 sensor in the remaining Climate Zones.Note: Cost increases are reported as a negative value and cost savings are reported as a positive value.Source: EA modelling.
Office buildingFor the office building with a WWR of 40 per cent, EA modelling suggests that the cost of complying with the revised code will be higher across all Climate Zones, although the magnitude of the cost change varies significantly (table ).■ The revised code would generally require more expensive (higher
performance) glazing in most Climate Zones. The exception is Climate Zone 7, where the modelling suggests there may be cost savings, largely driven by lower glazing stringency requirements on the south façade (lower performance double glazing would be permitted on the south façade under the revised code, whereas under the existing code high performance double glazing is required).
■ The relaxation of wall insulation requirements is estimated to result in cost savings across all Climate Zones.
■ The cost of services is estimated to be higher in all Climate Zones, except Climate Zones 2 and 5. – This is mainly driven by higher costs for fan coil units (FCUs) and CO2
sensors under the revised code.
www.TheCIE.com.au
Decision Regulation Impact Statement 61

– In Climate Zones 2 and 5, the main cost savings relate to FCUs and Economy Cycle.
www.TheCIE.com.au
62 Decision Regulation Impact Statement

055B0519 Change in construction costs — office building (5A) with 40 per cent WWR
Climate Zone 1
Climate Zone 2
Climate Zone 3
Climate Zone 4
Climate Zone 5
Climate Zone 6
Climate Zone 7
$'000 $'000 $'000 $'000 $'000 $'000 $'000
Façade
Roof 0.0 0.0 0.0 0.0 0.0 0.0 0.0Floor 0.0 0.0 0.0 0.0 0.0 0.0 0.0Walls 36.5 36.5 34.1 29.2 29.2 29.2 29.2Glazing - 34.6 - 158.5 - 83.9 - 39.7 - 158.5 - 18.0 69.2Façade total 1.9 - 122.0 - 49.8 - 10.6 - 129.3 11.1 98.3
Services
FCU - 65.1 29.0 - 101.3 - 32.3 28.4 - 41.2 - 87.7Cooling Tower - 1.3 4.9 - 5.4 - 1.4 7.0 2.5 1.4Chiller - 2.2 - 3.3 - 9.3 - 3.4 - 0.5 - 3.5 - 5.5Boiler - 0.4 2.2 - 1.9 - 0.4 2.6 0.9 - 0.2Economy Cycle 0.0 65.7 76.2 4.4 12.8 2.8 - 1.5CO2 Sensor - 20.4 0.0 - 20.4 - 20.4 - 20.4 - 20.4 - 20.4Lighting 0.0 0.0 0.0 0.0 0.0 0.0 0.0Lifts 0.0 0.0 0.0 0.0 0.0 0.0 0.0Services total - 89.3 98.5 - 62.1 - 53.5 29.9 - 58.8 - 113.8Total - 87.4 - 23.5 - 111.8 - 64.1 - 99.4 - 47.6 - 15.5
Note: Cost increases are reported as a negative value and cost savings are reported as a positive value.Source: EA modelling.
For the more extensively-glazed office building, construction costs are estimated to be higher in Climate Zones 2, 3 and 5 due mainly to higher glazing and FCU costs (table ). The increase in glazing costs are estimated to be particularly pronounced in Climate Zone 3, where high performance double glazing would be required on all facades; by contrast, the modelling suggests that low performance double glazing is permitted under the existing code (and single glazing on the south façade).On the other hand, the cost of complying with the revised code is estimated to be lower in the remaining Climate Zones.■ This is mainly driven by glazing cost savings. The modelling suggests
that low performance double glazing would be the lowest cost compliant option under the revised code. However, under the existing code, high performance double glazing would be required on at least some facades.
■ These cost savings are partly offset by higher services costs (mainly FCUs).
www.TheCIE.com.au
Decision Regulation Impact Statement 63

055B0520 Change in construction costs — office building (5A) with 56 per cent WWR
Climate Zone 1
Climate Zone 2
Climate Zone 3
Climate Zone 4
Climate Zone 5
Climate Zone 6
Climate Zone 7
$'000 $'000 $'000 $'000 $'000 $'000 $'000
Façade
Roof 0.0 0.0 0.0 0.0 0.0 0.0 0.0Floor 0.0 0.0 0.0 0.0 0.0 0.0 0.0Walls 28.6 28.6 28.6 23.2 23.2 23.2 26.4Glazing 222.5 - 120.0 - 481.6 104.1 - 48.4 315.8 285.3Façade total 251.1 - 91.4 - 453.0 127.3 - 25.2 339.0 311.7
Services
FCU - 108.4 - 16.7 - 113.6 - 49.0 - 39.7 - 95.7 - 148.6Cooling Tower - 1.6 1.0 - 4.5 - 4.7 - 4.1 - 7.0 - 5.4Chiller - 6.9 - 3.8 - 2.8 - 13.0 - 7.5 - 9.4 - 13.5Boiler - 3.0 0.1 - 1.5 - 1.9 - 1.8 - 2.6 - 2.2Economy Cycle 0.0 63.7 72.8 2.7 2.5 - 4.5 - 10.9CO2 Sensor/Heat Exchange - 20.4 0.0 - 20.4 - 20.4 - 20.4 - 20.4 - 20.4Lighting 0.0 0.0 0.0 0.0 0.0 0.0 0.0Lifts 0.0 0.0 0.0 0.0 0.0 0.0 0.0Services total - 140.1 44.3 - 70.0 - 86.3 - 71.0 - 139.6 - 201.0Total 111.0 - 47.1 - 523.0 41.0 - 96.2 199.4 110.7
Note: Cost increases are reported as a negative value and cost savings are reported as a positive value.Source: EA modelling.
Comparing the two office buildings suggests that the impact of the proposed changes on construction costs can vary significantly depending on the WWR (chart ).■ The more extensively glazed office building would have significantly
higher costs as a result of the code changes (compared to the less extensively glazed building) in Climate Zone 3.
■ By contrast, the proposed code changes result in cost savings for the more extensively glazed building in Climate Zones 1, 3, 5 and 6, but cost increases for the less extensively glazed building.
www.TheCIE.com.au
64 Decision Regulation Impact Statement

055A0521 Change in construction costs — office buildings
-600
-500
-400
-300
-200
-100
-
100
200
300
1 2 3 4 5 6 7
$'000
40% WWR
56% WWR
Data source: EA modelling.
Retail buildingsEA modelling suggests there would be increases in costs across all Climate Zones (table ). In general, higher cost services outweigh relatively modest savings in the cost of the façade driven by the methodology change to focus on façade SHGC.
055B0522 Change in construction costs — retail (6B)Climate Zone 1
Climate Zone 2
Climate Zone 3
Climate Zone 4
Climate Zone 5
Climate Zone 6
Climate Zone 7
$'000 $'000 $'000 $'000 $'000 $'000 $'000
Façade
Roof 0.0 0.0 0.0 0.0 0.0 0.0 0.0Floor 0.0 0.0 0.0 0.0 0.0 0.0 0.0Walls 6.8 6.8 6.8 6.8 6.8 6.8 6.8Glazing 2.8 - 2.1 - 2.1 - 0.9 - 3.0 9.8 17.9Façade total 9.6 4.7 4.7 5.9 3.8 16.6 24.7
Services
FCU - 1.3 0.2 - 5.1 - 16.5 - 2.5 - 16.9 - 26.7Cooling Tower - 1.2 - 0.9 - 1.9 - 2.1 - 1.2 - 1.8 - 1.3Chiller - 4.4 - 6.3 - 15.7 - 11.9 - 7.0 - 9.9 - 6.8Boiler - 3.4 - 5.6 - 7.4 - 8.9 - 6.1 - 6.6 - 7.6Economy Cycle 0.0 0.0 0.0 0.0 0.0 0.0 0.0CO2 Sensor/Heat 0.0 0.0 0.0 0.0 0.0 0.0 - 12.2
www.TheCIE.com.au
Decision Regulation Impact Statement 65

Climate Zone 1
Climate Zone 2
Climate Zone 3
Climate Zone 4
Climate Zone 5
Climate Zone 6
Climate Zone 7
$'000 $'000 $'000 $'000 $'000 $'000 $'000
ExchangeLighting 0.0 0.0 0.0 0.0 0.0 0.0 0.0Lifts 0.0 0.0 0.0 0.0 0.0 0.0 0.0Services total - 10.4 - 12.5 - 30.2 - 39.4 - 16.8 - 35.2 - 54.6Total - 0.8 - 7.9 - 25.5 - 33.5 - 13.0 - 18.6 - 29.9
Note: Cost increases are reported as a negative value and cost savings are reported as a positive value.Source: EA modelling.
Healthcare buildingBased on EA modelling, there is estimated to be an increase in construction costs for healthcare facilities across all Climate Zones (table ). More expensive services (particularly FCUs) are only partly offset by modest façade cost savings driven by the methodology change to focus on façade SHGC.
055B0523 Change in construction costs — healthcare building (9aC)Climate Zone 1
Climate Zone 2
Climate Zone 3
Climate Zone 4
Climate Zone 5
Climate Zone 6
Climate Zone 7
$'000 $'000 $'000 $'000 $'000 $'000 $'000
Façade
Roof 0.0 0.0 0.0 0.0 0.0 0.0 0.0Floor 0.0 0.0 0.0 0.0 0.0 0.0 0.0Walls 3.1 3.1 3.1 1.7 1.7 1.7 1.7Glazing 1.0 - 2.5 - 2.5 0.5 - 2.5 10.7 15.0Façade total 4.1 0.6 0.6 2.3 - 0.8 12.4 16.7
Services
FCU - 10.3 - 9.0 - 12.6 - 17.4 - 12.5 - 25.2 - 30.4Cooling Tower - 4.1 - 1.7 - 4.5 - 3.1 - 3.0 - 6.4 - 3.9Chiller - 2.0 - 2.3 - 2.7 - 2.9 - 2.2 - 3.1 - 4.8Boiler - 1.6 - 1.0 - 1.5 - 1.2 - 1.3 - 2.1 - 1.7Economy Cycle 0.0 4.3 5.5 5.7 4.5 - 0.7 - 0.8CO2 Sensor 0.0 0.0 0.0 0.0 0.0 0.0 - 2.0Lighting 0.0 0.0 0.0 0.0 0.0 0.0 0.0Lifts 0.0 0.0 0.0 0.0 0.0 0.0 0.0Services total - 18.0 - 9.8 - 15.8 - 18.9 - 14.6 - 37.6 - 43.7Total - 13.9 - 9.1 - 15.2 - 16.6 - 15.4 - 25.2 - 26.9
Note: Cost increases are reported as a negative value and cost savings are reported as a positive value.Source: EA modelling.
www.TheCIE.com.au
66 Decision Regulation Impact Statement

School classroomsConstruction costs are estimated to be higher across all Climate Zones (table ). This is mostly driven by more expensive services (particularly FCUs and cooling towers). These cost increases are only partly offset by façade cost savings in Climate Zone 6 and 7 driven by the methodology change to focus on SHGC and a relative ‘over stringency’ in the NCC 2016 glazing provisions (see EA’s report); there is estimated to be minimal change in façade costs in the remaining Climate Zones.
055B0524 Change in construction costs — school classroom (9bH)Climate Zone 1
Climate Zone 2
Climate Zone 3
Climate Zone 4
Climate Zone 5
Climate Zone 6
Climate Zone 7
$'000 $'000 $'000 $'000 $'000 $'000 $'000
Façade
Roof 0.0 0.0 0.0 0.0 0.0 0.0 0.0Floor 0.0 0.0 0.0 0.0 0.0 0.0 0.0Walls 7.9 7.9 16.3 4.6 4.6 4.6 4.6Glazing - 5.2 - 8.7 - 8.7 - 5.2 - 8.7 18.4 33.3Façade total 2.7 - 0.8 7.6 - 0.6 - 4.1 23.0 37.9
Services
FCU - 2.8 - 18.0 - 13.7 - 13.8 - 5.8 - 11.1 - 12.5Cooling Tower - 2.6 - 24.4 - 10.6 - 19.3 - 26.9 - 19.4 - 30.8Chiller - 0.7 - 11.1 - 5.0 - 3.3 - 1.4 - 1.8 - 6.7Boiler 0.0 0.0 0.0 0.0 0.0 0.0 0.0Economy Cycle 0.0 0.0 0.0 0.0 0.0 0.0 0.0CO2 Sensor/Heat Exchange - 12.2 0.0 - 12.2 - 12.2 - 12.2 - 12.2 - 12.2Lighting 0.0 0.0 0.0 0.0 0.0 0.0 0.0Lifts 0.0 0.0 0.0 0.0 0.0 0.0 0.0Services total - 18.3 - 53.5 - 41.5 - 48.7 - 46.4 - 44.5 - 62.2Total - 15.7 - 54.4 - 33.9 - 49.3 - 50.5 - 21.5 - 24.3
Note: Cost increases are reported as a negative value and cost savings are reported as a positive value.Source: EA modelling.
Insights from the case studiesThe EA modelling results of cost increase are in general smaller in terms of cost change per square metre than findings from case studies. While the majority of the building’s case studies used JV3 as their façade compliance pathway and would comply without design modification, the case studies included an exploration of the impact if they had used the DTS to comply. Table 5.10 summarises the construction cost increase per
www.TheCIE.com.au
Decision Regulation Impact Statement 67

square metre of floor area from case studies which provide costing information based on compliance using the DTS. One case study found that construction costs could be reduced due to less effective stringency requirement for windows, and cheaper insulation and installation costs. All other studies found that construction cost would increase using the DTS due to the change in the NCC. The cost increase varies significantly across studies, however most of the cost increases lie in the range between $10 and $50/m2.
055B0525 Increase in construction costs from selected case studiesProject name City Building
classCost -
lowCost -
highNote
$/m2 $/m2
Quay Quarter Tower
Sydney 5, 6 13.6 25.9 Fabric cost increase by $7.95-$14.55/m2 including shading, body tint for windows; heat reclaim system costs $5.68-$11.36/m2
Bupa Care Templestowe*
Templestowe, Vic
9c 39.2 49.1 Fabric costs increase by $20.6/m2
including roof and floor insulation, window tint and shading; services and equipment costs up by $18.5-$28.5/m2
Bupa Care Stirling* ACT 9c 30.1 39.9 Fabric costs increase by $10.6/m2
including roof and external wool insulation; window tint and shading; services and equipment costs up by $19.5-$29.3/m2
Shellharbour Civic Centre
Shellharbour, NSW
5, 9b 4.0 4.0 No cost change for façade
Mid-tier Office in Nedlands
Nedlands, WA
5 55.2 80.7 Glass upgrades between $42.5-$63.7/m2; roof top solar panels cost $12.7-$17/m2
Roselands Boarding House
Sydney 3 129.5 194.3 Windows costs – upgrade to high performance double glazed systems (U2.5 and SHGC 0.5)
Willowdale Community Centre
Sydney 9b -13.9 -13.9 cheaper windows due to less effective stringency; small reduction in insulation cost and window installation costs (lighter windows used)
Note: see notes in table; negative cost indicates cost reduction* These buildings were compliant without modification under a JV3 compliance pathway.Source: CIE calculation based on case study reports
One explanation for the larger impact on construction costs in the case studies is that the proposed changes in the case studies often outperform the NCC2019 requirements. As shown in table , proposed buildings in all studies except the Bupa Care Templestowe exceed the minimum requirement of the NCC 2019 Reference Building with lower energy consumption and greenhouse gas emissions.
www.TheCIE.com.au
68 Decision Regulation Impact Statement

055B0526 Proposed building compared to NCC2019 reference buildingProject Name Energy consumption GHG emissions
% %Collins Arch Development -4.3 -6.9Quay Quarter Tower -0.1 -0.3Bupa Care Templestowe 0.2 0.2Bupa Care Stirling -0.3 -0.3Shellharbour Civic Centre -0.4 -1.3Roselands Boarding House -0.6 -0.6Willowdale Community Centre -17.2 -17.2Green Hills Shopping Centre -8.2 -1.5
Note: negative indicates reduction of energy consumption or greenhouse gas emissions from the NCC2019 Reference BuildingSource: CIE construction based on case studies
It should be noted as well that the case studies were based on earlier versions of the proposed changes to the NCC, including (among others) changes to the requirement for Display Glazing (the code now has specific display glazing system minimum levels, the case studies used a whole of façade approach), more stringent lighting requirements and an error in pipe insulation requirements that had been listed as more stringent than the final version.
Are lower construction costs plausible?EA’s modelling suggests that the proposed improvements in energy efficiency can be achieved at ‘negative cost’ for a small number of building type/Climate Zone combinations. That is, the proposed changes to the NCC could improve energy performance (and reduce GHG emissions) and reduce construction costs.This result is somewhat counter-intuitive and raises the question: why are building owners not taking up opportunities that are both cheaper and reduce energy consumption without the need for more stringent minimum standards? In general, this type of result would be expected only where there is clear evidence of a market failure or regulatory failure. From our review of the literature on market failures, it is plausible that market failures/behavioural anomalies exist in relation to energy efficiency (although the direct evidence is limited); however, there is no evidence of market failures/behavioural anomalies in relation to construction costs and design choices.
www.TheCIE.com.au
Decision Regulation Impact Statement 69

Lower costs are not due to technology improvements or design changesIn the Consultation RIS we raised the possibility that these counter-intuitive modelling results may have arisen due to:■ the use of technology that is both cheaper and more energy efficient
(such as LED lighting); and/or■ a shift to more energy efficient designs (such as reducing the
window-to-wall ratio).However, we considered it unlikely that the proposed changes to the NCC would reduce costs for the above reasons.■ Where cheaper and more energy efficient technologies (and there are
no compromises on other characteristics) becomes available (such as LED lighting), they are likely to be adopted by industry even without the need for regulatory change.
■ While it may be possible to build more energy efficient buildings with lower construction costs, this is likely to involve design compromises, such as smaller windows. The cost of these design compromises will be at least as high as the construction cost savings. Stakeholders generally supported this view, noting that it is unlikely that industry would respond to the proposed changes to the NCC by significantly reducing window sizes.
The modelling for the Decision RIS accounted for these factors by:■ including the anticipated uptake of LED lighting in the baseline
(implying that no changes in construction cost or energy performance are attributed to changes to the maximum allowable IPD); and
■ holding the WWR constant under the baseline and under the revised code.
These factors are therefore not contributing to lower modelled construction costs under the revised code.
Lower costs are more likely due to code improvementsOn the other hand, it is possible that proposed changes to the NCC could lead to lower construction costs as well as improved energy performance where improvements to the NCC:■ allow industry to choose options that are both more energy efficient and
cheaper that were not available under the existing NCC; and■ relax the stringency of building elements that have minimal (or in some
cases negative) impact on energy performance.The proposed changes to the NCC are not simply changes to the stringency of the minimum energy efficiency requirements. The whole
www.TheCIE.com.au
70 Decision Regulation Impact Statement

approach to assessing some building elements such as wall-glazing construction has been changed.Changes proposed to the approach to specifying the stringency requirements for glazing is another explanation for both lower construction costs and improved energy performance. Specifically, the proposed approach to minimum glazing requirements shifts the focus from glazing U-Values to solar heat gain coefficient (SHGC) in day-time operating buildings. EA modelling suggests that energy performance is more closely correlated with SHGC than U-Values in day-time operating buildings.There is a relatively close correlation between the unit cost of glazing and the U-Value (right panel of chart 055A0527). However, there appears to be a much weaker relationship between SHGC and price (left panel of chart 055A0527).
www.TheCIE.com.au
Decision Regulation Impact Statement 71

055A0527 Relationship between window price and SHGC and U-Value
Data source: CIE construction based on the window data provided by EA
This change in approach raises the possibility that there are glazing options that are both cheaper and more energy efficient that would not necessarily meet the minimum U-Value requirement currently specified in the NCC, but would meet the minimum SHGC requirements in the revised NCC. Similarly, there may be circumstances where the revised methodology in relation to the façade allow significant cost reductions with only a modest reduction in façade performance.Furthermore, the proposed change in NCC specifies requirement of U-Values for whole façade, and thus allows substitution between glazing and wall insulation construction. More specifically, the chosen glazing meeting the new SHGC requirement over performs in terms of the new U-Value requirement, leading to insulation stringency being met at lower cost.The decomposition modelling conducted by EA supports the proposition that lower costs are a result of code improvements (see table ). Although decomposition modelling is not available for all Climate Zones, some observations may be made from the table include the following.46 ■ There are several cases where the proposed changes to the NCC reduce
the cost of the façade (the hotel in Climate Zone 5 and 6, the office building in Climate Zone 6 and the school in Climate Zone 6).
■ In one case (the hotel in Climate Zone 6), the cost savings on the façade outweigh the increase in the cost of services.
This suggests that net cost reductions are likely to be related to the improved methodology in relation to the façade.
46 Note that the decomposition modelling uses a different assumption in relation to insulation, so the results do not exactly align.
www.TheCIE.com.au
0.0 2.0 4.0 6.0 8.0U value
200
250
300
350
400
450
500
550
600
650
0.0 0.5 1.0
Price
($/m
2)
SHGC
72 Decision Regulation Impact Statement

055B0528 Decomposition of construction costsClimate Zone 2 Climate Zone 5 Climate Zone 6
$ per m2 $ per m2 $ per m2
Hotel
Façade - 0.55 8.02 3.12Services - 1.36 - 13.00 - 2.36Total - 1.92 - 4.98 0.77
Office
Façade - 1.70 - 0.75 9.84Services - 1.79 - 10.36 - 15.20Total - 3.49 - 11.11 - 5.36
Retail
Façade - 2.23 - 4.22 - 9.69Services - 3.18 - 3.83 - 7.88Total -5.41 -8.05 -17.57
Healthcare
Façade - 1.15 - 5.35 - 6.23Services - 10.10 - 10.99 - 20.38Total - 11.24 - 16.35 - 26.61
School
Façade - 10.54 - 7.26 0.68Services - 10.21 - 10.94 - 8.48Total - 20.75 - 18.20 - 7.80
Note: Consistent with other parts of the report, a cost increase is represented as a negative value and a cost saving is represented as a positive value.Source: CIE based on EA modelling.
Learning ratesSome recent analyses of energy efficiency requirements have accounted for a ‘learning rate’.47 The learning rate reflects how quickly firms adapt and adopt new technologies and techniques, and revise their designs
47 See for example: Houston Kemp Economists 2017, Residential Building Regulatory Impact Statement Methodology, A report for the Department of the Environment and Energy, 6 April 2017; and pitt&sherry 2016, Final Report – Pathway to 2020 for Increased Stringency in New Building Energy Efficiency Standards: Benefit Cost Analysis: Commercial Buildings: 2016 Update, final report to Department of Industry, Innovation and Science, May, available at https://www.environment.gov.au/system/files/energy/files/pathway-to-2020-for-increased-stringency-in-new-building-energy-efficiency-standards-2016-update.pdf, accessed 21 November 2017.
www.TheCIE.com.au
Decision Regulation Impact Statement 73

and/or production processes.48 The premise is that raising the Performance Requirements in the NCC may initially increase costs; however, these additional costs will decline over time as the industry adapts (or learns).The learning rate can have a significant impact on CBA results. For example, the Pathway to 2020 update for commercial buildings estimated that with no learning rate, energy consumption could be reduced by 29 per cent relative to the existing NCC (privately) cost effectively (i.e. with a benefit-cost ratio (BCR) of 1, not taking into account the external benefits of reduced GHG emissions). However, with an assumed learning rate of 3 per cent per year, cost-effective energy savings could be increased to 37 per cent relative to the current NCC requirements. Where the learning rate is assumed to be 100 per cent over 7 years (i.e. after 7 years, there would be no additional costs associated with achieving the new standard), cost effective energy savings of 70 per cent could be made.49
One way the additional cost of achieving higher minimum energy efficiency standards could fall over time is declining input prices. The price of new technologies can often decline rapidly initially before levelling off as the rate of learning slows.There is some evidence of declining prices of some energy efficient inputs. In particular, EA notes that the price of LED lighting has declined rapidly in recent years. EA’s modelling assumes that the price of LED lighting will decline a further 30 per cent over the period from 2017 to 2021. However, discussions with lighting industry representatives as part of the preliminary consultation process noted that prices had started to level off. They questioned whether additional gains of the magnitude assumed by EA would be achieved.A recent study for DEE that reviewed the evidence on learning rates found that on average the prices of energy-related building products had declined only modestly in real terms over the period from 2004 to 2016. Specifically, the real price of a basket of energy-related building products:■ declined by 0.4 per cent in unweighted terms; and■ declined by 0.2 per cent in weighted terms.50
48 pitt&sherry, Commercial Building Learning Rates, Final Report, Prepared for the Department of Industry, Innovation and Science, 3 August 2016, p. ii.
49 pitt&sherry, Pathway to 2020 for Increased Stringency in New Building Energy Efficiency Standards: Benefit Cost Analysis for Commercial Buildings — 2016 Update, Prepared for the Department of Industry, Innovation and Science, May 2016, p. 4.
50 Strategy. Policy. Research.2017, Quantifying Commercial Building Learning Rates in Australia: Final Report, Prepared for the Department of the Environment and Energy, June 2017, p. vi.
www.TheCIE.com.au
74 Decision Regulation Impact Statement

Note that in some circumstances, buildings constructed under the baseline scenario (i.e. constructed under existing NCC minimum requirements) would also benefit from declining prices of building products. Where the price declines for inputs that are used under both the baseline scenario and where stricter minimum performance requirements apply, there would be no change in the incremental cost of achieving higher standards. Even where the price of inputs used to achieve higher standards (but not necessarily under the baseline) falls, lower prices may encourage greater uptake of these products under the baseline. For example, declining prices has encouraged greater uptake of LED lighting even without the need for regulation.The other main way that the incremental costs could change is through innovation and learning in relation to design. The study on learning rates for DEE offered the EA modelling showing that construction costs are lower where the industry responds to the proposed changes by reducing the WWR to 30 per cent as evidence of innovation in design leading to lower costs. However, as noted above, lower cost design choices are available to industry without regulatory change (i.e. under the baseline scenario). That these options are currently not being chosen indicates that they are less preferred in terms of amenity.That said, there is scope for innovative designs to achieve better energy efficiency, with fewer design and cost compromises. However, as discussed above, these design innovations may also occur under the baseline scenario.Another relevant consideration is whether input price reductions and/or design innovation occurs as a result of increased NCC stringency (i.e. changes that would not occur without changes to the NCC). This could potentially occur where changes to NCC requirements leads to ‘market transformation’, such as where widespread uptake leads to declining prices. Similarly, design innovation could occur in response to tighter regulation.Overall, the evidence on learning rates is limited. The most convincing evidence of learning rates applies to new technologies/products, such as LED lighting. That said, falling costs of LED lighting has occurred in Australia without regulatory change. Furthermore, these falling costs have encouraged additional uptake without the need for regulation. As our baseline assumes voluntary uptake of LED lighting (see below), assumptions on the cost of LED lighting will have no impact on the costs and benefits.The evidence to support a more general learning rate linked to regulatory change presented in the recent report for DEE is generally less convincing. Learning rates have not therefore been included in the central case analysis.
www.TheCIE.com.au
Decision Regulation Impact Statement 75

Other potential costsDuring consultations, one stakeholder noted that there can be costs associated with increasing the stringency of minimum energy efficiency performance requirements that are difficult to identify ex ante. In particular, previous work by the Australian Institute of Refrigeration, Air-conditioning and Heating (AIRAH) found that more energy-efficient HVAC systems can require more space. For example:■ more efficient HVAC equipment can require bigger ducts with more
insulation, which require bigger shafts and deeper ceiling spaces offset, to an extent, by increasing efficiencies of fans, pumps, lighting and the building envelope that may reduce cooling loads and, consequently, reduce chiller size; and
■ more efficient chillers and boilers need bigger heat exchangers with more plant room access.51
More space for services can reduce floor space in buildings. Alternatively, a lack of space for services can reduce system performance.
51 AIRAH 2014, “The new space race”, Ecolibrium, February 2014.
www.TheCIE.com.au
76 Decision Regulation Impact Statement

6 Energy saving benefits
Energy savingsEnergy savings are the key intended benefit from the proposed changes to the NCC.
Modelled energy savingsEnergy savings per square metre of floor space (as modelled by EA) is summarised in table . As energy savings represent a benefit, a positive number represents a reduction in energy consumption.
066B0629 Modelled annual energy savings — summaryClimate Zone 1
Climate Zone 2
Climate Zone 3
Climate Zone 4
Climate Zone 5
Climate Zone 6
Climate Zone 7
Unit per m2 per
year
Unit per m2 per
year
Unit per m2 per
year
Unit per m2 per
year
Unit per m2 per
year
Unit per m2 per
year
Unit per m2 per
year
Electricity (Kwh)
Hotel 11.28 23.57 18.36 18.98 19.70 19.97 18.67Office building (40% WWR) 7.40 7.44 3.84 4.26 6.13 4.63 4.21Office building (56% WWR) 23.31 9.65 6.72 9.09 10.32 8.65 10.54Retail 26.96 20.42 28.18 23.61 28.56 24.70 - 2.91Aged care facility 21.78 12.25 16.10 9.07 8.60 4.89 9.80School 49.00 33.55 30.85 19.15 14.07 15.64 24.28
Gas (MJ)
Hotel 0.00 2.46 0.36 11.64 0.34 8.25 8.55Office building (40% WWR) 0.00 4.05 3.60 7.81 8.61 4.16 7.83Office building (56% WWR) - 0.01 2.91 5.43 - 5.47 0.62 - 4.52 - 16.43Retail - 0.07 - 4.42 - 7.86 - 29.34 - 15.99 - 64.32 32.59Aged care facility - 0.03 - 0.77 2.80 - 1.59 - 0.51 - 31.83 - 41.73School 0.26 - 10.91 12.25 35.54 20.03 42.01 28.75
Source: EA modelling.
www.TheCIE.com.au
Decision Regulation Impact Statement 77

These estimates represent modelled energy savings as a result of the proposed changes to the NCC. This cannot be interpreted as the change in stringency.■ Modelled energy savings takes into account the assumed uptake of
energy efficient technologies that would occur even if the NCC remained unchanged (i.e. under the baseline scenario), such as LED lighting. This approach is appropriate for the RIS as it focuses on estimating energy savings that would occur as a result of the proposed changes to the NCC.
■ By contrast, modelling the change of stringency would compare a building built as close as possible to the NCC minimum requirements under the proposed changes to the existing code. The change in stringency would be higher than the modelled energy savings as it would include the energy saving benefits from the shift towards LED lighting. However, for the purposes of the RIS, it would in appropriately attribute the uptake of LED lighting to the proposed changes to the NCC.
Hotels
The proposed changes to the NCC is estimated to reduce energy consumption in hotels by around 20-25 per cent in most Climate Zones (chart ). This is mainly due to reduced energy consumption from chillers and fans. In Climate Zone 1, energy savings are estimated to be lower at less than 10 per cent, due to a slight increase in energy consumption from chillers.
066A0630 Modelled energy savings — hotels
-5
0
5
10
15
20
25
30
CZ1 CZ2 CZ3 CZ4 CZ5 CZ6 CZ7
Per c
ent
Heatrejection
Pumps
Fans
Boiler
Chiller
Total
Note: Graph presents energy savings in percentage terms to provide some context; however, it is the absolute change in consumption (as reported in table above that matters for the CBA.Data source: CIE based on EA modelling.
www.TheCIE.com.au
78 Decision Regulation Impact Statement

Office buildings
For an office buildings (5A) with a WWR of 40 per cent, energy savings are estimated to be generally around the 10-15 per cent range in most Climate Zones (table ). In most Climate Zones, the source of energy saving is broadly based across the various services.
066A0631 Modelled energy savings — office buildings (40 per cent WWR)
-4-202468
1012141618
CZ1 CZ2 CZ3 CZ4 CZ5 CZ6 CZ7
Per c
ent
Heatrejection
Pumps
Fans
Boiler
Chiller
Total
Note: Graph presents energy savings in percentage terms to provide some context; however, it is the absolute change in consumption (as reported in table above that matters for the CBA.)Data source: CIE based on EA modelling.
For the more extensively glazed office building archetype, energy savings are estimated to be around 20 per cent in Climate Zone 1 and generally around the 5-10 per cent range in the remaining Climate Zones.■ In most Climate Zones, fans generally make the largest contribution to
total energy savings.■ By contrast, energy consumption from fans is estimated to increase
significantly in Climate Zone 2. However, this is more than offset by energy savings from pumps and other equipment.
www.TheCIE.com.au
Decision Regulation Impact Statement 79

066A0632 Modelled energy savings — office buildings (56 per cent WWR)
-20-15-10-505
1015202530
CZ1 CZ2 CZ3 CZ4 CZ5 CZ6 CZ7
Per c
ent
Heatrejection
Pumps
Fans
Boiler
Chiller
Total
a The WWR in Climate Zone 7 is 50 per cent (see above).Note: Graph presents energy savings in percentage terms to provide some context; however, it is the absolute change in consumption (as reported in table above that matters for the CBA.Data source: CIE based on EA modelling.
Retail
The modelled energy savings are generally around 5-10 per cent in most Climate Zones, but less than 5 per cent in the cooler Climate Zones (Climate Zones 6 and 7) (chart ).■ In most Climate Zones, chillers and fans make the largest contribution
to energy savings; however, these savings are partly offset by higher energy consumption from boilers in several Climate Zones. Increase in boiler energy use is related to over-stringency of the 2016 glazing U-Value requirement, and the 6B model having a high surface area to volume ratio. It is not expected that this result would be seen in larger buildings.
■ In contrast to other Climate Zone, boilers make the largest contribution to energy savings in Climate Zone 7, with energy consumption from fans increase. These results and fan sizing methodology is discussed in the EA report.
www.TheCIE.com.au
80 Decision Regulation Impact Statement

066A0633 Modelled energy savings — retail
-10
-5
0
5
10
15
CZ1 CZ2 CZ3 CZ4 CZ5 CZ6 CZ7
Per c
ent
Heatrejection
Pumps
Fans
Boiler
Chiller
Total
Note: Graph presents energy savings in percentage terms to provide some context; however, it is the absolute change in consumption (as reported in table above that matters for the CBA.Data source:
Healthcare facilities
For healthcare facilities, EA modelling shows that energy savings tend to be higher in the warmer Climate Zones (Climate Zones 1-3). Energy consumption is estimated to increase in the cooler Climate Zones (Climate Zones 6 and 7) due to an increase in consumption from boilers. Increase in boiler energy use is related to over-stringency of the 2016 glazing U-Value requirement, and the 9aC model having a high surface area to volume ratio. It is not expected that this result would be seen in larger buildings.
066A0634 Modelled energy savings — healthcare facilities
-15
-10
-5
0
5
10
15
CZ1 CZ2 CZ3 CZ4 CZ5 CZ6 CZ7
Per c
ent
Heatrejection
Pumps
Fans
Boiler
Chiller
Total
www.TheCIE.com.au
Decision Regulation Impact Statement 81

Note: Graph presents energy savings in percentage terms to provide some context; however, it is the absolute change in consumption (as reported in table above that matters for the CBA.Data source: CIE based on EA modelling.
Schools
Modelled energy savings for schools are generally around 20 per cent in most Climate Zones and closer to 25 per cent in Climate Zones 1 and 2 (chart ). Fans are estimated to be a significant contributor to energy saving across all Climate Zones. Chillers are also a large contributor to energy savings in the warmer Climate Zones (i.e. Climate Zones 1-3), while boilers are a significant contributor to energy savings in Climate Zones 4-7.
066A0635 Modelled energy savings — schools
-5
0
5
10
15
20
25
30
CZ1 CZ2 CZ3 CZ4 CZ5 CZ6 CZ7
Per c
ent
Heatrejection
Pumps
Fans
Boiler
Chiller
Total
Note: Graph presents energy savings in percentage terms to provide some context; however, it is the absolute change in consumption (as reported in table above that matters for the CBA.Data source: CIE based on EA modelling.
Are modelled energy savings achieved in practice?Several international studies have found that there has been a tendency for the energy modelling relied on to estimate energy savings in some CBAs of energy efficiency policies to overstate actual energy savings.52 The Productivity Commission has also previously expressed concern in relation to both residential and commercial buildings that computer simulations of energy loads within buildings that form the analytical basis
52 See for example, Gerarden, Todd D., Richard G. Newell and Robert N. Stavins 2015, “Assessing the Energy Efficiency Gap”, Cambridge, Mass.: Harvard Environmental Economics Program, January 2015.
www.TheCIE.com.au
82 Decision Regulation Impact Statement

for minimum energy efficiency standards in the NCC may be flawed.53 It is therefore important to investigate whether modelled energy savings are actually realised.It is well-documented that energy efficiency modelling for commercial buildings does not accurately predict actual energy consumption outcomes (see Appendix D for further details). This is referred to as the ‘performance gap’. However, the key issue is not whether energy modelling accurately predicts the level of energy consumption; rather, it is the extent to which energy savings from more energy efficient design and technology choices are accurately estimated that matters. However, there are surprisingly few Australian studies comparing modelled outcomes with actual performance for commercial buildings.
Green Building Council study
The Green Building Council of Australia (GBCA) published a study using Australian data that indirectly addresses this question. This study compared:■ Predicted greenhouse gas emissions (in levels rather than savings)
available from Green Star certification records (in terms of both predicted ‘normalised emissions’ in KgCO2-e and predicted NABERS Energy stars). These predictions were based on computer generated energy modelling carried out by the individual project teams involved in the design and constructions of the buildings within the sample.
■ Actual greenhouse gas performance also in levels rather than savings available from the NABERS Energy database (in terms of ‘benchmarking factor’ and actual NABERS Energy stars, both without GreenPower).
A submission from Parramatta City Council argued that predicted ‘normalised’ greenhouse gas emissions in design (or at the as-built stage) and the NABERS Benchmarking Factor in operation are not comparable because the algorithms used to correct for differences in floor area, hours of operation and climate in the calculation of the NABERS Benchmarking Factor introduce distortions (see appendix D for further details). The submissions implies that no conclusions on the accuracy of modelled outcomes can be drawn from the Green Star data.While we consider it conceptually appropriate for the NABERS Benchmarking Factor to be adjusted for factors such as floor area and hours of operation, the limitations of the normalisation process are acknowledged. Nevertheless, the data provides some useful insights on the extent to which modelled outcomes are achieved in practice.
53 Productivity Commission 2005, The Private Cost Effectiveness of Improving Energy Efficiency, Productivity Commission Inquiry Report No.36, 31 August 2005, p. XXXVIII and p.227.
www.TheCIE.com.au
Decision Regulation Impact Statement 83

CIE analysis of this data is shown in chart . The chart plots predicted GHG emissions on the x axis against actual GHG emissions on the y axis.■ If actual outcomes are predicted perfectly, the observations would fall
on the red line (where y = x).– Most of the observations are above the red line, indicating that in
most cases actual GHG emissions were higher than predicted.– For the observations below the red line, actual GHG emissions were
lower than predicted.■ The grey line is the actual line of best fit. The slope coefficient reflects
the average change in actual GHG emissions for each modelled unit change. This can be interpreted as the rate at which modelled energy savings are realised in practice.
Although the above data relate to GHG emissions, rather than energy consumption, GHG emission estimates are based on the energy consumption and the emissions intensity of the relevant energy sources in each building’s location. The emissions intensity of each energy source is unlikely to have varied significantly from the predictions. The relationship shown above is therefore likely to be indicative of the relationship between predicted and actual energy consumption, unless prediction errors can be explained by a significant shift in the energy mix (i.e. between electricity and gas).Key observations are as follows.■ The relationship between predicted and actual GHG emissions is
relatively weak. Although there appears to be a positive relationship between predicted and actual greenhouse gas emissions (indicating that greenhouse gas emissions are indeed lower in buildings with lower predicted greenhouse gas emissions), this relationship is not statistically significant.
■ The available data also do not support the proposition that modelled energy savings are achieved in practice. The analysis suggests that as low as only around half of modelled energy (or greenhouse gas) savings are achieved in practice.
www.TheCIE.com.au
84 Decision Regulation Impact Statement

066A0636 Relationship between predicted and actual greenhouse gas emissions
Data source: CIE based on data in Bell, H. Millagre, R. and Sanchez, C. 2013, Achieving the Green Dream: Predicted vs Actual, Green Building Council of Australia, August 2013, pp. 17-20.
To address concerns that several significant outliers were unduly affecting the estimated relationship between predicted and actual outcomes, we re-estimated the relationship when the outliers are removed from the sample. Unsurprisingly, when these outliers are removed from the sample, the linear relationship between predicted and achieved outcomes provides a closer fit with the data. Nevertheless, the relationship between modelled and actual GHG emissions savings based on the reduced sample suggests that on average, around three-quarters of modelled energy savings are achieved in practice (Appendix D).Stakeholders have made various plausible suggestions as to why the relationship implied by these results may not be representative of the commercial building sector more broadly, including the following:■ the sample includes only office buildings which may not be
representative of other types of commercial buildings;■ the actual performance was measured only two years after construction
and it may take several years to achieve optimal performance; and■ actual performance in any given year can be affected by factors such as
weather conditions and may not be representative of average performance over time.
On the other hand, participants in the voluntary Green Star scheme that may also be required to obtain a NABERS rating would be expected to be more conscious of their energy performance than other building owners.
Aggregate trends in the energy efficiency of commercial buildings
Another study that sheds light on actual energy performance relative to predicted outcomes compares the predicted energy savings from the
www.TheCIE.com.au
Decision Regulation Impact Statement 85

change to the BCA between 2006-2010 with observed energy efficiency improvements in the commercial building stock.In 2014, ClimateWorks Australia et al reported that the energy intensity of commercial buildings actually increased between 2002-03 and 2006-07. However, it has decreased in more recent years since the introduction of the changes to the BCA in 2006 and 2010, and due to other interventions and market responses. Between 2007-08 to 2010-11, energy intensity fell by at least 2 per cent overall or 0.5 per cent per year. The improvements are understood to have been driven by an increase in the energy efficiency of base buildings (regulated energy use), but offset by an increased use of equipment and appliances across tenancy occupants (non-regulated energy).54 The observed actual improvement of 0.5 per cent per year over this period would be the results of all factors including the rising energy price, technological improvement, other policies55, as well as the change in the BCA in 2006. In 2006, the BCA was amended to introduce, for the first time, requirements for energy efficiency for Class 5 to Class 9 commercial buildings. The requirements encompassed changes to lighting, glazing, building envelope insulation (wall, floor and ceiling), hot water supply services and air conditioning. If we were to generously assume that two thirds of the total improvement were due to the changes to the BCA56, the energy intensity improvement resulting from the BCA changes in 2016 would be around 0.33 per cent.
However, the implied improvement of energy intensity from projected energy saving was 0.44 per cent per year.57 This is calculated from the results of the 2006 RIS stating that the proposed changes achieve a 20 per
54 ClimateWorks Australia, ANU, CSIRO and CoPS 2014. ‘Assumptions and input’, In Pathways to deep decarbonisation in 2050: How Australia can prosper in a low carbon world: Technical report, Section 5.2, ClimateWorks Australia.
55 Such programs include the adoption and mandatory disclosure of NABERS and Green Star rating applied to around 11 per cent of new commercial building space which comprises of offices (and only voluntarily applied to hotels and shopping centres), the Australian Minimum Energy Performance Standards (MEPS) of energy performance for appliances, lighting and electrical equipment, minimum energy performance standards that have been introduced for Government office buildings, and other state-based schemes such as the Energy Savings Scheme in New South Wales that targets energy savings through the installation, upgrade and replacement of building equipment.
56 Note that in pitt&sherry’s 2015 report, in the year 2020, code-related changes are suggested to account for more than half of the improvement (around 55 per cent) in the energy intensity of commercial buildings across Sydney. This is anticipated to increase to 70 per cent by 2030. pitt&sherry incorporate both residential and commercial buildings (which may differ between states), as well as BASIX, to calculate the impact of code related changes on the total change in energy intensity across commercial and residential buildings.
www.TheCIE.com.au
86 Decision Regulation Impact Statement
cent reduction in total energy use across new commercial buildings (applying to 2.2 per cent of total commercial buildings stock which are new). This would suggest an adjustment factor of approximately 0.75, to account for the difference between predicted and actual impact of increasing energy efficiency stringencies. However, if we attributed only 55 per cent58 of the changes to the changes to the BCA in 2006 to the observed improvement of 0.5 per cent per year, the adjustment factor would be lower at 0.625.
Summary
Overall, the available (albeit limited) Australian evidence suggests that modelled energy savings are unlikely to be fully realised. This finding is consistent with a number of international studies (see appendix D for details) and the following observation from the NABERS Guide to Building Energy Estimation:
“Simulation is not a definitive indicator of the performance of a building, and indeed the relationship between the average performance of buildings and their simulations is very weak. Real buildings rarely reach the performance potential indicated by simulation and the gap between theoretical and actual performance is often very substantial.”59
Insights from case studiesMost case studies focus on the comparison of the proposed buildings against NCC 2016 Reference building and NCC 2019 Reference building, and thus do not provide direct indication of energy savings and emission reductions resulted from the change in NCC requirement as NCC 2019 Reference and 2016 Reference buildings use difference schedules. Nevertheless, three case studies present results for 2016 Reference building with 2019 schedules and thus enable the comparison between NCC 2019 and NCC 2016. They show that, compared to NCC 2016, NCC 2019 Reference Buildings may reduce energy consumption by 3-20 per cent (table ), which is broadly consistent with the findings of the EA modelling of the DTS and give an indication of the relative stringency
57 The DTS results predicted that buildings in major cities built under the changes would achieve a range of 21 per cent to 24 per cent improvement for offices, 24 per cent to 27 per cent for retail (the dominant building class) and 21 per cent to 24 per cent for schools. However, figure 6.1, suggests that overall a change of up to 20 per cent across all new commercial buildings would be achieved.
58 As per the estimates in pitt&sherry (2015).59 NABERS 2011, Guide to Building Energy Estimation, p. 2.
www.TheCIE.com.au
Decision Regulation Impact Statement 87

achieved, noting that any actual costs were often avoided by using a JV3 modelled façade. The case study of mid-tier office building in Nedlands, WA compares the NCC 2019 Reference building with the NCC 2016 Reference building with 2019 lighting and 2019 schedules and with 2016 lighting and 2019 schedules. The energy consumption and emissions would reduce by more than 48 per cent from the 2016 Reference building with 2016 lighting, more than doubled the reduction from the 2016 Reference building with 2019 lighting. As discussed earlier, the industry has already been adopting the LED technology even without changes to the NCC, and thus a more appropriate baseline for comparison.
066B0637 Impact on energy consumption and emissions from case studiesEnergy Emissions
% %
Quay Quarter Tower -2.4 -8.8Mid-tier Office in Nedlands with 2016 lighting in 2016 Reference -48.4 -48.4 with 2019 lighting in 2016 Reference -20.4 -20.4Roselands Boarding House -2.9 -2.9
Note: negative indicates reduction of energy consumption or greenhouse gas emissions from the NCC 2016 Reference Building with 2019 SchedulesSource: CIE construction based on case studies
Measuring the benefitsAs discussed above, the main benefit of the proposed changes to Section J of the NCC are related to energy savings, including both bill savings for building owners and/or tenants and reduced GHG emissions. Energy savings are based on EA’s modelled simulations. These simulations compare energy consumption under NCC 2016 (assuming voluntary uptake of LED lighting) to energy consumption for a building that complies with the proposed amendments. This could potentially overstate the energy savings for those buildings that would voluntarily exceed the minimum energy efficiency requirements of the existing NCC (beyond the use of LED lighting). However, it is difficult to take this into account in CBA; although we have some information on the extent to which buildings are choosing to exceed the NCC, it is difficult to adjust the cost side of this equation, we have no information on the approach (technologies) that are being (or will be) used (other than LED lighting). The additional cost of complying with the NCC is therefore difficult to estimate.As discussed above, the available (albeit limited) evidence suggests that the relationship between simulated and actual energy consumption is
www.TheCIE.com.au
88 Decision Regulation Impact Statement

relatively weak and that as low as only around half of predicted energy savings are realised in practice. The potential for engineering estimates to overstate the energy savings from improved energy efficiency is a modelling issue raised in the international literature (see appendix D for further details).As in the Consultation RIS, we report benefit estimates under three alternative realisation scenarios. 1 Under the first (low) realisation scenario, we assume that 50 per cent of
modelled energy savings are achieved in practice. This is consistent with the relationship between modelled and actual GHG emission savings implied by the Green Star data (see chart above).
2 Under the second (medium) realisation scenario, we assume that 75 per cent of modelled energy savings are achieved in practice. This is consistent with the relationship between modelled and actual GHG emissions implied by the Green Star data when the five outliers have been excluded from the sample (see appendix D for further details).
3 Under the third (high) realisation scenario, modelled energy savings are assumed to be achieved fully in practice.
We apply the above realisation rates equally to modelled changes in both electricity and gas consumption.Stakeholders had mixed views on which scenario was considered more likely.■ More stakeholders (including the Property Council of Australia, Think
Brick, JMG and the NSW Government) lent towards the medium scenario than the other options.
■ That said, there were several stakeholders that argued the low or high scenario were more likely.– MBA felt the low scenario (or worse) was more likely given the poor
relationship between predicted and actual outcomes.– Benmax Group argued that energy savings are likely to be in line
with EA modelling (i.e. the high scenario) given EA’s good reputation and that the model used (IES) is a reliable and proven product.
In the CBA, energy savings are valued as follows:■ Resource cost savings are valued by applying retail energy prices (see
appendix H for further discussion on the approach to valuing energy savings) in each state to the change in annual consumption reported over the building’s life (assumed to be 40 years) and discounting to present value terms.
■ Environmental benefits are valued by:
www.TheCIE.com.au
Decision Regulation Impact Statement 89
– estimating the associated reduction in GHG emissions by applying estimated emissions factors to energy savings (by source); and
– applying an estimate of the medium social cost of carbon as estimated by the US Environment Protection Agency (EPA) (see appendix H for further details).
Aggregate energy savingsEstimated aggregate electricity savings over time based under various scenarios are shown in chart . In general, electricity savings increase as the stock of building constructed under the new code increases over the ten-year regulatory period. Based on EA modelling (i.e. the high scenario), electricity savings would level off at around 1200 GWh per year. However, if only half of modelled electricity savings are realised (under the low scenario), electricity savings would peak at around 600 GWh per year. Electricity savings would decline from 2058 as the buildings built during the regulatory period reach the end of their assumed 40 year lives.
066A0638 Aggregate electricity savings over time
0
200
400
600
800
1000
1200
1400
2019 2022 2025 2028 2031 2034 2037 2040 2043 2046 2049 2052 2055 2058 2061 2064 2067
GWh
Low scenarioMedium scenarioHigh scenario
Data source: CIE based on EA modelling.
Aggregate electricity savings are estimated to be partly offset by increased gas consumption (chart ).
www.TheCIE.com.au
90 Decision Regulation Impact Statement

066A0639 Aggregate gas savings over time
-250
-200
-150
-100
-50
0
2019 2022 2025 2028 2031 2034 2037 2040 2043 2046 2049 2052 2055 2058 2061 2064 2067
TJ
Low scenario
Medium scenario
High scenario
Data source: CIE based on EA modelling.
The net impact on GHG emissions under each scenario is shown in chart . Under all scenarios, GHG savings increase over the ten-year regulatory period as the stock of buildings constructed under the new code expands. At the end of the regulatory period, GHG emissions savings declines as electricity generation is assumed to gradually become less GHG intensive. This decline would accelerate from around 2058 as the buildings built during the regulatory period reach the end of their assumed 40 year lives.■ Under the low scenario, annual GHG emissions savings are estimated
peak at around 450 Kt of CO2-e. Over the whole period, cumulative GHG emissions reduction are estimated at around 13.4 Mt CO2-e.
■ Under the medium scenario, annual GHG emissions savings are estimated peak at around 675 Kt of CO2-e. Over the whole period, cumulative GHG emissions reduction are estimated at around 20 Mt CO2-e.
■ Based on EA modelling (i.e. the high scenario), avoided GHG emissions would peak at around 900 Kt of CO2-e. Cumulative GHG emissions reductions over the whole period are estimated at around 26.7 Mt CO2-e.
www.TheCIE.com.au
Decision Regulation Impact Statement 91

066A0640 Aggregate GHG emissions savings over time
0100200300400500600700800900
1000
2019 2022 2025 2028 2031 2034 2037 2040 2043 2046 2049 2052 2055 2058 2061 2064 2067
Kt CO
2-e
Low scenarioMedium scenarioHigh scenario
Data source: CIE based on EA modelling.
These emissions reductions will make a modest contribution towards Australia’s 2030 emissions targets of 26-28 per cent below 2005 levels in 2030 under the Paris Agreement. Cumulative emissions reductions of 868-934 Mt CO2-e are required to meet the 26 per cent and 28 per cent targets respectively.60 The proposed changes to the NCC would contribute less than 1 per cent towards these targets (table ).
066B0641 Aggregate emissions reductionsEmissions reduction
(2019-2067)
Emissions reductions
(2021-2030)
Proportion of emissions
reduction task (based on 26
per cent reduction)
Proportion of emissions
reduction task (based on 28
per cent reduction)
Mt Mt Per cent Per cent
Low scenario 13.34 3.28 0.38 0.35Medium scenario 20.01 4.92 0.57 0.53High scenario 26.67 6.56 0.76 0.70
Source: Department of the Environment and Energy, Australia’s emissions projections 2017, December 2017, p. 3; CIE estimates based on EA modelling.
60 Department of the Environment and Energy, Australia’s emissions projections 2017, December 2017, p. 3.
www.TheCIE.com.au
92 Decision Regulation Impact Statement

7 Other impacts
Change in administrative costsIn general, there are no significant new regulatory processes under the proposed changes to the NCC. As such, changes in administrative costs would be relatively modest.
Streamlined regulatory processOne change that may streamline regulatory processes is the expansion of options for demonstrating compliance via new Verification Methods (VMs). A Performance Solution is used where a building owner chooses to meet the Performance Requirements of the NCC using a method other than the DTS provisions of the NCC. Verification Methods are one option to demonstrate compliance with the Performance Requirements. Currently NCC 2016 specifies one VM – JV3.However, where a building owner chooses to obtain either a NABERS Commitment Agreement or a Green Star Design & As Built rating the building owner will incur the associated costs in addition to the cost of demonstrating compliance with the NCC using its DTS provisions, a Performance Solution verified using JV3 or another Performance Solution.Under the proposed changes, the NCC would recognise a NABERS Commitment Agreement or Green Star rating as an acceptable means of demonstrating compliance with the NCC’s Performance Requirements, avoiding duplication and additional cost. EA estimates that the cost savings could be in the order of $10 000 per building. These administrative cost savings apply mainly to office buildings.■ The NABERS register shows there have been 184 NABERS Commitment
Agreements, mostly over the past ten years (although some were earlier), indicating around 18 per year are sought.61
■ Green Star Design & As Built penetration rates vary across state capitals, ranging from 8 per cent in Darwin up to around 38 per cent in
61 NABERS website, https://nabers.gov.au/public/WebPages/ContentStandard.aspx?module=21&template=3&id=220, accessed 27 February 2018.
www.TheCIE.com.au
Decision Regulation Impact Statement 93

Brisbane and Perth.62 To estimate the approximate number of buildings, we:– apply these capital city penetration rates to state-wide office building
projections to estimate the proportion of floor space covered by Green Star Design & As Built ratings, and
– convert to the number of buildings, by dividing by 9000 m2 based on the assumed floor space of building 5A.
If each building covered by a NABERS Commitment Agreement or Green Star Design & As Built rating saves around $10 000 (based on EA estimates), this implies a relatively modest cost saving of around $0.7 million annually or $5.3 million in present value terms over ten years, using a discount rate of 7 per cent (table ). Note that where buildings obtain both a Green Star rating and a NABERS Commitment Agreement, this approach may over-estimate the number of separate buildings to which the savings would apply.
077B0742 Estimated administrative cost savingsNSW Vic Qld SA WA Tas ACT NT Total
Average NABERS Commitment Agreements (No. per year) a
7.2 1.8 3.5 0.6 3.6 0.0 1.4 0.3 18.4
Green Star penetration (%) b
26 33 38 29 38 10 28 8
Estimated number of buildings (No.) c
2019 24.4 7.2 15.9 3.2 9.7 0.1 3.9 0.4 64.92020 24.4 8.1 13.8 3.5 9.6 0.2 4.7 0.4 64.92021 22.1 16.2 14.0 2.5 9.6 0.2 4.2 0.4 69.22022 22.2 16.3 14.2 2.5 9.6 0.2 4.3 0.4 69.72023 22.5 16.6 14.5 2.5 9.7 0.2 4.3 0.4 70.82024 22.8 17.0 14.8 2.6 9.8 0.2 4.4 0.4 72.12025 23.0 17.1 14.8 2.6 9.9 0.2 4.4 0.4 72.52026 23.2 17.5 15.1 2.6 9.9 0.2 4.5 0.4 73.52027 23.3 17.6 15.2 2.6 9.9 0.2 4.6 0.4 73.82028 23.7 17.9 15.3 2.7 10.0 0.2 4.7 0.5 74.9
Cost saving ($'000) d
2019 244.3 72.0 159.5 31.8 96.5 1.4 39.0 4.4 648.82020 244.3 81.3 138.3 35.5 96.1 1.9 46.9 4.3 648.62021 221.0 161.7 140.4 24.6 95.9 1.8 42.1 4.3 691.82022 222.4 163.3 142.3 24.8 95.8 1.8 42.5 4.3 697.32023 224.8 166.3 145.5 25.0 96.9 1.9 43.3 4.4 708.0
62 Green Building Council of Australia, Penetration of Green Star Australia’s office market, May 2017, p. 2.
www.TheCIE.com.au
94 Decision Regulation Impact Statement

NSW Vic Qld SA WA Tas ACT NT Total
2024 228.0 170.5 148.0 25.5 98.3 1.9 44.3 4.4 721.12025 230.1 171.4 148.4 25.6 98.6 1.9 44.4 4.4 724.82026 232.4 175.2 150.8 26.1 99.3 1.9 45.1 4.5 735.32027 232.9 175.8 151.7 26.1 99.0 1.9 45.9 4.5 737.72028 236.7 179.4 153.5 26.7 100.2 1.9 46.5 4.5 749.5Average annual saving (not discounted, $’000) 231.7 151.7 147.8 27.2 97.7 1.8 44.0 4.4 706.3Net present value ($’000) 1 743.6 1 094
1 108.6 206.9 732.1 13.6 328.6 33.0 5 260.5
a NABERS website, https://nabers.gov.au/public/WebPages/ContentStandard.aspx?module=21&template=3&id=220, accessed 27 February 2018. b Green Building Council of Australia, Penetration of Green Star Australia’s office market, May 2017, p. 2; c Building projection in m2 (see appendix E) multiplied by Green star penetration rate, divided by the floor space of an average office building (assumed to be 9000 m2 based on Building 5A) plus the average number of NABERS Commitment Agreements per year. d Number of buildings multiplied by $10 000 per building based on EA estimates.Source: Green Building Council of Australia, EA, CIE.
Other changes in regulatory practiceOther possible changes to regulatory practice that will have minimal impact on administrative costs (and have therefore not been quantified) include the following.■ While not able to be quantified it is likely that there will be a reduction
in the regulatory burden for designers of facades and HVAC systems as a result of the new methods.– For HVAC designers, they are now able to use the new whole of
system DTS compliance pathways to show that their system design uses less energy than a system representative of the DTS minimum standards at a component level. This gives the designer the ability to trade energy use between fans and pumps as a DTS solution. Previously this would have required the use of a Performance Solution (through the JV3 pathway) and full building energy model.
– This is also true of the changes to facades. Anecdotal feedback from industry is that a Performance Solution is commonly used to get consistent glazing and façade types and materials on all aspects. Especially in cool climates the over stringency issue means that this is not possible under the DTS, so a JV3 is used. Designers can now trade energy performance between facades, allowing for consistent glazing types to be used on all aspects without the use of a JV3, meaning they no longer have to create a full energy model.
■ The new methods for fans, pumps and facades will require designers to demonstrate compliance of their fans in a new format. Learning how to comply with the new format is expected to be achieved through re-training (see below for an estimate of the associated costs). The
www.TheCIE.com.au
Decision Regulation Impact Statement 95

information that will be used to demonstrate compliance is the same information required to complete a compliant design currently (material type, thermal resistance properties, building area, HVAC system parameters etc.).– In the case of HVAC pumps and fans the designer will replace one
calculation (based on watts per m2) with a new one (total system pressure drop).
– In the case of facades, the designer will take the information they currently need (square meters and thermal resistance of glass and wall elements) and combine them to get a total façade calculation.
– In both cases, the ABCB is producing calculators that assist in completing the necessary calculations.
■ Minimum energy efficiency standards for lifts is a new requirement. The information used to demonstrate compliance (using expected numbers of passengers and distances travelled to specify what energy efficiency level is required) is the same that will be used in standard lift parameters. So the additional burden is only in collating the information and presenting it to a certifier, as actual lift selection is expected to be business-as-usual.
Simplification/clarification of requirementsA significant number of proposed changes aim to simplify the NCC and clarify the energy efficiency requirements. They include the following.■ Relatively minor wording changes that clarify requirements or move
particular requirements into a more logical place. These proposed changes are likely to be worthwhile, but may not have a significant impact on outcomes.
■ More substantive changes that provide additional guidance and/or reduce ambiguity. Changes of this nature, include the provision of nomograms relating to thermal bridging and related measures.
There is some evidence that the thermal bridging requirements in the current code are frequently misapplied due to the complexity. This may be contributing to the underperformance of some buildings, relative to modelled outcomes.Clarifying and simplifying these requirements has the potential to improve energy efficiency outcomes by improving compliance. That said, it is not possible to estimate the extent to which the revised code would improve compliance with the thermal bridging requirements.
www.TheCIE.com.au
96 Decision Regulation Impact Statement

Re-training costsAs the proposed changes to the NCC are significant, both government and industry would incur some one-off costs associated with raising awareness of the changes and re-training.
Costs to governmentCosts to the government are estimated at $355 000 (table ).■ To assist with the transition to the new code, ABCB would prepare a
range of guidance material (see chapter 9 for further details). The cost of preparing the guidance material is estimated at $300 000.
■ The Department of the Environment is also funding awareness raising seminars to be delivered by the Property Council of Australia in all capital cities (except Darwin).63 The cost is estimated at $55 000.
077B0743 Transitional costs incurred by governmentEstimated cost
$
Funding for seminars 55 000Preparation of guidance material 300 000Total 355 000
Source: Estimates provided by ABCB.
Costs to industryIndustry stakeholders will also incur one-off costs associated with familiarising themselves with the new code requirements, including:■ the time costs associated with familiarising themselves with the
relevant aspects of the new code■ any fees associated with attending associated professional
development seminars.These costs are estimated at around $16.7 million (table ). Details on our approach to estimating these costs are provided below.
077B0744 Estimated training costs incurred by industryNumber
affectedaCPD
seminar feesa
Time costsa Total
No. $'000 $'000 $'000
Certifiers/surveyors 2 405 - 120.3 - 1 149.0 - 1 269.2Architects/building designers 14 067 - 703.3 - 9 014.3 - 9 717.7
63 A seminar in Darwin may be given by ABCB.
www.TheCIE.com.au
Decision Regulation Impact Statement 97

Engineers 9 701 - 485.1 - 5 259.5 - 5 744.6Total 26 173 - 1 308.7 - 15 422.8 - 16 731.4
a Based on the number of NCC subscribers assuming that the proposed changes will affect around 51 per cent of subscribers, based on share from input-output tables (see table below). b Assumes seminar fees of $50 per subscriber. c Assumes 9.5 hours per affected stakeholder (see below for details). Time is valued at: $67.46 per hour for architects; $57.07 per hour for engineers; and $50.28 per hour for building surveyors/certifiers (see table below).Source: CIE estimates.
These costs are allocated across jurisdictions based on employment in the share of the relevant professions in each jurisdiction (based on 2016 Census data) (table ).
077B0745 Allocation of training costs across jurisdictionsCertifiers/ surveyors
Architects Engineers Total
$ million $million $ million $ million
New South Wales - 0.39 - 3.45 - 1.76 - 5.60Victoria - 0.32 - 3.06 - 1.49 - 4.87Queensland - 0.26 - 1.47 - 1.15 - 2.89South Australia - 0.07 - 0.50 - 0.32 - 0.89Western Australia - 0.17 - 0.87 - 0.82 - 1.86Tasmania - 0.02 - 0.14 - 0.07 - 0.23ACT - 0.02 - 0.19 - 0.07 - 0.28Northern Territory - 0.02 - 0.03 - 0.07 - 0.12Total - 1.27 - 9.71 - 5.74 - 16.73
Source: ABS 2016 Census of Population and Housing, CIE.
Industry stakeholder directly affected by the proposed changes
Stakeholders that will be directly affected by the proposed changes to the code (i.e. those that will need to be familiar with some or all of the detail of the changes) include:■ certifiers/surveyors■ architects and building designers■ engineers.The NCC subscriber base is around 194 000 in total, which suggests that registered users are a reasonable reflection of the total size of the market. This includes more than 51 000 subscribers in those professions that will be directly affected by the proposed changes. However, not all registered users in the relevant professions are involved with the construction of commercial buildings (i.e. some focus on residential construction). In particular, those in the relevant professions that specialise in the residential construction sector would not need to familiarise themselves
www.TheCIE.com.au
98 Decision Regulation Impact Statement

with the proposed changes to the energy efficiency requirements for commercial buildings.Input-output tables published by the ABS provides and estimate of the production of each industry that is used as an input to the production of other industries. To allocate the number of NCC subscribers between non-residential and residential buildings, we use the share of the relevant sectors (architectural services and engineering, design and consulting services) used in non-residential building construction sector as share of total building construction (table ). This is around 51 per cent of NCC subscribers.
077B0746 Estimated number of stakeholders directly affected by proposed changes
Number of NCC subscribers
Non-residential
building share
Estimated number of
affected stakeholders
No. Per cent No.
Certifiers/surveyors 4 689 51.3 2 405Architects/building designers 27 474 51.2 14 067Engineers 18 911 51.3 9 701Total 51 074 26 173
Source: ABCB, ABS, CIE.
Estimated costs incurred by each stakeholder
We estimate that each stakeholder directly affected would require around 9 hours to familiarise themselves with the relevant changes to the NCC (note that not every stakeholder would need to be familiar with every element of the code).■ As noted above, the Property Council of Australia will provide seminars
(funded by the Department of the Environment) in all capital cities (except Darwin) to raise awareness and to assist industry stakeholders to familiarise themselves with the proposed changes. Each seminar will run for 2 hours.
■ In addition, the awareness raising seminars, industry stakeholders may require more detailed training. The professions that will be directly affected by the proposed changes generally have mandatory of voluntary continuing professional development (CPD) arrangements. As such, relevant bodies are likely to include a seminar on the code as a CPD topic. Where CPD is mandatory, it is therefore likely that a seminar on changes to the NCC would displace an alternative topic (i.e. the total time spent on CPD would not increase). That said, the alternative topic would presumably have some value; we therefore include the cost of attending the CPD seminar. As a conservative estimate (i.e. an estimate
www.TheCIE.com.au
Decision Regulation Impact Statement 99

that is more likely to overstate than understate the true costs), ABCB has suggested that each stakeholder may require:– a half-day (3.75 hours) CPD seminar; and– an additional half day of self-paced learning.
Note that not every affected stakeholder will attend seminars. However, we assume that stakeholders would need to spend the equivalent time independently familiarising themselves with the new code.Time costs are valued based on indicative hourly costs for the relevant professions (table ).■ a 25 per cent loading for on-costs (such as payroll tax, superannuation
etc.) is added to annual salary estimates■ annual salary estimates are converted to hourly rates assuming:
– 230 working days per year– 7.5 hours per working day.
077B0747 Indicative salaries for relevant professionsAnnual salary
Annual salary
including on-costsd
Daily salary
(including on-costs)e
Hourly salary
(including on-costs)f
$ $ $ $
Architect 93 089a 116 361 505.92 67.46Service engineer 78 753b 98 441 428.01 57.07Building surveyor 69 384c 86 730 377.09 50.28
a Estimated based on the weighted average (across experience levels) from a salary survey undertaken by the Association of Consulting Architects Australia (https://aca.org.au/article/2017-salary-survey-findings). b Estimate based on the average salary (including bonuses, profit-sharing and commission) of a Services Engineer (https://www.payscale.com/research/AU/Job=Service_Engineer/Salary). c Estimate based on the average salary (including bonuses, and profit-sharing) of a Building Surveyor (https://www.payscale.com/research/AU/Job=Building_Surveyor/Salary). d Assumes an on-cost loading of 25 per cent. e Assumes 230 working days per year. f Assumes 7.5 hours per working day.Source: Association of Consulting Architects website, https://aca.org.au/article/2017-salary-survey-findings, accessed 5 November 2018; Payscale website, https://www.payscale.com/, accessed 5 November 2018, CIE.
In addition to the time costs, some stakeholders will bear some seminar fees.■ As the costs of the seminar are being funded by the Department of the
Environment, there would be associated fees for industry participants.■ The cost of attending CPD seminars run be the relevant professional
bodies can vary. We assume a cost of $50 to attend a half day seminar.
www.TheCIE.com.au
100 Decision Regulation Impact Statement

Impact on competitionAn inevitable downside of minimum standards is the potential for negative impact on competition. The COAG Guidelines require that, in accordance with the Competition Principles Agreement, legislation should not restrict competition unless it can be demonstrated that:■ the benefits of the restriction to the community as a whole outweigh
the costs; and■ the objectives of the regulation can only be achieved by restricting
competition.Minimum energy efficiency standards for commercial buildings in the NCC could reduce competition by restricting choice, such as:■ Restricting the choice of buildings available — minimum energy
efficiency standards could restrict choices in relation to the buildings that are available and the associated design choices.– As pointed out in the Master Builders Australia submission, some
building owners (or tenant) could rationally choose cheaper or less energy efficient premises. For example, some small businesses may leave their office frequently unoccupied and may therefore prefer a cheaper less energy efficient office.
– Minimum energy efficiency standards could effectively preclude some design features that some owners or tenants value more highly than energy savings.
■ Restricting the choice of building products and services — minimum energy efficiency requirements will restrict the choice of glazing, boilers, fans and other services that can be used in construction through the DTS pathway The submission from Rheem Australia provided a tangible example of the proposed tightening of the minimum standards effectively preventing some suppliers from participating in the market (at least temporarily).
■ An increase in the minimum efficiency for “Type A” appliances (under 500 MJ/h) to 86 per cent, as proposed by ABCB, would prevent Rheem from selling some types of boilers produced at its Moorabbin factory.
■ ABCB also proposed to increase the minimum efficiency for “Type B” (over 500 MJ/h) boilers from 80 per cent to 90 per cent. Over several year, Rheem has been developing a new product with 86-88 per cent efficiency. Were the minimum standards to be increased to 90 per cent, Rheem would be unable to launch the new product, which has apparently been the result of many years of development and many hundreds of thousands of dollars in expenditure.
Rheem proposed staggering the increase to 90 per cent efficiency over time as follows.
www.TheCIE.com.au
Decision Regulation Impact Statement 101

■ The minimum efficiency of Type B boilers would be increased to 85 per cent from 2019.
■ This would be increased to 90 per cent from 2022.The modelling presented above is based on products that are currently available in the market. According to EA, increasing the minimum energy efficiency standard above 80 per cent would largely preclude the use of most non-condensing boilers currently available and require the use of condensing boilers, which mostly operate at around 90 per cent efficiency. Therefore, based on products currently available, the impact of the revised proposal would be largely unchanged from the initial proposal.ABCB notes that products that comply with the 90 per cent minimum standard are currently available in the market and the concern for less efficient products was related to those yet to reach market, no economic impact could be estimated.More generally, Rheem argues that this would result in less local manufacturing and more imported products and this should somehow be taken into account.However, as is generally the case, the CBA is based on a ‘partial equilibrium’ framework, focusing on the construction and operation of commercial buildings. As such, it does not consider the ‘general equilibrium’ effects on the supply chain. Under this framework, the impacts on the supply chain are only relevant to the extent that compliant products are available from either domestically produced or imported sources.From a competition perspective, it is important that the same standards apply, whether products are produced locally or imported. An increase in minimum standards should be assessed on its merits, rather than whether it disadvantages local manufacturers relative to imports. Furthermore, the NCC is a performance-based code with Verification Methods and other pathways that allow for trading between the performance of elements in order to achieve compliance against the overarching Performance Requirement. Augmenting this flexibility is commercial building performance quantification in NCC 2019, which although less likely to be used, enables complete flexibility in design to meet the targeted values.In the case of Rheem, its primary concern was that the regulation would affect a boiler product that it was in the process of bringing to market, but had not yet done so. It is understood that Rheem are the sole only manufacturer of this type of boiler for commercial application in Australia. In response to this, the Office lowered the proposed efficiency for smaller Type A boilers to 86 per cent, while retaining the higher efficiency for larger boilers.From an individual product perspective competition is not constrained where the possibility exists to use these building products and/or services
www.TheCIE.com.au
102 Decision Regulation Impact Statement

through a Performance Solution, where trade-offs are made elsewhere. The proposed changes appear to comply with the ‘competition test’ set out in the COAG Guidelines. That said, it is reasonable to give all suppliers, including local manufacturers, sufficient time to gear up to meet future market needs (this is considered under implementation and review).
Potential for unintended consequencesMost respondents feel some degree of adverse impacts on these issues if the changes were not properly implemented. One exception is NSW Building Administration who reports stakeholders generally feel increased energy efficiency could lead to higher levels of amenity and health as working conditions, air temperature and air quality are likely to be better.Stakeholders feel the changes will have negative impacts on:■ Safety and health – ASBEC, PCA, BlueScope, NASH, MBA, Sustainability
House■ Amenity – JMG, Benmax, G. James, Sustainability House, MBA■ Accessibility – PCA, GBCA, MBA, Think Brick (may have misinterpreted
the question as market access).
Safety and healthSome suggested impacts on amenity safety and health including ‘low lighting levels could result in difficulty seeing hazards, leading to collision or slippage’, and ‘result in persons coming in contact with hazardous materials/waste that might otherwise be avoided’. However, these concerns are unfounded as the illumination levels are not proposed to change. It is also mentioned that mandatory use of lighting control (motion detectors) in some areas of Class 6 Buildings ‘is likely to be high cost penalty with low energy efficiency impact’.BlueScope suggests continually increasing stringency leads to the risk of increasing the use of non-compliant products (cites board type insulation) which have poor fire performance because materials with greater fire performance are ‘significantly more expensive’ (no citation or further evidence provided). NASH also sees the risk from insulation suggesting the cheapest and best performing materials (foams). Less combustible bulk fibrous materials require more space, and a foreseeable consequence may be ‘novel combinations of combustible materials’ that lead to undermining of the fire safety requirements. ASBEC, GBCA and PCA feel that increases in the stringency of energy efficiency requirements could impact on safety and health if not properly implemented, and suggest that there is a role for government to improve industry capacity by providing or supporting the provision of training and
www.TheCIE.com.au
Decision Regulation Impact Statement 103

to improve monitoring and enforcement. It is also suggested provisions to mitigate the risk of unintended consequences could be potentially included in relevant sections of the code.
AmenityJMG points to amenity as an unintended impact, but does not provide further comments. Benmax Group argues that ‘reduction in light and in views will definitely be seen as a reduction in amenity’.G. James highlights lighting level concerns as an area of diminished amenity and Sustainability House echoes this view and suggests this may lead to safety issues (see above). PCA notes the difficulties achieving compliance in Class 9 buildings (WWR and the need for views and amenity for Class 9 occupants) will likely lead to the need for reduced window sizes due to stringency and this will impact on amenity. MBA believes changes will negatively impact occupant amenity by reducing natural light and view resulted from reducing WWR (smaller windows). It goes further drawing on the philosophical argument energy efficiency is regionally specific and argues the NCC is the wrong place for the regional specific technical regulation. It feels the principle goals of minimum necessary standards are now moved to more of a best practice standard.
AccessibilityWhile this aspect of the code taken in context with life safety and amenity is generally understood to relate to entering or leaving a buildings, some interpret this to be with respect to the written form’s digestibility. It is generally noted in submissions that the NCC is complex and ‘some operators are not equipped with the appropriate knowledge and skill’ (ASBEC, PCA and GBCA).PCA also provides specific suggestions to assist industry including ■ guidelines in plain English; ■ simple calculators for the DTS façade provisions;■ training materials and courses for designers, architects, builders,
surveyors and consultants, and ■ an online forum for Q&A.With regard to amenity, it is the case that energy efficiency has not proved a barrier to achieving high levels of occupant amenity in practice. A number of case studies provide further evidence that concurrent NCC
www.TheCIE.com.au
104 Decision Regulation Impact Statement

requirements for amenity safe movement and access can be achieved under the stringency proposed. Similarly, and though non-specific, concerns over the suitability of materials need to be considered in light of other NCC requirements including those for fire safety. It is clear with respect to where materials need to be non-combustible in buildings and the comprehensive package of measures delivered in 2018 compliment the NCC 2016 Amendment 1 and the consideration of evidence of suitability. Education and awareness raising activities relating to both these requirements and additional material will assist industry with interpreting and compliment the introduction of NCC 2019 for Section J (see implementation and review).
www.TheCIE.com.au
Decision Regulation Impact Statement 105
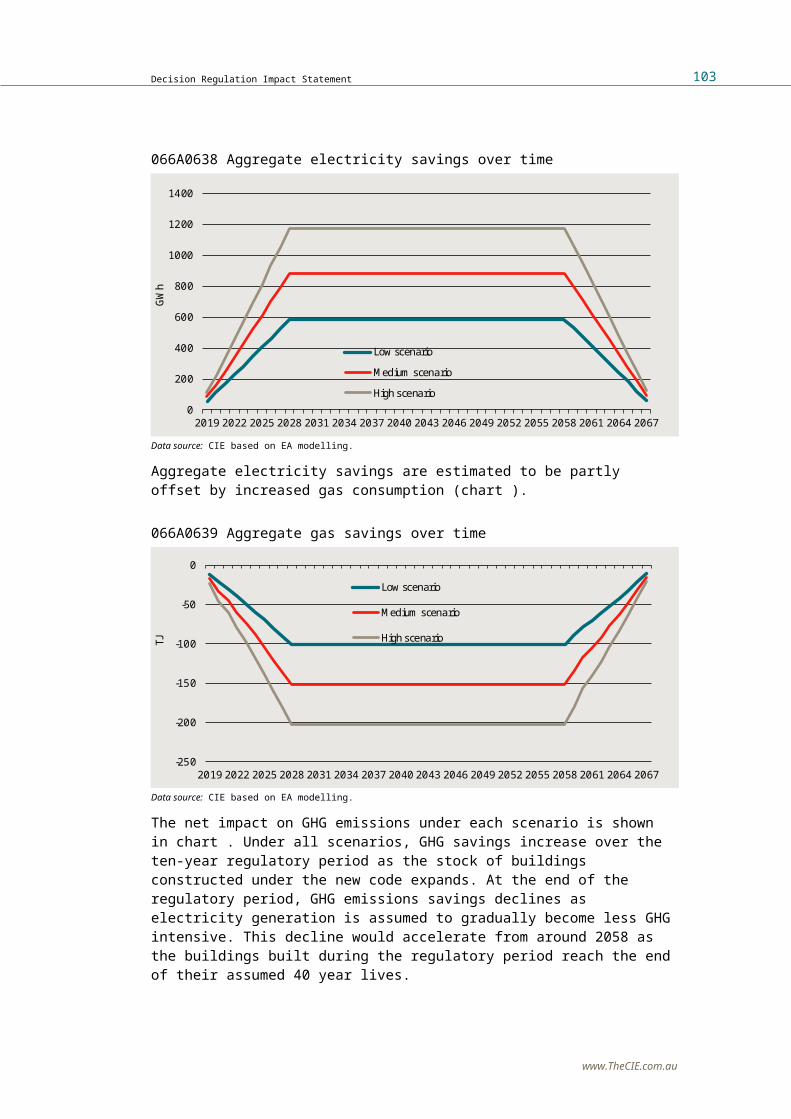
8 Cost-benefit analysis
Building level net impacts
Building level impacts by stateIn addition to variations across building type and Climate Zone, net benefits will depend on energy prices, as well as the GHG-intensity of energy, which vary across states.In general, the proposed changes to the NCC are estimated to result in a net benefit across most building types, jurisdictions and Climate Zones. Key exceptions are as follows.■ There is estimated to be a small net cost for the retail buildings in
Climate Zone 7.■ There is also estimated to be a small net cost for the healthcare
buildings in Climate Zones 6 and 7 (and Climate Zones 4 and 5 in most jurisdictions under the low realisation scenario).
The net cost for the healthcare building in cooler Climate Zones relates to the less stringent (and less expensive) façade requirements. The healthcare building archetype has a low WWR and a relatively high envelope surface area to volume ratio. As such, increased energy consumption for heating outweighs energy savings for cooling.The proposed changes will apply to all Climate Zones albeit with variation in specific requirement because exclusion of particular zones was not feasible for the following reasons:■ In general stringency updates underlying reference building schedules
and performance quantification would be incompatible with existing methods, undermine objectives and lead to confusion in the market.
■ The stringency of DTS services provisions were selected to optimise outcomes and correct over stringency in a number of cases, which suggests poorer design outcomes need to be considered in this context.
■ Due to methodology change, there is no flexibility to retain the existing requirements for façade which would require a duplication of provisions and methods which would be complex and unworkable particularly for mixed use buildings.
■ Fundamental changes to façade provisions mean guidance and advisory material require withdrawing or updating.
www.TheCIE.com.au
106 Decision Regulation Impact Statement
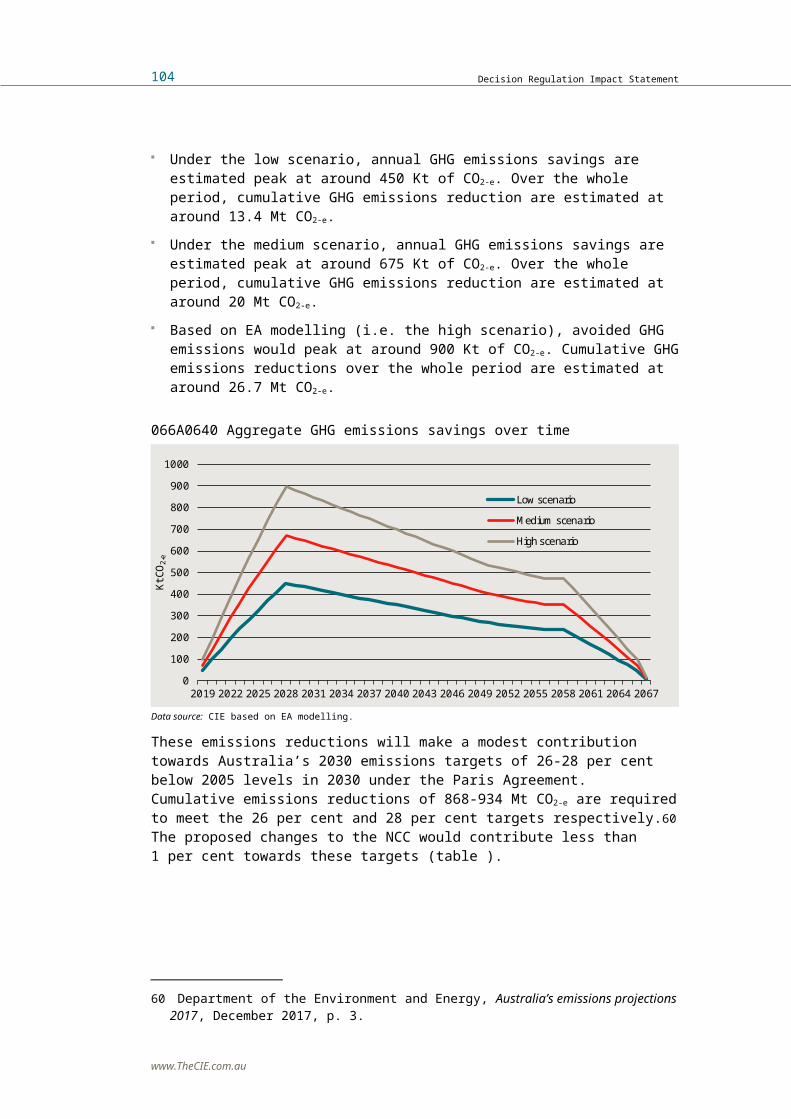
New South Wales
New South Wales spans Climate Zones 2 and 4-8 (although Climate Zone 8 has not been modelled). Based on EA modelling, the net benefit per square metre of floor space is shown in table . The modelling suggests that the proposed changes to the NCC would deliver a net benefit in NSW across most building types and Climate Zones.■ The key exceptions are the healthcare building in Climate Zone 6 and 7
and the retail building in Climate Zone 7.– As noted above, the modelling suggests that energy consumption
would increase in the healthcare building in Climate Zones 6 and 7.– In the retail building in Climate Zone 6, compliance costs are
estimated to outweigh modest bill savings (based on NSW energy prices).
■ Net benefits per square metre of floor space tend to be highest for hotels and schools, largely because compliance costs tend to be low (or negative in some Climate Zones) (see appendix I for further details).
■ Net benefits per square metre of floor space tend to be modest for office buildings.
088B0848 Building-level net impacts — New South WalesCZ1 CZ2 CZ3 CZ4 CZ5 CZ6 CZ7
$ per m2
$ per m2
$ per m2
$ per m2
$ per m2
$ per m2
$ per m2
Low scenario
Hotel n.a. 43.42 n.a. 40.03 32.33 40.68 50.20Office building n.a. 12.52 n.a. 3.00 2.81 4.56 8.31Retail n.a. 33.03 n.a. 18.25 42.51 19.30 - 13.50Healthcare n.a. 13.33 n.a. - 0.77 - 0.11 - 25.66 - 20.86School n.a. 41.03 n.a. 27.92 13.78 32.95 44.75
Medium scenario
Hotel n.a. 66.02 n.a. 59.50 50.98 60.63 68.97Office building n.a. 20.09 n.a. 8.06 9.74 9.49 13.32Retail n.a. 51.74 n.a. 36.67 67.38 34.13 - 11.94Healthcare n.a. 24.80 n.a. 7.59 7.94 - 25.25 - 17.13School n.a. 71.29 n.a. 50.71 29.72 53.28 71.49
High scenario
Hotel n.a. 88.61 n.a. 78.96 69.63 80.59 87.74Office building n.a. 27.65 n.a. 13.12 16.68 14.42 18.34Retail n.a. 70.45 n.a. 55.10 92.25 48.96 - 10.38Healthcare n.a. 36.27 n.a. 15.95 16.00 - 24.83 - 13.39
www.TheCIE.com.au
Decision Regulation Impact Statement 107

CZ1 CZ2 CZ3 CZ4 CZ5 CZ6 CZ7
$ per m2
$ per m2
$ per m2
$ per m2
$ per m2
$ per m2
$ per m2
School n.a. 101.54 n.a. 73.50 45.66 73.61 98.22Note: Net impacts include the private benefits and costs to building owners/tenants and the global benefits from reduced GHG emissions.Source: CIE based on EA modelling.
Victoria
Victoria spans Climate Zones 4 and 6-8. As energy prices in Victoria are not significantly different to NSW, the net benefits across building types and Climate Zones are broadly similar to the NSW results reported above.
088B0849 Building-level net impacts — VictoriaCZ1 CZ2 CZ3 CZ4 CZ5 CZ6 CZ7
$ per m2
$ per m2
$ per m2
$ per m2
$ per m2
$ per m2
$ per m2
Low scenario
Hotel n.a. n.a. n.a. 41.99 n.a. 43.15 52.43Office building n.a. n.a. n.a. 2.91 n.a. 4.91 8.20Retail n.a. n.a. n.a. 25.22 n.a. 30.06 - 17.35Healthcare n.a. n.a. n.a. 0.91 n.a. - 21.56 - 14.92School n.a. n.a. n.a. 27.44 n.a. 31.22 45.83
Medium scenario
Hotel n.a. n.a. n.a. 62.44 n.a. 64.35 72.32Office building n.a. n.a. n.a. 7.92 n.a. 10.00 13.16Retail n.a. n.a. n.a. 47.12 n.a. 50.27 - 17.72Healthcare n.a. n.a. n.a. 10.11 n.a. - 19.09 - 8.21School n.a. n.a. n.a. 49.99 n.a. 50.68 73.10
High scenario
Hotel n.a. n.a. n.a. 82.88 n.a. 85.54 92.20Office building n.a. n.a. n.a. 12.93 n.a. 15.10 18.12Retail n.a. n.a. n.a. 69.03 n.a. 70.48 - 18.09Healthcare n.a. n.a. n.a. 19.31 n.a. - 16.62 - 1.50School n.a. n.a. n.a. 72.54 n.a. 70.15 100.37
Note: Net impacts include the private benefits and costs to building owners/tenants and the global benefits from reduced GHG emissions.Source: CIE based on EA modelling.
Queensland
Queensland spans Climate Zones 1-3 and 5. Based on the Queensland energy price profile, the modelling suggests that the proposed changes to
www.TheCIE.com.au
108 Decision Regulation Impact Statement

the NCC will result in net benefits across all building types in each of these Climate Zones.
www.TheCIE.com.au
Decision Regulation Impact Statement 109

088B0850 Building-level net impacts — QueenslandCZ1 CZ2 CZ3 CZ4 CZ5 CZ6 CZ7
$ per m2
$ per m2
$ per m2
$ per m2
$ per m2
$ per m2
$ per m2
Low scenario
Hotel 31.07 42.15 34.90 n.a. 31.41 n.a. n.a.Office building 3.93 11.85 n.a. n.a. n.a. n.a. n.a.Retail 49.25 32.48 36.38 n.a. 42.55 n.a. n.a.Healthcare 25.54 12.84 14.22 n.a. - 0.46 n.a. n.a.School 84.81 40.42 46.96 n.a. 11.47 n.a. n.a.
Medium scenario
Hotel 41.47 64.11 51.86 n.a. 49.60 n.a. n.a.Office building 10.75 19.08 n.a. n.a. n.a. n.a. n.a.Retail 74.11 50.91 61.66 n.a. 67.44 n.a. n.a.Healthcare 45.61 24.07 29.33 n.a. 7.42 n.a. n.a.School 130.02 70.37 76.52 n.a. 26.26 n.a. n.a.
High scenario
Hotel 51.88 86.07 68.83 n.a. 67.80 n.a. n.a.Office building 17.57 26.31 n.a. n.a. n.a. n.a. n.a.Retail 98.96 69.34 86.93 n.a. 92.33 n.a. n.a.Healthcare 65.69 35.30 44.43 n.a. 15.30 n.a. n.a.School 175.24 100.32 106.08 n.a. 41.05 n.a. n.a.
Note: Net impacts include the private benefits and costs to building owners/tenants and the global benefits from reduced GHG emissions.Source: CIE based on EA modelling.
South Australia
South Australia covers Climate Zones 3-6. Based on South Australian energy prices, the proposed changes to the NCC are estimated to result in a net benefit across most building types and Climate Zones. As in other states, the key exception is the healthcare building in Climate Zone 6.
088B0851 Building-level net impacts — South AustraliaCZ1 CZ2 CZ3 CZ4 CZ5 CZ6 CZ7
$ per m2
$ per m2
$ per m2
$ per m2
$ per m2
$ per m2
$ per m2
Low scenario
Hotel n.a. n.a. n.a. 35.92 29.16 36.73 n.a.Office building n.a. n.a. n.a. n.a. 1.03 n.a. n.a.Retail n.a. n.a. n.a. 17.24 39.47 21.39 n.a.
www.TheCIE.com.au
110 Decision Regulation Impact Statement

CZ1 CZ2 CZ3 CZ4 CZ5 CZ6 CZ7
$ per m2
$ per m2
$ per m2
$ per m2
$ per m2
$ per m2
$ per m2
Healthcare n.a. n.a. n.a. - 2.06 - 1.43 - 23.46 n.a.School n.a. n.a. n.a. 21.55 9.67 26.54 n.a.
Medium scenario
Hotel n.a. n.a. n.a. 53.34 46.24 54.71 n.a.Office building n.a. n.a. n.a. n.a. 7.07 n.a. n.a.Retail n.a. n.a. n.a. 35.16 62.82 37.27 n.a.Healthcare n.a. n.a. n.a. 5.65 5.96 - 21.95 n.a.School n.a. n.a. n.a. 41.16 23.55 43.66 n.a.
High scenario
Hotel n.a. n.a. n.a. 70.75 63.31 72.69 n.a.Office building n.a. n.a. n.a. n.a. 13.11 n.a. n.a.Retail n.a. n.a. n.a. 53.08 86.16 53.14 n.a.Healthcare n.a. n.a. n.a. 13.37 13.36 - 20.43 n.a.School n.a. n.a. n.a. 60.76 37.43 60.78 n.a.
Note: Net impacts include the private benefits and costs to building owners/tenants and the global benefits from reduced GHG emissions.Source: CIE based on EA modelling.
Western Australia
Western Australia spans Climate Zones 1 and 3-6.
088B0852 Building-level net impacts — Western AustraliaCZ1 CZ2 CZ3 CZ4 CZ5 CZ6 CZ7
$ per m2
$ per m2
$ per m2
$ per m2
$ per m2
$ per m2
$ per m2
Low scenario
Hotel 30.57 n.a. 34.07 36.65 30.53 37.70 n.a.Office building n.a. n.a. n.a. n.a. 1.01 n.a. n.a.Retail 48.08 n.a. 35.64 20.43 42.31 26.48 n.a.Healthcare 24.59 n.a. 13.35 - 1.34 - 0.81 - 21.46 n.a.School 82.65 n.a. 44.84 21.04 9.60 25.44 n.a.
Medium scenario
Hotel 40.73 n.a. 50.62 54.42 48.28 56.16 n.a.Office building n.a. n.a. n.a. n.a. 7.04 n.a. n.a.Retail 72.34 n.a. 60.55 39.94 67.07 44.90 n.a.Healthcare 44.19 n.a. 28.01 6.73 6.91 - 18.94 n.a.School 126.79 n.a. 73.34 40.38 23.46 42.01 n.a.
High scenario
www.TheCIE.com.au
Decision Regulation Impact Statement 111
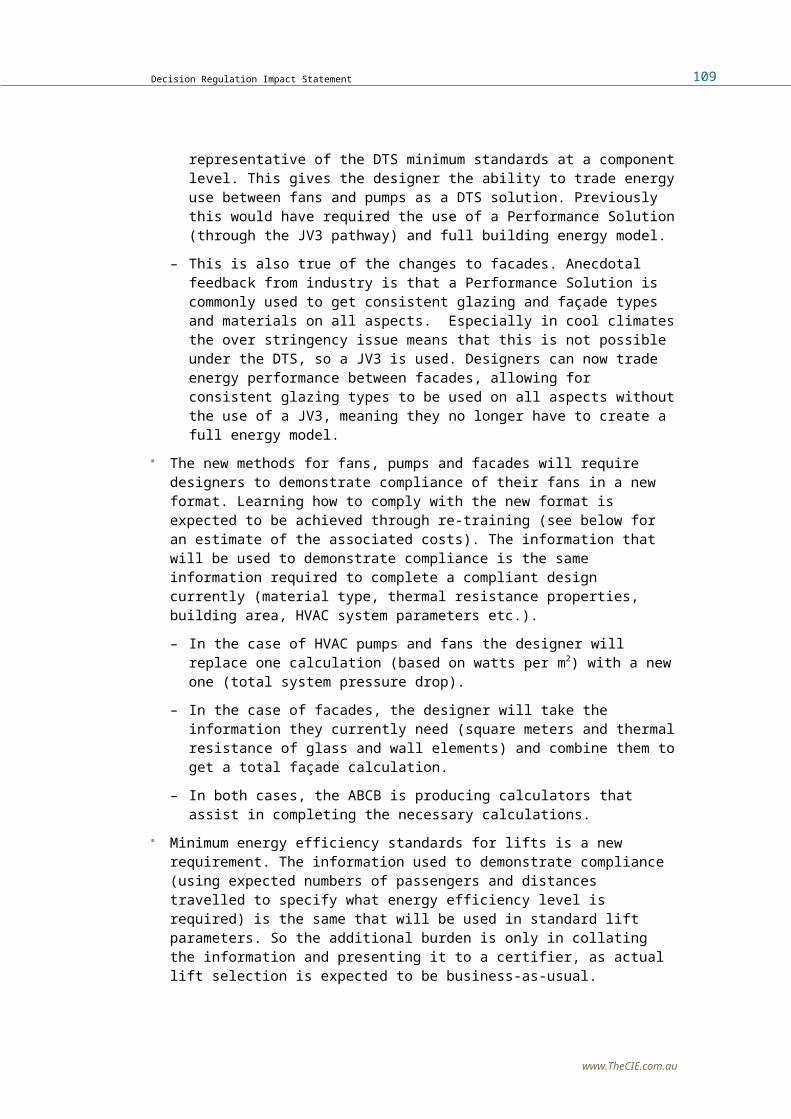
CZ1 CZ2 CZ3 CZ4 CZ5 CZ6 CZ7
$ per m2
$ per m2
$ per m2
$ per m2
$ per m2
$ per m2
$ per m2
Hotel 50.89 n.a. 67.18 72.19 66.03 74.63 n.a.Office building n.a. n.a. n.a. n.a. 13.07 n.a. n.a.Retail 96.61 n.a. 85.45 59.45 91.83 63.32 n.a.Healthcare 63.79 n.a. 42.67 14.80 14.62 - 16.42 n.a.School 170.92 n.a. 101.84 59.73 37.31 58.58 n.a.
Note: Net impacts include the private benefits and costs to building owners/tenants and the global benefits from reduced GHG emissions.Source: CIE based on EA modelling.
Tasmania
Most of Tasmania is in Climate Zone 7 (except a small proportion in Climate Zone 8 which has not been modelled). As in other states, the proposed changes to the NCC are estimated to result in a net cost for retail and healthcare buildings in Climate Zone 7. There are estimated to be net benefits for the remaining building types.
088B0853 Building-level net impacts — TasmaniaCZ1 CZ2 CZ3 CZ4 CZ5 CZ6 CZ7
$ per m2
$ per m2
$ per m2
$ per m2
$ per m2
$ per m2
$ per m2
Low scenario
Hotel n.a. n.a. n.a. n.a. n.a. n.a. 39.26Office building n.a. n.a. n.a. n.a. n.a. n.a. 5.24Retail n.a. n.a. n.a. n.a. n.a. n.a. - 15.23Healthcare n.a. n.a. n.a. n.a. n.a. n.a. - 21.93School n.a. n.a. n.a. n.a. n.a. n.a. 28.75
Medium scenario
Hotel n.a. n.a. n.a. n.a. n.a. n.a. 52.56Office building n.a. n.a. n.a. n.a. n.a. n.a. 8.72Retail n.a. n.a. n.a. n.a. n.a. n.a. - 14.53Healthcare n.a. n.a. n.a. n.a. n.a. n.a. - 18.72School n.a. n.a. n.a. n.a. n.a. n.a. 47.48
High scenario
Hotel n.a. n.a. n.a. n.a. n.a. n.a. 65.87Office building n.a. n.a. n.a. n.a. n.a. n.a. 12.21Retail n.a. n.a. n.a. n.a. n.a. n.a. - 13.84Healthcare n.a. n.a. n.a. n.a. n.a. n.a. - 15.51School n.a. n.a. n.a. n.a. n.a. n.a. 66.21
Note: Net impacts include the private benefits and costs to building owners/tenants and the global benefits from reduced GHG emissions.
www.TheCIE.com.au
112 Decision Regulation Impact Statement

Source: CIE based on EA modelling.
Australian Capital Territory
As for Tasmania, the ACT is entirely in Climate Zone 7. As such, there are estimated to be net costs for retail and healthcare buildings, but net benefits in the remaining buildings.
088B0854 Building-level net impacts — Australian Capital TerritoryCZ1 CZ2 CZ3 CZ4 CZ5 CZ6 CZ7
$ per m2
$ per m2
$ per m2
$ per m2
$ per m2
$ per m2
$ per m2
Low scenario
Hotel n.a. n.a. n.a. n.a. n.a. n.a. 42.57Office building n.a. n.a. n.a. n.a. n.a. n.a. 5.97Retail n.a. n.a. n.a. n.a. n.a. n.a. - 15.84Healthcare n.a. n.a. n.a. n.a. n.a. n.a. - 20.05School n.a. n.a. n.a. n.a. n.a. n.a. 33.00
Medium scenario
Hotel n.a. n.a. n.a. n.a. n.a. n.a. 57.53Office building n.a. n.a. n.a. n.a. n.a. n.a. 9.82Retail n.a. n.a. n.a. n.a. n.a. n.a. - 15.45Healthcare n.a. n.a. n.a. n.a. n.a. n.a. - 15.91School n.a. n.a. n.a. n.a. n.a. n.a. 53.86
High scenario
Hotel n.a. n.a. n.a. n.a. n.a. n.a. 72.49Office building n.a. n.a. n.a. n.a. n.a. n.a. 13.67Retail n.a. n.a. n.a. n.a. n.a. n.a. - 15.07Healthcare n.a. n.a. n.a. n.a. n.a. n.a. - 11.77School n.a. n.a. n.a. n.a. n.a. n.a. 74.72
Note: Net impacts include the private benefits and costs to building owners/tenants and the global benefits from reduced GHG emissions.Source: CIE based on EA modelling.
Northern Territory
The Northern Territory spans Climate Zones 1 and 3. The net benefits from the proposed changes to the NCC tend to be higher in these Climate Zones.
www.TheCIE.com.au
Decision Regulation Impact Statement 113

088B0855 Building-level net impacts — Northern TerritoryCZ1 CZ2 CZ3 CZ4 CZ5 CZ6 CZ7
$ per m2
$ per m2
$ per m2
$ per m2
$ per m2
$ per m2
$ per m2
Low scenario
Hotel 28.90 n.a. 31.37 n.a. n.a. n.a. n.a.Office building 2.51 n.a. n.a. n.a. n.a. n.a. n.a.Retail 44.07 n.a. 30.78 n.a. n.a. n.a. n.a.Healthcare 21.35 n.a. 11.19 n.a. n.a. n.a. n.a.School 75.40 n.a. 41.31 n.a. n.a. n.a. n.a.
Medium scenario
Hotel 38.22 n.a. 46.58 n.a. n.a. n.a. n.a.Office building 8.62 n.a. n.a. n.a. n.a. n.a. n.a.Retail 66.33 n.a. 53.25 n.a. n.a. n.a. n.a.Healthcare 39.33 n.a. 24.78 n.a. n.a. n.a. n.a.School 115.90 n.a. 68.05 n.a. n.a. n.a. n.a.
High scenario
Hotel 47.54 n.a. 61.78 n.a. n.a. n.a. n.a.Office building 14.73 n.a. n.a. n.a. n.a. n.a. n.a.Retail 88.59 n.a. 75.72 n.a. n.a. n.a. n.a.Healthcare 57.32 n.a. 38.37 n.a. n.a. n.a. n.a.School 156.40 n.a. 94.79 n.a. n.a. n.a. n.a.
Note: Net impacts include the private benefits and costs to building owners/tenants and the global benefits from reduced GHG emissions.Source: CIE based on EA modelling.
Decomposition by services and facadeAs discussed above, several stakeholders requested the modelling results to be disaggregated by element. To address these concerns, EA has modelled a scenario for each building archetype with a façade that complies with the existing code (i.e. no change from the baseline) with services that comply with the proposed revised minimum standard, which enables the costs and benefits to be disaggregated between services and the façade.These simulations covered only Climate Zones 2, 5 and 6, which cover all of the mainland state capital cities. The estimates reported below are as modelled by EA and therefore correspond to the ‘high scenario’. Also note that this modelling uses slightly different assumptions around wall insulation costs to the ‘core modelling’ and therefore produces slightly different aggregate results.
www.TheCIE.com.au
114 Decision Regulation Impact Statement

Hotel
For hotels, most of the benefits and costs can be attributed to the services components of the code (table ). The new façade requirements generate cost savings and also contribute to energy savings.
088B0856 Services/façade decomposition — hotelSydney Melbourne Brisbane Adelaide Perth
$ per m2 $ per m2 $ per m2 $ per m2 $ per m2
Services
Benefits 62.62 80.97 68.48 57.71 60.34Costs - 13.00 - 2.36 - 1.36 - 13.00 - 13.00Net benefits/costs 49.61 78.61 67.12 44.71 47.34
Façade
Benefits 12.00 3.81 19.36 10.58 10.67Costs 8.02 3.12 - 0.55 8.02 8.02Net benefits/costs 20.02 6.93 18.80 18.60 18.69Total net benefits/costs 69.63 85.54 85.92 63.31 66.03
Note: Net impacts include the private benefits and costs to building owners/tenants and the global benefits from reduced GHG emissions. Costs and benefits expressed in net present value terms over the assumed 40 year life of the building, using a discount rate of 7 per cent. Benefit estimates are based on future energy price (and GHG emission) profiles from 2019.Source: CIE based on EA modelling.
Office building
In the office building archetype, the proposed services requirements are estimated to generate most of the energy savings, which tend to be smaller than the other building archetypes.■ The additional cost of the services requirements tend to be relatively
high in Climate Zone 6, such that the net benefit of these requirements are small in Melbourne.
■ By contrast, the additional costs are relatively small in Climate Zone 2 (Brisbane).
The façade requirements also generate relatively modest benefits across all cities.■ The additional cost of complying with the façade requirements are
estimated to be negligible in most cities.■ By contrast, the revised code is estimated to generate significant cost
savings in Melbourne.
www.TheCIE.com.au
Decision Regulation Impact Statement 115

088B0857 Services/façade decomposition — office buildingSydney Melbourne Brisbane Adelaide Perth
$ per m2 $ per m2 $ per m2 $ per m2 $ per m2
Services
Benefits 25.18 15.64 22.90 22.72 23.34Costs - 10.36 - 15.20 - 1.79 - 10.36 - 10.36Net benefits/costs 14.83 0.44 21.11 12.36 12.99
Façade
Benefits 2.54 4.76 6.02 1.45 0.78Costs - 0.75 9.84 - 1.70 - 0.75 - 0.75Net benefits/costs 1.78 14.60 4.32 0.69 0.02Total net benefits/costs 16.61 15.04 25.43 13.05 13.01
Note: Net impacts include the private benefits and costs to building owners/tenants and the global benefits from reduced GHG emissions. Costs and benefits expressed in net present value terms over the assumed 40 year life of the building, using a discount rate of 7 per cent. Benefit estimates are based on future energy price (and GHG emission) profiles from 2019.Source: CIE based on EA modelling.
Retail
For the retail building archetype, EA modelling suggests that more stringent minimum standards for services deliver large net benefits at minimal additional cost across all cities (table ).By contrast, the revised façade requirements are estimated to increase energy consumption, as well as imposing modest additional costs.
088B0858 Services/façade decomposition — retail buildingSydney Melbourne Brisbane Adelaide Perth
$ per m2 $ per m2 $ per m2 $ per m2 $ per m2
Services
Benefits 107.92 100.21 78.18 98.89 102.93Costs - 3.83 - 7.88 - 3.18 - 3.83 - 3.83Net benefits/costs 104.08 92.33 75.00 95.06 99.10
Façade
Benefits - 8.45 - 19.37 - 4.46 - 5.51 - 3.88Costs - 4.58 - 3.67 - 2.40 - 4.58 - 4.58Net benefits/costs - 13.03 - 23.04 - 6.85 - 10.09 - 8.46Total net benefits/costs 91.05 69.29 68.14 84.97 90.64
Note: Net impacts include the private benefits and costs to building owners/tenants and the global benefits from reduced GHG emissions. Costs and benefits expressed in net present value terms over the assumed 40 year life of the building, using a discount rate of 7 per cent. Benefit estimates are based on future energy price (and GHG emission) profiles from 2019.
www.TheCIE.com.au
116 Decision Regulation Impact Statement

Source: CIE based on EA modelling.
Healthcare
For the healthcare building archetype, the new services requirements are estimated to deliver energy saving benefits with modest additional costs across all cities (table ).The costs and benefits of the new façade requirements are generally relatively small across most Climate Zones. Nevertheless, the façade requirements are estimated to impose a net cost in all cities except Brisbane.In Melbourne, the façade requirements are estimated to increase energy consumption significantly. This is the main factor driving an overall net cost for this building archetype.
088B0859 Services/façade decomposition — healthcare buildingSydney Melbourne Brisbane Adelaide Perth
$ per m2 $ per m2 $ per m2 $ per m2 $ per m2
Services
Benefits 31.66 31.08 40.76 28.63 29.49Costs - 10.99 - 20.38 - 10.10 - 10.99 - 10.99Net benefits/costs 20.67 10.70 30.66 17.64 18.50
Façade
Benefits 0.56 - 21.22 4.16 0.95 1.35Costs - 5.35 - 6.23 - 1.15 - 5.35 - 5.35Net benefits/costs - 4.79 - 27.45 3.01 - 4.40 - 4.00Total net benefits/costs 15.88 - 16.74 33.67 13.24 14.50
Note: Net impacts include the private benefits and costs to building owners/tenants and the global benefits from reduced GHG emissions. Costs and benefits expressed in net present value terms over the assumed 40 year life of the building, using a discount rate of 7 per cent. Benefit estimates are based on future energy price (and GHG emission) profiles from 2019.Source: CIE based on EA modelling.
School
For the school building archetype, the proposed services requirements are estimated to deliver large benefits associated with energy savings, with only a small increase in costs (table ).The impact of the change to the façade requirements vary across Climate Zones, but the modelling suggests small net costs in Sydney, Adelaide and Perth and small net benefits in Melbourne and Brisbane.
www.TheCIE.com.au
Decision Regulation Impact Statement 117

■ In all cities except Brisbane, the new façade requirements are estimated to increase energy consumption, partly offsetting the large energy savings from the services requirements.
■ In all cities except Melbourne, the façade requirements are also estimated to increase costs slightly. In Melbourne, the façade requirements are estimated to result in some cost savings.
088B0860 Services/façade decomposition — schoolSydney Melbourne Brisbane Adelaide Perth
$ per m2 $ per m2 $ per m2 $ per m2 $ per m2
Services
Benefits 68.52 88.41 112.43 58.43 57.20Costs - 10.94 - 8.48 - 10.21 - 10.94 - 10.94Net benefits/costs 57.58 79.93 102.23 47.49 46.26
Façade
Benefits - 4.76 - 10.56 7.37 - 2.89 - 1.79Costs - 7.26 0.68 - 10.54 - 7.26 - 7.26Net benefits/costs - 12.02 - 9.88 - 3.17 - 10.14 - 9.04Total net benefits/costs 45.56 70.06 99.06 37.34 37.22
Note: Net impacts include the private benefits and costs to building owners/tenants and the global benefits from reduced GHG emissions. Costs and benefits expressed in net present value terms over the assumed 40 year life of the building, using a discount rate of 7 per cent. Benefit estimates are based on future energy price (and GHG emission) profiles from 2019.Source: CIE based on EA modelling.
Aggregating benefits and costsCost and benefit estimates on a square metre basis are applied to the construction profile shown above and then aggregated up to the state and national level. Some commercial buildings, such as warehouses, factories and aged care facilities were not explicitly modelled.
■ Many warehouses and factories are not air-conditioned and have low WWRs, so many of the proposed changes are less likely to affect these buildings. Changes to lighting requirements may be relevant to these buildings; however, due to the LED uptake assumptions, the proposed changes will have little impact.
www.TheCIE.com.au
118 Decision Regulation Impact Statement

■ For aged care facilities, we apply the results for the modelled healthcare building.
Based on the modelled outcomes discussed above, the CBA results under each of the realisation scenarios are shown in table .■ Even under the low realisation scenario (where only 50 per cent of
modelled energy savings are assumed to be achieved in practice, based on the observed relationship between modelled and actual GHG emissions from the sample of Green Star rated buildings), the proposed changes to the NCC are estimated to deliver significant net benefits to the community in addition to the global benefits associated with reduced GHG emissions. – Nationwide, net benefits to the community under this scenario are
estimated at around $769 million in net present value terms, using a discount rate of 7 per cent.
– In addition, global benefits from reduced GHG emissions are estimated at around $369 million.
■ Under the medium realisation scenario (where 75 per cent of modelled energy savings are assumed to be achieved in practice, based on the observed relationship between modelled and actual GHG emissions from the sample of Green Star rated buildings with several outliers removed from the sample):– net benefits to the community are estimated at around $1.4 billion
nationally– global benefits from reduced GHG emissions are estimated at around
$553 million.■ Under the high realisation scenario, modelled energy savings are
assumed to be fully realised. Under this scenario:– net benefits to the community are estimated at around $2.1 billion– global benefits from reduced GHG emissions are estimated at around
$738 million.
088B0861 Net benefit/costs of proposed changes to the NCCNSW Vic Qld SA WA Tas ACT NT Total
$ million
$ million
$ million
$ million
$ million
$ million
$ million
$ million
$ million
Low realisation scenario
Lifetime energy savings 352.8 301.2 339.9 77.6 186.4 12.0 17.4 23.5 1 310.8Compliance costs - 172.3 - 121.5 - 93.4 - 36.9 - 81.5 - 9.4 - 10.8 - 2.4 - 528.2Administrative cost savings 1.2 1.0 0.8 0.2 0.5 0.0 0.2 0.0 3.9
www.TheCIE.com.au
Decision Regulation Impact Statement 119

NSW Vic Qld SA WA Tas ACT NT Total
$ million
$ million
$ million
$ million
$ million
$ million
$ million
$ million
$ million
Industry re-training costs -5.6 -4.9 -2.9 -0.9 -1.9 -0.2 -0.3 -0.1 -16.7Government implementation costs -0.1 -0.1 -0.1 0.0 0.0 0.0 0.0 0.0 -0.4Net impact on community 176.0 175.6 244.5 39.9 103.5 2.4 6.6 21.0 769.4
GHG savingsa 97.7 101.8 99.9 14.2 41.9 1.6 6.0 5.7 368.9
Total impactsb (NPV) 273.7 277.4 344.4 54.1 145.4 4.0 12.6 26.7 1 138.3
Medium realisation scenario
Industry impacts
Lifetime energy savings 529.1 451.8 509.9 116.4 279.6 18.1 26.2 35.2 1 966.2Compliance costs - 172.3 - 121.5 - 93.4 - 36.9 - 81.5 - 9.4 - 10.8 - 2.4 - 528.2Administrative cost savings 1.2 1.0 0.8 0.2 0.5 0.0 0.2 0.0 3.9Industry retraining costs -5.6 -4.9 -2.9 -0.9 -1.9 -0.2 -0.3 -0.1 -16.7Government implementation costs -0.1 -0.1 -0.1 0.0 0.0 0.0 0.0 0.0 -0.4Net impact on community 352.4 326.2 414.5 78.7 196.7 8.4 15.3 32.7 1 424.8
GHG savingsa 146.6 152.6 149.9 21.4 62.9 2.4 9.1 8.5 553.3
Total impactsb
(NPV) 498.9 478.9 564.3 100.0 259.6 10.8 24.4 41.3 1 978.1
High realisation scenario
Lifetime energy savings 705.5 602.4 679.9 155.1 372.8 24.1 34.9 47.0 2 621.7Compliance costs - 172.3 - 121.5 - 93.4 - 36.9 - 81.5 - 9.4 - 10.8 - 2.4 - 528.2Administrative cost savings 1.2 1.0 0.8 0.2 0.5 0.0 0.2 0.0 3.9Industry retraining costs -5.6 -4.9 -2.9 -0.9 -1.9 -0.2 -0.3 -0.1 -16.7Government implementation costs -0.1 -0.1 -0.1 0.0 0.0 0.0 0.0 0.0 -0.4Net impact on community 528.8 476.8 584.4 117.5 289.9 14.4 24.0 44.5 2 080.2
GHG savingsa 195.4 203.5 199.8 28.5 83.9 3.2 12.1 11.4 737.8
Total impactsb
(NPV) 724.2 680.3 784.2 146.0 373.8 17.6 36.1 55.8 2 818.0
www.TheCIE.com.au
120 Decision Regulation Impact Statement

a GHG savings are global benefits. b Includes the global benefits from reduced GHG emissions.Note: Costs and benefits estimated in present value terms over the 40 year life of all commercial building construction over a ten year regulatory period, using a discount rate of 7 per cent. Benefits are represented as a positive number; costs are represented as a negative number. Net social benefits include net private benefits and public benefits from greenhouse gas emissionsSource: CIE estimates based on EA modelling.
The community (i.e. including the costs and benefits to the Australian community, but excluding the global benefits from reduced GHG emissions) and total (including all costs and benefits to the Australian community, as well as the global benefits from reduced GHG emissions) benefit-cost ratios (BCRs) are reported in table .■ Under the low realisation scenario, the community BCR is estimated at
around 2.5 at the national level, while the total BCR is estimated at around 3.2.
■ Under the medium realisation scenario, the community BCR is estimated at around 3.7. The total BCR is estimated at around 4.8.
■ Under the high realisation scenario, the community BCR is estimated at around 5.0. The total BCR is estimated at around 6.4.
Across states and territories, the benefit-cost ratios (BCRs) vary considerably. Nevertheless, they exceed 1 (indicating the benefits outweigh the costs) in all jurisdictions in all of the realisation scenarios. The BCRs are:■ highest in the Northern Territory and Queensland (i.e. warmer
climates).■ lowest in Tasmania, which has a cooler climate, relatively low energy
prices and low emissions intensity.
088B0862 Benefit-cost ratiosNSW Vic Qld SA WA Tas ACT NT Total
Low realisation scenario
Community BCRa 2.0 2.4 3.5 2.1 2.2 1.2 1.6 9.4 2.4Total BCRb 2.5 3.2 4.6 2.4 2.7 1.4 2.1 11.7 3.1
Medium realisation scenario
Community BCRa 3.0 3.6 5.3 3.1 3.4 1.9 2.4 14.1 3.6Total BCRb 3.8 4.8 6.9 3.6 4.1 2.1 3.2 17.5 4.6
High realisation scenario
Community BCRa 4.0 4.8 7.1 4.1 4.5 2.5 3.2 18.8 4.8Total BCRb 5.1 6.4 9.1 4.9 5.5 2.8 4.3 23.4 6.2
www.TheCIE.com.au
Decision Regulation Impact Statement 121

a Excludes the global benefits from reduced GHG emissions. b Includes the global benefits from reduced GHG emissions.Notes: Costs and benefits estimated over the 40 year life of all commercial building construction over a ten year regulatory period, using a discount rate of 7 per cent. Source: CIE estimates based on EA modelling.
Results by building typeAlthough in aggregate these results suggest a clear (and significant) net benefit from the proposed changes to the NCC, there is significant variation across states, Climate Zones and building types. Table shows aggregate net benefit/cost estimates (including the global benefits from reduced GHG emissions) by state and building type.The net benefits are largely driven by retail buildings and schools.■ For retail buildings, net benefits are relatively large due to both
relatively high net benefits per square metre of floor area across most Climate Zones and retail is estimated to be a relatively high proportion of new construction.
■ For schools, high aggregate net benefits relative to other building types is mostly driven by very high estimated energy savings per square metre of floor space.
While there is estimated to be a net benefit for most building types, there is estimated to be a net cost, albeit marginal, for:■ health-care buildings (9aC) in Climate Zones 6 and 7 and possibly in
Climate Zones 4 and 5 (depending on the extent to which modelled energy savings are realised in practice; and
■ retail buildings in Climate Zone 7.There is also variation within building types across jurisdictions and Climate Zones (see appendix I for further details).
088B0863 Net benefit/costs of proposed changes to the NCC by building type
NSW Vic Qld SA WA Tas ACT NT Total
$ million
$ million
$ million
$ million
$ million
$ million
$ million
$ million
$ million
Low scenario
Hotel 27.1 30.6 20.9 4.9 7.7 2.9 1.6 2.2 97.9Office 17.2 15.0 23.6 0.7 1.7 0.7 4.5 0.4 63.8Retail 145.7 132.5 150.9 39.5 112.3 - 4.4 - 4.1 9.9 582.2Healthcare - 7.8 - 13.1 10.0 - 0.7 0.1 - 1.2 - 1.0 0.8 - 13.0School 103.0 130.1 135.6 11.7 25.6 7.5 12.5 13.2 439.2Aged care - 5.8 - 12.7 6.5 - 1.1 - 0.1 - 1.2 - 0.6 0.3 - 14.8Other impactsa - 5.7 - 5.0 - 3.0 - 0.9 - 1.9 - 0.2 - 0.3 - 0.1 - 17.1
www.TheCIE.com.au
122 Decision Regulation Impact Statement

NSW Vic Qld SA WA Tas ACT NT Total
$ million
$ million
$ million
$ million
$ million
$ million
$ million
$ million
$ million
Net benefit/cost 273.7 277.4 344.4 54.1 145.4 4.0 12.6 26.7 1 138.3
Medium scenario
Hotel 41.4 45.6 31.4 7.6 12.0 3.8 2.2 3.0 147.1Office 46.0 28.9 38.3 3.9 8.6 1.1 7.4 1.1 135.4Retail 240.7 221.2 235.2 63.8 177.5 - 4.2 - 4.0 15.0 945.3Healthcare - 3.9 - 11.3 18.6 0.4 3.5 - 1.0 - 0.8 1.5 7.0School 181.7 210.6 231.4 25.1 57.9 12.3 20.3 20.4 759.6Aged care - 1.3 - 11.1 12.3 0.1 1.9 - 1.0 - 0.5 0.5 0.9Other impactsa - 5.7 - 5.0 - 3.0 - 0.9 - 1.9 - 0.2 - 0.3 - 0.1 - 17.1Net benefit/cost 498.9 478.9 564.3 100.0 259.6 10.8 24.4 41.3 1 978.1
High scenario
Hotel 55.7 60.5 42.0 10.3 16.4 4.8 2.8 3.7 196.3Office 74.8 42.8 53.1 7.0 15.5 1.6 10.3 1.9 207.0Retail 335.8 310.0 319.5 88.1 242.7 - 4.0 - 3.9 20.1 1 308.4Healthcare 0.0 - 9.6 27.2 1.6 7.0 - 0.8 - 0.6 2.1 26.9School 260.3 291.1 327.2 38.4 90.1 17.1 28.1 27.5 1 079.9Aged care 3.2 - 9.4 18.1 1.4 3.9 - 0.8 - 0.4 0.7 16.6Other impactsa - 5.7 - 5.0 - 3.0 - 0.9 - 1.9 - 0.2 - 0.3 - 0.1 - 17.1Net benefit/cost 724.2 680.3 784.2 146.0 373.8 17.6 36.1 55.8 2 818.0
a Includes impacts that are not attributable to particular building types.Note: Net impacts include the private benefits and costs to building owners/tenants and the global benefits from reduced GHG emissions. Costs and benefits estimated over the 40 year life of commercial building construction over a ten year regulatory period, using a discount rate of 7 per cent. Benefits are represented as a positive number; costs are represented as a negative number.Source: CIE estimates based on EA modelling.
Furthermore, there is likely to be significant variation across individual buildings within building types. We previously cited evidence showing that the relationship between modelled and actual energy savings was relatively weak based on a sample of Green Star buildings. As well as indicating that modelled energy savings were unlikely to be fully realised on average, the data also suggested significant variation around the average (as indicated by relatively high standard errors and relatively wide confidence intervals around the coefficient estimates). This suggests that those buildings with below average realisation rates, but the same costs may incur a net cost even when on average buildings in that class receive a net benefit from the proposed changes to the NCC.From the relationship between modelled and actual outcomes, we can estimate the probability that the proposed changes to the NCC will result in a net cost for each building type/Climate Zone/state combination under the low medium and high realisation scenarios.
www.TheCIE.com.au
Decision Regulation Impact Statement 123

■ Based on the Green Star data, we estimated that only around 50 per cent of modelled savings were realised (which we used as the low scenario), with a standard error around this estimate of around 0.34. We therefore assume that the realisation rate is normally distributed, with a mean of 0.50 and a standard deviation of 0.34.
■ When several outliers that are potentially distorting the results of the above analysis were removed from the sample, we estimated a mean realisation rate of 0.75, with a standard error of 0.15. For the medium scenario, we therefore assume a normally distributed realisation rate with a mean of 0.75 and a standard deviation of 0.15.
■ Under the high scenario, we assumed modelled energy savings are achieved on average. Under this scenario we assume the realisation rate is normally distributed with a mean of 1 and standard deviation of 0.15 (as per the medium scenario).
This analysis suggests that even though the results suggest significant net benefits in aggregate, a significant proportion of construction activity is likely to incur a net cost under the DTS, particularly under the low scenario.
088B0864 Estimated proportion of construction activity incurring a net cost
Low scenario Medium scenario High scenario
Per cent Per cent Per cent
NSW 27.4 5.5 5.0Victoria 23.1 9.5 9.4Queensland 13.0 0.0 0.0South Australia 28.8 3.7 2.3Western Australia 26.9 1.4 0.2Tasmania 53.5 47.7 47.7ACT 33.6 24.3 24.3Northern Territory 13.9 0.2 0.0Total 23.7 5.9 5.4
Source: CIE estimates.
Regulatory burdenUnder OBPR’s requirements, RISs must report the regulatory burden of a policy proposal on businesses using the Regulatory Burden Measure (RBM) framework. The RBM framework covers:■ administrative costs■ substantive compliance costs■ delay costs.
www.TheCIE.com.au
124 Decision Regulation Impact Statement

Costs associated with the proposed changes that fall under the RBM framework include:■ the incremental costs associated with meeting the revised minimum
standards incurred by privately owned buildings (as costs imposed on governments are excluded under the RBM framework, the additional construction costs incurred by government-owned building must be excluded from the costs estimated above)
■ retraining costs incurred by industry■ these costs are partly offset by administrative cost savings associated
with additional Verification Methods.To exclude additional construction costs incurred by government-owned buildings, we estimated the private ownership share for office, education and healthcare buildings by state and territory as follows.■ Office building — we used the government owned and leased office
floor space, and occupation data in Australian Government Office Occupancy Report 201764 and ABS data on public sector employment (ABS Cat.No.6248.0.55.002) to estimate the office floor spaces owned by Commonwealth, state and territory, and local governments in 2017 and compared them to the total office floor space in 2017 to estimate the private ownership share;
■ Education buildings — we used the ABS data on the number of full time equivalent (FTE) students attending government and non-government schools (ABS Cat.No.4221.0) as a proxy to split the building ownership; and
■ Health buildings — no data available for state and territory level breakdown between private and public hospital beds. As a result, we used the national hospital beds data from Australian Institute of Health and Welfare (AIHW)65 as a proxy to split the ownership of healthcare buildings and assumed the same share for all states and territories.
Table reports the share of non-government owned buildings. On average non-government owned buildings account for more than three quarters of office building, about one third of education and health buildings.
64 Australian Government Department of Finance 2018, Australian Government Office Occupancy Report 2017: Annual KPIs, available at https://www.finance.gov.au/property/property/occupancy-report-2017/annual-kpis/
65 Australian Institute of Health and Welfare 2018, Australia’s hospitals 2016-17: At a glance, Health services series no.85, June 2018, Australian Institute of Health and Welfare, Canberra. Available at https://www.aihw.gov.au/getmedia/d5f4d211-ace3-48b9-9860-c4489ddf2c35/aihw-hse-204.pdf.aspx?inline=true
www.TheCIE.com.au
Decision Regulation Impact Statement 125

088B0865 Share of non-government owned buildingsOffice Education Health
Per cent Per cent Per cent
NSW 84.63 34.54 34.81
Vic 51.00 36.51 34.81 Qld 78.88 32.85 34.81 SA 71.87 35.05 34.81 WA 77.12 33.11 34.81 Tas 37.84 30.07 34.81 NT 64.95 26.91 34.81 ACT 80.48 39.67 34.81 Australia 77.36 34.47 34.81
Source: CIE estimates
The annual regulatory burden is estimated by multiplying the estimated cost per square metre of floor space (see table above) for each building type multiplied by projected commercial building additions and major refurbishments (see appendix E for details) and the private ownership share as shown in table . This is then averaged over the ten-year regulatory period (as required by OBPR).One-off industry re-training costs are also divided by ten (reflecting the ten year regulatory period) to obtain an annual cost estimate, consistent with OBPR Guidelines.The average additional regulatory burden on businesses from the proposed changes to the NCC is around $40.5 million per year (table ). The Commonwealths share of this regulatory burden is $4.5 million or 1/9th of the regulatory burden.
088B0866 Annual regulatory burdenCompliance
costsIndustry
training costsAdministrativ
e cost savings
Total
$ million $ million $ million $ million
New South Wales - 14.06 - 0.49 0.16 - 14.39Victoria - 9.19 - 0.42 0.13 - 9.47Queensland - 5.96 - 0.36 0.11 - 6.20South Australia - 2.69 - 0.10 0.02 - 2.76Western Australia - 5.94 - 0.22 0.06 - 6.10Tasmania - 0.70 - 0.03 0.00 - 0.73Australian Capital Territory - 0.92 - 0.05 0.03 - 0.94Northern Territory - 0.10 - 0.02 0.00 - 0.11Total - 39.54 - 1.67 0.52 - 40.69
Note: Estimates are averaged over the ten year regulatory period (undiscounted).Source: CIE estimates.
www.TheCIE.com.au
126 Decision Regulation Impact Statement

Sensitivity analysisSome studies have suggested that modelling failures can make the energy efficiency gap appear much larger than it is in reality (see appendix A for details). It is therefore crucial to test the robustness of the findings to alternative input assumptions.
Compliance costsA key finding from the EA modelling is that a significant improvement in energy performance can be achieved at a relatively modest additional cost across most building types and Climate Zones.
Alternative insulation cost assumptions
EA provided another estimate of insulation cost change by assuming there is an upper limit on the thickness of insulation materials. This assumption, in effect, lowers the construction costs for NCC 2016 buildings in some cases and thus increases the incremental costs moving from NCC 2016 to NCC 2019.
088B0867 Net benefits under alternative insulation cost scenarioNSW Vic Qld SA WA Tas ACT NT Total
NPV of net benefits ($ million)
Low scenario 266.9 271.6 331.8 52.7 142.0 3.6 12.2 26.0
1 106.8
Medium scenario 492.1 473.0 551.7 98.6 256.2 10.4 23.9 40.6
1 946.6
High scenario 717.4 674.5 771.6 144.5 370.3 17.2 35.7 55.2
2 786.5
Benefit-cost ratio
Low scenario 2.4 3.1 4.0 2.3 2.6 1.4 2.1 9.2 2.9Medium scenario 3.7 4.6 6.1 3.5 4.0 2.0 3.1 13.8 4.4High scenario 4.9 6.1 8.1 4.7 5.3 2.7 4.1 18.4 5.8
Note: Net impacts include the private benefits and costs to building owners/tenants and the global benefits from reduced GHG emissions. Costs and benefits estimated over the 40 year life of commercial building construction over a ten year regulatory period, using a discount rate of 7 per cent.Source: CIE estimates based on EA modelling
This change in insulation construction costs does not affect the CBA results very much – the proposed changes still generate positive net benefits for all cases which fall only slightly.
Break-even analysis
As outlined in appendix A, there is some evidence that CBAs of energy efficiency measures frequently understate costs.
www.TheCIE.com.au
Decision Regulation Impact Statement 127

Table shows break-even additional construction costs for the low, medium and high realisation scenarios. It uses the simplifying assumption that the additional construction costs apply uniformly across all building types. The break-even construction costs indicate the additional construction cost that would need to be incurred to achieve compliance with the proposed changes (relative to the baseline) for a net benefit of zero (or a BCR of 1).■ If actual additional construction costs turn out to be higher than the
break-even point, proposed changes to the NCC would deliver a net cost.
■ On the other hand, if actual additional construction costs turn out to be lower than the break-even point (as suggested by EA modelling), the proposed changes to the NCC would deliver a net benefit.
The break-even analysis suggests that if the proposed changes to NCC increased construction costs by $32 per m2 across all building types, there would be a net cost under the low realisation scenario. This appears to be well within a plausible range suggested by other studies such as pitt&sherry (2016).
www.TheCIE.com.au
128 Decision Regulation Impact Statement

088B0868 Break-even additional construction costBreak-even construction cost
$ per m2
Low scenario 32.41Medium scenario 48.72High scenario 65.04
Note: Net impacts include the private benefits and costs to building owners/tenants and the global benefits from reduced GHG emissions. Costs and benefits estimated over the 40 year life of commercial building construction over a ten year regulatory period, using a discount rate of 7 per cent.Source: CIE estimates.
Energy pricesAnother key uncertainty relates to energy prices. Although future energy price assumptions are based on credible projections, any forecasts have significant uncertainty. To test the sensitivity to electricity prices (the results will be particularly sensitive to electricity prices), we use:■ EA’s large user series as the low alternative assumption; and■ EA’s small user series as the high alternative assumption (see appendix
H).In general, the prices series are not sufficiently different to make a significant impact on the overall results (table ).
088B0869 Net benefit/costs under various energy price estimatesNSW Vic Qld SA WA Tas ACT NT Total
$ million
$ million
$ million
$ million
$ million
$ million
$ million
$ million
$ million
Low realisation scenario
Low 223.6 249.4 331.7 48.4 119.6 3.5 11.0 24.4
1 011.6
High 323.8 305.4 357.0 59.9 171.3 4.5 14.3 28.9
1 265.0
Medium realisation scenario
Low 423.7 436.9 545.4 91.5 220.8 10.1 21.9 37.9
1 788.1
High 574.1 520.8 583.3 108.6 298.4 11.5 26.8 44.6
2 168.2
High realisation scenario
Low 623.9 624.3 759.0 134.5 322.0 16.7 32.8 51.3
2 564.6
High 824.4 736.3 809.5 157.4 425.5 18.6 39.4 60.3
3 071.4
www.TheCIE.com.au
Decision Regulation Impact Statement 129

Note: Net impacts include the private benefits and costs to building owners/tenants and the global benefits from reduced GHG emissions. Costs and benefits estimated over 40 year life of commercial building construction over a ten year regulatory period, using a discount rate of 7 per cent.Source: CIE estimates based on EA modelling.
Social cost of carbonWe also test the sensitivity of the results to alternative social cost of carbon (SCC) series. The US Government recently published four SCC series (see appendix H for details). The estimated net benefits using each of the SCC series is shown in table .In general, the results are relatively insensitive to the SCC series, largely because the GHG savings are a relatively small share of the overall benefits. That is, the central case CBA suggests the private benefits outweigh the private costs even without the public benefits associated with reduced GHG emissions.
088B0870 Net benefit/costs under various social cost of carbon seriesNSW Vic Qld SA WA Tas ACT NT Total
$ million
$ million
$ million
$ million
$ million
$ million
$ million
$ million
$ million
Low realisation scenario
Low SCC 208.2 209.2 277.4 44.6 117.3 2.9 8.6 22.9 891.1High SCC
273.7 277.4 344.4 54.1 145.4 4.0 12.6 26.71
138.3High impact
472.2 484.1 547.3 83.1 230.6 7.3 24.9 38.21
887.7
Medium realisation scenario
Low SCC 400.7 376.6 463.9 85.7 217.5 9.2 18.3 35.5
1 607.4
High SCC 562.7 545.3 629.6 109.3 286.9 11.8 28.3 45.0
2 219.0
High impact 796.7 789.0 868.7 143.5 387.4 15.7 42.8 58.6
3 102.3
High realisation scenario
Low SCC 593.2 543.9 650.3 126.9 317.6 15.5 28.0 48.2
2 323.6
High SCC 809.2 768.9 871.2 158.4 410.2 19.0 41.3 60.8
3 139.1
High impact 1 121.2
1 093.8
1 190.1 203.8 544.2 24.2 60.6 79.0
4 316.9
Note: Net impacts include the private benefits and costs to building owners/tenants and the global benefits from reduced GHG emissions. Costs and benefits estimated over the 40 year life of commercial building construction over a ten year regulatory period, using a discount rate of 7 per cent.Source: CIE estimates based on EA modelling.
www.TheCIE.com.au
130 Decision Regulation Impact Statement

Discount ratesAs required by OBPR guidelines, we estimate the net benefits of the proposed changes to the NCC under alternative discount rates of 3 per cent and 10 per cent (table ).The CBA results are relatively sensitive to the chosen discount rate, due to the long stream of future benefits (assumed to be 40 years for building construction and 25 years for services).■ Lower discount rates produce higher net benefit estimates, as the
benefits of future energy savings and GHG emissions are discounted to a lesser extent.
■ On the other hand, higher discount rates produce lower net benefit estimates, as the benefits of future bill savings and GHG emissions are discounted more heavily.
The proposed changes are estimated to deliver a net benefit (and a net benefit to all states and territories) under all discount rates (although the benefits are close to costs for Tasmania under the low scenario when a 10 per cent discount rate is used) (table ).
088B0871 Net benefit/costs under various discount ratesNSW Vic Qld SA WA Tas ACT NT Total
$ million
$ million
$ million
$ million
$ million
$ million
$ million
$ million
$ million
Low realisation scenario
3% discount rate 684.0 649.9 753.7 139.3 355.9 16.1 33.9 54.8
2 687.7
10% discount rate 142.7 157.1 210.2 27.3 78.2 0.4 5.9 17.3 639.1
Medium realisation scenario
3% discount rate 1 129.2
1 048.3
1 186.2 230.9 582.5 29.8 57.3 83.7
4 347.8
10% discount rate 293.7 292.1 358.3 57.9 154.5 4.9 13.8 27.1
1 202.2
High realisation scenario
3% discount rate 1 574.3
1 446.7
1 618.6 322.5 809.1 43.5 80.6 112.6
6 008.0
10% discount rate 444.7 427.1 506.4 88.5 230.8 9.5 21.6 36.8
1 765.4
Note: Net impacts include the private benefits and costs to building owners/tenants and the global benefits from reduced GHG emissions. Costs and benefits estimated over 40 years life of commercial building construction over a ten-year regulatory period, using a discount rate as shown in the table.Source: CIE estimates based on EA modelling.
www.TheCIE.com.au
Decision Regulation Impact Statement 131

High level assessment of the non-regulatory optionThe alternative option considered involves converting the proposed changes to the NCC into a non-regulatory handbook for industry to adopt. The handbook could potentially deliver better energy efficiency outcomes in commercial buildings by encouraging industry to make more energy efficient decisions in their own best interests.Options that encourage the voluntary uptake of energy efficiency opportunities have the advantage of reducing the risk of regulatory failure, such as forcing some buildings to over-invest in energy efficiency.The impact of this option would depend on the extent to which the handbook would encourage industry to improve the energy efficiency of commercial buildings. There is some evidence that measures focusing on information provision can encourage voluntary uptake of energy efficiency opportunities.■ Data reported by NABERS shows that on average, buildings with
multiple NABERS ratings reduce energy consumption and GHG emissions over time (chart ).
■ A review found that the CBD program had encouraged greater uptake of energy efficiency opportunities and had delivered net benefits to the community of around $44 million in net present value terms in the period between 2010 and 2014.66
088A0872 Change in energy consumption and GHG emissions from first NABERS rating
-50-45-40-35-30-25-20-15-10-50
2nd 3rd 4th 5th 6th 7th 8th 9th 10th 11th 12th
Per c
ent
Change in energy consumption Change in GHG emissions
Data source: NABERS Annual Report, 2017/18, p. 25.
66 See ACIL Allen Consulting, Commercial Building Disclosure: Program Review, Report to the Department of Industry and Science, March 2015, p. ii.
www.TheCIE.com.au
132 Decision Regulation Impact Statement

That said, the voluntary uptake of NABERS energy ratings has been mixed across sectors (chart ).■ Around 86 per cent of office floor space had a NABERS Energy rating in
2017/18. However, uptake has to a significant extent been driven by policy requirements.– Market uptake of NABERS Energy ratings for office buildings was
initially limited. – The introduction of requirements for all government owned and
leased office spaces first by the NSW Government (in 2003-04) and then the Commonwealth Government (in 2006-07) increased the number of ratings. It is understood that Victoria, South Australia, ACT and Tasmania have also since introduced a similar requirements.
– The CBD Program has been the key driver of uptake.… There was a sharp increase in the number of office building energy
ratings following the introduction of the CBD Program in 2009-10.… The number of office building energy ratings also increased in
2017-18, when the threshold was reduced from 2000 m2 to 1000 m2.■ Around 46 per cent of shopping centres with a floor area larger than
15 000 m2 had a NABERS Energy rating in 2017-18.■ A NABERS rating tool for hotels has been available since 2008-09;
however, uptake has been limited and has declined in recent years.■ NABERS rating tools for public hospitals and data centres are relatively
new.
088A0873 Number of unique buildings and tenancies with a NABERS rating
0
500
1000
1500
2000
2500
1998-99 2001-02 2004-05 2007-08 2010-11 2013-14 2016-17
Num
ber
Datacentre
Publichospital
Hotel
Shoppingcentre
Office
NSW GreenhousePerformance of Government Office Buildings
Commonwealth Energy Efficiency in Government Operations
CBD for office buildings over 2000m2
CBD threshold reduce to 1000m2
Data source: NABERS Annual Report, 2017/18, p. 22.
Disclosure requirements can be effective because they directly address information asymmetries/split incentives, particularly in markets where
www.TheCIE.com.au
Decision Regulation Impact Statement 133

leasing arrangements are prevalent. However, the potential expansion of the CBD program to other building types is being considered through a separate process and is not an option considered under this RIS.A handbook would effectively provide information in relation to the costs and benefits of energy efficiency options at the design and construction phase. This type of approach seeks to address market failures relating to the availability of information. However, the availability of information does not appear to be the main barrier preventing the uptake of privately cost-effective energy efficiency measures (see appendix A for further details). General information on the potential benefits of improving energy efficiency in commercial buildings is freely available from various sources, including:■ the Energy Efficiency Exchange, a Commonwealth Government
website;67 and■ case studies published by the Green Building Council of Australia
(GBCA) and others.More project-specific information is also commercially available from specialist consultants and energy efficiency modellers.This suggests that relevant information is already available, albeit at some cost (that relevant information may come at a cost is not necessarily a market failure). Rather, the main barrier preventing building owners from making privately optimal energy efficiency decisions seems to be bounded rationality and heuristic decision making (such as deferring to entrenched practices or building to NCC minimum requirements). That is, building owners and designers may not necessarily consider the available information on the full costs and benefits of energy efficiency options when making decisions.Developing a handbook from the research that underpinned the proposed changes does not specifically address the main barrier preventing businesses (and governments) from making privately beneficial energy efficiency decisions. It is therefore unlikely that this option would have much impact in driving improved energy performance.In addition, measures focusing on encouraging voluntary uptake do not address the GHG externality associated with energy consumption. Even if all building owners/designers made privately optimal energy efficiency designs, the incentive to under-invest in energy efficiency would remain under current energy policy settings.
67 Energy Exchange website, https://www.eex.gov.au/sectors/commercial-buildings, accessed 17 October 2017.
www.TheCIE.com.au
134 Decision Regulation Impact Statement

Assessment against the ‘competition test’Based on the above analysis, the proposed changes to the NCC is the option likely to deliver the largest net benefits to the community. As noted above, a limitation of the NCC as a policy mechanism for driving further energy efficiency improvements is that increasing the stringency of the minimum standards could restrict choice, and place a greater restriction on competition. Under COAG Guidelines, regulation should not restrict competition unless:■ it can be demonstrated that the benefits of the restriction to the
community as a whole outweigh the costs; and■ the objectives of the regulation can only be achieved by restricting
competition adopting the option that generates the greatest net benefit to the community.68
The proposed changes to the NCC clearly satisfy the first part of the ‘competition test’; the CBA suggests that the proposed changes to the NCC will deliver significant net benefits to the community.To satisfy the second part of the ‘competition test’, the RIS needs to establish whether improvements in the energy efficiency of commercial buildings can only be achieved by restricting competition and that proposed changes to the NCC generates the largest net benefit to the community.In this regard, there are other approaches to improving the energy efficiency of commercial buildings that do not restrict competition, such as measures to encourage industry to improve energy efficiency voluntarily. Given the challenges of setting a minimum standard that is optimal across all buildings, it is possible that non-regulatory options that encourage industry to adopt a more optimal energy efficiency design could achieve some (but not all) of the benefits, without the costs.This RIS considers a non-regulatory (voluntary) option, but finds it is unlikely to deliver significant net benefits if barrier to improved uptake of energy efficiency relate to the identified market failures. General information on the benefits of improved energy efficiency in commercial buildings is widely available from existing sources, while project-specific information is commercially available. The availability of relevant information is therefore unlikely to be the main factor preventing industry from making better energy efficiency decisions in their own best interests. Rather, the key market failure seems to relate to industry acting on the available information due to bounded rationality or heuristic decision-making. As such, the non-regulatory option does not appear to address the main market failure.
68 Council of Australian Governments, Best Practice Regulation: A Guide for Ministerial Councils and National Standard Setting Bodies, October 2007, pp. 12-13.
www.TheCIE.com.au
Decision Regulation Impact Statement 135

So while alternative approaches that do not restrict competition may to some extent improve energy efficiency, it is unlikely that voluntarily options would deliver improvements to the extent of changes to the NCC. It is generally considered that a regulatory approach has the potential to restrict competition or choice in materials or design. The proposed changes to the DTS provisions potentially negatively affect some suppliers or products by changing the thresholds at which products comply. However, the NCC is Performance based and established Verification Methods or measuring performance against the Performance Requirement enable flexibility in design choices to meet the targeted values. In this regard, the proposed changes to the NCC appears to satisfy the second part of the ‘competition test’.
Limitations of the analysisAs shown above, the modelling results suggest that the proposed changes to the NCC will deliver significant net benefits to the community, with the sensitivity testing suggesting that this finding is relatively robust to alternative assumptions. Nevertheless, it is important to acknowledge some of the key limitations of the analysis.
Representativeness of modelling resultsThe commercial buildings that would be built under the revised code will vary enormously by geometry, WWR, locational climate, occupancy patterns and a range of other factors.■ The modelling has attempted to capture some of this variation by
modelling buildings that are broadly intended to be representative of the main commercial building types (including geometry and WWR) in each Climate Zone (except Climate Zone 8).– This involved modelling 5 different buildings, across 7 Climate Zones
under 2 different codes (the current code and under the proposed changes) for a total of 70 individual building models.
– In addition, a variation of one of the buildings with a different WWR across each Climate Zone (an additional 14 building models) plus a variation based on the current façade requirements with services that comply with the proposed new requirements was completed for each building across 3 Climate Zones (and additional 15 building models).
■ The modelling has also made specific assumptions about the way building owners and designers will respond to changes.
Given the extent of the modelling task even for a relatively small number of building types, it is impractical (and probably not possible) to model all
www.TheCIE.com.au
136 Decision Regulation Impact Statement

of the possible variations in the commercial buildings that would be built under the revised code.The CBA effectively extrapolates the modelling results for the representative buildings across the entire building stock. The CBA results are therefore contingent on the modelled results for the representative buildings being broadly representative of the impacts across all new buildings.
BaselineAnother key uncertainty is the uptake of energy efficiency opportunities in the future in the absence of changes to the NCC (i.e. under the baseline scenario). The limited information available suggests that relatively few buildings are exceeding the current standard and where they are, they are not exceeding the current standard by much. There is also little information available on the technologies that are being implemented and the trade-offs to achieve compliance. For example, some buildings may be trading off more efficient services than required by the current code against a less efficient façade (or vice versa) through a Performance Solution.Our baseline effectively assumes that all buildings will adopt LED lighting, but the cheapest available compliant technology for all other building attributes. However, it is likely that some of the other highly cost-effective technologies would also be adopted under the existing code. In this regard, the decomposition analysis suggests that the BCRs for installing more efficient services are in some cases very high. These highly cost-effective technologies could plausibly be adopted in some new buildings, despite the presence of the various market failures and/or behaviour anomalies.If the baseline understates the uptake of energy efficiency opportunities, the CBA results will overstate the magnitude of the net benefits of the proposed changes to the NCC (see appendix A for further discussion) as energy efficiency improvements that would occur anyway are attributed to the code changes.
www.TheCIE.com.au
Decision Regulation Impact Statement 137

9 Implementation and review
Implementation of the proposed changes to the NCCAs a matter of policy, proposed changes to the NCC are released in advance of implementation to allow time for familiarisation and education and for industry to modify its practices to accommodate the changes. It is anticipated that State and Territory building administrations and industry organisations, in association with the ABCB, will conduct information and awareness raising practices. ABCB is developing a range of awareness raising materials (see table ). Handbooks and online training modules are being updated and new materials, including calculators, are high priorities that assist with interpretation of the measures aim to be available around February 2019, other lower priorities will be delivered around May 2019.If approved, the option would be included in the NCC’s DTS Provisions in NCC 2019 with jurisdiction’s regulations allowing for transition to new versions of the NCC, typically designs which are already approved or significantly progressed prior to adoption have no obligation to comply. A number of submissions to the Consultation RIS argued for the need for industry to be supported and transition to the new provisions. It should be noted that the NCC can only accommodate one set of technical provisions. Due to methodology change, there is no flexibility to retain the existing methodology which would require a duplication of provisions and methods, be complex and unworkable particularly for mixed use buildings. For performance pathways, stringency updates that underlie reference building schedules and performance quantification would be incompatible with existing methods, undermine objectives and lead to confusion in the industry.Notwithstanding these observations, if proposed changes were adopted into the NCC State and Territories’ parent legislation has the capacity apply a transition period and administratively delay adoption. Provided this were limited to 1 year, this would likely be well received by stakeholders and unlikely to materially impact the CBA, but allow sufficient time for new and additional guidance material to be socialised and training and professional development to be delivered.
www.TheCIE.com.au
138 Decision Regulation Impact Statement

099B0974 Guidance material being developed by ABCB# Name Type Priority Partner Comment
1 Energy Efficiency Handbook for Vol. 1
Handbook V High Re-write current handbook and guide, update based on the new provisions. Will incorporate the updated JV3 handbook and JP1 handbooks
2 Façade Calculator
Calculator V High AWA, BPIC, AIBS, PCA
Replaces Glazing Calculator: to allow calculation of whole of façade U and SHGC values on the basis of insulation levels, thermal bridges and window performance. Will include reference to AFRC technical protocols.
3 Lighting Calculator
Calculator V High IES Update of existing calculator to be based on new provisions, additions include:■ a new section to allow
calculation of an increase in IPD based on additional energy saved elsewhere in a new building to be added to lighting power allowance; and
■ for a Performance Solution based on a more sophisticated control solution than specified in the DTS.
4 Fans Calculator V high FMAANZ New to calculate a compliant pressure drop of a system with a given selection of fans.FMA efficiency curve is undergoing further development to expand its data set and confirm it is appropriate across a number of different fan types. May now be completed in-house
5 Pump pipework Calculator med PIA (new) to calculate a compliant pressure drop of a system with a given selection of pipework May now be completed in-house
6 Facades Worked Examples
V High AWA, BPIC, AIBS, PCA
Wall/ glazing façade of typical construction types (curtain wall, masonry/ punch wall) including a calculation of the effects of Thermal Bridging on façade performance.Provision of these worked examples will be added to the workload of the service provider and delivered with the tool.
7 Fans Worked Examples
high FMAANZ Four examples: a simple system following fan Method 1 (component level DTS) and Method 2 (system level DTS); and a more complex
www.TheCIE.com.au
Decision Regulation Impact Statement 139

# Name Type Priority Partner Comment
system following Method 1 and 2.
8 Pumps pipework.
Worked Examples
med PIA (as per fans)
9 Lighting, Worked Examples
high IES, IALD An example that uses each of the new adjustment factors available (e.g. colour temperature, new controls)
10 JV1 Worked Examples
med OEH Use of NABERS as a VM
11 JV2 Worked Examples
med GBCA Use of Green Star as a VM– multiple building type examples (if possible)
12 Class 2 Worked Examples
high A DTS compliance pathway for a Class 2 building, including how the common areas are to show compliance.
13 Solar PV Worked Examples
high How to properly account for a PV system in a JV3 scenario (i.e. establishing how much of the energy generated will be used on site in order to offset the energy in a proposed building). Can build on existing ABCB documentation.
14 Ground Source Heat pump
Worked Examples
low An example of a compliant ground source heating system
15 Campus type sites with central thermal plant
Worked Examples
low An example of a compliant HVAC system in a precinct scenario.
16 Awareness Raising
various High Social Media, Roadshow, Webinar, Merchandise, Industry Association Seminars (PIA, IBSA, PCA, MBA, etc).ABCB has meetings/ presentations scheduled with AREMA, PIA, AIRAH and the PCA in August/ September
17 Compliance Pathways
Fact sheets Med Building on existing ABCB materials on the various pathways by which a building can comply, focus on hybrid versions.Can build on existing ABCB documentation
18 Thermal Bridging
Fact sheets High What it is, how it affects R or U values, how to avoid it. Tables that convert material R value to Total R value in common construction types that take into account thermal bridging that can be used when calculating total façade U value.
www.TheCIE.com.au
140 Decision Regulation Impact Statement

# Name Type Priority Partner Comment
19 Lighting Guidance Material on Performance Solutions
High IES The relationship between the IPD values in the code and AS NZ 1680.1, and where it may be appropriate to increase an IPD for a space when 1680.1 specifies higher lux levels are required.
20 Comfort/PMV Guidance Material on Performance Solutions
High Use of the Adaptive Comfort standard in place of PMV for mixed mode and naturally ventilated buildings
21 Chillers Guidance Material on Performance Solutions
Med Use of the Euro vent standard in place of AHRI to show compliance with the DTS requirements for chillers.Will build on materials being developed as part of the MEPs process for Chillers and released as part of the MEPs Position Paper.
22 Fans Guidance Material on Performance Solutions
High FMAANZ (TBA) – use of the FMAANZ efficiency curve to show compliance with the DTS for fans
23 Section J - Guide to Reference Documents.
Fact Sheets Med Lists of the documents, standards etc. referenced in Section J.
24 Update/re-write existing based on the new provisions.
Training materials
Low Review the existing energy efficiency NCC Tutor documentation and adapt/ replace as needed.
25 Small class 5 office that “just complies” with the DTS 2019 provisions
Case Studies Med PCA Based on an actual building, to shows a design that complies “just” via the DTS for 2019.
26 Retail at base of a Class 2/ mixed use high rise
Case Studies Med PCA Based on an actual building, shows the compliance pathways available in a mixed use scenario
27 Lighting Refurbishment in a class 5 office
Case Studies Med IES Based on an actual building, shows options for compliant designs in a refurbishment scenarios for lighting.
28 Medium to large Class 3 hotel
Case Studies Med PCA Based on an actual building, shows compliance options for a highly glazed façade
29 University or school building
Case Studies low Based on an actual building, shows options for a building seeking to meet other environmental accreditations for an educational facility (WELL, GreenStar)
Source: ABCB.
www.TheCIE.com.au
Decision Regulation Impact Statement 141

Review of the new minimum standardsThe revised minimum energy efficiency standards for commercial buildings would be subject to review in the same way as any provision in the NCC. The ABCB allows interested parties to initiate a Proposal for Change (PFC) process to propose changes to the NCC. This is a formal process which requires proponents of change to provide justification to support their proposal.PFCs are considered by the ABCB's Building Codes Committee (BCC) each time it meets. The role of the BCC, which consists of representatives of all levels of government as well as industry representatives, is to provide advice, guidance, and make recommendations relating technical matters relevant to the NCC. If the proposal is considered to have merit, the BCC may recommend that changes be included in the next public comment draft of the NCC, or for more complex proposals, it may recommend that the proposal be included on the ABCB's work program for further research, analysis and consultation.This process means that if the proposed minimum energy efficiency standards for commercial buildings are found to be more costly than expected, difficult to administer or deficient in some other way, it is open to affected parties to initiate a PFC.Additionally, to encourage continuous review and feedback, the ABCB maintains regular and extensive consultative relationships with a wide range of stakeholders. In particular, a continuous feedback mechanism exists and is maintained through State and Territory building control administrations and industry through the BCC. These mechanisms ensure that opportunities for regulatory reform are identified and assessed for implementation in a timely manner.As with all other aspects of the NCC, the effectiveness and observed impacts of the proposed measures should be monitored. The analysis in this RIS has been undertaken based on the best information currently available and it will be necessary to verify how the building industry do in fact respond. The ABCB will seek regular feedback from industry, building administrators, and other stakeholders in relation to the implementation of the new requirements.
www.TheCIE.com.au
142 Decision Regulation Impact Statement

10 Conclusions
Based on the analysis presented in the RIS, the proposed changes to the NCC is the preferred option to improve the energy efficiency of new commercial buildings.EA’s modelling suggests that significant energy efficiency improvements can be made in commercial buildings at a relatively modest additional cost. This is largely due to improvements in the methodology of setting the stringency for the facades. EA’s analysis found that the solar heat gain coefficient (SHGC) is a more important parameter for window performance than U-Value, while the cost of window products in the market appears to be highly related to U-Value rather than SHGC. By changing the focus of the code from U-Value to SHGC, the proposed change in specifying the stringency for glazing enables cost savings by choosing a window with better SHGC and relatively poorer U-Value measure. Furthermore, stringency is proposed to be set for whole façade rather than separately for wall and glazing as in the current code. In this way, substitution between glazing and insulation is possible and could further reduce construction cost.If these modelling results are broadly representative of the impacts of the proposed changes to the NCC across all buildings, the CBA results suggest that these changes could deliver significant net benefits across all jurisdictions, even if the modelled energy savings are not fully realised in practice (as appears likely based on the evidence available).■ The net benefits to the Australian community are estimated to range
between around $769 million and $1.42 billion in net present value terms over the assumed 40-year life of commercial buildings constructed over the ten-year regulatory period (using a discount rate of 7 per cent). These estimates assume that 49-75 per cent of modelled energy savings will be achieved in practice.
■ In addition the global benefits of reduced GHG emissions are estimated to range between around $369 million and $553 million.
■ The benefit-cost ratios (BCRs) for the proposed changes are estimated to range between 2.4 and 3.6 (excluding the global benefits of reduced GHG emissions).
■ Sensitivity testing suggests that these findings are robust to alternative assumptions around compliance costs, energy prices, emissions, the social cost of carbon and discount rates.
www.TheCIE.com.au
Decision Regulation Impact Statement 143

The alternative non-regulatory option considered involved turning the work that underpins the proposed changes into a handbook to encourage voluntary uptake of cost-effective energy efficiency opportunities.■ However, there is already significant information on the benefits of
energy efficiency available. This includes free general information, while project-specific information is available commercially.
■ As such, the barrier to the voluntary uptake of cost-effective energy efficiency opportunities in commercial buildings is not the availability of information. Rather, the main barrier appears to be a failure to use the available information to make privately optimal decisions (due to bounded rationality and/or heuristic decision-making).
■ Providing additional information would therefore do little to address the main barrier to the voluntary uptake of cost-effective energy efficiency opportunities. The impacts of this option are therefore likely to be relatively small.
■ Furthermore, this option would not address identified inefficiencies in the existing code.
Although the proposed changes to the NCC are likely to deliver the largest net benefit to the community, there are some potential downsides, including the following.■ The proposed changes are likely to result in net costs for some
buildings, albeit marginal. Our analysis suggests that between 5 and 24 per cent of buildings could incur a net cost under the DTS pathway, although these net costs would be significantly outweighed by those buildings that benefit.– The modelling results suggest there may be net costs on average for
healthcare buildings in Climate Zones 6 and 7 (and possibly Climate Zones 4 and 5, depending on the extent to which modelled energy savings are realised) and for retail buildings in Climate Zone 7.
– In addition, the (limited) data available suggests that the relationship between modelled and actual energy performance is relatively weak. While the CBA takes into account the average realisation rate (under the low and medium scenarios), there also appears to be significant ‘scatter’ around the average (see appendix D). This suggests that the realisation rate for some buildings will be above the average, while others will be below average. Where buildings incur the cost of complying with the new code requirements, but the improvement in energy performance is below the average realisation rate they may incur a net cost.
■ More stringent minimum energy efficiency standards also restricts choice and is therefore a greater restriction to competition under a DTS pathway. That said, the proposed changes to the NCC provide more
www.TheCIE.com.au
144 Decision Regulation Impact Statement

opportunities for performance solutions and satisfy the competition test specified in the COAG Guidelines.
www.TheCIE.com.au
Decision Regulation Impact Statement 145

A Review of direct evidence on causes of the energy efficiency gap
Direct evidence of market failures and behavioural anomalies
Greenhouse gas emissionsIn the current policy environment, the lack of an economy wide carbon price is the clearest market failure in relation to energy consumption. There are various approaches to valuing greenhouse gas emissions (see appendix H for further details). Using the internationally recognised approach of the social cost of carbon (SCC), the external cost of carbon emissions associated with electricity consumption is estimated at around 5 c/KWh based on:■ a social cost of carbon of around $60 per tonne of CO2-e — this is based
on a SCC of US$36 per tonne of CO2-e (expressed in 2007 dollar terms), as estimated by the United State Environment Protection Agency (based on the 2015 estimate using the 3 per cent discount rate).69 This converted to Australian dollar terms, using an average exchange rate of US$0.76 per Australian dollar (based on the post-float average) and then inflated to 2017 dollar terms using the CPI; and
■ an average carbon intensity of electricity of around 0.8 tonnes of CO2-e per MWh across the National Electricity Market (NEM).
Internalising the social cost of carbon would therefore increase current retail energy prices by around 30 per cent.While the carbon intensity of electricity generation is expected to decline over time, USEPA estimates suggest that the SCC will increase.
Externalities associated with peak demandAs electricity network capacity is driven by peak demand, reducing peaks through energy efficiency can potentially defer or remove the need for additional investment to expand network capacity.
69 US Environment Protection Agency 2016, Technical Support Document:- Technical Update of the Social Cost of Carbon for Regulatory Impact Analysis — Under Executive Order 12866, August 2016, p. 16.
www.TheCIE.com.au
146 Decision Regulation Impact Statement

However, to a significant extent, the cost of supply during peak periods is reflected in energy prices. As a natural monopoly, network charges are regulated by the Australian Energy Regulator (AER). Under the AER’s pricing principles, network tariffs must reflect the long run marginal cost (LRMC) of supply.For network services, the LRMC is a forward-looking concept reflecting both the operating costs associated with an additional unit supplied, and any network expansion costs (see appendix B for further details). As such, the LRMC reflects the avoidable network costs from reducing energy consumption.In many cases, retail tariffs have different peak and off peak rates to reflect differences in the cost of supply during peak and non-peak rates. To a large extent, network-related costs are therefore reflected in retail prices.
Information failuresOne form of information failure would arise when the party that makes decisions on the energy efficiency of the building design and the associated services installed (such as building owners or developers, architects and engineers acting on their behalf) do not have access to sufficient information to make fully informed decisions when the building is designed and constructed.General information on the potential benefits of improving energy efficiency in commercial buildings is freely available through a range of sources, including:■ the Energy Efficiency Exchange, a Commonwealth Government
website;70 and■ case studies published by the Green Building Council of Australia
(GBCA) and others.More project-specific information is commercially available from specialist consultants and energy efficiency modellers. Stakeholders suggested that Performance Solutions, which involve energy efficiency modelling, are frequently used to comply with Section J of the NCC (although some stakeholders reported that the DTS pathway continues to be used for some buildings). Nevertheless, this suggests that energy efficiency modelling is an established part of the building design and construction process.This suggests that relevant information is potentially available, albeit at some cost; and that relevant information may come at a cost is not
70 Energy Exchange website, https://www.eex.gov.au/sectors/commercial-buildings, accessed 17 October 2017.
www.TheCIE.com.au
Decision Regulation Impact Statement 147

necessarily a market failure. The extent to which this information is accessed and acted upon is a separate issue addressed below.Another form of information failure is an ‘information asymmetry’. This occurs where one party in a transaction has more information than another. In the context of energy efficiency in commercial buildings, an information asymmetry would arise where a building (or part of a building) is sold or rented and the seller/landlord has information on the associated energy bills, while the buyer/tenant does not. Under these circumstances the buyer/tenant may not be in a position to make informed decisions and higher levels of energy efficiency would not be reflected in leases or sale prices.That said, there are several existing mechanisms to address the potential for these information asymmetries to arise:■ Energy efficiency rating tools allow building owners/operators to obtain
a rating for their building from an accredited assessor using an established methodology. These arrangements mean that buyers/tenants can have confidence in the energy efficiency rating provided by the seller/landlord. Existing energy efficiency rating tools include:– The National Australian Built Environment Rating System (NABERS)
operated by the NSW Office of Environment and Heritage (OEH) on behalf of Federal, State and Territory Governments. There are currently NABERS tools available for:… Office buildings — the tool for office buildings is widely used… Shopping centres… Hotels… Data centres.71
– The Green Star rating system operated by the Green Building Council of Australia (GBCA). Green Star is a holistic sustainability rating system.
■ In addition, the Commercial Building Disclosure (CBD) program requires that sellers and lessors of office space of 1 000 m2 or more to obtain a Building Energy Efficiency Certificate — which includes the building’s NABERS Energy for Offices star rating and a tenancy lighting assessment of the relevant area of the building — before the building goes on the market for sale, lease or sublease.72 The CBD program
71 NABERS website, https://nabers.gov.au/public/webpages/ContentStandard.aspx?module=10&template=3&include=Intro.htm&side=EventTertiary.htm#What are the NABERS tools?, accessed 17 October 2017.
72 Commercial Building Disclosure website, http://cbd.gov.au/overview-of-the-program/what-is-cbd, accessed 17 October 2017.
www.TheCIE.com.au
148 Decision Regulation Impact Statement

commenced in July 2010 with a minimum threshold of 2 000 m2.73 This was decreased to 1 000 m2 from July 2017. The aim is to encourage all parties in a purchase or lease transaction to consider energy efficiency.
Stakeholders also reported that investor demand for green buildings provides a significant incentive to achieve high levels of energy efficiency at the premium end of the office market. Investor demand for green buildings is driven by the recognition of the commercial benefits of better energy efficiency (such as lower energy bills, higher rents and lower vacancy rates) as well as corporate social responsibility requirements of large investors. Some stakeholders also reported that NABERS or Green Star ratings are often used as a market proxy for overall building quality.A recent review found that the CBD program had been successful in encouraging energy efficiency improvements, particularly in the least efficient buildings.74 While the focus of the CBD program is on existing buildings, it nevertheless suggests that existing mechanisms go some way to addressing the information asymmetry problem. However, as noted above, mandatory disclosure of the NABERS energy efficiency rating is applied only to a subset of commercial buildings. As a result, the problem of information failure should be addressed for those commercial buildings not being covered by the CBD.
Split incentivesA subset of the information problems discussed above is the issue of split incentives. Split incentives occur when the party making the decision on whether to invest in energy efficiency are not responsible for energy bills.
Landlord-tenant problem¤
The most commonly cited split incentive in relation to commercial buildings is the landlord-tenant problem. This problem potentially applies to leased buildings where:■ the building owner (the landlord) bears the cost of any investment in
energy efficiency (including the building façade and central services); and
■ energy bills are passed onto tenants (although this is not always the case).
73 Acil Allen Consulting 2016, Improving the energy efficiency performance of small office buildings: Regulation Impact Statement for Consultation, Report for Office of Best Practice Regulation, March 2016, p. 3.
74 Acil Allen Consulting 2015, Commercial Building Disclosure: Program Review, Report to the Department of Industry and Science, March 2015, pp. 42-46.
www.TheCIE.com.au
Decision Regulation Impact Statement 149

The landlord-tenant problem is more relevant to office and retail buildings which are the largest commercial users of energy, together accounting for over 40 per cent of the total energy consumed by commercial buildings.It is less relevant to other types of commercial buildings, such as educational facilities, health-care facilities and hotels, where the building owner and operator are more likely to be the same entity and responsible for both decisions on whether to invest in energy efficiency, and energy bills. However, there may be organisational inefficiencies that limit the appropriate consideration of the longer term operating cost implications at various levels of capital expenditure decisions for these types of commercial buildings.The landlord-tenant problem is essentially an information or behavioural failure on the part of tenants. Where energy bill savings are understood by tenants, they are likely to be willing to pay higher rents in more energy efficient buildings (i.e. bill savings are likely to be capitalised into rents). In these circumstances, the benefits of better energy efficiency are passed back to the building owner/manager. The capacity to achieve higher rents would also be reflected in the value of the building.To some extent, the existing mechanisms outlined above address these information failures for tenants in the buildings where the landlord-tenant problem are most likely to arise. In particular:■ it is mandatory for all office buildings with an area greater than
1 000 m2 to obtain a NABERS rating when sold or leased under the CBD program; and
■ voluntary NABERS and/or Green Star rating tools are also available for office buildings and shopping centres.
Evidence of energy bill savings being capitalised into rents and building values would be an indicator that tenants and buyers have sufficient information to make informed decisions.A number of international studies have found evidence that returns to more energy efficient buildings are higher than less energy efficient buildings.75 In particular, Papineau (2015) found that in the US office market, on average unlabelled buildings constructed under a more stringent energy code are associated with statistically significant rent premiums of around 4 per cent and price premiums of around 9 per cent. These premiums were considered to plausibly represent complete capitalisation of estimated energy savings in rents and prices.76
75 See for example, Eichholtz, P., Kok, N. and Yonder, E., 2012, “Portfolio greenness and the financial performance of REITs”, Journal of International Money and Finance, 31(7), pp.1911-1929.
76 Papineau, M. 2015, Energy Codes and the Landlord-Tenant Problem, Carleton University, 10 April 2015, p. 27.
www.TheCIE.com.au
150 Decision Regulation Impact Statement

There is also Australian evidence of energy bill savings associated with higher levels of energy efficiency being capitalised into rents and prices (as well as lower vacancy rates). A study for the Australian Property Institute and Property Funds Association compared rents and prices of 206 NABERS-rated office buildings and 160 office buildings that did not have a NABERS rating in Sydney and Canberra. This study focused mostly (over 97 per cent) on office buildings with an area exceeding 2 000 m2. A key feature of this study is that it controlled for differences in building characteristics to ensure that any identified ‘green premium’ is not a result of green buildings being newer.77
The study found:■ Evidence of a green premium in values for buildings with higher
NABERS ratings – the 5 star NABERS energy rating delivering a 9 per cent green premium in value and the 3-4.5 star NABERS rating delivering a 2-3 per cent green premium in value.
■ These green premiums were most evident in the Canberra office market and the Sydney suburban office market (North Sydney, Parramatta, Chatswood, St Leonards, South Sydney, Norwest, Macquarie Park, Rhodes and Homebush Bay).
■ Rents were lower in buildings with a low NABERS ratings.■ Green premiums were also evident in reduced vacancy rates and
reduced outgoings.78
This study suggests that where sufficient information is available, tenants and buyers can make informed decisions.That said, it should be noted that the CBD currently covers offices with an area at or above 1 000 m2, and the rating schemes like NABERS are voluntary and/or not available for other building types. For them the landlord-tenant problem is still relevant.
Builder and end-user split incentive problem
Another source of split incentives reported by stakeholders in Australia is between a building contractor and its owner/occupier. As discussed in the International Energy Agency’s 2007 report, Mind the Gap: Quantifying Principal-Agent Problems in Energy Efficiency, a building contractor makes many energy-related decisions, including the efficiency of the heating system and of the windows, and the building’s resistance to air infiltration.
77 Newell, Graeme, John MacFarlane and Nils Kok 2011, Building Better Returns: A Study of the Financial Performance of Green Office Buildings in Australia, Research by the University of Western Sydney and the University of Maastricht Netherlands in conjunction with Jones Lang LaSalle and CBRE for The Australian Property Institute and Property Funds Association, p. 22.
78 ibid, p. 41.
www.TheCIE.com.au
Decision Regulation Impact Statement 151

However, given these energy efficient alternatives usually increase the cost of construction, ‘the building contractor has incentives to avoid these measures, especially if the measures are invisible to prospective buyers’.79 That is, the developer is naturally trying to build for the lowest cost possible, and would incur the capital cost of energy efficiency investments, while the end user is not identified and may potentially not pay the full cost of those investments. This applies to all building types and, particularly to those developments that are completed speculatively or, where there is a fixed-price build and energy efficiency measures may be ‘value engineered’ out to increase the builder's margin. Due to the complexity of observing the compliance to design after building, it may be difficult for the owner to observe the difference between planned and actual building standard.
Other types of split incentives
Another type of split incentive could occur within large organisations, where separate parts of the organisation are responsible for capital budgets and paying energy bills. This is effectively an organisational failure, rather than a market failure per se. This type of split incentive as a result of government budgeting arrangements was identified during stakeholder consultations as a key barrier to improved energy efficiency in government buildings.
Bounded rationality and heuristic decision-makingIn addition to the market failures discussed above, some studies cite behavioural anomalies/failures as a reason for under-investment in improved energy efficiency. Behavioural anomalies cited in the literature include bounded rationality and heuristic decision-making.Energy efficiency choices in commercial buildings may involve complex trade-offs with factors, such as design preferences as well as cost. In the face of this complexity, some owners/developers may: make sub-optimal decisions due to cognitive limitations; and/or rely on heuristics (mental short cuts) to make decisions.In an assessment of the evidence on the causes of the energy efficiency gap, Gerarden et. al. (2015) noted that cognitive limitations could conceivably contribute to the energy efficiency gap by preventing individuals (or possibly firms) from properly balancing present value of benefits and costs when investing in energy-using capital goods.80
79 International Energy Agency 2007, Mind the Gap: Quantifying Principal Agent Problems in Energy Efficiency, OECD/IEA, Paris, France, available at https://www.iea.org/publications/freepublications/publication/mind_the_gap.pdf.
80 Gerarden, Todd D., Richard G. Newell, and Robert N. Stavins 2015, “Assessing the Energy Efficiency Gap” Cambridge, Mass.: Harvard Environmental
www.TheCIE.com.au
152 Decision Regulation Impact Statement

Gerarden et. al. (2015) note that many empirical studies are consistent with this explanation. However, it is difficult to disentangle the role of heuristics and bounded rationality from competing explanations because consumers’ decision-making processes cannot be directly observed.81
Given these challenges, it is difficult to find direct evidence that bounded rationality and heuristic decision-making contributes to the energy efficiency paradox in relation to commercial buildings. That said, several stakeholders identified entrenched practices in the construction industry — a form of heuristic decision making — as a key barrier to greater uptake of energy efficiency in commercial buildings in Australia because energy efficiency is a relatively new design consideration and sometimes overlooked or ignored as a lower order imperative to life safety.
Inattention and non-salience of energy costsSome studies have sought to explain the energy efficiency paradox due to the inattention of energy users and/or the salience of energy costs. As energy costs are relatively small component of total costs for many businesses, little attention is paid to them, leading to under-investment in energy efficiency.Gerarden et. al. (2015) find some evidence that consumer inattention to non-salient costs affects decisions.82 However, most of the research cited relates to consumers rather than businesses.While there is little direct evidence that inattention to energy costs leads to under-investment in energy efficiency, it is nonetheless a plausible explanation (particularly for small businesses), although several stakeholders noted that rising energy prices over recent years have focused greater attention on energy bills. That said, the extent to which the energy price increase has encouraged greater uptake of energy efficiency measures from design to construction to operation is not clear.
Alternative explanationsAs discussed above, the failure of industry (and government) to adopt energy efficiency opportunities that modelling shows is privately cost-effective is often explained through the market and behavioural failures. However, an alternative view in the international literature is that the perceived energy efficiency gap may be much smaller than it appears because the modelling may not always be accurately reflecting the true costs and benefits of energy efficiency measures.
Economics Program, January 2015, p. 28.81 ibid, p. 28.82 ibid, pp. 24-26.
www.TheCIE.com.au
Decision Regulation Impact Statement 153

Some of the potential modelling issues identified in the energy efficiency literature include the following:■ Over-estimation of energy savings — in many CBAs, energy saving
estimates are based on engineering estimates, particularly in the case of ex-ante CBAs where actual energy saving cannot be observed. There is some evidence that engineering estimates can significantly overstate the energy savings achieved from improved energy efficiency (see appendix D for further details). Studies that over-estimate energy savings have persisted, despite improvements in ex-ante engineering-economic methods over time.83
■ Under-estimation of energy efficiency improvements under the baseline scenario — the Productivity Commission has previously noted that policy makers may overstate the potential for regulation to deliver cost-effective improvements in energy efficiency because their assumed business-as-usual improvements in energy efficiency are too pessimistic and fail to anticipate the responsiveness of consumers to future reductions in the prices of energy-efficient products. 84
■ Heterogeneity across buildings — investments in energy efficiency that appear privately cost effective for the average consumer (or developer in the case of commercial buildings) may not be cost-effective for some consumers due to different preferences, expected usage and the cost of borrowing.85
■ Risk and uncertainty — investment in energy efficiency involves some degree of risk or uncertainty, including uncertainty in relation to energy savings and future energy prices.86 Various studies have noted that risk is a common explanation for firms rejecting the recommendations from energy audits.87 As noted by the Productivity Commission, if the degree of risk and uncertainty facing producers and consumers is not
83 For further details see: Gerarden, T.D., Newell, R.G. and Stavins, R.N. 2015, Assessing the Energy Efficiency Gap, Duke University Energy Initiative and Harvard Environmental Economics Program, January 2015, pp. 17-19.
84 Productivity Commission 2005, The Private Cost Effectiveness of Improving Energy Efficiency, Productivity Commission Inquiry Report No. 36, 31 August 2005, p. 236.
85 Gillingham, K. and Palmer, K. 2014, “Bridging the Energy Efficiency Gap: Policy Insights from Economic Theory and Empirical Evidence”, Review of Environmental Economics and Policy, 8(1), p. 21.
86 Productivity Commission 2005, The Private Cost Effectiveness of Improving Energy Efficiency, Productivity Commission Inquiry Report No. 36, 31 August 2005, p. 62.
87 Gillingham, K. and Palmer, K. 2014, “Bridging the Energy Efficiency Gap: Policy Insights from Economic Theory and Empirical Evidence”, Review of Environmental Economics and Policy, volume 8, issue 1, p. 21.
www.TheCIE.com.au
154 Decision Regulation Impact Statement

adequately recognised, estimates of the potential for taking up energy efficiency related investments will be overstated.88
■ Omitted and under-estimated costs — some studies argue that energy efficiency modelling can often omit costs and therefore overstate the net impact of investing in energy efficiency. As noted by the Productivity Commission, well-informed purchasers of non-residential buildings may want to forgo the energy savings from a building standard because the standard causes more highly valued characteristics to be lost.89
If the apparent energy efficiency gap is due to these modelling issues, regulation could potentially impose a net cost on building owners (energy efficiency investment costs are bigger than the actual energy bill savings). The public benefits of reduced greenhouse gas emissions would therefore need to outweigh these private costs for energy efficiency regulations to deliver a net social benefit (the combined benefits of actual energy bill savings plus reduction in greenhouse gas emissions are larger than the energy efficiency investment costs). In this analysis we have separated the public benefits of emissions reduction from private benefits of energy saving and found that there are significant private net benefits. Furthermore, we have tested the impact on cost benefit analysis results of different values of emissions reduction (social cost of carbon) and found that the CBA results are robust against different assumptions of SCC.There is some evidence of these modelling issues in previous studies. For example, the existing DTS simulations by EA revealed that lighting contributed most to energy saving for all building types except Building 3A moving from NCC 2016 to NCC 2019. However, this finding was based on the assumption that the NCC 2016 required stringency would not be voluntarily exceeded and the market was only adopting lower efficiency and higher cost fluorescent lighting technology; whereas NCC 2019 compliance would require LED technology. In reality, most new commercial buildings are already using LED technology. Stakeholders expected that virtually all new commercial buildings will be using LED lighting by 2019, even with no changes to the NCC. If the current market practice is assumed in the baseline, the estimated energy saving would be significantly smaller – reduced by between 5 and 30 percentage points from what was reported in table 2.4.We have sought to address these potential modelling issues through careful selection of building models, inputs and assumptions informed by evidence. We have also conducted sensitivity testing to ensure that the findings are robust when alternative input assumptions are used.
88 Productivity Commission 2005, The Private Cost Effectiveness of Improving Energy Efficiency, Productivity Commission Inquiry Report No. 36, 31 August 2005, p. 62.
89 ibid, p. 236.
www.TheCIE.com.au
Decision Regulation Impact Statement 155

www.TheCIE.com.au
156 Decision Regulation Impact Statement

A Summary of proposed changes to the DTS Provisions
Proposed changes to the Deemed-to-Satisfy Provisions of the NCC are summarised in table .
BError! No text of specified style in document.Error! No text of specified style in document.B Summary of proposed changesProvision Proposed change Comment
Building fabric Total R-Values(J1.2)
A new subclause has been added to provide options for determining how to achieve the required Total R-Values of building elements. This includes direct reference of NZS 4214 (Methods of determining the total thermal resistance of parts of buildings).
NZS 4214 is a normative reference of AS/NZS 4859.1, which is already referenced in Section J. Directly referencing NZS 4214 in Section J will ensure practitioners are aware of the need to use this standard when determining how to achieve the required level of thermal resistance of building elements. This includes taking account of thermal bridging. Research has shown that many common construction types have much lower inherent R-Values when thermal bridging is properly considered. Performance Solutions may need to be considered where it is difficult to achieve the minimum Total R-Values.
Roofs(J1.3)
The current provisions have been replaced with simpler provisions for roof thermal resistance and solar absorptance.
The change to a single value for solar absorptance is based on analysis indicating that this represents the most cost-effective option for improving roof performance. In turn, this simplifies the requirements for roof Total R-Values in that they no longer need to vary on the basis of the roof solar absorptance.As a consequence of this change, the table adjusting for the loss of ceiling insulation (Table J1.3b) and the separate thermal break provisions (J1.3(c)) have been removed. These provisions are captured within the NZS 4214 calculation method and the new Specification J1.2b.
Roof lights(J1.4)
Changes have been made to improve the performance of roof lights and simplify the provisions.
Analysis of benefit has resulted in a single Total U-Value for roof lights and a simplified table of Solar Heat Gain Coefficients (SHGCs).
Wall-glazing construction(J1.5)
The glazing provisions currently in Part J2 have been incorporated into J1.5. A minimum Total U-Value and SHGC must be achieved for the whole façade instead
This approach is fundamentally different to the currently separate provisions for walls and glazing. The change is based on the principle that the overall façade performance is more important than that of the individual elements, particularly as the
www.TheCIE.com.au
Decision Regulation Impact Statement 157

Provision Proposed change Comment
of separate targets for glazing and walls. Minimum Total R-Values have also been specified for walls.
DTS Provisions are made more stringent.The new performance values are based on analysis indicating that glazing SHGC is generally more important for facades as stringency increases. Separate values for daytime versus overnight operating buildings have been retained, reflecting the different demands on the façade.The new stringencies for wall-glazing constructions were selected on a cost-benefit basis to suit Australian conditions. Note that the new values are broadly comparable to the values in the US energy code, ANSI/ASHRAE/IES Standard 90.1-2016.Compared to the NCC 2016 methodology, the new NCC 2019 methodology has a number of benefits. In addition to being more transparent, it is simpler to calculate glazing requirements and does not necessitate a separate glazing calculator. The new methodology also has the benefit of being easier to update if necessary, including if another stringency increase is required in the future.As a consequence of these changes, in some instances, lower wall Total R-Values than the current NCC provisions may be permissible to meet the total facade U-Values. However, the total façade performance (wall and glazing) will generally be more stringent.It should also be noted that there are two methods for determining compliance. The first method is based on each façade direction (i.e. North, South, East and West) being assessed separately. The second method allows all façade directions to be assessed together.The reduction in the number of façade directions reflects feedback on current industry practice and a desire for some simplification of the provisions.As a consequence of these changes in methodology, significantly less tables are required. This includes the need for detailing options for achieving the necessary levels of wall thermal resistance.Guidance documents will be developed to assist practitioners in interpreting and applying the new provisions. As is currently the case, this will include emphasis on the use of glazing performance values determined in accordance with the technical protocols and procedures of the Australian Fenestration Rating Council (AFRC).
Floors(J1.6)
The current provisions have been simplified, including through a consolidated table of minimum Total R-Values.
The new provisions do not fundamentally alter the stringency of the current provisions when the thermal resistance of any subfloor space or material (e.g. ground) is taken into
www.TheCIE.com.au
158 Decision Regulation Impact Statement

Provision Proposed change Comment
account. The note to the new Table J1.6 directs practitioners to CIBSE Guide A for this information.
Glazing(Part J2)
Part J2 has been deleted. This change is a consequence of incorporating the glazing provisions into J1.5.
Building sealing(Part J3)
Numerous minor changes have been made to this Part.
These changes are primarily intended to strengthen the current provisions with more detail.
Air-conditioning system control(J5.2)
Includes more precise provisions on how air-conditioning systems are to be controlled, including ensuring adjoining air-conditioning systems operate in a coordinated manner.
The additional controls are intended to increase the ability for air-conditioning systems to be operated efficiently.
Air-conditioning system control(J5.2)
The requirements for an economy cycle have been limited to larger air-conditioning systems in the cooler Climate Zones.
This change is based on modelling of outdoor air economy cycles which demonstrated that the current provisions are slightly too stringent.
Air-conditioning system control(J5.2)
The provisions for time switches have been relocated into this clause from the current Specification J6.
This change is intended to improve the readability of the provisions.
Mechanical ventilation system control (J5.3)
The general changes to these provisions include extending the requirements for energy reclaiming systems and demand control, and incorporating the requirements for miscellaneous exhaust systems and time switches (currently in J5.4 and Specification J6).
These changes are intended to provide more nuanced control of ventilation energy use and improve the readability of the provisions.
Mechanical ventilation system control (J5.3)
The provisions also extend the requirement for carbon monoxide (CO) sensors as part of carpark exhaust systems.
The CO sensors will ensure the fans are only operated when necessary and should result in significant energy use reductions.
Fan systems(J5.4)
These new provisions establish a more stringent whole-of-system approach based on minimising system pressure drop. It includes specific fan component level requirements.
The changes increase the efficiency of fans to a level modelled to be cost effective. The provisions were developed in consultation with the fan manufacturers’ industry association, FMAANZ.Requiring the calculation of actual pressure drop reduces the chance of a system consuming higher than expected energy use and is predicted to improve system design.
Fan systems(J5.4)
A fan system performance-type solution has been
The option of a whole-of-system DTS Solution allows for greater flexibility in
www.TheCIE.com.au
Decision Regulation Impact Statement 159

Provision Proposed change Comment
introduced to enable fan system designers to use a DTS system pressure drop as a benchmark for their proposed system.
system design and encourages properly designed solutions.
Ductwork insulation and sealing(J5.5, J5.6)
The current provisions for ductwork insulation and sealing in Specification J5.2b have been relocated to Part J5.
The intent of this change is to increase the readability of the provisions by placing related information in one place.
Air-conditioning pumps(J5.7)
The current provisions based on W/m2 have been replaced with minimum pump power efficiencies and maximum allowable pressure drops within pipework.
These changes establish component-level efficiencies for circulator pumps based on a calculation method used in European Union regulations. The new bases for measuring pump efficiency and pipework are considered more closely aligned with what drives the energy use of HVAC pumps. The changes are also more closely aligned with industry practice in pump specification and should encourage better designed and more energy efficient systems.The new component level metrics ensure that the pumps selected are both fit for purpose for the system they are operating in, and the most efficient.
Air-conditioning pumps(J5.7)
A pump system performance-type solution has been introduced to enable pump system designers to use a DTS system pressure drop as a benchmark for their proposed system.
The option of a whole-of-system DTS Solution allows for greater flexibility in system design and encourages properly designed solutions.
Pipework insulation(J5.8)
The current provisions for pipework insulation in Specification J5.2c have been relocated to Part J5. The minimum R-Values have also been increased.
The increase in minimum R-Values is based on cost-benefit analysis. It was also determined to be more appropriate to base pipe insulation levels on the temperature of the transported fluid, rather than its state.
Space heating(J5.9)
The current provisions for space heating in Specification J5.2d have been relocated to Part J5. The gross thermal efficiency of gas water heaters (boilers) has also been increased.
The changes to the DTS Provisions for gas boilers is based on analysis indicating higher levels of gross thermal efficiency are cost effective, with current technology, across all boiler sizes. On the basis of industry feedback, a lower level of stringency for smaller boilers was introduced to accommodate non-condensing boilers.
Refrigerant chillers(J5.10)
The current provisions for chillers in Specification J5.2e have been relocated to Part J5. The provisions specify more stringent energy efficiency ratios (EERs) and cover chillers of all capacities.
The new EERs are based on the US energy code, ANSI/ASHRAE/IES Standard 90.1-2016.Two options, or sets of EERs, are provided to accommodate whether the chillers are likely to be used predominantly under full or part load.As a consequence of increasing stringency, it has become necessary to specify EERs for chillers of all capacities, rather than just for
www.TheCIE.com.au
160 Decision Regulation Impact Statement

Provision Proposed change Comment
those not covered by Minimum Energy Performance Standards (MEPS).
Unitary air-conditioning equipment(J5.11)
The current provisions for packaged air-conditioning equipment in Specification J5.2e have been relocated to Part J5 and renamed. More stringent EERs have been specified.
The proposed EERs were determined by cost-benefit analysis and are anticipated to mirror future MEPS for unitary air-conditioning equipment.
Heat rejection equipment (J5.12)
The current provisions for heat rejection equipment fans in Specification J5.2a have been relocated to Part J5. The methodology for calculating fan motor power has been aligned to the provisions for fan systems in J5.4.
These changes are intended to increase the readability and interpretation of the provisions.Forced draft, closed circuit coolers are no longer included in the provisions because they are considered to be highly inefficient.
Artificial lighting(J6)
The stringency of the artificial lighting provisions has been increased. This includes reductions to the maximum Illumination Power Densities (IPDs) for interior artificial lighting. Improvements have also been made to the interior lighting adjustment factors.
The stringency increases are based on advances in current lighting technology, particularly LED technology. The improvements to the adjustment factors include consideration of contemporary technology, colour rendering and colour temperature. The adjustment factors provide considerable flexibility for achieving the necessary IPDs for interior artificial lighting.
Lifts(J6.7)
New provisions for lift efficiency have been introduced.
Lifts can be relatively significant energy users, especially as other aspects of a building’s energy use become more efficient. The proposed new efficiency levels are based on an international standard, ISO 25745-2.
Escalators(J6.8)
New provisions inserted for escalators and moving walkways.
The new provisions are intended to reduce the energy use of escalators and moving walkways when not in use.
Swimming pool and spa heating(J7.3)
A number of changes have been made to the provisions for swimming pool and spa heating. This includes the need for gas water heaters to achieve minimum levels of gross thermal efficiency, and pool covers must achieve a minimum R-Value.
The gas water heater requirements mimic the new provisions for boilers used for air conditioning in J5.9.
Facilities for energy monitoring(J8.3)
Improvements made to the existing provisions for energy monitoring.
These changes are intended to ensure that energy monitoring is installed that can provide useful data to facilities managers about the performance of a building.
Material properties(Specification J1.2a)
Tables reformatted. This change has been made to improve readability.
Spandrel panels New specification inserted The specification takes into account the
www.TheCIE.com.au
Decision Regulation Impact Statement 161

Provision Proposed change Comment
(Specification J1.2d) detailing how to determine the thermal performance of spandrel panels.
effects of the frame and panel construction.
Roof, wall and floor construction(Specifications J1.3, J1.5 and J1.6)
Existing Specifications J1.3, J1.5 and J1.6 have been deleted.
This is a consequence of the changes to Part J1 and the general stringency increase of the new provisions. Practitioners will be required to determine the Total R-Value of building elements on a case-by-case basis, taking into account thermal bridging.More appropriately, the content of these specifications may be incorporated into guidance documents.
Lighting power control(Specification J6)
Minor improvements made to the provisions for lighting timers, time switches and motion detectors.
Source: ABCB.
www.TheCIE.com.au
162 Decision Regulation Impact Statement

B Summary of consultation submissions
Questions were asked and feedbacks were sought in the Consultation RIS around the following issues:■ Scope of market failures in the commercial building industry;■ Roles of Section J of the NCC to correct the market failures;■ Potential regulatory failures in the NCC’s current methodology and
options to address the problem;■ Other problems not considered by the Consultation RIS■ Preferred option as regard to changing the provisions in Section J of the
NCC■ Existing average window-to-wall ratio (WWR) in new buildings■ Likely responses of building designs to the proposed changes■ Likely energy saving scenario in relation to modelled results and factors
affecting the outcome■ Role of SHGCxWWR and U-Value in determining energy consumption
and construction cost■ Awareness of the importance of SHGCxWWR by the Australian industry■ Factors leading to lower energy consumption and lower construction
cost■ Other unintended impacts of increasing the stringency of the energy
efficiency requirement on safety, amenity and accessibilityThere were 23 written submissions received from:■ JMG Consulting and Building Approval■ Frank Acitelli (Builder)■ Benmax Group Pty Ltd■ Real Project Solutions■ the Australian Sustainable Build Environment Council (ASBEC) and
ClimateWorks Australia■ Bondor Group■ City of Parramatta Council
www.TheCIE.com.au
Decision Regulation Impact Statement 163

■ Rheem Australia Pty Ltd■ BlueScope■ G. James Glass and Aluminium■ Sustainability House (SUHO)■ National Association of Steel-Framed Housing Inc.■ Unions NSW■ The Property Council of Australia (PCA)■ Think Brick Australia, Concrete Masonry Association of Australia and
Australian Roof Tile Association■ the Green Building Council of Australia (GBCA)■ The Australian Small Business and Family Enterprise Ombudsman■ Anderson Energy Efficiency■ the Housing Industry Association (HIA)■ NSW Building Administration at the Department of Planning and
Environment■ Master Builders Australia (MBA)■ Environment Victoria■ the Australian Government Department of the Environment and EnergyThis appendix provides a summary of consultation submissions structured around each of the questions.
Scope of market failure in the commercial building sectorSubmissions in general agree there are market failures in the commercial building sector.Many made observations regarding the different markets that exist within the commercial buildings market and reinforced early consultations. Ownership is thought to be fragmented and client, builder, designer relationships entrenched and likely to be challenged by the need to change behaviour or inadvertent non-compliance and redesign costs are likely to be incurred. Several industry stakeholders (ASBEC, ClimateWorks, PCA, GBCA) provided co-ordinated submissions that pointed to some additional barriers to improved energy efficiency in commercial buildings. These submissions note that some energy efficiency technologies may not yet to
www.TheCIE.com.au
164 Decision Regulation Impact Statement
commercially attractive (relative to less energy efficient alternatives) and offer a low return on investment (relative to alternative potential projects).The co-ordinated submissions argued that the presence of market failures are well-accepted both in Australia and internationally. These submissions contended that it is therefore unnecessary to re-establish the presence of these market failures for each regulatory intervention.Benmax Group suggests on individual buildings struggle to comply due to a lack of appreciation on Section J requirements and leads to the need for modelling, alternatively gaming is a risk. Some scepticism over achieved outcomes. A theme of an entrenched system and disparate ownership with an industry with low levels of awareness and understanding is reflected in ASBEC, GBCA and PCA submissions.NASH suggests that the industry is highly disparate with larger buildings and owners by virtue of resources, need or ability to compete will seek higher energy efficiency and therefore a non-regulatory approach would suit. However the majority of the market was building to low cost and low specification, even where better outcomes could be achieved in practice. This view is shared by Dr Clyde Anderson of Andersen Energy Efficiency. ASBEC and its mirror submissions (PCA and GBCA) note similar issues as supply chain issues that result from poor compliance culture and workmanship issues and fragmentation of ownership that increases transaction costs. Broadly impediments rather than market failures are grouped under Capability, Attractiveness and Motivation which are then examined in more detail. The submission cites ASBEC’s report Low Carbon High Performance authored by ClimateWorks which suggested failures arise primarily from regulatory uncertainty and under estimation of benefits (from discount rates).The Australian Government's Small Business and Family Enterprise Ombudsman noted that lessees and tenants have little control over their circumstances.Exception to this view is the MBA, who disagrees that the energy efficiency gap is driven by a market failure, rather it reflects rational decisions and any gap is the difference between the demand for such features in the market and policy settings. G. James Glass and Aluminium argues narrower position than other submissions that there are many buildings that adopt world class façades and therefore market failure in general is weak. However, it is contended that much of the glazing industry rely on self-regulation which is a problem of disclosure.
www.TheCIE.com.au
Decision Regulation Impact Statement 165

Role of Section J of the NCC to correct the market failures and any other feasible options to address themEight of the submissions including ASBEC, GBCA, PCA, NSW Building Administration, Real Project Solutions, Sustainability House, G. James, explicitly support Section J of the NCC a means of addressing the identified market failures.Many such as ASBEC, GBCA and PCA note that Section J shares its role with a number of complimentary instruments such as the Commercial Building Disclosure programme run by DEE and most agree it can work to address split incentives. However many note the absence of broader energy efficiency trajectories and higher level policies.ASBEC’s proposition is the NCC is essential as a broader objective to correct motivation failures, split incentives and information asymmetry.The capacity of industry seems an issue. NASH suggests the NCC is too complex and open to gaming and has led to an over reliance on consultants. However it is not a criticism of the NCC’s role in building standards, rather its proposed approach particularly for smaller projects.Others such as Benmax Group argue current practice of using the DTS drives poor outcomes – mandatory energy modelling upfront would encourage a change to the hierarchical nature of design importance which suggests gaming not intentional but unavoidable when seeking compliance. JMG suggests it might be effective only for designing, but not for the complete work as it is very hard to check all aspects of energy efficiency.Think Brick Australia acknowledges separating heating and cooling loads is a good approach, however it has reservation over the reference of NZS 4214 which complicates the process of determining R-Value.
Regulatory failures in the NCC’s current methodologyIt is suggested that there might be regulatory failures in the NCC’s current methodology, for example, an emphasis on window U-Value for certain types of buildings might be leading to higher energy use and construction cost. Stakeholders were asked if they agree this is a problem, and if so, how to address it.Most submissions agree there are regulatory failures. They include JMG, Benmax, Real Project Solutions, City of Parramatta Council, G. James, Sustainability House, NASH, PCA and Think Brick.
www.TheCIE.com.au
166 Decision Regulation Impact Statement

JMG agrees there are regulatory failures and contemplates if the trades certificates must be controlled.Benmax Group agrees there is a problem. The glazing calculator produces different U-Value and SHGCs to suit the different aspects of each façade of the building. For most buildings, however, the builder will want to standardise on the glass types and as such the highest performing glass requirement often becomes the benchmark.City of Parramatta Council argues that it has been consistently identified as a problem in cooling dominated climates as heat is trapped inside the space, increasing cooling loads and as a result, increasing energy consumption and greenhouse gas emissions.BlueScope does not comment specifically on this issue. Rather it points to another one – the lack of inclusion of curtains within buildings, especially in overnight occupied buildings. It is also suggested to separate the impact of improved methodology from an increase in stringency.G. James accepts that U-Value is a problem and suggests alternatively the NCC should allow a tolerance rather than the current less or equal requirement. It also highlights a problem in the code which allows gaming. It argues ‘over stringency’ and some scepticism that the case studies validated results are achievable. Sustainability House (SUHO) points to some problems with the current proposed changes:■ Wall-glazing: Calculating glazing requirements is still complex and
prone to errors especially for larger buildings with high number of window size and window shading varieties. Its own modelling clearly indicates there is little performance difference between a wall with R2 or R4, contradicting the glazing worked example where an increase in insulation to the wall can be used as a trade-off to reduce the U-Value requirement of the glazing proposed by the new methodology.
■ Floors: In most Australian climates the stability of the earth temperature makes the ground a useful heat source in winter and heat sink in summer. SUHO therefore disagrees with the premise, particularly for warmer and temperate climates that floor insulation (slab R-Value no less than R2) will make building more efficient.
■ New verification method, JV4 – Building envelope sealing: Air leakage or tightness testing is a performance text, primarily a post construction activity, and can’t be proved at the building permit application. This may mean extensive rework to achieve compliance of the building works.
■ Renewable/reclaimed energy: A solar PV array or other renewable or reclaimed energy supply can be used to offset requirements for an efficient building envelope. This goes against the original intent of the
www.TheCIE.com.au
Decision Regulation Impact Statement 167

code that high performance building services should not be used to trade off against a poor performing thermal envelope.
Many respondents are of the view that more information to separate the change in stringency from the change in methodology would be necessary in order to be definitive with respect to the regulatory failure.A few submissions (BlueScope, NASH and PCA) raise the point of problems with the current methodology not allowing curtains to be used as a means of meeting the NCC Performance.PCA also notes a potential problem if the regulation dictates one size or option fits all. It provides an example of buildings may prefer heating loads and shift the mix to gas initially as a result which is considered dirtier than electricity in longer term as the grid progresses (with more renewables).Think Brick points to problems in the existing NCC methodology which does not considering the differences between heating and cooling, and not enough support from the NCC to encourage the use of thermal mass products. Anderson Energy Efficiency shares the same view on the use of thermal mass products.Anderson Energy Efficiency suggests an unintended consequence of the change may be that NCC 2019 buildings may experience easier compliance (through comparison to DTS as 80 percent of buildings they assessed reduced façade conductance, would have higher calculated annual energy consumption) than NCC 2016 buildings, which would lead only to cleverer thermal modelling, not more sustainable buildings.The NSW Building Administration and MBA both note the change in methodology may lead to overnight operating buildings not being able to achieve compliance and as a general theme many respondents were seeking greater clarity on this point including how stringency and methodology changes could be separated and WWRs are kept constant when comparing NCC 2016 and NCC 2019. NSW Building Administration also points that an emphasis on U-Value allows for better controlled indoor environments.
Feasible options to address the problemBenmax suggests a more collaborative approach to design development through direct feedback path between the energy modeller and the architect. However, it seems not an option to address the regulatory problem.Real Project Solutions propose to ‘have an overall methodology of the performance of a building rather than just one element’.
www.TheCIE.com.au
168 Decision Regulation Impact Statement

It is mentioned by City of Parramatta Council that many projects choose to follow a JV3 pathway for compliance which ‘is as much about reduced construction costs as it is about energy saving’.Sustainability House proposes some options to address the problems raised above:■ Wall-glazing: Introducing a new standardised ABCB endorsed wall-
glazing calculation tool suitable for all classes and Climate Zones. A maximum R Value of U Value needs to be suggested to for walls.
■ Floors: more research into this issue■ JV4 Building envelope sealing: Detailed guidance materials and pre-air
leakage testing, design, construction and costing reviews to ensure the rate of failure of air-leakage test in constructed buildings is kept to an absolute minimum.
■ Renewable/reclaimed energy: Improved estimation of energy generated by PV system on site by more reliable and thorough methodology; an even better alternative/solution would be to not credit solar PV at all.
There is some agreement that the NCC’s current methodology is flawed (JMG, NASH, G James, MBA) though responses to address the issue are disparate. The sole glazing industry response suggests that the issue was caused by compliance language in the NCC and specifying the methodology for the calculation of window Performance as an alternative option. The comments are driven by stringency concerns, particularly for overnight operating buildings and the ‘over stringent’ U-Values which in their opinion will ‘be very difficult to demonstrate DTS compliance’ given operable windows approach a U-Value of 4 and it follows that only very low WWR could be used before triggering an alternative pathway. Similar concerns are echoed by MBA.Some respondents offer alternatives to address the issue. Benmax argues that mandating energy modelling would place decisions regarding glazing at the beginning of the design process. The City of Parramatta Council’s response recognises JV3 is a common pathway where it is recognised the DTS is unsuitable and incentive for its use is based on construction costs savings.NASH comments suggest the DTS needs simplification, as does the MBA who feels this is the best way to address market failure of information asymmetry. It is unclear if the current proposals go far enough in their view. NASH suggests Class 9 buildings will struggle to demonstrate compliance (without offering an alternative).
www.TheCIE.com.au
Decision Regulation Impact Statement 169

Other problems not considered by the Consultation RISMany responses focused on issues identified in the RIS, for example, BlueScope submission lists areas of the RIS approach it disagrees with rather than new problems. Issues respondents feel more attention required in the final RIS include thermal bridging, separation of impacts of increasing stringency from the change in methodology of setting the stringency, and transitional assistance.
Thermal bridgingBlueScope argues that the costs associated with thermal bridging are overlooked by the RIS as modelling calculates costs of R-Value as linear (consistent with ignoring its effects). The assumption (thermal bridging is a current requirement) is also not supported by the HIA, who argues its extension to Class 2, 3 and 4 buildings would represent an increase in stringency for residential buildings.
Separation of impacts of stringency change and methodological changeThe impacts on individual components such as space heating and the impacts and alternative modelling methodologies (separating the change in stringency from a change in methodology that is SHGCxWWR versus U-Value) raised predominantly by manufacturers (Rheem, BlueScope, G. James) and HIA. It is mentioned in the BlueScope submission, for example, WWR should be held constant when comparing the changes, or service levels being constant while comparing wall/glazing changes and so on.NSW Building Administration also raises the same suggestion to separately calculate building fabric thermal energy consumption, and to run energy simulations by keeping the same services for NCC 2016 and NCC 2019.
Transitional assistanceReal Project Solutions suggest a lack of greater knowledge of the measures undertaken within the permit analysis process is a problem.ASBEC argue that a lack of regulatory certainty in relation to if, when and by how much and according to what criteria the energy requirement will be updated, targets and overarching policy direction are a problem that impacts achieving energy productivity and investment.
www.TheCIE.com.au
170 Decision Regulation Impact Statement

Supporters of ASBEC’s view include GBCA and PCA. Both note the large shift in approach will challenge the capacity to the industry to respond. They recognise training, guidance, education tools and calculators will be necessary to support those who use the DTS pathway. Further the change will take time to implement and for industry to adapt their practices. In this vein, some (ASBEC, PCA and the HIA) argue that the change should be supported by a transition of more than one year. Others suggest maintaining the current DTS for a period. Bondor argues lack of consultation with members of the industry is a problem.
Other issuesBlueScope raises a unique issue – lifecycle costs. It is argued that buildings will require additional material to meet stringency. The impact of increases in stringency on space for services is again raised in the context of an overlooked consequence. Benmax argues that air conditioning air paths in ceiling spaces have been choked by the increase in the thickness of insulation within ceiling space in response to Section J requirements with resultant impacts upon user thermal comfort and increases in fan energy.Benmax suspects all compliance installations will be operating as commissioning time is often compressed in order to meet a construction deadline. As such it proposes to mandate employment of an independent commissioning agent.Rheem reiterates its concern on the viability of its products as a result of the proposed changes. It seems that the increase in stringency may affect market access and make some previous R&D investment useless.SUHO suggests that peak electricity demand (PED) and urban heat island effect should be considered.Think Brick suggests that cost and energy consumption comparison should be given for high thermal mass products with low thermal mass products.
Preferred option in relation to the proposed changesConsultation RIS discusses three options for the NCC changes:■ Option 1 – no change to Section J of the NCC, the status quo;■ Option 2 – the proposed changes to Section J of the NCC; and
www.TheCIE.com.au
Decision Regulation Impact Statement 171

■ Option 3 – alternative voluntary option, which is converting the proposed changes to the NCC into a non-regulatory handbook for industry to adopt.
Stakeholders were asked to provide their preference of options and their reasoning.
CError! No text of specified style in document.Error! No text of specified style in document.CCError! No text of specified style in document.75 Preferred option to proposed changes
0123456789
10
Option 1 Option 2 Objection to Option2
Option 3 Other
Numb
er of
respo
nses
Conditional support
Support support
Note: Other category includes choices not relating to Options 1, 2 or 3 or no clear indication of preference to one optionData source: CIE construction based on submissions
A majority of responses prefer the Option 2 (the proposed changes to the provisions in Section J of the NCC), either conditionally or unconditionally (chart ).Supporters of the Option 2 include Real Project Solutions, ASBEC, City of Parramatta Council, G. James, PCA and GBCA. Frank Acitelli, Unions NSW, BlueScope, Anderson Energy Efficiency, DEE did not provide answer to this question.Benmax, Real Project solutions, ASBEC, GBC, and PCA are all in broad agreement with an increase in stringency noting there will be pockets of major impact around capability and communication that will necessitate time to transition to a new system. G. James, despite being quite critical of the assumptions around stringency, is also supportive of an increase.
www.TheCIE.com.au
172 Decision Regulation Impact Statement

Although not specifically stating the preference of options, Environment Victoria ‘strongly supports the Australian Building Code Board’s efforts to improve building energy performance’.The NSW Building Administration supports Option 2 on the basis that technical issues are resolved and a minimum level of performance being required for the building fabric.Think Brick Australia prefers Option 2 on the condition that the reference of NZS 4214 is removed. Sustainability House also provided conditional support noting the potential for VM stringency to change outside of an NCC cycle. It argues that the DTS lighting allowances need to be updated even if the Option 1 (the status quo) were chosen. For Option 2, it objects some changes to Performance Requirements, in particular the proposed new compliance pathways through NABERS and Green Star. For Option 3 (voluntary option), it agrees that the industry can benefit greatly by improving and increasing the extent of voluntary rating schemes and non-regulatory, self-regulatory and co-regulatory options.NASH suggests the market demands different approaches based on their level of capability to respond to the changes – larger buildings not necessitating regulatory intervention and smaller buildings which are more likely to be using the DTS, be provided simple options for compliance to enable increases in stringency. Australian Small Business and Family Enterprise Ombudsman provided general comments as to allow ‘flexible compliance options’ for small business, and to give consideration for ‘exclusions or voluntary stringency requirements for spaces most likely used by small business, particularly in the retail industry including small business franchisees’.BlueScope does not answer the question directly, but makes a moral argument elsewhere theoretically solar absorptance gains should not be used to offset other costs. Those that object to increase in stringency include:■ Bondor Group argues individual impacts have not been considered and
the proposed changes are complex, impractical and unable to be implemented or lead to inadvertent non-compliance.
■ Rheem notes the level at which the technical stringency for products is set will have a major impact on their viability.
Manufacturers generally do not disclose a position on the options in part this could be due to the individual impacts of the changes being obscured by the modelling approach. HIA argues the status quo should be adopted and in the event the changes progress a 3 year transition may be required. MBA suggests the non-regulatory route (Option 3) be adopted as a means to ‘allow for an examination of the uptake and effectiveness of
www.TheCIE.com.au
Decision Regulation Impact Statement 173

the new regulatory guidelines before imposing them on the entire industry’, and to ‘provides greater choice to industry and leaves room for more flexibility for the market to meet the differing demands of businesses’.
Existing average window-to-wall ratio (WWR) in new buildingsTo prepare the submission, DEE commissioned EA to survey the WWR across various building types. To estimate the WWR, EA used a software tool on a combination of elevation drawings, Google Streetview and photographs for a sample of buildings. The findings are summarised in table . It should be noted that the sample size is small and some states may be under-represented in each category. It was also difficult to estimate other façades if using photographs or Google Streetview.
C44CC476WWR across different building sub-typesSample Average
WWRMinimum
WWRMaximum
WWR
No. Per cent Per cent Per cent
Hotels 26 27 12 40Business hotel 18 32 15 47Motel 8 16 5 29
Office 28 46 31 61Low rise office (<10 floors) 15 35 18 54Mid-rise office (10-25 floors) 8 63 53 70High rise office (25+ floors) 5 57 41 69
Retail 27 30 10 52Outdoor retail strip 8 50 13 59Shopping centre 5 28 10 45Standalone retail 14 18 9 51
Hospitals 25 30 14 45Aged care 30 27 15 41Education 29 32 11 49Early learning centre 3 26 11 46Primary school 7 24 3 44Secondary school 7 25 7 43University 12 44 26 58
Source: EA, Australian buildings window to wall ratios, Prepared for the Department of Energy and Climate Change.
Benmax Group refers to average WWR in the US by building type, ranging from 6 per cent for warehouse to 54 per cent for large office, in a study of
www.TheCIE.com.au
174 Decision Regulation Impact Statement

building envelope construction in 2003 CBECS undertaken for the US Department of Energy.Think Brick suggests the average WWR is 30 per cent, broadly consistent with the DEE submission.Sustainability House suggests that average WWR in new buildings is approximately 35-40 per cent based on 18 randomly selected recent buildings. It is also noted that Office Warehouse constructions have WWR of 50-60 per cent.JMG provides an answer of 1:1 ratio to this question, implying a WWR of 50 per cent.However other submissions provide very different WWR figures. NSW Building Administration estimates the average WWR is around 70 per cent. G. James suggests higher WWRs for some building types in its submission (table ). City of Parramatta Council argues that new commercial office buildings have WWRs approaching 100 per cent.90
C02CC077Average WWR suggested by G. JamesBuilding type Average WWR (%)
Large offices >65Medium offices >50Small offices >20Warehouse 6Sand-alone retail >80School 65Fast food 35Hospital 40-70Health care 20-60Hotel >70Large multi residential >70Medium residential >50
Note: the WWRs may be subject to adjustment as mentioned in footnote 90Source: G. James submission
Property Council of Australia provides average WWR for different building classes based on member feedback (table ).
90 It should be noted that the WWR is calculated based on the window area divided by the total façade area exposed to conditioned air, which includes the plenum space in the same orientation. As a result, a WWR of 75 per cent corresponds to a 100 per cent glazing of the occupied space and an opaque wall to the plenum space (EA 2017, Glazing Analysis, p.9). In other words, these high WWRs in the submission must be adjusted such that a suggested 100 per cent WWR is equivalent to 75 per cent WWR in energy modelling.
www.TheCIE.com.au
Decision Regulation Impact Statement 175

C02CC078Average WWR suggested by PCABuilding class Average WWR (%)
2 (apartment common area) 90 and above3 (hotel) 75 for high-rise large buildings, 40 for smaller
buildings5 (office) Premium and A-grade: above 80; B-grade: 60-
75; Small, low-grade: 30-50, but for curtain wall up to 60
6 (High street shop or base of mix use development)
70-80
6 (Vehicle showroom) As high as possible and up to 1009a (Hospitals) Up to 609b (Schools, universities, civic buildings) School around 40 but there is trend towards
more glazing; universities up to 90 in some instances
Note: the WWRs must be subject to adjustment as mentioned in footnote 90Source: PCA submission
Likely responses of building designs to the proposed changesReducing window size was originally suggested in energy modelling as a way to improve energy efficiency. Stakeholders were asked how building designs will most likely respond to the proposed changes: ■ A – Maintaining preferred WWR supplementing window performance
through shading;■ B – Reducing WWR to a minimum practical level; or■ C – Adopting a different compliance pathwayThe respondents is summarised in table . Most respondents are of the view that reduced WWR will not be used as a method of compliance. Exceptions are JMG, Real Project Solutions and Think Brick who argue reducing WWR to a minimum practical level but offer no further discussion or justification for this approach.
C02CC079Likely responses of building designsRespondent A – Maintaining WWR B – Reducing WWR C – Different pathway
JMG B
Benmax Group C as shading presents problems; more and more use JV3 as DTS impractical
Real Project Solutions B
G. James A – shading already B is the only tool for C – JV3 virtually
www.TheCIE.com.au
176 Decision Regulation Impact Statement

Respondent A – Maintaining WWR B – Reducing WWR C – Different pathway
extensively used overnight operation buildings
mandated for use in some Climate Zones and building classes
Sustainability House A – architects, designers and owners want to maintain WWR but shading is expensive and difficult to implement e.g. external shading on large high rise buildings
B more likely, however adverse effects (indoor environment quality through loss of daylight and views; reduce passive solar benefits in winter or mid-season)
C - JV3 preferred option for managing WWR at high levels
NASH A most likely, but may with some reduction
PCA A – premium and A-grade office buildings, but for high-rise buildings using shading may present difficulty to clean; lower end of the market already has low WWR
C - JV3 initially, more through NABERS and Green Star pathways later on
Think Brick B
NSW Building Administration
A most likely B very unlikely
Source: submissions as noted in the table
Benmax Group, NASH, NSW Building Administration and PCA confirm the view that most designs will seek to maintain their current WWR. In particular, NASH states ‘it seems improbable that the ratio will change suddenly from 70-75% to 30-45% with the proposed 2019 measures ... this will only happen over time’. Views are mixed on how compliance will be achieved. There appears to be many arguments against shading including ■ ‘it is already extensively used’ (G. James); ■ ‘Shading may not get you over the line’, ‘it may interfere with the
architects vision’ (Benmax); ■ ‘Shading in high rise presents challenges’ (PCA), and ■ ‘brings with it non-compliance’ (Sustainability House). For the most part, respondents feel a change in compliance pathway will be required. However this will present challenges too and a particular concern is noted around the impacts on Class 9 buildings (probably arising from the case studies), noting the U-Values coupled with the need to maintain high WWR will be prohibitive to compliance.
www.TheCIE.com.au
Decision Regulation Impact Statement 177

Likely energy saving scenario in relation to modelled results and factors affecting the outcomeThree scenarios of realisation of modelled energy outcomes were presented in the Consultation RIS:■ Low – about half realisation of modelled outcome■ Medium – 75 per cent realisation■ High – full realisationStakeholders were asked to comment on which scenario is more likely and what factors affect the realisation of modelled outcome.Most submissions answering this question suggest low or medium scenario of realisation (table ). JMG, Think Brick and NSW Building Administration suggest the medium scenario was more likely. PCA suggests low to medium scenario noting suburban office and small retail market comprise a much larger percentage of overall building stock. Similarly NASH suggests low scenario for mainstream buildings and medium for large and landmark buildings. BlueScope and MBA feel the low scenario is more likely due to the poor relationship between predicted and actual outcomes. Benmax Group feels the high scenario was more representative. G. James anticipates ‘the energy savings to be significant’, but does not explicitly suggest a realisation scenario.
C02CC080Realisation of modelled outcomesRespondent Low Medium High
JMG Medium
Benmax Group High
BlueScope Low
NASH Low for mainstream buildings
Medium for large and landmark buildings
PCA Low to Medium
Think Brick Medium
NSW Building Administration
Medium
MBA Closer to Low than to Medium or High
Source: Consultation RIS submissions as noted in the table
City of Parramatta Council suggests the Green Star analysis is flawed because predicted ‘normalised’ greenhouse gas emissions in design (or at the as-built stage) and the NABERS Benchmarking Factor in operation are
www.TheCIE.com.au
178 Decision Regulation Impact Statement

not comparable. The normalisation process and difference in input parameters such as area and hour of operation all affect the comparability.
Factors affecting the outcomeMost submissions acknowledge that outcomes are highly reliant on the modelled inputs and other factors. For example, PCA reckons the realisation of modelled outcomes is highly dependent not only on the professionalism of modelling, but also on the correct implementation of control strategies to reflect the modelling, the commissioning, and ongoing tuning and improvement of the building systems.Other stakeholders have made various plausible suggestions as to why the relationship implied by these results may not be representative of the commercial building sector more broadly, including the following:■ the sample includes only office buildings which may not be
representative of other types of commercial buildings;■ the actual performance was measured only two years after construction
and it may take several years to achieve optimal performance; and■ actual performance in any given year can be affected by factors such as
weather conditions and may not be representative of average performance over time.
Role of SHGCxWWR and U-ValueEnergy modelling conducted by EA found that SHGCxWWR is a dominant factor over U-Value in determining final energy consumption and construction costs. Stakeholders were asked if it is a new finding, and if they are aware of any overseas examples recognising the importance of SHGCxWWR.Most respondents including Benmax, G. James, Sustainability House, PCA, Think Brick and NSW Building Administration, agree with the proposition for daytime operating buildings and deny it is a new finding. An exception is JMG who suggests it is a new finding, and Australian industry has not adopted the approach because there are costs involved.G. James suggest that there is no evidence that a window with higher WWR is more expensive. Sustainability House suggests that there is no evidence a window with a higher U-Value can reduce heating and cooling loads.PCA argues that the proposed U-Value for overnight operating buildings presents a very significant challenge and feels a need for more clear definition of overnight operating buildings.
www.TheCIE.com.au
Decision Regulation Impact Statement 179

Most respondents do not answer the question about overseas examples. Those answering the question are not aware of any such examples.
Awareness of the importance of SHGCxWWR by the Australian industryMost submissions including PCA, NSW Building Administration, Think Brick and Benmax Group agree that the industry has recognised the importance of SHGCxWWR as an approach.G. James does not agree with the view that SHGCxWWR is the overriding factor for achieving reduced energy consumption in the Australian market. SHGC is virtually irrespective of WWR. ‘It is relatively easy with the combination of appropriate shading to specify a glazing system with little thermal moderation and still generate human comfort without resorting to over specification of artificial lighting and HVAC systems’.Stakeholders suggest reasons that prevent the findings from being adopted including:■ there are costs involved (JMG, Real Project Solutions);■ impediments from end users who want more natural light and views
(Benmax);■ the commercial building industry seeks low cost, as clear as possible
glazing as the ideal glazing in Australia (Sustainability House). The proposed requirement for glazing with SHGC 0.6 is too strict, especially for aged care facilities.
■ a lack of availability and choice of high performance façade elements (thermally broken window systems, argon-filled glass) as the demand in Australian has been restricted to leading projects, and thus having costs associated with it (PCA);
■ an international and domestic trend that the tenant leasing market moves towards higher floor to ceiling zones to improve penetration of natural light, clearer glass, and unencumbered views without external shading (PCA);
■ glazing is a valued building feature and thus it is very unlikely that industry will reduce window areas in buildings (NSW Building Administration).
Factors leading to lower energy consumption and lower construction costEnergy modelling has shown win-win results – lower energy consumption with lower construction costs. Further analysis suggests that the win-win
www.TheCIE.com.au
180 Decision Regulation Impact Statement

result could be affected by the underlying cost relationship. To better inform the cost benefit analysis, the following specific questions were asked:■ To what degree will the assumed window and insulation pricing affect
the win-win results?■ The EA window database suggests the market does not place a high
value on the more important performance measure (SHGC) of a window.– What is the reason for this?– Is this consistent with your experience?
■ Are there any other factors that could change the win-win results?
Window and insulation pricingIt seems this question was not well understood and answered directly in most cases. NSW Building Administration agrees window pricing has a significant impact on results.BlueScope and G. James offer alternative views on this point of WWR driving cost relationship. BlueScope notes that smaller windows may not necessarily be cheaper than larger windows in $/m2 terms due to the relatively higher proportion of frame and the need for thermal breaks. G. James on the other hand feels that windows have a relatively small impact on cost relationship and in doing so seems to confirm the DTS overstates the importance of U-Value at the expense of SHGC. It also notes that construction cost is dictated by the specifics of the building design and is relatively insensitive to window selections.Similarly NASH suggests that wall construction cost to achieve a particular R-Value is not a linear function, especially when thermal bridging is taken into account. Similar comments are made by BlueScope under Question 4.
Market does not place a high value on SHGC in window pricing?Again this question seems not be well understood. It is often that the submissions do not interpret ‘value’ as monetary value in price and/or cost, rather as technical value, that is importance in energy performance.Benmax Group does not agree with the statement and argues that SHGC is already factored into the Section J calculator and is identified by glazing manufacturers in their technical data.
www.TheCIE.com.au
Decision Regulation Impact Statement 181

G. James feels the statement seems ‘farfetched’ and suggests the information may not be correct – ‘it is difficult to know where this information could have been obtained regarding commercial construction’. It also notes that the draft provisions regarding DTS U-Value compliance overstates the importance of U-Value at the expense of SHGC in its market, which is reinforced by the orientation unspecific U-Value and SHGC provisions.Sustainability House agrees SHGC is a more important performance measure, citing more cost effective to go with clear as a reason. It is also consistent with its experience as ‘client would rather apply tint or reduce SHGC to achieve compliance than improve U value performance of glazing’.PCA, while supportive of the costings (if these have been provided by industry), suggests design solutions necessary to achieve compliance (particularly in the case studies) mean reduced WWR, reduced VLT and shading are at odds with tenant demands. It also notes the change will likely add 0-8 per cent to facade design costs for some building types.Think Brick argues that the energy provision in solar heat gain is not properly recognised to correctly value the performance measure.NSW Building Administration reckons that the market does use SHGC as a value to meet minimum requirements. Again this seems refer to technical value rather than market or monetary value.
Other factorsBenmax Group suggests the results could be affected by factors such as limited availability of triple glazed, vacuum sealed units in Australia, knowledge and cost of installing them, and matching mechanical systems to the WWR.It is suggested by G. James that thermal bridging requirements would provide the single largest lift in fabric performance. On this point NASH suggests that the cost of increasing R-Value is not linear as suggested by the analysis when thermal bridging is taken into account. Similar comments are made by BlueScope under Question 4.In addition to SHGCxWWR, Think Brick argues that the provision in thermal mass has not been adequately recognised.NSW Building Administration suggests some other factors such as constant WWR to be modelled; the impact on lighting energy consumption for spaces close to windows if dimming is used and when SHGCxWWR is reduced; and comparison of the thermal performance of the building shell.
www.TheCIE.com.au
182 Decision Regulation Impact Statement

Other unintended impacts of increasing the stringencyStakeholders were asked to comment on the impacts of increasing the stringency of the energy efficiency requirements on the NCC’s other goals on ■ safety (including safety from fire) and health;■ amenity; and■ accessibility.The responses are summarised in chart . Most respondents feel some degree of adverse impacts on these issues if the changes were not properly implemented. One exception is NSW Building Administration who reports stakeholders generally feel increased energy efficiency could lead to higher levels of amenity and health as working conditions, air temperature and air quality are likely to be better.
CError! No text of specified style in document.Error! No text of specified style in document.CCError! No text of specified style in document.81 Other unintended impacts
7
6
5
4
3
2
1
0
1
2
Safety and health Amenity Accessibility
Numb
er of
respo
nses
Positiveimpact
Adverseimpact
Data source: CIE construction based on consultation submissions
Stakeholders feel the changes will have negative impacts on:■ Safety and health – ASBEC, PCA, BlueScope, NASH, MBA, Sustainability
House■ Amenity – JMG, Benmax, G. James, Sustainability House, MBA■ Accessibility – PCA, GBCA, MBA, Think Brick (may have misinterpreted
the question as market access).
www.TheCIE.com.au
Decision Regulation Impact Statement 183

Safety and healthSustainability House suggests impacts on amenity, but three issues raised in the submission are related to safety and health. It is argued that low lighting levels could ‘result in difficulty seeing hazards, leading to collision or slippage’, and ‘result in persons coming in contact with hazardous materials/waste that might otherwise be avoided’. It is also mentioned that mandatory use of lighting control (motion detectors) in some areas of Class 6 Buildings ‘is likely to be high cost penalty with low energy efficiency impact’.BlueScope suggests continually increasing stringency leads to the risk of increasing the use of non-compliant products (cites board type insulation) which have poor fire performance because materials with greater fire performance are ‘significantly more expensive’ (no citation or further evidence provided). NASH also sees the risk from insulation suggesting the cheapest and best performing materials (foams) tend to be most combustible which are now less available with the release of (NCC) Amendment 1. Less combustible bulk fibrous materials require more space, and a foreseeable consequence may be ‘novel combinations of combustible materials’ that lead to undermining of the fire safety requirements. ASBEC, GBCA and PCA feel that increases in the stringency of energy efficiency requirements could impact on safety and health if not properly implemented, and suggest that there is a role for government to improve industry capacity by providing or supporting the provision of training and to improve monitoring and enforcement. It is also suggested provisions to mitigate the risk of unintended consequences could be potentially included in relevant sections of the code.
AmenityJMG points to amenity as an unintended impact, but does not provide further comments. Benmax Group argues that ‘reduction in light and in views will definitely be seen as a reduction in amenity’.G. James highlights lighting level concerns as an area of diminished amenity and Sustainability House echoes this view and suggests this may lead to safety issues (see above). PCA notes the difficulties achieving compliance in Class 9 buildings (WWR and the need for views and amenity for Class 9 occupants) will likely lead to the need for reduced window sizes due to stringency and this will impact on amenity. MBA believes changes will negatively impact occupant amenity by reducing natural light and view resulted from reducing WWR (smaller windows). It goes further drawing on the philosophical argument energy
www.TheCIE.com.au
184 Decision Regulation Impact Statement

efficiency is regionally specific and argues the NCC is the wrong place for the regional specific technical regulation. It feels the principle goals of minimum necessary standards are now moved to more of a best practice standard.
AccessibilityIt is generally noted in submissions that the NCC is complex and ‘some operators are not equipped with the appropriate knowledge and skill’ (ASBEC, PCA and GBCA).PCA also provides specific suggestions to assist industry including ■ guidelines in plain English; ■ simple calculators for the DTS façade provisions;■ training materials and courses for designers, architects, builders,
surveyors and consultants, and ■ an online forum for Q&A.
www.TheCIE.com.au
Decision Regulation Impact Statement 185
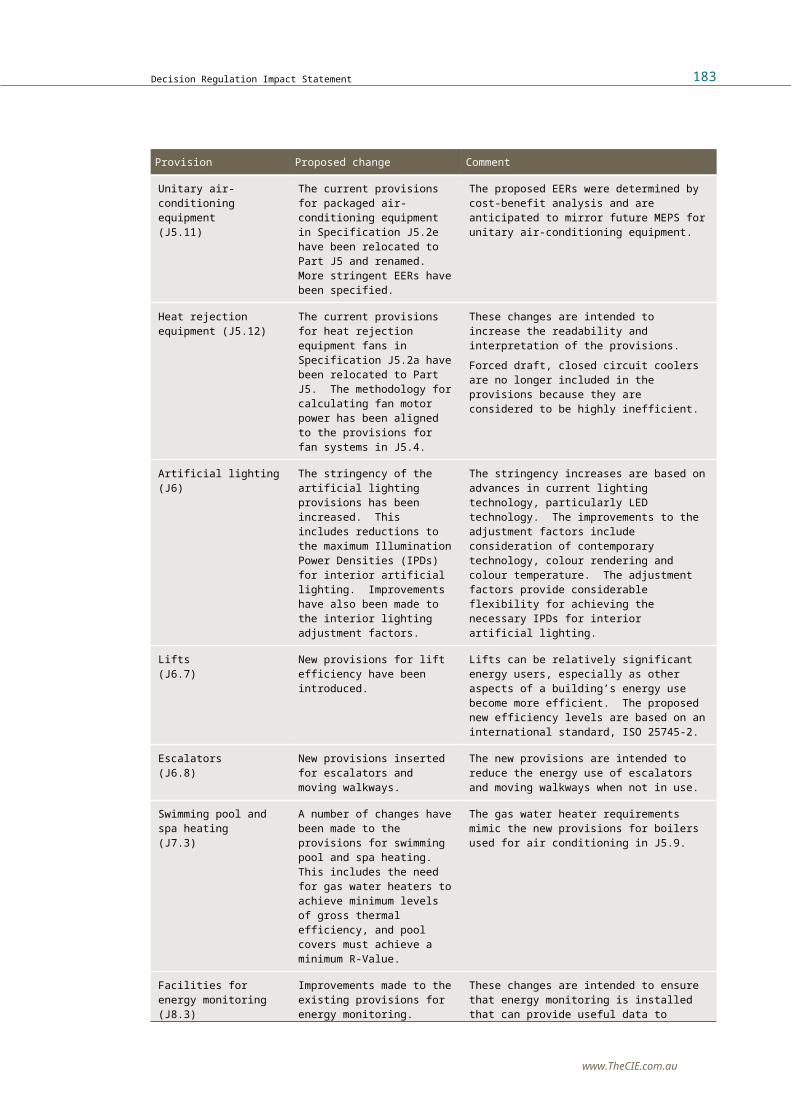
B Are modelled energy savings realised?
Over-estimation of energy savingsSeveral international studies have noted that engineering calculations may be prone to overstating the energy savings from particular energy efficiency investments.91 Analyses that rely on engineering estimates could therefore overstate the size of the energy efficiency gap.This was a key concern of the Productivity Commission in its 2005 Inquiry into the Private Cost Effectiveness of Improving Energy Efficiency. In particular, the Commission was concerned that the analytical basis for minimum energy efficiency standards for buildings (computer simulations of energy loads within buildings in each Climate Zone) may be flawed.92 The National Energy Efficient Buildings Project also noted that the NCC focuses on the energy performance of building designs rather than actual buildings, which risks creating a gap between design performance (which at best can be simulated or modelled) and actual energy use (which can be measured).93
The performance gapComparing modelled building energy consumption with actual outcomes is a challenging exercise due to a range of issues, including the availability of relevant data.In reviewing the performance of energy modelling it is important to make a distinction between the following:■ Absolute performance — we use this term to refer to a comparison
between a building’s actual energy consumption with modelled outcomes. As a building’s actual energy consumption is directly observable, it is relatively straightforward to compare this to predicted outcomes (subject to data availability).
91 See for example, Gillingham, K. and Palmer, K. 2014, “Bridging the Energy Efficiency Gap: Policy Insights from Economic Theory and Empirical Evidence”, Review of Environmental Economics and Policy, volume 8, issue 1, p. 21.
92 Productivity Commission 2005, The Private Cost Effectiveness of Improving Energy Efficiency, Productivity Commission Inquiry Report No. 36, 31 August 2005, p. XXXVIII.
93 pitt&sherry 2014, National Energy Efficient Building Project: Final report, prepared for Department of State Development, Government of South Australia, November 2014, p. 75.
www.TheCIE.com.au
186 Decision Regulation Impact Statement

■ Relative performance — this refers to the energy savings achieved by specific building features, compared to alternative, less energy efficient, design options (i.e. a baseline).94 The challenge in comparing actual and modelled energy savings is that energy consumption for the alternative building design (i.e. the design that was not built) is not directly observable.
Arguably, it is the relative performance that is important. Some stakeholders argued that the (actual) performance gap is mainly due to poor operational practices. As such, having more energy efficient design features will achieve similar energy savings, regardless of how efficiently the building is operated. The literature seems to use the term ‘performance gap’ interchangeably. However, there is evidence of a performance gap in both absolute and relative terms.
Absolute performanceThere are numerous international studies showing a gap between actual energy consumption and predicted outcomes.■ Frankel and Turner (2008a) compared the predicted energy use
intensity (EUI) with actual EUI for a sample of 91 buildings certified under the United States Green Building Council’s Leadership in Energy and Environmental Design (LEED) program. This sample was split into: 71 medium energy use buildings; and 20 high energy use buildings.– In medium energy use buildings, on average modelling accuracy was
found to be quite good, with the ratio of measured to design EUI around 92 per cent across the whole sample. However, the accuracy of individual project energy use was found to be very inconsistent, with the actual to predicted energy use varying widely across projects.95
– For high energy use buildings, the alignment between predicted and actual energy use was found to be very poor. On average, high energy use buildings in the sample used nearly two-and-a-half times as much energy as predicted.96
■ A Canadian study undertook a detailed building performance evaluation (BPE) of 9 ‘high performance’ commercial buildings (including: five academic buildings at universities or colleges, three private or public office buildings, and one community building) and found that there
94 Frankel, M. and Turner, C. 2008a, “How Accurate is Energy Modelling in the Market”, New Buildings Institute, ACEEE Summery Study on Energy Efficiency in Buildings, pp. 3-90—3-91.
95 ibid, pp. 3-91—3-93.96 ibid, pp. 3-91—3-100.
www.TheCIE.com.au
Decision Regulation Impact Statement 187

were significant variations across buildings. Although actual EUI was higher than predicted in most buildings (7 out of 9), in all but one case, energy consumption was lower than a typical building of its type.97
■ The UK Government recently funded an evaluation of building performance for non-domestic (commercial) buildings. The evaluation covered 48 commercial buildings, including schools and higher education buildings, offices, community centres, supermarkets, hotels and restaurants, visitor centres, healthcare and libraries.98
– Only one building produced emissions similar to those predicted. The remaining buildings produced emissions between 1.8 and 10 times the predicted level, with the average carbon emissions 3.8 times higher than predicted.
– That said, predicted emissions only account for loads that fall under Building Regulations (regulated loads), which includes heating, cooling, ventilation and lighting. Other types of energy uses, such as small power, IT and external lighting (unregulated loads) are excluded.99 The exclusion of unregulated loads from predictions accounts for some of the discrepancy.
■ According to the Carbon Trust100, evidence from 28 case studies found that 75 per cent of designs did not perform as well as expected.101 In one case, actual energy consumption in the first year of operation was five times the modelled estimate. On average, the gap was around 16 per cent.
Relative performanceAs outlined above, it is generally more difficult to compare modelled and actual energy savings because the counterfactual (i.e. the building without energy efficient design features) cannot be observed.One strand of the international literature compares energy consumption in buildings with some form of energy efficiency certification (such as LEED
97 Bartlett, K. Brown, C., Chu, A. Ebrahimi, G. Gorgolewski, M. Hodgson, M. Issa, M. Mallory-Hill, S. Ouf, M. Scannell, L. and Turcato, A. 2014. “Do our green buildings perform as intended?”, paper presented at World Sustainable Building Conference (SBE 2014), Barcelona, Spain, p. 5.
98 Innovate UK 2016, Building Performance Evaluation Programme: Findings from non-domestic projects, Getting the best from buildings, January 2016, p. 6.
99 ibid, p. 22.100 The Carbon Trust is a United Kingdom-based independent, expert partnership
of leading organisations around the world, helping them contribute to and benefit from a more sustainable future through carbon reduction, resource efficiency strategies and commercialising low carbon technologies.
101 The Carbon Trust 2011, Closing the gap: Lessons learned on realising the potential of low carbon building design, p. 2.
www.TheCIE.com.au
188 Decision Regulation Impact Statement

certification) with non-accredited buildings or some form average across the building stock. Similar to the AGBC’s Green Star system, the LEED certification scheme awards points for energy efficiency improvements relative to a hypothetical baseline model based on a minimum standard. Although these studies mostly focus on assessing the performance of certified ‘green buildings’ relative to other buildings, this nevertheless provides some insights into the accuracy of energy modelling.The Frankel and Turner (2008a) study referred to above provides some insights into relative savings, finding that the broad conclusions in relation to relative performance was broadly similar to those for absolute performance.■ In particular, there was significant variations across buildings, with 25
per cent of buildings achieving savings well above predicted outcomes and 21 per cent estimated to perform worse than the code baseline.102
■ The study also notes a lack of correlation between measured Energy Use Intensity (EUI) and initial proposed EUI. Furthermore, projects with more aggressive energy performance goals generate overly optimistic predictions of actual energy use.103 This suggests that predicted energy savings may not be achieved in practice.
Another study by Frankel and Turner (2008b) compared the actual building performance of a sample of 121 LEED certified buildings with a range of benchmarks, including EUI relative to national average, Energy Star ratings and energy use levels relative to code. The study found that the performance of LEED certified buildings was around 25-30 per cent better than the benchmarks. This was broadly in line with predictions, although there was wide variation within the individual results.104
However, this study was criticised for its lack of statistical analysis and for comparing the median of the sample of LEED certified buildings with the mean across the national building stock.105
Another study of 25 buildings (including 6 college/university buildings, 10 multifamily residential buildings106 and 9 office buildings) determined energy savings using the as-designed building model calibrated to actual
102 Frankel, M. and Turner, C. 2008a, “How Accurate is Energy Modelling in the Market”, New Buildings Institute, 2008 ACEEE Summery Study on Energy Efficiency in Buildings, pp. 3-90—3-94.
103 ibid, pp. 3-90—3-95.104 Frankel, M. and Turner, C. 2008b, “Green Building Performance Evaluation:
Measured Results from LEED-New Construction Buildings”, 2008 ACCEEE Summer Study on Energy Efficiency in Buildings, p. 4-329.
105 See Mehdi S. Kaddory Al-Zubaidy, 2015, “A Literature Evaluation of the Energy Efficiency of LEED-Certified Buildings”, American Journal of Civil Engineering and Architecture, p. 4.
106 Note that residential buildings are not relevant to the RIS.
www.TheCIE.com.au
Decision Regulation Impact Statement 189

energy consumption to estimate gross energy consumption of the baseline building. This was then compared to actual energy consumption.107 This study found that on average (weighted by gross square footage), around 90 per cent of predicted savings were realised.108 One limitation of this study is it relied on modelled estimates of energy consumption under alternative designs, albeit estimates that were calibrated to actual outcomes.
Australian evidenceThere are few Australian studies comparing predicted and actual outcomes. The (previous) Department of Climate Change and Energy Efficiency commissioned a quantitative assessment of energy saving from building energy efficiency measures. However, for the energy performance requirements in the BCA, this study relied on the ex-ante modelled estimates from the relevant RISs, rather than an analysis of actual savings.109
Based on the (albeit relatively limited) evidence available, we find that:■ the relationship between modelled and actual performance is relatively
weak;■ there is significant variation across buildings; and■ as low as only around half of modelled energy savings are achieved in
practice.These findings are broadly consistent with some findings in the international literature (see above). In particular:■ a number of studies from the UK and US found that modelled outcomes
tend to understate actual outcomes in absolute terms and there is significant variation in performance relative to predictions across buildings;110
107 Crop, J. Lee, A. and Castor, S. Evaluating Results for the LEED Buildings in an Energy Efficiency Program, Prepared by Cadmus for the Energy Trust of Oregon, pp. 3-4.
108 ibid, pp. 7-8.109 See pitt&sherry 2013, Final Report: Quantitative Assessment of Energy
Savings from Building Energy Efficiency Measures, Prepared for the Department of Climate Change & Energy Efficiency, 20 March 2013, p. 5.
110 See for example: Frankel, M. and Turner, C. 2008a, “How Accurate is Energy Modelling in the Market”, New Buildings Institute, ACEEE Summery Study on Energy Efficiency in Buildings, pp. 3-90—3-91; Innovate UK 2016, Building Performance Evaluation Programme: Findings from non-domestic projects, Getting the best from buildings, January 2016; and The Carbon Trust 2011, Closing the gap: Lessons learned on realising the potential of low carbon building design.
www.TheCIE.com.au
190 Decision Regulation Impact Statement

■ Frankel and Turner (2008a) also found that projects with more aggressive energy performance goals generate overly optimistic predictions of actual energy use, implying that modelled energy savings may not be achieved in practice.111
Green Star dataThe only Australian study identified that compares modelled with actual outcomes was prepared by the Green Building Council of Australia (GBCA) using a sample of 70 office buildings for which relevant data were available.112 The GBCA compared:■ predicted greenhouse gas emissions (in levels, rather than savings)
available from Green Star certification records (in terms of both predicted ‘normalised emissions’ in KgCO2-e and predicted NABERS Energy stars); with
■ actual greenhouse gas emissions (also in levels) available from the NABERS Energy data base (also in terms of ‘benchmarking factor’ and actual NABERS Energy stars, both without GreenPower).
The study mostly focused on whether modelled star ratings were achieved in practice. The GBCA found that:■ 57 per cent of buildings in the sample achieved the predicted star
rating or better (including 19 per cent that performed better than predicted); and
■ a further 26 per cent of buildings in the sample were within 1 star of the predicted outcomes.113
Using the same data, we assess the accuracy of predictions by regressing actual GHG emissions on predicted GHG emissions, based on 61 observations where both predicted and actual GHG emissions were reported. Given the emission factors are constant in each location, GHG emissions should be commensurate with energy consumption (unless there is a significant change in the energy mix).Where predictions are perfectly accurate, each observation would fall on the red (y=x) line (chart ). However, these data suggest that energy efficiency modelling does a relatively poor job of predicting actual outcomes.■ The relationship between predicted and actual GHG emissions is weak.
111 Frankel, M. and Turner, C. 2008a, “How Accurate is Energy Modelling in the Market”, New Buildings Institute, ACEEE Summery Study on Energy Efficiency in Buildings, pp. 3-90—3-95.
112 Bell, H., Millagre, R. and Sanchez, C.2013, Achieving the Green Dream: Predicted vs Actual, Green Building Council of Australia, August 2013.
113 ibid, pp. 6-10.
www.TheCIE.com.au
Decision Regulation Impact Statement 191

– Although the line of best fit is upward sloping — implying that predicted greenhouse gas savings are associated with reduced greenhouse gas emissions in practice — this relationship is not statistically significant (formally, we cannot reject the hypothesis that the slope coefficient is equal to zero at the 90 per cent level of significance).
– The coefficient of determination (R2) is low at around 0.03. This implies that the modelling can explain only around 3 per cent of the variance in actual GHG emissions.
■ Also, these data generally do not support the proposition that modelled energy savings are achieved in practice.– This proposition would imply the line of best fit would have a slope
close to 1 (albeit with an intercept greater than zero).– However, the slope coefficient for the line of best fit (i.e. the grey line
in chart ) is 0.49, suggesting that as low as only around half of modelled energy savings are achieved in practice.
– That said, the hypothesis that the slope coefficient is equal to 1 cannot be formally rejected due to the high standard error. The 95 per cent confidence interval for the slope coefficient is between -0.17 and 1.16.
DError! No text of specified style in document.Error! No text of specified style in document.DDError! No text of specified style in document.82 Relationship between predicted and actual GHG emissions
y = 0.4909x + 62.874R² = 0.0342
0
50
100
150
200
250
300
350
0 20 40 60 80 100 120 140
Actu
al GH
G em
ission
s (Kg
CO2-
e/m
2 /an
num
)
Predicted GHG emissions (Kg CO2-e/ m2/ annum)
Best fit
Actual = Predicted
Data source: CIE based on data in Bell, H., Millagre, R. and Sanchez, C. 2013, Achieving the Green Dream: Predicted vs Actual, Green Building Council of Australia, August 2013, pp. 17-20.
Discussions with the GBCA suggested that the performance of new buildings can improve as building management improves. It is therefore possible that actual performance moves closer to predictions over time.
www.TheCIE.com.au
192 Decision Regulation Impact Statement

We understand that the GBCA are currently revisiting this study with a larger sample. This new study should provide some insights into whether the performance of Green Star rated buildings improved over time.
Are these findings driven by outliers?
In chart above, there are a number of obvious outliers where actual GHG emissions are significantly higher than predicted. To assess the extent the above findings are driven by these outliers, we exclude all observations where actual GHG emissions were more than 100 Kg CO2-e higher than predicted (5 observations, grey triangles in chart ).When the 5 outliers are excluded there is a significantly closer relationship between predicted and actual outcomes.■ When the outliers are excluded, the relationship between predicted and
actual outcomes is statistically significant and the ‘fit’ improves (i.e. the R2 increases to around 0.3, implying that modelling can explain around 30 per cent of the variance in actual GHG performance).
■ The slope coefficient is around 0.75, implying that around 75 per cent of modelled energy savings are achieved in practice. The 95 per cent confidence interval is between 0.44 and 1.05.
DError! No text of specified style in document.Error! No text of specified style in document.D Relationship between predicted and actual GHG emissions — excluding outliers
y = 0.7495x + 31.306R² = 0.3032
0
50
100
150
200
250
300
350
0 20 40 60 80 100 120 140
Actu
al GH
G em
ission
s (Kg
CO2-
e/m
2 /an
num
)
Predicted GHG emissions (Kg CO2-e/m2/ annum)
Observations includedExcluded outliersBest fitActual = Predicted
Data source: CIE based on data in Bell, H., Millagre, R. and Sanchez, C. 2013, Achieving the Green Dream: Predicted vs Actual, Green Building Council of Australia, August 2013, pp. 17-20.
That removing outliers improves the fit of the data is not surprising. That said, even when the outliers are excluded, there remains significant variation in the relationship between actual and predicted outcomes across buildings and it appears likely that modelled energy savings are not fully realised.
www.TheCIE.com.au
Decision Regulation Impact Statement 193

‘As designed’ versus ‘as built’
The Green Star data also distinguishes between buildings that used the former ‘Green Star — Office Designed’ rating tool and the ‘Green Star — Office As Built’ rating tool. Where projects were rated with both tools, only the data from the ‘As Built’ rating was considered. Note that these separate tools have now been combined and an additional Green Star tool that focuses on building performance has been developed.The Green Star ‘as designed’ rating is based on an assessment of the building’s design. The dataset we used includes 30 ‘as designed’ ratings. As compliance with Section J of the NCC is certified based on the building’s design, the Green Star ‘as designed’ rating most closely reflects the compliance process for the NCC.The same broad conclusions as above can be inferred from the ‘as designed’ ratings only. Specifically:■ the relationship between predicted and actual outcomes is weak
(chart ); and■ as low as only a bit more than half (around 53 per cent) of predicted
outcomes based on the building’s design are realised (based on a slope coefficient of 0.53).
DError! No text of specified style in document.Error! No text of specified style in document.D Relationship between predicted and actual GHG emissions — as designed
y = 0.5392x + 68.141R² = 0.0205
0
50
100
150
200
250
300
350
0 20 40 60 80 100 120
Actu
al GH
G em
ission
s (Kg
CO2-
e/m
2 /an
num
)
Predicted GHG emissions (Kg CO2-e/ m2/ annum)
Best fit
Actual = Predicted
Data source: CIE based on data in Bell, H., Millagre, R. and Sanchez, C. 2013, Achieving the Green Dream: Predicted vs Actual, Green Building Council of Australia, August 2013, pp. 17-20.
There are also 30 observations based on the Green Star ‘as built’ tool. The ‘as built’ ratings are based on the building as it was actually constructed. In principle, it would be reasonable to expect a closer relationship between predicted and actual outcomes based on ‘as built’ ratings, compared to ‘as designed’ ratings on the basis that variations between design and the
www.TheCIE.com.au
194 Decision Regulation Impact Statement

building ‘as built’ are one factor that could potentially explain the energy efficiency gap.■ However, somewhat surprisingly, the relationship between predicted ‘as
built’ and actual outcomes is equally weak (chart ). This suggests that the performance gap may not be a result of non-compliance, where the building is not built to the certified design.
■ The slope coefficient suggests that only around 36 per cent of modelled energy savings are realised in practice.
DError! No text of specified style in document.Error! No text of specified style in document.D Relationship between predicted and actual GHG emissions — as built
y = 0.3615x + 63.223R² = 0.0459
0
50
100
150
200
250
0 20 40 60 80 100 120 140
Actu
al GH
G em
ission
s (Kg
CO2-
e/m
2 /an
num
)
Predicted GHG emissions (Kg CO2-e/ m2/ annum)
Best fit
Actual = Predicted
Data source: CIE based on data in Bell, H., Millagre, R. and Sanchez, C. 2013, Achieving the Green Dream: Predicted vs Actual, Green Building Council of Australia, August 2013, pp. 17-20.
Limitations
A submission from Parramatta City Council argued that predicted ‘normalised’ greenhouse gas emissions in design (or at the as-built stage) and the NABERS Benchmarking Factor in operation are not comparable, implying that no conclusions on the accuracy of modelled outcomes can be drawn from the above analysis.NABERS Benchmarking Factors are designed to enable a fair comparison between buildings (or tenancies). Benchmarking Factors are calculated by applying correction factors to the actual emissions of the rated premise to account for building/tenant operational factors, such as building area, hours of use, climate, equipment density and greenhouse intensity of the energy source.114
Conceptually, applying these corrections is appropriate to ensure comparability. For example, if a building produces the same greenhouse
114 NABERS, NABERS Energy for office Benchmarking Factors, 18 August 2011.
www.TheCIE.com.au
Decision Regulation Impact Statement 195

gases as modelled, yet the occupied floor area is smaller and/or the operating hours are shorter than assumed in the modelling, the building would appear to be operating less efficiently than modelled.Modelled energy performance can vary from actual energy performance for a number of reasons, including that the actual operation of the building may be difficult to predict and may not reflect the assumptions used in modelling (see appendix D for more discussion of the factors that may contribute to the performance gap). In this regard, the observation that input assumptions used in modelling vary from actual operation reinforces the point that a specific building’s energy performance is inherently hard to predict, even where the model accurately captures the physical relationships between building design and energy performance. Actual energy performance will depend on the interaction between the technical energy efficiency of the building as well as behavioural aspects.However, the argument here is that the algorithms used to correct for differences in floor area, hours of operation and climate introduces distortions.■ Flux Consultants who prepared the submission on behalf of Parramatta
City Council argues that the algorithms used to normalise energy performance are based on limited and now out-of-date datasets that were available when the Australian Building Greenhouse Rating scheme (the forerunner to NABERS) was established in 1998. Subsequent analysis based on an expanded dataset (available through the CBD program) has suggested that some of the relationships used to normalise energy performance may be unreliable.115
■ Furthermore, the submission argues that the NABERS Benchmarking Factor is based on greenhouse gas emissions factors from 1998, which are now out-of-date, particularly in areas where the greenhouse gas intensity of electricity has declined significantly. This means that the Benchmarking Factors are not comparable with modelled greenhouse gas emissions, which are based on current greenhouse gas emissions factors.116
Other stakeholders have made various plausible suggestions as to why the relationship implied by these results may not be representative of the commercial building sector more broadly, including the following:■ the sample includes only office buildings which may not be
representative of other types of commercial buildings;■ the actual performance was measured only two years after construction
and it may take several years to achieve optimal performance; and
115 Flux Consultants, Beneath the Stars: Data Empowerment for the Next Generation of Sustainable Property, 19 June 2014, p. 24.
116 Submission from Parramatta City Council, p. 4.
www.TheCIE.com.au
196 Decision Regulation Impact Statement

■ actual performance in any given year can be affected by factors such as weather conditions and may not be representative of average performance over time.
On the other hand, participants in the voluntary Green Star scheme that may also be required to obtain a NABERS rating would be expected to be more conscious of their energy performance than other building owners.
NABERS commitment agreementsThe extent to which the targets specified in NABERS Commitment Agreements are being achieved is another potential indicator of whether modelled outcomes are being realised. Data provided by the NSW Office of Environment and Heritage (the NABERS administrator) shows that of the 115 completed NABERS Commitment Agreements for which data are available, 105 (or 91 per cent) achieved their targeted star rating (table ). However, data on modelled GHG emission and/or energy consumption performance was not available.
D11D NABERS Commitment AgreementsCompleted NABERS
Commitment AgreementsStar rating target not
achievedStar rating target
achieved
No. No. Per cent
4 stars 7 0 1004.5 stars 66 8 885 stars 40 1 985.5 stars 1 0 1006 stars 1 1 0Total 115 10 91
Source: NSW Office of Environment and Heritage.
The percentage of NABERS Commitment Agreements that have achieved their star rating target is significantly higher than the 57 per cent of buildings in the Green Star sample discussed above. This could potentially indicate that a closer relationship between predicted and actual outcomes than estimated above. However, it is possible that owners that enter into NABERS Commitment Agreements are relatively conservative in the star rating they are willing to commit to.■ We note that the targeted star ratings are relatively unambitious; in only
two cases, the targeted star rating was higher than 5 stars.■ Furthermore, there are several NABERS Commitment Agreements where
the targeted star rating is only 4 stars. As the current minimum standards in the NCC are around 4.5 to 5 stars, it is doubtful that a 4 star rating would be compliant.
www.TheCIE.com.au
Decision Regulation Impact Statement 197

It is therefore difficult to draw firm conclusions from NABERS Commitment Agreements.
Reasons why predicted energy savings may not be realisedThere are a range of explanations for the performance gap at all stages of a building’s life cycle. Modelling is an abstract form of the reality which tends to differ in many cases from some of assumptions made in the modelling.■ Design and construction phase — the NCC focuses on building design, but
there can be gaps between a building’s design and the building actually constructed.– The National Energy Efficient Buildings Project also noted that
anecdotally, energy efficiency features and technologies are eliminated during the design and construction process. Budget constraints often force the building developer (not necessarily the ultimate owner) to choose between energy performance and other design elements that are more highly valued.117 However, no quantitative evidence on the extent to which this occurs was reported.
– The UK Carbon Trust also noted that:… the aim to make building low carbon in-use is not clearly conveyed
to the design team; and… design intent is not delivered on-site during construction. 118
■ Operation phase — building operation could contribute to the performance gap, including:– A lack of adequate commissioning and maintenance — the National
Energy Efficient Buildings Project reported that a perceived lack of adequate commissioning for new and renovated commercial buildings and ongoing maintenance was likely to be contributing to poor energy efficiency outcomes. As buildings aim for higher energy efficiency, integrating all of the relevant systems and ensuring that they deliver intended outcomes, through all seasons and weather conditions becomes more challenging. This means there is often greater scope for high performance buildings to deviate from design energy
117 pitt&sherry 2014, National Energy Efficient Building Project: Final report, report prepared for Department of State Development, Government of South Australia, November 2014, pp. 65-66.
118 Carbon Trust 2011, Closing the gap: Lessons learned on realising the potential of low carbon building design, p. 4.
www.TheCIE.com.au
198 Decision Regulation Impact Statement

consumption than simpler, ‘refrigerated boxes’.119 This finding was based on industry perceptions, rather than quantified evidence.
– Sub-optimal building operation.– Occupancy patterns and behaviour — occupancy patterns can be
difficult to predict and where they vary from those modelled, this could contribute to the performance gap. Similarly, the behaviour of building occupants can have a significant impact on energy consumption.
■ Modelling failures — a recent UK study (albeit in relation to residential buildings) found that a sample of 108 building modellers found that there was little correlation between variables that the modellers considered to be important to annual energy demand and the factors that were objectively found to be important.120 On this basis, the study concluded that this sample of building modellers, and by implication the population of building modellers cannot be considered ‘modelling literate’. This suggested that the performance of building modellers was contributing to the performance gap. Although these findings have no direct relevance to commercial building energy modellers in Australia, it nonetheless demonstrates that energy modelling involves subjective judgement and modellers are not infallible.
119 pitt&sherry 2014, National Energy Efficient Building Project: Final report, report prepared for Department of State Development, Government of South Australia, November 2014, pp. 65-66.
120 Imam, S. Coley, D.A. and Walker, I. 2017, “The building performance gap: Are modellers literate?”, Journal of Building Services Engineering Research & Technology, 38(3), pp.351-375.
www.TheCIE.com.au
Decision Regulation Impact Statement 199

A Commercial building construction projections
The net benefit of the proposed changes to the NCC will reflect the impacts to the sum of the components of individual building classes, across Climate Zones. The proposed changes will affect new or refurbished commercial buildings from 2019. This appendix presents the projected stock of buildings that may be subject to both benefits and costs associated with the proposed changes to the NCC. In providing this we:■ update previous estimates of the commercial building stock by class to
the base year of 2017■ estimate the rate of additions to the building stock by class of building,
in terms of both net additions and replacements of retired buildings out to 2049 (for 30 years)121, and
■ separately estimate the potential rate of refurbishment that would affect the existing stock of buildings.
Given the relevant period for evaluation is 10 years from the introduction of the changes, our reporting of these projections focuses on the period of 2019-29.
Background and approachThere are two previous sources of estimates of the commercial building stock, in terms of floor area, across multiple classes: ■ Baseline energy consumption and greenhouse gas emissions in
commercial buildings in Australia, prepared by pitt&sherry (with input from BIS Shrapnel and Exergy Pty Ltd) for the COAG National Strategy on Energy Efficiency, in 2012.
■ Economic evaluation of energy efficiency standards in the Building Code of Australia, prepared by the CIE for the Department of the Environment, Water, Heritage and the Arts, in 2009.
While the work by pitt&sherry in 2012 provides the most recent estimates of the Australian commercial building stock, it is important to note the following key limitations of these estimates:
121 Although only 10-year projection of new buildings after 2019 is relevant for this project, the longer period projection is presented so that we can examine if the projection is consistent with the long term trend.
www.TheCIE.com.au
200 Decision Regulation Impact Statement

■ It was a stock model (estimating total, rather than turnover), and not able to separately estimate additions, refurbishments or retirements.
■ The scope of the exercise excluded a number of important building classes, including:– industrial buildings such as factories– other industrial buildings such as warehouses, cool rooms and
freezers;– standalone aged care facilities– undercover car parks; and– a range of other building classes that are potentially less important
to this evaluation such as health clinics and doctors’ surgeries, and hotels and motels with less than five rooms.
The CIE’s updated commercial building stock estimates principally utilise the pitt&sherry estimates to 2020. However, we overcome the limitations of the exclusions by separately estimating the floor space of ‘industrial’ buildings such as factories, warehouses and storage, undercover car parks and standalone aged care residences. It remains a model that estimates the total floor area for each building class, with the difference between each year reflecting the rate of ‘net addition’ (including the replacement of retirements). To establish the total rate of addition (to account for retirements) we separately estimate the rate of building retirements across the whole building stock and add these to the ‘net additions’ to get total additions. Also, we attempt to shed light on the extent of major refurbishments separately.
The concordance of building classes in the NCC against the pitt&sherry categories and 2009 CIE stock estimates are shown in table E.1.
E11EE183 Categories of commercial buildings and base data sourceBuilding classes pitt&sherry Stock estimates, base year
Class 3
Residential component of hotels, motels, schools,
Hotels pitt&sherry
www.TheCIE.com.au
Decision Regulation Impact Statement 201

Building classes pitt&sherry Stock estimates, base year
hospitals and jails
Class 5
Office buildings a that are used for professional or commercial purposes, excluding Class 6, 7, 8 or 9 buildings
Standalone offices pitt&sherry
Class 6
Buildings typically shops, restaurants, and cafes
Retail (shopping centres, supermarkets and retail strips)
pitt&sherry
Class 7a
Car parks CIE estimates: We utilise the Deloitte Access Economics/ Colliers Edge b of non-residential car spaces per 100 CBD workers, applying the proportion for ‘Sydney’ as a guide for the ratio of undercover car parks per full time worker (12.2 per 100 workers). c We apply this ratio to the number of employed persons of working age in each capital city. For workers located outside of each capital city, we assume a rate of one tenth the proportion of car spaces per worker in cities. Each car space is assumed to require 32 m2 of building. Estimates were crosschecked with building approval data for ‘transport buildings’, and are consistent with 50 per cent of this category of planned expenditure being for underground car parks.
Class 7b
Typically warehouses, storage buildings or buildings for the display of goods (or produce) that is for wholesale
Not included CIE estimates: base year reflects Australian National Accounts value of Australian production across storage and warehousing categories (of $6.98 billion in 2013-14, scaled by the rate of economic growth to $7.70 billion in 2016-7), divided by the estimated revenue per $m for each State/Territory (ranging from $61 per m2 to $130 per m2)
Class 8Factory Not included CIE (2009) of 25 million m2 (assuming a 2
per cent rate of stock replacement) scaled to 2017 by the change in Gross Value Added of mining and manufacturing sectors.
Class 9a
Generally hospital buildings Hospitals pitt&sherry
www.TheCIE.com.au
202 Decision Regulation Impact Statement

Building classes pitt&sherry Stock estimates, base year
Class 9b
Buildings in which people gather for social, theatrical, political, religious or civil purposes Incorporates schools, universities, VET buildings and public buildings/law courts, as well as aged care
Schools Universities VET buildings Public buildingsLaw courts
pitt&sherry
Class 9c
Buildings used as residential accommodation for elderly people who, due to varying degrees of incapacity associated with the ageing process, are provided with personal care services and 24 hour staff assistance to evacuate the building in an emergency.
Aged care Aged care: Estimated by the number of residential aged care places by the average floor area per resident
a Note that the CIE excludes non-standalone offices for which the pitt&sherry work provided stock but no energy intensity per floor area estimates. These are expected to be comprised (at least in part) of residential based offices. b Available at Colliers International 2015, The evolution of car parking – technology creating risk and opportunity. https://www.commercialrealestate.com.au/news/wp-content/uploads/2015/07/Car-Parking-White-Paper-2015-1.pdf c The CIE understands that the data reflects both undercover and open car parks. While the rate of car parks per worker is as high as 20 per 100 workers in locations such as Canberra, to be conservative we assume that this relates to open car parks which are not present (as a standalone commercial use) of land in the Sydney CBD. Source: CIE (2009), pitt&sherry (2012), ABCB (2017). Colliers International (2015).
Estimates of the existing stockThe estimated floor space of Australia’s commercial building stock in 2017, by type, is shown in table E.2. In total, we estimate that there is approximately 360.2 million square metres of floor space across commercial buildings in Australia. This is equivalent to an increase of approximately 9 per cent above the level in 2012. The floor area associated with warehousing and storage has the potential to be around 92.7 million square metres, or twice the size of standalone offices. Acknowledging the uncertainty surrounding the precise floor area for this building class, even if the CIE’s estimate were too high by 20 per cent with respect to warehouse and storage area, it would remain at least as large as Australia’s retail area. Furthermore, the CIE’s estimates are in line with (lower than) those of Savills Research who estimates there is ‘some 100 million square metres of industrial floor space in Australia’.122
122 Savills Research 2017, Key Australian industrial sales transactions, February 2017, http://pdf.savills.asia/asia-pacific-research/australian-research/australia-industrial/savillsresearch-spotlight-keytransactions-industrialsales2017.pdf.
www.TheCIE.com.au
Decision Regulation Impact Statement 203

The second largest category of commercial building floor space is retail, incorporating supermarkets, shopping centres and retail strips, with an estimated 72.6 million square metres. Approximately 41.3 million square metres is estimated to be comprised by retail strips, followed by 22.6 million square metres in shopping centres. Note that the estimated area of shopping centres is consistent with those published by the Australian Shopping Centre Industry in 2015 (at 22.9 million).123
The third largest category is education buildings (at 62.6 million square metres), comprising of schools, VET buildings and universities. Schools are expected to account for approximately 70 per cent of this category.
E11E Estimated commercial building floor space in 2017Estimated floor space Share of the building stock
000 m2 %
Warehouse and storage 92 718 25.7
Retail 72 609 20.2Education 62 593 17.4Standalone offices 42 848 11.9Factories 29 330 8.2Car parks 28 515 7.9Hospital 13 984 3.9Hotel 11 787 3.3Aged care 5 734 1.6Total 360 118 100.0
Source: CIE.
ProjectionsThe commercial building stock, as well as other growth factors with respect to the economy and international demand, account for the change in stock over time. It should be noted that the available data was not sufficiently comprehensive to provide for regression analysis to establish empirical relationships. As such, this task was instead guided by the expectations of drivers of the change over time and verified (where possible) by supporting information. The projected net additions (additions net of retirements) are based on the pitt&sherry estimates to 2020, supplemented by the CIE’s projections for additional categories of buildings including industrial/factory, warehouses, undercover car parks and aged care.
123 urbis 2015, Australian Shopping Centre Industry: Scale and Performance Measures, prepared for Shopping Centre Council of Australia, August 2015, http://www.scca.org.au/wp-content/uploads/2015/06/Shopping-Centre-Industry-Statisctics-August-2015_FINAL.pdf.
www.TheCIE.com.au
204 Decision Regulation Impact Statement

The estimates for Class 8 buildings (industrial buildings/factories) reflect the rate of growth in the Gross Value Added of mining and manufacturing in chain volume terms from the base year estimates in 2009. Overall, over this period the growth in mining and manufacturing GVA has been 1.6 per cent, but with negative growth in 2017, at -0.4 per cent. This is used to estimate the net additions, suggesting retirements greater than additions in that year. The projections beyond 2017 are based on the expected GVA growth of mining and manufacturing, at 1.9 per cent per annum, slightly lower than the rest of the economy.The underlying assumptions driving the pattern of growth across each class of building is shown in table E.3.
E11E Growth assumptions by building class underpinning the projections excluding replacement
Growth rate 2018-2037
2038-2061 Assumptions
Warehouse and storage 1.4 1.0 Population growth apportioned by the share of the population. The reason to use population growth (over sectoral growth) is to be conservative.
Retail 1.6 1.3 Shopping centre: above population growth (~1 per cent above)Retail strip: population growth (+/- 0.3 per cent) a
Supermarkets: population growth c
Education 1.5 1.1 Schools: population growth of school aged children in cities (age 5-17) and total population in regional areasUniversities: above population rate of growth for tertiary age population of 1 per cent VET: population growth of tertiary age population b
Standalone offices 2.0 1.5 Above population growth of working age persons of 1 per cent (decreasing over time after 20 years) d This reflects proportionately more people working in office spaces over time.
Factories 1.9 1.9 Projected by a share of mining and manufacturing GVA of 1.9 per cent
Undercover car parks 1.4 1.0 Projected at the rate of growth of the working age population for each state and territory, separately for the capital city and rest of the State/Territory (where we assume that the rate of car park additions per worker is one tenth that of the capital cities)
www.TheCIE.com.au
Decision Regulation Impact Statement 205

Growth rate 2018-2037
2038-2061 Assumptions
Hospital 1.2 1.2 In major cities: projected by ‘trend’ (lower than population growth) and in regional areas projected by (constant floor space per person)
Hotels 1.4 1.4 Trend based projections, variable by location
Aged care 3.1 1.8 Population growth in age 70+ population
Average growth per annum in commercial building space
1.6 1.3
Average growth per annum in resident population
1.4 1.0
a Growth in shopping centres in regional areas are typically higher than cities b Except for ACT where trend was used. c The exception is for Sydney where the growth is assumed to be 1 per cent higher than overall population growth until 2035. d Excluding Perth where population growth of the working age only is assumed.Source: CIE.
Estimates of the additions to the commercial building stock is shown in chart E.4. Each year it is estimated that around 6.3 million square metres of new floor area is added across the commercial building classes. Chart E.5 shows the significant components of this include warehousing and storage, retail, office space and education-related buildings. Based on the estimates above, the expected additional floor area of commercial buildings would be 6.3 million square metres in 2019 and 6.9 million in 2028, up by 10 per cent.
E.4 Projected net additions to the building stock by building class
0
2000
4000
6000
8000
2013 2018 2023 2028
Tota
l add
itions
(000
m2)
Office Hotel HospitalsRetail Education Undercover car parksWarehouse Factories Aged care
Note: Estimates of additional floor space of office buildings taken from pitt&sherry (2012) have been revised by the current working age population estimates and trend growth in floor space, for Sydney and Perth. Additions to the industrial/factory floor space are estimated to be positive 1.9 per cent, on average. The chart excludes retirements and refurbishments.Data source: CIE.
www.TheCIE.com.au
206 Decision Regulation Impact Statement

Chart E.5 shows that in 2019, approximately 25 per cent of net additions are expected to relate to warehousing and storage, 21 per cent for retail space, 16 per cent related to education, 13 per cent related to office space, and 9 per cent related to industrial/factory space. Growth rates across different building classes are similar in 2028, except with a greater share of office space (15 per cent), and warehouses slightly less (22 per cent).We note that growth rates temper beyond the evaluation period (from the 2030s). This reflects the slowing of the rate of population growth across some age groups, including the over 70 years age cohort and school age children (5 to 17 years).
E.5 Components of net additions to building stock
0% 20% 40% 60% 80% 100%
2019
2028
Estimated share of additions to the commercial building stock
Office Hotels HospitalsRetail Education Undercover car parksWarehouses Industrial/ factory Aged care
Note: Estimates of additional floor space of office buildings taken from pitt&sherry (2012) have been revised by the current working age population estimates and trend growth in floor space, for Sydney and Perth. Additions to the industrial/factory floor space are estimated to be positive 1.9 per cent, on average. The chart excludes retirements and refurbishments.Data source: CIE.
The modest increase in floor area per person (shown in chart E.6) reflects a range of factors, including increases in retail area above population growth, the demand for education-related commercial area related to international students, the trend towards larger office space per working age person and assumed growth of industrial space in line with gross value added. There are some questions over the sustainability of growth in the retail space with companies, such as Amazon, offering expanding levels of service via online retail.
www.TheCIE.com.au
Decision Regulation Impact Statement 207

E11E Increase in floor area per person
-0.2%
-0.1%
0.0%
0.1%
0.2%
0.3%
0.4%
13.5
14.0
14.5
15.0
15.5
16.0
2013 2018 2023 2028 2033 2038 2043 2048
Floor
area
per r
eside
nt (m
2)
Floor area per person % increase in floor area per person
Data source: CIE.
Estimates of net additions by Climate ZoneAs indicated in table E.3, population is a key driver of the change in building stock. It is also an important driver of the distribution of commercial buildings. In general, we used population to disaggregate the building stock by Climate Zone due to the fact that economic activities (and commercial building additions) are concentrated in population centres and associated with population growth. In addition, the population data by area is readily available for aggregation to each Climate Zone. The CIE’s approach to estimating the spread of buildings and new additions across Climate Zones, over time, is as follows:■ For the estimation of the components of office buildings by Climate
Zone, the NABERS data was dissected at a suburb level and compared against the ABCB Climate Zones. – NABERS data suggests a high level of concentration of office
buildings in the major cities. – As the NABERS data is not a requirement for buildings with a floor
space of less than 2 000 m2 (and more recently 1 000 m2) by CBD program there may be some under-representation of regional areas in the database.
■ For aged care residences, data on residential care places124 were available by small planning area and aggregated to the total building stock. It was assumed that the rate of population growth in the above
124 Department of Social Services 2015. Stocktake of Australian Government Subsidised Aged Care Places and Ratios as at 30 June 2015, available athttps://agedcare.health.gov.au/sites/g/files/net1426/f/documents/09_2015/operational_places_and_ratios_by_acpr.pdf.
www.TheCIE.com.au
208 Decision Regulation Impact Statement

70 years cohort was equivalent to the growth in residential care (or that the same preferences today for residential versus home care were held) and this was distributed across Climate Zones according to residential places in 2015.
■ For warehouses, industrial property research suggests that there is a high level of concentration of investment around the major population centres. As such, new investment is assumed to be undertaken proportionate to the State/Territory share of the population in each year.
■ For underground car parks, we expect that the rate of undercover car parks is significantly lower outside of the major cities (assumed to be one tenth that of the major cities) such that the Climate Zone disaggregation largely reflects the rate of the working age population across capital cities.
■ For all other building classes, the 2011 Census data was used to dissect the residential population to determine the share of buildings in each Climate Zone. Accounting for the differential growth of capital cities and regional population growth, within each segment the distribution of buildings was expected to be similar to the present.
The growth in the resident population is shown in chart E.7. It shows that the three most significant sources of population growth are from residents of Climate Zones 2 (which includes Brisbane), 5 (which includes most of Sydney) and 6 (including Melbourne and western Sydney). Chart E.8 reports net additions to commercial building by Climate Zone. It can be seen that they are closely related to residential population as shown in chart E.7.
E11E Growth in resident population by Climate Zone
0
2
4
6
8
10
12
14
2012 2017 2022 2027 2032 2037 2042 2047
Resid
ent p
opula
tion (
milli
on)
Zone 1 Zone 2 Zone 3 Zone 4 Zone 5 Zone 6
Data source: CIE.
www.TheCIE.com.au
Decision Regulation Impact Statement 209
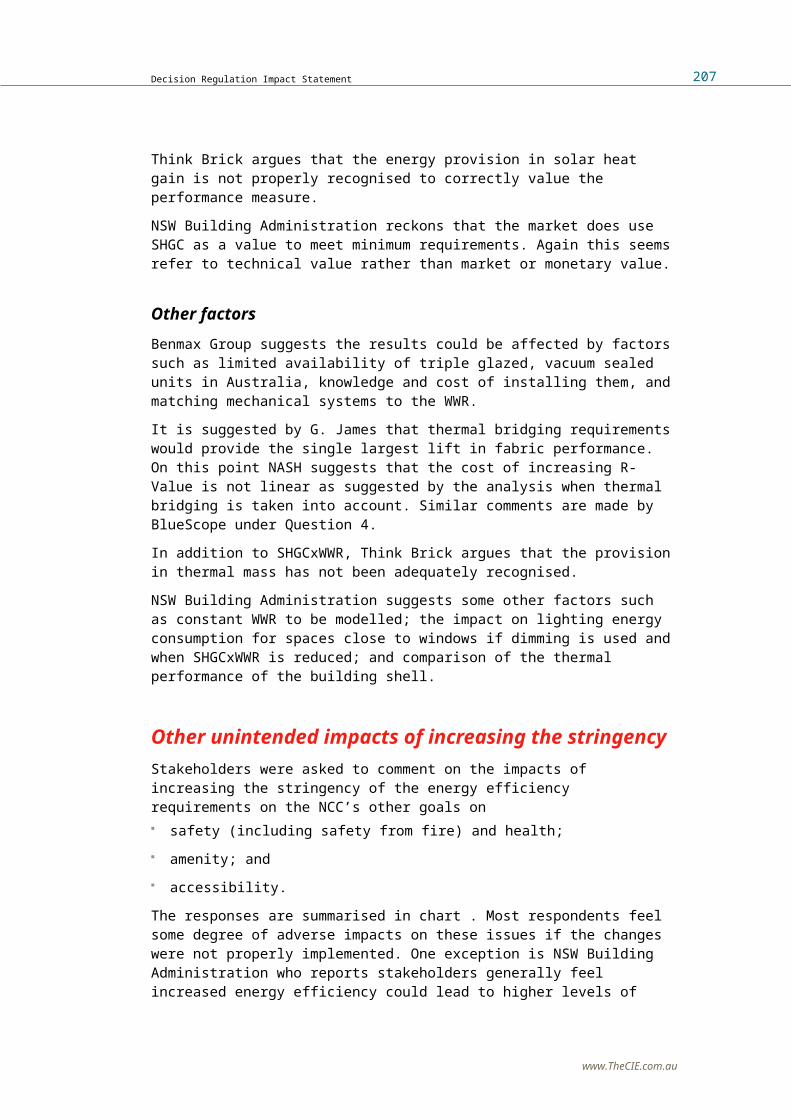
E11E Net additions to the commercial building stock by Climate Zone
0
2000
4000
6000
8000
2013 2023 2033 2043 2053
Com
merc
ial fl
oor a
rea (0
00 m
2)Zone 1 Zone 2 Zone 3 Zone 4 Zone 5 Zone 6 Zone 7 Zone 8
Note: Excludes refurbishments.Data source: CIE.
Retired floor space Additionally, given the estimates above relate to net floor space by building type, the rate of retirement needs to be accommodated. This refers to the end of the life time of buildings, where they may either be retired or replaced. In either case, the total new building floor space is equivalent to the ‘net additions’ plus the retired floor space. Commercial buildings may be built to last for up to 100 years.125 However, it is unlikely that this would represent the typical age of demolition of the current building stock. Skyscrapers, for instance, were constructed for a lifespan of at least 50 years.126 For this exercise, we assume that the average life span of a building is 70 years, and therefore the rate of retirement is 1.3 per cent of the building stock. Importantly, this rate applies to a much smaller commercial building stock. Based on an average increase, we estimate that the building stock in 1942 or 70 years prior to 2012 was 109.3 million square metres. Accounting for the replacement of the building stock retirements are estimated to be equivalent to a 0.5 per cent rate of replacement of the 2012 building stock.While acknowledging that different buildings are likely to have different rates of retirement, we assume a uniform replacement rate of 0.5 per cent
125 Dow, Aisha 2015, 2015. “Melbourne’s new wave of skyscrapers could survive ‘100 years’”, The Age, 18 March 2015, http://www.theage.com.au/victoria/melbournes-new-wave-of-skyscrapers-could-survive-100-years-20150317-1m1dmx.html.
126 ibid.
www.TheCIE.com.au
210 Decision Regulation Impact Statement

of the building stock in the relevant time period (70 years prior) is retired each year (by floor space).Thus, accounting for retirements means we need to increase net additions by around one third to estimate total additions. As a result, the total addition to the building stock (excluding refurbishments) each year is estimated to be approximately 2 per cent (chart E.9).
EError! No text of specified style in document.Error! No text of specified style in document.E Additions as a percentage of the building stock over time
0.0%
0.5%
1.0%
1.5%
2.0%
2.5%
2012 2017 2022 2027 2032 2037 2042 2047
Addit
ions (
% of
build
ing st
ock)
Note: Additions equals retirements plus net additions.Data source: CIE.
Total additionsAdding in ‘retirements’ to ‘net additions’, the total rate of additions across the building stock is shown in chart E.10, by building type, and chart E.11, by Climate Zone. The replacement of retired buildings is assumed to be undertaken in proportion to each building type’s share of the building stock in 2012.Over the ten year evaluation period from 2019 to 2028, the CIE projects that approximately 87 million square metres in commercial floor space may be affected by the regulations (excluding refurbishments). However, the extent to which the changes will affect different building classes will not only reflect their contribution to the annual additions but also the extent to which new stringencies will impact the building class.
www.TheCIE.com.au
Decision Regulation Impact Statement 211

EError! No text of specified style in document.Error! No text of specified style in document.EEError! No text of specified style in document.84 Total additions to the commercial building stock by building type (‘000 m2)
0
2000
4000
6000
8000
10000
2013 2018 2023 2028
Tota
l add
itions
(000
m2)
Office Hotel HospitalsRetail Education Undercover car parksWarehouse Factories Aged care
Note: Total additions equal ‘net additions’ plus ‘retirements’.Data source: CIE.
EError! No text of specified style in document.Error! No text of specified style in document.E Total additions to the commercial building stock by Climate Zone (‘000 m2)
0
2000
4000
6000
8000
10000
2013 2018 2023 2028 2033 2038 2043 2048
Tota
l add
itions
(000
m2)
Zone 1 Zone 2 Zone 3 Zone 4 Zone 5 Zone 6 Zone 7 Zone 8
Note: Total additions equal ‘net additions’ plus ‘retirements’.Data source: CIE.
RefurbishmentsThroughout the life of a given building, it is likely to be subject to both minor and major refurbishment to improve the functionality of the building with respect to its purpose. The rate of refurbishment could be significant,
www.TheCIE.com.au
212 Decision Regulation Impact Statement

estimated to range from 2.5 per cent (once every forty years) to 5 per cent (once every twenty years). The following sources provide estimates of the rate of major refurbishment within this range:■ The Aged Care Financing Authority: Annual Report on the Funding and
Financing of the Aged Care Sector reports that the existing stock at 2015 will include 25 per cent replacement or a rate of replacement of approximately 2.5 per cent each year.127
■ According to the City of Adelaide guide to building refurbishment, office buildings will generally require a major refurbishment every 20 to 25 years.128
■ In Sydney, according to Jones Lang LaSalle, in 2005 the average age of commercial buildings was 28 years while the average time since construction or major refurbishment was 19 years.129
■ NSW Health apply a ‘life cycle maintenance’ cost of 20-25 years for capital investment evaluation for hospitals.130
The extent to which these refurbishments would be affected by the NCC depends largely on whether refurbishments are ‘significant’. The extent of the refurbishment is a common theme across the state and territory legislation governing the requirement for building upgrades to comply with the NCC (or BCA). Typically, across each state/territory, the area of major refurbishment will be required to comply with the NCC, while non-refurbished areas would not be required to retrospectively comply with the current NCC unless the Building Certifier identifies issues around structural integrity or fire risk. This, of course, would not mean that the stringencies applied to one area of a building would not impact on the rest of the building with respect to technology and upgrades required to meet the standard in the new/refurbished building area.Noting that the rate of refurbishment is likely to vary across building classes, we do not have sufficient information to apply different
127 Aged Care Financing Authority 2015, Third report on the Funding and Financing of the Aged Care Sector, July 2015, available at https://agedcare.health.gov.au/sites/g/files/net1426/f/documents/10_2015/2015_report_on_the_funding_and_financing_of_the_aged_care_sector.pdf.
128 Adelaide City Council 2007, Building Refurbishment Guide, August 2007, https://www.cityofadelaide.com.au/assets/building_refurbishment_guide.pdf.
129 Hardie, M., Khan, S., O’Donnell, A. and Miller, G. 2007, “The efficacy of waste management plans in Australian commercial construction refurbishment projects”, Australian Journal of Construction Economics and Building, vol. 7, pp 26-36. https://eprints.qut.edu.au/27538/1/27538.pdf.
130 NSW Health 2011, Capital Projects – Economic Appraisal, Guideline Summary GL2011-006, 12 May 2011, http://www1.health.nsw.gov.au/pds/ActivePDSDocuments/GL2011_006.pdf.
www.TheCIE.com.au
Decision Regulation Impact Statement 213

assumptions to each building class. Hence, we demonstrate the assumption applied across the commercial building stock of a modest rate of refurbishment (of 1 in 30 years) and conservative share of ‘major refurbishment’ triggering building compliance with the NCC (of one third). This assumption is also consistent with previous analysis such as pitt&sherry (2015) that assumed that around one third of the area refurbished annually is upgraded to current code standards. The remaining two thirds is therefore assumed either not to trigger NCC compliance or related to under compliance with Section J requirements of the NCC.131 That is, we estimate that around 1.1 per cent of the building stock thirty years prior, or around 0.68 per cent of the existing building stock may be impacted each year. Hence, the impact of refurbishments could be significant. Using the year 2042 as an example (chart E.12), the impact in any given year or accumulatively may be similar to (net) additions. The cumulative floor area impacted in 2042 could be as much as 3.63 million square metres based on the 2019 commercial building stock. This compares to the estimated rate of total additions of 9.7 million in 2042. That is, refurbishments would represent 27 per cent of all new floor space (total additions plus major refurbishment) complying with the proposed NCC 2019.
E11E Potential impact of changes to the NCC on major refurbishments, in 2042
0 500 1000 1500 2000 2500
Office
Hotels
Hospitals
Retail
Education
Undercover car parks
Warehouses
Industrial/ factory
Aged care
Cumulative floor area (000 m2)
Major refurbishment
Additions
Data source: CIE.
Applying the rate of refurbishments to the potential size of the building stock 30 years prior, and assuming the same distribution by building type,
131 pitt&sherry 2015, Energy efficiency Master Plan: Foundation Report, prepared for City of Sydney, 2 February 2015, Rev 1. p. iii. http://www.cityofsydney.nsw.gov.au/__data/assets/pdf_file/0019/225127/150216_EC_ITEM02_ATTACHMENTB.PDF.
www.TheCIE.com.au
214 Decision Regulation Impact Statement

the total floor area potentially affected by the proposed changes to NCC 2019 are shown below (charts E.13 and E.14).In 2019, the total floor area potentially impacted by the proposed changes incorporating the area of major refurbishment is 10.79 million square metres. In 2028, the potential area impacted may increase to 12.04 million square metres.
E11E Estimated floor area to be affected by proposed changes (including major refurbishments), by building type
0
2000
4000
6000
8000
10000
12000
14000
2013 2018 2023 2028
Tota
l add
itions
(000
m2)
Office Hotel HospitalsRetail Education Undercover car parksWarehouse Factories Aged care
Note: Estimates reflect refurbishments plus additions. The estimates of retirements and major refurbishments assume uniformity with the building stock of 2012, including building type and Climate Zone.Data source: CIE estimates.
E11E Estimated floor area to be affected by proposed changes (including major refurbishments), by Climate Zone
0
2000
4000
6000
8000
10000
12000
14000
2013 2018 2023 2028
Tota
l add
itions
(000
m2)
Zone 1 Zone 2 Zone 3 Zone 4 Zone 5 Zone 6 Zone 7 Zone 8
Note: Estimates reflect refurbishments plus additions. The estimates of retirements and major refurbishments assume uniformity with the building stock of 2012, including building type and Climate Zone.Data source: CIE.
www.TheCIE.com.au
Decision Regulation Impact Statement 215

A Survey of building surveyors
To improve our understanding of current industry practices, we undertook an online survey of building certifiers/surveyors.
Survey instrumentBuilding certifiers and surveyors were targeted for the survey because all new commercial buildings must be certified by a building surveyor and each building surveyor is likely to see a broader range of buildings than other building industry professionals. This reduces the chance of obtaining a biased sample.The survey instrument was developed using Survey Monkey. The questions are summarised in table (note that the online version of the survey had a significantly different layout).
F02FF085 Summary of survey designQuestion Answer choices
Introductory questions
What state/territory do you most operate in? ■ New South Wales■ Victoria■ Queensland■ Western Australia■ South Australia■ Tasmania■ Australian Capital Territory■ Northern Territory
What area do you mostly operate in? ■ Capital city■ Regional
What ABCB Climate Zone do you mostly operate in?
■ Climate Zone 1■ Climate Zone 2■ Climate Zone 3■ Climate Zone 4■ Climate Zone 5■ Climate Zone 6■ Climate Zone 7■ Climate Zone 8
www.TheCIE.com.au
216 Decision Regulation Impact Statement

Question Answer choices
Questions for each building type
The following set of questions were asked for each of the following building types:■ Premium high rise office buildings■ Other office buildings■ Shopping centres■ Other retail buildings■ Hospitals■ Schools■ VET/university buildings■ Hotels
In the past three years, have you certified any <building type>?
■ Yes■ No
Approximately how many new <building type> have you certified in the past three years?
Open ended
Please indicate approximately what proportion of new <building type> you certified were designed to achieve the following energy efficiency outcomes (responses must sum to 100%)The energy efficiency standards of the NCC were met by:■ Adopting Deemed-to-Satisfy solutions to
achieve the minimum (i.e. no more efficient than necessary) (%)
■ Adopting solutions under a Deemed-to-Satisfy pathway that were significantly more efficient (%)
■ A Performance Solution (using a Verification Method such as JV3) to achieve equivalence to the Deemed-to-Satisfy but not exceed it (i.e. equivalent, but no more efficient) (%)
■ A Performance Solution to achieve annual energy consumption that is 0-10% lower than NCC minimum standards (%)
■ A Performance Solution to achieve annual energy consumption that is 10-20% lower than the NCC minimum standards (%)
■ A Performance Solution to achieve annual energy consumption that is 20-30% lower than the NCC minimum standards (%)
■ A Performance Solution to achieve annual energy consumption that is 30-40% lower than the NCC minimum standards (%)
■ A Performance Solution to achieve annual energy consumption that is more than 40% lower than the NCC minimum standards (%)
Numerical response summing to 100%
Do you have comments in relation to your responses to the above questions?
Open ended
www.TheCIE.com.au
Decision Regulation Impact Statement 217
Source: CIE.
The survey was forwarded to the membership of the Australian Institute of Building Surveyors via email in December 2017.The survey was also forwarded to the ABCB’s mailing list of building surveying stakeholders on 12 January 2018.
Response rateAs at 23 January 2018, we had received 158 separate responses. The number of responses by building type and the number of buildings reported is shown in table .
F02F Response rates by building typeNumber of responses Number of buildings
reported
No. No.
Premium office 11 60Other office 63 800Shopping centre 13 42Other retail 56 506Hospitals 4 5Schools 33 150Universities/VET buildings 14 29Hotels 14 28
Source: CIE.
ResultsSurvey results for each building type, weighted by the number of buildings certified are shown in table F.3. There were no responses indicating that buildings exceed minimum standards by more than 20 per cent.
F02F Survey resultsDTS to NCC
minimum standard
DTS exceeding
NCC minimum standard
Performance solution to
NCC minimum standard
Performance solution
exceeding minimum
performance 0-10%
Performance solution
exceeding minimum
performance 10-20%
Per cent Per cent Per cent Per cent Per cent
Premium office 67.9 3.8 21.7 6.7 0.0Other office 62.6 5.8 17.2 14.3 0.1Shopping centre 26.2 0.0 21.4 52.4 0.0
www.TheCIE.com.au
218 Decision Regulation Impact Statement
DTS to NCC minimum standard
DTS exceeding
NCC minimum standard
Performance solution to
NCC minimum standard
Performance solution
exceeding minimum
performance 0-10%
Performance solution
exceeding minimum
performance 10-20%
Per cent Per cent Per cent Per cent Per cent
Other retail 55.8 2.4 17.0 24.7 0.0Hospitals 40.0 0.0 60.0 0.0 0.0Schools 53.3 5.3 13.3 28.0 0.0Universities/VET buildings
72.3 3.4 7.0 17.2 0.0
Hotels 39.3 14.3 3.6 42.9 0.0Source: CIE survey of building surveyors.
Although there is no way of knowing whether these results are representative of the broader industry, these results imply that a significant share of commercial buildings demonstrate compliance with Section J of the NCC through Deemed-to-Satisfy solutions (chart ). For those commercial buildings using the Performance Solution pathway, the modelled negative costs may not occur as by definition the Performance Solution allows trade-offs between components as long as the overall energy performance is met. This means that the benefit (that is negative cost) through trade-offs between glazing U-Value and wall U-Value and the substitution between glazing SHGC and U-Value with cheaper windows may already be exhausted in the baseline.
FError! No text of specified style in document.Error! No text of specified style in document.F Compliance pathway by building type
0%10%20%30%40%50%60%70%80%90%
100%
Premiumoffice
Otheroffice
Shoppingcentre
Otherretail
Hospitals Schools Uni/VET Hotels
Per c
ent
Performancesolutions
DTS
Data source: CIE survey of building surveyors.
The results also imply that for most building types covered by the survey, a relatively small proportion of buildings are designed to exceed NCC minimum standards (chart ). That said, more than half of shopping centres and hotels are designed to exceed NCC minimum standards. Furthermore,
www.TheCIE.com.au
Decision Regulation Impact Statement 219

the results imply that where buildings are designed to exceed minimum standards, they are not designed to exceed minimum standards by much (generally 0-10 per cent).
FError! No text of specified style in document.Error! No text of specified style in document.F Building design relative to NCC minimum standards
0%10%20%30%40%50%60%70%80%90%
100%
Premiumoffice
Otheroffice
Shoppingcentre
Otherretail
Hospitals Schools Uni/VET Hotels
Per c
ent
Designed toexceed NCCminimumstandards
Designed tomeet NCCminimumstandards
Data source: CIE survey of building surveyors.
www.TheCIE.com.au
220 Decision Regulation Impact Statement

A Building details
The buildings modelled by EA include:■ a hotel (3A);■ an office building (5A);■ a retail building (6B);■ a health-care clinic (9aC); and■ a school (9bH).
Building geometryDetails of each of these building’s geometry is summarised in table .
G02GG086 Building geometry3A 5A 6B 9aC 9bH
Storeys (No.) 10 10 3 1 3Net lettable area (m2) 9 000 9 000 1 800 950 2 790Floor length (m) 31.6 31.6 36.5 31.6 38.75Floor depth (m) 31.6 31.6 18.3 31.6 30.0Floor to floor height (m) 3.6 3.6 3.6 6.0 3.0Ceiling height (m) 2.7 2.7 2.7 4.8 3.0
Source: EA.
Depictions of buildings 3A and 5A (chart ), 6B (chart ) and 9aC (chart ) and 9bH (chart ) are shown below.
www.TheCIE.com.au
Decision Regulation Impact Statement 221

GError! No text of specified style in document.Error! No text of specified style in document.GGError! No text of specified style in document.87 Hotel and office building (3A and 5A)
Source: EA.
GError! No text of specified style in document.Error! No text of specified style in document.GGError! No text of specified style in document.88 Retail building (6B)
Source: EA.
www.TheCIE.com.au
222 Decision Regulation Impact Statement

GError! No text of specified style in document.Error! No text of specified style in document.GGError! No text of specified style in document.89 Healthcare building (9aC)
Source: EA.
GError! No text of specified style in document.Error! No text of specified style in document.GGError! No text of specified style in document.90 School building (9bH)
Data source: EA.
Window-to-wall ratiosA key factor driving the results is the window-to-wall ratio (WWR). WWRs can vary significantly across building. As the building archetypes modelled are intended to be broadly representative of the various commercial building types, the WWRs used in the modelling generally reflect the average of the EA’s survey sample (table ).
www.TheCIE.com.au
Decision Regulation Impact Statement 223

In various consultations, there were some concerns from industry in relation to compliance costs for premium office buildings, which tend to be more extensively glazed than other types of commercial buildings. To address these concerns, EA also modelled an office building with a higher WWR as a sensitivity test.EA’s modelling suggested that the highest WWR achievable through the DTS pathway for the 5A archetype under the current code is:■ around 56 per cent for most Climate Zones; and■ around 50 per cent for Climate Zone 7.As the modelling is based on compliance through the DTS pathway, these maximum WWRs were used. Note that higher WWRs were possible under the revised code, suggesting that the revised code offers more flexibility with regard to glazing choices through the DTS pathway than the existing code.
G02G Baseline window-to-wall ratios3A 5A 6B 9aC 9bH
Per cent Per cent Per cent Per cent Per cent
CZ1 30 40, 56 30 30 30CZ2 30 40, 56 30 30 30CZ3 30 40, 56 30 30 30CZ4 30 40, 56 30 30 30CZ5 30 40, 56 30 30 30CZ6 30 40, 56 30 30 30CZ7 30 40, 50 30 30 30
Source: EA.
ABCB Climate ZonesA map of ABCB Climate Zones is shown in chart
www.TheCIE.com.au
224 Decision Regulation Impact Statement

GError! No text of specified style in document.Error! No text of specified style in document.G ABCB Climate Zones
Data source: ABCB website, https://www.abcb.gov.au/Resources/Tools-Calculators/Climate-Zone-Map-Australia-Wide, accessed 26 September 2018.
www.TheCIE.com.au
Decision Regulation Impact Statement 225

B Valuing the benefits of saving energy
Energy saved is typically valued in terms of:■ the resource cost savings; and■ the environmental benefits.
Resource cost savingsAccording to Lazar and Colborn (2013)132, there are two broad approaches to valuing the benefits of energy saved.■ Capacity and energy approach — under this approach, the costs of
building and operating power plants are separated into capacity component (this includes the capital costs of meeting peak demand) and an energy component representing the remaining costs of power supply.
■ Market pricing approach — under this approach, the energy saved through improved energy efficiency is valued based on the market price (i.e. bill savings). Lazar and Colborn (2013) argue that in many cases, the market price internalises many of the costs outlined above and therefore may be a more precise measure of costs (depending on what costs are internalised in the market price).
Both approaches have been used in energy efficiency studies in the Australian context.
The capacity and energy approachIn a CBA of NSW Government energy efficiency schemes, Jacobs (2014) used the capacity and energy approach, with the benefits including:■ Wholesale market benefits, including:
– electricity market benefits, such as avoided fuel costs, avoided variable operating and maintenance costs and deferred infrastructure; and
132 Lazar, Jim and Ken Colborn 2013, Recognizing the Full Value of Energy Efficiency (What’s Under the Feel-Good Frosting of the World’s Most Valuable Layer Cake of Benefits), September 2013, available at http://www.raponline.org/wp-content/uploads/2016/05/rap-lazarcolburn-layercakepaper-2013-sept-9.pdf.
www.TheCIE.com.au
226 Decision Regulation Impact Statement

– gas market benefits including deferred gas production and delivery infrastructure.
■ Network benefits, including transmission and distribution infrastructure deferrals. These are estimated by:– estimating peak reduction by network service area by converting the
energy savings to peak reduction using estimates of the conservation load factor (CLF);
– converting peak demand reductions to an estimate of network capacity deferral, by calculating the year on year incremental growth; and
– applying a distribution and transmission deferral benefit factor to the estimates of network capacity deferral.133
Similarly, a recent report by Houston-Kemp for the Department of the Environment and Energy (DEE) setting out a CBA methodology in relation to residential energy efficiency, also advocates valuing energy savings based on avoided wholesale and network-related costs, although proposes a different approach to valuing these elements. Under the approach proposed by Houston-Kemp:■ wholesale costs are valued at wholesale market prices; and■ network-related costs are valued using the long-run marginal cost
(LRMC — see box for further details).134
133 Jacobs 2014, NSW Energy efficiency programs: Cost-benefit analysis, Final report to the NSW Office of Environment and Heritage, pp. 68-75.
134 See Houston Kemp Economists 2017, Residential Building Regulatory Impact Statement Methodology, A report for the Department of the Environment and Energy, 6 April 2017, pp. 14-15.
www.TheCIE.com.au
Decision Regulation Impact Statement 227

HError! No text of specified style in document.Error! No text of specified style in document.HHError! No text of specified style in document.91 Long-run marginal cost
Marginal cost is a key concept in economic analysis. It is the additional cost of supplying an additional unit of production. Standard economic theory suggests that in a competitive market, prices reflect the marginal cost of the last unit traded.In the context of network services, there is an important distinction between:■ short-run marginal cost (SRMC) — this is defined as the cost of an
incremental change in demand holding physical capacity constant; and
■ long-run marginal cost (LRMC) — this is the cost of an incremental change in demand including the cost of expanding network capacity.135
The retail price approachOn the other hand, a range of other studies have valued energy savings based on retail prices. There are broadly four components to retail electricity prices:136■ Wholesale costs — these costs are set in the wholesale market.■ Network costs (including transmission and distribution) — reflecting the
natural monopoly characteristics of electricity networks, this element is regulated by the Australian Energy Regulatory (AER).
■ Environmental schemes — this includes costs imposed on retailers (and passed onto users) associated with schemes, such as:– the Renewable Energy Target;– State-based certificate and efficiency schemes (such as the Victorian
Energy Efficiency Target, the NSW Energy Saving Scheme); and– solar feed-in tariffs.
■ Retail costs and margins — together retail costs and margins are referred to as the gross margin. The costs incurred by retailers can
135 NERA Economic Consulting 2014, Economic Concepts for Pricing Electricity Network Services: A Report for the Australian Energy Market Commission, 21 July 2014, pp. 4-6.
136 Australian Competition and Consumer Commission 2017, Retail Electricity Pricing Inquiry, Preliminary report, 22 September 2017, pp. 53-75.
www.TheCIE.com.au
228 Decision Regulation Impact Statement

sometimes be split into: costs to serve (the costs incurred to provide retail services to an existing customer, such as billing services, losses to bad debts, customer assistance and regulatory compliance costs); and the costs to acquire and retain customers (this includes marketing and advertising). Also included is a net margin for the retailers.
Comparing the various approachesAn obvious difference between the two approaches is that the approach based on retail pricing includes some additional costs, including the cost of environmental schemes and retail costs and margins.■ Where there is a reduction in demand, retailers will generally incur
lower costs to comply with the various environmental schemes. These costs should therefore be included.
■ On the other hand, most retail costs and the net margin may not change much due to lower demand. This suggests there is a conceptual case to exclude these costs. That said, the ACCC reports that these costs made up only around 3 per cent of the retail price for commercial and industrial customers in 2015/16.137 We note that the Houston-Kemp report relates to residential buildings, where retail costs and margins make up around 24 per cent of total costs.
The other significant difference relates to the treatment of avoided network costs. The approach used by Jacobs and others explicitly attempts to measure the reduction in peak loads and the extent to which this defers investment to expand capacity. However, in general, the approach to estimating the unit cost of expanding supply capacity is less robust than LRMC estimates suggested by Houston-Kemp. In particular, it appears to be based on capital expenditure related to demand growth in a single year.As discussed above, network charges are regulated by the AER. Under the AER’s pricing principles, each tariff must be based on the long run marginal cost of providing the service to which it relates to the retail customers assigned to that tariff with the method of calculating such cost and the manner in which that method is applied to be determined having regard to: ■ the costs and benefits associated with calculating, implementing and
applying that method as proposed; ■ the additional costs likely to be associated with meeting demand from
retail customers that are assigned to that tariff at times of greatest utilisation of the relevant part of the distribution network; and
137 ibid, p. 51.
www.TheCIE.com.au
Decision Regulation Impact Statement 229

■ the location of retail customers that are assigned to that tariff and the extent to which costs vary between different locations in the distribution network.138
Consequently, retail tariffs should broadly reflect the LRMC of supply.■ If the energy saved through energy efficiency measures is skewed
towards peak times (or more skewed towards peak times than average consumption) and/or buildings are not on tariffs that differentiate between peak and off-peak times, the retail price approach may understate peak-related costs.
■ On the other hand, if the energy saved is skewed towards non-peak times (or more skewed toward non-peak times than average consumption), the retail price approach could potentially overstate peak-related costs.
That said, there is limited information available on peak load profiles for commercial buildings and these may vary significantly across different buildings and Climate Zones. The CLFs used in some CBAs may be an approximation only, so it is unclear whether the alternative approach would be an improvement.Some studies appear to argue that the impact of energy efficiency policies on peak demand should be included in addition to the bill savings (based on retail prices).139 However, there is a risk of double-counting the network component of costs using this approach.
Approach used in the RISIn the RIS the retail price approach to valuing energy savings was used. As this approach includes retail costs and margins that would be excluded from the capacity and energy approach, it may result in slightly higher estimates of the benefits of energy efficiency.
Electricity prices
EA’s modelling used a single national retail price for electricity, based on a weighted average of state-based price projections.140
138 National Electricity Rules, Chapter 6: Economic Regulation of Distribution Services, p. 762.
139 See for example, Isaac, T. and Pears, A. 2016, How cautious analysis could lead to a ‘do nothing’ policy: A case study of the 6-star housing Regulation Impact Statement, July 2016, pp. 13-16; and pitt&sherry 2013, Final report: Quantitative assessment of energy savings from building energy efficiency measures, Prepared for: Department of Climate Change and Energy Efficiency, 20 March 2013, pp. 36-41.
140 Energy Action 2017, Energy Pricing Assumptions, NCC Section J Revision, 1 March 2017.
www.TheCIE.com.au
230 Decision Regulation Impact Statement
■ State-based price projections for the five states that are part of the National Electricity Market (NEM) were based on Australian Energy Market Operator (AEMO) projections to 2037 (and constant prices beyond that timeframe).
■ Based on a review of EA’s internal pricing information, price projections for Western Australia were assumed to be equivalent to NSW pricing from 2019 onwards.
■ EA used an average of AEMO’s retail price projections for small and large commercial users.
In this RIS, we use the same price projections as EA. However, we use separate state-based prices, rather than a single national price. As EA did not report prices for the two territories, our estimates are based on:■ the national average less a margin of around $44.30 per MWh in the
ACT — this is based on the average margin between ACT residential retail prices and the national average, as estimated by the Australian Energy Market Commission (AEMC);141 and
■ the national average less a margin of around $14.65 per MWh in the Northern Territory — this is also based on the average margin between Northern Territory residential retail prices and the national average, as estimated by the AEMC.
Retail electricity price projections by state for ‘small users’ are shown in chart H.2.
HError! No text of specified style in document.Error! No text of specified style in document.H Retail electricity price projections — small users
0
50
100
150
200
250
300
20192022 2025202820312034 2037204020432046 2049205220552058 206120642067
$ per
MWh
NSW Vic Qld SA
WA Tas ACT NT
Data source: Energy Action 2017, Energy Pricing Assumptions, NCC Section J Revision, 1 March 2017, p. 2; Australian Energy Market Commission 2017, 2017 Residential Electricity Price Trends, Final Report, 18 December 2017; CIE.
141 Australian Energy Market Commission, 2017 Residential Electricity Price Trends, Final Report, 18 December 2017.
www.TheCIE.com.au
Decision Regulation Impact Statement 231

Retail electricity price projections by state for ‘large users’ are shown in chart .
HError! No text of specified style in document.Error! No text of specified style in document.H Retail electricity price projections — large users
0
50
100
150
200
250
20192022 202520282031 20342037 204020432046 204920522055 20582061 20642067
$ per
MWh
NSW Vic Qld SA
WA Tas ACT NT
Data source: Energy Action, Energy Pricing Assumptions, NCC Section J Revision, 1 March 2017, p. 3; Australian Energy Market Commission 2017, 2017 Residential Electricity Price Trends, Final Report, 18 December 2017; CIE.
Following EA, we use the average of the small and large user prices in the RIS (chart ).
HError! No text of specified style in document.Error! No text of specified style in document.H Retail electricity price projections — average of small and large users
0
50
100
150
200
250
2019 2022202520282031 2034203720402043 2046204920522055 2058206120642067
$ per
MWh
NSW Vic Qld SA
WA Tas ACT NT
Data source: Energy Action, Energy Pricing Assumptions, NCC Section J Revision, 1 March 2017, p. 2-4; Australian Energy Market Commission 2017, 2017 Residential Electricity Price Trends, Final Report, 18 December 2017; CIE.
www.TheCIE.com.au
232 Decision Regulation Impact Statement

Gas prices
As for electricity prices, EA’s modelling used a single national gas price based on a weighted average across states. The state-based price series were generally based on gas prices achieved in recent tenders conducted by EA in various locations. Future price increases were based on AEMO projections of future wholesale gas costs.As for electricity prices, we use separate state-based prices in the RIS, using the same prices series as EA. EA did not report prices in Tasmania, the Northern Territory and the ACT. For these jurisdictions, the prices used in the RIS are based on the following:■ For Tasmania, prices are based on the average across the jurisdictions
reported by EA less a margin of around 51 cents per MJ. This is based on the difference between Tasmanian residential gas retail prices and the national average in 2015, as reported in Oakley Greenwood (2016).142
■ Similarly, the ACT prices are based on the average across the jurisdictions reported by EA less a margin of around 55 cents per MJ also based on the difference between ACT residential gas retail prices and the national average in 2015, as reported in Oakley Greenwood (2016).143
■ As Oakley Greenwood (2016) did not report retail gas prices for the Northern Territory, we used the national average price. Note that buildings in Climate Zones 1 and 2 tend to use relatively little gas, so the gas price will have relatively little impact on the Northern Territory.
The gas price assumptions used in the RIS are shown in chart .
142 Oakley Greenwood 2016, Gas Price Trends Review, Prepared for the Department of Innovation, Industry and Science, February 2016.
143 ibid.
www.TheCIE.com.au
Decision Regulation Impact Statement 233

HError! No text of specified style in document.Error! No text of specified style in document.H Gas price projections
0
5
10
15
20
25
30
35
40
2019 2023 2027 2031 2035 2039 2043 2047 2051 2055 2059 2063 2067
$ per
GJ
NSWVicQldSAWATasACTNT
Data source: Energy Action 2017, Energy Pricing Assumptions, NCC Section J Revision, 1 March 2017, p. 6-8; Australian Energy Market Commission 2017, 2017 Residential Electricity Price Trends, Final Report, 18 December 2017; CIE.
Environmental benefitsIn addition to the value of the resources saved, there are also environmental benefits associated with reduced energy consumption. Here the literature tends to focus mainly on valuing greenhouse gas emissions. Other environmental benefits could include other avoided pollutants such as SOx and particulate matter.
Emissions intensity of energy consumptionGreenhouse gas emissions will depend on the emissions intensity of energy consumption, which varies by energy source. EA’s modelling was based on a national average emissions intensity. However, given that the emissions intensity of electricity varies significantly across States and Territories, it is important to take into account this variability for the purposes of the RIS.The National Greenhouse Accounts Factors reports emissions factors for end users of electricity in each State and Territory (table ), including:■ Scope 2 emissions — these are indirect emissions from the generation
of the electricity purchased and consumed; and■ Scope 3 emissions — these are indirect emissions from the extraction,
production and transport of fuel burned at generation and the indirect emissions attributable to the electricity lost in delivery in the transmission and distribution network.
www.TheCIE.com.au
234 Decision Regulation Impact Statement

H02HH092 Electricity emissions factors for end usersNSW Vic Qld SA WA Tas ACT NT
Kg CO2-e per Kwh
Kg CO2-e per Kwh
Kg CO2-e per Kwh
Kg CO2-e per Kwh
Kg CO2-e per Kwh
Kg CO2-e per Kwh
Kg CO2-e per Kwh
Kg CO2-e per Kwh
Scope 2 emissions
0.82 1.07 0.80 0.51 0.70 0.19 0.82 0.64
Scope 3 emissions
0.10 0.10 0.13 0.10 0.05 0.03 0.10 0.09
Total 0.92 1.17 0.93 0.61 0.75 0.22 0.92 0.73Source: Australian Government Department of the Environment and Energy, National Greenhouse Accounts Factors, Australian National Greenhouse Accounts, July 2018, pp. 68-80.
The national emissions factors used by EA were projected to decline over time. Although the emissions intensity of electricity could depend to a significant extent on State and Territory Government policies (which vary), we apply the national rate of decline reflected in EA’s projections to each State and Territory’s emissions factors (except Tasmania, given its already low emissions intensity) (chart ).
HError! No text of specified style in document.Error! No text of specified style in document.HHError! No text of specified style in document.93 Electricity emissions factors over time
0.00
0.20
0.40
0.60
0.80
1.00
1.20
1.40
20172020202320262029203220352038204120442047205020532056205920622065
Tonn
es CO
2-epe
r MW
h
NSW VictoriaQueensland South AustraliaWestern Australia TasmaniaACT Northern Territory
Note: Data source: Australian Government Department of the Environment and Energy, National Greenhouse Accounts Factors, Australian National Greenhouse Accounts, July 2018, pp. 68-80; EA; CIE.
For natural gas consumption, EA used an emissions factor of 51.4 Kg Co2-e per GJ, which is consistent with emission factors for the consumption of natural gas reported in the National Greenhouse Accounts Factors, excluding Scope 3 emissions.144 For the RIS, we add estimates of
144 Australian Government Department of the Environment and Energy, National Greenhouse Accounts Factors, Australian National Greenhouse Accounts, July 2018, p. 12.
www.TheCIE.com.au
Decision Regulation Impact Statement 235

Scope 3 emissions, as reported in the National Greenhouse Accounts Factors (table ).145
H02HH094 Natural gas emissions factorsNSW Vic Qld SA WA Tas ACT NT
Kg CO2-e per GJ
Kg CO2-e per GJ
Kg CO2-e per GJ
Kg CO2-e per GJ
Kg CO2-e per GJ
Kg CO2-e per GJ
Kg CO2-e per GJ
Kg CO2-e per GJ
Scope 1 emissions
51.4 51.4 51.4 51.4 51.4 51.4 51.4 51.4
Scope 3 emissionsa
12.8 3.9 8.7 10.4 4.0 3.9b 12.8 4.0c
Total 64.2 55.3 60.1 61.8 55.4 55.3 64.2 55.4a Scope 3 emissions factors based on estimate for metro areas in each State. Estimates for non-metro areas vary slightly, but would not make a significant difference to the overall results. b Scope 3 emissions factors were not reported for Tasmania. Figure used based on estimate for Victoria. c Scope 3 emissions factors were not reported for the Northern Territory. Figure used based on estimate for Western Australia.Source: Australian Government Department of the Environment and Energy, National Greenhouse Accounts Factors, Australian National Greenhouse Accounts, July 2018, pp. 12 and 66.
Valuing greenhouse gas emissionsThere are also various approaches in the literature to valuing these environmental benefits, including the following:■ Social cost of carbon (SCC) approach — this is a measure of the
discounted value of expected future global damages from additional GHG emissions.146 SCC estimates are generally based on modelling of future climate change impacts and their economic effects. Given the large uncertainties around the impacts of climate change, estimates of the SCC can vary significantly.
■ Mitigation/abatement cost approach — under this approach, GHG emissions are valued using a carbon price measure, on the basis that a carbon price reflects the marginal cost of abatement. The price used to value carbon emissions could be an existing traded price, such as the EU Emissions Trading Scheme (ETS) price. Alternatively, several Australian studies value the reduction in greenhouse gas emissions using the projected carbon price from various carbon price modelling exercises (alternatively, projected future energy prices including the carbon price are used as the energy price, which also captures the value of the greenhouse gas externality).
145 Australian Government Department of the Environment and Energy, National Greenhouse Accounts Factors, Australian National Greenhouse Accounts, July 2018, p. 66.
146 Jotzo, F., Pezzey, J., van Dijk, J. and Mazouz, S. 2015, Social cost of carbon for NSW policy analysis, prepared for the NSW Department of Environment and Heritage, p. 9.
www.TheCIE.com.au
236 Decision Regulation Impact Statement

The United States (US) Government’s Interagency Working Group (IWG) on Social Cost of Greenhouse Gases revised its estimates of the social cost of carbon for Regulatory Impact Analysis in August 2016.147 To generate these estimates, the IWG generated a frequency distribution for the future costs of climate change per tonne of CO2-e based on climate modelling. Chart H.6 shows these estimates in Australian dollars:■ The low scenario, discounts the average estimate of the future costs of
climate change, using a discount rate of 5 per cent.■ The medium scenario discounts the average estimate of the future
costs of climate change, using a discount rate of 3 per cent.■ The high scenario discounts the average estimate of the future costs of
climate change, using a discount rate of 2.5 per cent.■ The high impact scenario corresponds to the 95th percentile of the
frequency distribution of the future costs of climate change, using a discount rate of 3 per cent.
HError! No text of specified style in document.Error! No text of specified style in document.H Social cost of carbon estimates
050
100150200250300350400450500
2019 2022 2025 2028 2031 2034 2037 2040 2043 2046 2049 2052 2055 2058 2061 2064 2067
A$ pe
r ton
ne C
O 2-e
Low - 5%Medium - 3%High - 2.5%High impact
Data source: US EPA 2017, The Social Cost of Carbon: Estimating the Benefit of Reducing Greenhouse Gas Emissions, https://19january2017snapshot.epa.gov/climatechange/social-cost-carbon_.html.
147 US EPA 2017, The Social Cost of Carbon: Estimating the Benefit of Reducing Greenhouse Gas Emissions, https://19january2017snapshot.epa.gov/climatechange/social-cost-carbon_.html.
www.TheCIE.com.au
Decision Regulation Impact Statement 237

B Net private benefits by state, Climate Zone and building type
New South Wales
I11II195 Net benefits to New South Wales — low realisation scenarioCZ1 CZ2 CZ3 CZ4 CZ5 CZ6 CZ7
$ per m2
$ per m2
$ per m2
$ per m2
$ per m2
$ per m2
$ per m2
Hotels
Bill savings - electricity n.a. 34.47 n.a. 27.75 28.80 29.20 27.31Bill savings - gas n.a. 0.58 n.a. 2.72 0.08 1.93 2.00Private costs n.a. - 1.77 n.a. 1.10 - 4.98 0.77 12.65Net private benefit/cost n.a. 33.28 n.a. 31.56 23.90 31.89 41.96Avoided GHG emissions - electricity n.a. 10.07 n.a. 8.10 8.41 8.53 7.98Avoided GHG emissions - gas n.a. 0.08 n.a. 0.36 0.01 0.26 0.26Net benefit/cost n.a. 43.42 n.a. 40.03 32.33 40.68 50.20
Office building
Bill savings - electricity n.a. 10.88 n.a. 6.24 8.97 6.78 6.16Bill savings - gas n.a. 0.94 n.a. 1.82 2.01 0.97 1.83Private costs n.a. - 2.61 n.a. - 7.12 - 11.05 - 5.29 - 1.72Net private benefit/cost n.a. 9.22 n.a. 0.94 - 0.07 2.45 6.27Avoided GHG emissions - electricity n.a. 3.18 n.a. 1.82 2.62 1.98 1.80Avoided GHG emissions - gas n.a. 0.13 n.a. 0.24 0.27 0.13 0.24Net benefit/cost n.a. 12.52 n.a. 3.00 2.81 4.56 8.31
Retail
Bill savings - electricity n.a. 29.86 n.a. 34.52 41.76 36.12 - 4.26Bill savings - gas n.a. - 1.03 n.a. - 6.85 - 3.73 - 15.02 7.61Private costs n.a. - 4.39 n.a. - 18.60 - 7.22 - 10.36 - 16.62Net private benefit/cost n.a. 24.45 n.a. 9.07 30.81 10.74 - 13.26Avoided GHG emissions - electricity n.a. 8.72 n.a. 10.08 12.20 10.55 - 1.24Avoided GHG emissions - gas n.a. - 0.14 n.a. - 0.91 - 0.49 - 1.99 1.01
www.TheCIE.com.au
238 Decision Regulation Impact Statement

CZ1 CZ2 CZ3 CZ4 CZ5 CZ6 CZ7
$ per m2
$ per m2
$ per m2
$ per m2
$ per m2
$ per m2
$ per m2
Net benefit/cost n.a. 33.03 n.a. 18.25 42.51 19.30 - 13.50
Healthcare
Bill savings - electricity n.a. 17.92 n.a. 13.26 12.57 7.16 14.32Bill savings - gas n.a. - 0.18 n.a. - 0.37 - 0.12 - 7.43 - 9.74Private costs n.a. - 9.62 n.a. - 17.49 - 16.23 - 26.49 - 28.34Net private benefit/cost n.a. 8.12 n.a. - 4.59 - 3.77 - 26.77 - 23.76Avoided GHG emissions - electricity n.a. 5.23 n.a. 3.87 3.67 2.09 4.18Avoided GHG emissions - gas n.a. - 0.02 n.a. - 0.05 - 0.02 - 0.98 - 1.29Net benefit/cost n.a. 13.33 n.a. - 0.77 - 0.11 - 25.66 - 20.86
School
Bill savings - electricity n.a. 49.07 n.a. 28.00 20.57 22.87 35.50Bill savings - gas n.a. - 2.55 n.a. 8.30 4.68 9.81 6.71Private costs n.a. - 19.48 n.a. - 17.65 - 18.10 - 7.71 - 8.72Net private benefit/cost n.a. 27.04 n.a. 18.64 7.15 24.97 33.49Avoided GHG emissions - electricity n.a. 14.33 n.a. 8.18 6.01 6.68 10.37Avoided GHG emissions - gas n.a. - 0.34 n.a. 1.10 0.62 1.30 0.89Net benefit/cost n.a. 41.03 n.a. 27.92 13.78 32.95 44.75
Note: Costs and benefits are estimated over the assumed 40 year life of the building, using a discount rate of 7 per cent.Source: CIE based on EA modelling.
I11II196 Net benefits to New South Wales — medium realisation scenarioCZ1 CZ2 CZ3 CZ4 CZ5 CZ6 CZ7
$ per m2
$ per m2
$ per m2
$ per m2
$ per m2
$ per m2
$ per m2
Hotels
Bill savings - electricity n.a. 51.71 n.a. 41.63 43.21 43.80 40.96Bill savings - gas n.a. 0.86 n.a. 4.08 0.12 2.89 2.99Private costs n.a. - 1.77 n.a. 1.10 - 4.98 0.77 12.65Net private benefit/cost n.a. 50.80 n.a. 46.80 38.35 47.45 56.61Avoided GHG emissions - electricity n.a. 15.10 n.a. 12.16 12.62 12.79 11.96Avoided GHG emissions - gas n.a. 0.11 n.a. 0.54 0.02 0.38 0.40Net benefit/cost n.a. 66.02 n.a. 59.50 50.98 60.63 68.97
Office building
Bill savings - electricity n.a. 16.32 n.a. 9.35 13.45 10.17 9.24
www.TheCIE.com.au
Decision Regulation Impact Statement 239

CZ1 CZ2 CZ3 CZ4 CZ5 CZ6 CZ7
$ per m2
$ per m2
$ per m2
$ per m2
$ per m2
$ per m2
$ per m2
Bill savings - gas n.a. 1.42 n.a. 2.73 3.02 1.46 2.74Private costs n.a. - 2.61 n.a. - 7.12 - 11.05 - 5.29 - 1.72Net private benefit/cost n.a. 15.13 n.a. 4.97 5.42 6.33 10.26Avoided GHG emissions - electricity n.a. 4.77 n.a. 2.73 3.93 2.97 2.70Avoided GHG emissions - gas n.a. 0.19 n.a. 0.36 0.40 0.19 0.36Net benefit/cost n.a. 20.09 n.a. 8.06 9.74 9.49 13.32
Retail
Bill savings - electricity n.a. 44.80 n.a. 51.78 62.65 54.17 - 6.38Bill savings - gas n.a. - 1.55 n.a. - 10.27 - 5.60 - 22.53 11.41Private costs n.a. - 4.39 n.a. - 18.60 - 7.22 - 10.36 - 16.62Net private benefit/cost n.a. 38.86 n.a. 22.91 49.83 21.29 - 11.59Avoided GHG emissions - electricity n.a. 13.08 n.a. 15.12 18.30 15.82 - 1.86Avoided GHG emissions - gas n.a. - 0.21 n.a. - 1.36 - 0.74 - 2.98 1.51Net benefit/cost n.a. 51.74 n.a. 36.67 67.38 34.13 - 11.94
Healthcare
Bill savings - electricity n.a. 26.88 n.a. 19.90 18.86 10.73 21.49Bill savings - gas n.a. - 0.27 n.a. - 0.56 - 0.18 - 11.15 - 14.62Private costs n.a. - 9.62 n.a. - 17.49 - 16.23 - 26.49 - 28.34Net private benefit/cost n.a. 16.98 n.a. 1.86 2.46 - 26.90 - 21.47Avoided GHG emissions - electricity n.a. 7.85 n.a. 5.81 5.51 3.13 6.28Avoided GHG emissions - gas n.a. - 0.04 n.a. - 0.07 - 0.02 - 1.48 - 1.94Net benefit/cost n.a. 24.80 n.a. 7.59 7.94 - 25.25 - 17.13
School
Bill savings - electricity n.a. 73.60 n.a. 42.00 30.86 34.31 53.25Bill savings - gas n.a. - 3.82 n.a. 12.45 7.02 14.71 10.07Private costs n.a. - 19.48 n.a. - 17.65 - 18.10 - 7.71 - 8.72Net private benefit/cost n.a. 50.30 n.a. 36.79 19.77 41.31 54.60Avoided GHG emissions - electricity n.a. 21.50 n.a. 12.27 9.01 10.02 15.55Avoided GHG emissions - gas n.a. - 0.51 n.a. 1.65 0.93 1.95 1.33Net benefit/cost n.a. 71.29 n.a. 50.71 29.72 53.28 71.49
Note: Costs and benefits are estimated over the assumed 40 year life of the building, using a discount rate of 7 per cent.Source: CIE based on EA modelling.
www.TheCIE.com.au
240 Decision Regulation Impact Statement

www.TheCIE.com.au
Decision Regulation Impact Statement 241

I11II197 Net benefits to New South Wales — high realisation scenarioCZ1 CZ2 CZ3 CZ4 CZ5 CZ6 CZ7
$ per m2
$ per m2
$ per m2
$ per m2
$ per m2
$ per m2
$ per m2
Hotels
Bill savings - electricity n.a. 68.94 n.a. 55.50 57.61 58.40 54.62Bill savings - gas n.a. 1.15 n.a. 5.43 0.16 3.85 3.99Private costs n.a. - 1.77 n.a. 1.10 - 4.98 0.77 12.65Net private benefit/cost n.a. 68.32 n.a. 62.03 52.79 63.02 71.26Avoided GHG emissions - electricity n.a. 20.14 n.a. 16.21 16.83 17.06 15.95Avoided GHG emissions - gas n.a. 0.15 n.a. 0.72 0.02 0.51 0.53Net benefit/cost n.a. 88.61 n.a. 78.96 69.63 80.59 87.74
Office building
Bill savings - electricity n.a. 21.76 n.a. 12.47 17.93 13.55 12.32Bill savings - gas n.a. 1.89 n.a. 3.65 4.02 1.94 3.66Private costs n.a. - 2.61 n.a. - 7.12 - 11.05 - 5.29 - 1.72Net private benefit/cost n.a. 21.05 n.a. 9.00 10.91 10.20 14.25Avoided GHG emissions - electricity n.a. 6.36 n.a. 3.64 5.24 3.96 3.60Avoided GHG emissions - gas n.a. 0.25 n.a. 0.48 0.53 0.26 0.48Net benefit/cost n.a. 27.65 n.a. 13.12 16.68 14.42 18.34
Retail
Bill savings - electricity n.a. 59.73 n.a. 69.04 83.53 72.23 - 8.51Bill savings - gas n.a. - 2.06 n.a. - 13.70 - 7.47 - 30.03 15.22Private costs n.a. - 4.39 n.a. - 18.60 - 7.22 - 10.36 - 16.62Net private benefit/cost n.a. 53.28 n.a. 36.75 68.84 31.84 - 9.91Avoided GHG emissions - electricity n.a. 17.44 n.a. 20.17 24.40 21.10 - 2.49Avoided GHG emissions - gas n.a. - 0.27 n.a. - 1.81 - 0.99 - 3.98 2.02Net benefit/cost n.a. 70.45 n.a. 55.10 92.25 48.96 - 10.38
Healthcare
Bill savings - electricity n.a. 35.84 n.a. 26.53 25.15 14.31 28.65Bill savings - gas n.a. - 0.36 n.a. - 0.74 - 0.24 - 14.86 - 19.49Private costs n.a. - 9.62 n.a. - 17.49 - 16.23 - 26.49 - 28.34Net private benefit/cost n.a. 25.85 n.a. 8.30 8.68 - 27.04 - 19.18Avoided GHG emissions - electricity n.a. 10.47 n.a. 7.75 7.35 4.18 8.37Avoided GHG emissions - gas n.a. - 0.05 n.a. - 0.10 - 0.03 - 1.97 - 2.58
www.TheCIE.com.au
242 Decision Regulation Impact Statement

CZ1 CZ2 CZ3 CZ4 CZ5 CZ6 CZ7
$ per m2
$ per m2
$ per m2
$ per m2
$ per m2
$ per m2
$ per m2
Net benefit/cost n.a. 36.27 n.a. 15.95 16.00 - 24.83 - 13.39
School
Bill savings - electricity n.a. 98.13 n.a. 56.00 41.15 45.75 71.00Bill savings - gas n.a. - 5.10 n.a. 16.60 9.36 19.62 13.43Private costs n.a. - 19.48 n.a. - 17.65 - 18.10 - 7.71 - 8.72Net private benefit/cost n.a. 73.56 n.a. 54.94 32.40 57.65 75.71Avoided GHG emissions - electricity n.a. 28.66 n.a. 16.36 12.02 13.36 20.74Avoided GHG emissions - gas n.a. - 0.67 n.a. 2.20 1.24 2.60 1.78Net benefit/cost n.a. 101.54 n.a. 73.50 45.66 73.61 98.22
Note: Costs and benefits are estimated over the assumed 40 year life of the building, using a discount rate of 7 per cent.Source: CIE based on EA modelling.
Victoria
I11II198 Net benefits to Victoria — low realisation scenarioCZ1 CZ2 CZ3 CZ4 CZ5 CZ6 CZ7
$ per m2
$ per m2
$ per m2
$ per m2
$ per m2
$ per m2
$ per m2
Hotels
Bill savings - electricity n.a. n.a. n.a. 28.71 n.a. 30.21 28.25Bill savings - gas n.a. n.a. n.a. 1.42 n.a. 1.01 1.05Private costs n.a. n.a. n.a. 1.10 n.a. 0.77 12.65Net private benefit/cost n.a. n.a. n.a. 31.23 n.a. 31.99 41.96Avoided GHG emissions - electricity n.a. n.a. n.a. 10.31 n.a. 10.85 10.14Avoided GHG emissions - gas n.a. n.a. n.a. 0.45 n.a. 0.32 0.33Net benefit/cost n.a. n.a. n.a. 41.99 n.a. 43.15 52.43
Office building
Bill savings - electricity n.a. n.a. n.a. 6.45 n.a. 7.01 6.37Bill savings - gas n.a. n.a. n.a. 0.96 n.a. 0.51 0.96Private costs n.a. n.a. n.a. - 7.12 n.a. - 5.29 - 1.72Net private benefit/cost n.a. n.a. n.a. 0.29 n.a. 2.23 5.61Avoided GHG emissions - electricity n.a. n.a. n.a. 2.32 n.a. 2.52 2.29Avoided GHG emissions - gas n.a. n.a. n.a. 0.30 n.a. 0.16 0.30
www.TheCIE.com.au
Decision Regulation Impact Statement 243

CZ1 CZ2 CZ3 CZ4 CZ5 CZ6 CZ7
$ per m2
$ per m2
$ per m2
$ per m2
$ per m2
$ per m2
$ per m2
Net benefit/cost n.a. n.a. n.a. 2.91 n.a. 4.91 8.20
Retail
Bill savings - electricity n.a. n.a. n.a. 35.72 n.a. 37.37 - 4.40Bill savings - gas n.a. n.a. n.a. - 3.59 n.a. - 7.88 3.99Private costs n.a. n.a. n.a. - 18.60 n.a. - 10.36 - 16.62Net private benefit/cost n.a. n.a. n.a. 13.53 n.a. 19.13 - 17.03Avoided GHG emissions - electricity n.a. n.a. n.a. 12.82 n.a. 13.41 - 1.58Avoided GHG emissions - gas n.a. n.a. n.a. - 1.13 n.a. - 2.48 1.26Net benefit/cost n.a. n.a. n.a. 25.22 n.a. 30.06 - 17.35
Healthcare
Bill savings - electricity n.a. n.a. n.a. 13.72 n.a. 7.40 14.82Bill savings - gas n.a. n.a. n.a. - 0.19 n.a. - 3.90 - 5.11Private costs n.a. n.a. n.a. - 17.49 n.a. - 26.49 - 28.34Net private benefit/cost n.a. n.a. n.a. - 3.96 n.a. - 22.98 - 18.63Avoided GHG emissions - electricity n.a. n.a. n.a. 4.93 n.a. 2.66 5.32Avoided GHG emissions - gas n.a. n.a. n.a. - 0.06 n.a. - 1.23 - 1.61Net benefit/cost n.a. n.a. n.a. 0.91 n.a. - 21.56 - 14.92
School
Bill savings - electricity n.a. n.a. n.a. 28.97 n.a. 23.67 36.73Bill savings - gas n.a. n.a. n.a. 4.35 n.a. 5.14 3.52Private costs n.a. n.a. n.a. - 17.65 n.a. - 7.71 - 8.72Net private benefit/cost n.a. n.a. n.a. 15.67 n.a. 21.10 31.53Avoided GHG emissions - electricity n.a. n.a. n.a. 10.40 n.a. 8.50 13.19Avoided GHG emissions - gas n.a. n.a. n.a. 1.37 n.a. 1.62 1.11Net benefit/cost n.a. n.a. n.a. 27.44 n.a. 31.22 45.83
Note: Costs and benefits are estimated over the assumed 40 year life of the building, using a discount rate of 7 per cent.Source: CIE based on EA modelling.
I11II199 Net benefits to Victoria — medium realisation scenarioCZ1 CZ2 CZ3 CZ4 CZ5 CZ6 CZ7
$ per m2
$ per m2
$ per m2
$ per m2
$ per m2
$ per m2
$ per m2
Hotels
Bill savings - electricity n.a. n.a. n.a. 43.07 n.a. 45.32 42.38
www.TheCIE.com.au
244 Decision Regulation Impact Statement

CZ1 CZ2 CZ3 CZ4 CZ5 CZ6 CZ7
$ per m2
$ per m2
$ per m2
$ per m2
$ per m2
$ per m2
$ per m2
Bill savings - gas n.a. n.a. n.a. 2.14 n.a. 1.52 1.57Private costs n.a. n.a. n.a. 1.10 n.a. 0.77 12.65Net private benefit/cost n.a. n.a. n.a. 46.30 n.a. 47.60 56.61Avoided GHG emissions - electricity n.a. n.a. n.a. 15.46 n.a. 16.27 15.21Avoided GHG emissions - gas n.a. n.a. n.a. 0.67 n.a. 0.48 0.50Net benefit/cost n.a. n.a. n.a. 62.44 n.a. 64.35 72.32
Office building
Bill savings - electricity n.a. n.a. n.a. 9.68 n.a. 10.52 9.56Bill savings - gas n.a. n.a. n.a. 1.43 n.a. 0.76 1.44Private costs n.a. n.a. n.a. - 7.12 n.a. - 5.29 - 1.72Net private benefit/cost n.a. n.a. n.a. 3.99 n.a. 5.99 9.28Avoided GHG emissions - electricity n.a. n.a. n.a. 3.47 n.a. 3.78 3.43Avoided GHG emissions - gas n.a. n.a. n.a. 0.45 n.a. 0.24 0.45Net benefit/cost n.a. n.a. n.a. 7.92 n.a. 10.00 13.16
Retail
Bill savings - electricity n.a. n.a. n.a. 53.58 n.a. 56.05 - 6.61Bill savings - gas n.a. n.a. n.a. - 5.39 n.a. - 11.82 5.99Private costs n.a. n.a. n.a. - 18.60 n.a. - 10.36 - 16.62Net private benefit/cost n.a. n.a. n.a. 29.59 n.a. 33.88 - 17.24Avoided GHG emissions - electricity n.a. n.a. n.a. 19.23 n.a. 20.12 - 2.37Avoided GHG emissions - gas n.a. n.a. n.a. - 1.70 n.a. - 3.73 1.89Net benefit/cost n.a. n.a. n.a. 47.12 n.a. 50.27 - 17.72
Healthcare
Bill savings - electricity n.a. n.a. n.a. 20.59 n.a. 11.11 22.23Bill savings - gas n.a. n.a. n.a. - 0.29 n.a. - 5.85 - 7.67Private costs n.a. n.a. n.a. - 17.49 n.a. - 26.49 - 28.34Net private benefit/cost n.a. n.a. n.a. 2.81 n.a. - 21.23 - 13.77Avoided GHG emissions - electricity n.a. n.a. n.a. 7.39 n.a. 3.99 7.98Avoided GHG emissions - gas n.a. n.a. n.a. - 0.09 n.a. - 1.84 - 2.42Net benefit/cost n.a. n.a. n.a. 10.11 n.a. - 19.09 - 8.21
School
Bill savings - electricity n.a. n.a. n.a. 43.46 n.a. 35.50 55.10Bill savings - gas n.a. n.a. n.a. 6.53 n.a. 7.72 5.28
www.TheCIE.com.au
Decision Regulation Impact Statement 245

CZ1 CZ2 CZ3 CZ4 CZ5 CZ6 CZ7
$ per m2
$ per m2
$ per m2
$ per m2
$ per m2
$ per m2
$ per m2
Private costs n.a. n.a. n.a. - 17.65 n.a. - 7.71 - 8.72Net private benefit/cost n.a. n.a. n.a. 32.33 n.a. 35.51 51.66Avoided GHG emissions - electricity n.a. n.a. n.a. 15.60 n.a. 12.74 19.78Avoided GHG emissions - gas n.a. n.a. n.a. 2.06 n.a. 2.43 1.67Net benefit/cost n.a. n.a. n.a. 49.99 n.a. 50.68 73.10
Note: Costs and benefits are estimated over the assumed 40 year life of the building, using a discount rate of 7 per cent.Source: CIE based on EA modelling.
www.TheCIE.com.au
246 Decision Regulation Impact Statement

I11II1100 Net benefits to Victoria — high realisation scenarioCZ1 CZ2 CZ3 CZ4 CZ5 CZ6 CZ7
$ per m2
$ per m2
$ per m2
$ per m2
$ per m2
$ per m2
$ per m2
Hotels
Bill savings - electricity n.a. n.a. n.a. 57.42 n.a. 60.43 56.51Bill savings - gas n.a. n.a. n.a. 2.85 n.a. 2.02 2.09Private costs n.a. n.a. n.a. 1.10 n.a. 0.77 12.65Net private benefit/cost n.a. n.a. n.a. 61.37 n.a. 63.21 71.26Avoided GHG emissions - electricity n.a. n.a. n.a. 20.61 n.a. 21.69 20.29Avoided GHG emissions - gas n.a. n.a. n.a. 0.90 n.a. 0.64 0.66Net benefit/cost n.a. n.a. n.a. 82.88 n.a. 85.54 92.20
Office building
Bill savings - electricity n.a. n.a. n.a. 12.90 n.a. 14.02 12.75Bill savings - gas n.a. n.a. n.a. 1.91 n.a. 1.02 1.92Private costs n.a. n.a. n.a. - 7.12 n.a. - 5.29 - 1.72Net private benefit/cost n.a. n.a. n.a. 7.70 n.a. 9.75 12.94Avoided GHG emissions - electricity n.a. n.a. n.a. 4.63 n.a. 5.03 4.58Avoided GHG emissions - gas n.a. n.a. n.a. 0.60 n.a. 0.32 0.60Net benefit/cost n.a. n.a. n.a. 12.93 n.a. 15.10 18.12
Retail
Bill savings - electricity n.a. n.a. n.a. 71.44 n.a. 74.73 - 8.81Bill savings - gas n.a. n.a. n.a. - 7.19 n.a. - 15.75 7.98Private costs n.a. n.a. n.a. - 18.60 n.a. - 10.36 - 16.62Net private benefit/cost n.a. n.a. n.a. 45.65 n.a. 48.62 - 17.44Avoided GHG emissions - electricity n.a. n.a. n.a. 25.65 n.a. 26.83 - 3.16Avoided GHG emissions - gas n.a. n.a. n.a. - 2.27 n.a. - 4.97 2.52Net benefit/cost n.a. n.a. n.a. 69.03 n.a. 70.48 - 18.09
Healthcare
Bill savings - electricity n.a. n.a. n.a. 27.45 n.a. 14.81 29.64Bill savings - gas n.a. n.a. n.a. - 0.39 n.a. - 7.80 - 10.22Private costs n.a. n.a. n.a. - 17.49 n.a. - 26.49 - 28.34Net private benefit/cost n.a. n.a. n.a. 9.58 n.a. - 19.48 - 8.92Avoided GHG emissions - electricity n.a. n.a. n.a. 9.85 n.a. 5.32 10.64Avoided GHG emissions - gas n.a. n.a. n.a. - 0.12 n.a. - 2.46 - 3.22
www.TheCIE.com.au
Decision Regulation Impact Statement 247

CZ1 CZ2 CZ3 CZ4 CZ5 CZ6 CZ7
$ per m2
$ per m2
$ per m2
$ per m2
$ per m2
$ per m2
$ per m2
Net benefit/cost n.a. n.a. n.a. 19.31 n.a. - 16.62 - 1.50
School
Bill savings - electricity n.a. n.a. n.a. 57.94 n.a. 47.33 73.46Bill savings - gas n.a. n.a. n.a. 8.70 n.a. 10.29 7.04Private costs n.a. n.a. n.a. - 17.65 n.a. - 7.71 - 8.72Net private benefit/cost n.a. n.a. n.a. 48.99 n.a. 49.91 71.78Avoided GHG emissions - electricity n.a. n.a. n.a. 20.80 n.a. 16.99 26.37Avoided GHG emissions - gas n.a. n.a. n.a. 2.75 n.a. 3.25 2.22Net benefit/cost n.a. n.a. n.a. 72.54 n.a. 70.15 100.37
Note: Costs and benefits are estimated over the assumed 40 year life of the building, using a discount rate of 7 per cent.Source: CIE based on EA modelling.
Queensland
I11II1101 Net benefits to Queensland — low realisation scenarioCZ1 CZ2 CZ3 CZ4 CZ5 CZ6 CZ7
$ per m2
$ per m2
$ per m2
$ per m2
$ per m2
$ per m2
$ per m2
Hotels
Bill savings - electricity 15.94 33.30 25.94 n.a. 27.82 n.a. n.a.Bill savings - gas 0.00 0.36 0.05 n.a. 0.05 n.a. n.a.Private costs 10.26 - 1.77 0.97 n.a. - 4.98 n.a. n.a.Net private benefit/cost 26.20 31.89 26.96 n.a. 22.89 n.a. n.a.Avoided GHG emissions - electricity 4.87 10.18 7.93 n.a. 8.50 n.a. n.a.Avoided GHG emissions - gas 0.00 0.08 0.01 n.a. 0.01 n.a. n.a.Net benefit/cost 31.07 42.15 34.90 n.a. 31.41 n.a. n.a.
Office building
Bill savings - electricity 10.45 10.51 n.a. n.a. n.a. n.a. n.a.Bill savings - gas 0.00 0.60 n.a. n.a. n.a. n.a. n.a.Private costs - 9.71 - 2.61 n.a. n.a. n.a. n.a. n.a.Net private benefit/cost 0.74 8.50 n.a. n.a. n.a. n.a. n.a.Avoided GHG emissions - electricity 3.19 3.21 n.a. n.a. n.a. n.a. n.a.Avoided GHG emissions - gas 0.00 0.13 n.a. n.a. n.a. n.a. n.a.
www.TheCIE.com.au
248 Decision Regulation Impact Statement

CZ1 CZ2 CZ3 CZ4 CZ5 CZ6 CZ7
$ per m2
$ per m2
$ per m2
$ per m2
$ per m2
$ per m2
$ per m2
Net benefit/cost 3.93 11.85 n.a. n.a. n.a. n.a. n.a.
Retail
Bill savings - electricity 38.08 28.85 39.81 n.a. 40.34 n.a. n.a.Bill savings - gas - 0.01 - 0.65 - 1.16 n.a. - 2.37 n.a. n.a.Private costs - 0.45 - 4.39 - 14.17 n.a. - 7.22 n.a. n.a.Net private benefit/cost 37.62 23.81 24.47 n.a. 30.75 n.a. n.a.Avoided GHG emissions - electricity 11.64 8.82 12.17 n.a. 12.33 n.a. n.a.Avoided GHG emissions - gas 0.00 - 0.15 - 0.26 n.a. - 0.53 n.a. n.a.Net benefit/cost 49.25 32.48 36.38 n.a. 42.55 n.a. n.a.
Healthcare
Bill savings - electricity 30.76 17.31 22.74 n.a. 12.15 n.a. n.a.Bill savings - gas 0.00 - 0.11 0.41 n.a. - 0.08 n.a. n.a.Private costs - 14.62 - 9.62 - 15.98 n.a. - 16.23 n.a. n.a.Net private benefit/cost 16.14 7.57 7.18 n.a. - 4.16 n.a. n.a.Avoided GHG emissions - electricity 9.40 5.29 6.95 n.a. 3.71 n.a. n.a.Avoided GHG emissions - gas 0.00 - 0.03 0.09 n.a. - 0.02 n.a. n.a.Net benefit/cost 25.54 12.84 14.22 n.a. - 0.46 n.a. n.a.
School
Bill savings - electricity 69.22 47.39 43.58 n.a. 19.87 n.a. n.a.Bill savings - gas 0.04 - 1.61 1.81 n.a. 2.96 n.a. n.a.Private costs - 5.61 - 19.48 - 12.16 n.a. - 18.10 n.a. n.a.Net private benefit/cost 63.65 26.30 33.23 n.a. 4.73 n.a. n.a.Avoided GHG emissions - electricity 21.16 14.49 13.32 n.a. 6.07 n.a. n.a.Avoided GHG emissions - gas 0.01 - 0.36 0.41 n.a. 0.67 n.a. n.a.Net benefit/cost 84.81 40.42 46.96 n.a. 11.47 n.a. n.a.
Note: Costs and benefits are estimated over the assumed 40 year life of the building, using a discount rate of 7 per cent.Source: CIE based on EA modelling.
www.TheCIE.com.au
Decision Regulation Impact Statement 249

I11II1102 Net benefits to Queensland — medium realisation scenarioCZ1 CZ2 CZ3 CZ4 CZ5 CZ6 CZ7
$ per m2
$ per m2
$ per m2
$ per m2
$ per m2
$ per m2
$ per m2
Hotels
Bill savings - electricity 23.91 49.94 38.90 n.a. 41.73 n.a. n.a.Bill savings - gas 0.00 0.55 0.08 n.a. 0.08 n.a. n.a.Private costs 10.26 - 1.77 0.97 n.a. - 4.98 n.a. n.a.Net private benefit/cost 34.17 48.72 39.95 n.a. 36.83 n.a. n.a.Avoided GHG emissions - electricity 7.31 15.27 11.89 n.a. 12.76 n.a. n.a.Avoided GHG emissions - gas 0.00 0.12 0.02 n.a. 0.02 n.a. n.a.Net benefit/cost 41.47 64.11 51.86 n.a. 49.60 n.a. n.a.
Office building
Bill savings - electricity 15.67 15.77 n.a. n.a. n.a. n.a. n.a.Bill savings - gas 0.00 0.90 n.a. n.a. n.a. n.a. n.a.Private costs - 9.71 - 2.61 n.a. n.a. n.a. n.a. n.a.Net private benefit/cost 5.96 14.06 n.a. n.a. n.a. n.a. n.a.Avoided GHG emissions - electricity 4.79 4.82 n.a. n.a. n.a. n.a. n.a.Avoided GHG emissions - gas 0.00 0.20 n.a. n.a. n.a. n.a. n.a.Net benefit/cost 10.75 19.08 n.a. n.a. n.a. n.a. n.a.
Retail
Bill savings - electricity 57.12 43.27 59.71 n.a. 60.51 n.a. n.a.Bill savings - gas - 0.01 - 0.98 - 1.74 n.a. - 3.55 n.a. n.a.Private costs - 0.45 - 4.39 - 14.17 n.a. - 7.22 n.a. n.a.Net private benefit/cost 56.65 37.90 43.80 n.a. 49.74 n.a. n.a.Avoided GHG emissions - electricity 17.46 13.23 18.25 n.a. 18.50 n.a. n.a.Avoided GHG emissions - gas 0.00 - 0.22 - 0.39 n.a. - 0.80 n.a. n.a.Net benefit/cost 74.11 50.91 61.66 n.a. 67.44 n.a. n.a.
Healthcare
Bill savings - electricity 46.14 25.96 34.11 n.a. 18.22 n.a. n.a.Bill savings - gas - 0.01 - 0.17 0.62 n.a. - 0.11 n.a. n.a.Private costs - 14.62 - 9.62 - 15.98 n.a. - 16.23 n.a. n.a.Net private benefit/cost 31.51 16.17 18.76 n.a. 1.88 n.a. n.a.Avoided GHG emissions - electricity 14.10 7.94 10.43 n.a. 5.57 n.a. n.a.Avoided GHG emissions - gas 0.00 - 0.04 0.14 n.a. - 0.03 n.a. n.a.Net benefit/cost 45.61 24.07 29.33 n.a. 7.42 n.a. n.a.
www.TheCIE.com.au
250 Decision Regulation Impact Statement

CZ1 CZ2 CZ3 CZ4 CZ5 CZ6 CZ7
$ per m2
$ per m2
$ per m2
$ per m2
$ per m2
$ per m2
$ per m2
School
Bill savings - electricity 103.83 71.09 65.37 n.a. 29.81 n.a. n.a.Bill savings - gas 0.06 - 2.42 2.72 n.a. 4.45 n.a. n.a.Private costs - 5.61 - 19.48 - 12.16 n.a. - 18.10 n.a. n.a.Net private benefit/cost 98.27 49.19 55.93 n.a. 16.15 n.a. n.a.Avoided GHG emissions - electricity 31.74 21.73 19.98 n.a. 9.11 n.a. n.a.Avoided GHG emissions - gas 0.01 - 0.54 0.61 n.a. 1.00 n.a. n.a.Net benefit/cost 130.02 70.37 76.52 n.a. 26.26 n.a. n.a.
Note: Costs and benefits are estimated over the assumed 40 year life of the building, using a discount rate of 7 per cent.Source: CIE based on EA modelling.
www.TheCIE.com.au
Decision Regulation Impact Statement 251

I11II1103 Net benefits to Queensland — high realisation scenarioCZ1 CZ2 CZ3 CZ4 CZ5 CZ6 CZ7
$ per m2
$ per m2
$ per m2
$ per m2
$ per m2
$ per m2
$ per m2
Hotels
Bill savings - electricity 31.88 66.59 51.87 n.a. 55.65 n.a. n.a.Bill savings - gas 0.00 0.73 0.11 n.a. 0.10 n.a. n.a.Private costs 10.26 - 1.77 0.97 n.a. - 4.98 n.a. n.a.Net private benefit/cost 42.14 65.55 52.95 n.a. 50.77 n.a. n.a.Avoided GHG emissions - electricity 9.74 20.35 15.86 n.a. 17.01 n.a. n.a.Avoided GHG emissions - gas 0.00 0.16 0.02 n.a. 0.02 n.a. n.a.Net benefit/cost 51.88 86.07 68.83 n.a. 67.80 n.a. n.a.
Office building
Bill savings - electricity 20.90 21.02 n.a. n.a. n.a. n.a. n.a.Bill savings - gas 0.00 1.20 n.a. n.a. n.a. n.a. n.a.Private costs - 9.71 - 2.61 n.a. n.a. n.a. n.a. n.a.Net private benefit/cost 11.18 19.61 n.a. n.a. n.a. n.a. n.a.Avoided GHG emissions - electricity 6.39 6.43 n.a. n.a. n.a. n.a. n.a.Avoided GHG emissions - gas 0.00 0.27 n.a. n.a. n.a. n.a. n.a.Net benefit/cost 17.57 26.31 n.a. n.a. n.a. n.a. n.a.
Retail
Bill savings - electricity 76.15 57.69 79.62 n.a. 80.68 n.a. n.a.Bill savings - gas - 0.02 - 1.31 - 2.33 n.a. - 4.73 n.a. n.a.Private costs - 0.45 - 4.39 - 14.17 n.a. - 7.22 n.a. n.a.Net private benefit/cost 75.69 52.00 63.12 n.a. 68.73 n.a. n.a.Avoided GHG emissions - electricity 23.28 17.63 24.34 n.a. 24.66 n.a. n.a.Avoided GHG emissions - gas 0.00 - 0.29 - 0.52 n.a. - 1.06 n.a. n.a.Net benefit/cost 98.96 69.34 86.93 n.a. 92.33 n.a. n.a.
Healthcare
Bill savings - electricity 61.52 34.62 45.49 n.a. 24.29 n.a. n.a.Bill savings - gas - 0.01 - 0.23 0.83 n.a. - 0.15 n.a. n.a.Private costs - 14.62 - 9.62 - 15.98 n.a. - 16.23 n.a. n.a.Net private benefit/cost 46.89 24.77 30.34 n.a. 7.91 n.a. n.a.Avoided GHG emissions - electricity 18.80 10.58 13.90 n.a. 7.42 n.a. n.a.Avoided GHG emissions - gas 0.00 - 0.05 0.19 n.a. - 0.03 n.a. n.a.
www.TheCIE.com.au
252 Decision Regulation Impact Statement

CZ1 CZ2 CZ3 CZ4 CZ5 CZ6 CZ7
$ per m2
$ per m2
$ per m2
$ per m2
$ per m2
$ per m2
$ per m2
Net benefit/cost 65.69 35.30 44.43 n.a. 15.30 n.a. n.a.
School
Bill savings - electricity 138.44 94.79 87.16 n.a. 39.74 n.a. n.a.Bill savings - gas 0.08 - 3.23 3.62 n.a. 5.93 n.a. n.a.Private costs - 5.61 - 19.48 - 12.16 n.a. - 18.10 n.a. n.a.Net private benefit/cost 132.90 72.08 78.62 n.a. 27.57 n.a. n.a.Avoided GHG emissions - electricity 42.32 28.97 26.64 n.a. 12.15 n.a. n.a.Avoided GHG emissions - gas 0.02 - 0.73 0.82 n.a. 1.33 n.a. n.a.Net benefit/cost 175.24 100.32 106.08 n.a. 41.05 n.a. n.a.
Note: Costs and benefits are estimated over the assumed 40 year life of the building, using a discount rate of 7 per cent.Source: CIE based on EA modelling.
South Australia
I11II1104 Net benefits to South Australia — low realisation scenarioCZ1 CZ2 CZ3 CZ4 CZ5 CZ6 CZ7
$ per m2
$ per m2
$ per m2
$ per m2
$ per m2
$ per m2
$ per m2
Hotels
Bill savings - electricity n.a. n.a. n.a. 27.47 28.51 28.90 n.a.Bill savings - gas n.a. n.a. n.a. 1.57 0.05 1.11 n.a.Private costs n.a. n.a. n.a. 1.10 - 4.98 0.77 n.a.Net private benefit/cost n.a. n.a. n.a. 30.13 23.57 30.78 n.a.Avoided GHG emissions - electricity n.a. n.a. n.a. 5.37 5.58 5.65 n.a.Avoided GHG emissions - gas n.a. n.a. n.a. 0.42 0.01 0.30 n.a.Net benefit/cost n.a. n.a. n.a. 35.92 29.16 36.73 n.a.
Office building
Bill savings - electricity n.a. n.a. n.a. n.a. 8.87 n.a. n.a.Bill savings - gas n.a. n.a. n.a. n.a. 1.16 n.a. n.a.Private costs n.a. n.a. n.a. n.a. - 11.05 n.a. n.a.Net private benefit/cost n.a. n.a. n.a. n.a. - 1.01 n.a. n.a.Avoided GHG emissions - electricity n.a. n.a. n.a. n.a. 1.74 n.a. n.a.Avoided GHG emissions - gas n.a. n.a. n.a. n.a. 0.31 n.a. n.a.
www.TheCIE.com.au
Decision Regulation Impact Statement 253

CZ1 CZ2 CZ3 CZ4 CZ5 CZ6 CZ7
$ per m2
$ per m2
$ per m2
$ per m2
$ per m2
$ per m2
$ per m2
Net benefit/cost n.a. n.a. n.a. n.a. 1.03 n.a. n.a.
Retail
Bill savings - electricity n.a. n.a. n.a. 34.17 41.33 35.75 n.a.Bill savings - gas n.a. n.a. n.a. - 3.95 - 2.15 - 8.66 n.a.Private costs n.a. n.a. n.a. - 18.60 - 7.22 - 10.36 n.a.Net private benefit/cost n.a. n.a. n.a. 11.62 31.96 16.72 n.a.Avoided GHG emissions - electricity n.a. n.a. n.a. 6.69 8.09 6.99 n.a.Avoided GHG emissions - gas n.a. n.a. n.a. - 1.06 - 0.58 - 2.33 n.a.Net benefit/cost n.a. n.a. n.a. 17.24 39.47 21.39 n.a.
Healthcare
Bill savings - electricity n.a. n.a. n.a. 13.13 12.45 7.08 n.a.Bill savings - gas n.a. n.a. n.a. - 0.21 - 0.07 - 4.29 n.a.Private costs n.a. n.a. n.a. - 17.49 - 16.23 - 26.49 n.a.Net private benefit/cost n.a. n.a. n.a. - 4.57 - 3.85 - 23.69 n.a.Avoided GHG emissions - electricity n.a. n.a. n.a. 2.57 2.44 1.39 n.a.Avoided GHG emissions - gas n.a. n.a. n.a. - 0.06 - 0.02 - 1.15 n.a.Net benefit/cost n.a. n.a. n.a. - 2.06 - 1.43 - 23.46 n.a.
School
Bill savings - electricity n.a. n.a. n.a. 27.71 20.36 22.64 n.a.Bill savings - gas n.a. n.a. n.a. 4.79 2.70 5.66 n.a.Private costs n.a. n.a. n.a. - 17.65 - 18.10 - 7.71 n.a.Net private benefit/cost n.a. n.a. n.a. 14.85 4.96 20.59 n.a.Avoided GHG emissions - electricity n.a. n.a. n.a. 5.42 3.98 4.43 n.a.Avoided GHG emissions - gas n.a. n.a. n.a. 1.29 0.72 1.52 n.a.Net benefit/cost n.a. n.a. n.a. 21.55 9.67 26.54 n.a.
Note: Costs and benefits are estimated over the assumed 40 year life of the building, using a discount rate of 7 per cent.Source: CIE based on EA modelling.
I11II1105 Net benefits to South Australia — medium realisation scenarioCZ1 CZ2 CZ3 CZ4 CZ5 CZ6 CZ7
$ per m2
$ per m2
$ per m2
$ per m2
$ per m2
$ per m2
$ per m2
Hotels
Bill savings - electricity n.a. n.a. n.a. 41.20 42.76 43.35 n.a.
www.TheCIE.com.au
254 Decision Regulation Impact Statement

CZ1 CZ2 CZ3 CZ4 CZ5 CZ6 CZ7
$ per m2
$ per m2
$ per m2
$ per m2
$ per m2
$ per m2
$ per m2
Bill savings - gas n.a. n.a. n.a. 2.35 0.07 1.67 n.a.Private costs n.a. n.a. n.a. 1.10 - 4.98 0.77 n.a.Net private benefit/cost n.a. n.a. n.a. 44.65 37.85 45.78 n.a.Avoided GHG emissions - electricity n.a. n.a. n.a. 8.06 8.37 8.48 n.a.Avoided GHG emissions - gas n.a. n.a. n.a. 0.63 0.02 0.45 n.a.Net benefit/cost n.a. n.a. n.a. 53.34 46.24 54.71 n.a.
Office building
Bill savings - electricity n.a. n.a. n.a. n.a. 13.31 n.a. n.a.Bill savings - gas n.a. n.a. n.a. n.a. 1.74 n.a. n.a.Private costs n.a. n.a. n.a. n.a. - 11.05 n.a. n.a.Net private benefit/cost n.a. n.a. n.a. n.a. 4.00 n.a. n.a.Avoided GHG emissions - electricity n.a. n.a. n.a. n.a. 2.60 n.a. n.a.Avoided GHG emissions - gas n.a. n.a. n.a. n.a. 0.47 n.a. n.a.Net benefit/cost n.a. n.a. n.a. n.a. 7.07 n.a. n.a.
Retail
Bill savings - electricity n.a. n.a. n.a. 51.25 62.00 53.62 n.a.Bill savings - gas n.a. n.a. n.a. - 5.93 - 3.23 - 12.99 n.a.Private costs n.a. n.a. n.a. - 18.60 - 7.22 - 10.36 n.a.Net private benefit/cost n.a. n.a. n.a. 26.73 51.55 30.26 n.a.Avoided GHG emissions - electricity n.a. n.a. n.a. 10.03 12.13 10.49 n.a.Avoided GHG emissions - gas n.a. n.a. n.a. - 1.59 - 0.87 - 3.49 n.a.Net benefit/cost n.a. n.a. n.a. 35.16 62.82 37.27 n.a.
Healthcare
Bill savings - electricity n.a. n.a. n.a. 19.69 18.67 10.62 n.a.Bill savings - gas n.a. n.a. n.a. - 0.32 - 0.10 - 6.43 n.a.Private costs n.a. n.a. n.a. - 17.49 - 16.23 - 26.49 n.a.Net private benefit/cost n.a. n.a. n.a. 1.89 2.34 - 22.30 n.a.Avoided GHG emissions - electricity n.a. n.a. n.a. 3.85 3.65 2.08 n.a.Avoided GHG emissions - gas n.a. n.a. n.a. - 0.09 - 0.03 - 1.73 n.a.Net benefit/cost n.a. n.a. n.a. 5.65 5.96 - 21.95 n.a.
School
Bill savings - electricity n.a. n.a. n.a. 41.57 30.54 33.96 n.a.Bill savings - gas n.a. n.a. n.a. 7.18 4.05 8.49 n.a.
www.TheCIE.com.au
Decision Regulation Impact Statement 255

CZ1 CZ2 CZ3 CZ4 CZ5 CZ6 CZ7
$ per m2
$ per m2
$ per m2
$ per m2
$ per m2
$ per m2
$ per m2
Private costs n.a. n.a. n.a. - 17.65 - 18.10 - 7.71 n.a.Net private benefit/cost n.a. n.a. n.a. 31.10 16.49 34.73 n.a.Avoided GHG emissions - electricity n.a. n.a. n.a. 8.13 5.98 6.64 n.a.Avoided GHG emissions - gas n.a. n.a. n.a. 1.93 1.09 2.28 n.a.Net benefit/cost n.a. n.a. n.a. 41.16 23.55 43.66 n.a.
Note: Costs and benefits are estimated over the assumed 40 year life of the building, using a discount rate of 7 per cent.Source: CIE based on EA modelling.
www.TheCIE.com.au
256 Decision Regulation Impact Statement

I11II1106 Net benefits to South Australia — high realisation scenarioCZ1 CZ2 CZ3 CZ4 CZ5 CZ6 CZ7
$ per m2
$ per m2
$ per m2
$ per m2
$ per m2
$ per m2
$ per m2
Hotels
Bill savings - electricity n.a. n.a. n.a. 54.93 57.02 57.80 n.a.Bill savings - gas n.a. n.a. n.a. 3.13 0.09 2.22 n.a.Private costs n.a. n.a. n.a. 1.10 - 4.98 0.77 n.a.Net private benefit/cost n.a. n.a. n.a. 59.16 52.13 60.79 n.a.Avoided GHG emissions - electricity n.a. n.a. n.a. 10.75 11.16 11.31 n.a.Avoided GHG emissions - gas n.a. n.a. n.a. 0.84 0.02 0.60 n.a.Net benefit/cost n.a. n.a. n.a. 70.75 63.31 72.69 n.a.
Office building
Bill savings - electricity n.a. n.a. n.a. n.a. 17.75 n.a. n.a.Bill savings - gas n.a. n.a. n.a. n.a. 2.32 n.a. n.a.Private costs n.a. n.a. n.a. n.a. - 11.05 n.a. n.a.Net private benefit/cost n.a. n.a. n.a. n.a. 9.02 n.a. n.a.Avoided GHG emissions - electricity n.a. n.a. n.a. n.a. 3.47 n.a. n.a.Avoided GHG emissions - gas n.a. n.a. n.a. n.a. 0.62 n.a. n.a.Net benefit/cost n.a. n.a. n.a. n.a. 13.11 n.a. n.a.
Retail
Bill savings - electricity n.a. n.a. n.a. 68.34 82.67 71.49 n.a.Bill savings - gas n.a. n.a. n.a. - 7.90 - 4.31 - 17.32 n.a.Private costs n.a. n.a. n.a. - 18.60 - 7.22 - 10.36 n.a.Net private benefit/cost n.a. n.a. n.a. 41.83 71.14 43.81 n.a.Avoided GHG emissions - electricity n.a. n.a. n.a. 13.37 16.18 13.99 n.a.Avoided GHG emissions - gas n.a. n.a. n.a. - 2.12 - 1.16 - 4.65 n.a.Net benefit/cost n.a. n.a. n.a. 53.08 86.16 53.14 n.a.
Healthcare
Bill savings - electricity n.a. n.a. n.a. 26.26 24.89 14.16 n.a.Bill savings - gas n.a. n.a. n.a. - 0.43 - 0.14 - 8.57 n.a.Private costs n.a. n.a. n.a. - 17.49 - 16.23 - 26.49 n.a.Net private benefit/cost n.a. n.a. n.a. 8.34 8.53 - 20.90 n.a.Avoided GHG emissions - electricity n.a. n.a. n.a. 5.14 4.87 2.77 n.a.Avoided GHG emissions - gas n.a. n.a. n.a. - 0.11 - 0.04 - 2.30 n.a.
www.TheCIE.com.au
Decision Regulation Impact Statement 257

CZ1 CZ2 CZ3 CZ4 CZ5 CZ6 CZ7
$ per m2
$ per m2
$ per m2
$ per m2
$ per m2
$ per m2
$ per m2
Net benefit/cost n.a. n.a. n.a. 13.37 13.36 - 20.43 n.a.
School
Bill savings - electricity n.a. n.a. n.a. 55.43 40.72 45.28 n.a.Bill savings - gas n.a. n.a. n.a. 9.57 5.40 11.32 n.a.Private costs n.a. n.a. n.a. - 17.65 - 18.10 - 7.71 n.a.Net private benefit/cost n.a. n.a. n.a. 47.35 28.02 48.88 n.a.Avoided GHG emissions - electricity n.a. n.a. n.a. 10.84 7.97 8.86 n.a.Avoided GHG emissions - gas n.a. n.a. n.a. 2.57 1.45 3.04 n.a.Net benefit/cost n.a. n.a. n.a. 60.76 37.43 60.78 n.a.
Note: Costs and benefits are estimated over the assumed 40 year life of the building, using a discount rate of 7 per cent.Source: CIE based on EA modelling.
Western Australia
I11II1107 Net benefits to Western Australia — low realisation scenarioCZ1 CZ2 CZ3 CZ4 CZ5 CZ6 CZ7
$ per m2
$ per m2
$ per m2
$ per m2
$ per m2
$ per m2
$ per m2
Hotels
Bill savings - electricity 16.39 n.a. 26.67 27.56 28.61 29.00 n.a.Bill savings - gas 0.00 n.a. 0.03 0.95 0.03 0.67 n.a.Private costs 10.26 n.a. 0.97 1.10 - 4.98 0.77 n.a.Net private benefit/cost 26.65 n.a. 27.67 29.61 23.65 30.44 n.a.Avoided GHG emissions - electricity 3.93 n.a. 6.39 6.61 6.86 6.95 n.a.Avoided GHG emissions - gas 0.00 n.a. 0.01 0.43 0.01 0.31 n.a.Net benefit/cost 30.57 n.a. 34.07 36.65 30.53 37.70 n.a.
Office building
Bill savings - electricity n.a. n.a. n.a. n.a. 8.90 n.a. n.a.Bill savings - gas n.a. n.a. n.a. n.a. 0.70 n.a. n.a.Private costs n.a. n.a. n.a. n.a. - 11.05 n.a. n.a.Net private benefit/cost n.a. n.a. n.a. n.a. - 1.44 n.a. n.a.Avoided GHG emissions - electricity n.a. n.a. n.a. n.a. 2.13 n.a. n.a.Avoided GHG emissions - gas n.a. n.a. n.a. n.a. 0.32 n.a. n.a.
www.TheCIE.com.au
258 Decision Regulation Impact Statement

CZ1 CZ2 CZ3 CZ4 CZ5 CZ6 CZ7
$ per m2
$ per m2
$ per m2
$ per m2
$ per m2
$ per m2
$ per m2
Net benefit/cost n.a. n.a. n.a. n.a. 1.01 n.a. n.a.
Retail
Bill savings - electricity 39.15 n.a. 40.93 34.29 41.48 35.87 n.a.Bill savings - gas - 0.01 n.a. - 0.64 - 2.39 - 1.30 - 5.24 n.a.Private costs - 0.45 n.a. - 14.17 - 18.60 - 7.22 - 10.36 n.a.Net private benefit/cost 38.70 n.a. 26.12 13.30 32.96 20.27 n.a.Avoided GHG emissions - electricity 9.39 n.a. 9.81 8.22 9.94 8.60 n.a.Avoided GHG emissions - gas 0.00 n.a. - 0.29 - 1.09 - 0.59 - 2.39 n.a.Net benefit/cost 48.08 n.a. 35.64 20.43 42.31 26.48 n.a.
Healthcare
Bill savings - electricity 31.63 n.a. 23.38 13.17 12.49 7.11 n.a.Bill savings - gas 0.00 n.a. 0.23 - 0.13 - 0.04 - 2.59 n.a.Private costs - 14.62 n.a. - 15.98 - 17.49 - 16.23 - 26.49 n.a.Net private benefit/cost 17.00 n.a. 7.64 - 4.44 - 3.78 - 21.98 n.a.Avoided GHG emissions - electricity 7.58 n.a. 5.61 3.16 2.99 1.70 n.a.Avoided GHG emissions - gas 0.00 n.a. 0.10 - 0.06 - 0.02 - 1.18 n.a.Net benefit/cost 24.59 n.a. 13.35 - 1.34 - 0.81 - 21.46 n.a.
School
Bill savings - electricity 71.17 n.a. 44.81 27.81 20.43 22.72 n.a.Bill savings - gas 0.02 n.a. 1.00 2.89 1.63 3.42 n.a.Private costs - 5.61 n.a. - 12.16 - 17.65 - 18.10 - 7.71 n.a.Net private benefit/cost 65.58 n.a. 33.64 13.05 3.96 18.43 n.a.Avoided GHG emissions - electricity 17.06 n.a. 10.74 6.67 4.90 5.45 n.a.Avoided GHG emissions - gas 0.01 n.a. 0.46 1.32 0.74 1.56 n.a.Net benefit/cost 82.65 n.a. 44.84 21.04 9.60 25.44 n.a.
Note: Costs and benefits are estimated over the assumed 40 year life of the building, using a discount rate of 7 per cent.Source: CIE based on EA modelling.
I11II1108 Net benefits to Western Australia — medium realisation scenario
CZ1 CZ2 CZ3 CZ4 CZ5 CZ6 CZ7
$ per m2
$ per m2
$ per m2
$ per m2
$ per m2
$ per m2
$ per m2
Hotels
www.TheCIE.com.au
Decision Regulation Impact Statement 259
CZ1 CZ2 CZ3 CZ4 CZ5 CZ6 CZ7
$ per m2
$ per m2
$ per m2
$ per m2
$ per m2
$ per m2
$ per m2
Bill savings - electricity 24.58 n.a. 40.00 41.34 42.91 43.50 n.a.Bill savings - gas 0.00 n.a. 0.04 1.42 0.04 1.01 n.a.Private costs 10.26 n.a. 0.97 1.10 - 4.98 0.77 n.a.Net private benefit/cost 34.84 n.a. 41.01 43.86 37.97 45.27 n.a.Avoided GHG emissions - electricity 5.89 n.a. 9.59 9.91 10.29 10.43 n.a.Avoided GHG emissions - gas 0.00 n.a. 0.02 0.65 0.02 0.46 n.a.Net benefit/cost 40.73 n.a. 50.62 54.42 48.28 56.16 n.a.
Office building
Bill savings - electricity n.a. n.a. n.a. n.a. 13.36 n.a. n.a.Bill savings - gas n.a. n.a. n.a. n.a. 1.05 n.a. n.a.Private costs n.a. n.a. n.a. n.a. - 11.05 n.a. n.a.Net private benefit/cost n.a. n.a. n.a. n.a. 3.36 n.a. n.a.Avoided GHG emissions - electricity n.a. n.a. n.a. n.a. 3.20 n.a. n.a.Avoided GHG emissions - gas n.a. n.a. n.a. n.a. 0.48 n.a. n.a.Net benefit/cost n.a. n.a. n.a. n.a. 7.04 n.a. n.a.
Retail
Bill savings - electricity 58.73 n.a. 61.40 51.43 62.22 53.80 n.a.Bill savings - gas - 0.01 n.a. - 0.96 - 3.58 - 1.95 - 7.86 n.a.Private costs - 0.45 n.a. - 14.17 - 18.60 - 7.22 - 10.36 n.a.Net private benefit/cost 58.27 n.a. 46.27 29.25 53.04 35.59 n.a.Avoided GHG emissions - electricity 14.08 n.a. 14.72 12.33 14.92 12.90 n.a.Avoided GHG emissions - gas 0.00 n.a. - 0.44 - 1.64 - 0.89 - 3.59 n.a.Net benefit/cost 72.34 n.a. 60.55 39.94 67.07 44.90 n.a.
Healthcare
Bill savings - electricity 47.44 n.a. 35.08 19.76 18.73 10.66 n.a.Bill savings - gas 0.00 n.a. 0.34 - 0.19 - 0.06 - 3.89 n.a.Private costs - 14.62 n.a. - 15.98 - 17.49 - 16.23 - 26.49 n.a.Net private benefit/cost 32.82 n.a. 19.44 2.08 2.44 - 19.72 n.a.Avoided GHG emissions - electricity 11.37 n.a. 8.41 4.74 4.49 2.56 n.a.Avoided GHG emissions - gas 0.00 n.a. 0.16 - 0.09 - 0.03 - 1.78 n.a.Net benefit/cost 44.19 n.a. 28.01 6.73 6.91 - 18.94 n.a.
School
Bill savings - electricity 106.76 n.a. 67.21 41.71 30.65 34.08 n.a.
www.TheCIE.com.au
260 Decision Regulation Impact Statement

CZ1 CZ2 CZ3 CZ4 CZ5 CZ6 CZ7
$ per m2
$ per m2
$ per m2
$ per m2
$ per m2
$ per m2
$ per m2
Bill savings - gas 0.03 n.a. 1.50 4.34 2.45 5.13 n.a.Private costs - 5.61 n.a. - 12.16 - 17.65 - 18.10 - 7.71 n.a.Net private benefit/cost 101.18 n.a. 56.55 28.40 14.99 31.50 n.a.Avoided GHG emissions - electricity 25.59 n.a. 16.11 10.00 7.35 8.17 n.a.Avoided GHG emissions - gas 0.01 n.a. 0.68 1.98 1.12 2.34 n.a.Net benefit/cost 126.79 n.a. 73.34 40.38 23.46 42.01 n.a.
Note: Costs and benefits are estimated over the assumed 40 year life of the building, using a discount rate of 7 per cent.Source: CIE based on EA modelling.
www.TheCIE.com.au
Decision Regulation Impact Statement 261

I11II1109 Net benefits to Western Australia — high realisation scenarioCZ1 CZ2 CZ3 CZ4 CZ5 CZ6 CZ7
$ per m2
$ per m2
$ per m2
$ per m2
$ per m2
$ per m2
$ per m2
Hotels
Bill savings - electricity 32.78 n.a. 53.34 55.12 57.22 58.00 n.a.Bill savings - gas 0.00 n.a. 0.06 1.90 0.06 1.34 n.a.Private costs 10.26 n.a. 0.97 1.10 - 4.98 0.77 n.a.Net private benefit/cost 43.04 n.a. 54.36 58.11 52.29 60.11 n.a.Avoided GHG emissions - electricity 7.86 n.a. 12.79 13.21 13.72 13.91 n.a.Avoided GHG emissions - gas 0.00 n.a. 0.03 0.87 0.03 0.61 n.a.Net benefit/cost 50.89 n.a. 67.18 72.19 66.03 74.63 n.a.
Office building
Bill savings - electricity n.a. n.a. n.a. n.a. 17.81 n.a. n.a.Bill savings - gas n.a. n.a. n.a. n.a. 1.40 n.a. n.a.Private costs n.a. n.a. n.a. n.a. - 11.05 n.a. n.a.Net private benefit/cost n.a. n.a. n.a. n.a. 8.16 n.a. n.a.Avoided GHG emissions - electricity n.a. n.a. n.a. n.a. 4.27 n.a. n.a.Avoided GHG emissions - gas n.a. n.a. n.a. n.a. 0.64 n.a. n.a.Net benefit/cost n.a. n.a. n.a. n.a. 13.07 n.a. n.a.
Retail
Bill savings - electricity 78.30 n.a. 81.86 68.57 82.96 71.74 n.a.Bill savings - gas - 0.01 n.a. - 1.28 - 4.78 - 2.60 - 10.48 n.a.Private costs - 0.45 n.a. - 14.17 - 18.60 - 7.22 - 10.36 n.a.Net private benefit/cost 77.84 n.a. 66.41 45.19 73.13 50.90 n.a.Avoided GHG emissions - electricity 18.77 n.a. 19.63 16.44 19.89 17.20 n.a.Avoided GHG emissions - gas 0.00 n.a. - 0.58 - 2.18 - 1.19 - 4.78 n.a.Net benefit/cost 96.61 n.a. 85.45 59.45 91.83 63.32 n.a.
Healthcare
Bill savings - electricity 63.25 n.a. 46.77 26.35 24.98 14.21 n.a.Bill savings - gas 0.00 n.a. 0.46 - 0.26 - 0.08 - 5.19 n.a.Private costs - 14.62 n.a. - 15.98 - 17.49 - 16.23 - 26.49 n.a.Net private benefit/cost 48.63 n.a. 31.25 8.60 8.67 - 17.46 n.a.Avoided GHG emissions - electricity 15.16 n.a. 11.21 6.32 5.99 3.41 n.a.Avoided GHG emissions - gas 0.00 n.a. 0.21 - 0.12 - 0.04 - 2.37 n.a.
www.TheCIE.com.au
262 Decision Regulation Impact Statement
CZ1 CZ2 CZ3 CZ4 CZ5 CZ6 CZ7
$ per m2
$ per m2
$ per m2
$ per m2
$ per m2
$ per m2
$ per m2
Net benefit/cost 63.79 n.a. 42.67 14.80 14.62 - 16.42 n.a.
School
Bill savings - electricity 142.35 n.a. 89.61 55.62 40.87 45.43 n.a.Bill savings - gas 0.04 n.a. 2.00 5.79 3.26 6.84 n.a.Private costs - 5.61 n.a. - 12.16 - 17.65 - 18.10 - 7.71 n.a.Net private benefit/cost 136.77 n.a. 79.45 43.75 26.03 44.57 n.a.Avoided GHG emissions - electricity 34.13 n.a. 21.48 13.33 9.80 10.89 n.a.Avoided GHG emissions - gas 0.02 n.a. 0.91 2.64 1.49 3.12 n.a.Net benefit/cost 170.92 n.a. 101.84 59.73 37.31 58.58 n.a.
Note: Costs and benefits are estimated over the assumed 40 year life of the building, using a discount rate of 7 per cent.Source: CIE based on EA modelling.
Tasmania
I11II1110 Net benefits to Tasmania — low realisation scenarioCZ1 CZ2 CZ3 CZ4 CZ5 CZ6 CZ7
$ per m2
$ per m2
$ per m2
$ per m2
$ per m2
$ per m2
$ per m2
Hotels
Bill savings - electricity n.a. n.a. n.a. n.a. n.a. n.a. 22.74Bill savings - gas n.a. n.a. n.a. n.a. n.a. n.a. 1.11Private costs n.a. n.a. n.a. n.a. n.a. n.a. 12.65Net private benefit/cost n.a. n.a. n.a. n.a. n.a. n.a. 36.50Avoided GHG emissions - electricity n.a. n.a. n.a. n.a. n.a. n.a. 2.47Avoided GHG emissions - gas n.a. n.a. n.a. n.a. n.a. n.a. 0.28Net benefit/cost n.a. n.a. n.a. n.a. n.a. n.a. 39.26
Office building
Bill savings - electricity n.a. n.a. n.a. n.a. n.a. n.a. 5.13Bill savings - gas n.a. n.a. n.a. n.a. n.a. n.a. 1.02Private costs n.a. n.a. n.a. n.a. n.a. n.a. - 1.72Net private benefit/cost n.a. n.a. n.a. n.a. n.a. n.a. 4.42Avoided GHG emissions - electricity n.a. n.a. n.a. n.a. n.a. n.a. 0.56Avoided GHG emissions - gas n.a. n.a. n.a. n.a. n.a. n.a. 0.26
www.TheCIE.com.au
Decision Regulation Impact Statement 263

CZ1 CZ2 CZ3 CZ4 CZ5 CZ6 CZ7
$ per m2
$ per m2
$ per m2
$ per m2
$ per m2
$ per m2
$ per m2
Net benefit/cost n.a. n.a. n.a. n.a. n.a. n.a. 5.24
Retail
Bill savings - electricity n.a. n.a. n.a. n.a. n.a. n.a. - 3.54Bill savings - gas n.a. n.a. n.a. n.a. n.a. n.a. 4.23Private costs n.a. n.a. n.a. n.a. n.a. n.a. - 16.62Net private benefit/cost n.a. n.a. n.a. n.a. n.a. n.a. - 15.93Avoided GHG emissions - electricity n.a. n.a. n.a. n.a. n.a. n.a. - 0.39Avoided GHG emissions - gas n.a. n.a. n.a. n.a. n.a. n.a. 1.09Net benefit/cost n.a. n.a. n.a. n.a. n.a. n.a. - 15.23
Healthcare
Bill savings - electricity n.a. n.a. n.a. n.a. n.a. n.a. 11.93Bill savings - gas n.a. n.a. n.a. n.a. n.a. n.a. - 5.42Private costs n.a. n.a. n.a. n.a. n.a. n.a. - 28.34Net private benefit/cost n.a. n.a. n.a. n.a. n.a. n.a. - 21.83Avoided GHG emissions - electricity n.a. n.a. n.a. n.a. n.a. n.a. 1.30Avoided GHG emissions - gas n.a. n.a. n.a. n.a. n.a. n.a. - 1.39Net benefit/cost n.a. n.a. n.a. n.a. n.a. n.a. - 21.93
School
Bill savings - electricity n.a. n.a. n.a. n.a. n.a. n.a. 29.56Bill savings - gas n.a. n.a. n.a. n.a. n.a. n.a. 3.74Private costs n.a. n.a. n.a. n.a. n.a. n.a. - 8.72Net private benefit/cost n.a. n.a. n.a. n.a. n.a. n.a. 24.58Avoided GHG emissions - electricity n.a. n.a. n.a. n.a. n.a. n.a. 3.21Avoided GHG emissions - gas n.a. n.a. n.a. n.a. n.a. n.a. 0.96Net benefit/cost n.a. n.a. n.a. n.a. n.a. n.a. 28.75
Note: Costs and benefits are estimated over the assumed 40 year life of the building, using a discount rate of 7 per cent.Source: CIE based on EA modelling.
I11II1111 Net benefits to Tasmania — medium realisation scenarioCZ1 CZ2 CZ3 CZ4 CZ5 CZ6 CZ7
$ per m2
$ per m2
$ per m2
$ per m2
$ per m2
$ per m2
$ per m2
Hotels
Bill savings - electricity n.a. n.a. n.a. n.a. n.a. n.a. 34.11
www.TheCIE.com.au
264 Decision Regulation Impact Statement

CZ1 CZ2 CZ3 CZ4 CZ5 CZ6 CZ7
$ per m2
$ per m2
$ per m2
$ per m2
$ per m2
$ per m2
$ per m2
Bill savings - gas n.a. n.a. n.a. n.a. n.a. n.a. 1.67Private costs n.a. n.a. n.a. n.a. n.a. n.a. 12.65Net private benefit/cost n.a. n.a. n.a. n.a. n.a. n.a. 48.43Avoided GHG emissions - electricity n.a. n.a. n.a. n.a. n.a. n.a. 3.71Avoided GHG emissions - gas n.a. n.a. n.a. n.a. n.a. n.a. 0.43Net benefit/cost n.a. n.a. n.a. n.a. n.a. n.a. 52.56
Office building
Bill savings - electricity n.a. n.a. n.a. n.a. n.a. n.a. 7.69Bill savings - gas n.a. n.a. n.a. n.a. n.a. n.a. 1.53Private costs n.a. n.a. n.a. n.a. n.a. n.a. - 1.72Net private benefit/cost n.a. n.a. n.a. n.a. n.a. n.a. 7.50Avoided GHG emissions - electricity n.a. n.a. n.a. n.a. n.a. n.a. 0.84Avoided GHG emissions - gas n.a. n.a. n.a. n.a. n.a. n.a. 0.39Net benefit/cost n.a. n.a. n.a. n.a. n.a. n.a. 8.72
Retail
Bill savings - electricity n.a. n.a. n.a. n.a. n.a. n.a. - 5.32Bill savings - gas n.a. n.a. n.a. n.a. n.a. n.a. 6.35Private costs n.a. n.a. n.a. n.a. n.a. n.a. - 16.62Net private benefit/cost n.a. n.a. n.a. n.a. n.a. n.a. - 15.58Avoided GHG emissions - electricity n.a. n.a. n.a. n.a. n.a. n.a. - 0.58Avoided GHG emissions - gas n.a. n.a. n.a. n.a. n.a. n.a. 1.63Net benefit/cost n.a. n.a. n.a. n.a. n.a. n.a. - 14.53
Healthcare
Bill savings - electricity n.a. n.a. n.a. n.a. n.a. n.a. 17.89Bill savings - gas n.a. n.a. n.a. n.a. n.a. n.a. - 8.13Private costs n.a. n.a. n.a. n.a. n.a. n.a. - 28.34Net private benefit/cost n.a. n.a. n.a. n.a. n.a. n.a. - 18.58Avoided GHG emissions - electricity n.a. n.a. n.a. n.a. n.a. n.a. 1.94Avoided GHG emissions - gas n.a. n.a. n.a. n.a. n.a. n.a. - 2.09Net benefit/cost n.a. n.a. n.a. n.a. n.a. n.a. - 18.72
School
Bill savings - electricity n.a. n.a. n.a. n.a. n.a. n.a. 44.34Bill savings - gas n.a. n.a. n.a. n.a. n.a. n.a. 5.60
www.TheCIE.com.au
Decision Regulation Impact Statement 265

CZ1 CZ2 CZ3 CZ4 CZ5 CZ6 CZ7
$ per m2
$ per m2
$ per m2
$ per m2
$ per m2
$ per m2
$ per m2
Private costs n.a. n.a. n.a. n.a. n.a. n.a. - 8.72Net private benefit/cost n.a. n.a. n.a. n.a. n.a. n.a. 41.22Avoided GHG emissions - electricity n.a. n.a. n.a. n.a. n.a. n.a. 4.82Avoided GHG emissions - gas n.a. n.a. n.a. n.a. n.a. n.a. 1.44Net benefit/cost n.a. n.a. n.a. n.a. n.a. n.a. 47.48
Note: Costs and benefits are estimated over the assumed 40 year life of the building, using a discount rate of 7 per cent.Source: CIE based on EA modelling.
www.TheCIE.com.au
266 Decision Regulation Impact Statement

I11II1112 Net benefits to Tasmania — high realisation scenarioCZ1 CZ2 CZ3 CZ4 CZ5 CZ6 CZ7
$ per m2
$ per m2
$ per m2
$ per m2
$ per m2
$ per m2
$ per m2
Hotels
Bill savings - electricity n.a. n.a. n.a. n.a. n.a. n.a. 45.48Bill savings - gas n.a. n.a. n.a. n.a. n.a. n.a. 2.22Private costs n.a. n.a. n.a. n.a. n.a. n.a. 12.65Net private benefit/cost n.a. n.a. n.a. n.a. n.a. n.a. 60.35Avoided GHG emissions - electricity n.a. n.a. n.a. n.a. n.a. n.a. 4.94Avoided GHG emissions - gas n.a. n.a. n.a. n.a. n.a. n.a. 0.57Net benefit/cost n.a. n.a. n.a. n.a. n.a. n.a. 65.87
Office building
Bill savings - electricity n.a. n.a. n.a. n.a. n.a. n.a. 10.26Bill savings - gas n.a. n.a. n.a. n.a. n.a. n.a. 2.03Private costs n.a. n.a. n.a. n.a. n.a. n.a. - 1.72Net private benefit/cost n.a. n.a. n.a. n.a. n.a. n.a. 10.57Avoided GHG emissions - electricity n.a. n.a. n.a. n.a. n.a. n.a. 1.12Avoided GHG emissions - gas n.a. n.a. n.a. n.a. n.a. n.a. 0.52Net benefit/cost n.a. n.a. n.a. n.a. n.a. n.a. 12.21
Retail
Bill savings - electricity n.a. n.a. n.a. n.a. n.a. n.a. - 7.09Bill savings - gas n.a. n.a. n.a. n.a. n.a. n.a. 8.47Private costs n.a. n.a. n.a. n.a. n.a. n.a. - 16.62Net private benefit/cost n.a. n.a. n.a. n.a. n.a. n.a. - 15.24Avoided GHG emissions - electricity n.a. n.a. n.a. n.a. n.a. n.a. - 0.77Avoided GHG emissions - gas n.a. n.a. n.a. n.a. n.a. n.a. 2.17Net benefit/cost n.a. n.a. n.a. n.a. n.a. n.a. - 13.84
Healthcare
Bill savings - electricity n.a. n.a. n.a. n.a. n.a. n.a. 23.86Bill savings - gas n.a. n.a. n.a. n.a. n.a. n.a. - 10.84Private costs n.a. n.a. n.a. n.a. n.a. n.a. - 28.34Net private benefit/cost n.a. n.a. n.a. n.a. n.a. n.a. - 15.33Avoided GHG emissions - electricity n.a. n.a. n.a. n.a. n.a. n.a. 2.59Avoided GHG emissions - gas n.a. n.a. n.a. n.a. n.a. n.a. - 2.78
www.TheCIE.com.au
Decision Regulation Impact Statement 267

CZ1 CZ2 CZ3 CZ4 CZ5 CZ6 CZ7
$ per m2
$ per m2
$ per m2
$ per m2
$ per m2
$ per m2
$ per m2
Net benefit/cost n.a. n.a. n.a. n.a. n.a. n.a. - 15.51
School
Bill savings - electricity n.a. n.a. n.a. n.a. n.a. n.a. 59.12Bill savings - gas n.a. n.a. n.a. n.a. n.a. n.a. 7.47Private costs n.a. n.a. n.a. n.a. n.a. n.a. - 8.72Net private benefit/cost n.a. n.a. n.a. n.a. n.a. n.a. 57.87Avoided GHG emissions - electricity n.a. n.a. n.a. n.a. n.a. n.a. 6.43Avoided GHG emissions - gas n.a. n.a. n.a. n.a. n.a. n.a. 1.92Net benefit/cost n.a. n.a. n.a. n.a. n.a. n.a. 66.21
Note: Costs and benefits are estimated over the assumed 40 year life of the building, using a discount rate of 7 per cent.Source: CIE based on EA modelling.
Australian Capital Territory
I11II1113 Net benefits to Australian Capital Territory — low realisation scenario
CZ1 CZ2 CZ3 CZ4 CZ5 CZ6 CZ7
$ per m2
$ per m2
$ per m2
$ per m2
$ per m2
$ per m2
$ per m2
Hotels
Bill savings - electricity n.a. n.a. n.a. n.a. n.a. n.a. 20.57Bill savings - gas n.a. n.a. n.a. n.a. n.a. n.a. 1.09Private costs n.a. n.a. n.a. n.a. n.a. n.a. 12.65Net private benefit/cost n.a. n.a. n.a. n.a. n.a. n.a. 34.31Avoided GHG emissions - electricity n.a. n.a. n.a. n.a. n.a. n.a. 7.98Avoided GHG emissions - gas n.a. n.a. n.a. n.a. n.a. n.a. 0.28Net benefit/cost n.a. n.a. n.a. n.a. n.a. n.a. 42.57
Office building
Bill savings - electricity n.a. n.a. n.a. n.a. n.a. n.a. 4.64Bill savings - gas n.a. n.a. n.a. n.a. n.a. n.a. 0.99Private costs n.a. n.a. n.a. n.a. n.a. n.a. - 1.72Net private benefit/cost n.a. n.a. n.a. n.a. n.a. n.a. 3.91Avoided GHG emissions - electricity n.a. n.a. n.a. n.a. n.a. n.a. 1.80
www.TheCIE.com.au
268 Decision Regulation Impact Statement

CZ1 CZ2 CZ3 CZ4 CZ5 CZ6 CZ7
$ per m2
$ per m2
$ per m2
$ per m2
$ per m2
$ per m2
$ per m2
Avoided GHG emissions - gas n.a. n.a. n.a. n.a. n.a. n.a. 0.26Net benefit/cost n.a. n.a. n.a. n.a. n.a. n.a. 5.97
Retail
Bill savings - electricity n.a. n.a. n.a. n.a. n.a. n.a. - 3.21Bill savings - gas n.a. n.a. n.a. n.a. n.a. n.a. 4.14Private costs n.a. n.a. n.a. n.a. n.a. n.a. - 16.62Net private benefit/cost n.a. n.a. n.a. n.a. n.a. n.a. - 15.68Avoided GHG emissions - electricity n.a. n.a. n.a. n.a. n.a. n.a. - 1.24Avoided GHG emissions - gas n.a. n.a. n.a. n.a. n.a. n.a. 1.08Net benefit/cost n.a. n.a. n.a. n.a. n.a. n.a. - 15.84
Healthcare
Bill savings - electricity n.a. n.a. n.a. n.a. n.a. n.a. 10.79Bill savings - gas n.a. n.a. n.a. n.a. n.a. n.a. - 5.30Private costs n.a. n.a. n.a. n.a. n.a. n.a. - 28.34Net private benefit/cost n.a. n.a. n.a. n.a. n.a. n.a. - 22.85Avoided GHG emissions - electricity n.a. n.a. n.a. n.a. n.a. n.a. 4.18Avoided GHG emissions - gas n.a. n.a. n.a. n.a. n.a. n.a. - 1.39Net benefit/cost n.a. n.a. n.a. n.a. n.a. n.a. - 20.05
School
Bill savings - electricity n.a. n.a. n.a. n.a. n.a. n.a. 26.74Bill savings - gas n.a. n.a. n.a. n.a. n.a. n.a. 3.65Private costs n.a. n.a. n.a. n.a. n.a. n.a. - 8.72Net private benefit/cost n.a. n.a. n.a. n.a. n.a. n.a. 21.68Avoided GHG emissions - electricity n.a. n.a. n.a. n.a. n.a. n.a. 10.37Avoided GHG emissions - gas n.a. n.a. n.a. n.a. n.a. n.a. 0.96Net benefit/cost n.a. n.a. n.a. n.a. n.a. n.a. 33.00
Note: Costs and benefits are estimated over the assumed 40 year life of the building, using a discount rate of 7 per cent.Source: CIE based on EA modelling.
www.TheCIE.com.au
Decision Regulation Impact Statement 269

I11II1114 Net benefits to Australian Capital Territory — medium realisation scenario
CZ1 CZ2 CZ3 CZ4 CZ5 CZ6 CZ7
$ per m2
$ per m2
$ per m2
$ per m2
$ per m2
$ per m2
$ per m2
Hotels
Bill savings - electricity n.a. n.a. n.a. n.a. n.a. n.a. 30.86Bill savings - gas n.a. n.a. n.a. n.a. n.a. n.a. 1.63Private costs n.a. n.a. n.a. n.a. n.a. n.a. 12.65Net private benefit/cost n.a. n.a. n.a. n.a. n.a. n.a. 45.14Avoided GHG emissions - electricity n.a. n.a. n.a. n.a. n.a. n.a. 11.96Avoided GHG emissions - gas n.a. n.a. n.a. n.a. n.a. n.a. 0.43Net benefit/cost n.a. n.a. n.a. n.a. n.a. n.a. 57.53
Office building
Bill savings - electricity n.a. n.a. n.a. n.a. n.a. n.a. 6.96Bill savings - gas n.a. n.a. n.a. n.a. n.a. n.a. 1.49Private costs n.a. n.a. n.a. n.a. n.a. n.a. - 1.72Net private benefit/cost n.a. n.a. n.a. n.a. n.a. n.a. 6.73Avoided GHG emissions - electricity n.a. n.a. n.a. n.a. n.a. n.a. 2.70Avoided GHG emissions - gas n.a. n.a. n.a. n.a. n.a. n.a. 0.39Net benefit/cost n.a. n.a. n.a. n.a. n.a. n.a. 9.82
Retail
Bill savings - electricity n.a. n.a. n.a. n.a. n.a. n.a. - 4.81Bill savings - gas n.a. n.a. n.a. n.a. n.a. n.a. 6.21Private costs n.a. n.a. n.a. n.a. n.a. n.a. - 16.62Net private benefit/cost n.a. n.a. n.a. n.a. n.a. n.a. - 15.21Avoided GHG emissions - electricity n.a. n.a. n.a. n.a. n.a. n.a. - 1.86Avoided GHG emissions - gas n.a. n.a. n.a. n.a. n.a. n.a. 1.63Net benefit/cost n.a. n.a. n.a. n.a. n.a. n.a. - 15.45
Healthcare
Bill savings - electricity n.a. n.a. n.a. n.a. n.a. n.a. 16.19Bill savings - gas n.a. n.a. n.a. n.a. n.a. n.a. - 7.95Private costs n.a. n.a. n.a. n.a. n.a. n.a. - 28.34Net private benefit/cost n.a. n.a. n.a. n.a. n.a. n.a. - 20.11Avoided GHG emissions - electricity n.a. n.a. n.a. n.a. n.a. n.a. 6.28Avoided GHG emissions - gas n.a. n.a. n.a. n.a. n.a. n.a. - 2.08
www.TheCIE.com.au
270 Decision Regulation Impact Statement

CZ1 CZ2 CZ3 CZ4 CZ5 CZ6 CZ7
$ per m2
$ per m2
$ per m2
$ per m2
$ per m2
$ per m2
$ per m2
Net benefit/cost n.a. n.a. n.a. n.a. n.a. n.a. - 15.91
School
Bill savings - electricity n.a. n.a. n.a. n.a. n.a. n.a. 40.11Bill savings - gas n.a. n.a. n.a. n.a. n.a. n.a. 5.48Private costs n.a. n.a. n.a. n.a. n.a. n.a. - 8.72Net private benefit/cost n.a. n.a. n.a. n.a. n.a. n.a. 36.87Avoided GHG emissions - electricity n.a. n.a. n.a. n.a. n.a. n.a. 15.55Avoided GHG emissions - gas n.a. n.a. n.a. n.a. n.a. n.a. 1.43Net benefit/cost n.a. n.a. n.a. n.a. n.a. n.a. 53.86
Note: Costs and benefits are estimated over the assumed 40 year life of the building, using a discount rate of 7 per cent.Source: CIE based on EA modelling.
www.TheCIE.com.au
Decision Regulation Impact Statement 271

I11II1115 Net benefits to Australian Capital Territory — high realisation scenario
CZ1 CZ2 CZ3 CZ4 CZ5 CZ6 CZ7
$ per m2
$ per m2
$ per m2
$ per m2
$ per m2
$ per m2
$ per m2
Hotels
Bill savings - electricity n.a. n.a. n.a. n.a. n.a. n.a. 41.14Bill savings - gas n.a. n.a. n.a. n.a. n.a. n.a. 2.17Private costs n.a. n.a. n.a. n.a. n.a. n.a. 12.65Net private benefit/cost n.a. n.a. n.a. n.a. n.a. n.a. 55.97Avoided GHG emissions - electricity n.a. n.a. n.a. n.a. n.a. n.a. 15.95Avoided GHG emissions - gas n.a. n.a. n.a. n.a. n.a. n.a. 0.57Net benefit/cost n.a. n.a. n.a. n.a. n.a. n.a. 72.49
Office building
Bill savings - electricity n.a. n.a. n.a. n.a. n.a. n.a. 9.28Bill savings - gas n.a. n.a. n.a. n.a. n.a. n.a. 1.99Private costs n.a. n.a. n.a. n.a. n.a. n.a. - 1.72Net private benefit/cost n.a. n.a. n.a. n.a. n.a. n.a. 9.55Avoided GHG emissions - electricity n.a. n.a. n.a. n.a. n.a. n.a. 3.60Avoided GHG emissions - gas n.a. n.a. n.a. n.a. n.a. n.a. 0.52Net benefit/cost n.a. n.a. n.a. n.a. n.a. n.a. 13.67
Retail
Bill savings - electricity n.a. n.a. n.a. n.a. n.a. n.a. - 6.41Bill savings - gas n.a. n.a. n.a. n.a. n.a. n.a. 8.28Private costs n.a. n.a. n.a. n.a. n.a. n.a. - 16.62Net private benefit/cost n.a. n.a. n.a. n.a. n.a. n.a. - 14.75Avoided GHG emissions - electricity n.a. n.a. n.a. n.a. n.a. n.a. - 2.49Avoided GHG emissions - gas n.a. n.a. n.a. n.a. n.a. n.a. 2.17Net benefit/cost n.a. n.a. n.a. n.a. n.a. n.a. - 15.07
Healthcare
Bill savings - electricity n.a. n.a. n.a. n.a. n.a. n.a. 21.58Bill savings - gas n.a. n.a. n.a. n.a. n.a. n.a. - 10.61Private costs n.a. n.a. n.a. n.a. n.a. n.a. - 28.34Net private benefit/cost n.a. n.a. n.a. n.a. n.a. n.a. - 17.36Avoided GHG emissions - electricity n.a. n.a. n.a. n.a. n.a. n.a. 8.37Avoided GHG emissions - n.a. n.a. n.a. n.a. n.a. n.a. - 2.78
www.TheCIE.com.au
272 Decision Regulation Impact Statement

CZ1 CZ2 CZ3 CZ4 CZ5 CZ6 CZ7
$ per m2
$ per m2
$ per m2
$ per m2
$ per m2
$ per m2
$ per m2
gasNet benefit/cost n.a. n.a. n.a. n.a. n.a. n.a. - 11.77
School
Bill savings - electricity n.a. n.a. n.a. n.a. n.a. n.a. 53.49Bill savings - gas n.a. n.a. n.a. n.a. n.a. n.a. 7.31Private costs n.a. n.a. n.a. n.a. n.a. n.a. - 8.72Net private benefit/cost n.a. n.a. n.a. n.a. n.a. n.a. 52.07Avoided GHG emissions - electricity n.a. n.a. n.a. n.a. n.a. n.a. 20.74Avoided GHG emissions - gas n.a. n.a. n.a. n.a. n.a. n.a. 1.91Net benefit/cost n.a. n.a. n.a. n.a. n.a. n.a. 74.72
Note: Costs and benefits are estimated over the assumed 40 year life of the building, using a discount rate of 7 per cent.Source: CIE based on EA modelling.
Northern Territory
I11II1116 Net benefits to Northern Territory — low realisation scenarioCZ1 CZ2 CZ3 CZ4 CZ5 CZ6 CZ7
$ per m2
$ per m2
$ per m2
$ per m2
$ per m2
$ per m2
$ per m2
Hotels
Bill savings - electricity 14.82 n.a. 24.11 n.a. n.a. n.a. n.a.Bill savings - gas 0.00 n.a. 0.06 n.a. n.a. n.a. n.a.Private costs 10.26 n.a. 0.97 n.a. n.a. n.a. n.a.Net private benefit/cost 25.07 n.a. 25.14 n.a. n.a. n.a. n.a.Avoided GHG emissions - electricity 3.82 n.a. 6.22 n.a. n.a. n.a. n.a.Avoided GHG emissions - gas 0.00 n.a. 0.01 n.a. n.a. n.a. n.a.Net benefit/cost 28.90 n.a. 31.37 n.a. n.a. n.a. n.a.
Office building
Bill savings - electricity 9.71 n.a. n.a. n.a. n.a. n.a. n.a.Bill savings - gas 0.00 n.a. n.a. n.a. n.a. n.a. n.a.Private costs - 9.71 n.a. n.a. n.a. n.a. n.a. n.a.Net private benefit/cost 0.00 n.a. n.a. n.a. n.a. n.a. n.a.Avoided GHG emissions - electricity 2.51 n.a. n.a. n.a. n.a. n.a. n.a.Avoided GHG emissions - 0.00 n.a. n.a. n.a. n.a. n.a. n.a.
www.TheCIE.com.au
Decision Regulation Impact Statement 273

CZ1 CZ2 CZ3 CZ4 CZ5 CZ6 CZ7
$ per m2
$ per m2
$ per m2
$ per m2
$ per m2
$ per m2
$ per m2
gasNet benefit/cost 2.51 n.a. n.a. n.a. n.a. n.a. n.a.
Retail
Bill savings - electricity 35.40 n.a. 37.01 n.a. n.a. n.a. n.a.Bill savings - gas - 0.01 n.a. - 1.31 n.a. n.a. n.a. n.a.Private costs - 0.45 n.a. - 14.17 n.a. n.a. n.a. n.a.Net private benefit/cost 34.94 n.a. 21.53 n.a. n.a. n.a. n.a.Avoided GHG emissions - electricity 9.14 n.a. 9.55 n.a. n.a. n.a. n.a.Avoided GHG emissions - gas 0.00 n.a. - 0.30 n.a. n.a. n.a. n.a.Net benefit/cost 44.07 n.a. 30.78 n.a. n.a. n.a. n.a.
Healthcare
Bill savings - electricity 28.59 n.a. 21.14 n.a. n.a. n.a. n.a.Bill savings - gas 0.00 n.a. 0.46 n.a. n.a. n.a. n.a.Private costs - 14.62 n.a. - 15.98 n.a. n.a. n.a. n.a.Net private benefit/cost 13.97 n.a. 5.63 n.a. n.a. n.a. n.a.Avoided GHG emissions - electricity 7.38 n.a. 5.46 n.a. n.a. n.a. n.a.Avoided GHG emissions - gas 0.00 n.a. 0.11 n.a. n.a. n.a. n.a.Net benefit/cost 21.35 n.a. 11.19 n.a. n.a. n.a. n.a.
School
Bill savings - electricity 64.35 n.a. 40.51 n.a. n.a. n.a. n.a.Bill savings - gas 0.04 n.a. 2.04 n.a. n.a. n.a. n.a.Private costs - 5.61 n.a. - 12.16 n.a. n.a. n.a. n.a.Net private benefit/cost 58.78 n.a. 30.39 n.a. n.a. n.a. n.a.Avoided GHG emissions - electricity 16.61 n.a. 10.46 n.a. n.a. n.a. n.a.Avoided GHG emissions - gas 0.01 n.a. 0.47 n.a. n.a. n.a. n.a.Net benefit/cost 75.40 n.a. 41.31 n.a. n.a. n.a. n.a.
Note: Costs and benefits are estimated over the assumed 40 year life of the building, using a discount rate of 7 per cent.Source: CIE based on EA modelling.
www.TheCIE.com.au
274 Decision Regulation Impact Statement

I11II1117 Net benefits to Northern Territory — medium realisation scenario
CZ1 CZ2 CZ3 CZ4 CZ5 CZ6 CZ7
$ per m2
$ per m2
$ per m2
$ per m2
$ per m2
$ per m2
$ per m2
Hotels
Bill savings - electricity 22.23 n.a. 36.17 n.a. n.a. n.a. n.a.Bill savings - gas 0.00 n.a. 0.09 n.a. n.a. n.a. n.a.Private costs 10.26 n.a. 0.97 n.a. n.a. n.a. n.a.Net private benefit/cost 32.48 n.a. 37.22 n.a. n.a. n.a. n.a.Avoided GHG emissions - electricity 5.74 n.a. 9.33 n.a. n.a. n.a. n.a.Avoided GHG emissions - gas 0.00 n.a. 0.02 n.a. n.a. n.a. n.a.Net benefit/cost 38.22 n.a. 46.58 n.a. n.a. n.a. n.a.
Office building
Bill savings - electricity 14.57 n.a. n.a. n.a. n.a. n.a. n.a.Bill savings - gas 0.00 n.a. n.a. n.a. n.a. n.a. n.a.Private costs - 9.71 n.a. n.a. n.a. n.a. n.a. n.a.Net private benefit/cost 4.86 n.a. n.a. n.a. n.a. n.a. n.a.Avoided GHG emissions - electricity 3.76 n.a. n.a. n.a. n.a. n.a. n.a.Avoided GHG emissions - gas 0.00 n.a. n.a. n.a. n.a. n.a. n.a.Net benefit/cost 8.62 n.a. n.a. n.a. n.a. n.a. n.a.
Retail
Bill savings - electricity 53.09 n.a. 55.51 n.a. n.a. n.a. n.a.Bill savings - gas - 0.02 n.a. - 1.96 n.a. n.a. n.a. n.a.Private costs - 0.45 n.a. - 14.17 n.a. n.a. n.a. n.a.Net private benefit/cost 52.63 n.a. 39.38 n.a. n.a. n.a. n.a.Avoided GHG emissions - electricity 13.70 n.a. 14.33 n.a. n.a. n.a. n.a.Avoided GHG emissions - gas 0.00 n.a. - 0.46 n.a. n.a. n.a. n.a.Net benefit/cost 66.33 n.a. 53.25 n.a. n.a. n.a. n.a.
Healthcare
Bill savings - electricity 42.89 n.a. 31.71 n.a. n.a. n.a. n.a.Bill savings - gas - 0.01 n.a. 0.70 n.a. n.a. n.a. n.a.Private costs - 14.62 n.a. - 15.98 n.a. n.a. n.a. n.a.Net private benefit/cost 28.26 n.a. 16.43 n.a. n.a. n.a. n.a.Avoided GHG emissions - electricity 11.07 n.a. 8.19 n.a. n.a. n.a. n.a.Avoided GHG emissions - gas 0.00 n.a. 0.16 n.a. n.a. n.a. n.a.
www.TheCIE.com.au
Decision Regulation Impact Statement 275

CZ1 CZ2 CZ3 CZ4 CZ5 CZ6 CZ7
$ per m2
$ per m2
$ per m2
$ per m2
$ per m2
$ per m2
$ per m2
Net benefit/cost 39.33 n.a. 24.78 n.a. n.a. n.a. n.a.
School
Bill savings - electricity 96.52 n.a. 60.77 n.a. n.a. n.a. n.a.Bill savings - gas 0.07 n.a. 3.05 n.a. n.a. n.a. n.a.Private costs - 5.61 n.a. - 12.16 n.a. n.a. n.a. n.a.Net private benefit/cost 90.97 n.a. 51.66 n.a. n.a. n.a. n.a.Avoided GHG emissions - electricity 24.91 n.a. 15.68 n.a. n.a. n.a. n.a.Avoided GHG emissions - gas 0.02 n.a. 0.71 n.a. n.a. n.a. n.a.Net benefit/cost 115.90 n.a. 68.05 n.a. n.a. n.a. n.a.
Note: Costs and benefits are estimated over the assumed 40 year life of the building, using a discount rate of 7 per cent.Source: CIE based on EA modelling.
www.TheCIE.com.au
276 Decision Regulation Impact Statement

I11II1118 Net benefits to Northern Territory — high realisation scenarioCZ1 CZ2 CZ3 CZ4 CZ5 CZ6 CZ7
$ per m2
$ per m2
$ per m2
$ per m2
$ per m2
$ per m2
$ per m2
Hotels
Bill savings - electricity 29.63 n.a. 48.22 n.a. n.a. n.a. n.a.Bill savings - gas 0.00 n.a. 0.12 n.a. n.a. n.a. n.a.Private costs 10.26 n.a. 0.97 n.a. n.a. n.a. n.a.Net private benefit/cost 39.89 n.a. 49.31 n.a. n.a. n.a. n.a.Avoided GHG emissions - electricity 7.65 n.a. 12.45 n.a. n.a. n.a. n.a.Avoided GHG emissions - gas 0.00 n.a. 0.03 n.a. n.a. n.a. n.a.Net benefit/cost 47.54 n.a. 61.78 n.a. n.a. n.a. n.a.
Office building
Bill savings - electricity 19.42 n.a. n.a. n.a. n.a. n.a. n.a.Bill savings - gas 0.00 n.a. n.a. n.a. n.a. n.a. n.a.Private costs - 9.71 n.a. n.a. n.a. n.a. n.a. n.a.Net private benefit/cost 9.71 n.a. n.a. n.a. n.a. n.a. n.a.Avoided GHG emissions - electricity 5.01 n.a. n.a. n.a. n.a. n.a. n.a.Avoided GHG emissions - gas 0.00 n.a. n.a. n.a. n.a. n.a. n.a.Net benefit/cost 14.73 n.a. n.a. n.a. n.a. n.a. n.a.
Retail
Bill savings - electricity 70.79 n.a. 74.01 n.a. n.a. n.a. n.a.Bill savings - gas - 0.02 n.a. - 2.61 n.a. n.a. n.a. n.a.Private costs - 0.45 n.a. - 14.17 n.a. n.a. n.a. n.a.Net private benefit/cost 70.32 n.a. 57.23 n.a. n.a. n.a. n.a.Avoided GHG emissions - electricity 18.27 n.a. 19.10 n.a. n.a. n.a. n.a.Avoided GHG emissions - gas - 0.01 n.a. - 0.61 n.a. n.a. n.a. n.a.Net benefit/cost 88.59 n.a. 75.72 n.a. n.a. n.a. n.a.
Healthcare
Bill savings - electricity 57.19 n.a. 42.28 n.a. n.a. n.a. n.a.Bill savings - gas - 0.01 n.a. 0.93 n.a. n.a. n.a. n.a.Private costs - 14.62 n.a. - 15.98 n.a. n.a. n.a. n.a.Net private benefit/cost 42.56 n.a. 27.24 n.a. n.a. n.a. n.a.Avoided GHG emissions - electricity 14.76 n.a. 10.91 n.a. n.a. n.a. n.a.Avoided GHG emissions - gas 0.00 n.a. 0.22 n.a. n.a. n.a. n.a.
www.TheCIE.com.au
Decision Regulation Impact Statement 277

CZ1 CZ2 CZ3 CZ4 CZ5 CZ6 CZ7
$ per m2
$ per m2
$ per m2
$ per m2
$ per m2
$ per m2
$ per m2
Net benefit/cost 57.32 n.a. 38.37 n.a. n.a. n.a. n.a.
School
Bill savings - electricity 128.69 n.a. 81.02 n.a. n.a. n.a. n.a.Bill savings - gas 0.09 n.a. 4.07 n.a. n.a. n.a. n.a.Private costs - 5.61 n.a. - 12.16 n.a. n.a. n.a. n.a.Net private benefit/cost 123.17 n.a. 72.93 n.a. n.a. n.a. n.a.Avoided GHG emissions - electricity 33.22 n.a. 20.91 n.a. n.a. n.a. n.a.Avoided GHG emissions - gas 0.02 n.a. 0.95 n.a. n.a. n.a. n.a.Net benefit/cost 156.40 n.a. 94.79 n.a. n.a. n.a. n.a.
Note: Costs and benefits are estimated over the assumed 40 year life of the building, using a discount rate of 7 per cent.Source: CIE based on EA modelling.
www.TheCIE.com.au
278 Decision Regulation Impact Statement

THE CENTRE FOR INTERNATIONAL ECONOMICSwww.TheCIE.com.au
www.TheCIE.com.au
1 Decision Regulation Impact Statement


