28
ABC 2017 SAFETY PERFORMANCE REPORT UNDERSTANDING THE IMPACT OF STEP PARTICIPATION ON OVERALL SAFETY PERFORMANCE
| Date post: | 18-Aug-2018 |
| Category: |
Documents |
| Upload: | phungduong |
| View: | 214 times |
| Download: | 0 times |
IABC 2017 Safety Performance Report
ABC
2017SAFETYPERFORMANCEREPORT
UNDERSTANDING THE IMPACT OF STEP PARTICIPATION ON OVERALL SAFETY PERFORMANCE
II ABC 2017 Safety Performance Report
©2017 Associated Builders and Contractors, Inc. All Rights Reserved
Disclaimer:
The information contained within this report is for reference purposes only and reflects data submitted by ABC member companies during the 2016 Safety Training Evaluation Process (STEP) term. Any unauthorized use or distribution of this information without the express written consent of Associated Builders and Contractors, Inc.; 440 First St. NW, Suite 200, Washington, DC 20001, is strictly prohibited.
ABC 2017 SAFETY PERFORMANCE REPORT
UNDERSTANDING THE IMPACT OF STEP PARTICIPATION ON OVERALL SAFETY PERFORMANCE
1ABC 2017 Safety Performance Report
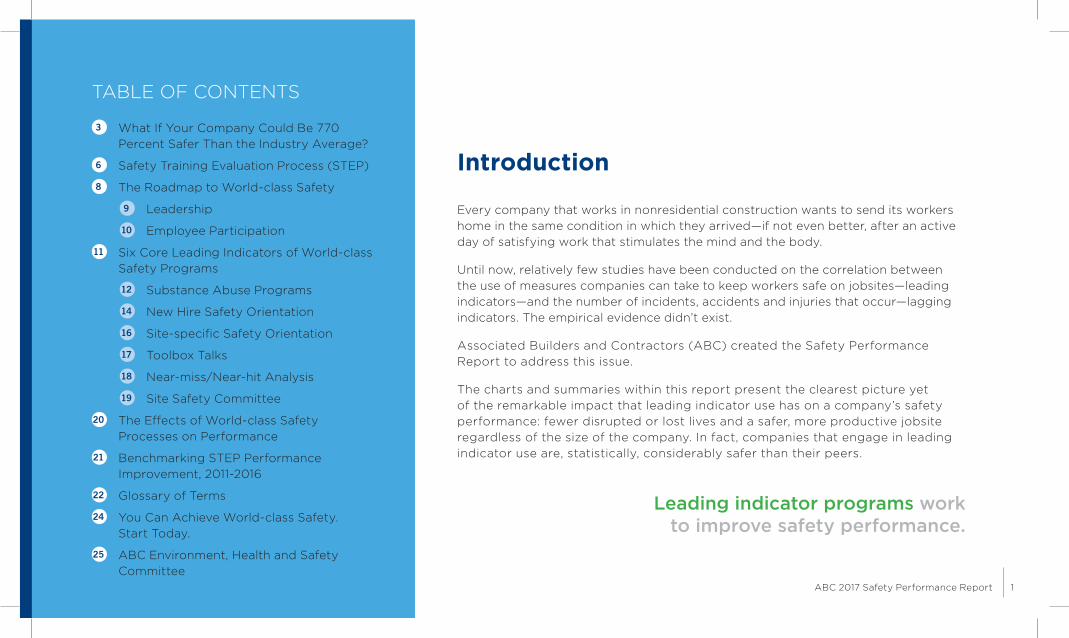
Introduction
Every company that works in nonresidential construction wants to send its workers home in the same condition in which they arrived—if not even better, after an active day of satisfying work that stimulates the mind and the body.
Until now, relatively few studies have been conducted on the correlation between the use of measures companies can take to keep workers safe on jobsites—leading indicators—and the number of incidents, accidents and injuries that occur—lagging indicators. The empirical evidence didn’t exist.
Associated Builders and Contractors (ABC) created the Safety Performance Report to address this issue.
The charts and summaries within this report present the clearest picture yet of the remarkable impact that leading indicator use has on a company’s safety performance: fewer disrupted or lost lives and a safer, more productive jobsite regardless of the size of the company. In fact, companies that engage in leading indicator use are, statistically, considerably safer than their peers.
Leading indicator programs work to improve safety performance.
TABLE OF CONTENTS
3 What If Your Company Could Be 770 Percent Safer Than the Industry Average?
6 Safety Training Evaluation Process (STEP)
8 The Roadmap to World-class Safety
9 Leadership
10 Employee Participation
11 Six Core Leading Indicators of World-class Safety Programs
12 Substance Abuse Programs
14 New Hire Safety Orientation
16 Site-specific Safety Orientation
17 Toolbox Talks
18 Near-miss/Near-hit Analysis
19 Site Safety Committee
20 The Effects of World-class Safety Processes on Performance
21 Benchmarking STEP Performance Improvement, 2011-2016
22 Glossary of Terms
24 You Can Achieve World-class Safety. Start Today.
25 ABC Environment, Health and Safety Committee

2 ABC 2017 Safety Performance Report
STEP PARTICIPANTS BY LEVEL
Methodology
The 2017 ABC Safety Performance Report is based on submissions of unique company data gathered from participants in the 2016 Safety Training Evaluation Process (STEP). ABC collects each company’s lagging indicator data as reported on its annual Occupational Safety & Health Administration (OSHA) Form 300A (“Summary of Work-Related Injuries and Illnesses”) and its self-assessment of leading indicator practices from its STEP application. Each of the 35 data points collected is sorted using statistically valid methodology developed by the U.S. Bureau of Labor Statistics (BLS) for its annual Occupational Injuries and Illnesses Survey, and combined to produce analyses of STEP participant performance against BLS industry average incident rates.
STEP PARTICIPANTS BY INDUSTRY
(NAICS) CODE
238 Specialty Trade Contractors
32%
10%
58%
236 Construction of Buildings
237 Heavy & Civil Engineering Construction
1%Participant
2%Bronze
33%Silver
29%Gold
20% Platinum
15%Diamond
NAICS
NAICS
NAICS

3ABC 2017 Safety Performance Report
What If Your Company Could Be 770 Percent Safer than the Industry Average?
And you could reduce your Total Recordable Incident Rate (TRIR) by 87 percent?
It’s more than possible. It’s doable.
The 2017 ABC Safety Performance Report is not a research project or academic study. It captures the results of ABC STEP member companies performing real work on real projects. ABC is building on analysis presented in the 2016 report to identify what comprises a world-class safety program.
STEP Ave
rage
STEP Plat
inum
Mem
ber
ABC STEP PARTICIPANTS ARE SAFER THAN THE INDUSTRY AVERAGE
Total Recordable Incident Rate (TRIR): STEP vs. the U.S. Bureau of Labor Statistics Industry Average
770%SAFER
87%REDUCTION IN
TRIR RATES
BLS In
dustry
Avera
ge
STEP Diam
ond
Mem
ber
0
1
2
3
4
INJURIES/FATALITIESPER 100
FULL-TIME EMPLOYEES

4 ABC 2017 Safety Performance Report
Measuring Safety Performance
LAGGING INDICATORS: OUTPUTS AND RESULTS
The fact is that safety performance isn’t reflected in what you did. It’s
reflected in what you’re doing.
The construction industry has long evaluated safety performance based on lagging indicators—statistics that measure performance based on past incidents or conditions. These statistics judge companies not on the steps taken to prevent jobsite injuries and fatalities, but rather on the number of past safety failures. Lagging indicators tell only part of the story.
Every work day in the construction industry, an average of three people are fatally injured.
TRIR DART EMR
Total Recordable Incident Rate
Days Away, Restricted or
Transferred Rate
Experience Modification
Rate
3FATAL
INJURIES PER DAY

5ABC 2017 Safety Performance Report
What’s Behind World-class Safety Performance
Innovative thinking from contractors, the owner/user community and insurers puts leading indicators under the microscope.
ABC has been studying how to improve safety through STEP since 1989.
STEP is comprised of 20 “Key Components,” leading indicators that are proven to improve safety performance and the criteria that indicate best practices. Participating companies score their level of achievement for each component on a weighted scale of 0 points (low score) up to 12 points (high score). Companies receive a recognition level of Diamond, Platinum, Gold, Silver, Bronze or Participant based on their score.
ABC quantified the positive impact of proactive injury and hazard elimination tools on the jobsite using data gathered from STEP participants in construction, heavy construction, civil engineering and specialty trades. Analyzing aggregated data allows ABC to determine how measures taken to prevent incidents actually improve lagging indicator performance.
20 Key Components of a world-class safety program.
GOAL
GOAL: determine the correlation between leading indicator implementation and lagging indicator performance
LEADING INDICATOR IMPLEMENTATION
LAGGING INDICATOR PERFORMANCE

ABC 2017 Safety Performance Report
EMPLOYEE PAPAP RTICIPAPAP TATA ION
EMPLOYERINVOLVEMENT
NEAR-HIT/NEAR CNEAR-HIT/NEAR C ONEAR-HIT/NEAR
OMISS ANALYSIS
NEW EMPLOYEE ORIENTATION
SITE SAFETY COMMITTEE
SITE-SPECIFIC SAFETY ORIENTATION
SUBSTANCE ABUSEPROGRAM
TOOLBOX TALKS
EMPLOYEE SAFETY TRAININGEMPLOYER POLICY STATEMENT ON SAFETY
EMPLOYER SUPERVISORY MEETINGS
EMPLOYER SUPERVISORY MEETINGS
INCIDENT INVESTIGATION
INSPECTIONS
PRE-PLANNING FOR JOBSITE SAFETY
PRE-PLANNINGFOR JOBSITE SAFETY
RECORDKEEPING AND DOCUMENTS
RESOURCES FOR SAFETY
RESPONSIBILITY FOR SAFETY
SAFETY PROGRAM GOAL SETTING
SAFETY PROGRAMPERFORMANCE REVIEW
SAFETY RULES
SUPERVISORY TRAINING TOPICS
TRAILING INDICATORS
USE OF PERSONAL PROTECTIVE EQUIPMENT
STEP is a safety benchmarking and improvement tool. Participating ABC member fi rms measure their safety processes and policies on the 20 Key Components through a detailed questionnaire with the goal of implementing or enhancing safety programs that reduce jobsite incident rates. Applying world-class processes dramatically improves safety performance among participants regardless of company size or type of work.
STEP Improves Safety
Safety TrainingEvaluation Process
6

7ABC 2017 Safety Performance Report
EMPLOYEE PARTICIPATION
EMPLOYERINVOLVEMENT
NEAR-HIT/NEAR MISS ANALYSIS
NEW EMPLOYEE ORIENTATION
SITE SAFETY COMMITTEE
SITE-SPECIFIC SAFETY ORIENTATION
SUBSTANCE ABUSEPROGRAM
TOOLBOX TALKS
EMPLOYEE SAFETY TRAININGEMPLOYER POLICY STATEMENT ON SAFETY
EMPLOYER SUPERVISORY MEETINGS
EMPLOYER SUPERVISORY MEETINGS
INCIDENT INVESTIGATION
INSPECTIONS
PRE-PLANNING FOR JOBSITE SAFETY
PRE-PLANNINGFOR JOBSITE SAFETY
RECORDKEEPING AND DOCUMENTS
RESOURCES FOR SAFETY
RESPONSIBILITY FOR SAFETY
SAFETY PROGRAM GOAL SETTING
SAFETY PROGRAMPERFORMANCE REVIEW
SAFETY RULES
SUPERVISORY TRAINING TOPICS
TRAILING INDICATORS
USE OF PERSONAL PROTECTIVE EQUIPMENT
Getting started is free up to the platinum level. Visit abc.org/step.
% Safer than BLS averageReduce BLS average TRIR by
150%
54%
330%
73%
770%
87%
STEP Participant
STEP Platinum
STEP Diamond
STEP ACHIEVEMENT LEVELS
TRIR at or below 50 percent of the BLS NAICS code average in each of the previous three data years
TRIR at or below 25 percent of the BLS NAICS code average for the data year
TRIR at or below BLS NAICS code average for the data year
EMR at or below 0.7 beginning Jan. 1 of the application year
EMR at or below 0.8 beginning Jan. 1 of the application year
No lives lost or catastrophic incidents, company-wide, during the application year
No lives lost or catastrophic incidents, company-wide, during the previous three years resulting in an OSHA citation
Minimum 20 Key Components score
STEP
Dia
mon
d
STEP
Pla
tinum
STEP
Gol
dST
EP S
ilver
/Bro
nze
Get into STEP
Analyze your safety and loss
program
Learn the best practices that reduce TRIR and DART
rates and mod factor (EMR)
Benchmark your safety record
against similar companies
and industry averages
Measure improvement
from year to year
Show your safety
commitment to potential clients and
insurers

8 ABC 2017 Safety Performance Report
LEADERSHIPis the courage to be out front and take a stand to challenge and transform the status quo to create a
CULTURE that is passionate in its belief that all incidents are preventable—a culture where safety is considered a moral obligation not just for leadership, but for all employees. A culture of safety cannot exist without leadership taking a stand that includes an unwillingness to compromise safety and modeling this belief in their every action.
Current SafetyPerformance
Leadership Commitment to World-class Safety
Cultural Transformation and Commitment to World-class Safety
World-class Safety System Process
Introduced and Deployed
WORLD-CLASSSAFETY
Safety TrainingEvaluation Process
Construction Coalition for a Drug- and Alcohol-Free Workplace
The Roadmap to World-class Safety

ABC 2017 Safety Performance Report
EMPLOYER INVOLVEMENT AT THE HIGHEST LEVELS (C-SUITE): LOW SCORE VS. HIGH SCORE
C-Suite Engagement and Commitment Matters
Employer involvement at the highest level of company management produces a more than 50 percent reduction in TRIR rates. In high-scoring ABC STEP member fi rms, the owner/CEO:
Is a direct and active participant in the safety program
Instills personal accountability for safety throughout
the company
Tracks and annually reviews safety goals
and objectives
Solicits feedback on the safety
program and seeks ways to improve it
Commits resources—money,
time, personnel, equipment,
supplies, etc.
Integrates safety into performance
appraisals and other company
operations
TRIR DART
2.56
1.31
Low Score
1.19
TRIR DART
0.65
High Score
54%Reduction
50%Reduction
9
10 ABC 2017 Safety Performance Report
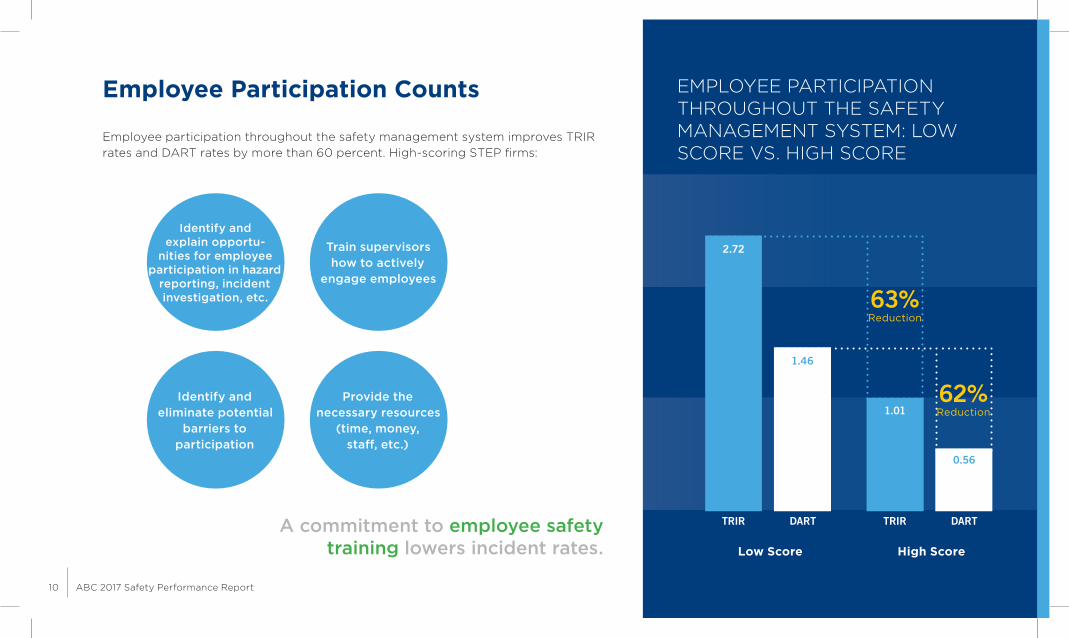
A commitment to employee safety training lowers incident rates.
Identify and explain opportu-
nities for employee participation in hazard
reporting, incident investigation, etc.
Train supervisors how to actively
engage employees
Identify and eliminate potential
barriers to participation
Provide the necessary resources
(time, money, staff , etc.)
EMPLOYEE PARTICIPATION THROUGHOUT THE SAFETY MANAGEMENT SYSTEM: LOW SCORE VS. HIGH SCORE
TRIR DART
Low Score
TRIR DART
High Score
62%Reduction
Employee Participation Counts
Employee participation throughout the safety management system improves TRIR rates and DART rates by more than 60 percent. High-scoring STEP fi rms:
63%Reduction
2.72
1.01
0.56
1.46

11ABC 2017 Safety Performance Report
Six Core Leading Indicators
A leading indicator is a system or process used to identify hazards and eliminate or minimize the condition to prevent injury.
This report focuses on six core leading indicators that have the most dramatic impact on safety performance.
1SUBSTANCE
ABUSE PROGRAM
4TOOLBOX
TALKS
2NEW HIRE SAFETY
ORIENTATION
5NEAR-MISS/
NEAR-HIT ANALYSIS
3SITE-SPECIFIC
SAFETY ORIENTATION
6SITE SAFETY COMMITTEE

12 ABC 2017 Safety Performance Report
Substance Abuse Program
A written substance abuse program/policy with provisions for drug and alcohol testing where permitted.
One-third of all incidents on construction jobsites are drug- or alcohol-related. Companies with substance abuse programs in place dramatically outperform those without an implemented program in terms of safety. Plus, substance abuse testing can be an eff ective method of incident prevention if used properly.
1CORE LEADING INDICATORS
SUBSTANCE ABUSE PROGRAMS: LOW SCORE VS. HIGH SCORE
TRIR DART
Low Score
TRIR DART
High Score
36%Reduction
36%Reduction
Construction Coalition for a Drug- and Alcohol-Free Workplace
ABC is an active member of the Construction Coalition
for a Drug- and Alcohol-Free Workplace. Take the pledge at
drugfreeconstruction.org.
1.94
1.06
1.24
0.68

13ABC 2017 Safety Performance Report
“As a safety professional, I have personally seen the value of substance abuse testing prior to allowing new employees to work on a jobsite. In the world we live in today there is no way for us to determine who may enter our site under the infl uence of drugs. These preventive and proactive programs give us an opportunity to determine who can and cannot work on site.”
—Joel Pickering, senior vice president/director of fi re prevention, Lend Lease (US) Construction
Inc., Rockville, Md., STEP Gold member
SUBSTANCE ABUSE PROGRAMS REDUCE INCIDENTS
Key components include:
Drug and alcohol testing pre-hire,
post-accident and with reasonable
suspicion
A safety policy with strict rules regarding drug and alcohol use, supervisor
training, record keeping and active enforcement
An employee assistance program and available
education on substance abuse prevention

14 ABC 2017 Safety Performance Report
New Hire Safety OrientationLength of time spent on safety awareness and education during training for new hires.
Companies that conduct an in-depth indoctrination of new hires into the safety culture, systems and processes based on a documented orientation process experience 48 percent to 50 percent lower incident rates than companies that limit their orientations to basic safety and health compliance topics. The CEO or senior leadership delivers that introduction to the company’s safety culture and core values:
2CORE LEADING INDICATORSNEW EMPLOYEE SAFETY ORIENTATION: LOW SCORE VS. HIGH SCORE
TRIR DART
Low Score
TRIR DART
High Score
48%Reduction
50%Reduction
Safety commitment,
expectations and responsibilities
Workplace safety rules specifi c to the
site and hazards
Hazard, injury and emergency communication and reporting
procedures
Protective gear/safety skills
demonstrations
Assignment of a safety mentor to each new hire
until orientation is complete
Performance evaluation and record-keeping
2.13
1.181.10
0.59
15ABC 2017 Safety Performance Report
93%Reduction
92%Reduction
0
1
2
3
4
5
6
7
8
50
75
100
125
150
175
200
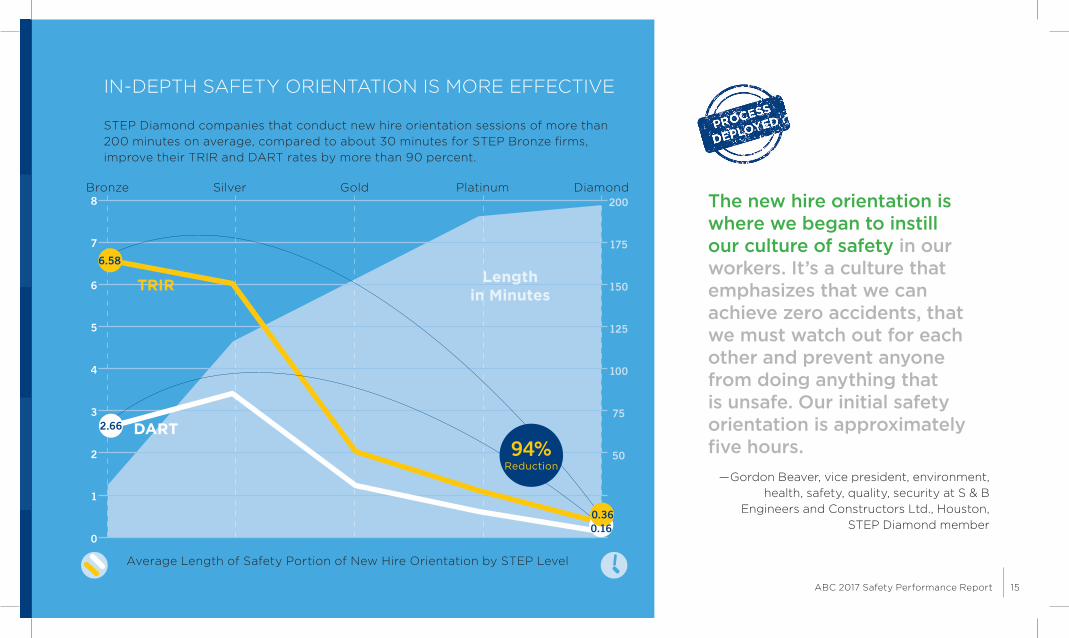
IN-DEPTH SAFETY ORIENTATION IS MORE EFFECTIVE
STEP Diamond companies that conduct new hire orientation sessions of more than 200 minutes on average, compared to about 30 minutes for STEP Bronze fi rms, improve their TRIR and DART rates by more than 90 percent.
The new hire orientation is where we began to instill our culture of safety in our workers. It’s a culture that emphasizes that we can achieve zero accidents, that we must watch out for each other and prevent anyone from doing anything that is unsafe. Our initial safety orientation is approximately fi ve hours.
—Gordon Beaver, vice president, environment, health, safety, quality, security at S & B
Engineers and Constructors Ltd., Houston, STEP Diamond member
94%Reduction
6.58
2.66
0.360.16
Average Length of Safety Portion of New Hire Orientation by STEP Level
TRIR
DART
Bronze Silver Gold Platinum Diamond
Length in Minutes

16 ABC 2017 Safety Performance Report
Site-specifi c Safety Orientation3CORE LEADING INDICATORS
Companies that conduct site-specifi c orientations reduce their TRIR and DART rates by 45 percent and 37 percent, respectively. These sessions incorporate:
“The knowledge and expectations communicated in site-specifi c orientations are vital in preparing our teams to make good, safe decisions. Our workforce not only has
the specifi c information to work safely in that facility, they also have the confi dence to handle what comes their way.”
—Shelley Sutton, CSHO, director of shared services, hth companies inc., Union, Mo., STEP Platinum member
Site-specifi c policies and procedures
Site-specifi c hazards and operations
Company safety vision and
core values
Emphasis on the importance of stop-work authority and peer observations
SITE-SPECIFIC SAFETY ORIENTATION (NO/YES) VS. TRIR & DART
TRIR DART
No
TRIR DART
Yes
37%Reduction
0.69
1.09
1.24
2.24
45%Reduction

ABC 2017 Safety Performance Report
Toolbox Talks4CORE LEADING INDICATORS
Brief, single-topic training sessions of 15 to 30 minutes conducted on the jobsite for all employees.
Can you brief employees on safety too much? No matter what you may have heard, there is no negative eff ect to conducting daily toolbox talks. The less frequently this type of training is conducted and the fewer safety topics covered, the higher the lagging indicators. Companies that conduct only monthly toolbox talks have a TRIR more than four times higher than those that hold them daily.
“Focusing on safety as you start the day or week sets expectations for safety by highlighting the
precautions needed to mitigate anticipated risks. Toolbox talks have a signifi cant positive impact
on safety performance, especially when coupled with stretching exercises and preparation of each crew’s
daily task plan.”
—Rich Baldwin, director, health, safety and environment, PCL Construction Enterprises Inc., Orlando, Fla., STEP Gold member
FREQUENCY OF TOOLBOX TALKS
TRIR TRIR TRIRDART DART DART
Monthly Weekly Daily
64%Reduction
17
2.21
1.23
1.76
0.98
0.80
0.42
66%Reduction

18 ABC 2017 Safety Performance Report
TRACK AND LEARN FROM NEAR MISSES (NO/YES) VS. TRIR & DART
TRIR DART
No
TRIR DART
Yes
41%Reduction
39%Reduction
Near-miss/Near-hit Analysis
The quintessential leading indicator, near-miss/near-hit analysis records observations of situations that could have potentially been catastrophic, but did not result in disrupted or lost lives. While there is no industry-wide recognized defi nition of a near miss, tracking and learning from such episodes shows much promise in improving safety, with TRIR and DART rates reduced by 41 percent and 39 percent respectively at companies that do so. Companies that conduct near-miss/near-hit analysis:
5CORE LEADING INDICATORS
“Every incident that occurs on a construction site must receive some level of review. Near misses, however, receive extra scrutiny. A near miss can be a fraction of an inch from
causing a serious injury. That is why it is critical to have a system that tracks, analyzes and reviews near misses and
shares fi ndings to prevent it from happening again.”
—Gordon Beaver, vice president, environment, health, safety, quality, security at S & B Engineers and Constructors Ltd., Houston, STEP Diamond member
Ensure that the site supervisor
investigates both accidents and near
misses promptly
Determine causal factors
Follow up and take corrective actions
Share lessons learned
2.01
1.061.19
0.65

ABC 2017 Safety Performance Report
Site Safety Committee/Principals’ CouncilRegular meetings coordinated by the general contractor or construction manager that include representatives from site employees, subcontractors, vendors/suppliers and the client.
Companies that participated in site safety committee meetings had 46 percent to 47 percent fewer incidents. These information- and idea-sharing sessions:
6CORE LEADING INDICATORS
Serve as a communications hub
to enhance jobsite safety
Meet at least weekly to raise
and correct safety concerns
Are comprised of volunteers or
members selected by peers
Represent all subcontractors
on site
SITE SAFETY COMMITTEE/PRINCIPALS’ COUNCIL PARTICIPATION (NO/YES) VS. TRIR & DART
TRIR DART
No
TRIR DART
Yes
47%Reduction
46%Reduction
19
“Project safety committees should be an essential part of every contractor’s safety program. The nurture a
strong sense of safety culture, create an awareness that every worker is empowered to work safely, and improve
communication between contractors from various trades.”
—Chris Diaz, vice president, safety, health and environmental, Balfour Beatty Corp., Dallas, STEP Diamond member
0.60
1.091.11
2.04

ABC 2017 Safety Performance Report
Inspections are made by the
supervisor and are documented
Potentially serious safety
issues are corrected immediately
Less serious safety issues are corrected
promptly
Follow-up processes ensure
that corrective actions produce expected results
FREQUENT INSPECTIONS, CORRECTIONS AND LEARNINGS: LOW SCORE VS. HIGH SCORE
TRIR DART
Low Score
TRIR DART
High Score
59%Reduction
58%Reduction
2.63
1.46
1.10
0.60
Site Safety Committee/Principals’ CouncilWeekly jobsite inspections by the site supervisor are a critical information input to the site safety committee. Frequent inspections, corrections and learnings lead to a 58 percent reduction in TRIR rates and a 59 percent reduction in DART rates.
6CORE LEADING INDICATORS
20

BENCHMARKING STEP MEMBER SAFETY PERFORMANCE IMPROVEMENT, 2011-2016
Total Recordable Incident Rate (TRIR): STEP vs. the U.S. Bureau of Labor Statistics Industry Average
2011 2012 2013 2014 2015 2016
BLS
STEP Average
STEP Platinum
STEP Diamond
4
2.5
1.1
0.7
3.9
2.2
1
0.3
3.8
2
1.2
0.5
3.7
1.8
1.5
0.5
3.6
1.8
1
0.5
3.5
1.4
0.8
0.4
21
770%SAFER

ABC 2017 Safety Performance Report22
Glossary of Common Terms
ABC – Associated Builders and Contractors Inc., a construction trade association representing nearly 21,000 merit shop contractors and affiliated firms nationwide.
BLS – U.S. Bureau of Labor Statistics, a federal agency responsible for providing statistical analysis on workplace injuries, illnesses and fatalities. Operates under the scope of the U.S. Department of Labor.
CII – Construction Industry Institute, a consortium of owners, engineering-construction firms and suppliers focused on the effectiveness and sustainability of the capital facility life cycle through research and industry initiatives.
CCDAFW – Construction Coalition for a Drug- and Alcohol-Free Workplace, established in 2012 by construction trade associations to develop resources in the campaign to eliminate substance abuse in the industry (drugfreeconstruction.org).
CURT – The Construction Users Roundtable represents many owners/users/clients that hire construction industry firms.
DART Rate – Days Away, Restricted or Transferred rate. Measures the number of cases per 100 full-time employees where an injury or illness causes an employee to be restricted or transferred based on inability to perform normal job functions.
Disrupted Life/Lives – Non-statistical term used to describe the impact on the employee, friends and family when a life has been disrupted because of an injury suffered during work hours.
Experience Modification Rate (EMR) – Also referred to as “mod factor.” Calculation normally performed by the insurance industry (National Council on Compensation Insurance or state-level agency) reflecting percentage of workers’ compensation payouts by a company compared to a company of similar size and type.
FTE – Full-time employee as defined by BLS and captured on a company’s OSHA Form 300A, which tracks the number of full-time employees that a company employs in the course of a calendar year.
Lagging Indicators – Metrics used by industry to measure safety performance based on historical data (i.e. incident rate, DART rate, etc.).
Leading Indicators – Metrics used by industry to measure the use and effectiveness of incident prevention (i.e. near-miss reporting, use of substance abuse programs, site-safety orientation programs, etc.).
Lost Life/Lives – Non-statistical term used to describe a fatality caused by an injury suffered during work hours and the long-term extended impact, beyond the lost life, on family and friends.
Near-miss Tracking – Observations made and recorded of cases where, had conditions been different, an OSHA recordable incident would have occurred. Also referred to as “near-hits.”

23ABC 2017 Safety Performance Report
OSHA – The Occupational Safety and Health Administration, a U.S. government agency tasked with establishing workplace safety and health requirements and enforcement of existing rules. Operates under the scope of the U.S. Department of Labor.
OSHA Form 300A – The “Summary of Work-Related Injuries and Illnesses” required by OSHA for all companies with 11 or more employees and is created using information gathered from a company’s OSHA Form 300, the “Log of Work-Related Injuries and Illnesses.”
Safety Portion of a Company’s New-Hire Orientation – Amount of time, in minutes, a company devotes to covering safety-related topics during orientation for all new employees.
Site Safety Committees – Group comprised of employees and site management representatives, usually selected from the general contractor and subcontractors operating on the jobsite, tasked with reviewing and establishing safety and health training and education, as well as reporting on the general well-being of employees onsite. Also may be referred to as “Principals’ Councils.”
Site-Specific Safety Orientation – Jobsite-specific training conducted by a construction firm designed to orient employees recently hired or assigned to the jobsite with operational procedures, safety hazards specific to the work being performed, and location-specific safety and health information, such as emergency contacts, first response procedures, etc.
STEP – ABC’s Safety Training Evaluation Process, created in 1989 to gather data related to member safety performance and to evaluate the effectiveness of safety programs based on 20 Key Components of world-class safety programs.
Toolbox Talks – Topic-specific, short-format training, usually conducted before the workday or during lunch breaks, aimed at crews and site employees to educate on specific safety and health topics/hazards/policies and procedures.
TRIR – Total Recordable Incident Rate. Measures the number of cases per 100 full-time employees where an injury or illness caused a loss of life, situation where an employee is unable to work (days away), is restricted or transferred based on inability to perform normal job functions or any other injury that falls under the OSHA definition of a recordable incident.

24 ABC 2017 Safety Performance Report
You Can Achieve World-class Safety. Start Today.
A commitment to world-class safety takes tremendous effort and is fraught with leadership challenges.
Transforming a company is difficult. Transforming an industry is daunting. Once you resolve to make that transformation, ABC can help.
Whether your company is large or small, ABC’s Safety Training Evaluation Process—STEP—gives you an organized approach to analyze and develop your company’s safety and loss prevention program, wherever you are on the roadmap to world-class safety performance.
The STEP application is now online, making it faster and easier to complete your self-evaluation. You can also ask your ABC chapter to host an ABC STEP Plus Safety Excellence Academy.
I hope the 2017 ABC Safety Performance Report helps you discover how world-class results can be realized in your company. Please feel free to share the report widely.
If we choose to lead, if we choose to commit, if we choose to transform, together we will create the conditions for all to do their work without incident and go home safely every day.
Michael D. BellamanPresident and CEOAssociated Builders and Contractors
Founded in 1950, Associated Builders and Contractors (ABC) is a national construction industry trade association representing nearly 21,000 members. Founded on the merit shop philosophy, ABC and its 70 chapters help members develop people, win work and deliver that work safely, ethically and profitably for the betterment of the communities in which ABC and its members work. Visit us at abc.org.

25ABC 2017 Safety Performance Report
Chair Sam Stiteler MetroPower Inc.
Executive Committee Liaison Jay Baldwin Reliable Contracting Company Inc.
Chapter President Liaison John Mielke ABC Wisconsin Chapter
Staff Liaison Greg Sizemore ABC National
Troy Allen Primoris Services Corp.
Richard Baldwin PCL Construction Services Inc.
Gary Clevenger CNA
Kevin Converse United Rentals Inc.
Shane Davis Ivey Mechanical
Christopher Diaz Balfour Beatty Construction
Edwin Foulke, Jr. Fisher & Phillips LLP
Bill Goss CNA
Daryl Guercio CB&I
Melanie Laird FC Background
Anthony Lombardi Centennial Contractors Enterprises Inc.
Todd Meek Lauren Engineers & Constructors Inc.
Jeremy Miller Performance Contractors Inc.
Danny Oubre EXCEL Contractors Inc.
Joel Pickering Lend Lease (US) Construction Inc.
Ralph Riley S&B Engineers and Constructors Ltd.
Shelley Sutton hth companies inc.
Jim Thompson Kwest Group LLC
Bart Wilder Hoar Construction, LLC
Stephen Wiltshire Forrester Construction
Lauren WilliamsABC National
ABC 2017 ENVIRONMENT, HEALTH AND SAFETY COMMITTEE

For more information, contact:
Greg SizemoreVice President, Health, Safety, Environment and Workforce DevelopmentAssociated Builders and Contractors440 First St., NW, Suite 200Washington, DC [email protected]
abc.org/safety


![A smart artificial bee colony algorithm with distance-fitness-based …hebmlc.org/UploadFiles/201872983541770.pdf · 2018. 7. 29. · abc. [] abc abc abc [] abc [abc abc [] abc [abc](https://static.documents.pub/doc/80x56/5febef9cecac5951281b206e/a-smart-artificial-bee-colony-algorithm-with-distance-fitness-based-2018-7-29.jpg)


