Scanning Acoustic Microscopy Training 8700 Morrissette Drive 8700 Morrissette Drive Springfield, VA 22152 Springfield, VA 22152 tel: 703 tel: 703 - - 440 440 - - 0222 0222 fax: 703 fax: 703 - - 440 440 - - 9512 9512 e e - - mail: [email protected]mail: [email protected]This presentation and images are copyrighted by Sonix, Inc. They may not be copied, reproduced, modified, published, uploaded, posted, transmitted, or distributed in any way, without prior written permission from Sonix.
This presentation and images are copyrighted by Sonix, Inc. They may not be copied, reproduced, modified, published, uploaded, posted, transmitted, or distributed in any way, without prior written
permission from Sonix.
Copyright Sonix, Inc2
This presentation serves as a brief introduction into the theory and operation of scanning acoustic
microscopes.
Copyright Sonix, Inc3
Ultrasound Inspection,
Using an Acoustic Microscope…
• Ultrasound
•Non-Destructive Testing
•Example Images
What does this thing do?
Copyright Sonix, Inc4
UltrasoundUltrasound
University of California Medical Center
San Francisco, California
MEDICAL SONAR
What are Ultrasonic Waves?
Ultrasonic waves refer to sound waves above 20 kHz (not audible to the human ear)
What are Ultrasonic Waves?
Ultrasonic waves refer to sound waves above 20 kHz (not audible to the human ear)
Copyright Sonix, Inc5
NonNon--Destructive TestingDestructive Testing
NDT utilizes various non-invasive measurement techniques, such as
ultrasonics and radiography to determine the integrity of a
component, structure, or material without destroying the usefulness
of the item.
Copyright Sonix, Inc6
Where an Acoustic Microscope is utilized.Where an Acoustic Microscope is utilized.
•Failure Analysis
•Reliability
•Process Control
•Vendor Qualification
•Production
•Quality Control
•Research
•Failure Analysis
•Reliability
•Process Control
•Vendor Qualification
•Production
•Quality Control
•Research
Copyright Sonix, Inc7
Common ApplicationsCommon Applications
•Plastic encapsulated IC packages
•Flip Chips
•Bonded Wafers
•Printed Circuit Boards
•Capacitors
•Ceramics
•Metallic
•Power Devices/Hybrids
•Medical Devices
•Material Characterization
•Plastic encapsulated IC packages
•Flip Chips
•Bonded Wafers
•Printed Circuit Boards
•Capacitors
•Ceramics
•Metallic
•Power Devices/Hybrids
•Medical Devices
•Material Characterization
Copyright Sonix, Inc8
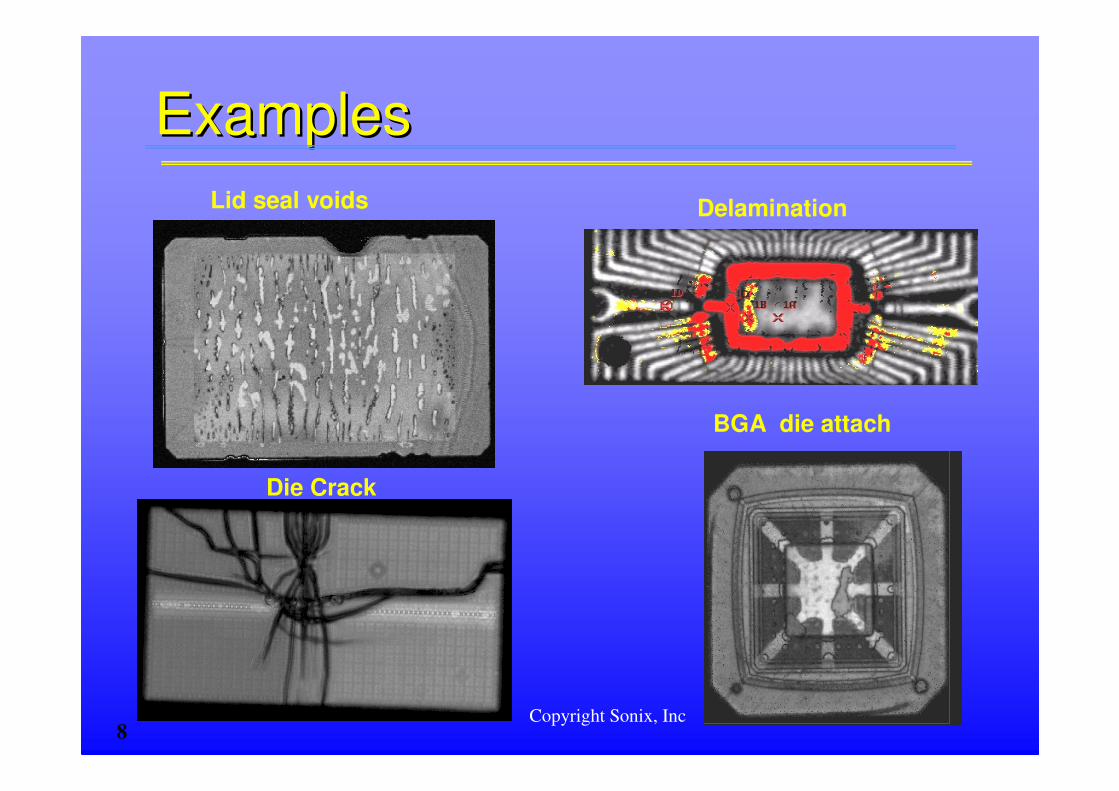
Die Crack
Delamination
BGA die attach
Lid seal voids
Examples Examples
Copyright Sonix, Inc9
ExamplesExamples
Die Attach VoidsDie Tilt, B-Scan Die Pad delamination
Mold compound voidsDie Top
DelaminationFlip Chip Underfill
Voids
Copyright Sonix, Inc10
Ultrasound Inspection
•Theory
•System Components
•Transducers
Copyright Sonix, Inc11
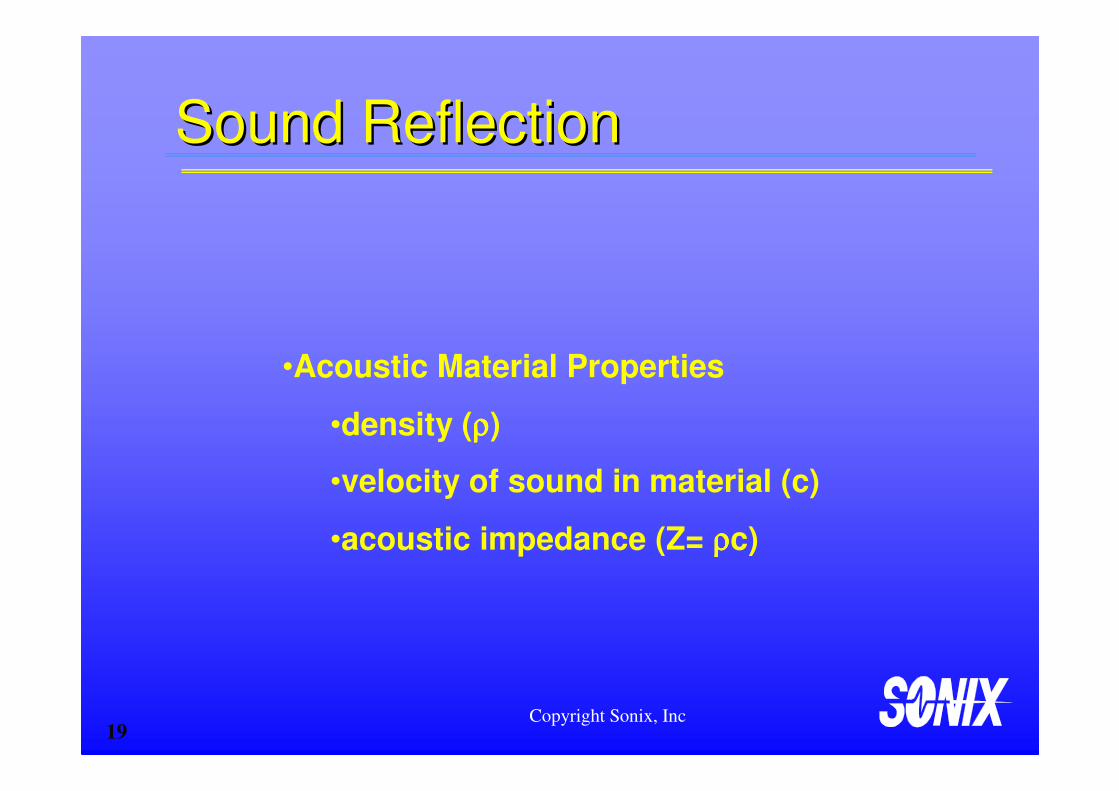
Characteristics of Ultrasonic Waves
• Freely propagate through liquids and solids
• Reflect at boundaries of internal flaws and
change of material
• Capable of being focused, straight
transmission
• Suitable for Real-Time processing
• Harmless to the human body
• Non-destructive to material
Characteristics of Ultrasonic Waves
• Freely propagate through liquids and solids
• Reflect at boundaries of internal flaws and
change of material
• Capable of being focused, straight
transmission
• Suitable for Real-Time processing
• Harmless to the human body
• Non-destructive to material
Ultrasonic WavesUltrasonic Waves
University of California Medical Center
San Francisco, California
Copyright Sonix, Inc12
Ultrasonic InspectionUltrasonic Inspection
H2O
Transducer
Coupling
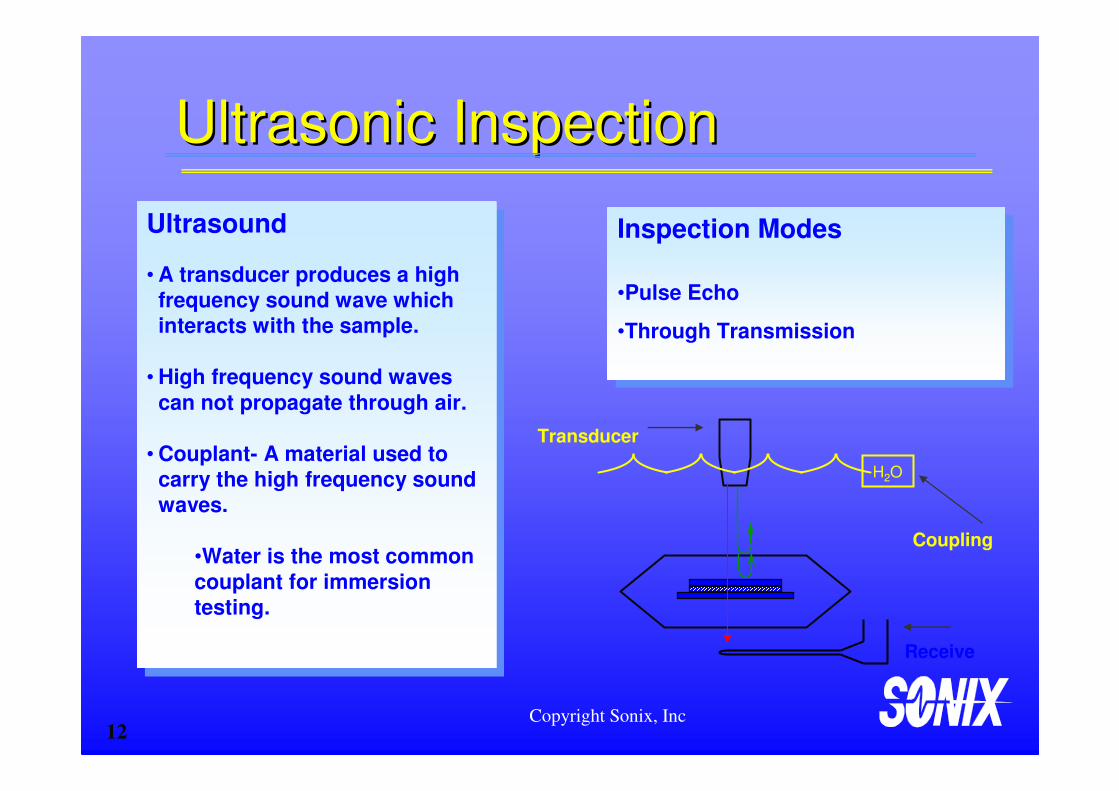
Ultrasound
• A transducer produces a high frequency sound wave which interacts with the sample.
• High frequency sound waves
can not propagate through air.
• Couplant- A material used to carry the high frequency sound waves.
•Water is the most common
couplant for immersion testing.
Ultrasound
• A transducer produces a high frequency sound wave which interacts with the sample.
• High frequency sound waves
can not propagate through air.
• Couplant- A material used to carry the high frequency sound waves.
•Water is the most common
couplant for immersion testing.
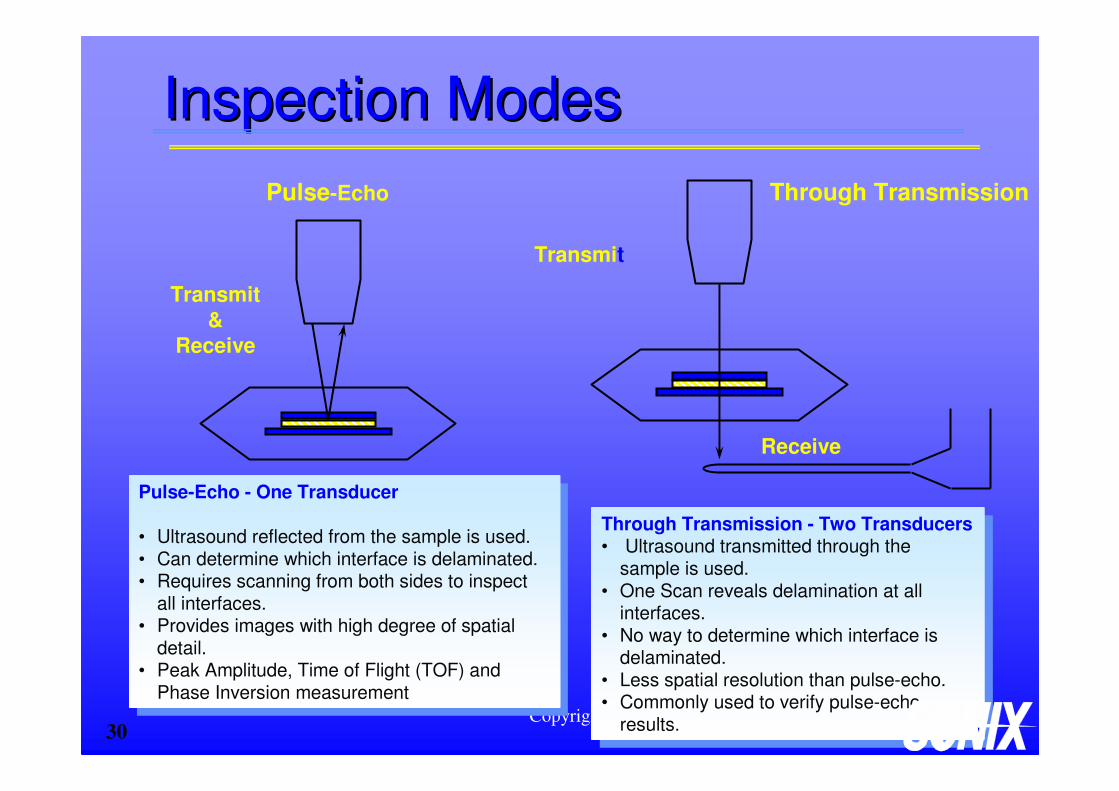
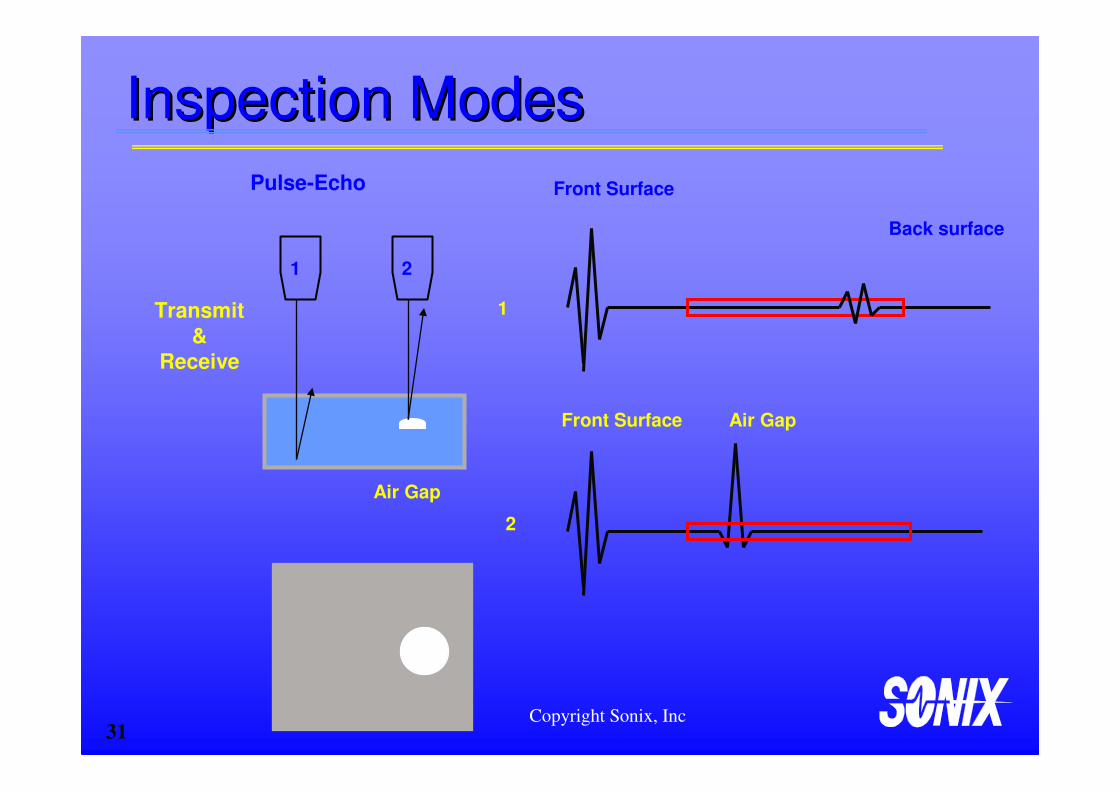
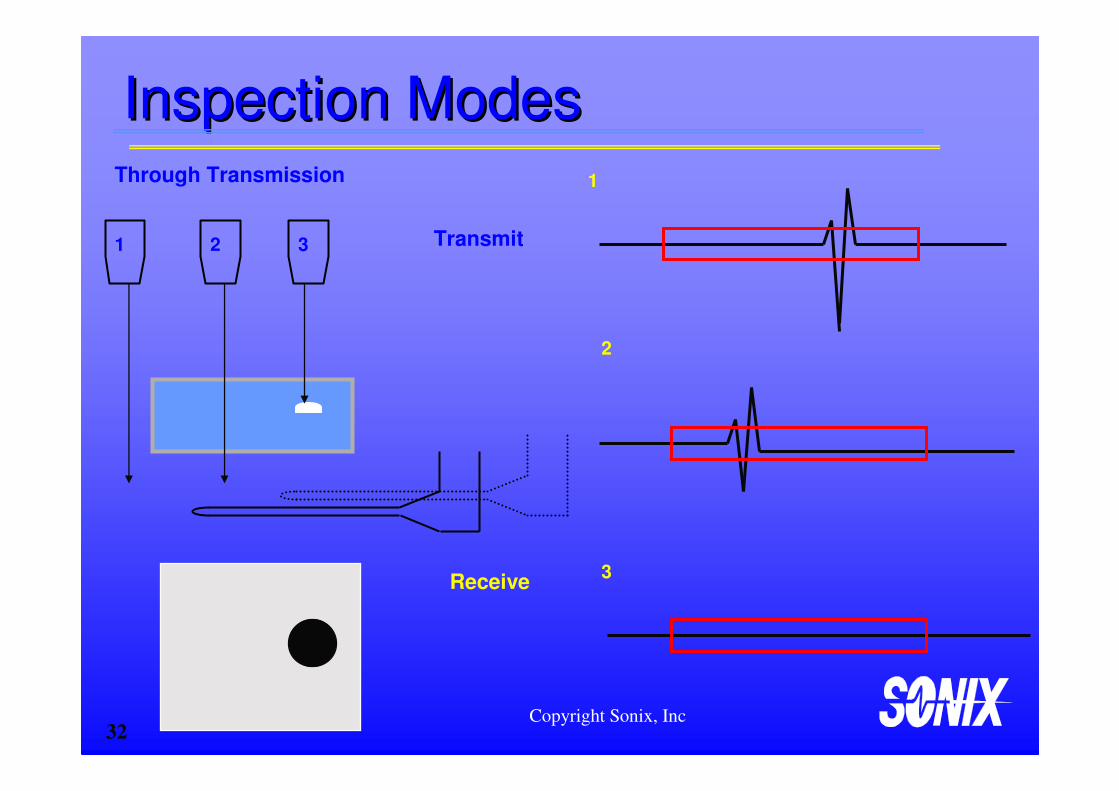
Inspection Modes
•Pulse Echo
•Through Transmission
Inspection Modes
•Pulse Echo
•Through Transmission
Receive
Copyright Sonix, Inc13
ScannerScanner
The scanner consists of a three axis system, X, Y, and Z. The motor controller directs the movement of these axes.
Z
A
xi
s
Y-A
xis
Ste
p
X-Axis
Scan
Foc
us
Copyright Sonix, Inc14
TransducersTransducers
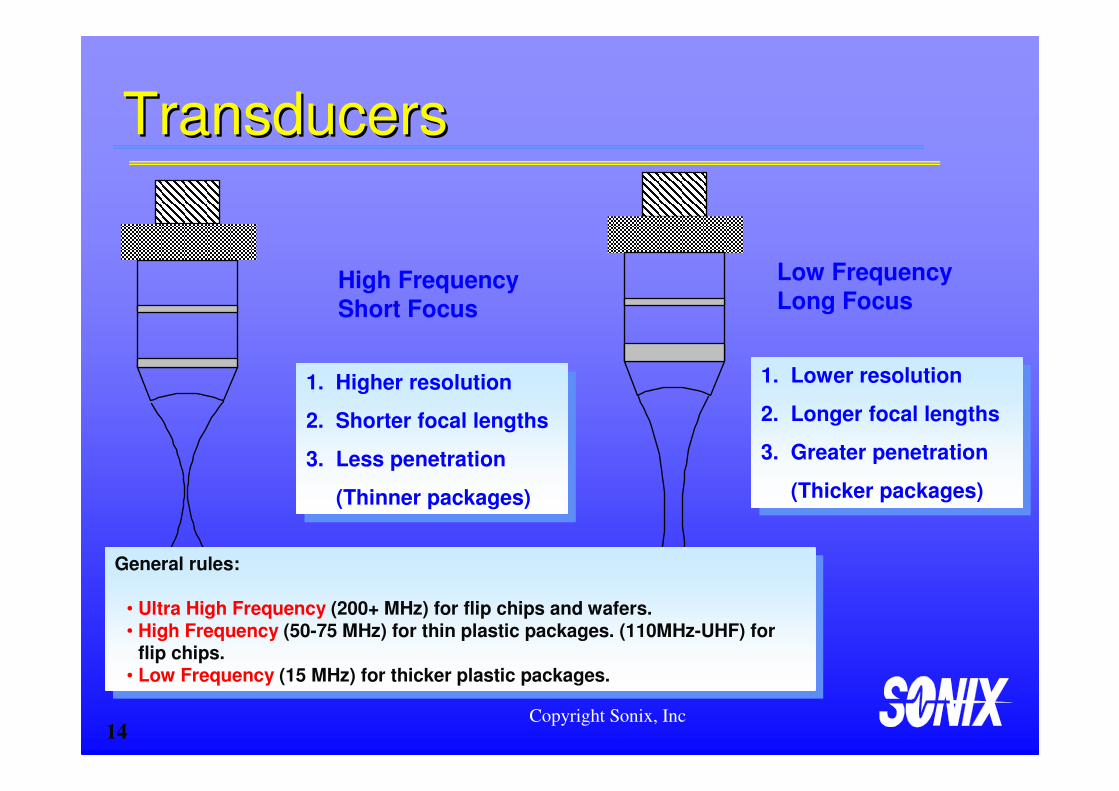
High Frequency
Short Focus
Low Frequency
Long Focus
1. Higher resolution
2. Shorter focal lengths
3. Less penetration
(Thinner packages)
1. Higher resolution
2. Shorter focal lengths
3. Less penetration
(Thinner packages)
1. Lower resolution
2. Longer focal lengths
3. Greater penetration
(Thicker packages)
1. Lower resolution
2. Longer focal lengths
3. Greater penetration
(Thicker packages)
General rules:
• Ultra High Frequency (200+ MHz) for flip chips and wafers. • High Frequency (50-75 MHz) for thin plastic packages. (110MHz-UHF) for
flip chips.• Low Frequency (15 MHz) for thicker plastic packages.
General rules:
• Ultra High Frequency (200+ MHz) for flip chips and wafers. • High Frequency (50-75 MHz) for thin plastic packages. (110MHz-UHF) for
flip chips.• Low Frequency (15 MHz) for thicker plastic packages.
Copyright Sonix, Inc15
Transducer Beam ProfileTransducer Beam Profile
Depth of Field
The purple region
is referred to as the focal area or depth of field of the transducer beam.


![Nonlinear UT for NDT [Kompatibilitetsläge] · Nonlinear ultrasonics for NDTNonlinear ultrasonics for NDT Linear Ultrasonics: Detection of Flaws/Discontinuities • Detect geometric](https://static.documents.pub/doc/80x56/5eb54bd032d9642d8e2c4d0a/nonlinear-ut-for-ndt-kompatibilitetslge-nonlinear-ultrasonics-for-ndtnonlinear.jpg)

![10 Level Ultrasonics[1]](https://static.documents.pub/doc/80x56/56d6c09d1a28ab30169b1821/10-level-ultrasonics1.jpg)


