ABCs of Zzzzs: The Impact of Delaying High School Start Times on Adolescent Health, Safety and Performance Sleep Grand Rounds Judith Owens MD MPH Director of Sleep Medicine Children’s National Medical Center Washington DC
Transcript
ABCs of Zzzzs: The Impact of Delaying High School StartTimes on Adolescent Health, Safety and Performance
Sleep Grand RoundsJudith Owens MD MPH
Director of Sleep MedicineChildren’s National Medical Center
Washington DC
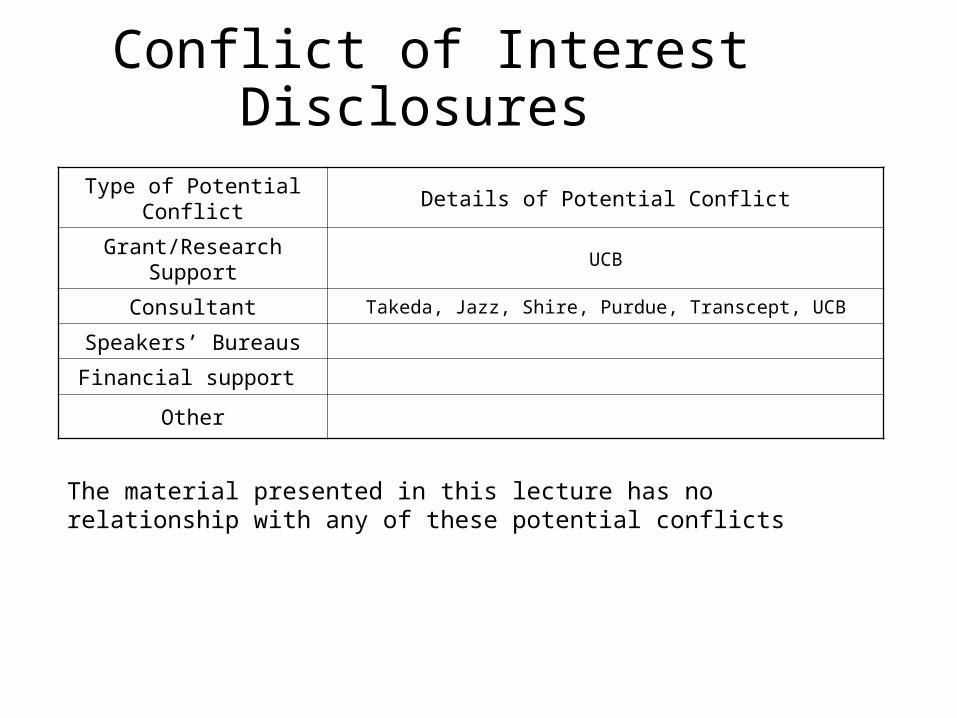
Conflict of Interest Disclosures
Type of Potential Conflict Details of Potential Conflict
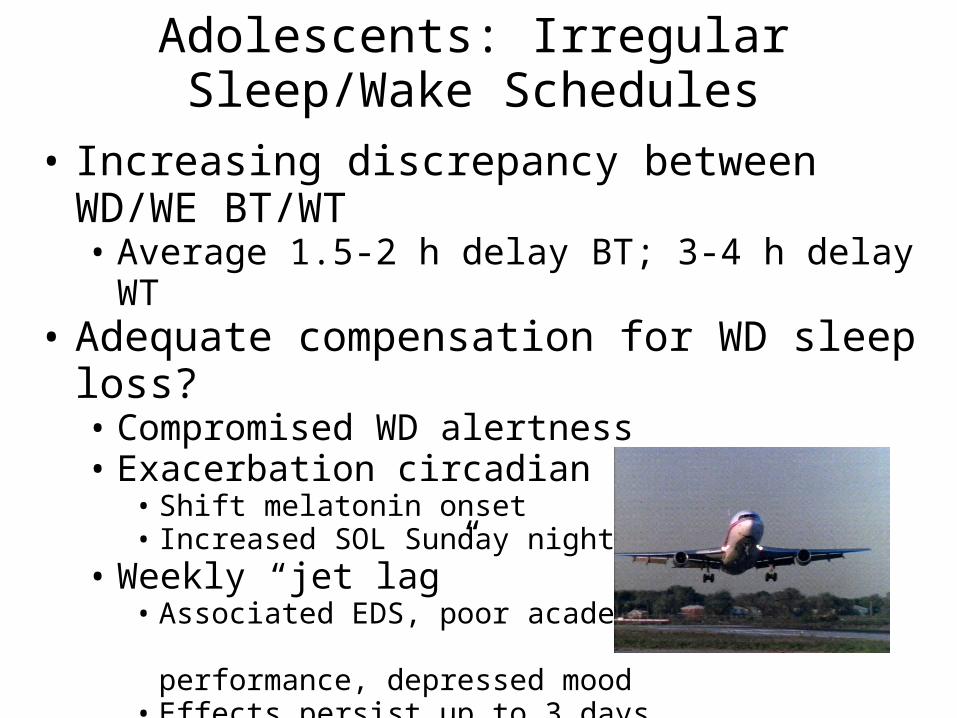
• Shift melatonin onset• Increased SOL Sunday night
• Weekly “jet lag”• Associated EDS, poor academic
performance, depressed mood• Effects persist up to 3 days
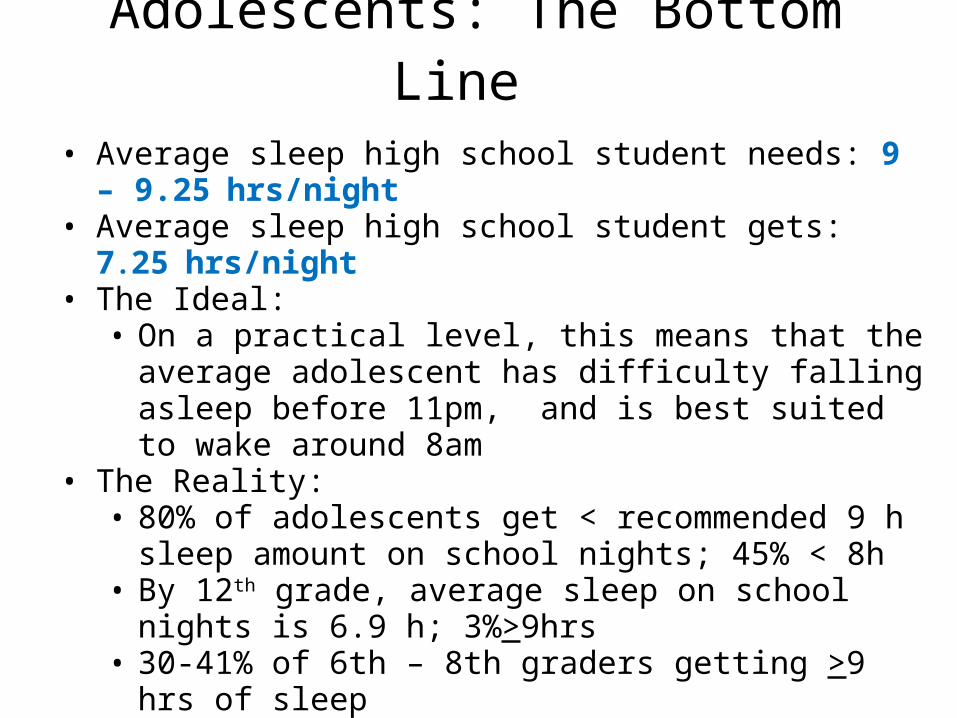
Adolescents: The Bottom Line • Average sleep high school student needs: 9 – 9.25 hrs/night• Average sleep high school student gets: 7.25 hrs/night• The Ideal:
• On a practical level, this means that the average adolescent has difficulty falling asleep before 11pm, and is best suited to wake around 8am
• The Reality:• 80% of adolescents get < recommended 9 h sleep amount on
school nights; 45% < 8h• By 12th grade, average sleep on school nights is 6.9 h;
3%>9hrs• 30-41% of 6th – 8th graders getting >9 hrs of sleep • But, 71% of parents think their teens get enough sleep most
nights NSF Poll data 2006
Sleep In Adolescents:A Public Health Crisis
*
*Save Our Sleep
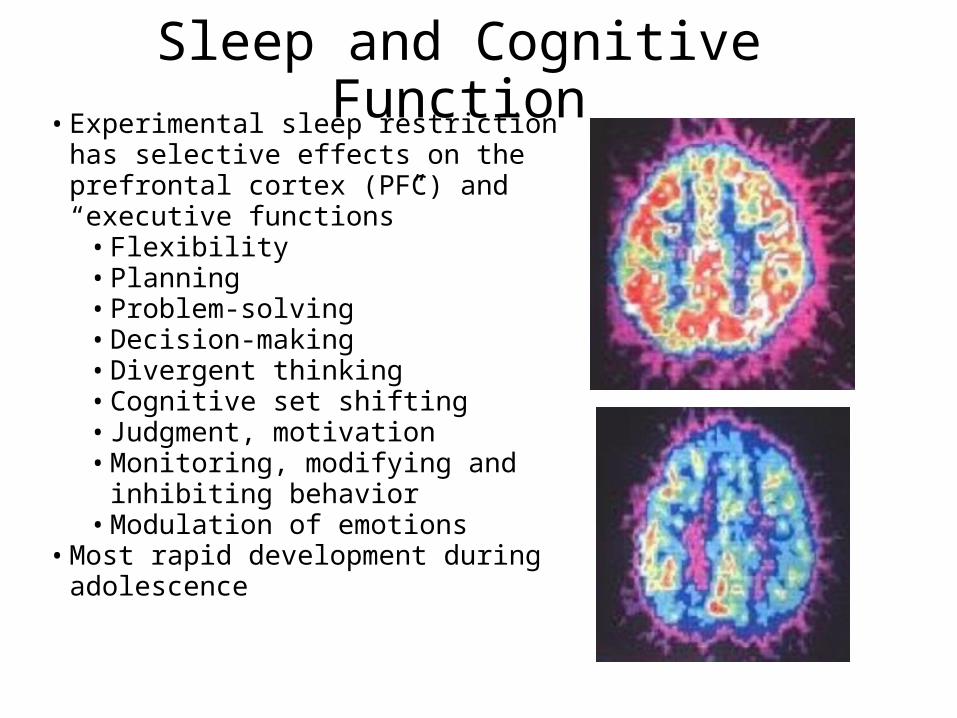
Sleep and Cognitive Function• Experimental sleep restriction has
selective effects on the prefrontal cortex (PFC) and “executive functions”
• Flexibility• Planning• Problem-solving• Decision-making• Divergent thinking• Cognitive set shifting • Judgment, motivation• Monitoring, modifying and
inhibiting behavior• Modulation of emotions
• Most rapid development during adolescence
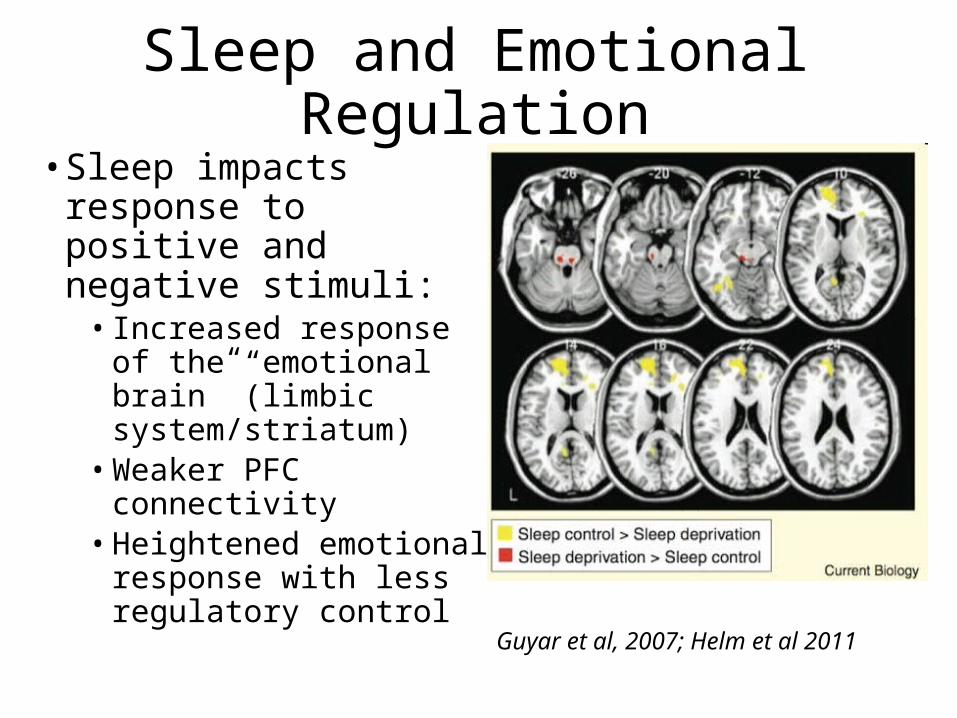
Sleep and Emotional Regulation• Sleep impacts response
to positive and negative stimuli:
• Increased response of the “emotional brain” (limbic system/striatum)
• Weaker PFC connectivity • Heightened emotional
response with less regulatory control
Guyar et al, 2007; Helm et al 2011
Sleep and Risk Taking Behaviors• Selective areas of the brain (striatum) are important for
reward-related function• Positive emotions• Motivation• Response to reward
• These undergo structural/functional changes in adolescence • Studies suggest insufficient sleep linked to changes in reward-
related decision making• Perceive less negative consequences,
take greater risks
O’Brien & Mindell 2005; Giedd 2009; Holm et al 2009
A “Real World” Example• Large socioeconomically, racially and culturally-
diverse school district in eastern US• 183,000 total students in 96 schools• 56,000 students in 26 HS• >1000 buses; 4 delivery tiers• Current start times:
• HS 7:20am (bus pick-up starts 5:45am)• MS 7:45-55am• ES 8:05-9:10am
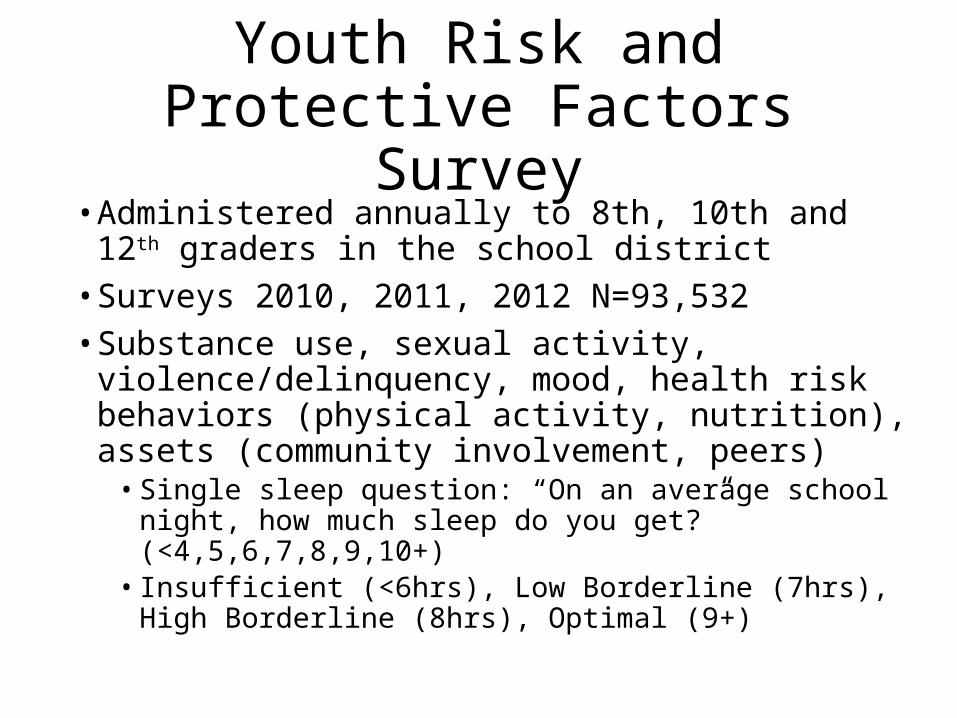
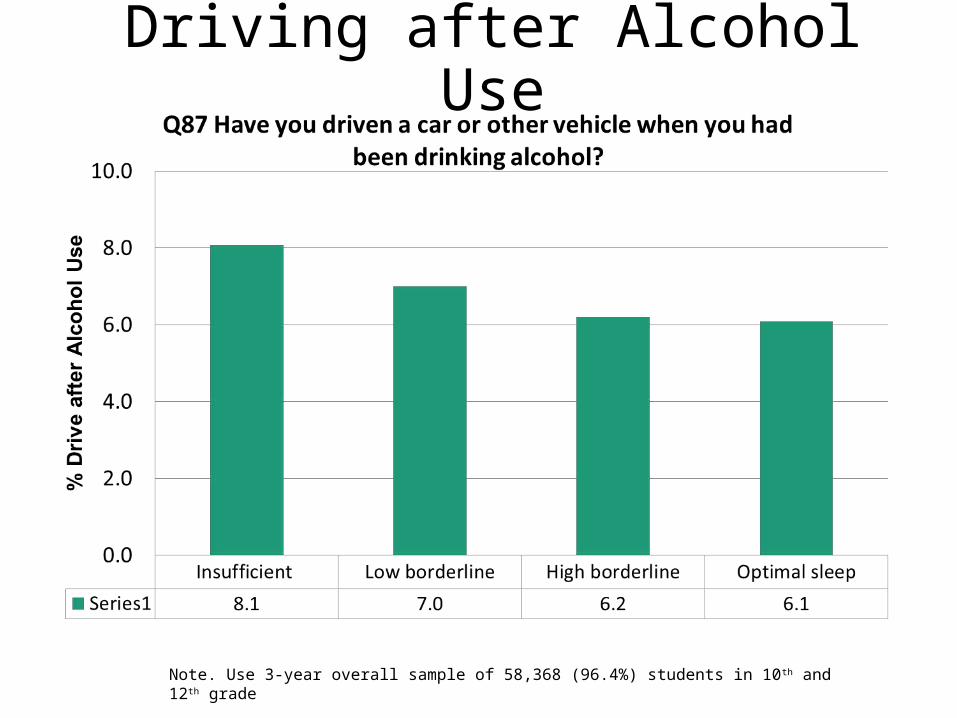
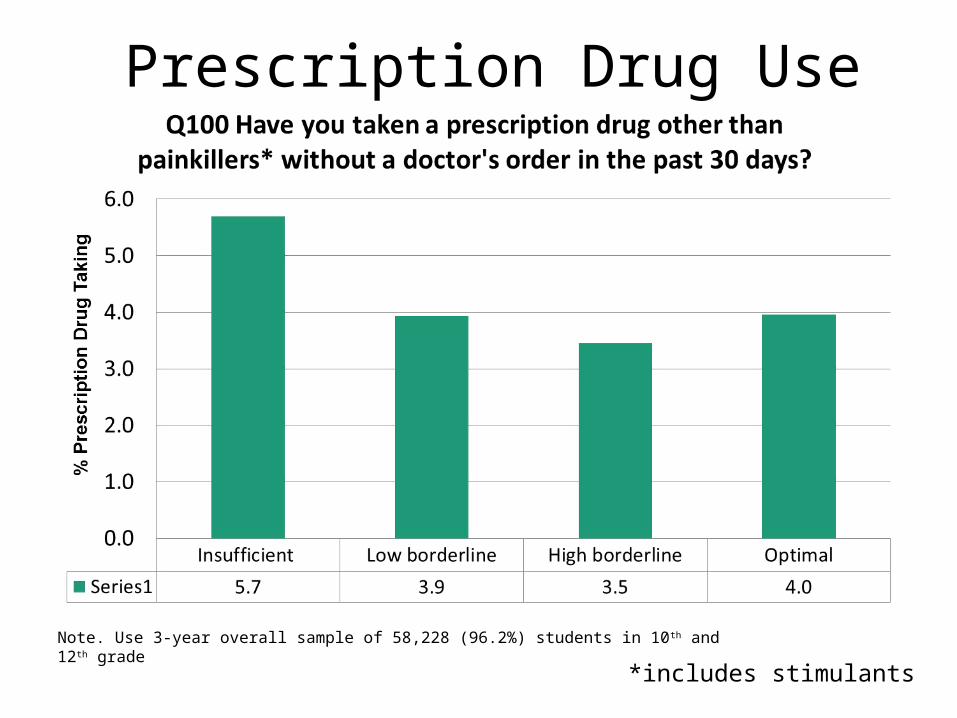
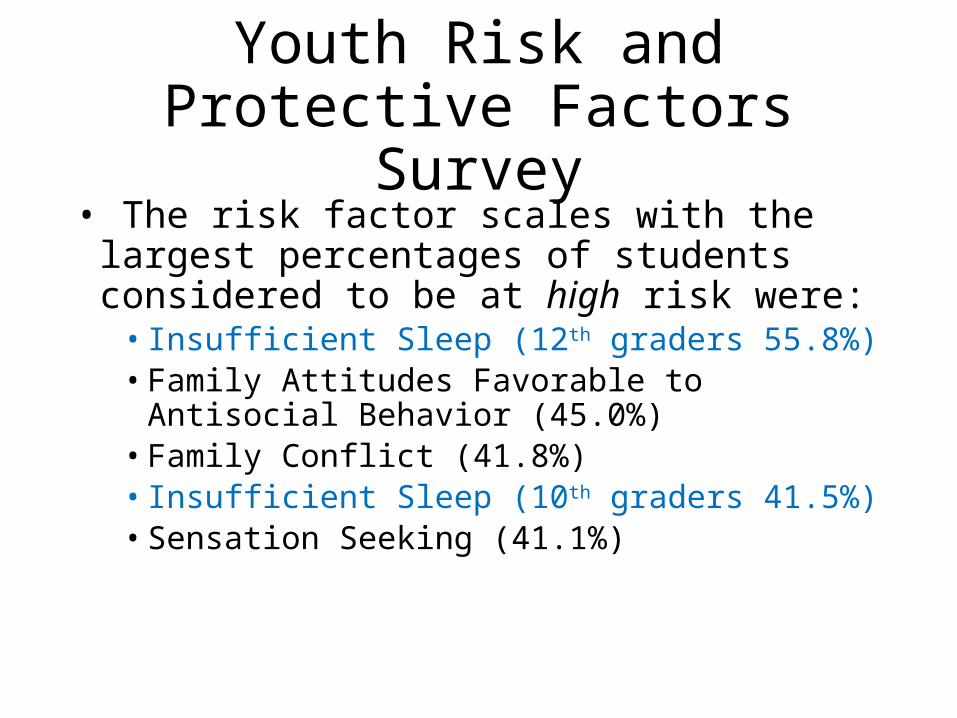
Youth Risk and Protective Factors Survey
• Administered annually to 8th, 10th and 12th graders in the school district
1996: Edina MN changed high school start times from 7:20am to 8:30am
1997: Minneapolis changed high school start times from 7:15am to 8:40am; N>18,000 students
Since late 1990’s, ~1000 high schools in 70 districts report school start time delays; almost no schools have returned to the original bell times
60% of 19,000+ public high school start after 8am
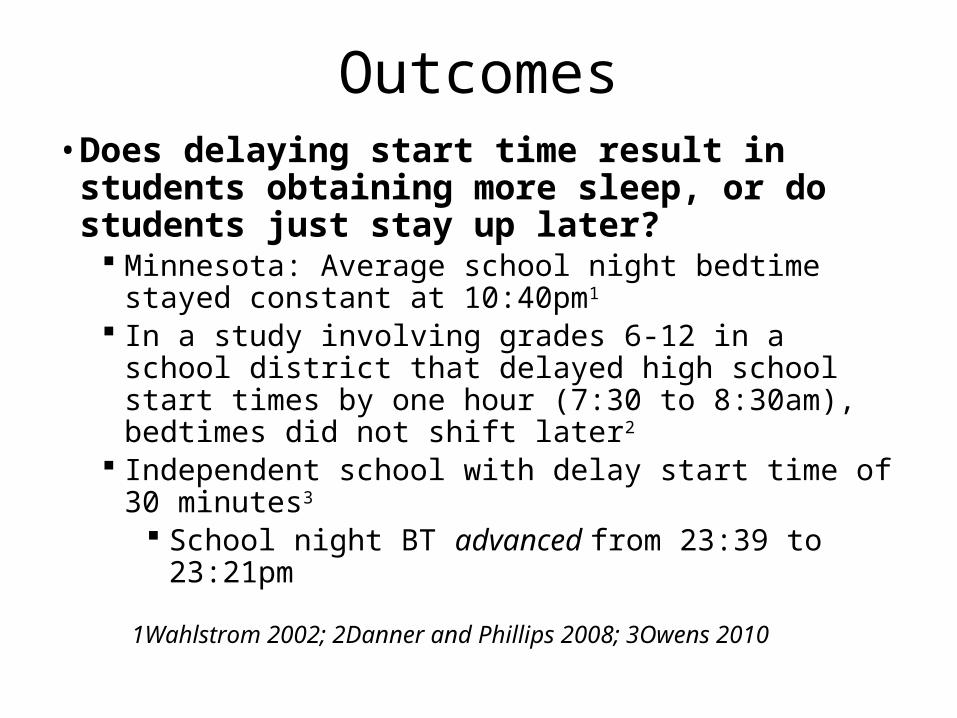
Outcomes• Does delaying start time result in students obtaining
more sleep, or do students just stay up later? Minnesota: Average school night bedtime stayed constant
at 10:40pm1
In a study involving grades 6-12 in a school district that delayed high school start times by one hour (7:30 to 8:30am), bedtimes did not shift later2
Independent school with delay start time of 30 minutes3
School night BT advanced from 23:39 to 23:21pm
1Wahlstrom 2002; 2Danner and Phillips 2008; 3Owens 2010
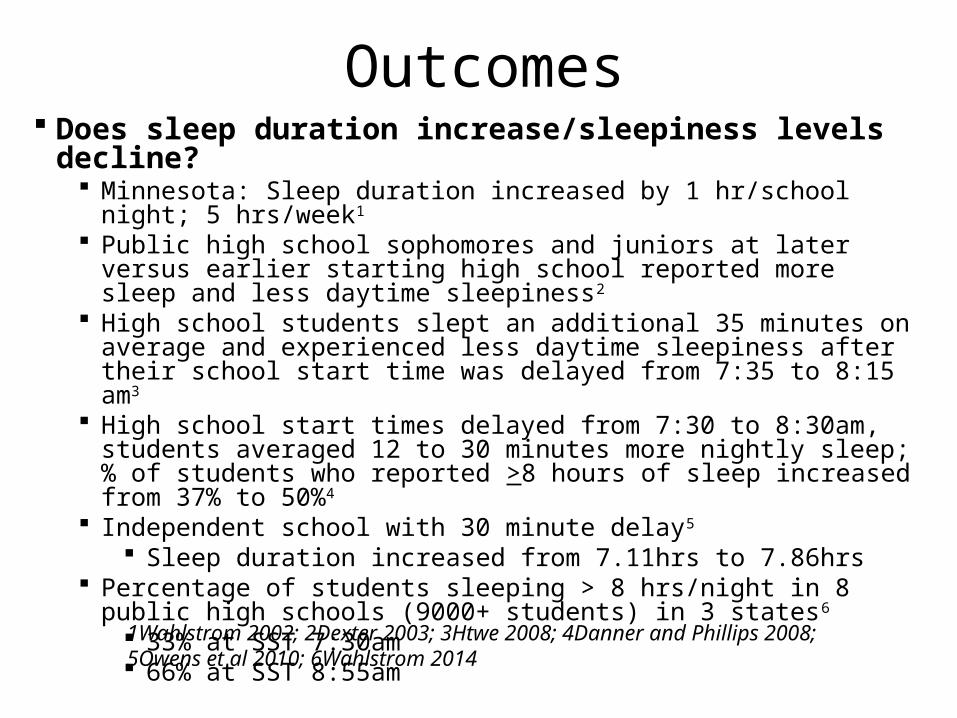
Outcomes Does sleep duration increase/sleepiness levels decline?
Minnesota: Sleep duration increased by 1 hr/school night; 5 hrs/week1
Public high school sophomores and juniors at later versus earlier starting high school reported more sleep and less daytime sleepiness2
High school students slept an additional 35 minutes on average and experienced less daytime sleepiness after their school start time was delayed from 7:35 to 8:15 am3
High school start times delayed from 7:30 to 8:30am, students averaged 12 to 30 minutes more nightly sleep; % of students who reported >8 hours of sleep increased from 37% to 50%4
Independent school with 30 minute delay5
Sleep duration increased from 7.11hrs to 7.86hrs Percentage of students sleeping > 8 hrs/night in 8 public high schools
(9000+ students) in 3 states6
33% at SST 7:30am 66% at SST 8:55am
1Wahlstrom 2002; 2Dexter 2003; 3Htwe 2008; 4Danner and Phillips 2008; 5Owens et al 2010; 6Wahlstrom 2014
Outcomes
0
5
10
15
20
25
30
35
40
45
50
Survey 1 Survey 2
<6
6-6.9
7-7.9
8-8.9
>9
Percentage of students in each self-reported school night sleep duration category at Surveys 1 and 2
Owens et al 2010
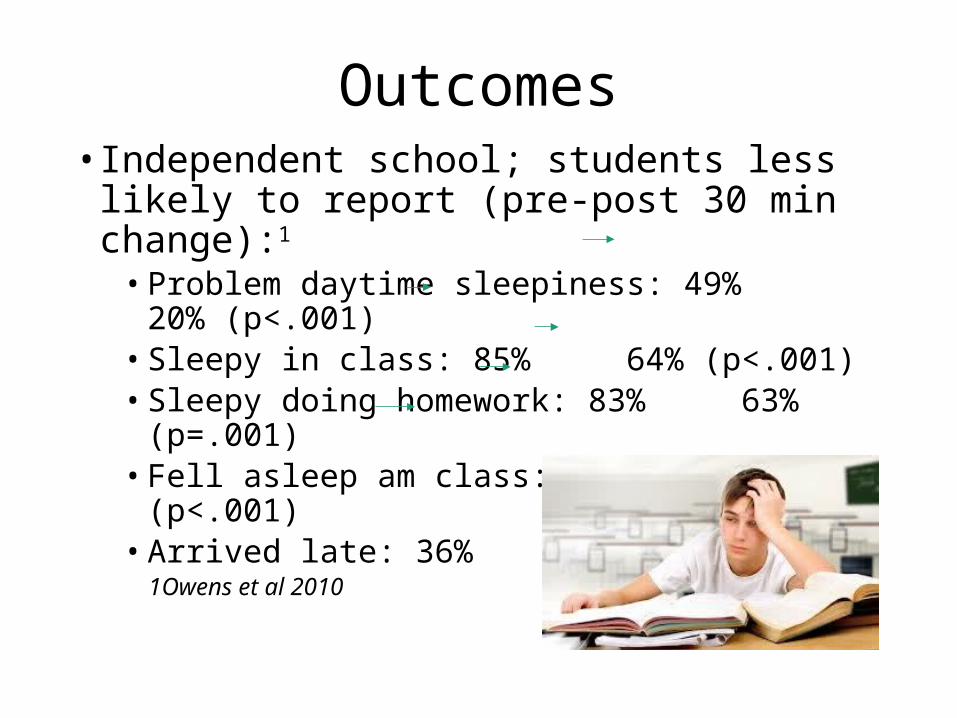
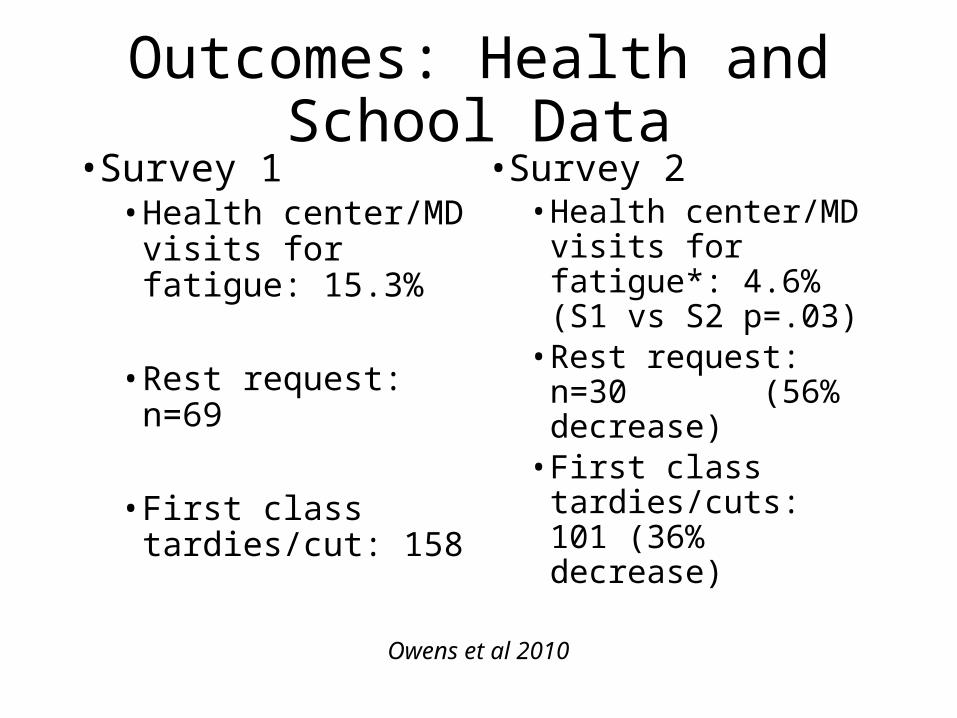
Outcomes• Independent school; students less likely to report
(pre-post 30 min change):1
• Problem daytime sleepiness: 49% 20% (p<.001)• Sleepy in class: 85% 64% (p<.001)• Sleepy doing homework: 83% 63% (p=.001)• Fell asleep am class: 39% 18%(p<.001)• Arrived late: 36% 22% (p<.001)
1Owens et al 2010
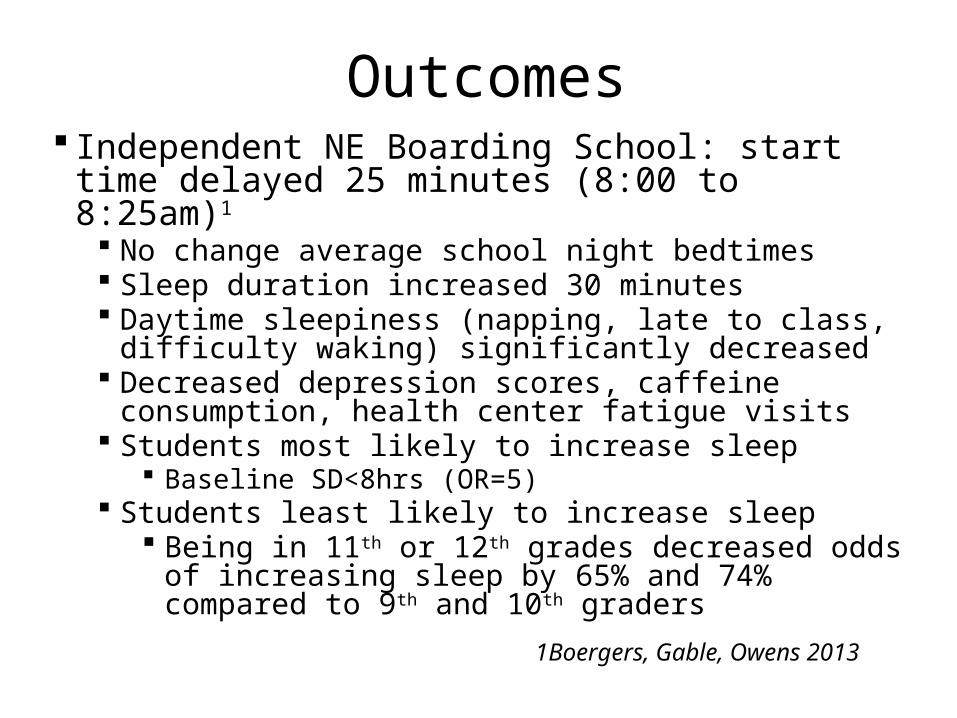
Outcomes Independent NE Boarding School: start time delayed
25 minutes (8:00 to 8:25am)1
No change average school night bedtimes Sleep duration increased 30 minutes Daytime sleepiness (napping, late to class, difficulty waking)
significantly decreased Decreased depression scores, caffeine consumption, health
center fatigue visits Students most likely to increase sleep
Baseline SD<8hrs (OR=5) Students least likely to increase sleep
Being in 11th or 12th grades decreased odds of increasing sleep by 65% and 74% compared to 9th and 10th graders
1Boergers, Gable, Owens 2013
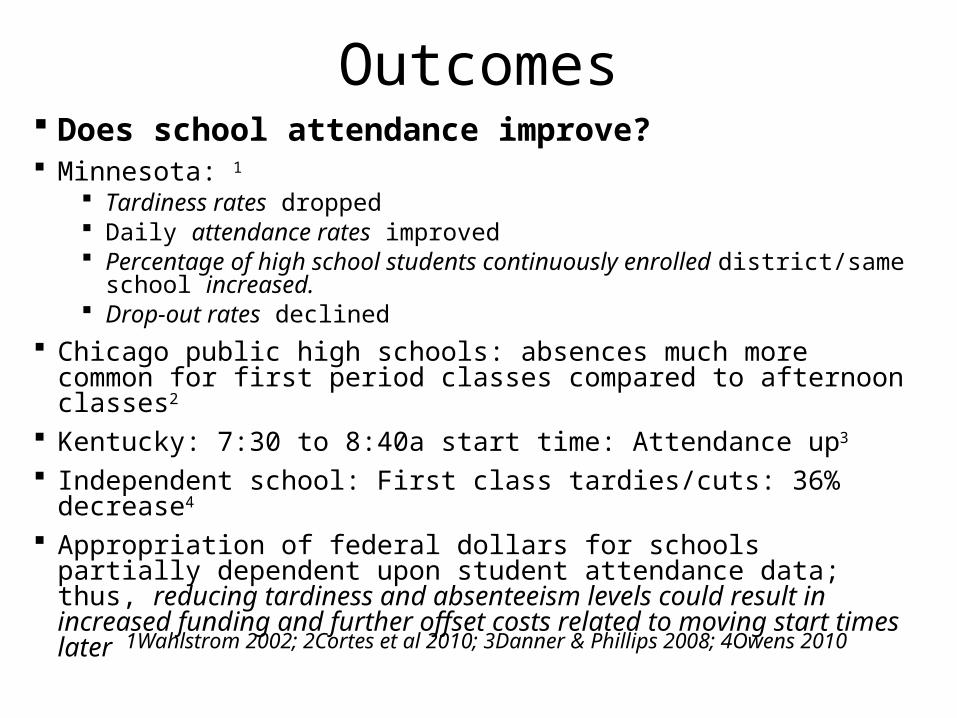
Outcomes Does school attendance improve? Minnesota: 1
Tardiness rates dropped Daily attendance rates improved Percentage of high school students continuously enrolled district/same school
increased. Drop-out rates declined
Chicago public high schools: absences much more common for first period classes compared to afternoon classes2
Kentucky: 7:30 to 8:40a start time: Attendance up3
Independent school: First class tardies/cuts: 36% decrease4
Appropriation of federal dollars for schools partially dependent upon student attendance data; thus, reducing tardiness and absenteeism levels could result in increased funding and further offset costs related to moving start times later
1Wahlstrom 2002; 2Cortes et al 2010; 3Danner & Phillips 2008; 4Owens 2010
Outcomes Does academic performance improve? Minnesota1
Grades improved slightly (not statistically significant) SAT scores for the top 10% of students jumped from 1288 to 1500
Chicago public high schools2 Student grades and test score performance notably lower for first period
classes compared to afternoon classes Performance on end-of-year subject-specific standardized tests (i.e.,
math, English) correlated with whether or not the student was scheduled for that subject during first period
Kentucky: 7:30 to 8:40a start time3
Standardized test scores up
CDC study (2014)4
5/6 schools showed significant increase in GPA pre-post in English, math, science and social studies
Outcomes: Safety• Kentucky: 7:30 to 8:40a start time1
• Teens involved in car crashes down by 16% (vs 9% increase in the rest of the state)
• Adolescent crash rates 40% higher in VA Beach (SST 7:20a) vs Chesapeake (SST 8:40a)2
• 2007: 71 vs 55/1000 (p<.001)• 2008: 66 vs 47/1000 • Peak 1 hour earlier
• CDC (2014): Reduction crash rates in 16-18yo by 65-70%3
• Decreased sleep associated with increased sports-related injuries in high school athletes
1Danner & Phillips 2008; 2Vorona et al 2011; 3Wahlstrom 2014
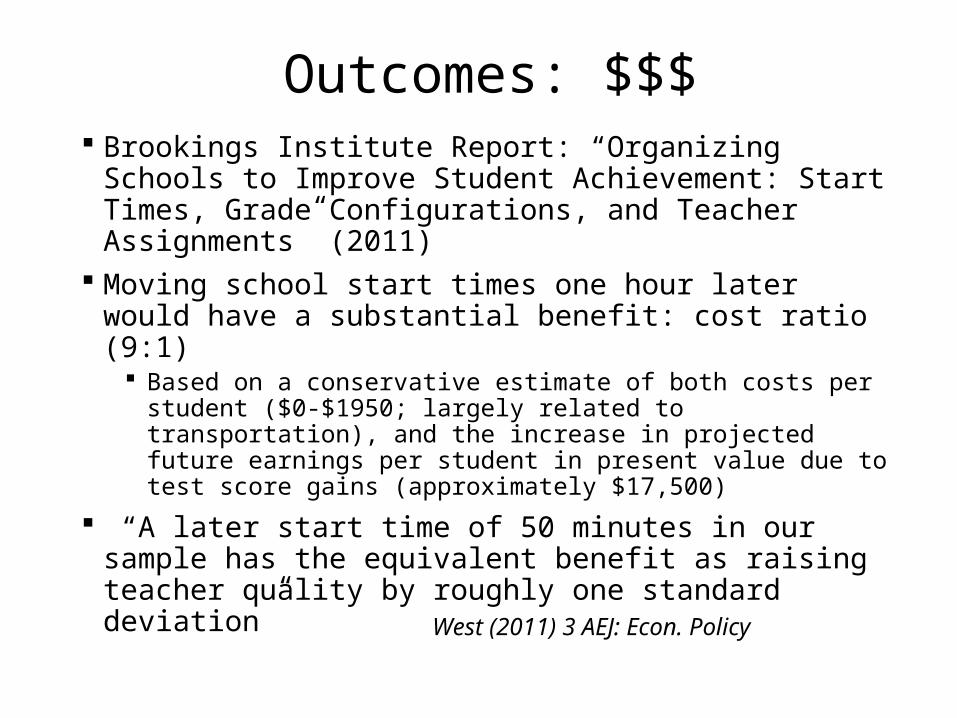
Outcomes: $$$ Brookings Institute Report: “Organizing Schools to Improve
Student Achievement: Start Times, Grade Configurations, and Teacher Assignments” (2011)
Moving school start times one hour later would have a substantial benefit: cost ratio (9:1)
Based on a conservative estimate of both costs per student ($0-$1950; largely related to transportation), and the increase in projected future earnings per student in present value due to test score gains (approximately $17,500)
“A later start time of 50 minutes in our sample has the equivalent benefit as raising teacher quality by roughly one standard deviation”
West (2011) 3 AEJ: Econ. Policy
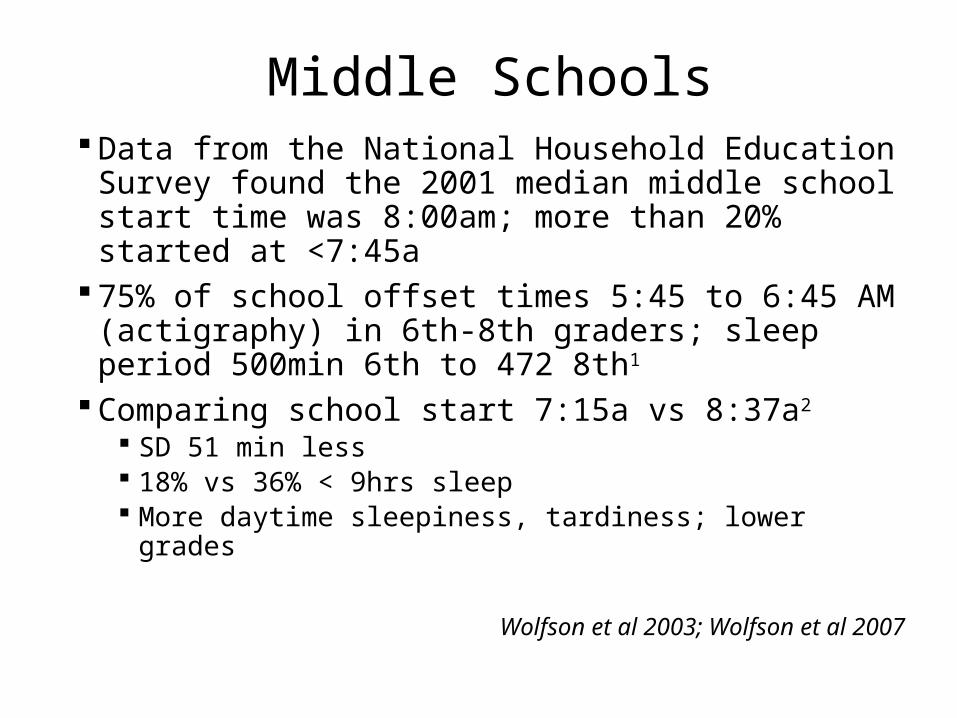
Middle Schools Data from the National Household Education Survey
found the 2001 median middle school start time was 8:00am; more than 20% started at <7:45a
75% of school offset times 5:45 to 6:45 AM (actigraphy) in 6th-8th graders; sleep period 500min 6th to 472 8th1
Comparing school start 7:15a vs 8:37a2
SD 51 min less 18% vs 36% < 9hrs sleep More daytime sleepiness, tardiness; lower grades
Wolfson et al 2003; Wolfson et al 2007
Middle Schools• Recent research shows that delaying school start times for
middle school students is accompanied by positive outcomes similar to those found in high schools, including:
• Later rise times • More school night total sleep • Less daytime sleepiness• Decreased tardiness rates• Improved academic performance• Better performance on computerized attention tasks
Is Federal Legislation the Answer? Congresswoman Zoe Lofgren introduced bill H.R.
1267, "Zs to As Act" (1999, 2003) Initially an “anti-crime, anti-teen pregnancy” bill Bill would provide grants (up to $25,000) to local educational
institutions that agree to begin school for secondary students after 9:00 am
National Petition: Promote legislation to prevent public schools from starting before 8 am
Sponsored by Start School Later: a national coalition working to ensure that all public schools can set hours compatible with health, safety, equity, and learning
Pros and Cons
Requires all school districts to comply, reducing likelihood of scheduling conflicts among schools
Likely to result in faster implementation than “grass roots” approach
Raises awareness of adolescent sleep as critical health issue
School districts may view federal mandate as interfering with local community needs, circumstances, autonomy; risk of backlash
Does not provide support and education for implementation; likelihood of “buy-in”
Is 8am late enough?
A Middle Ground? Advocate for federal funding to:
Establish national tracking system for start times Develop resources to provide support, education and
consultation for school districts contemplating changes Provide financial incentives for schools starting later Fund research to determine barriers, assess outcomes (health/safety,
academic achievement/graduation rates/college attendance, etc) across all types of school districts
Enlist professional organization endorsement (AASM/SBSM, APA, SAM, AAP, etc)
AAP Policy Statement (2014?)
Consider state-wide policies MD legislature passes H.B. 883, "Study of Safe and Healthy School Hours for
Maryland Public Schools," requiring Department of Health and Mental Hygiene to conduct a study of morning bell times (4/4/14)
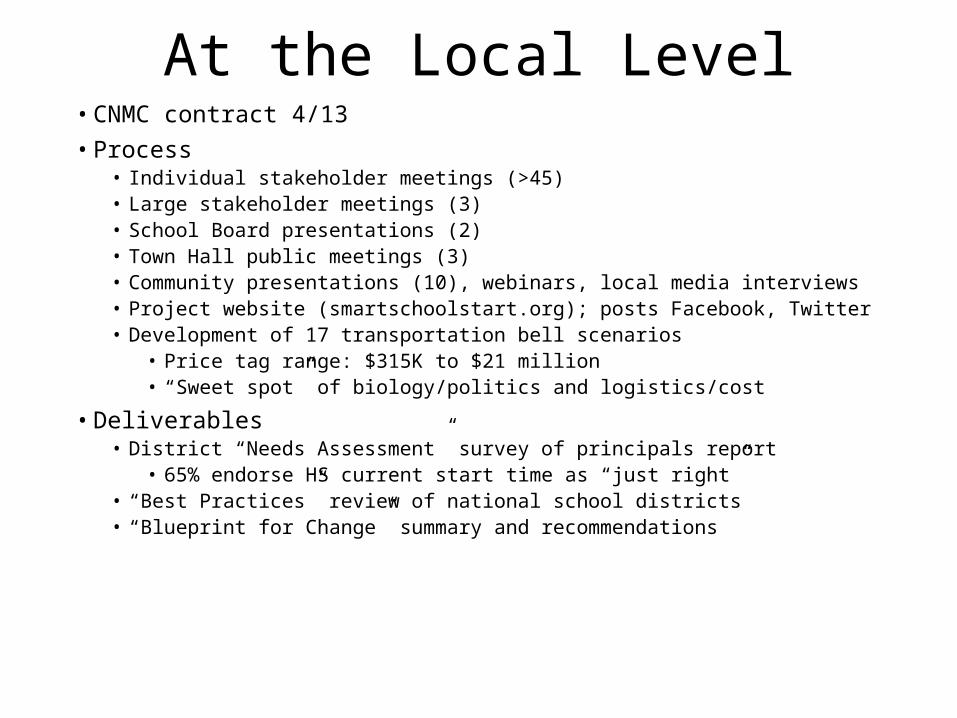
At the Local Level• CNMC contract 4/13• Process
• Individual stakeholder meetings (>45)• Large stakeholder meetings (3)• School Board presentations (2)• Town Hall public meetings (3)• Community presentations (10), webinars, local media interviews• Project website (smartschoolstart.org); posts Facebook, Twitter• Development of 17 transportation bell scenarios
• Price tag range: $315K to $21 million• “Sweet spot” of biology/politics and logistics/cost
• Deliverables• District “Needs Assessment” survey of principals report
• 65% endorse HS current start time as “just right”• “Best Practices” review of national school districts• “Blueprint for Change” summary and recommendations
SSTC: Lessons Learned• District superintendent support and leadership critical• School board involvement key• School leadership (ie, principals) and teacher support vital• Importance of middle/elementary school principal,
teacher, parent involvement• Importance of student engagement• Critical role of community education
• Health, safety and academics
• Critical role of community engagement• Identification and involvement of key stakeholders
SSTC: Lessons Learned• Transportation “drives” the process
• Biggest source of logistical issues and cost• However, may result in cost savings (increased # tiers)
• Critical to allow adequate time for families to become informed and make sufficient plans prior to implementation
• Each community faces different, unique challenges• But you don’t have to “reinvent the wheel”
• Not all students will benefit equally • The goal is to provide “the greatest good for the greatest number of
students”
• Anticipation often worse than reality (impact on athletics, teacher retention, after-school programs, childcare issues)