Page 1
Aberystwyth University
Ruminal bacteria and protozoa composition, digestibility, and amino acid profiledetermined by multiple hydrolysis timesFessenden, S. W.; Hackmann, T. J.; Ross, D. A.; Foskolos, A.; Van Amburgh, M. E.
Published in:Journal of Dairy Science
DOI:10.3168/jds.2016-12531
Publication date:2017
Citation for published version (APA):Fessenden, S. W., Hackmann, T. J., Ross, D. A., Foskolos, A., & Van Amburgh, M. E. (2017). Ruminal bacteriaand protozoa composition, digestibility, and amino acid profile determined by multiple hydrolysis times. Journalof Dairy Science, 100(9), 7211-7226. https://doi.org/10.3168/jds.2016-12531
General rightsCopyright and moral rights for the publications made accessible in the Aberystwyth Research Portal (the Institutional Repository) areretained by the authors and/or other copyright owners and it is a condition of accessing publications that users recognise and abide by thelegal requirements associated with these rights.
• Users may download and print one copy of any publication from the Aberystwyth Research Portal for the purpose of private study orresearch. • You may not further distribute the material or use it for any profit-making activity or commercial gain • You may freely distribute the URL identifying the publication in the Aberystwyth Research Portal
Take down policyIf you believe that this document breaches copyright please contact us providing details, and we will remove access to the work immediatelyand investigate your claim.
tel: +44 1970 62 2400email: [email protected]
Download date: 04. Mar. 2020
Page 2
For Peer Review
Ruminal bacteria and protozoa composition, digestibility
and amino acid profile determined by multiple hydrolysis times.
Journal: Journal of Dairy Science
Manuscript ID JDS-16-12531.R2
Article Type: Research
Date Submitted by the Author: 01-May-2017
Complete List of Authors: Fessenden, Samuel; Cornell University, Animal Science
Hackmann, Timothy; Ohio State University, Interdisciplinary Ph.D. Program in Nutrition Ross, Deborah; cornell university, animal science Foskolos, Andreas; Aberystwyth University , IBERS Van Amburgh, Michael; Cornell University, Animal Science
Key Words: digestibility, amino acid, hyrolysis, ruminal microbes
ScholarOne support: (434) 964 4100
Journal of Dairy Science
Page 3
For Peer Review
RUMEN MICROBIAL COMPOSITION AND DIGESTIBILITY
1
Interpretive summary: 1
Microbial samples from several experiments in lactating dairy cattle were analyzed for nutrient 2
composition, AA composition and digestibility. An in vitro assay was used to determine 3
intestinal availability of individual AA. Multiple time point hydrolysis and least-squares non-4
linear regression was used to determine the AA content of microbial samples, and comparisons 5
were made against single time point hydrolysis. Results indicated that the in vitro assay could 6
demonstrate differences in AA digestibility, and multiple time point hydrolysis likely provide 7
more accurate estimations of the AA profile of omasal bacteria and protozoa for use in field 8
applicable nutrient models. 9
Ruminal bacteria and protozoa composition, digestibility and amino acid profile 10
determined by multiple hydrolysis times. 11
S.W. Fessenden*, T.J. Hackmann†, D.A. Ross*, A. Foskolos*, and M.E. Van Amburgh*1 12
*Department of Animal Science, Cornell University, Ithaca 14850 13
†Department of Animal Sciences, University of Florida, Gainesville 32611 14
ABSTRACT: Microbial samples from 4 independent experiments in lactating dairy cattle were 15
obtained and analyzed for nutrient composition, AA digestibility, and AA profile after multiple 16
hydrolysis times ranging from 2 to 168 h. Similar bacterial and protozoal isolation techniques 17
were used for all isolations. Omasal bacteria and protozoa samples were analyzed for AA 18
digestibility using a new in vitro technique. Multiple time point hydrolysis and least-squares non-19
linear regression were used to determine the AA content of omasal bacteria and protozoa, and 20
equivalency comparisons were made against single time point hydrolysis. Formalin was used in 21
1 experiment, which negatively affected AA digestibility and likely limited the complete release 22
1 Corresponding author: [email protected]
Page 1 of 40
ScholarOne support: (434) 964 4100
Journal of Dairy Science
Page 4
For Peer Review
2
of AA during acid hydrolysis. The mean AA digestibility was 87.8 and 81.6 % for non-formalin 23
treated bacteria and protozoa, respectively. Preservation of microbe samples in formalin likely 24
decreased recovery of several individual AA. Results from the multiple time point hydrolysis 25
indicated that Ile, Val, and Met hydrolyzed at a slower rate compared with other essential AA. 26
Singe time point hydrolysis was found to be non-equivalent to multiple time point hydrolysis 27
when considering biologically important changes in estimated microbial AA profiles. Several 28
AA including Met, Ile, and Val were under-predicted using AA determination after a single 24 h 29
hydrolysis. Models for predicting post-ruminal supply of AA might need to consider potential 30
bias present in post-ruminal AA flow literature when AA determinations are performed after 31
single time point hydrolysis and when using formalin as a preservative for microbial samples. 32
Keywords: amino acid, digestibility, hydrolysis, ruminal bacteria, ruminal protozoa 33
INTRODUCTION 34
Nutrient supply and requirement models such as the Cornel Net Carbohydrate and Protein 35
System (CNCPS) (Higgs et al., 2015; Van Amburgh et al., 2015) and the NRC (NRC, 2001) 36
along with their derivative models predict post ruminal flows of bacterial biomass. Bacterial 37
protein flow is assigned an AA content, AA profile, and a digestibility of individual AA to 38
calculate supply of metabolizable AA. These field applicable models typically use the AA profile 39
of bacteria obtained from the literature (Storm et al., 1983; Clark et al., 1992; Volden and 40
Harstad, 1998), and few account for protozoal AA flows, which can contribute a substantial 41
amount to total microbial AA flow (Dijkstra et al., 1998; Fessenden, 2016). A new, dynamic 42
version of the CNCPS (v. 7; Higgs, 2014; Higgs et al. submitted) utilizes a similar approach in a 43
N based model, and mechanistically accounts for protozoa and endogenous AA contributions to 44
total AA flow in addition to bacteria and feed. To improve this model, accurate representations 45
Page 2 of 40
ScholarOne support: (434) 964 4100
Journal of Dairy Science
Page 5
For Peer Review
3
of the AA content and digestibility of bacterial and protozoal AA were needed to understand 46
sources of error in predictions of particular AA. On an N basis, the predictions of NAN in 47
CNCPS v. 7 were reasonably accurate and precise. However, predictions of individual AA such 48
as Lys, Met, Ile, and Val were biased, likely due to a lack of information about the true content 49
those AA in both microbes and feeds (Higgs, 2014; Higgs et al., submitted). 50
The methods used for isolation of microbial fractions and analysis of AA vary widely across 51
the literature, and much of the data used for nutrition models still rely on older methods where 52
more robust alternatives now exist. An example can be found in the isolation of protozoa, where 53
differential centrifugation has historically been used to isolate microbial cells with significant 54
contamination from bacteria and feed particles. A procedure developed for isolation of 55
cultivatable mixed ruminal protozoa for qPCR and competition studies (Sylvester et al., 2004; 56
2005; Denton et al., 2015) can be used to isolate protozoa for more accurate nutrient analysis. In 57
addition, several of the methods employ the use of formalin in the isolation and storage of 58
microbial and specifically protozoal samples (Martin et al., 1994; Rossi et al., 2013). This might 59
be problematic as formaldehyde is known to react with AA (Barry, 1976). 60
Intestinal digestibility of individual microbial AA has been estimated by several different 61
methods, including regression approaches (Tas et al., 1981; Hvelplund and Hesselholt, 1987), in 62
vitro assays such as the modified 3-step assay (Gargallo et al., 2006), and in vivo assays utilizing 63
the mobile bag technique. In vivo and in vitro procedures relying on retention in bags are largely 64
inadequate, as both indigestible and digestible protein and AA can pass through the pores in the 65
bags resulting in inflated digestibility values. In vivo assays have clear advantages in providing 66
realistic and applicable enzymatic hydrolysis conditions, however they also require surgically 67
altered animal models. The precision-fed cecectomized rooster bioassay was recently applied to 68
Page 3 of 40
ScholarOne support: (434) 964 4100
Journal of Dairy Science
Page 6
For Peer Review
4
ruminal bacteria (Fonseca et al., 2014); however data are still lacking on protozoa AA 69
digestibility. Additionally, avian species have different enzymes and pH conditions which might 70
reduce the ability to make direct comparisons to ruminant digestion (Keller, 1968; Guerino and 71
Baumrucker, 1987). Ross et al. (2013) developed an in vitro assay with ruminal fluid to 72
determine intestinally unavailable N (uN) in ruminant feeds that addressed some issues of non-73
physiologic or species specific enzyme activities, poor retention of small particles, and extensive 74
cannulation procedures. This assay might provide an adequate assessment of intestinal 75
digestibility of ruminal bacteria and protozoa. Considering the ability of formaldehyde to reduce 76
feed protein degradation, it is also possible that the use of formalin in preservation of microbial 77
samples, as reported in Reynal et al. (2003) and others, might reduce the measured intestinal 78
digestibility of microbial AA. An evaluation of the digestibility of unpreserved and formalin 79
preserved samples using the uN assay might simultaneously provide more information on 80
formalin effects on individual microbial AA while testing the ability of the uN assay to detect 81
differences in samples treated with a compound known to decreased digestibility. 82
Amino acid content of feeds and microbes has historically been determined by single time 83
point hydrolysis, as this represents a compromise between maximal release of AA from the 84
matrix while minimizing the loss of acid labile AA (Rutherfurd, 2009). Determination of AA at 85
multiple time points followed by least-squares non-linear regression provides more accurate 86
estimates of the AA profile (Darragh and Moughan, 2005). This approach has been utilized in 87
purified protein (Darragh et al., 1996), milk protein (Rutherfurd et al., 2008) and common animal 88
feedstuffs (Rutherfurd, 2009). Previous work in our laboratory indicated that to obtain the 89
greatest release of branched-chain AA in forages, hydrolysis times needed to be greater than 21 90
Page 4 of 40
ScholarOne support: (434) 964 4100
Journal of Dairy Science
Page 7
For Peer Review
5
hr; while Ile release was greatest at 70 hr (Ross, 2004). To our knowledge, AA determination 91
after multiple hydrolyses times has not been performed on rumen microbial biomass. 92
Given the data from Darragh and Moughan (2005), Rutherfurd (2009) and the observations 93
made in the data from Higgs et al. (submitted), the hypothesis of this study was that the standard 94
method of determination of AA in ruminal bacteria and protozoa using single time point 95
hydrolysis is not equivalent to AA determination after multiple time point hydrolysis and non-96
linear least-squares regression. Additional objectives of this study were to summarize the 97
chemical composition and AA profile of ruminal bacteria and protozoa from high producing 98
lactating dairy cows and to evaluate intestinal digestibility of microbial AA using a newly 99
developed in-vitro assay. 100
101
MATERIALS AND METHODS 102
All cannulated cows used as rumen or omasal fluid donors for the microbial isolations in this 103
experiment were cared for according to the guidelines of the Institutional Animal Care and Use 104
committee appropriate for the university responsible for their care. The committees reviewed and 105
approved the experiment and all procedures carried out in the study. 106
Microbial Isolation Procedures 107
Microbial samples from several independent experiments in lactating dairy cattle were 108
obtained and analyzed for nutrient composition, AA content, and intestinal nutrient and AA 109
digestibility. Bacteria and protozoa included in the analysis were from the following 110
experiments: Trial A: An omasal sampling trial with 8 cows in a 2 treatment switchback design 111
investigating effects of a commercial byproduct feed on omasal nutrient flow (Fessenden, 2016); 112
Page 5 of 40
ScholarOne support: (434) 964 4100
Journal of Dairy Science
Page 8
For Peer Review
6
Trial B: An omasal sampling trial with 12 cows in a 3 treatment Latin Square design 113
investigating the effect of rapidly degradable starch on omasal nutrient flow (Foskolos et al, 114
unpublished data); Trial C: A ruminal N balance and recycling trial with 12 cows in a 3 115
treatment randomized complete block design investigating ruminal N and/or MP deficient diets 116
(Recktenwald, 2010; Recktenwald et al., 2013). One additional protozoal sample was obtained 117
from T. Hackmann at the University of Florida from repeated isolations from the rumen of a 118
lactating dairy cow at the Ohio State University Columbus campus (Trial D). For trials A-C, 119
equal parts DM were combined within microbial type, resulting in a composited sample of 120
bacteria and protozoa from each experiment. Therefore, the possible effects of treatments from 121
trials A – C are not represented in this dataset. Information regarding the chemical composition 122
of the average diet fed to cows in each experiment, along with the number of individual 123
collections and isolations represented by each composited sample are reported in Table 1. Due to 124
limited amount of sample for some trials (D and C) not all analysis were performed on all 125
samples as noted throughout the text. 126
For Trials A and B, microbial samples were obtained using the omasal sampling technique 127
developed by Huhtanen et al. (1997) and adapted by Reynal and Broderick (2005). Samples of 128
whole omasal contents were collected from the omasal canal every 2 h during 3, 8 h intervals. 129
Details of sampling for trial A are described in Fessenden (2016). Trial B sampling occurred per 130
a very similar sampling schedule as Trial A by the same researchers (A. Foskolos and S. 131
Fessenden). Trial C collection methods are described in Recktenwald (2010) and Recktenwald et 132
al. (2013). Trial D protozoa were collected on 4 separate days with 2 separate aliquots filtered 133
per day for 8 aliquots total (T. Hackmann, personal communication). 134
Page 6 of 40
ScholarOne support: (434) 964 4100
Journal of Dairy Science
Page 9
For Peer Review
7
Bacterial isolations for trial A and C were performed according to Whitehouse et al. (1994) 135
with modifications. Briefly; whole omasal contents were filtered through 4 layers of cheesecloth 136
and solids were rinsed once with saline, and the filtrate (I) was treated with formalin (0.1% v/v in 137
final solution) and stored at 4 °C. The solids retained on the cheesecloth were incubated for 1 h 138
at 39 °C in a 0.1% methylcellulose solution, mixed for 1 min at low speed (Omni Mixer, Omni 139
International, Kennesaw, GA) to detach solids associated bacteria, and held at 4°C for 24 h. The 140
contents were then squeezed through 4 layers of cheesecloth and the filtrate (II) was treated with 141
formalin (0.1% v/v in final solution). Filtrates I and II were then combined and centrifuged at 142
1,000 x g for 5 min at 4 °C to remove small feed particles and protozoa. The supernatant was 143
centrifuged at 15,000 x g for 20 min at 4 °C and the bacterial pellet, representing both solid and 144
liquid associated bacteria, was collected and stored at −20 °C until lyophilization and later 145
analysis. Bacterial isolation for trial B followed the same procedure as described above, however 146
formalin was not used. 147
Protozoa from trials A and B were isolated from whole contents using the same procedure as 148
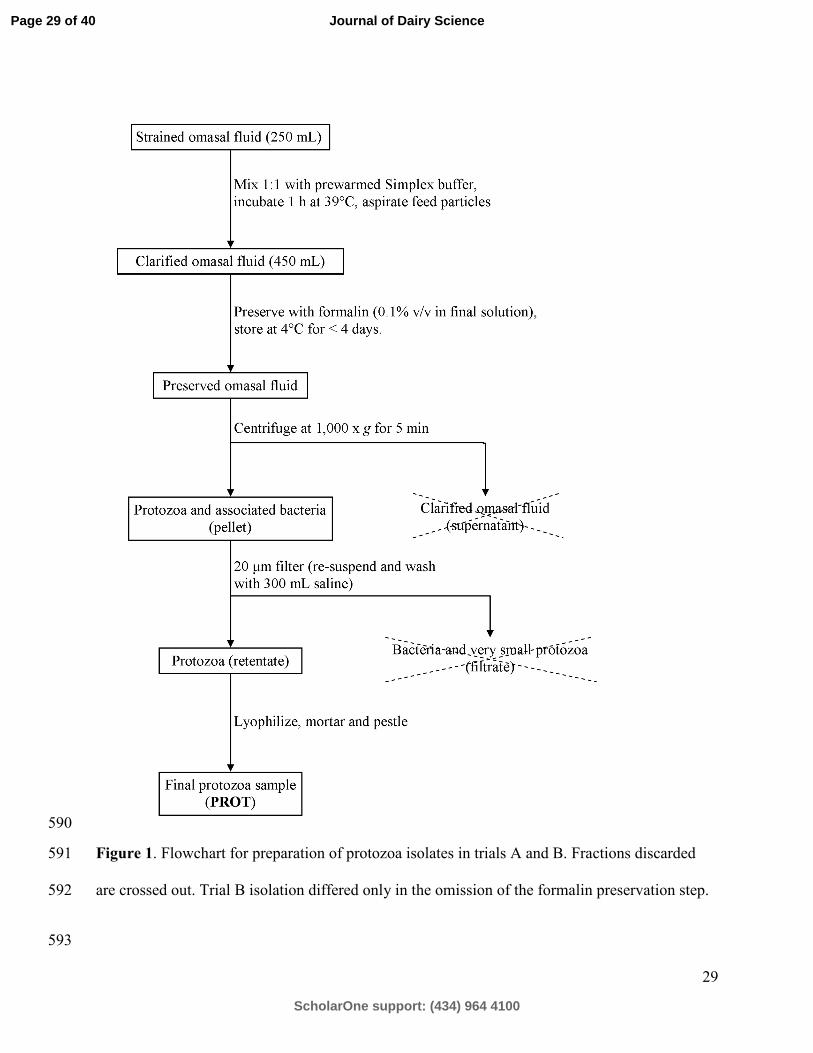
described by Denton et al. (2015) and modified as reported in Fessenden (2016) (Figure 1). The 149
only difference between trials was the omission of formalin and centrifugation in Trial B. The 150
isolations were performed by the same researcher for both trials. Strained omasal fluid (250 mL) 151
was combined 1:1 with pre-warmed, anaerobically prepared Simplex type buffer and added to a 152
pre-warmed separatory funnel. Plant particles were removed by aspiration after 1 h of incubation 153
at 39 °C. Funnel contents were then preserved with formalin (0.1% v/v in final solution) and 154
stored for < 4 d at 4 °C. Preserved contents were centrifuged at 1000 x g for 5 min at 4 °C, the 155
pellet was re-suspended in saline, and protozoa were isolated on a nylon cloth with a 20 µm pore 156
size (14% open area, Sefar, Buffalo, NY). The protozoa isolate was washed several times with 157
Page 7 of 40
ScholarOne support: (434) 964 4100
Journal of Dairy Science
Page 10
For Peer Review
8
saline (500 mL) to reduce bacterial contamination. After isolation, protozoa were stored at −20 158
°C prior to lyophilization. Protozoa from trial C were isolated from strained ruminal fluid by 159
flocculation to remove feed particles followed by preservation with formalin and centrifugation 160
at 500 x g for 5 min at 10°C. The pellet obtained after centrifugation was assumed to be 161
representative of the ruminal protozoa (Recktenwald, 2010). Protozoa isolation from Trial D was 162
performed by T. Hackmann in the laboratory of J. Firkins at the Ohio State University according 163
to Denton et al., (2015) except 25 mL instead of 30 mL or clarified fluid was filtered per 164
isolation. 165
Chemical Analysis and Hydrolysis Times 166
All samples were analyzed for DM after 6 h at 105°C and ash according to AOAC (2005). 167
Total N was determined using a combustion assay (Leco FP-528 N Analyzer, Leco Corp., St. 168
Joseph, MI). Amino acid content of all samples was determined by HPLC following hydrolysis 169
for 24 h at 110°C in a block heater (Gehrke et al., 1985). Trial B bacteria and protozoa were also 170
hydrolyzed for 2, 4, 6, 12, 18, 21, 24, 30, 48, 72, 120 and 168 h to evaluate the rate of release of 171
each AA. The time points chosen were based on a similar analysis performed on milk proteins 172
(Rutherfurd et al., 2008). The entire time course was performed twice for each sample, and the 173
reported values are the mean of the 2 determinations. Insufficient sample amount from trials A, 174
C, and D precluded the multiple time point hydrolysis of samples for AA determination. 175
For all AA excluding Met, Cys, and Trp, a sample containing 2 mg N was weighed into 176
hydrolysis tubes with 25 µL of 250 mM norleucine as an internal standard. Samples were then 177
hydrolyzed as described above with high-purity 6 M HCl (5 mL) after flushing with N2 gas 178
(Mason et al., 1980). For Met and Cys, additional aliquots containing 2 mg N and the internal 179
standard were pre-oxidized with 1 mL performic acid (0.9 mL of 88 % formic acid, 0.1 mL of 180
Page 8 of 40
ScholarOne support: (434) 964 4100
Journal of Dairy Science
Page 11
For Peer Review
9
30% H2O2 and 5 mg phenol) for 16 h at 4°C prior to acid hydrolysis (Elkin and Griffith, 1984). 181
After hydrolysis, tube contents were filtered through Whatman 541 filter paper and filtrate was 182
diluted to 50 mL in a volumetric flask with HPLC grade H2O. Aliquots (0.5 mL) were 183
evaporated at 60°C under constant N2 flushing, with 3 rinses and re-evaporations with HPLC 184
grade H2O to remove acid residues. After final evaporation, the hydrolysate was dissolved in 1 185
mL of Na diluent (Na220, Pickering Laboratories, Mountain View, CA). 186
Individual AA hydrolysates were separated using an Agilent 1100 series HPLC (Agilent 187
Technologies, Santa Clara, CA) fitted with a sodium cation exchange column (Cat. no 188
1154110T, Pikering Laboratories, Mountain View, CA) using a 4 buffer step gradient and 189
column temperature gradient. Detection of separated AA was performed at 560 nm following 190
post-column ninhydrin derivation. Standards (250 nM/mL) for the individual AA were prepared 191
by diluting a pure standard in sample buffer. The volume of sample and standards loaded onto 192
the column was 10 µL. 193
For Trp determination, a separate aliquot of sample containing 2 mg N was hydrolyzed with 194
1.2 g of Ba(OH)2 at 110°C for the same time course as other AA on a block heater according to 195
the method of Landry and Delhaye (1992). Included in the hydrolysis was 125µL of 5-Methyl-196
Trp (5mM) as an internal standard. After cooling to precipitate barium ions, an aliquot (3 µL) of 197
the hydrolysate was added to 1 mL of acetate buffer (0.07 M sodium acetate) an analyzed using 198
fluorescence detection (excitation = 285 nm, emission = 345 nm) after HPLC separation. 199
In vitro Digestibility of N and AA 200
Microbial samples from Trials A and B were analyzed for intestinal digestibility of N and AA 201
according to the assay described by Ross et al. (2013) with minor modifications. The ruminal 202
incubation step was omitted because microbial samples were isolated from the omasum. For each 203
Page 9 of 40
ScholarOne support: (434) 964 4100
Journal of Dairy Science
Page 12
For Peer Review
10
sample, 150 mg of DM was weighed in duplicate into 125 mL Erlenmeyer Flasks and 40 mL of 204
pre-warmed ruminal buffer was added (Van Soest, 2015). Samples were then acidified to a pH of 205
2 with 3M HCl followed by addition of 2 mL of pepsin solution (282 U/mL). After 1 h of 206
incubation at 39°C in a shaking water bath, contents of the flask were neutralized with 2 ml of 2 207
M NaOH. Ten milliliters of enzyme mixture containing trypsin, (24 mg/mL) chymotrypsin, (20 208
mg/mL) amylase, (50 mg/mL) and lipase (4 mg/mL) was then added to the flasks, followed by 209
24 h of incubation at 39°C in a shaking water bath. After incubation, flask contents were filtered 210
on previously tared Whatman 934AH filters under vacuum. Samples were allowed to air dry, 211
followed by drying and storage in a desiccator. Filter + residue weight was then recorded, and 212
DM remaining on the filter was corrected for a blank carried throughout the process. Each filter 213
was cut in half and weighed; with one half used for determination of residual N, while the other 214
half used for AA analysis of the residual material. Determination of residual AA except Trp was 215
performed after 24 h of hydrolysis with pre-oxidation of Met and Cys, as described previously. 216
Insufficient sample N on the filters precluded the determination of Trp on the residues. 217
Calculations and Statistical Analysis 218
Digestibility of DM, N and individual AA was calculated as the disappearance of DM, OM, 219
N or AA after enzymatic hydrolysis, corrected for the procedure blank. Determination of the AA 220
concentration of microbes after multiple hydrolysis times was performed using a method similar 221
to Rutherfurd et al. (2008) and Rutherfurd (2009). Amino acid concentration (mg/g of DM) was 222
plotted against hydrolysis time and a non-linear equation was used to fit the curves to each plot: 223
B�t�=Aoh�e-lh-e-ht�
h-l
Page 10 of 40
ScholarOne support: (434) 964 4100
Journal of Dairy Science
Page 13
For Peer Review
11
where B(t) is the AA concentration at time t, h is the hydrolysis rate (proportion of bound AA 224
hydrolyzed per hour), l is the loss rate (proportion of bound AA destroyed per hour) and Ao is the 225
actual AA content of the protein within the sample. Ao,h and l for each sample were derived from 226
each AA using least-squares non-linear regression with the constraints that Ao > 0, and h > 0. 227
Rutherfurd (2009) utilized an additional term to account for free AA content (analyzed as AA 228
determined before hydrolysis). This was not included in the current model, as free AA in 229
bacterial and protozoal samples was considered to be negligible. 230
The AA profile of Trial B bacteria and protozoa determined using the different hydrolysis 231
methods was compared using two, one-sided paired t-tests (TOST option in the TTEST 232
procedure of SAS version 9.3; SAS Institute, Cary, NC). This procedure, common in bio-233
equivalence testing, allows the researcher to specify biologically relevant differences in means 234
determined by competing methods. In this study, an AA profile difference that would 235
theoretically alter the calculated flow of any individual AA by 6 or more g/d was considered 236
biologically relevant for the following reasons: 1) Commercial AA products fed at 10 g/d (a 237
common minimum feeding rate) provide approximately 6 g metabolizable AA (Whitehouse, 238
2016). 2) With a commonly limiting AA such as Met, a 6 g shift represents a 10% difference in 239
the total supply of 60 g/d. To convert this 6 g/d metabolizable AA value into a relevant change in 240
bacterial or protozoal AA profile (measured in g/100 AA) the following calculations were made: 241
The microbial AA flowing out of the rumen of a lactating dairy cow was assumed to be 242
approximately 1,900 g/d (Reynal et al., 2007; Fessenden, 2016). Assuming 80% of the flow is 243
bacteria AA, and 20 % is protozoa AA (Dijkstra et al., 1998; Fessenden, 2016); this corresponds 244
to 1,520 and 380 g/d of AA for bacteria and protozoa, respectively. Therefore, a 6 g/d change in 245
supply corresponds to 0.4 percentage units (6 g / 1,520 g) and 1.5 percentage units (6 g / 380 g) 246
Page 11 of 40
ScholarOne support: (434) 964 4100
Journal of Dairy Science
Page 14
For Peer Review
12
change in any individual AA in the AA profile of bacteria and protozoa, respectively. In a 247
nutrition modeling context, Fessenden (2016) saw significant improvements in CNCPS 248
predictions of AA flow when similar magnitude changes in AA profile of microbial fractions 249
were evaluated. The bio-equivalency testing framework requires thoughtful interpretation of the 250
results. Emphasis is placed on the comparison of the 90% confidence interval of the mean 251
difference and its comparison the pre-determined biologically relevant ranges defined previously 252
in this section. 253
For AA digestibility, a two-sample t-test was used to compare the digestibility estimates 254
between trials A and B. Only means from trials A and B were analyzed, as limited amount of 255
sample precluded digestibility and multiple hydrolysis time analysis for trials C and D. For all 256
analysis, n=2 for each comparison. 257
RESULTS AND DISCUSSION 258
Microbial Chemical Composition and Digestibility 259
All donor cows were fed diets with fairly similar chemical and nutrient composition (Table 260
1). Diets were typical of the Northeastern and Midwestern US with corn silage and alfalfa silage 261
as the principal forages. Organic matter content in bacteria and protozoa was similar to values 262
obtained previously from ruminal and omasal isolates (Brito et al., 2006; 2007) although OM 263
content is strongly influenced by the isolation procedures used (Martin et al., 1994). Trial A 264
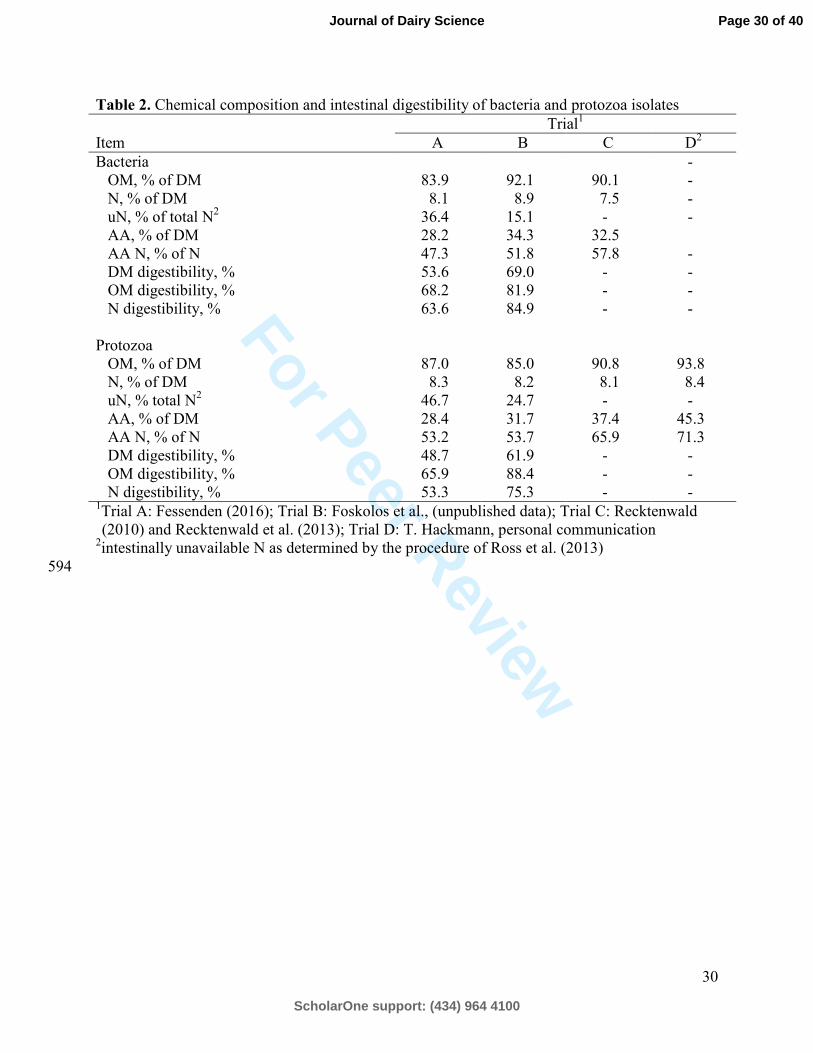
bacteria and protozoa had numerically decreased DM, OM, and N digestibility compared with 265
trial B (Table 2). This is likely due to the use of formalin in trial A vs. trial B, as formaldehyde 266
readily reacts with proteins to form products resistant to digestion (Barry, 1976). While diet and 267
animal differences between trials might also have contributed to observed differences, the 268
direction and magnitude of the difference between trial A and B for OM, DM, and N digestibility 269
Page 12 of 40
ScholarOne support: (434) 964 4100
Journal of Dairy Science
Page 15
For Peer Review
13
suggests formalin treatment is a likely cause of the differences observed. Bacteria isolates had 270
similar AA as a percent of DM, while the lower N content of bacteria from trial C (7.5 %) 271
resulted in AA N contributing more to total N compared with bacteria from trials A and B. 272
Protozoa from trial D had the highest AA N as a % of N. Bacterial AA N values for trials A and 273
B were on the low end of the range (54.9 – 86.7 AA-N, % of total N) reported by Clark et al. 274
(1992). This could be related to the site of sampling as microbes in trials A and B were isolated 275
from omasal contents, while trials C and D were isolated from ruminal contents, which may 276
contribute to different amounts of NAN. Volden et al. (1999b) reported diaminopimelic acid and 277
purines were affected by diet and differed between protozoa and bacterial fractions in the rumen, 278
and similarly, Illg and Stern (1994) noted wide ranges in non-amino N concentration between 279
duodenal and ruminal samples. 280
Microbial isolates averaged 50.6 % and 49% EAA as a % of total AA for bacteria and 281
protozoa, respectively (Table 3). Bacterial isolates from trial B had numerically increased 282
concentrations of Lys and Met, while trials B and D protozoa also demonstrated increased Lys 283
and Met concentrations. For NEAA, bacteria and protozoa isolations were similar among trials 284
with the exception of Tyr, which was reduced in trials A and C. Again, the differences in 285
microbial isolates from trial A and C for individual AA are likely due to formalin treatment. 286
Volden et al. (1999b) reported decreased recoveries of Lys, Met, and Tyr with vs. without 287
formaldehyde treatment in solid and liquid associated bacteria and Whitehouse et al. (1994) 288
reported approximately 20% less Tyr in microbial samples after treatment with formaldehyde. 289
Beyond these differences likely due to formaldehyde treatment, the AA profile of bacteria and 290
protozoa agreed fairly well with literature reports with some exceptions. Methionine averaged 291
3.2 % of total AA among all samples, and was at the high end of the range reported by Clark et 292
Page 13 of 40
ScholarOne support: (434) 964 4100
Journal of Dairy Science
Page 16
For Peer Review
14
al. (1992). The variability of reported AA composition is likely related more to the isolation 293
techniques rather than true differences among microbial populations. Protozoa AA composition 294
has been shown to remain fairly constant among sampling times (Martin et al., 1996; Volden et 295
al., 1999a). Differences among microbial fractions (solid associated bacteria, liquid associated 296
bacteria, and protozoa) have been well documented (Chiquette and Benchaar, 1998; Korhonen et 297
al., 2002); however reasons for the differences are not clear. Procedures used to detach microbes 298
report recoveries ranging from 20 % (Martı́n-Orúe et al., 1998) to 80 % (Whitehouse et al., 299
1994). This might call into question the true ability of recovered bacteria to represent the 300
particle associated bacteria (Korhonen et al., 2002). Ultimately it is likely that differences in 301
isolation methods are responsible for much of the reported ranges of AA composition, while a 302
smaller portion of the variation can be considered a true difference in AA composition (Fonseca 303
et al., 2014). 304
Bacteria and protozoa from Trial A demonstrated decreased digestibility (Table 4) for most 305
AA, which again is likely related directly to formalin treatment. Total bacterial EAA digestibility 306
averaged 74.9 and 88.0 % for trials A and B, respectively (P = 0.01). Protozoa AA digestibility 307
was also likely affected by formalin treatment in trial A, however not all AA were significantly 308
different between trials. Arginine, Leu, Val and Glu all demonstrated decreased digestibility with 309
formalin treatment. The ability of the uN assay to detect differences in digestibility due to 310
formalin treatment indicates the assay might be a useful evaluation tool for other protein 311
containing feedstuffs, especially rumen protected protein supplements. Other techniques such as 312
the mobile bag technique (Hvelplund et al., 1992) and the modified 3-step assay (Gargallo et al., 313
2006) rely on retention of all undigested proteins in bags, and as such, estimates of microbial 314
digestibility of AA from those assays are of limited value due to potential for loss from the bag. 315
Page 14 of 40
ScholarOne support: (434) 964 4100
Journal of Dairy Science
Page 17
For Peer Review
15
The in vivo nature of the mobile bag technique does ensure exposure to idealized enzymatic 316
hydrolysis conditions; however this requires extensively cannulated animals and a significant 317
amount of sample to use the method; something not easily done with isolated omasal microbial 318
samples. Heat damaged blood meal, while relatively soluble and able to pass through pores, can 319
have a very low digestible fraction (Ross et al., 2013). Alternative in vivo techniques such as the 320
precision-fed cecectomized rooster bioassay have been used in ruminant feeds (Titgemeyer et al., 321
1990, Boucher et al., 2009), and Fonseca et al. (2014) recently applied the technique to ruminal 322
bacteria isolates. Total AA digestibility reported by Fonseca et al. (2014) averaged 76%, with a 323
range of 62 % (Cys) to 82 % (Met). The mean AA digestibility in non-formalin treated bacteria 324
in the current trial was 88%, with a range of 84 % (Tyr) to 95 % (Cys). Differences between the 325
studies are likely related to the different enzyme activities and digestive processes between these 326
two methods and the enzyme and pH differences between avian and ruminant digestion (Guerino 327
and Baumrucker, 1987; Parker, 1968; Ross et al., 2013). Storm et al., (1983) calculated a mean 328
intestinal digestibility of 85% (range of 80 to 88 %) in sheep maintained on VFA, minerals and 329
isolated ruminal microorganisms. Mathematical techniques have also been used to estimate 330
digestibility and Tas et al. (1981) utilized a regression approach to estimate true digestibility of 331
rumen bacteria at 87%, while Hvelplund and Hesselholt (1987) reported true AA digestibilities 332
between 80 and 91% for most AA using a similar approach. General agreement between the 333
previously utilized techniques in ruminants and the current application of the assay developed by 334
Ross et al. (2013) suggest that in-vitro uN determination might be useful for future studies of AA 335
digestibility in diverse supplemental protein sources of metabolizable AA. 336
Amino Acid Determination from Multiple Hydrolysis Times 337
Page 15 of 40
ScholarOne support: (434) 964 4100
Journal of Dairy Science
Page 18
For Peer Review
16
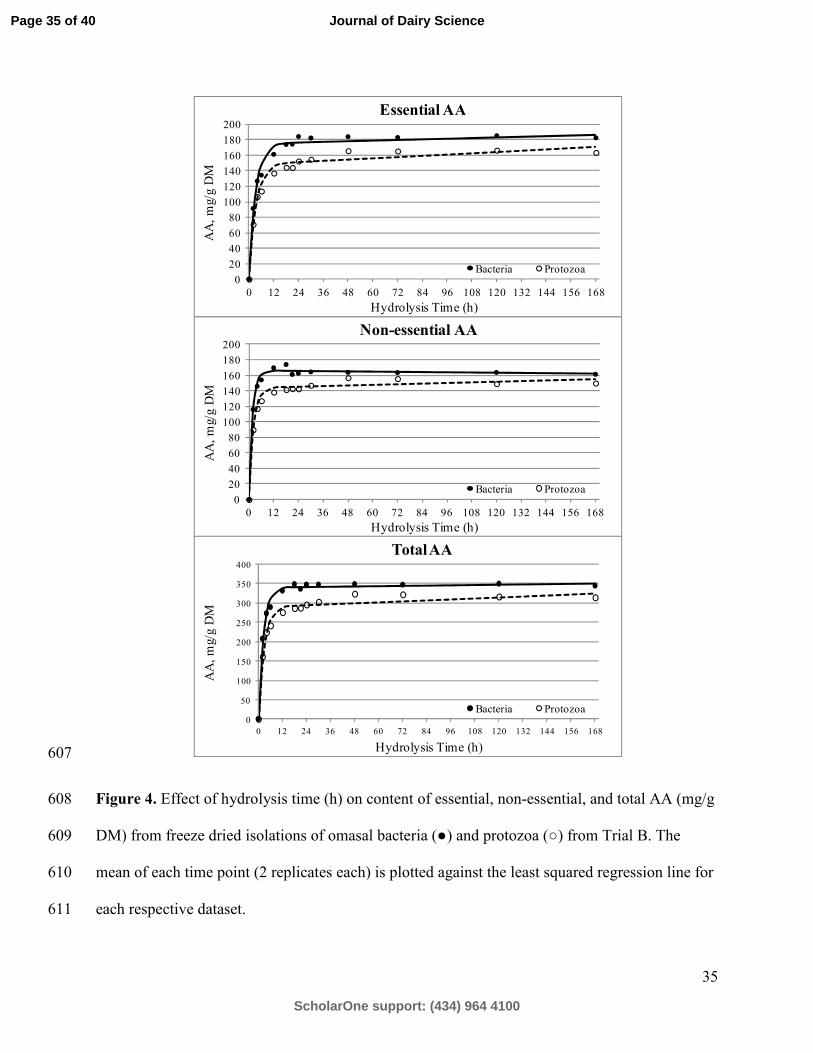
The release of individual AA in trial B bacteria and protozoa are in Figures 2-4. Extraction 338
of Ile, Met, and Val demonstrated greater release over time and thus positive slopes at time 339
points greater than 24 h and hydrolysis rate (h; Table 5) were lowest for these AA. Of the NEAA 340
of the protozoa, Ala, Cys and Pro demonstrated increasing concentrations of AA as hydrolysis 341
time increased. Serine concentrations of bacteria and protozoa decreased markedly after 24 h of 342
hydrolysis as indicated by a relatively high loss rate (l; Table 5). Overall, total AA were 343
hydrolyzed from the sample matrix at a rate of 0.415 and 0.357 mg/h for bacteria and protozoa, 344
respectively. The same least-squares non-linear regression approach has been previously 345
employed in the analysis of other AA containing compounds, including lysozyme (Darragh et al., 346
1996), cat hair (Hendriks et al., 1998), human milk (Darragh and Moughan, 1998) and some 347
common feedstuffs (Rutherfurd, 2009). To our knowledge, no previous work has reported rumen 348
microbial AA content after multiple hydrolysis times. Rutherfurd (2009) reported similarly low h 349
for Ile and Val, while Ser was reported to have the highest l of any AA. 350
The use of multiple hydrolysis times provides some insight into the appropriateness of single 351
time point hydrolysis for AA in rumen microbial samples. While both techniques are simply 352
estimates of the theoretical unknown true AA composition, the regression method has been 353
shown to more accurately estimate the true AA profile in purified proteins (Darragh et al., 1996). 354
The AA profile determined from the regression compared with the value determined at 24 h was 355
used to establish the equivalency of the two methods in relation to biologically relevant ranges 356
(Table 6). This alternative framework of hypothesis testing requires thoughtful interpretation of 357
the results. While some AA may exhibit negligible mean differences between analysis method, 358
such as His and Thr, the interpretation of the 90% CI indicates that they are not equivalent, as the 359
CI lies outside the pre-determined rage of biologically relevant differences. Of the bacterial AA, 360
Page 16 of 40
ScholarOne support: (434) 964 4100
Journal of Dairy Science
Page 19
For Peer Review
17
the 24 h time point method was determined to be not equivalent to the multiple time point 361
hydrolysis method for every AA except Gly. The 90 % CI of the mean difference was greater 362
than ± 1 g/100g AA for Ile, Leu, Met, and Val (Figure 5). The relatively large underestimation of 363
Ile, Met, and Val results in an overestimation of approximately 5% for the rapidly hydrolyzed 364
AA such as Arg, Leu, and Lys. This is similar to the results of Rutherfurd (2009), where soybean 365
meal Ile content was underestimated by 8.4 %, followed by Val (7.0%), Ser (4.6%), and Thr 366
(4.3%). The relatively low range in acceptable equivalence (mean difference of -0.4 to 0.4 367
g/g100 AA for bacteria) serves to emphasize the importance of the AA profile of bacteria on AA 368
supply determinations. 369
Protozoa AA determinations between methods showed more general agreement between 370
hydrolysis methods, largely due to the greater range in equivalence limits (mean difference of -371
1.5 to 1.5 g/100g AA for protozoa). Six of the 10 EAA and 6 of the 8 NEAA were deemed 372
equivalent between methods (Table 7). Similar to the bacterial results, Ile and Met were 373
underestimated (13.4 and 16.5 %, respectively; Figure 6) when determined with a single time 374
point hydrolysis, resulting in over estimation of several other AA, namely Lys and Asp. 375
Implications for AA Predictions in Mathematical Nutritional Models 376
The non-equivalence of the determination methods are important to consider when 377
developing models that rely on AA profiles of microbial protein and feedstuffs. The results from 378
this study and the Rutherfurd (2009) data indicate that specific AA, especially Ile, Leu, Met, and 379
Val could be underestimated in many post-ruminal AA flow studies when utilizing single time 380
point hydrolysis between 21 and 24 h. This consideration should recognized when literature 381
values for AA are used in development and evaluation of nutritional models that seek to 382
accurately predict AA supply, especially those that utilize mechanistic post-absorptive sub-383
Page 17 of 40
ScholarOne support: (434) 964 4100
Journal of Dairy Science
Page 20
For Peer Review
18
models. For example, in this analysis Met was determined to contribute more to total AA than 384
has previously been reported. Currently, the CNCPS v.6.55 uses a profile that corresponds to 385
approximately 1.2% of microbial AA as Met (Higgs et al, 2015; Van Amburgh et al., 2015). 386
Compared with the current analysis (4.7 % of total AA), predictions of AA supply from the 387
model would be expected to increase more than 2 fold (assuming microbial AA accounts for 388
50% of total AA). Adoption of these values will likely result in a re-evaluation of many common 389
ratios and relationships currently used to balance essential AA for lactating cattle. Given the data 390
presented here and by Rutherfurd (2009), this might also be true for many of the EAA. The 391
current data, especially regarding the branched-chain AA, would help explain the prediction bias 392
for those AA observed in CNCPS v.7 despite the relatively good prediction of NAN (Higgs, 393
2014; Higgs et al. submitted). Overall, this analysis illustrates how sensitive nutritional models 394
that rely on microbial AA profiles could be to errors in AA analysis, especially when a single 395
profile accounts for a large portion of the predicted AA supply. Additionally, future studies 396
should evaluate the use of formalin as a microbial preservative if AA analysis or digestibility is 397
considered as an outcome. Model developers should not include any data from procedures that 398
utilize formalin as a microbial preservative, as it will likely lead to biases and poor model 399
evaluation. 400
CONCLUSIONS 401
Microbial composition and digestibility of individual AA are very important for the accurate 402
predictions in many nutrition models used to feed dairy cattle. Previous literature reports have 403
used techniques that have known limitations, while new procedures developed to address these 404
limitations might provide better estimations of key parameters needed to properly characterize 405
metabolizable AA supply. Multiple time point hydrolysis has been shown to improve the 406
Page 18 of 40
ScholarOne support: (434) 964 4100
Journal of Dairy Science
Page 21
For Peer Review
19
determination of AA in feeds, and the technique has been applied here. Digestibility of AA in 407
microbial isolations were measured using a new in vitro technique. While in vivo techniques 408
might better represent the bio-physical condition of the ruminant animal, they can be expensive 409
and rely on surgically altered animals. In vitro digestibility estimates were similar to those 410
reported using previous techniques, and the assay was sensitive to formalin treatment, a process 411
known to reduce bioavailability of proteins. Methionine and branched-chain AA concentration of 412
microbial isolates was higher than previously reported and this might have implications for 413
predicting AA supply in cattle. 414
REFERENCES 415
AOAC International. 2005. Official methods of analysis. 18th ed. AOAC International, 416
Gaithersburg, MD. 417
Barry, T. 1976. The effectiveness of formaldehyde treatment in protecting dietary protein from 418
rumen microbial degradation. Proc Nutr Soc. 35:221-229. 419
http://dx.doi.org/10.1079/PNS19760035 420
Boucher, S. E., S. Calsamiglia, C. M. Parsons, H. H. Stein, M. D. Stern, P. S. Erickson, P. L. 421
Utterback, and C. G. Schwab. 2009. Intestinal digestibility of amino acids in rumen 422
undegradable protein estimated using a precision-fed cecectomized rooster bioassay: I. 423
Soybean meal and SoyPlus. J. Dairy Sci. 92:4489-4498. 424
http://dx.doi.org/10.3168/jds.2008-1884 425
Brito, A. F., G. A. Broderick, and S. M. Reynal. 2006. Effect of varying dietary ratios of alfalfa 426
silage to corn silage on omasal flow and microbial protein synthesis in dairy cows. J. 427
Dairy Sci. 89:3939-3953. http://dx.doi.org/10.3168/jds.S0022-0302(06)72436-5 428
Page 19 of 40
ScholarOne support: (434) 964 4100
Journal of Dairy Science
Page 22
For Peer Review
20
Brito, A. F., G. A. Broderick, and S. M. Reynal. 2007. Effects of different protein supplements 429
on omasal nutrient flow and microbial protein synthesis in lactating dairy cows. J. Dairy 430
Sci. 90:1828-1841. http://dx.doi.org/10.3168/jds.2006-559 doi:10.3168/jds.2006-559 431
Chiquette, J. and C. Benchaar. 1998. Effect of diet and probiotic addition on chemical 432
composition of free or particle-associated bacterial populations of the rumen. Can J. 433
Anim. Sci. 78:115-120. http://dx.doi.org/10.4141/A97-043 434
Clark, J. H., T. H. Klusmeyer, and M. R. Cameron. 1992. Microbial protein synthesis and flows 435
of nitrogen fractions to the duodenum of dairy cows. J. Dairy Sci. 75:2304-2323. 436
http://dx.doi.org/10.3168/jds.S0022-0302(92)77992-2 437
Darragh, A. J., D. J. Garrick, P. J. Moughan, and W. H. Hendriks. 1996. Correction for amino 438
acid loss during acid hydrolysis of a purified protein. Anal. Biochem. 236:199-207. 439
http://dx.doi.org/10.1006/abio.1996.0157 440
Darragh, A. J. and P. J. Moughan. 1998. The amino acid composition of human milk corrected 441
for amino acid digestibility. Br. J. Nutr. 80:25-34. 442
http://dx.doi.org/10.1017/S0007114598001731 443
Darragh, A. J. and P. J. Moughan. 2005. The effect of hydrolysis time on amino acid analysis. J. 444
AOAC Int. 88:888-893. 445
Denton, B. L., L. E. Diese, J. L. Firkins, and T. J. Hackmann. 2015. Accumulation of reserve 446
carbohydrate by rumen protozoa and bacteria in competition for glucose. Appl. Environ. 447
Microbiol. 81:1832-1838. http://dx.doi.org/10.1128/AEM.03736-14. 448
Dijkstra, J., J. France, and S. Tamminga. 1998. Quantification of the recycling of microbial 449
nitrogen in the rumen using a mechanistic model of rumen fermentation processes. J. 450
Agric. Sci. 130:81-94. 451
Page 20 of 40
ScholarOne support: (434) 964 4100
Journal of Dairy Science
Page 23
For Peer Review
21
Elkin, R. and J. Griffith. 1984. Hydrolysate preparation for analysis of amino acids in sorghum 452
grains: effect of oxidative pretreatment. J. AOAC 68:1117-1121. 453
Fessenden, S. W. 2016. Amino acid supply in dairy cattle. Ph.D. Dissertation. Cornell Univ., 454
Ithaca, NY. https://ecommons.cornell.edu/handle/1813/45365 455
Fonseca, A., S. Fredin, L. Ferraretto, C. Parsons, P. Utterback, and R. Shaver. 2014. Short 456
communication: Intestinal digestibility of amino acids in fluid-and particle-associated 457
rumen bacteria determined using a precision-fed cecectomized rooster bioassay. J. Dairy 458
Sci. 97:3855-3859. http://dx.doi.org/10.3168/jds.2013-7880 459
Gargallo, S., S. Calsamiglia, and A. Ferret. 2006. Technical note: A modified three-step in vitro 460
procedure to determine intestinal digestion of proteins. J. Anim. Sci. 84:2163-2167. 461
http://dx.doi.org/10.2527/jas.2004-704 462
Guerino, F. and C. R. Baumrucker. 1987. Methionine and lysine uptake by cattle small intestine 463
in vitro. J. Anim. Sci. 65:619-629. 464
Gehrke, C. W., L. Wall Sr, J. Absheer, F. Kaiser, and R. Zumwalt. 1985. Sample preparation for 465
chromatography of amino acids: acid hydrolysis of proteins. J. AOAC 68:811-821. 466
Hendriks, W., M. Tarttelin, and P. Moughan. 1998. The amino acid composition of cat (Felis 467
catus) hair. Anim. Sci. 67:165-170. http://dx.doi.org/10.1017/S1357729800009905 468
Higgs, R. 2014. Development of a dynamic rumen and gastro-intestinal model in the Cornell Net 469
Carbohydrate and Protein System to predict the nutrient supply and requirements of dairy 470
cattle. Ph.D. Dissertation. Cornell Univ., Ithaca, NY. 471
Higgs, R., L. Chase, D. Ross, and M. Van Amburgh. 2015. Updating the Cornell Net 472
Carbohydrate and Protein System feed library and analyzing model sensitivity to feed 473
inputs. J. Dairy Sci. 98:6340-6360. http://dx.doi.org/10.3168/jds.2015-9379. 474
Page 21 of 40
ScholarOne support: (434) 964 4100
Journal of Dairy Science
Page 24
For Peer Review
22
Huhtanen, P., P. G. Brotz, and L. D. Satter. 1997. Omasal sampling technique for assessing 475
fermentative digestion in the forestomach of dairy cows. J. Anim. Sci. 75:1380-1392. 476
http://dx.doi.org/10.2527/1997.7551380x. 477
Hvelplund, T. and M. Hesselholt. 1987. Digestibility of individual amino acids in rumen 478
microbial protein and undegraded dietary protein in the small intestine of sheep. Acta 479
Agric. Scand. 37:469-477. http://dx.doi.org/10.1080/00015128709436578 480
Hvelplund, T., M. R. Weisbjerg, and L. S. Andersen. 1992. Estimation of the true digestibility of 481
rumen undegraded dietary protein in the small intestine of ruminants by the mobile bag 482
technique. Acta Agric. Scand. A Anim. Sci. 42:34-39. 483
http://dx.doi.org/10.1080/09064709209410106 484
Illg, D. and M. Stern. 1994. In vitro and in vivo comparisons of diaminopimelic acid and purines 485
for estimating protein synthesis in the rumen. Anim. Feed Sci. Technol. 48:49-55. 486
http://dx.doi.org/10.1016/0377-8401(94)90111-2. Vol. V. 487
Keller, P. J. 1968. Pancreatic proteolytic enzymes. American Physiology Society. Handbook of 488
Physiology. Section 6: Alimentary Canal. 122:2605-2628. Wash. D.C. 489
Korhonen, M., S. Ahvenjärvi, A. Vanhatalo, and P. Huhtanen. 2002. Supplementing barley or 490
rapeseed meal to dairy cows fed grass-red clover silage: II. Amino acid profile of 491
microbial fractions. J. Anim. Sci. 80:2188-2196. 492
http://dx.doi.org/10.2527/2002.8082188x 493
Landry, J. and S. Delhaye. 1992. Simplified procedure for the determination of tryptophan of 494
foods and feedstuffs from barytic hydrolysis. J. Agric. Food Chem. 40:776-779. 495
Martı́n-Orúe, S. M., J. Balcells, F. Zakraoui, and C. Castrillo. 1998. Quantification and chemical 496
composition of mixed bacteria harvested from solid fractions of rumen digesta: effect of 497
Page 22 of 40
ScholarOne support: (434) 964 4100
Journal of Dairy Science
Page 25
For Peer Review
23
detachment procedure. Anim. Feed Sci. Technol. 71:269-282. 498
http://dx.doi.org/10.1016/S0377-8401(97)00156-9 499
Martin, C., L. Bernard, and B. Michalet-Doreau. 1996. Influence of sampling time and diet on 500
amino acid composition of protozoal and bacterial fractions from bovine ruminal 501
contents. J. Anim. Sci. 74:1157-1163. http://dx.doi.org/10.2527/1996.7451157x 502
Martin, C., A. G. Williams, and B. Michalet-Doreau. 1994. Isolation and characteristics of the 503
protozoal and bacterial fractions from bovine ruminal contents. J. Anim. Sci. 72:2962-504
2968. http://dx.doi.org/10.2527/1994.72112962x 505
Mason, V. C., S. Bech-Andersen, and M. Rudemo. 1980. Hydrolysate preparation for amino acid 506
determinations in feed constituents. Z Tierphysiol Tierernahr Futtermittelkd. 43:146-164. 507
http://dx.doi.org/10.1111/j.1439-0396.1980.tb00618.x 508
National Research Council. 2001. Nutrient requirements of dairy cattle. 7th revised ed. National 509
Academy Press, Washington, DC. 510
Recktenwald, E. B., D. A. Ross, S. W. Fessenden, C. J. Wall , and M. E. Van Amburgh. 2013. 511
Urea-N recycling in lactating dairy cows fed diets with 2 different levels of dietary crude 512
protein and starch with or without monensin. J. Dairy Sci. 97:1611–1622. 513
http://dx.doi.org/10.3168/jds.2013-7162 514
Recktenwald, E. B. 2010. Urea N recycling and its utilization by ruminal microbial populations 515
in lactating dairy cattle. Ph.D. Dissertation. Cornell Univ., Ithaca, NY. 516
http://hdl.handle.net/1813/17757. 517
Reynal, S. M., G. A. Broderick, S. Ahvenjärvi, and P. Huhtanen. 2003. Effect of feeding protein 518
supplements of differing degradability on omasal flow of microbial and undegraded 519
Page 23 of 40
ScholarOne support: (434) 964 4100
Journal of Dairy Science
Page 26
For Peer Review
24
protein. J. Dairy Sci. 86:1292-1305. http://dx.doi.org/10.3168/jds.S0022-0302(03)73713-520
8. 521
Reynal, S. M. and G. A. Broderick. 2005. Effect of dietary level of rumen-degraded protein on 522
production and nitrogen metabolism in lactating dairy cows. J. Dairy Sci. 88:4045-4064. 523
http://dx.doi.org/10.3168/jds.S0022-0302(05)73090-3. 524
Reynal, S. M., I. R. Ipharraguerre, M. Lineiro, A. F. Brito, G. A. Broderick, and J. H. Clark. 525
2007. Omasal flow of soluble proteins, peptides, and free amino acids in dairy cows fed 526
diets supplemented with proteins of varying ruminal degradabilities. J. Dairy Sci. 527
90:1887-1903. http://dx.doi.org/10.3168/jds.2006-158. 528
Ross, D. A. 2013. Methods to analyze feeds for nitrogen fractions and digestibility for ruminants 529
with application for the CNCPS. Ph.D. dissertation. Cornell University, Ithaca, NY. 530
https://ecommons.cornell.edu/handle/1813/33993 531
Ross, D. A., M. Gutierrez-Botero, and M. E. Van Amburgh. 2013. Development of an in-vitro 532
intestinal digestibility assay for ruminant feeds. Pages 190-202 in Proc. Cornell Nutrition 533
Conference, Syracuse, NY. Cornell University, Ithaca, NY. 534
Ross, D. A. 2004. Amino acid composition of ruminant feeds and feed fractions and evaluation 535
of the methods used to obtain the insoluble and true precipitate protein fractions of 536
feedstuffs. M.S. Thesis. Cornell University. Ithaca, NY 537
Rossi, M. F., I. Martinele and M. D’Agosto. 2013. Quantitative and differential analysis of ciliate 538
protozoa in rumen content samples filtered before and after fixation. R. Bras. Zootec. 539
42:831-834. http://dx.doi.org/10.1590/S1516-35982013001100010 540
Rutherfurd, S. M. 2009. Accurate determination of the amino acid content of selected feedstuffs. 541
Int. J. Food Sci. Nutr. 60:53-62. http://dx.doi.org/10.1080/09637480802269957 542
Page 24 of 40
ScholarOne support: (434) 964 4100
Journal of Dairy Science
Page 27
For Peer Review
25
Rutherfurd, S. M., P. J. Moughan, D. Lowry, and C. G. Prosser. 2008. Amino acid composition 543
determined using multiple hydrolysis times for three goat milk formulations. Int. J. Food 544
Sci. Nutr. 59:679-690. http://dx.doi.org/10.1080/09637480701705424 545
Storm, E., D. S. Brown, and E. R. Ørskov. 1983. The nutritive value of rumen micro-organisms 546
in ruminants 3. The digestion of microbial amino and nucleic acids in, and losses of 547
endogenous nitrogen from, the small intestine of sheep. Br. J. Nutr. 50:479-485. 548
Sylvester, J. T., S. K. Karnati, Z. Yu, M. Morrison, and J. L. Firkins. 2004. Development of an 549
assay to quantify rumen ciliate protozoal biomass in cows using real-time PCR. J. Nutr. 550
134:3378-3384. 551
Sylvester, J. T., S. K. R. Karnati, Z. Yu, C. J. Newbold, and J. L. Firkins. 2005. Evaluation of a 552
real-time PCR assay quantifying the ruminal pool size and duodenal flow of protozoal 553
nitrogen. J. Dairy Sci. 88:2083-2095. http://dx.doi.org/10.3168/jds.S0022-554
0302(05)72885-X 555
Tas, M., R. Evans, and R. Axford. 1981. The digestibility of amino acids in the small intestine of 556
the sheep. Br. J. Nutr. 45:167-174. https://doi.org/10.1079/BJN19810089 557
Titgemeyer, E., N. Merchen, Y. Han, C. Parsons, and D. Baker. 1990. Assessment of intestinal 558
amino acid availability in cattle by use of the precision-fed cecectomized rooster assay. J. 559
Dairy Sci. 73:690-693. http://dx.doi.org/10.3168/jds.S0022-0302(90)78721-8 560
Van Amburgh, M., E. Collao-Saenz, R. Higgs, D. Ross, E. Recktenwald, E. Raffrenato, L. 561
Chase, T. Overton, J. Mills, and A. Foskolos. 2015. The Cornell Net Carbohydrate and 562
Protein System: Updates to the model and evaluation of version 6.5. J. Dairy Sci. 563
98:6361-6380. http://dx.doi.org/10.3168/jds.2015-9378. 564
Page 25 of 40
ScholarOne support: (434) 964 4100
Journal of Dairy Science
Page 28
For Peer Review
26
Van Soest, P. J. 2015. The Detergent System for Analysis of Foods and Feeds. Cornell 565
University, Ithaca, NY. ISBN 9781630951344. 566
Volden, H. and O. M. Harstad. 1998. Amino acid composition of bacteria harvested from the 567
rumen of dairy cows fed three diets differing in protein content and rumen protein 568
degradability at two levels of intake. Acta Agric. Scand. A Anim. Sci. 48:210-215. 569
http://dx.doi.org/10.1080/09064709809362422. 570
Volden, H., O. M. Harstad, and L. T. Mydland. 1999a. Amino acid content and profile of 571
protozoal and bacterial fractions isolated from ruminal contents of lactating dairy cows 572
fed diets differing in nitrogen supplementation. Acta Agric. Scand. A Anim. Sci. 49:245-573
250. http://dx.doi.org/10.1080/090647099424006. 574
Volden, H., L. T. Mydland, and O. M. Harstad. 1999b. Chemical composition of protozoal and 575
bacterial fractions isolated from ruminal contents of dairy cows fed diets differing in 576
nitrogen supplementation. Acta Agric. Scand. A Anim. Sci. 49:235-244. 577
http://dx.doi.org/10.1080/090647099423999 578
Whitehouse, N., V. Olson, C. Schwab, W. Chesbrot, K. Cunningham, and T. Lykos. 1994. 579
Improved techniques for dissociating particle-associated mixed ruminal microorganisms 580
from ruminal digesta solids. J. Anim. Sci 72:1335-1343. 581
http://dx.doi.org/10.2527/1994.7251335x. 582
Whitehouse, N. L. 2016. Using the plasma free amino acid dose response method to determine 583
metabolizable protein concentrations of lysine and methionine in rumen protected 584
supplements. PhD dissertation. Univ. New Hampshire, 2016. 585
http://pqdtopen.proquest.com/pubnum/10248580.html?FMT=AI. 586
587
Page 26 of 40
ScholarOne support: (434) 964 4100
Journal of Dairy Science
Page 29
For Peer Review
27
Table 1. Donor cow diet ingredient and chemical composition, intake, and milk production Trial1 Item A B C D2 Number of isolations in each sample: 72 108 NA 8 Diet ingredient composition
Corn silage 44.0 28.6 45.6 45.3 Haycrop silage 12.0 22.9 - 13.8 Wheat straw - - 2.1 - Corn meal 12.0 28.6 11.1 12.5 Barley grain, ground - - 6.2 - Soybean meal - - 4.5 8.6 Canola meal - 9.2 - - Rumen protected soybean meal 8.2 - 3.8 2.1 Commercial fermentation byproduct 1.5 - - - Corn distillers - - - 3.8 Cottonseed - - 8.4 6.4 Wheat middlings 3.4 - - 2.8 Soybean hulls 5.8 5.5 - - Citrus pulp 3.3 1.0 7.3 - Sugar - - 2.2 - Molasses 0.9 - - - Fatty acid supplement 1.2 0.6 - 1.0 Blood meal 1.7 1.4 1.1 - Minerals, vitamins, and additives 6.2 2.2 7.7 3.7
Diet chemical composition
OM, % of DM 93.9 92.6 92.5 91.8 CP, % of DM 16.0 16.9 14.8 16.3 Soluble protein, % of CP 35.7 43.7 31.9 34.1 RDP, % of CP3 51.9 59.8 54.3 62.0 aNDFom, % of DM 31.1 30.6 33.6 32.1 ADF, % of DM 19.8 20.5 NA 20.2 ADL, % of DM 3.0 3.4 1.9 3.1 Sugars, % of DM 5.4 3.5 5.4 2.8 Starch, % of DM 27.6 27.9 25.4 26.7 Ether extract, % of DM 4.9 3.9 4.5 5.6 ME, Mcal/kg3 2.5 2.6 2.7 2.6
Cattle intake and production
Dry matter intake, kg/d 27.3 26.1 23.8 NA Milk production, kg/d 41.7 41.6 30.9 NA
1Trial A: Fessenden (2016); Trial B: Foskolos et al., (unpublished data); Trial C: Recktenwald (2010) and Recktenwald et al. (2013); Trial D: T. Hackmann, personal communication
2Chemical composition estimated using CNCPS v. 6.55 using diet ingredient composition 3Metabolizable energy predicted using CNCPS v. 6.55
Page 27 of 40
ScholarOne support: (434) 964 4100
Journal of Dairy Science
Page 30
For Peer Review
28
588
589
Page 28 of 40
ScholarOne support: (434) 964 4100
Journal of Dairy Science
Page 31
For Peer Review
29
590
Figure 1. Flowchart for preparation of protozoa isolates in trials A and B. Fractions discarded 591
are crossed out. Trial B isolation differed only in the omission of the formalin preservation step. 592
593
Page 29 of 40
ScholarOne support: (434) 964 4100
Journal of Dairy Science
Page 32
For Peer Review
30
Table 2. Chemical composition and intestinal digestibility of bacteria and protozoa isolates Trial1 Item A B C D2 Bacteria -
OM, % of DM 83.9 92.1 90.1 - N, % of DM 8.1 8.9 7.5 - uN, % of total N2 36.4 15.1 - - AA, % of DM 28.2 34.3 32.5 AA N, % of N 47.3 51.8 57.8 - DM digestibility, % 53.6 69.0 - - OM digestibility, % 68.2 81.9 - - N digestibility, % 63.6 84.9 - -
Protozoa OM, % of DM 87.0 85.0 90.8 93.8 N, % of DM 8.3 8.2 8.1 8.4 uN, % total N2 46.7 24.7 - - AA, % of DM 28.4 31.7 37.4 45.3 AA N, % of N 53.2 53.7 65.9 71.3 DM digestibility, % 48.7 61.9 - - OM digestibility, % 65.9 88.4 - - N digestibility, % 53.3 75.3 - -
1Trial A: Fessenden (2016); Trial B: Foskolos et al., (unpublished data); Trial C: Recktenwald (2010) and Recktenwald et al. (2013); Trial D: T. Hackmann, personal communication
2intestinally unavailable N as determined by the procedure of Ross et al. (2013) 594
Page 30 of 40
ScholarOne support: (434) 964 4100
Journal of Dairy Science
Page 33
For Peer Review
31
Table 3. Amino acid profile (% of total AA) of microbial isolates using a 24 h hydrolysis time. Bacteria AA Protozoa AA Trial1 Trial1 Item A B C D A B C D Essential AA
Arg 5.4 5.0 5.0 - 5.5 5.4 5.4 4.7 His 2.1 2.1 2.0 - 2.9 2.5 2.3 2.0 Ile 5.0 4.0 4.9 - 4.7 3.8 5.7 5.5 Leu 4.8 5.6 6.8 - 5.5 6.1 4.6 4.2 Lys 4.7 7.5 4.8 - 5.7 8.8 5.3 10.2 Met 3.3 4.5 2.6 - 2.7 3.1 2.1 3.8 Phe 6.6 6.0 6.8 - 7.4 6.5 7.3 7.6 Thr 6.3 5.7 5.4 - 5.4 4.8 6.1 4.7 Trp 5.7 5.5 5.3 - 4.6 4.5 3.1 1.4 Val 6.7 5.9 5.6 - 5.7 4.7 4.7 4.7
Total EAA 50.8 51.9 49.3 - 50.1 50.2 46.5 48.8
Non-essential AA Ala 7.9 6.9 6.7 - 5.9 5.1 4.7 4.0 Asp 12.2 11.1 8.8 - 11.8 10.8 12.1 11.6 Cys 1.4 1.5 1.1 - 2.0 2.1 1.7 2.2 Glu 12.4 11.3 13.0 - 14.0 13.6 15.2 13.6 Gly 5.7 4.9 5.2 - 4.7 4.5 4.3 4.0 Pro 2.1 2.0 6.9 - 2.7 3.0 7.9 5.6 Ser 5.5 4.6 5.4 - 5.3 5.4 5.5 4.2 Tyr 2.0 6.0 3.5 - 3.5 5.4 2.0 6.1
Total NEAA 49.2 48.1 50.7 - 49.9 49.8 53.5 51.2 1Trial A: Fessenden (2016); Trial B: Foskolos et al., (unpublished data); Trial C: Recktenwald (2010) and Recktenwald et al. (2013); Trial D: T. Hackmann, personal communication
595
Page 31 of 40
ScholarOne support: (434) 964 4100
Journal of Dairy Science
Page 34
For Peer Review
32
Table 4. Intestinal digestibility (% of AA) of AA of omasal bacteria and protozoa Bacteria Protozoa Trial1 Trial1
Item A B SEM P A B SEM P
Essential AA Arg 74.0 88.2 0.9 0.03 69.0 89.0 0.4 0.01 His 78.4 90.7 1.9 0.03 69.7 70.9 11.9 0.93 Ile 76.8 88.9 0.6 0.00 75.3 85.7 3.0 0.08 Leu 78.5 92.2 1.5 0.01 74.3 92.5 1.1 0.01 Lys 75.5 91.0 1.8 0.02 68.2 77.5 12.6 0.54 Met 80.7 88.8 1.0 0.07 78.4 90.1 0.9 0.17 Phe 69.0 83.2 1.2 0.01 67.5 79.7 2.7 0.06 Thr 76.3 89.8 1.1 0.01 73.5 79.2 9.3 0.61 Trp - - - - - - - - Val 69.9 88.0 4.0 0.05 63.2 83.3 3.8 0.04
Total EAA 74.9 88.0 1.4 0.01 70.6 82.8 4.4 0.11
Non-essential AA Ala 72.5 87.2 2.2 0.02 67.5 80.1 6.6 0.20 Asp 77.5 90.8 1.2 0.01 75.8 86.3 5.0 0.18 Cys 82.1 94.8 0.7 0.05 89.3 93.6 1.7 0.15 Glu 68.5 85.2 3.6 0.04 67.5 87.7 0.8 0.01 Gly 69.4 85.8 3.7 0.05 63.5 72.8 13.4 0.56 Pro 77.9 88.4 1.4 0.10 78.1 80.7 4.7 0.66 Ser 75.0 89.3 1.3 0.01 71.9 56.7 33.6 0.70 Tyr 34.0 84.3 0.4 0.00 55.9 73.8 4.5 0.06
Total NEAA 71.6 87.5 1.9 0.02 70.2 80.2 7.6 0.32 Total AA 73.3 87.8 1.7 0.01 70.4 81.6 6.0 0.21 1Trial A: Fessenden (2016); Trial B: Foskolos et al., (unpublished data); Trial C: Recktenwald (2010) and Recktenwald et al. (2013); Trial D: T. Hackmann, personal communication. n=2 for each comparison
596
597
Page 32 of 40
ScholarOne support: (434) 964 4100
Journal of Dairy Science
Page 35
For Peer Review
33
598
Figure 2. Effect of hydrolysis time (h) on content of essential AA (mg/g DM) from freeze dried 599
isolations of omasal bacteria (●) and protozoa (○) from Trial B. The mean of each time point (2 600
replicates each) is plotted against the least squared regression line for each respective dataset. 601
0
5
10
15
20
0 12 24 36 48 60 72 84 96 108 120 132 144 156 168
AA
, mg/
g D
M
Hydrolysis Time (h)
Arg
Bacteria Protozoa0
2
4
6
8
10
0 12 24 36 48 60 72 84 96 108 120 132 144 156 168
AA
, mg/
g D
M
Hydrolysis Time (h)
His
Bacteria Protozoa
0
5
10
15
20
0 12 24 36 48 60 72 84 96 108 120 132 144 156 168
AA
, mg/
g D
M
Hydrolysis Time (h)
Ile
Bacteria Protozoa0
5
10
15
20
25
30
0 12 24 36 48 60 72 84 96 108 120 132 144 156 168
AA
, mg/
g D
M
Hydrolysis Time (h)
Leu
Bacteria Protozoa
0
5
10
15
20
25
30
0 12 24 36 48 60 72 84 96 108 120 132 144 156 168
AA
, mg/
g D
M
Hydrolysis Time (h)
Lys
Bacteria Protozoa0
5
10
15
20
0 12 24 36 48 60 72 84 96 108 120 132 144 156 168
AA
, mg/
g D
M
Hydrolysis Time (h)
Met
Bacteria Protozoa
0
5
10
15
20
25
0 12 24 36 48 60 72 84 96 108 120 132 144 156 168
AA
, mg/
g D
M
Hydrolysis Time (h)
Phe
Bacteria Protozoa0
5
10
15
20
25
0 12 24 36 48 60 72 84 96 108 120 132 144 156 168
AA
, mg/
g D
M
Hydrolysis Time (h)
Thr
Bacteria Protozoa
0
5
10
15
20
25
0 12 24 36 48 60 72 84 96 108 120 132 144 156 168
AA
, mg/
g D
M
Hydrolysis Time (h)
Trp
Bacteria Protozoa0
5
10
15
20
25
30
0 12 24 36 48 60 72 84 96 108 120 132 144 156 168
AA
, mg/
g D
M
Hydrolysis Time (h)
Val
Bacteria Protozoa
Page 33 of 40
ScholarOne support: (434) 964 4100
Journal of Dairy Science
Page 36
For Peer Review
34
602
Figure 3. Effect of hydrolysis time (h) on content of non-essential AA (mg/g DM) from freeze 603
dried isolations of omasal bacteria (●) and protozoa (○) from Trial B. The mean of each time 604
point (2 replicates each) is plotted against the least squared regression line for each respective 605
dataset. 606
0
5
10
15
20
25
30
0 12 24 36 48 60 72 84 96 108 120 132 144 156 168
AA
, mg/
g DM
Hydrolysis Time (h)
Ala
Bacteria Protozoa0
10
20
30
40
50
0 12 24 36 48 60 72 84 96 108 120 132 144 156 168
AA
, mg/
g DM
Hydrolysis Time (h)
Asp
Bacteria Protozoa
0
1
2
3
4
5
6
7
8
0 12 24 36 48 60 72 84 96 108 120 132 144 156 168
AA
, mg/
g DM
Hydrolysis Time (h)
Cys
Bacteria Protozoa0
10
20
30
40
50
0 12 24 36 48 60 72 84 96 108 120 132 144 156 168
AA
, mg/
g DM
Hydrolysis Time (h)
Glu
Bacteria Protozoa
0
5
10
15
20
0 12 24 36 48 60 72 84 96 108 120 132 144 156 168
AA
, mg/
g D
M
Hydrolysis Time (h)
Gly
Bacteria Protozoa0
2
4
6
8
10
12
0 12 24 36 48 60 72 84 96 108 120 132 144 156 168
AA
, mg/
g D
M
Hydrolysis Time (h)
Pro
Bacteria Protozoa
0
5
10
15
20
0 12 24 36 48 60 72 84 96 108 120 132 144 156 168
AA
, mg/
g DM
Hydrolysis Time (h)
Ser
Bacteria Protozoa0
5
10
15
20
25
0 12 24 36 48 60 72 84 96 108 120 132 144 156 168
AA
, mg/
g DM
Hydrolysis Time (h)
Tyr
Bacteria Protozoa
Page 34 of 40
ScholarOne support: (434) 964 4100
Journal of Dairy Science
Page 37
For Peer Review
35
607
Figure 4. Effect of hydrolysis time (h) on content of essential, non-essential, and total AA (mg/g 608
DM) from freeze dried isolations of omasal bacteria (●) and protozoa (○) from Trial B. The 609
mean of each time point (2 replicates each) is plotted against the least squared regression line for 610
each respective dataset. 611
0
20
40
60
80
100
120
140
160
180
200
0 12 24 36 48 60 72 84 96 108 120 132 144 156 168
AA
, mg/
g D
M
Hydrolysis Time (h)
Essential AA
Bacteria Protozoa
0
20
40
60
80
100
120
140
160
180
200
0 12 24 36 48 60 72 84 96 108 120 132 144 156 168
AA
, mg/
g D
M
Hydrolysis Time (h)
Non-essential AA
Bacteria Protozoa
0
50
100
150
200
250
300
350
400
0 12 24 36 48 60 72 84 96 108 120 132 144 156 168
AA
, mg/
g D
M
Hydrolysis Time (h)
Total AA
Bacteria Protozoa
Page 35 of 40
ScholarOne support: (434) 964 4100
Journal of Dairy Science
Page 38
For Peer Review
36
612
Table 5. Rate of hydrolysis (h)1 and loss (l)2 for individual and total AA from omasal bacteria and protozoa isolates from Trial B. Values are presented as the mean (SEM). Bacteria Protozoa Item h (h-1) l (h-1) h (h-1) l (h-1)
Essential AA Arg 0.414 (0.045) 0.00039 (0.00078) 0.303 (0.027) -0.00025 (0.00001) His 0.577 (0.222) -0.00027 (0.00048) 0.409 (0.110) 0.00026 (0.00038) Ile 0.107 (0.037) -0.00054 (0.00080) 0.106 (0.007) -0.00122 (0.00034) Leu 0.323 (0.019) -0.00037 (0.00086) 0.217 (0.002) -0.00162 (0.00060) Lys 0.421 (0.017) -0.00012 (0.00034) 0.333 (0.026) -0.00016 (0.00051) Met 0.234 (0.079) -0.00097 (0.00008) 0.198 (0.100) -0.00112 (0.00041) Phe 0.782 (0.193) -0.00050 (0.00108) 0.529 (0.286) -0.00052 (0.00086) Thr 0.323 (0.056) 0.00077 (0.00007) 0.318 (0.030) 0.00015 (0.00042) Trp 0.283 (0.196) 0.00054 (0.00090) 0.332 (0.303) -0.00072 (0.00122) Val 0.312 (0.054) -0.00054 (0.00055) 0.169 (0.021) -0.00153 (0.00003)
Total EAA 0.303 (0.009) -0.00038 (0.00022) 0.287 (0.002) -0.00084 (0.00033)
Non-essential AA Ala 0.571 (0.183) 0.00001 (0.00063) 0.658 (0.132) -0.00156 (0.00100) Asp 0.523 (0.057) 0.00014 (0.00039) 0.548 (0.168) -0.00044 (0.00077) Cys 0.377 (0.035) -0.00035 (0.00005) 0.429 (0.125) -0.00070 (0.00023) Glu 0.550 (0.027) -0.00019 (0.00005) 0.397 (0.060) -0.00048 (0.00118) Gly 0.599 (0.174) -0.00049 (0.00020) 0.541 (0.030) -0.00081 (0.00009) Pro 0.324 (0.115) 0.00018 (0.00021) 0.304 (0.014) -0.00081 (0.00045) Ser 0.622 (0.097) 0.00218 (0.00049) 0.418 (0.011) 0.00198 (0.00079) Tyr 0.804 (0.254) 0.00036 (0.00024) 0.328 (0.476) -0.00046 (0.00038)
Total NEAA 0.568 (0.112) 0.00014 (0.00024) 0.447 (0.107) -0.00045 (0.00075) Total AA 0.415 (0.048) -0.00018 (0.00021) 0.357 (0.037) -0.00067 (0.00054) 1proportion of bound AA hydrolyzed per hour. 2proportion of bound AA destroyed per hour.
Page 36 of 40
ScholarOne support: (434) 964 4100
Journal of Dairy Science
Page 39
For Peer Review
37
Table 6. Comparison of the AA composition (g/100 g AA) of omasal bacteria from trial B1 determined using multiple hydrolysis time point or single hydrolysis time point methods. Method 90 % CI AA Single Multiple S - M SED2 Lower Upper EQ Essential AA Arg 5.00 4.73 0.27 0.03 0.06 0.48 No His 2.12 2.11 0.01 0.14 -0.85 0.86 No Ile 4.05 4.62 -0.58 0.46 -3.46 2.31 No Leu 5.60 5.32 0.28 0.26 -1.35 1.91 No Lys 7.54 7.17 0.37 0.04 0.11 0.63 No Met 4.49 4.63 -0.14 0.36 -2.41 2.13 No Phe 6.00 5.77 0.23 0.09 -0.31 0.77 No Thr 5.49 5.53 -0.04 0.10 -0.69 0.60 No Trp 5.97 5.77 0.20 0.03 -0.01 0.41 No Val 5.92 6.32 -0.41 0.32 -2.41 1.60 No Non-essential AA Ala 6.88 6.94 -0.06 0.21 -1.36 1.24 No Asp 11.06 10.79 0.28 0.03 0.05 0.50 No Cys 1.45 1.40 0.05 0.07 -0.40 0.51 No Glu 11.26 11.06 0.21 0.58 -3.45 3.86 No Gly 4.86 4.83 0.02 0.02 -0.10 0.15 Yes Pro 2.03 1.91 0.12 0.16 -0.89 1.12 No Ser 4.58 4.89 -0.31 0.44 -3.06 2.44 No Tyr 5.71 5.65 0.06 0.13 -0.76 0.89 No 1Trial B: Foskolos et al., (unpublished data). n=2 for all comparisons. 2Standard error of the difference. 2Equivalence determined from 2 one-sided paired t-tests. Methods deemed to be equivalent if 90% CI falls within defined equivalency of -0.4 to 0.4 g/100g of AA.
613
614
Page 37 of 40
ScholarOne support: (434) 964 4100
Journal of Dairy Science
Page 40
For Peer Review
38
615
Figure 5. Equivalency chart for difference in AA composition (g/100 g AA) of Trial B bacteria 616
determined using multiple vs. single time point hydrolysis methods. Open circles (○) represent 617
the mean difference and error bars represent the 90% confidence interval around the mean 618
difference. Shaded region represents equivalency defined as -0.4 to 0.4 g/100 g bacterial AA. 619
620
-5.0
-4.0
-3.0
-2.0
-1.0
0.0
1.0
2.0
3.0
4.0
5.0
Arg His Ile Leu Lys Met Phe Thr Trp Val Ala Asp Cys Glu Gly Pro Ser Tyr
dif
fere
nce
, g/1
00g A
A
Essential AA Non-essential AA
Page 38 of 40
ScholarOne support: (434) 964 4100
Journal of Dairy Science
Page 41
For Peer Review
39
Table 7. Comparison of the AA composition (g/100 g AA) of omasal protozoa from trial B1 determined using multiple vs. single time point hydrolysis methods. Method 90 % CI AA Single Multiple S - M SED2 Lower Upper EQ3
Essential AA Arg 5.35 5.26 0.09 0.15 -0.84 1.03 Yes His 2.53 2.52 0.01 0.01 -0.03 0.05 Yes Ile 3.80 4.39 -0.59 0.06 -0.94 -0.24 Yes Leu 6.11 6.25 -0.14 0.41 -2.70 2.42 No Lys 8.81 8.55 0.26 0.06 -0.10 0.62 Yes Met 3.14 3.77 -0.62 0.47 -3.58 2.34 No Phe 6.49 6.58 -0.08 0.24 -1.61 1.45 No Thr 5.41 5.34 0.07 0.03 -0.13 0.26 Yes Trp 4.76 4.95 -0.19 0.27 -1.90 1.52 No Val 4.65 4.75 -0.10 0.04 -0.38 0.18 Yes Non-essential AA Ala 5.14 5.03 0.11 0.07 -0.31 0.53 Yes Asp 10.85 10.14 0.71 0.47 -2.27 3.69 No Cys 2.06 2.16 -0.09 0.01 -0.15 -0.04 Yes Glu 13.56 13.03 0.52 0.04 0.30 0.74 Yes Gly 4.48 4.41 0.07 0.01 0.03 0.12 Yes Pro 2.99 2.89 0.10 0.10 -0.52 0.71 Yes Ser 5.36 5.28 0.08 0.03 -0.14 0.29 Yes Tyr 4.50 4.70 -0.20 0.34 -2.32 1.92 No 1Trial B: Foskolos et al., (unpublished data). n=2 for all comparisons. 2Standard error of the difference. 3Equivalence determined from 2 one-sided paired t-tests. Methods deemed to be equivalent if 90% CI falls within defined equivalency of -1.5 to 1.5 g/100g of AA.
621
Page 39 of 40
ScholarOne support: (434) 964 4100
Journal of Dairy Science
Page 42
For Peer Review
40
622
Figure 6. Equivalency chart for difference in AA composition (g/100 g AA) of Trial B protozoa 623
determined using multiple vs. single time point hydrolysis methods. Open circles (○) represent 624
the mean difference and error bars represent the 90% confidence interval around the mean 625
difference. Shaded region represents equivalency defined as -1.5 to 1.5 g/100 g protozoal AA. 626
627
-5.0
-4.0
-3.0
-2.0
-1.0
0.0
1.0
2.0
3.0
4.0
5.0
Arg His Ile Leu Lys Met Phe Trp Thr Val Ala Asp Cys Glu Gly Pro Ser Tyr
dif
fere
nce
, g/1
00g A
A
Essential AA Non-essential AA
Page 40 of 40
ScholarOne support: (434) 964 4100
Journal of Dairy Science