PNNL-19142 Prepared for the U.S. Department of Energy under Contract DE-AC05-76RL01830 Abiotic Degradation Rates for Carbon Tetrachloride and Chloroform: Progress in FY 2009 JE Amonette CK Russell PM Jeffers TW Wietsma O Qafoku MJ Truex March 2010
Transcript
PNNL-19142
Prepared for the U.S. Department of Energy under Contract DE-AC05-76RL01830
Abiotic Degradation Rates for Carbon Tetrachloride and Chloroform: Progress in FY 2009 JE Amonette CK Russell PM Jeffers TW Wietsma O Qafoku MJ Truex March 2010
PNNL-19142
PNNL-19142
Abiotic Degradation Rates for Carbon Tetrachloride and Chloroform: Progress in FY 2009 JE Amonette CK Russell PM Jeffers1
O Qafoku MJ Truex TW Wietsma
March 2010 Prepared for the U.S. Department of Energy under Contract DE-AC05-76RL01830 Pacific Northwest National Laboratory Richland, Washington 99352
1 The Research Foundation of the State University of New York, Cortland, New York.
iii
Abstract
This report documents the progress made through FY 2009 on a project initiated in FY 2006 to help address uncertainties related to the rates of hydrolysis in groundwater at the Hanford Site for carbon tetrachloride (CT) and chloroform (CF). The study also explores the possible effects of contact with minerals and sediment (i.e., heterogeneous hydrolysis) on these rates. The research was initiated to decrease the uncertainties in abiotic degradation rates of CT and chloroform CF associated with temperature and possible heterogeneous effects. After 2 years of data collection, the first evidence for heterogeneous effects was identified for hydrolysis of CT, and preliminary evidence for the effects of different mineral types on CF hydrolysis rates also was reported. The CT data showed no difference among mineral types, whereas significant differences were seen in the CF results, perhaps due to the fact that CF hydrolyzes by both neutral and base-catalyzed mechanisms whereas CT follows only the neutral hydrolysis path.
In this report, we review the project objectives, organization, and technical approaches taken, update the status and results of the hydrolysis-rate experiments after 3 years of experimentation (i.e., through FY 2009), and provide a brief discussion of how these results add to scientific understanding of the behavior of the CT/CF plume at the Hanford Site.
v
Abbreviations
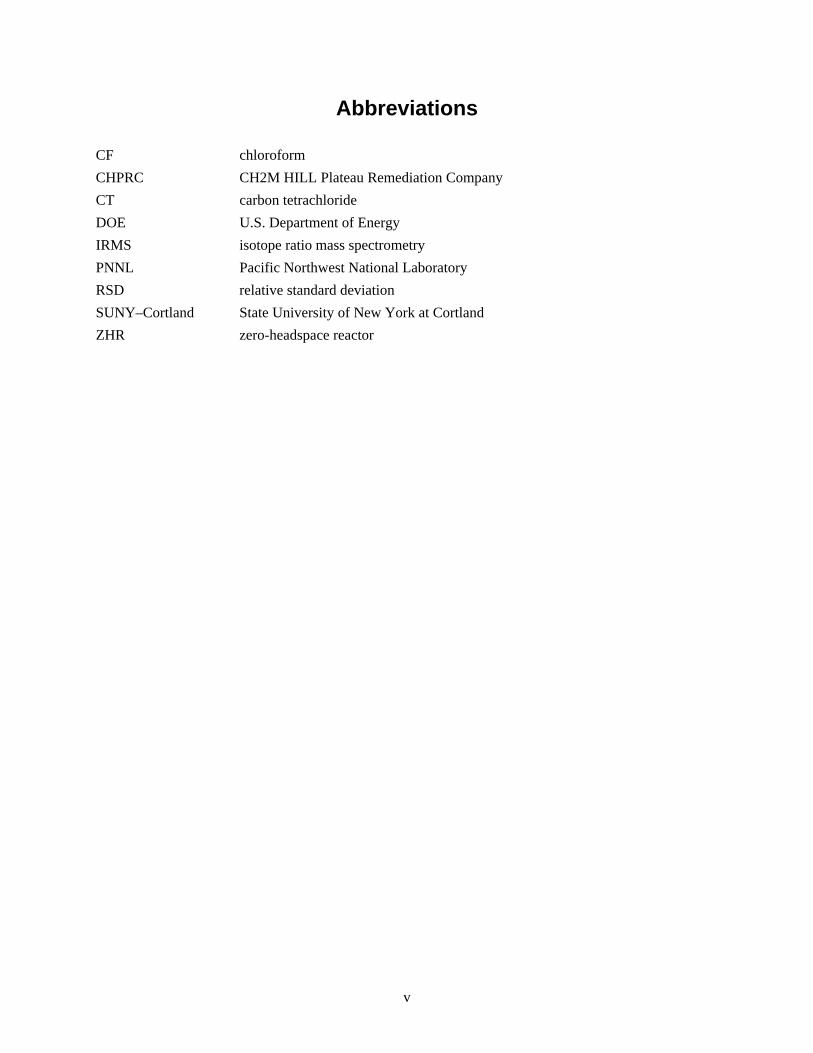
CF chloroform CHPRC CH2M HILL Plateau Remediation Company CT carbon tetrachloride DOE U.S. Department of Energy IRMS isotope ratio mass spectrometry PNNL Pacific Northwest National Laboratory RSD relative standard deviation SUNY–Cortland State University of New York at Cortland ZHR zero-headspace reactor
vii
Contents
Abstract ................................................................................................................................................. iii Abbreviations ........................................................................................................................................ v
3.1 Arrhenius Plot of kzhs Data Generated in This Study Along with kapp Data as Reported by Jeffers et al. (1996) and the 1996 Data Normalized to kzhs Assuming a 2% Headspace-to-Liquid Ratio and the Extrapolated Henry’s Law Coefficients of Gossett (1987) ......................... 3.3
3.2 Arrhenius Plot of Base-Catalyzed Homogeneous Hydrolysis Data for Chloroform .................... 3.9
3.3 Arrhenius Plot of kzhs Data for Hydrolysis of Carbon Tetrachloride in Deionized Water, Hanford Groundwater, and Suspensions of Oxidized Hanford Sediment in Hanford Groundwater ................................................................................................................................. 3.11
3.4 Provisional kzhs Data at 50°C for Hydrolysis of Chloroform in Suspensions of Minerals or Hanford Sediment and in Homogeneous Solutions at Several pH Levels .................................... 3.15
4.1 Values of KH′ Determined and Extrapolated to Higher Temperatures from Gossett (1987) Together with Direct Determinations of Klv at SUNY–Cortland and Back-Calculated Values of Klv Derived from PNNL Hydrolysis-Rate Determinations in Deionized Water ...................... 4.1
4.2 Mean Values of Klv for Chloroform Measured by SUNY–Cortland, Together with Kh Values for Chloroform Reported by Gorgenyi et al. (2002) ..................................................................... 4.2
viii
Tables
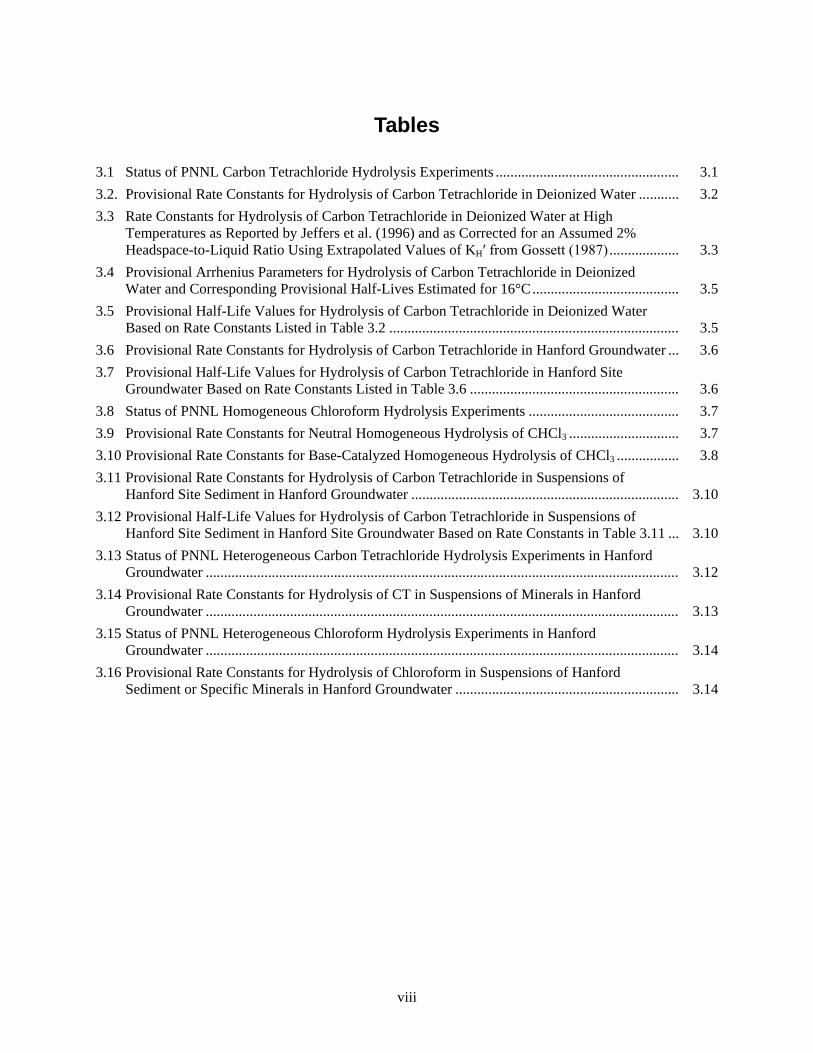
3.1 Status of PNNL Carbon Tetrachloride Hydrolysis Experiments .................................................. 3.1
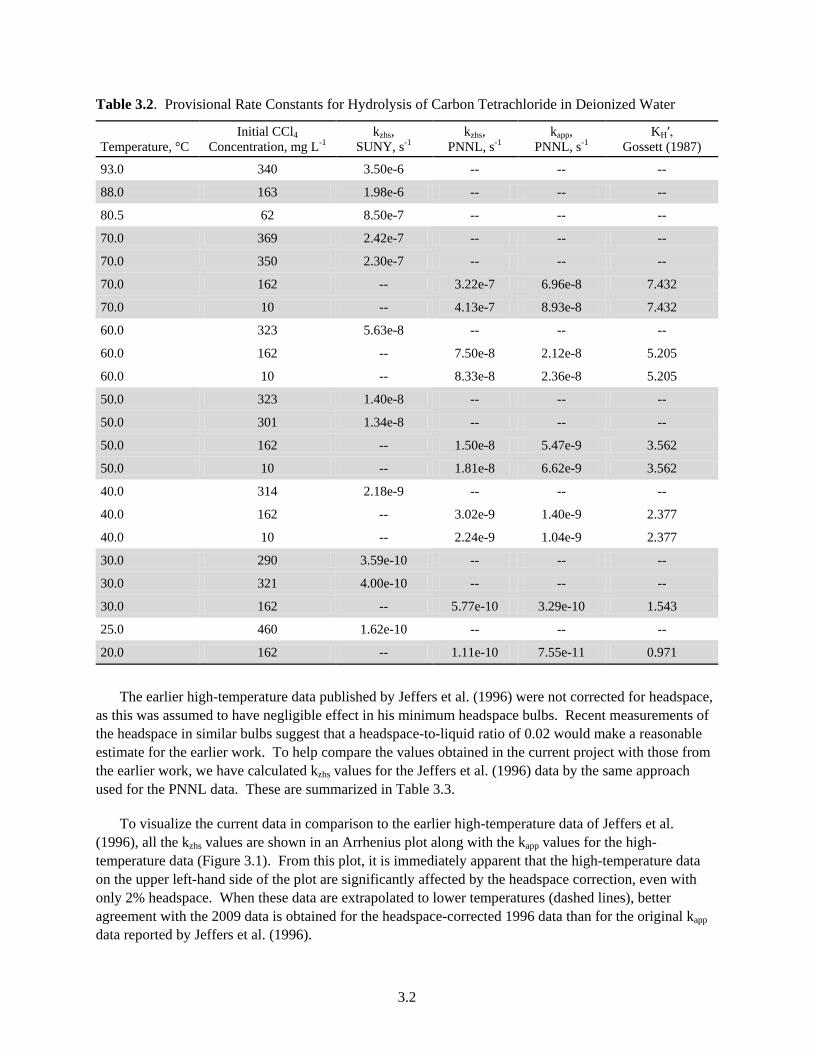
3.2. Provisional Rate Constants for Hydrolysis of Carbon Tetrachloride in Deionized Water ........... 3.2
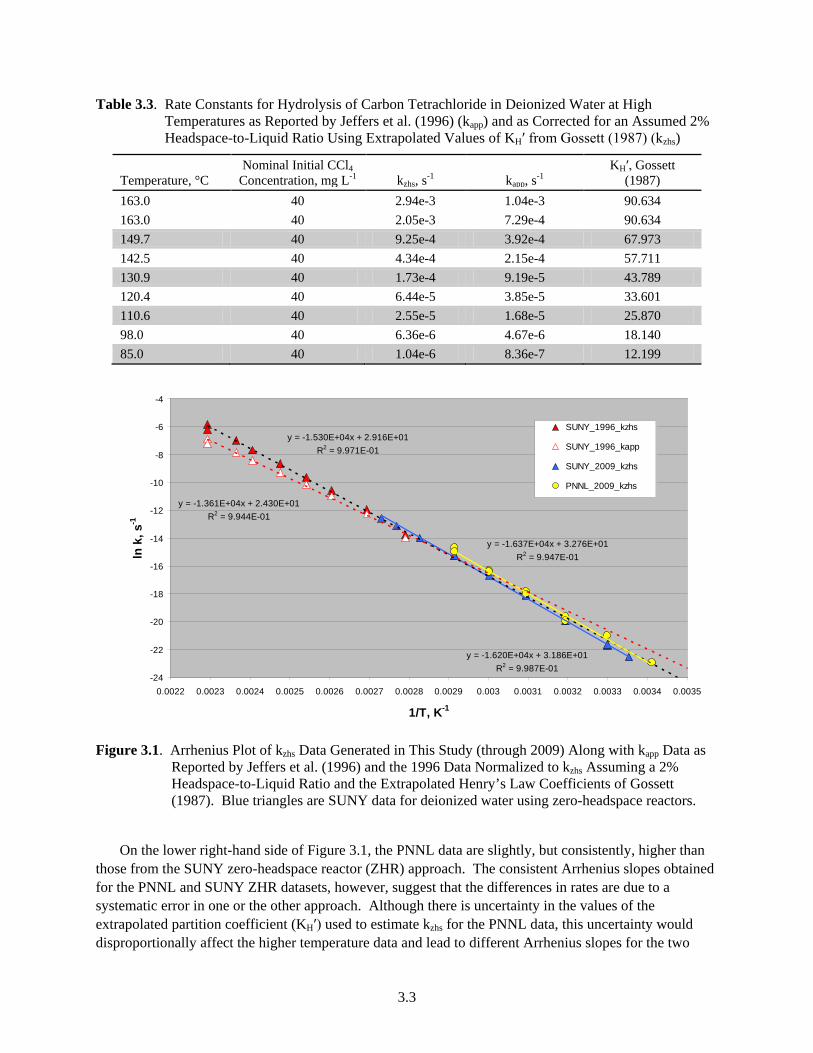
3.3 Rate Constants for Hydrolysis of Carbon Tetrachloride in Deionized Water at High Temperatures as Reported by Jeffers et al. (1996) and as Corrected for an Assumed 2% Headspace-to-Liquid Ratio Using Extrapolated Values of KH′ from Gossett (1987) ................... 3.3
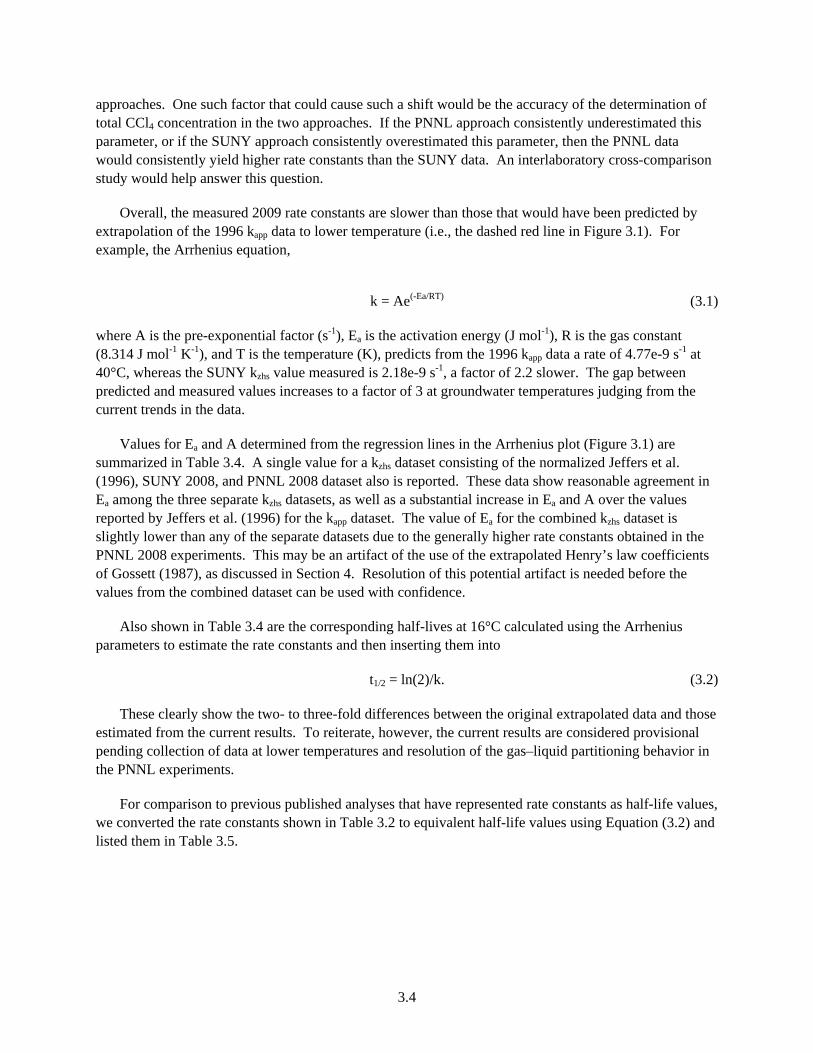
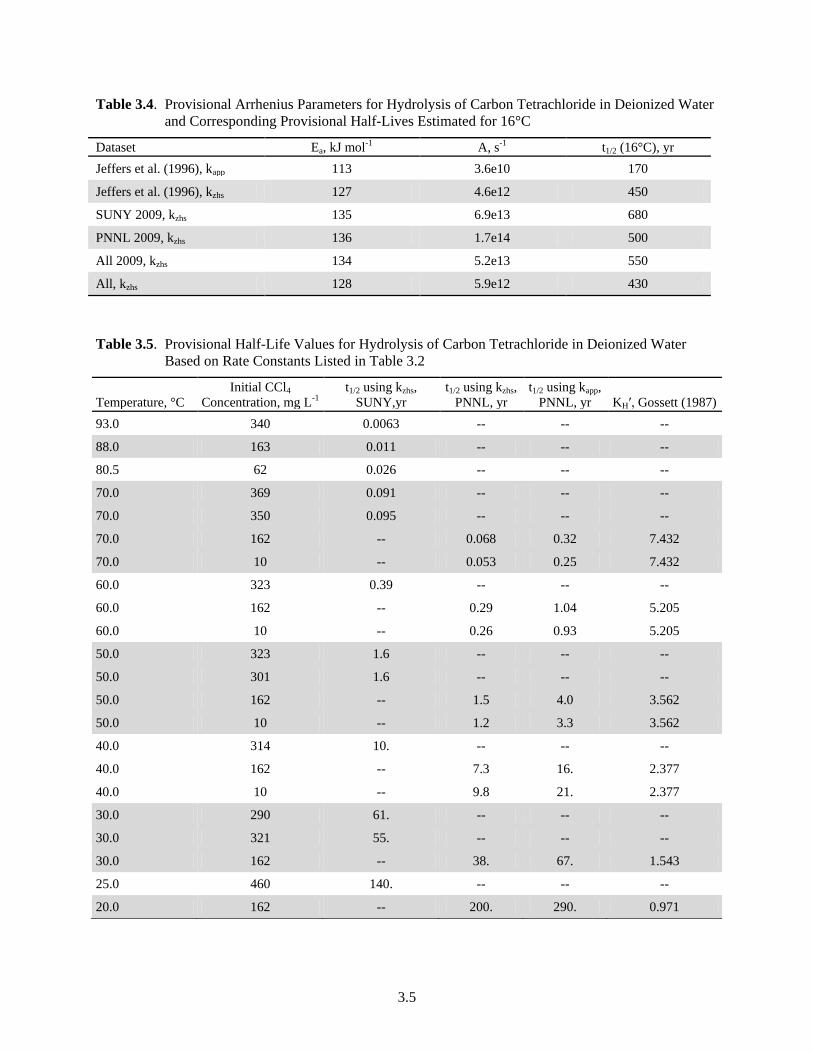
3.4 Provisional Arrhenius Parameters for Hydrolysis of Carbon Tetrachloride in Deionized Water and Corresponding Provisional Half-Lives Estimated for 16°C ........................................ 3.5
3.5 Provisional Half-Life Values for Hydrolysis of Carbon Tetrachloride in Deionized Water Based on Rate Constants Listed in Table 3.2 ............................................................................... 3.5
3.6 Provisional Rate Constants for Hydrolysis of Carbon Tetrachloride in Hanford Groundwater ... 3.6
3.7 Provisional Half-Life Values for Hydrolysis of Carbon Tetrachloride in Hanford Site Groundwater Based on Rate Constants Listed in Table 3.6 ......................................................... 3.6
3.8 Status of PNNL Homogeneous Chloroform Hydrolysis Experiments ......................................... 3.7
3.9 Provisional Rate Constants for Neutral Homogeneous Hydrolysis of CHCl3 .............................. 3.7
3.10 Provisional Rate Constants for Base-Catalyzed Homogeneous Hydrolysis of CHCl3 ................. 3.8
3.11 Provisional Rate Constants for Hydrolysis of Carbon Tetrachloride in Suspensions of Hanford Site Sediment in Hanford Groundwater ......................................................................... 3.10
3.12 Provisional Half-Life Values for Hydrolysis of Carbon Tetrachloride in Suspensions of Hanford Site Sediment in Hanford Site Groundwater Based on Rate Constants in Table 3.11 ... 3.10
3.13 Status of PNNL Heterogeneous Carbon Tetrachloride Hydrolysis Experiments in Hanford Groundwater ................................................................................................................................. 3.12
3.14 Provisional Rate Constants for Hydrolysis of CT in Suspensions of Minerals in Hanford Groundwater ................................................................................................................................. 3.13
3.15 Status of PNNL Heterogeneous Chloroform Hydrolysis Experiments in Hanford Groundwater ................................................................................................................................. 3.14
3.16 Provisional Rate Constants for Hydrolysis of Chloroform in Suspensions of Hanford Sediment or Specific Minerals in Hanford Groundwater ............................................................. 3.14
1.1
1.0 Introduction
This report documents the progress made through FY 2009 on a project initiated in FY 2006 to help address uncertainties related to the rates of hydrolysis in groundwater for carbon tetrachloride and chloroform. The study seeks also to explore the possible effects of contact with minerals and sediment (i.e., heterogeneous hydrolysis) on these rates. In previous years, the work was funded as two separate projects by various sponsors, all of whom received their funding from the U.S. Department of Energy (DOE). In FY 2009, the projects were combined and funded by CH2M HILL Plateau Remediation Company. Work in FY 2009 was performed by staff at the Pacific Northwest National Laboratory (PNNL). Staff from the State University of New York at Cortland (SUNY–Cortland) contributed in previous years.
1.1 Rationale
Between 1955 and 1973, an estimated 920,000 kg of carbon tetrachloride (CT) were discharged to the soil in the 200 West Area of the Hanford Site as part of the plutonium production process (Oostrom et al. 2007). Of this amount, some CT reached the groundwater more than 70 m below the ground surface and formed a plume of 10 km2 extent. Recent data show that the CT plume extends to a depth of at least 60 m below the water table. Some CT has been degraded by either the original process or subsequent transformations in the subsurface to form a coexisting plume of chloroform (CF).
Upcoming remediation decisions will rely on an improved conceptual model of the plume as well as mechanistic information concerning the fate and transport of CT/CF. A key aspect of these decisions will be to determine the relative sizes of the efforts devoted to active remediation and natural attenuation in order to stabilize the plume. Of the possible natural-attenuation mechanisms, biodegradation is not likely to contribute significantly (Truex et al. 2001), and mechanisms such as dispersion, dilution, and sorption to Hanford Site sediments have been the focus of previous field and modeling efforts (e.g., Riley et al. 2005). In contrast, abiotic-degradation processes such as hydrolysis and reduction, which are likely to contribute significantly to natural attenuation (Truex et al. 2001), are not well understood or quantified. The work in this project is designed to partly bridge that gap by determining the mechanisms and rates associated with hydrolysis.
Current estimates of chlorinated-methane hydrolysis rates are based on studies conducted at high temperatures (typically 70ºC–150°C) and extrapolated to ambient conditions using the Arrhenius equation. The use of data extrapolated from higher temperatures to estimate hydrolysis rates at groundwater temperatures injects considerable uncertainty into any attempt to determine the role of abiotic processes in CT and CF degradation and frustrates the development and design of possible remedies. To resolve this situation, collection of hydrolysis rate data at temperatures at or near actual groundwater temperatures is needed. Because the hydrolysis rates are very slow at low temperatures, adequate resolution of the issue requires a lengthy experiment (as long as 5 years), extremely accurate sampling and analytical procedures, control of temperature and microbial populations, adequate headspace in the vials to minimize pressure effects, and a large number of replicates. Not surprisingly, the combination of these requirements has inhibited the collection of these data at ambient temperatures heretofore.
1.2
In addition to the uncertainty associated with temperature, the possibility of heterogeneous catalytic effects on hydrolysis rates exists. In 1994, Jeffers et al. reported on a search for heterogeneous catalysis in the hydrolysis of trichloroethene, tetrachloroethene, and 1,1,1-trichloroethane. In experiments executed at 102oC or 106oC, no additional hydrolysis reactivity was observed with aqueous solutions containing finely divided dispersions of eleven different minerals (Jeffers et al. 1994). However, any catalytic process would be characterized by a lower activation energy, implying that Arrhenius curves for homogeneous and heterogeneous reactions could cross at some relatively low temperature, and in any case, a heterogeneous reaction path would become increasingly important as temperature decreased due to the increased probability of sorption.
This study was initiated to decrease the uncertainties in abiotic degradation rates of CT and CF associated with temperature and possible heterogeneous effects. After 2 years of data collection, the first evidence for heterogeneous effects was identified for hydrolysis of CT1
In this report, we review the project objectives, organization, and technical approaches taken, update the status and results of the hydrolysis-rate experiments after 3 years of experimentation (i.e., through FY 2009), and provide a brief discussion of how these results add to scientific understanding of the behavior of the CT/CF plume at the Hanford Site.
, and preliminary evidence for the effects of different mineral types on CF hydrolysis rates also was reported (Amonette et al. 2009). Interestingly, the CT data showed no difference among mineral types, whereas significant differences were seen in the CF results, perhaps due to the fact that CF hydrolyzes by both neutral and base-catalyzed mechanisms whereas CT follows only the neutral hydrolysis path.
1.2 Project Goals
The overall goals of this project are to
1. Determine the homogeneous rates of hydrolysis for CT and CF (including neutral and base-catalyzed rates) in deionized water and Hanford Site groundwater at temperatures from 20°C to 70°C.
2. Determine the Arrhenius parameters (i.e., activation energy and prefactor) for hydrolysis of CT and CF in aqueous systems using the hydrolysis rate data collected at temperatures of 20°C to 70°C together with previously published data, thus allowing highly accurate interpolated estimates of hydrolysis rate at any temperature in the 20°–150°C range and reasonable extrapolation to groundwater temperatures.
3. Determine the impact and mechanisms of fine-grained Hanford Site sediment in Hanford groundwater and of representative Hanford mineral surfaces on the hydrolysis of CT and CF at near-ambient temperatures.
1.3 Project Organization
Since its inception, the project has been managed by Jim Amonette (PNNL), who also has served as co-principal investigator with Peter Jeffers (SUNY–Cortland) and Mike Truex (PNNL). In FY 2009,
1 Amonette JE, PM Jeffers, O Qafoku, CK Russell, TW Wietsma, and MJ Truex. Abiotic Degradation Rates for Carbon Tetrachloride: Progress in FY 2008. 2008 Draft Report, Pacific Northwest National Laboratory, Richland, Washington.
1.3
work on the project was being conducted solely in the Environmental Molecular Sciences Laboratory at PNNL using ampules with a headspace-to-liquid ratio of 1:2. In previous years, work was conducted also at SUNY–Cortland using minimal-headspace ampules (headspace-to-liquid ratio of about 1:50) and a zero-headspace reactor. The SUNY–Cortland work also included direct determinations of aqueous–vapor partition coefficients for CT and CF using a specially built reactor.
2.1
2.0 Experimental Approach
The overall experimental design involves collection of data at four to six temperatures covering the range of 20ºC–70°C. Samples are incubated under one of three environments (sterile deionized water, sterile filtered Hanford 200-Area groundwater, or sterile Hanford 200-Area sediment in 200-Area groundwater), at one of two concentrations (40 ppm or 400 ppm), for periods of up to 5 years. We conduct five replicate analyses for each treatment combination at each of ten times during the experiment. Reaction progress is followed by measurement (using ion chromatography) of the chloride released. Two additional replicates are prepared as controls for potential analysis by gas chromatography in the event that non-hydrolytic degradation pathways are suspected. In addition, another 14 ampules are prepared for each temperature/environment combination to ascertain initial and maximum potential concentrations of chloride. Thus, the number of ampules for a temperature/environment combination is 84.
Over the course of the project, 91 temperature/environment combinations (a total of more than 7600 ampules) have been started at PNNL; 48 of those combinations are still being actively sampled, although more than two-thirds of the ampules have been analyzed. The experiments under way included CT in deionized water and Hanford groundwater, and in groundwater suspensions of Hanford sediment or one of four representative mineral phases. For CF, homogeneous experiments at three pH levels were started, of which only pH 3 and pH 8 remain due to the rapid degradation rates at pH 12, as was an identical set of heterogeneous experiments involving Hanford sediment and the four representative minerals.
Details of the laboratory procedures used and calculations followed, together with analyses of the groundwater, sediment, and representative minerals, are given in Amonette et al. (2009).
3.1
3.0 Hydrolysis Rate Experiments
In this section, we report all the data collected from the inception of the project in FY 2006 through FY 2009, in order to keep a complete record of the dataset. In addition, values listed are provisional and change as new information from sampling of more ampules in a temperature/environment combination becomes available.
3.1 Homogeneous Experiments with Carbon Tetrachloride
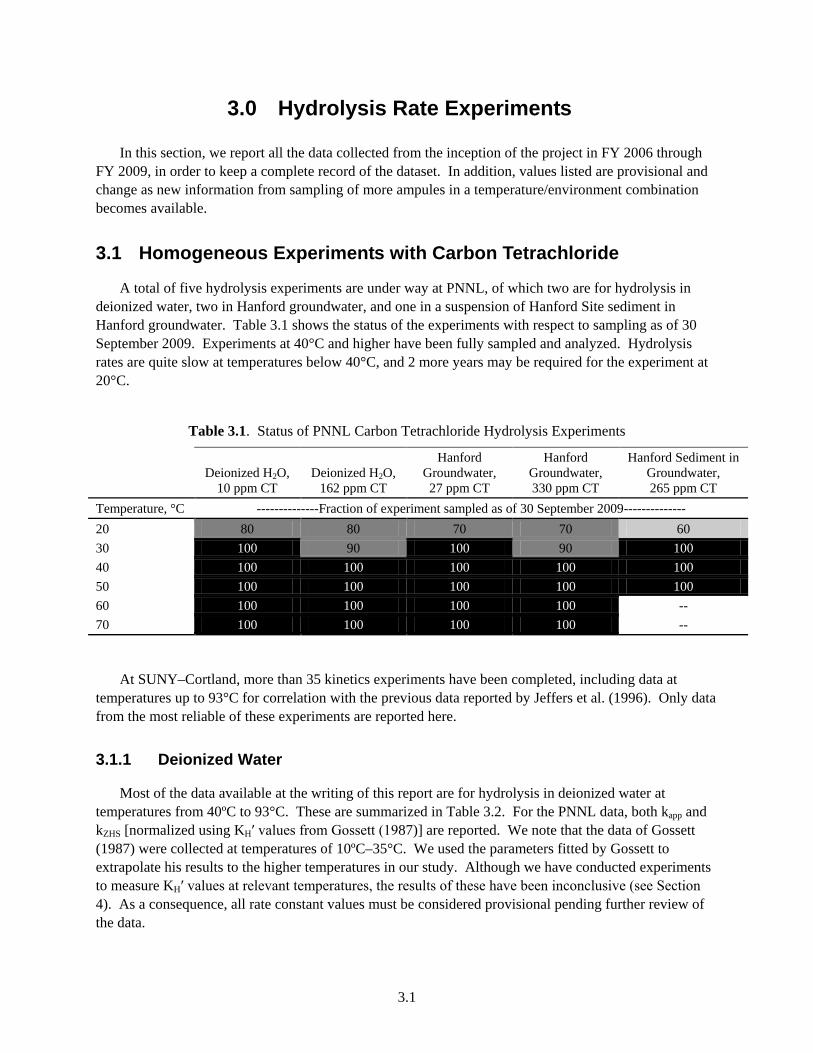
A total of five hydrolysis experiments are under way at PNNL, of which two are for hydrolysis in deionized water, two in Hanford groundwater, and one in a suspension of Hanford Site sediment in Hanford groundwater. Table 3.1 shows the status of the experiments with respect to sampling as of 30 September 2009. Experiments at 40°C and higher have been fully sampled and analyzed. Hydrolysis rates are quite slow at temperatures below 40°C, and 2 more years may be required for the experiment at 20°C.
Table 3.1. Status of PNNL Carbon Tetrachloride Hydrolysis Experiments
Deionized H2O,
10 ppm CT Deionized H2O,
162 ppm CT
Hanford Groundwater, 27 ppm CT
Hanford Groundwater, 330 ppm CT
Hanford Sediment in Groundwater, 265 ppm CT
Temperature, °C --------------Fraction of experiment sampled as of 30 September 2009-------------- 20 80 80 70 70 60 30 100 90 100 90 100 40 100 100 100 100 100 50 100 100 100 100 100 60 100 100 100 100 -- 70 100 100 100 100 --
At SUNY–Cortland, more than 35 kinetics experiments have been completed, including data at temperatures up to 93°C for correlation with the previous data reported by Jeffers et al. (1996). Only data from the most reliable of these experiments are reported here.
3.1.1 Deionized Water
Most of the data available at the writing of this report are for hydrolysis in deionized water at temperatures from 40ºC to 93°C. These are summarized in Table 3.2. For the PNNL data, both kapp and kZHS [normalized using KH′ values from Gossett (1987)] are reported. We note that the data of Gossett (1987) were collected at temperatures of 10ºC–35°C. We used the parameters fitted by Gossett to extrapolate his results to the higher temperatures in our study. Although we have conducted experiments to measure KH′ values at relevant temperatures, the results of these have been inconclusive (see Section 4). As a consequence, all rate constant values must be considered provisional pending further review of the data.
3.2
Table 3.2. Provisional Rate Constants for Hydrolysis of Carbon Tetrachloride in Deionized Water
Temperature, °C Initial CCl4
Concentration, mg L-1 kzhs,
SUNY, s-1 kzhs,
PNNL, s-1 kapp,
PNNL, s-1 KH′,
Gossett (1987)
93.0 340 3.50e-6 -- -- --
88.0 163 1.98e-6 -- -- --
80.5 62 8.50e-7 -- -- --
70.0 369 2.42e-7 -- -- --
70.0 350 2.30e-7 -- -- --
70.0 162 -- 3.22e-7 6.96e-8 7.432
70.0 10 -- 4.13e-7 8.93e-8 7.432
60.0 323 5.63e-8 -- -- --
60.0 162 -- 7.50e-8 2.12e-8 5.205
60.0 10 -- 8.33e-8 2.36e-8 5.205
50.0 323 1.40e-8 -- -- --
50.0 301 1.34e-8 -- -- --
50.0 162 -- 1.50e-8 5.47e-9 3.562
50.0 10 -- 1.81e-8 6.62e-9 3.562
40.0 314 2.18e-9 -- -- --
40.0 162 -- 3.02e-9 1.40e-9 2.377
40.0 10 -- 2.24e-9 1.04e-9 2.377
30.0 290 3.59e-10 -- -- --
30.0 321 4.00e-10 -- -- --
30.0 162 -- 5.77e-10 3.29e-10 1.543
25.0 460 1.62e-10 -- -- --
20.0 162 -- 1.11e-10 7.55e-11 0.971
The earlier high-temperature data published by Jeffers et al. (1996) were not corrected for headspace,
as this was assumed to have negligible effect in his minimum headspace bulbs. Recent measurements of the headspace in similar bulbs suggest that a headspace-to-liquid ratio of 0.02 would make a reasonable estimate for the earlier work. To help compare the values obtained in the current project with those from the earlier work, we have calculated kzhs values for the Jeffers et al. (1996) data by the same approach used for the PNNL data. These are summarized in Table 3.3.
To visualize the current data in comparison to the earlier high-temperature data of Jeffers et al. (1996), all the kzhs values are shown in an Arrhenius plot along with the kapp values for the high-temperature data (Figure 3.1). From this plot, it is immediately apparent that the high-temperature data on the upper left-hand side of the plot are significantly affected by the headspace correction, even with only 2% headspace. When these data are extrapolated to lower temperatures (dashed lines), better agreement with the 2009 data is obtained for the headspace-corrected 1996 data than for the original kapp data reported by Jeffers et al. (1996).
3.3
Table 3.3. Rate Constants for Hydrolysis of Carbon Tetrachloride in Deionized Water at High Temperatures as Reported by Jeffers et al. (1996) (kapp) and as Corrected for an Assumed 2% Headspace-to-Liquid Ratio Using Extrapolated Values of KH′ from Gossett (1987) (kzhs)
Figure 3.1. Arrhenius Plot of kzhs Data Generated in This Study (through 2009) Along with kapp Data as
Reported by Jeffers et al. (1996) and the 1996 Data Normalized to kzhs Assuming a 2% Headspace-to-Liquid Ratio and the Extrapolated Henry’s Law Coefficients of Gossett (1987). Blue triangles are SUNY data for deionized water using zero-headspace reactors.
On the lower right-hand side of Figure 3.1, the PNNL data are slightly, but consistently, higher than
those from the SUNY zero-headspace reactor (ZHR) approach. The consistent Arrhenius slopes obtained for the PNNL and SUNY ZHR datasets, however, suggest that the differences in rates are due to a systematic error in one or the other approach. Although there is uncertainty in the values of the extrapolated partition coefficient (KH′) used to estimate kzhs for the PNNL data, this uncertainty would disproportionally affect the higher temperature data and lead to different Arrhenius slopes for the two
3.4
approaches. One such factor that could cause such a shift would be the accuracy of the determination of total CCl4 concentration in the two approaches. If the PNNL approach consistently underestimated this parameter, or if the SUNY approach consistently overestimated this parameter, then the PNNL data would consistently yield higher rate constants than the SUNY data. An interlaboratory cross-comparison study would help answer this question.
Overall, the measured 2009 rate constants are slower than those that would have been predicted by extrapolation of the 1996 kapp data to lower temperature (i.e., the dashed red line in Figure 3.1). For example, the Arrhenius equation,
k = Ae(-Ea/RT) (3.1)
where A is the pre-exponential factor (s-1), Ea is the activation energy (J mol-1), R is the gas constant (8.314 J mol-1 K-1), and T is the temperature (K), predicts from the 1996 kapp data a rate of 4.77e-9 s-1 at 40°C, whereas the SUNY kzhs value measured is 2.18e-9 s-1, a factor of 2.2 slower. The gap between predicted and measured values increases to a factor of 3 at groundwater temperatures judging from the current trends in the data.
Values for Ea and A determined from the regression lines in the Arrhenius plot (Figure 3.1) are summarized in Table 3.4. A single value for a kzhs dataset consisting of the normalized Jeffers et al. (1996), SUNY 2008, and PNNL 2008 dataset also is reported. These data show reasonable agreement in Ea among the three separate kzhs datasets, as well as a substantial increase in Ea and A over the values reported by Jeffers et al. (1996) for the kapp dataset. The value of Ea for the combined kzhs dataset is slightly lower than any of the separate datasets due to the generally higher rate constants obtained in the PNNL 2008 experiments. This may be an artifact of the use of the extrapolated Henry’s law coefficients of Gossett (1987), as discussed in Section 4. Resolution of this potential artifact is needed before the values from the combined dataset can be used with confidence.
Also shown in Table 3.4 are the corresponding half-lives at 16°C calculated using the Arrhenius parameters to estimate the rate constants and then inserting them into
t1/2 = ln(2)/k. (3.2)
These clearly show the two- to three-fold differences between the original extrapolated data and those estimated from the current results. To reiterate, however, the current results are considered provisional pending collection of data at lower temperatures and resolution of the gas–liquid partitioning behavior in the PNNL experiments.
For comparison to previous published analyses that have represented rate constants as half-life values, we converted the rate constants shown in Table 3.2 to equivalent half-life values using Equation (3.2) and listed them in Table 3.5.
3.5
Table 3.4. Provisional Arrhenius Parameters for Hydrolysis of Carbon Tetrachloride in Deionized Water and Corresponding Provisional Half-Lives Estimated for 16°C
Dataset Ea, kJ mol-1 A, s-1 t1/2 (16°C), yr Jeffers et al. (1996), kapp 113 3.6e10 170
Jeffers et al. (1996), kzhs 127 4.6e12 450
SUNY 2009, kzhs 135 6.9e13 680
PNNL 2009, kzhs 136 1.7e14 500
All 2009, kzhs 134 5.2e13 550
All, kzhs 128 5.9e12 430
Table 3.5. Provisional Half-Life Values for Hydrolysis of Carbon Tetrachloride in Deionized Water Based on Rate Constants Listed in Table 3.2
The hydrolysis data for Hanford groundwater are summarized in Tables 3.6 (rate constants) and 3.7 (half-lives). As before, all data are provisional pending further evaluation and additional data.
Table 3.6. Provisional Rate Constants for Hydrolysis of Carbon Tetrachloride in Hanford Groundwater
Temperature, °C Initial CCl4
Concentration, mg L-1 kzhs,
SUNY, s-1 kzhs, PNNL,
s-1 kapp,
PNNL, s-1 KH′, Gossett
(1987)
70 330 -- 3.62e-7 7.86e-8 7.432
70 27 -- 4.27e-7 9.23e-8 7.432
60 402 4.67e-8 -- -- --
60 330 -- 7.77e-8 2.20e-8 5.205
60 27 -- 7.04e-8 1.99e-8 5.205
50 330 -- 1.39e-8 5.09e-9 3.562
50 27 1.39e-8 5.07e-9 3.562
48.6 464 1.38e-8 -- -- --
40 330 -- 2.92e-9 1.35e-9 2.377
40 27 -- 4.09e-9 1.90e-9 2.377
30 330 -- 3.99e-10 2.28e-10 1.543
20 330 -- 1.03e-10 6.98e-11 0.971
Table 3.7. Provisional Half-Life Values for Hydrolysis of Carbon Tetrachloride in Hanford Site Groundwater Based on Rate Constants Listed in Table 3.6
Temperature, °C Initial CCl4
Concentration, mg L-1 t1/2 using kzhs,
SUNY, yr t1/2 using kzhs,
PNNL, yr t1/2 using kapp,
PNNL, yr KH′, Gossett
(1987)
70 330 0.061 0.28 7.432
70 27 0.052 0.24 7.432
60 402 0.47 --
60 330 0.28 1.0 5.205
60 27 0.31 1.1 5.205
50 330 1.6 4.3 3.562
50 27 1.6 4.3 3.562
48.6 464 1.6 --
40 330 7.5 16. 2.377
40 27 5.4 12. 2.377
30 330 23. 38. 1.543
20 330 71. 99. 0.971
3.7
3.2 Homogeneous Experiments with Chloroform
The status of the homogeneous chloroform hydrolysis experiments at PNNL as of September 2009 is summarized in Table 3.8. As each experiment involves sampling at 10 separate time periods, the progress is given in terms of the number of sampling periods that have occurred (i.e., percentage of the initial ampules filled that have been terminated). As can be seen, a total of four homogeneous hydrolysis experiments with CF have been started, two at pH 3, one at pH 8, and one at pH 12. Hydrolysis is rapid at pH 12, and those experiments are complete (Table 3.8). In addition, the highest-temperature (50°C through 70°C) experiments at pH 8, and the 70°C experiments at pH 3 are complete (Table 3.8). The hydrolysis rates are considerably slower at pH 8 and temperatures below 50°C, and several years may be required to obtain useful data at 20°C. Several years will also be required to obtain hydrolysis rates at some of the lower temperatures for pH 3, where only neutral hydrolysis is important.
Table 3.8. Status of PNNL Homogeneous Chloroform Hydrolysis Experiments
pH 3, 34 ppm CF,
1 mM H2SO4 pH 3, 330 ppm CF,
1 mM H2SO4 pH 8, 207 ppm CF,
0.1 M phosphate pH 12, 303 ppm CF,
0.1 M phosphate Temperature, °C ------------ Percentage of experiment sampled as of 30 September 2009 ------------ 70 100 100 100 -- 60 90 90 100 -- 50 60 70 100 100 40 70 70 80 100 30 -- 40 30 100 20 -- 40 30 100
At SUNY–Cortland, seven experiments at six temperatures between 22°C and 60°C and pH 12 were
completed. As noted in Table 3.8, only base-catalyzed experiments conducted at pH 8 and 12 and the 70ºC experiments at pH 3 are at a stage where rate constants can be calculated. These data are summarized in Table 3.9 and Table 3.10, along with the initial reactant concentrations and the dimensionless Henry’s law constants derived from Gorgenyi et al. (2002). Note that all the PNNL data at pH 8 and 12 were collected in 0.1-m phosphate buffers. All rate constant values must be considered provisional pending further review of the data.
Table 3.9. Provisional Rate Constants for Neutral Homogeneous Hydrolysis of CHCl3
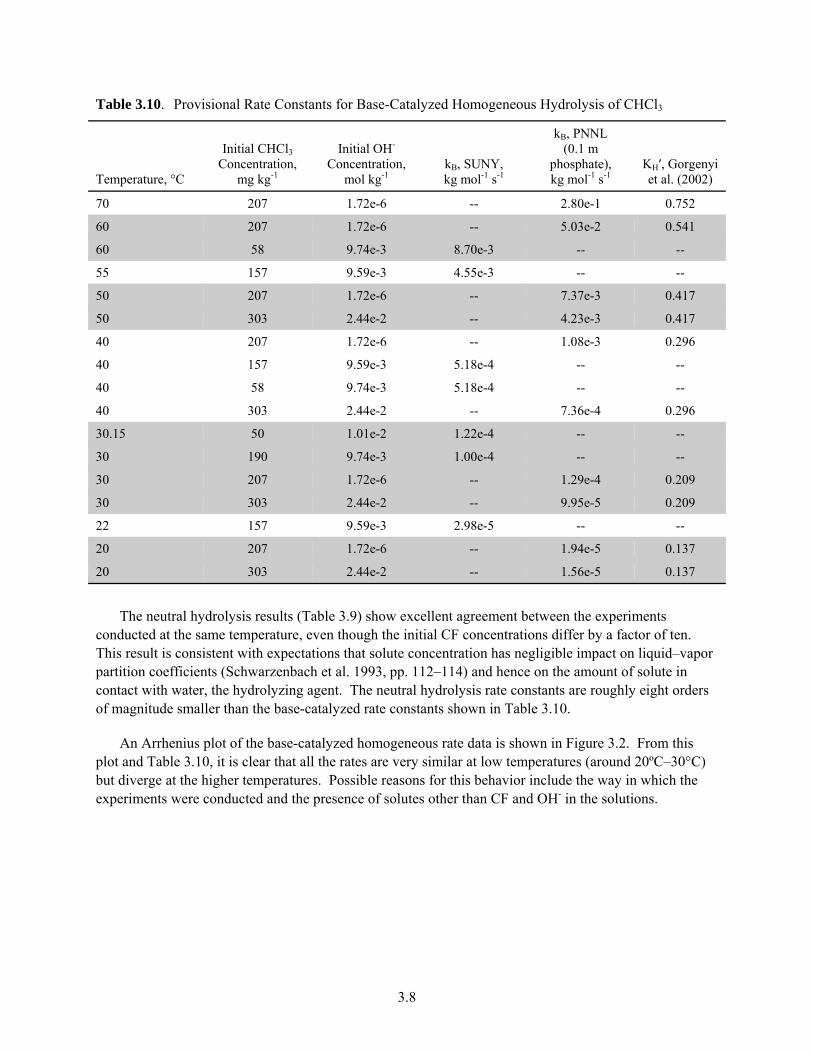
Table 3.10. Provisional Rate Constants for Base-Catalyzed Homogeneous Hydrolysis of CHCl3
Temperature, °C
Initial CHCl3 Concentration,
mg kg-1
Initial OH- Concentration,
mol kg-1 kB, SUNY, kg mol-1 s-1
kB, PNNL (0.1 m
phosphate), kg mol-1 s-1
KH′, Gorgenyi et al. (2002)
70 207 1.72e-6 -- 2.80e-1 0.752
60 207 1.72e-6 -- 5.03e-2 0.541
60 58 9.74e-3 8.70e-3 -- --
55 157 9.59e-3 4.55e-3 -- --
50 207 1.72e-6 -- 7.37e-3 0.417
50 303 2.44e-2 -- 4.23e-3 0.417
40 207 1.72e-6 -- 1.08e-3 0.296
40 157 9.59e-3 5.18e-4 -- --
40 58 9.74e-3 5.18e-4 -- --
40 303 2.44e-2 -- 7.36e-4 0.296
30.15 50 1.01e-2 1.22e-4 -- --
30 190 9.74e-3 1.00e-4 -- --
30 207 1.72e-6 -- 1.29e-4 0.209
30 303 2.44e-2 -- 9.95e-5 0.209
22 157 9.59e-3 2.98e-5 -- --
20 207 1.72e-6 -- 1.94e-5 0.137
20 303 2.44e-2 -- 1.56e-5 0.137
The neutral hydrolysis results (Table 3.9) show excellent agreement between the experiments conducted at the same temperature, even though the initial CF concentrations differ by a factor of ten. This result is consistent with expectations that solute concentration has negligible impact on liquid–vapor partition coefficients (Schwarzenbach et al. 1993, pp. 112–114) and hence on the amount of solute in contact with water, the hydrolyzing agent. The neutral hydrolysis rate constants are roughly eight orders of magnitude smaller than the base-catalyzed rate constants shown in Table 3.10.
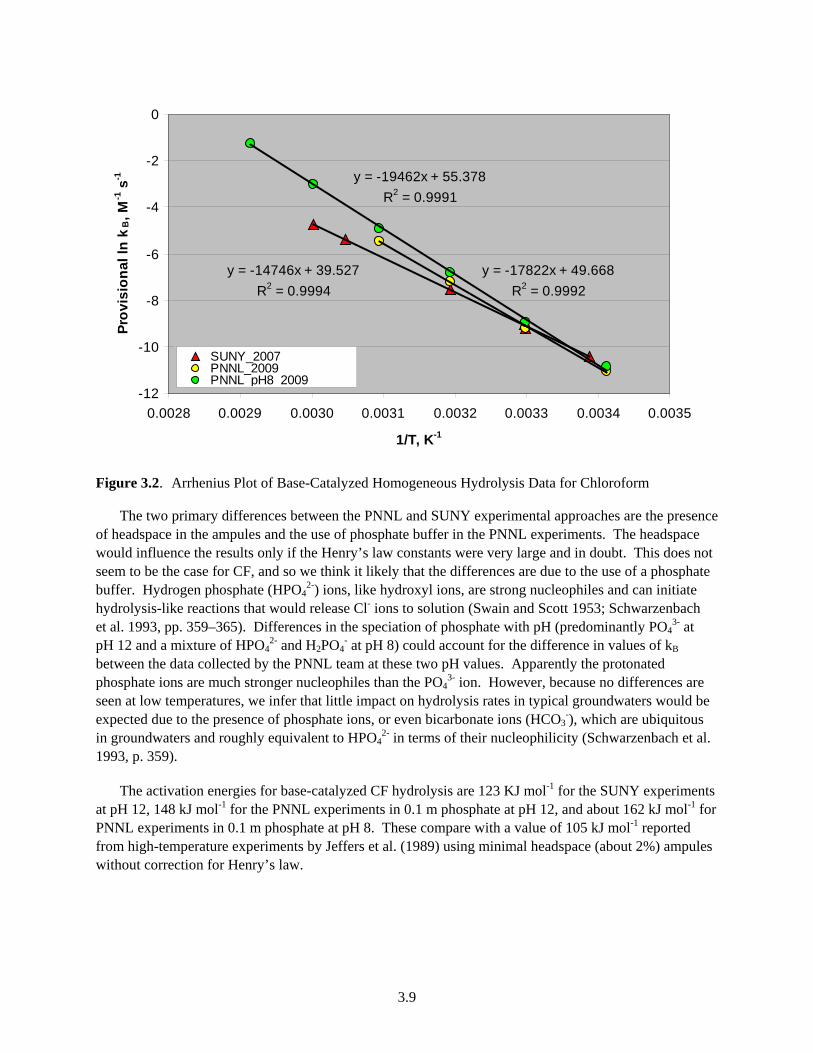
An Arrhenius plot of the base-catalyzed homogeneous rate data is shown in Figure 3.2. From this plot and Table 3.10, it is clear that all the rates are very similar at low temperatures (around 20ºC–30°C) but diverge at the higher temperatures. Possible reasons for this behavior include the way in which the experiments were conducted and the presence of solutes other than CF and OH- in the solutions.
Figure 3.2. Arrhenius Plot of Base-Catalyzed Homogeneous Hydrolysis Data for Chloroform
The two primary differences between the PNNL and SUNY experimental approaches are the presence of headspace in the ampules and the use of phosphate buffer in the PNNL experiments. The headspace would influence the results only if the Henry’s law constants were very large and in doubt. This does not seem to be the case for CF, and so we think it likely that the differences are due to the use of a phosphate buffer. Hydrogen phosphate (HPO4
2-) ions, like hydroxyl ions, are strong nucleophiles and can initiate hydrolysis-like reactions that would release Cl- ions to solution (Swain and Scott 1953; Schwarzenbach et al. 1993, pp. 359–365). Differences in the speciation of phosphate with pH (predominantly PO4
3- at pH 12 and a mixture of HPO4
2- and H2PO4- at pH 8) could account for the difference in values of kB
between the data collected by the PNNL team at these two pH values. Apparently the protonated phosphate ions are much stronger nucleophiles than the PO4
3- ion. However, because no differences are seen at low temperatures, we infer that little impact on hydrolysis rates in typical groundwaters would be expected due to the presence of phosphate ions, or even bicarbonate ions (HCO3
-), which are ubiquitous in groundwaters and roughly equivalent to HPO4
2- in terms of their nucleophilicity (Schwarzenbach et al. 1993, p. 359).
The activation energies for base-catalyzed CF hydrolysis are 123 KJ mol-1 for the SUNY experiments at pH 12, 148 kJ mol-1 for the PNNL experiments in 0.1 m phosphate at pH 12, and about 162 kJ mol-1 for PNNL experiments in 0.1 m phosphate at pH 8. These compare with a value of 105 kJ mol-1 reported from high-temperature experiments by Jeffers et al. (1989) using minimal headspace (about 2%) ampules without correction for Henry’s law.
3.10
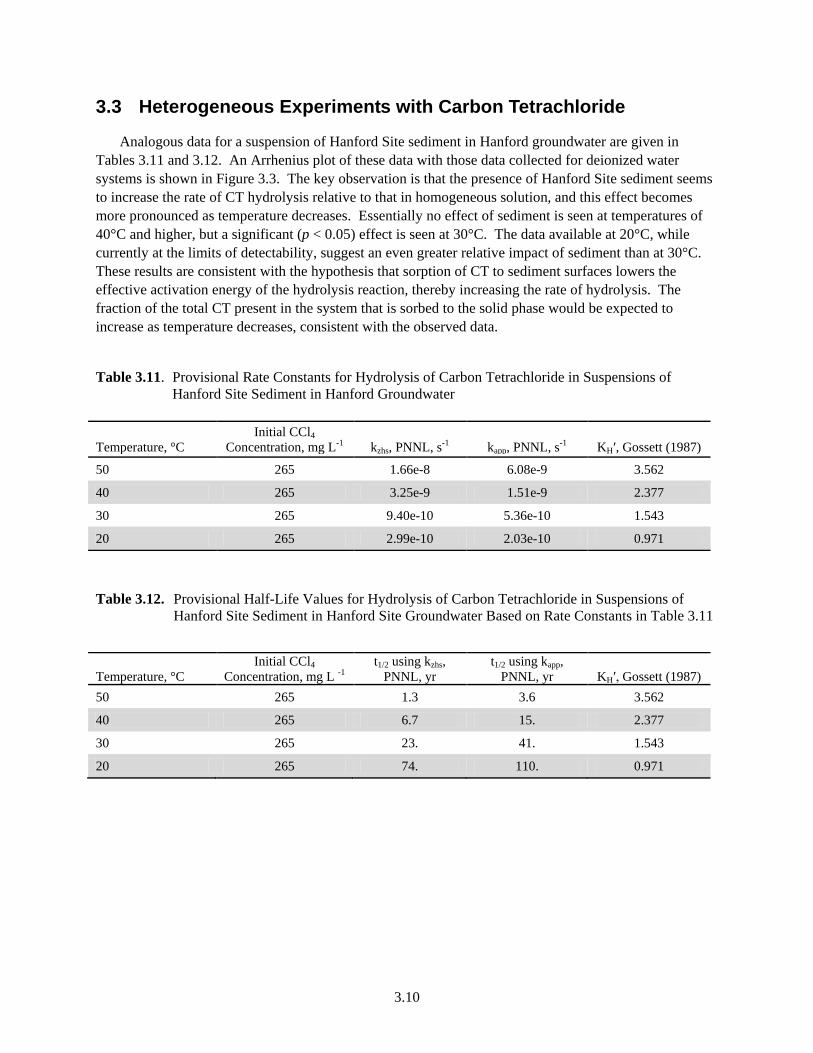
3.3 Heterogeneous Experiments with Carbon Tetrachloride
Analogous data for a suspension of Hanford Site sediment in Hanford groundwater are given in Tables 3.11 and 3.12. An Arrhenius plot of these data with those data collected for deionized water systems is shown in Figure 3.3. The key observation is that the presence of Hanford Site sediment seems to increase the rate of CT hydrolysis relative to that in homogeneous solution, and this effect becomes more pronounced as temperature decreases. Essentially no effect of sediment is seen at temperatures of 40°C and higher, but a significant (p < 0.05) effect is seen at 30°C. The data available at 20°C, while currently at the limits of detectability, suggest an even greater relative impact of sediment than at 30°C. These results are consistent with the hypothesis that sorption of CT to sediment surfaces lowers the effective activation energy of the hydrolysis reaction, thereby increasing the rate of hydrolysis. The fraction of the total CT present in the system that is sorbed to the solid phase would be expected to increase as temperature decreases, consistent with the observed data.
Table 3.11. Provisional Rate Constants for Hydrolysis of Carbon Tetrachloride in Suspensions of Hanford Site Sediment in Hanford Groundwater
Table 3.12. Provisional Half-Life Values for Hydrolysis of Carbon Tetrachloride in Suspensions of Hanford Site Sediment in Hanford Site Groundwater Based on Rate Constants in Table 3.11
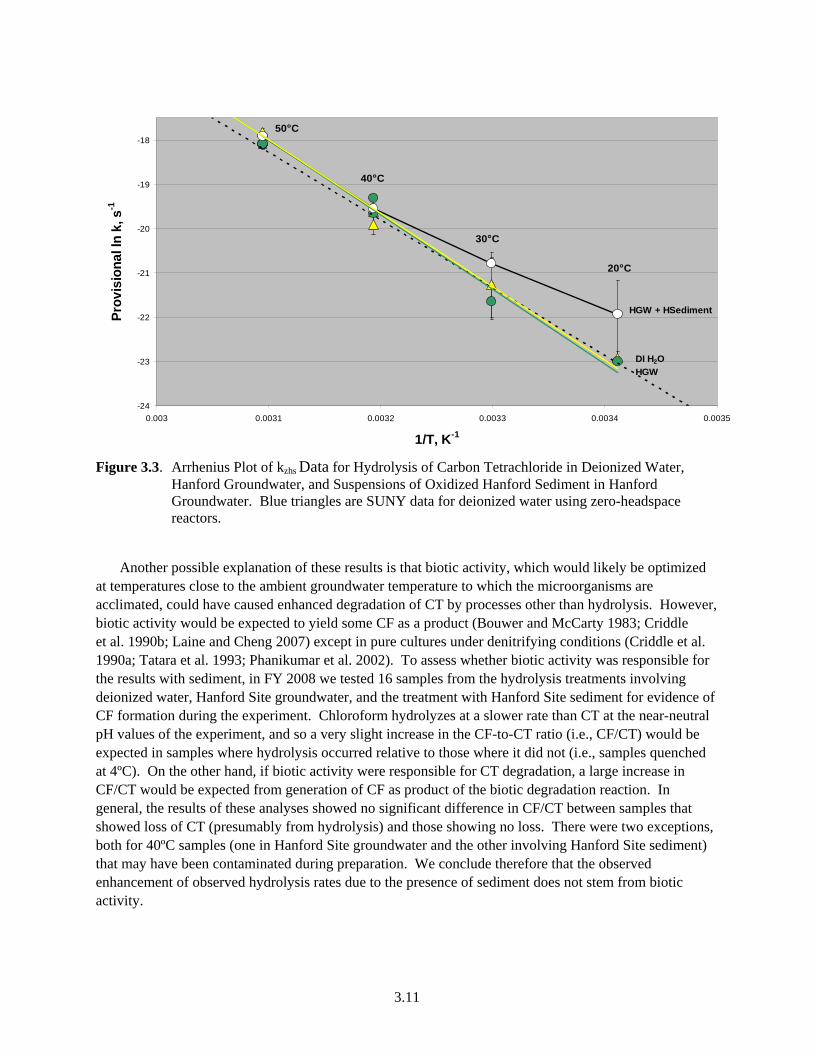
Figure 3.3. Arrhenius Plot of kzhs Data for Hydrolysis of Carbon Tetrachloride in Deionized Water,
Hanford Groundwater, and Suspensions of Oxidized Hanford Sediment in Hanford Groundwater. Blue triangles are SUNY data for deionized water using zero-headspace reactors.
Another possible explanation of these results is that biotic activity, which would likely be optimized
at temperatures close to the ambient groundwater temperature to which the microorganisms are acclimated, could have caused enhanced degradation of CT by processes other than hydrolysis. However, biotic activity would be expected to yield some CF as a product (Bouwer and McCarty 1983; Criddle et al. 1990b; Laine and Cheng 2007) except in pure cultures under denitrifying conditions (Criddle et al. 1990a; Tatara et al. 1993; Phanikumar et al. 2002). To assess whether biotic activity was responsible for the results with sediment, in FY 2008 we tested 16 samples from the hydrolysis treatments involving deionized water, Hanford Site groundwater, and the treatment with Hanford Site sediment for evidence of CF formation during the experiment. Chloroform hydrolyzes at a slower rate than CT at the near-neutral pH values of the experiment, and so a very slight increase in the CF-to-CT ratio (i.e., CF/CT) would be expected in samples where hydrolysis occurred relative to those where it did not (i.e., samples quenched at 4ºC). On the other hand, if biotic activity were responsible for CT degradation, a large increase in CF/CT would be expected from generation of CF as product of the biotic degradation reaction. In general, the results of these analyses showed no significant difference in CF/CT between samples that showed loss of CT (presumably from hydrolysis) and those showing no loss. There were two exceptions, both for 40ºC samples (one in Hanford Site groundwater and the other involving Hanford Site sediment) that may have been contaminated during preparation. We conclude therefore that the observed enhancement of observed hydrolysis rates due to the presence of sediment does not stem from biotic activity.
3.12
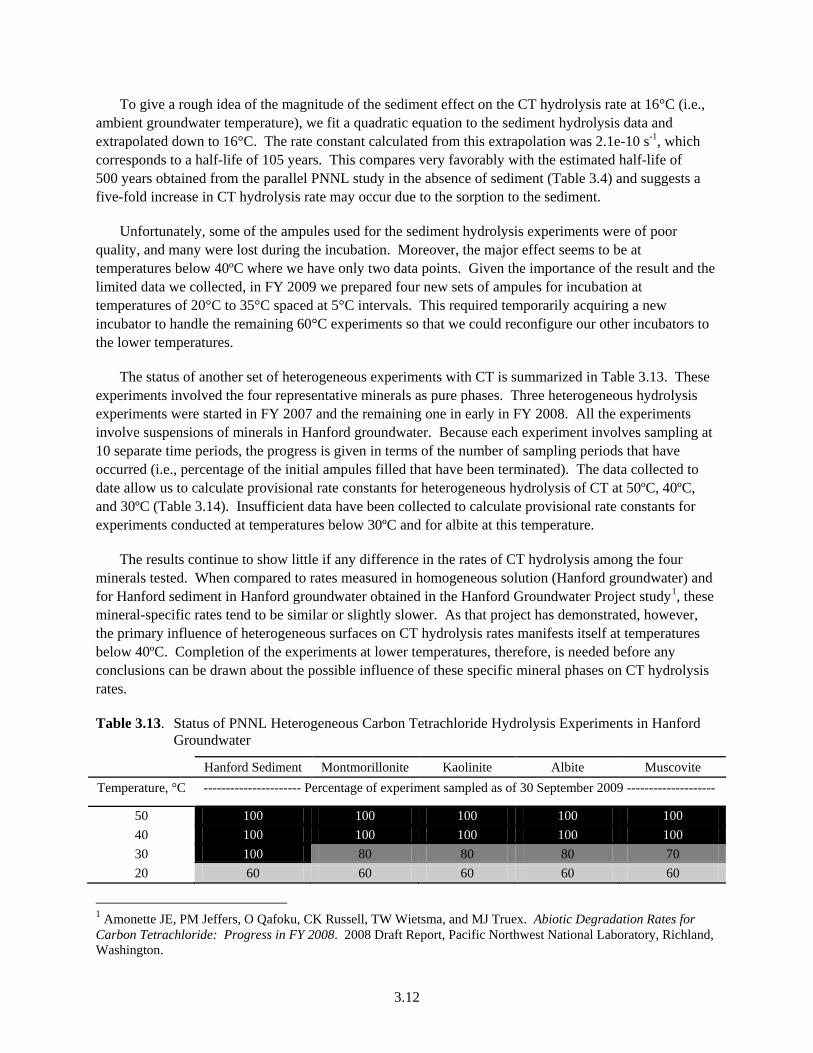
To give a rough idea of the magnitude of the sediment effect on the CT hydrolysis rate at 16°C (i.e., ambient groundwater temperature), we fit a quadratic equation to the sediment hydrolysis data and extrapolated down to 16°C. The rate constant calculated from this extrapolation was 2.1e-10 s-1, which corresponds to a half-life of 105 years. This compares very favorably with the estimated half-life of 500 years obtained from the parallel PNNL study in the absence of sediment (Table 3.4) and suggests a five-fold increase in CT hydrolysis rate may occur due to the sorption to the sediment.
Unfortunately, some of the ampules used for the sediment hydrolysis experiments were of poor quality, and many were lost during the incubation. Moreover, the major effect seems to be at temperatures below 40ºC where we have only two data points. Given the importance of the result and the limited data we collected, in FY 2009 we prepared four new sets of ampules for incubation at temperatures of 20°C to 35°C spaced at 5°C intervals. This required temporarily acquiring a new incubator to handle the remaining 60°C experiments so that we could reconfigure our other incubators to the lower temperatures.
The status of another set of heterogeneous experiments with CT is summarized in Table 3.13. These experiments involved the four representative minerals as pure phases. Three heterogeneous hydrolysis experiments were started in FY 2007 and the remaining one in early in FY 2008. All the experiments involve suspensions of minerals in Hanford groundwater. Because each experiment involves sampling at 10 separate time periods, the progress is given in terms of the number of sampling periods that have occurred (i.e., percentage of the initial ampules filled that have been terminated). The data collected to date allow us to calculate provisional rate constants for heterogeneous hydrolysis of CT at 50ºC, 40ºC, and 30ºC (Table 3.14). Insufficient data have been collected to calculate provisional rate constants for experiments conducted at temperatures below 30ºC and for albite at this temperature.
The results continue to show little if any difference in the rates of CT hydrolysis among the four minerals tested. When compared to rates measured in homogeneous solution (Hanford groundwater) and for Hanford sediment in Hanford groundwater obtained in the Hanford Groundwater Project study1
Table 3.13. Status of PNNL Heterogeneous Carbon Tetrachloride Hydrolysis Experiments in Hanford Groundwater
, these mineral-specific rates tend to be similar or slightly slower. As that project has demonstrated, however, the primary influence of heterogeneous surfaces on CT hydrolysis rates manifests itself at temperatures below 40ºC. Completion of the experiments at lower temperatures, therefore, is needed before any conclusions can be drawn about the possible influence of these specific mineral phases on CT hydrolysis rates.
Hanford Sediment Montmorillonite Kaolinite Albite Muscovite Temperature, °C ---------------------- Percentage of experiment sampled as of 30 September 2009 --------------------
1 Amonette JE, PM Jeffers, O Qafoku, CK Russell, TW Wietsma, and MJ Truex. Abiotic Degradation Rates for Carbon Tetrachloride: Progress in FY 2008. 2008 Draft Report, Pacific Northwest National Laboratory, Richland, Washington.
3.13
Table 3.14. Provisional Rate Constants for Hydrolysis of Carbon Tetrachloride in Suspensions of Minerals in Hanford Groundwater
Mineral Phase Temperature, °C Initial CCl4 Concentration,
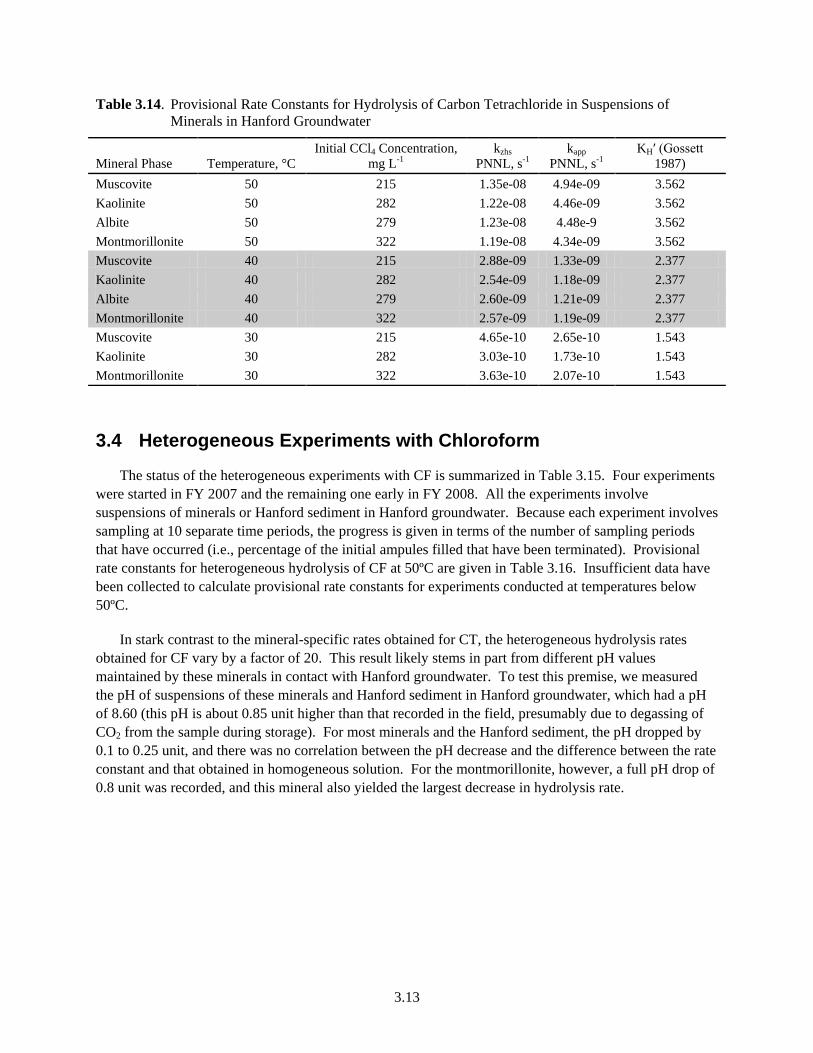
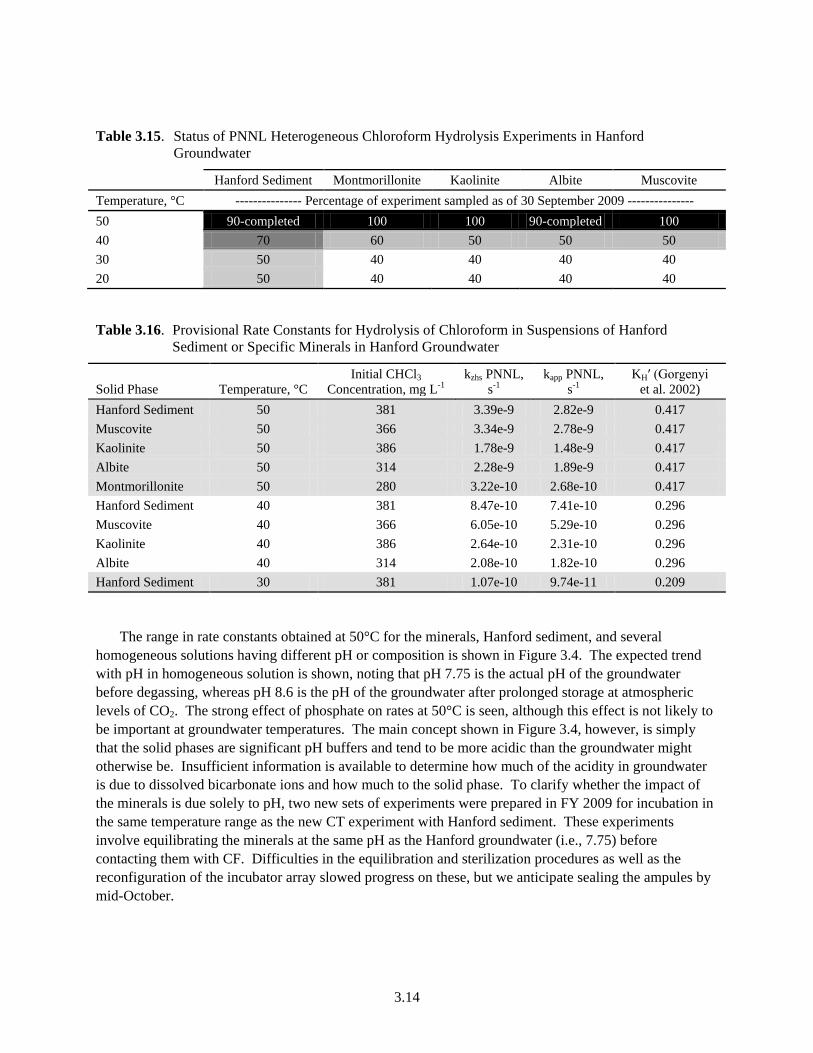
The status of the heterogeneous experiments with CF is summarized in Table 3.15. Four experiments were started in FY 2007 and the remaining one early in FY 2008. All the experiments involve suspensions of minerals or Hanford sediment in Hanford groundwater. Because each experiment involves sampling at 10 separate time periods, the progress is given in terms of the number of sampling periods that have occurred (i.e., percentage of the initial ampules filled that have been terminated). Provisional rate constants for heterogeneous hydrolysis of CF at 50ºC are given in Table 3.16. Insufficient data have been collected to calculate provisional rate constants for experiments conducted at temperatures below 50ºC.
In stark contrast to the mineral-specific rates obtained for CT, the heterogeneous hydrolysis rates obtained for CF vary by a factor of 20. This result likely stems in part from different pH values maintained by these minerals in contact with Hanford groundwater. To test this premise, we measured the pH of suspensions of these minerals and Hanford sediment in Hanford groundwater, which had a pH of 8.60 (this pH is about 0.85 unit higher than that recorded in the field, presumably due to degassing of CO2 from the sample during storage). For most minerals and the Hanford sediment, the pH dropped by 0.1 to 0.25 unit, and there was no correlation between the pH decrease and the difference between the rate constant and that obtained in homogeneous solution. For the montmorillonite, however, a full pH drop of 0.8 unit was recorded, and this mineral also yielded the largest decrease in hydrolysis rate.
3.14
Table 3.15. Status of PNNL Heterogeneous Chloroform Hydrolysis Experiments in Hanford Groundwater
Hanford Sediment Montmorillonite Kaolinite Albite Muscovite Temperature, °C --------------- Percentage of experiment sampled as of 30 September 2009 --------------- 50 90-completed 100 100 90-completed 100 40 70 60 50 50 50 30 50 40 40 40 40 20 50 40 40 40 40
Table 3.16. Provisional Rate Constants for Hydrolysis of Chloroform in Suspensions of Hanford Sediment or Specific Minerals in Hanford Groundwater
The range in rate constants obtained at 50°C for the minerals, Hanford sediment, and several homogeneous solutions having different pH or composition is shown in Figure 3.4. The expected trend with pH in homogeneous solution is shown, noting that pH 7.75 is the actual pH of the groundwater before degassing, whereas pH 8.6 is the pH of the groundwater after prolonged storage at atmospheric levels of CO2. The strong effect of phosphate on rates at 50°C is seen, although this effect is not likely to be important at groundwater temperatures. The main concept shown in Figure 3.4, however, is simply that the solid phases are significant pH buffers and tend to be more acidic than the groundwater might otherwise be. Insufficient information is available to determine how much of the acidity in groundwater is due to dissolved bicarbonate ions and how much to the solid phase. To clarify whether the impact of the minerals is due solely to pH, two new sets of experiments were prepared in FY 2009 for incubation in the same temperature range as the new CT experiment with Hanford sediment. These experiments involve equilibrating the minerals at the same pH as the Hanford groundwater (i.e., 7.75) before contacting them with CF. Difficulties in the equilibration and sterilization procedures as well as the reconfiguration of the incubator array slowed progress on these, but we anticipate sealing the ampules by mid-October.
3.15
0.0E+00
2.0E-09
4.0E-09
6.0E-09
8.0E-09
1.0E-08
1.2E-08
1.4E-08
pH8_
0.1M_P
O4
pH 8.
6 (ca
lc)
Hanfor
d Sed
imen
tMica
Feldsp
ar
Kaolin
ite
pH 7.
75 (c
alc)
Smectite pH
3
Prov
isio
nal k
zhs,
s-1
50 °C
Figure 3.4. Provisional kzhs Data at 50°C for Hydrolysis of Chloroform in Suspensions of Minerals or
Hanford Sediment and in Homogeneous Solutions at Several pH Levels
4.1
4.0 Liquid–Vapor Partition Coefficients
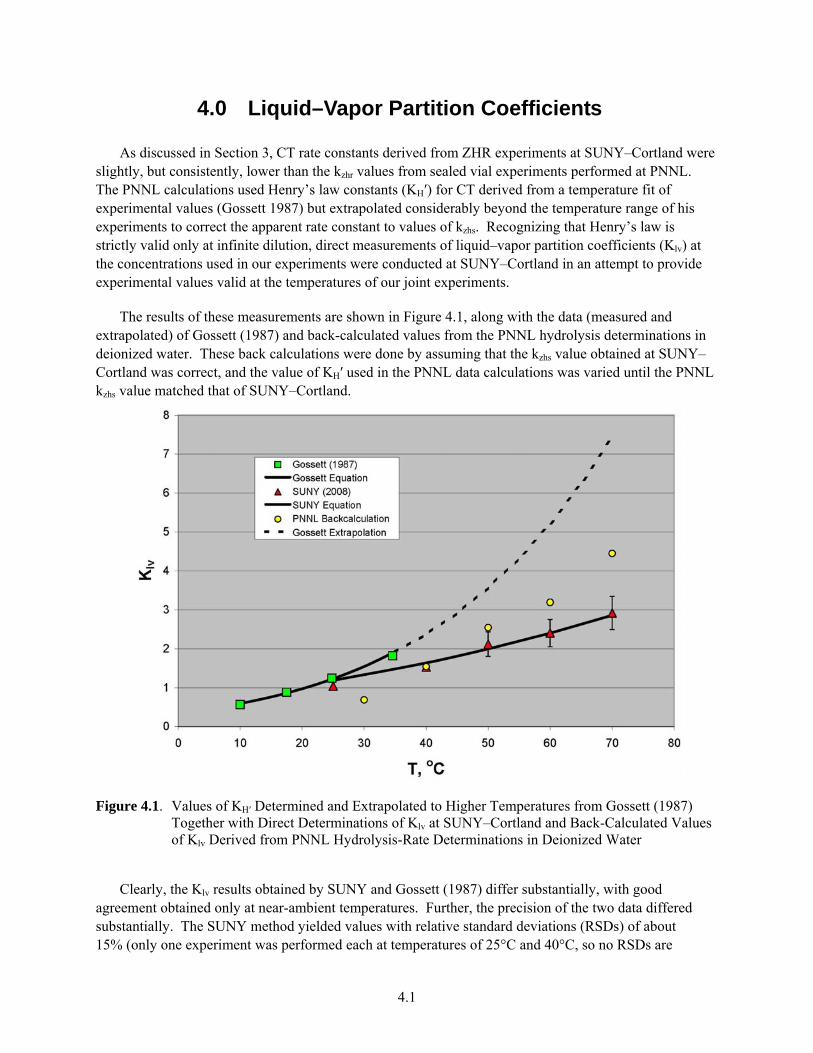
As discussed in Section 3, CT rate constants derived from ZHR experiments at SUNY–Cortland were slightly, but consistently, lower than the kzhr values from sealed vial experiments performed at PNNL. The PNNL calculations used Henry’s law constants (KH′) for CT derived from a temperature fit of experimental values (Gossett 1987) but extrapolated considerably beyond the temperature range of his experiments to correct the apparent rate constant to values of kzhs. Recognizing that Henry’s law is strictly valid only at infinite dilution, direct measurements of liquid–vapor partition coefficients (Klv) at the concentrations used in our experiments were conducted at SUNY–Cortland in an attempt to provide experimental values valid at the temperatures of our joint experiments.
The results of these measurements are shown in Figure 4.1, along with the data (measured and extrapolated) of Gossett (1987) and back-calculated values from the PNNL hydrolysis determinations in deionized water. These back calculations were done by assuming that the kzhs value obtained at SUNY–Cortland was correct, and the value of KH′ used in the PNNL data calculations was varied until the PNNL kzhs value matched that of SUNY–Cortland.
Figure 4.1. Values of KH′ Determined and Extrapolated to Higher Temperatures from Gossett (1987) Together with Direct Determinations of Klv at SUNY–Cortland and Back-Calculated Values of Klv Derived from PNNL Hydrolysis-Rate Determinations in Deionized Water
Clearly, the Klv results obtained by SUNY and Gossett (1987) differ substantially, with good
agreement obtained only at near-ambient temperatures. Further, the precision of the two data differed substantially. The SUNY method yielded values with relative standard deviations (RSDs) of about 15% (only one experiment was performed each at temperatures of 25°C and 40°C, so no RSDs are
4.2
calculated for those two data points), whereas Gossett (1987) reported RSDs of 3%–4%. Gossett measured headspace concentrations of CT and used a valved syringe to avoid errors due to pressure differences between the vials being sampled and the ambient laboratory atmosphere. Because SUNY samples collected were liquids, such precautions were not deemed necessary. Gossett (1987) equilibrated his samples for at least 18 hours, if not longer, whereas the equilibration time used in the SUNY determinations was 15–30 minutes. No data were collected during the SUNY experiments to verify that equilibrium was attained between the liquid and gaseous phases. Just as important, the back-calculated values of Klv needed to obtain agreement between the PNNL and SUNY kzhr values do not match well at all with the SUNY-determined values of Klv. The sum of these factors leads us to question whether the SUNY experiments were successful in measuring true values of Klv. We reluctantly conclude, therefore, that the best values available are still those of Gossett (1987) extrapolated to higher temperatures as necessary.
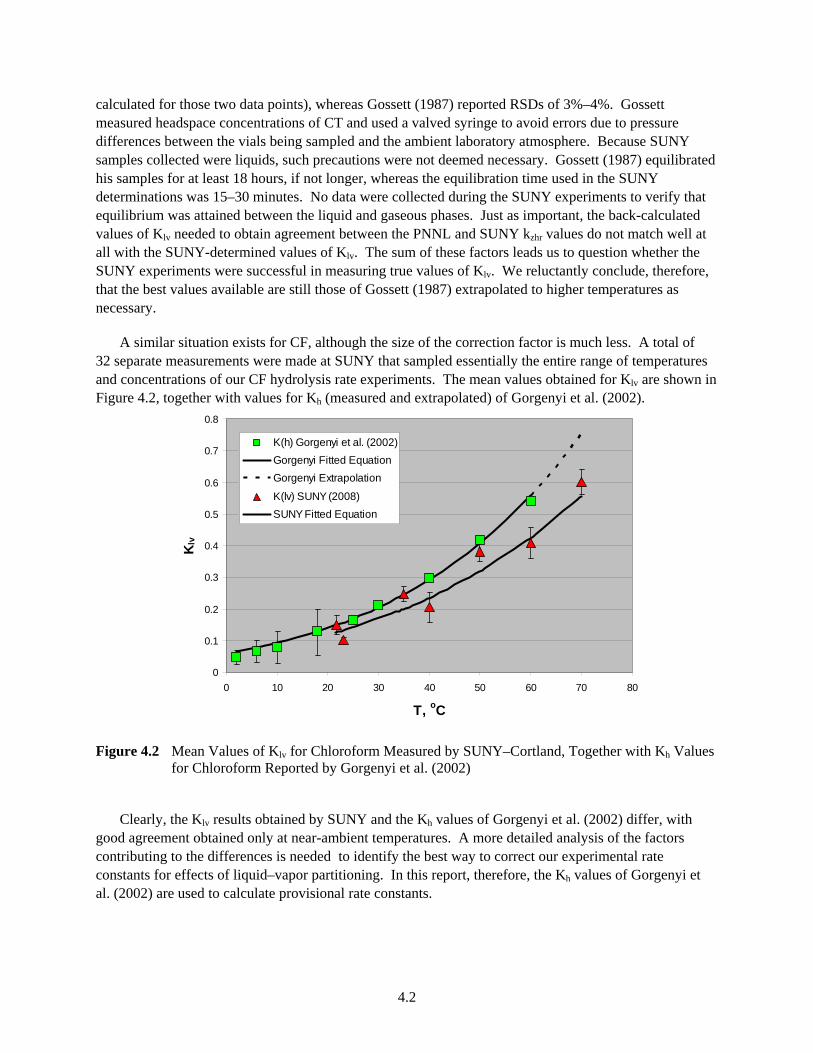
A similar situation exists for CF, although the size of the correction factor is much less. A total of 32 separate measurements were made at SUNY that sampled essentially the entire range of temperatures and concentrations of our CF hydrolysis rate experiments. The mean values obtained for Klv are shown in Figure 4.2, together with values for Kh (measured and extrapolated) of Gorgenyi et al. (2002).
0
0.1
0.2
0.3
0.4
0.5
0.6
0.7
0.8
0 10 20 30 40 50 60 70 80
T, oC
Klv
K(h) Gorgenyi et al. (2002)Gorgenyi Fitted EquationGorgenyi Extrapolation
K(lv) SUNY (2008)SUNY Fitted Equation
Figure 4.2 Mean Values of Klv for Chloroform Measured by SUNY–Cortland, Together with Kh Values for Chloroform Reported by Gorgenyi et al. (2002)
Clearly, the Klv results obtained by SUNY and the Kh values of Gorgenyi et al. (2002) differ, with
good agreement obtained only at near-ambient temperatures. A more detailed analysis of the factors contributing to the differences is needed to identify the best way to correct our experimental rate constants for effects of liquid–vapor partitioning. In this report, therefore, the Kh values of Gorgenyi et al. (2002) are used to calculate provisional rate constants.
5.1
5.0 General Observations and Future Work
In general, the data obtained in this study agree well with those from higher temperatures, once the effects of partitioning into the vapor phase are taken into account. The net result is that slower rates of hydrolysis of CT in homogeneous solution are being measured at near-ambient temperatures than would have been predicted before this study. The precise size of the difference at ambient groundwater temperatures awaits further data. An estimate based on the current data yields homogeneous hydrolysis rates that are two to three times slower at groundwater temperatures than would be predicted from the open literature.
This bleak result is more than offset, however, by the demonstration of a catalytic enhancement of the hydrolysis rate stemming from sorption of CT to Hanford Site sediment. Based on extrapolation from the current data available, we estimate that a five-fold enhancement of hydrolysis rate (relative to that in homogeneous solutions) is likely at a groundwater temperature of 16ºC. This estimated increase in rate translates into a 105-year half-life for CT dissolved in Hanford Site groundwater that is in contact with Hanford Site sediment. Based on analysis of the products, we are confident that the effect of the sediment is not due to biotic or to other redox-related degradation processes. Further, we see no difference in rates obtained in deionized water or in Hanford Site groundwater, only an effect of Hanford sediment.
We must emphasize that the hydrolysis rate data at 20ºC, in contrast to those at higher temperatures, are preliminary and have low statistical power. While significant (p < 0.05) differences between the heterogeneous and homogeneous systems are seen at 30ºC, the results at 20ºC are not statistically significant at this level due to limited data and the very slow nature of the reaction. More time is needed to collect data at these low temperatures to improve the statistical power of our observation.
Given the critical need for hydrolysis rate data at temperatures relevant to groundwater systems, we have three recommendations for future work. First, we recommend a continuation of the sampling and analysis of the remaining long-term sealed-ampule experiments described in this report. As indicated in Table 3.1, these are primarily 20ºC and 30ºC experiments. The data at 20°C, which are most germane to the groundwater environment, will likely take 2 more years before they are complete. Second, due to the importance of heterogeneous effects, we recommend the continuation of sampling and analysis for a similar set of experiments looking at hydrolysis rates of CT and CF in contact with individual minerals (montmorillonite, kaolinite, albite, and muscovite) or Hanford Site sediment, and, for CF, in homogeneous solutions. These experiments were set up under a separate project funded by a congressional earmark (DOE Office of Environmental Management) for which funding expired at the end of FY 2008. Third, we strongly recommend development of a 13C/12C isotope ratio mass spectrometry (IRMS) approach for determination of hydrolysis rates at groundwater temperatures and relevant CT and CF concentrations. The technique is sensitive enough that we expect to be able to shorten the time required for a rate-constant determination by twenty-fold. Thus, a 5-year experiment conducted by the sealed-ampule approach could be shortened to 3 months by the IRMS approach. This sensitivity also would allow the IRMS technique to be used to follow hydrolysis rates at concentrations found in groundwater plumes at Hanford.
Based on the work completed to date, 82 provisional rate constants have been determined. These were chiefly the high-pH and/or high-temperature treatments, for which hydrolysis rates are relatively
5.2
fast. An additional 31 provisional rate constants remain to be determined as data from the lower-pH and lower-temperature experiments become available in the future.
Provisional activation energies were calculated for the homogeneous base-catalyzed experiments with CF. These were 123 kJ mol-1 for 0.01 m NaOH (pH 12), 148 kJ mol-1 for 0.1 m Na3PO4 (pH 12), and 162 kJ mol-1 for 0.1 m phosphate buffer (pH 8). These results were substantially higher than the previously reported value of 105 kJ mol-1 obtained in NaOH. The higher value in NaOH is attributed to the corrections for liquid–vapor partitioning incorporated into the study. The even higher results obtained in phosphate buffers are attributed to parallel hydrolysis reactions caused by the nucleophilic character of the phosphate anions, particularly HPO4
-. Although the activation energies in the phosphate buffers are higher than in NaOH, the rates observed are similar at groundwater temperatures. It is surmised that neither phosphate nor HCO3
-, which is common in groundwaters and has a nucleophilic character comparable to HPO4
-, significantly increases the rates of hydrolysis for CF over those observed in waters where they are absent.
A twenty-fold range in hydrolysis rate constants was obtained for CF in contact with various solid phases at 50ºC. This high sensitivity to type of solid is likely due to the different pH values maintained by the solid surface in contact with the aqueous phase. Further work to clarify this is planned. In contrast, very little effect of mineral type on CT hydrolysis rates was noted. This is consistent with the pH hypothesis for CF because CT hydrolyzes only by a neutral, pH-independent mechanism.
At SUNY–Cortland, liquid–vapor partition coefficients (Klv) for CF were measured at the temperatures and CF concentrations used in our homogeneous hydrolysis experiments. These coefficients differed from the values for the Henry’s law constant (Kh) reported in the literature; in general, the Klv values were lower, and the size of the difference from Kh increased with temperature.
Key achievements of this project have been the 1) initiation of 13 major low-temperature experiments at PNNL involving a total of nearly 4800 ampules; 2) completion of one major set of experiments at pH 12 for base-catalyzed hydrolysis of CF involving work at both PNNL and SUNY–Cortland; 3) collection of preliminary evidence suggesting that nucleophiles other than H2O and OH- (such as HPO4
2- and HCO3-) can accelerate the abiotic degradation of CF at high temperatures, but that their
effects are negligible at temperatures and concentrations typical of groundwaters; and 4) measurement of Klv values for CF demonstrating the departure from Henry’s law under the conditions of our experiments. Our results confirm the large difference between the neutral and base-catalyzed homogeneous hydrolysis rates for CF in homogeneous solution. Consistent with the dominance of the base-catalyzed reaction, initial results for heterogeneous hydrolysis of CF suggest that the pH maintained at the solid surface will largely dictate the rate at which CF hydrolyzes.
Sampling and analysis of these experiments in the next several years to complete this unique dataset will result in an improved predictive capability that incorporates the effects of both temperature and solid phase. Such a capability is essential to a scientifically based approach to remediation of CT and CF contamination in groundwater systems.
6.1
6.0 References
Amonette JE, PM Jeffers, O Qafoku, CK Russell, TW Wietsma, and MJ Truex. 2009. Carbon Tetrachloride and Chloroform Attenuation Parameter Studies: Heterogeneous Hydrolytic Reactions. PNNL-18735, Pacific Northwest National Laboratory, Richland, Washington.
Bouwer EJ and PL McCarty. 1983. “Transformations of halogenated organic compounds under denitrification conditions.” Applied and Environmental Microbiology 45(4):1295–1299.
Criddle CS, JT DeWitt, D Grbic-Galic, and PL McCarty. 1990a. “Transformation of carbon tetrachloride by Pseudomonas sp. strain KC under denitrification conditions.” Applied and Environmental Microbiology 56(11):3240–3246.
Criddle CS, JT DeWitt, and PL McCarty. 1990b. “Reductive dehalogenation of carbon tetrachloride by Escherichia coli K-12.” Applied and Environmental Microbiology 56(11):3247–3254.
Gorgenyi M, J Dewulf, and H Van Langenhove. 2002. “Temperature dependence of Henry’s law constant in an extended temperature range.” Chemosphere 48(7):757–762.
Gossett JM. 1987. “Measurement of Henry’s law constants for C1 and C2 chlorinated hydrocarbons.” Environmental Science & Technology 21(2):202–208.
Jeffers PM, C Brenner, and NL Wolfe. 1996. “Hydrolysis of carbon tetrachloride.” Environmental Toxicology and Chemistry 15(7):1064–1065.
Jeffers PM, P Coty, S Luczak, and NL Wolfe. 1994. “Halocarbon hydrolysis rates - a search for ionic strength and heterogeneous effects.” Journal of Environmental Science and Health, Part A 29(4):821–831.
Jeffers PM, LM Ward, LM Woytowitch, and NL Wolfe. 1989. “Homogeneous hydrolysis rate constants for selected chlorinated methanes, ethanes, ethenes and propanes.” Environmental Science & Technology 23(8):965–969.
Laine DF and IF Cheng. 2007. “The destruction of organic pollutants under mild reaction conditions: A review.” Microchemical Journal 85(2):183–193.
Oostrom M., ML Rockhold, PD Thorne, MJ Truex, GV Last, and VJ Rohay. 2007. “Carbon tetrachloride flow and transport in the subsurface of the 216-Z trench at the Hanford Site.” Vadose Zone Journal 6(4):971–984.
Phanikumar MS, DW Hyndman, DC Wiggert, MJ Dybas, ME Witt, and CS Criddle. 2002. “Simulation of microbial transport and carbon tetrachloride biodegradation in intermittently-fed aquifer columns.” Water Resources Research 38(4):1033, doi: 10.1029/2001WR000289.
Riley RG, DS Sklarew, CF Brown, PM Gent, JE Szecsody, AV Mitroshkov, and CJ Thompson. 2005. Carbon Tetrachloride and Chloroform Partition Coefficients Derived from Aqueous Desorption of
6.2
Contaminated Hanford Sediments. PNNL-15239, Pacific Northwest National Laboratory, Richland, Washington.
Schwarzenbach RP, PM Gschwend, and DM Imboden. 1993. Environmental Organic Chemistry. John Wiley & Sons, New York.
Swain CG and CB Scott. 1953. Quantitative correlation of relative rates. “Comparison of hydroxide ion with other nucleophilic reagents toward alkyl halides, esters, epoxides and acyl halides.” Journal of the American Chemical Society 75(1):141–147.
Tatara, GM, MJ Dybas, and CS Criddle. 1993. “Effects of medium and trace metals on kinetics of carbon tetrachloride transformation by Pseudomonas sp. strain KC.” Applied and Environmental Microbiology 59(7):2126–2131.
Truex MJ, CJ Murray, CR Cole, RJ Cameron, MD Johnson, RS Skeen, and CD Johnson. 2001. Assessment of Carbon Tetrachloride Groundwater Transport in Support of the Hanford Carbon Tetrachloride Innovative Technology Demonstration Program. PNNL-13650, Pacific Northwest National Laboratory, Richland, Washington.
PNNL-19142
Distribution
No. of No. of Copies Copies
Distr.1
Offsite R. B. Rowley Office of Groundwater and Soil
Remediation EM-22/Cloverleaf Building U.S. Department of Energy 1000 Independence Avenue SW Washington, DC 20585-2040 G. Chamberlain
Office of Groundwater and Soil Remediation
EM-22/Cloverleaf Building U.S. Department of Energy 1000 Independence Avenue SW Washington, DC 20585-2040 P. M. Jeffers c/o Department of Chemistry Bowers Hall SUNY–Cortland P.O. Box 2000 Cortland, NY 13045
Onsite 2 DOE Richland Operations Office
M. Thompson A6-38 A. Tortoso A6-38
3 CH2M HILL Plateau Remediation
Company S. W. Petersen R3-50 V. J. Rohay H8-15 C. Sutton R3-50
7 Pacific Northwest National Laboratory
J. E. Amonette K8-96 M. D. Freshley K9-33 J. S. Fruchter K6-96 O. Qafoku K8-96 C. K. Russell K8-96 M. J. Truex K6-96 T. W. Wietsma K8-96