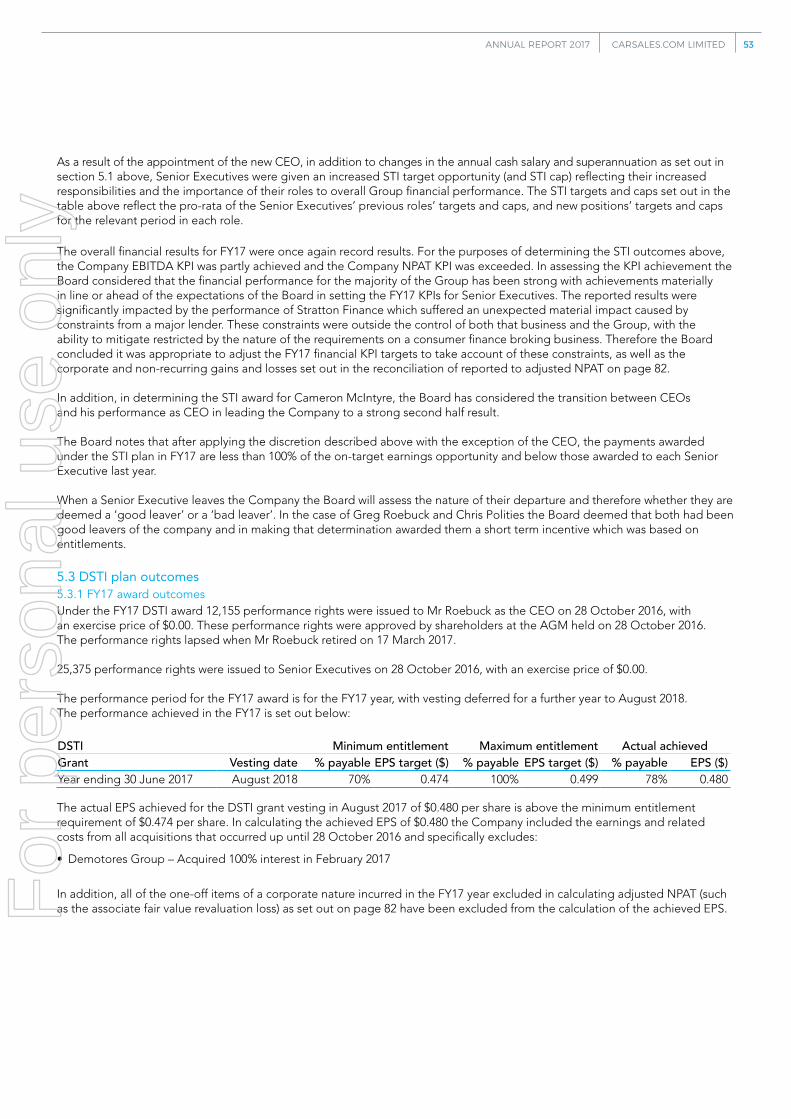
Appendix 4E carsales.com Ltd ABN 91 074 444 018 Results for Announcement to the Market Full-year ended 30 June 2017 (Previous corresponding period: Full-year ended 30 June 2016) A$’000 Revenue from ordinary activities Up 8.2% to 372,114 Profit from ordinary activities after tax attributable to members Up 0.2% to 109,479 Net profit for the period attributable to members Up 0.2% to 109,479 Dividends / Distribution Amount per security Franked amount per security 2016 Final Dividend paid 19.5 cents 19.5 cents 2017 Interim Dividend paid 18.7 cents 18.7 cents 2017 Final Dividend declared 21.5 cents 21.5 cents 2017 final dividend dates Record date for determining entitlements to the dividends 22 nd September 2017 Latest date for dividend reinvestment plan participation 25 th September 2017 Dividend payable 19 th October 2017 30 June 2017 30 June 2016 Net tangible assets backing per ordinary share 31.93 cents 27.60 cents Other information required by Listing Rule 4.3A Other information requiring disclosure to comply with Listing Rule 4.3A is contained in the 30 June 2017 Financial Report. For personal use only
Transcript
Appendix 4E
carsales.com Ltd
ABN 91 074 444 018
Results for Announcement to the Market
Full-year ended 30 June 2017 (Previous corresponding period: Full-year ended 30 June 2016)
A$’000
Revenue from ordinary activities Up 8.2% to 372,114
Profit from ordinary activities after tax attributable to members Up 0.2% to 109,479
Net profit for the period attributable to members Up 0.2% to 109,479
Dividends / Distribution Amount per security
Franked amount per security
2016 Final Dividend paid 19.5 cents 19.5 cents
2017 Interim Dividend paid 18.7 cents 18.7 cents
2017 Final Dividend declared 21.5 cents 21.5 cents
2017 final dividend dates
Record date for determining entitlements to the dividends 22nd September 2017
Latest date for dividend reinvestment plan participation 25th September 2017
Dividend payable 19th October 2017
30 June 2017 30 June 2016
Net tangible assets backing per ordinary share 31.93 cents 27.60 cents
Other information required by Listing Rule 4.3A
Other information requiring disclosure to comply with Listing Rule 4.3A is contained in the 30 June
2017 Financial Report. For
per
sona
l use
onl
y
Appendix 4E - carsales.com Ltd
ABN 91 074 444 018 CONTINUED
This page intentionally left blank
For
per
sona
l use
onl
y
ANNUAL REPORT 2017
ABN 91 074 444 018
For
per
sona
l use
onl
y
$119.1m adjusted NPAT up 8%
$372.1m revenue up 8%
$176.5m group EBITDA up 4%
CONTENTS
Our Vision 03
Our Business 04
Our Performance 05
Our Financial Performance 06
Chair and Chief Executive Officer’s Report 08
Our Strategy 10
Our Customers 12
Our Global Business 14
Our Brands 15
Building Our Brands 16
Our Future 18
The carsales World 20
Directors’ Report 22
Our People 26
Corporate Governance 33
Our Leadership Team 34
Our Remuneration Chair’s Report 38
Remuneration Report 39
Other Directors’ Disclosures 63
Auditor’s Independence Declaration 67
Financial Statements 68
Directors’ Declaration 113
Independent Auditor’s Report to the 114 Members of carsales.com Limited
Shareholder Information 120
Corporate Directory 123
ABN 91 074 444 018 CARSALES.COM LIMITED02F
or p
erso
nal u
se o
nly
Every day carsales helps thousands of people across the world buy and sell vehicles. Our vision is to make buying and selling vehicles easy and frictionless – for consumers, dealers and manufacturers alike. From a first car to a dream car; from a tool of trade to a leisure vehicle, we empower consumers of all types giving them confidence when they transact online, regardless of how much they know about cars (or boats or bikes or caravans or trucks).
We strive to be the compelling, trusted leader in every market in which we operate – whether in Australia or other regions around the world as we extend the reach of our business. We do this by empowering our people
to deliver world-class customer-centric solutions which help all our customers buy and sell with confidence. Whether it is a car, motorbike, caravan, truck, boat or combine harvester, we bring the same level of technology and
knowledge to ensure buyers and sellers have rewarding outcomes. We aim to deliver superior results for all our customers, whether they are consumers, dealers or manufacturers.
OUR VISION
ANNUAL REPORT 2017 CARSALES.COM LIMITED 03F
or p
erso
nal u
se o
nly
Today in our home market of Australia, more vehicles are sold using the carsales Network than anywhere else. We are one of Australia’s original disruptors and have expanded to include a large number of market-leading brands. Our business began in 1997 with carz.com.au, which grew into carsales.com.au, Australia’s leading automotive classifieds site. In 2009 the Company floated on the Australian Securities Exchange (ASX) as carsales.com Ltd.
Today, the carsales Network is Australia’s number one online destination for buying and selling cars, motorbikes, trucks, boats, caravans and machinery. Our market-leading Australian news and classifieds sites are augmented by classifieds businesses in Argentina, Brazil, Chile, Colombia, Mexico and South Korea. Our RedBook valuation and data business has operations in
Australia, New Zealand, China, Thailand and Malaysia. Our software is used by thousands of vehicle dealers to manage inventory and enquiries and to access market intelligence.
Our businesses around the world are underpinned by data and content. Our unique vehicle data taxonomy is used around the world to classify, report on and value vehicles. Our market intelligence is second to none, and helps both manufacturers and dealers with planning and sales strategies. Our data also underpins an innovative suite of targeted advertising solutions, used by a range of industry partners to provide relevant offers to consumers.
Data science and artificial intelligence are deployed across the business to assist with processing improvements and time-saving opportunities.
We publish editorial content on our site including reviews, road tests, comparisons and industry news, ensuring our users are fully informed. It is the power of the whole that drives carsales forward.
As one of Australia’s original technology innovators, we understand how vital continuous improvement is to our success. We have a global outlook and strive to attract, retain, empower and celebrate a truly diverse workforce that is empowered to deliver world- class solutions.
The Company is committed to having a positive impact on the community. We achieve this through a diverse range of initiatives and employment practices and through our charitable arm, the carsales Foundation.
OUR BUSINESS
ANNUAL REPORT 2017 CARSALES.COM LIMITED04F
or p
erso
nal u
se o
nly
OUR PERFORMANCE
Dealers around the world
29,864*
Cars for sale around the world
Up 20%**
733,219*
across all devices 30 June (Google Analytics)
carsales Australian network monthly audience
9,440,522
carsales visitors spend over 4x more time
on site than visitors to our nearest competitor (Nielsen Digital Ratings, June 2017)
Higher engagement
a car sold every minute on
carsales.com.au
4.7 million carsales members**
up 19% viewed on and off site in FY17
More than 16.3 equivalent years
of video
RBI inspections performed
over 125,000
more preferred than our nearest competitor
(Nature Research Australia, June 2017)
carsales.com.au
4 times
* Excludes iCar Asia.** PCP.
Australia’s most visited
2x the traffic (across desktop, mobile
and app) than our nearest competitor
(Nielsen Digital Ratings, June 2017)
Commanding content
11.3xmore page views than our nearest competitor (Nielsen Digital Ratings, June 2017)
Unique visitors to our sites around
the world as at 30 June 2017
25.3m*
(Nielsen Digital Ratings, June 2017, Google Analytics, June 2017)
ANNUAL REPORT 2017 CARSALES.COM LIMITED 05F
or p
erso
nal u
se o
nly
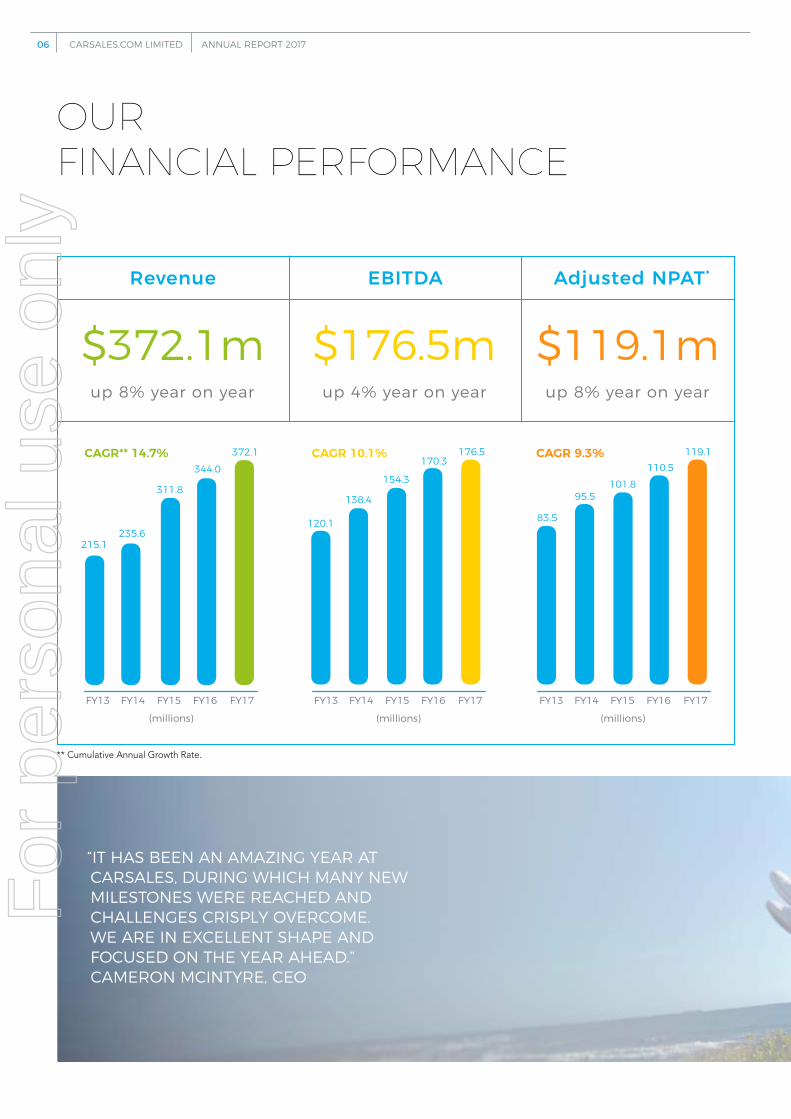
OUR FINANCIAL PERFORMANCE
Revenue EBITDA Adjusted NPAT*
up 8% year on year up 4% year on year up 8% year on year
$372.1m $176.5m $119.1m
“IT HAS BEEN AN AMAZING YEAR AT CARSALES, DURING WHICH MANY NEW MILESTONES WERE REACHED AND CHALLENGES CRISPLY OVERCOME. WE ARE IN EXCELLENT SHAPE AND FOCUSED ON THE YEAR AHEAD.” CAMERON MCINTYRE, CEO
FY13 FY14 FY15 FY16 FY17
CAGR** 14.7%
215.1235.6
311.8
344.0372.1 CAGR 10.1%
120.1
138.4
154.3
170.3176.5
FY13 FY14 FY15 FY16 FY17
CAGR 9.3%
83.5
95.5101.8
110.5119.1
FY13 FY14 FY15 FY16 FY17
(millions) (millions) (millions)
** Cumulative Annual Growth Rate.
ANNUAL REPORT 2017 CARSALES.COM LIMITED06F
or p
erso
nal u
se o
nly
A$ Millions GrowthYear ending 30 June 2017 FY17 FY16 $M %Revenue – Online Advertising Services 269.1 240.7 28.4 12– Data, Research and Services 39.3 35.9 3.4 10– International 8.3 4.4 3.9 87– Finance and Related Services 55.4 63.0 (7.6) (12)Total revenue 372.1 344.0 28.1 8Total operating expenses (before interest and depreciation and amortisation) (195.6) (173.7) (21.9) (13)
Profit before tax 159.6 154.4 5.2 3Income tax expense (48.3) (47.4) (0.9) (2)Profits from associates 8.5 5.3 3.2 61Gain on sale of business - 0.9 (0.9) n/a(Loss)/gain on associates fair value adjustment and investment dilution (6.8) 0.9 (7.7) n/aNon-controlling interest (NCI) (3.5) (4.8) 1.3 27
Reported net profit after tax 109.5 109.3 0.2 -Reported earnings per share (cents) 45.4 45.4 - -
Adjusted net profit after tax* 119.1 110.5 8.6 8Adjusted earnings per share (cents)* 49.4 45.9 3.5 8
* Adjusted NPAT and earnings per share above are post non-controlling interests and exclude gain on associate dilution, one-off gain on sale of business, associate one-off tax gain, associate fair value revaluation loss, and non-cash acquired intangible asset amortisation. See Note 6 of the financial statements for reconciliation to reported NPAT and earnings per share.
ANNUAL REPORT 2017 CARSALES.COM LIMITED 07F
or p
erso
nal u
se o
nly
Thank you for your support of our world class organisation this year. It has been an amazing year at carsales, during which many new milestones were reached and challenges overcome. We are in excellent shape and focused on the year ahead.
It’s very pleasing to report yet another year of record financial performance with revenue up 8% on the previous corresponding period (pcp) to $372.1m. There have been key contributions from carsales, core domestic business units; with Stratton Finance moving back into revenue growth in the 4th quarter, and our other adjacent business opportunities such as Redbook Inspect and tyresales continuing to demonstrate strong ongoing revenue growth.
Earnings before interest, tax and depreciation/amortisation (EBITDA) was up 4% to $176.5m with EBITDA margins contracting slightly to 47%. This performance reflects the ongoing expansion of core business margins, as the company continues to utilise its operating leverage, offset by our fast growing, early stage, lower margin businesses, such as tyresales.
Adjusted Net Profit After Tax (NPAT) increased 8% to $119.1m and total dividend payments in the FY17 year were $92.2m; up 4% on the previous year.
This year marked the company’s 20th birthday. From our suburban beginnings on Blackburn Road in Mount Waverley, Melbourne, with the idea of developing a parts exchange product, we could not have imagined we would become the world class organisation of over 1,250 people around the globe (and growing) we are today.
Our operational performanceDomestic automotive selling conditions have remained consistent over the past twelve months, despite some month to month patchiness in new car sales volumes. We have seen consistent performance in metrics such as used car lead volumes and average time to sell with both steady.
Across both our consumer and commercial business units, we have continued to drive new product innovation in a bid to improve consumer experience, enable
customers to differentiate their offerings and where possible reduce the number of friction points in the buy/sell process. Products such as advertising depth, instant offer and the launch of our natural language search are three clear examples of the effort going into strengthening our market leading products. There is plenty more to come with our investments in data science and artificial intelligence providing further opportunities to create more compelling personalised experiences for consumers and our commercial customers.
The Stratton management team have worked tirelessly over the past 12 months to reset the business back onto a path of growth by making a number of operational and product changes. There is still much to be done but the business has been able to demonstrate the positive impact of the changes made by delivering solid pcp revenue growth in the 4th quarter.
We see our international expansion as one of the key contributors to our long term growth strategy, and over the past twelve months we have continued to see some very positive developments. In February this year we acquired the online automotive classifieds business Demotores in Argentina, Chile and Colombia, which further consolidated our strong position in Latin America.
We have continued to work well with our partners in Brazil and South Korea and have seen excellent growth in these markets as the management teams of both Webmotors and SK Encar continue to extend their market leading positions. A number of times this year we visited each of these important operations and have established closer operational and governance links with our partners. In all of our Latin American markets our customers are looking to build on their digital selling capability. We believe that with our technology and IP, we are in a strong position to support the evolution of these markets over time.
CHAIR AND CHIEF EXECUTIVE OFFICER’S REPORT
Cameron McIntyreManaging Director and CEO
Jeffrey BrowneNon-Executive Chair
ANNUAL REPORT 2017 CARSALES.COM LIMITED08F
or p
erso
nal u
se o
nly
Board changes2017 marked the year Greg Roebuck, our carsales co-founder, decided that it was time to conquer his travel bug, his long list of hobbies and interests, and his desire to spend more time with his wonderful family. In March this year Greg retired from his position with the Company, and Cameron McIntyre was appointed to the position of Managing Director and CEO. While the departure of a very successful founder can be difficult, the Board has been very pleased with the smooth transition between Greg and Cameron and the positive response received to the change both internally and externally.
The Board would like to express its deep gratitude to Greg for his years of leadership and the passion and energy he brought to the business every day. Greg developed a dynamic and talented leadership team, and he has left the Company in the best of hands.
Executive changes in responsibilitiesAs a result of the change of Managing Director and CEO there were several changes in Key Management Personnel (KMP) responsibilities, which have supported the ongoing development of our KMP talent and succession planning. We have brought together all of our commercial customer operations under Anthony Saines, Managing Director Commercial, reflecting the converging demand for innovative data-rich products and services across our dealer and manufacturer customers. Our consumer businesses have been brought together under Ajay Bhatia, Managing Director Consumer Business, which will increase our focus on providing frictionless buy/sell/own services to consumers at every point of their journey.
As the Company’s size and complexity have continued to evolve, we also made some very positive changes to the Executive Leadership Team (ELT). Michael Holmes our Executive Director Dealer, Nicole Birman, General Counsel and Company Secretary, Lisa Sheehan,
Chief People Officer and Jason Blackman, Chief Information Officer, were all appointed to the ELT. They bring with them extensive carsales and industry experience, which has further enhanced the capability and diversity of the team. Andrew Demery and Kellie Cordner, our most capable CFO and CMO, continued to maintain their positions on the ELT throughout the year.
People and communityPeople are at the heart of carsales’ success and we pride ourselves on developing a collaborative and innovative culture. We have invested (and will continue to do so) in the development of a strong and highly capable team to ensure we are in the best position possible to leverage the growth opportunities ahead.
In addition to continuing our sponsorship of two university students through our carsales Foundation scholarships, this year we launched the ‘Next Gear’ Graduate Program, which will see the intake of eight university graduates from early 2018 in both commercial and technology disciplines. We had an overwhelming response to our first formal graduate offering and we are very pleased with the graduates who will be joining us in 2018. The intake selection program involved many of our senior business leaders who were enormously impressed with the level of talent they saw. We are pleased to be closely supporting the development of local talent while building generations of carsales leadership to come.
Our support of community is an important part of who we are and we have once again continued to strongly advocate for the White Ribbon program. Given the importance of the prevention of domestic violence against women and the large male audience we having using our sites every day, we are in a strong position to enhance and promote community awareness of this important program.
Capital managementcarsales regularly reviews its capital structure to ensure it is maximising returns to shareholders. Continued solid earnings growth, coupled with prudent balance sheet management which includes relatively low gearing enable the Company to consider capital management initiatives on an ongoing basis.
The Board has declared a final FY17 dividend payment of 21.5 cents per share fully franked, up 10% on pcp, bringing the total FY17 dividends to 40.2 cents per share and representing an increase year on year of 2.9 cents per share – or 8%. The Board believes that the current dividend payout ratio of adjusted earnings of 81% reflects an appropriate balance between profit distribution to shareholders and reinvestment in the future growth in earnings.
Towards a successful FY18We are extremely grateful to the team we have at carsales. Our success is a clear and direct result of their passion and dedication to the Company. Our people are the envy of the markets they serve and we would like to publically thank each and every one of them for what they bring to our business each day.
Finally, on behalf of the Board we would like to thank all of our customers and partners around the world for their support and engagement over the past 12 months and we look forward to working with them all again in FY18.
Thank you for your support of our world-class organisation.
Cameron McIntyreManaging Director and CEO
Jeffrey BrowneNon-Executive Chair
ANNUAL REPORT 2017 CARSALES.COM LIMITED 09F
or p
erso
nal u
se o
nly
Advertising and data services are the foundation of our business and we will continue to provide a compelling world-class experience for consumers and customers as we bring together buyers and sellers. Innovation is vital to ensuring our network of sites is the No.1 destination for auto intenders in the markets in which we operate. Our core products include classified advertising, display advertising and data and research services.
But connecting buyers and sellers is only one part of our business. We strive to provide a frictionless end-to-end buying and selling experience and leverage our trusted brand and customer relationships throughout the ownership period. We have a number of adjacent businesses and services, such as Stratton Finance, RedBook Inspect, RedBook Warranty, PayProtect and tyresales.com.au, that all extend the
core services we offer and increasingly engage with the consumer during the ownership period.
Over the next year we will continue to invest in new products and businesses to benefit our consumers and customers. We anticipate growing these businesses and services and expanding the range of ownership services we provide over the coming years.
OUR STRATEGYOUR STRATEGY IS TO GROW THE THREE PILLARS OF OUR BUSINESS: CORE ADVERTISING AND DATA SERVICES, COMPLEMENTARY ADJACENT BUSINESSES, AND INTERNATIONAL OPERATIONS. THIS STRATEGY ALLOWS US TO MAXIMISE VALUE FOR OUR CUSTOMERS AND SHAREHOLDERS BY EXPANDING THE BREADTH AND DEPTH OF SERVICES WE OFFER ACROSS NEW MARKETS AND GEOGRAPHIES.
ANNUAL REPORT 2017 CARSALES.COM LIMITED10F
or p
erso
nal u
se o
nly
To reflect the evolving needs of our customers and provide a seamless range of integrated services, in March 2017 we brought together all of our Australian customer-facing operations into two divisions – commercial and consumer. The commercial division comprises our dealer, agency and manufacturer focused teams, reflecting the increasing
closeness between manufacturers and dealers and the alignment in the demand for data driven advertising solutions. Our consumer team brings together all of our membership, consumer classified products and adjacencies into a single division to focus on providing a frictionless buying, selling and ownership experience.
We have operations in 12 countries around the world and our strategy to leverage and extend the 20 years’ experience carsales has in Australia into developing markets globally continues. We seek to be a compelling No.1 in the markets in which we operate and utilise our global technology platform and IP to bring the same experience to consumers and customers no matter where they live.
12 countriesoperations in
worldwide
ANNUAL REPORT 2017 CARSALES.COM LIMITED 11F
or p
erso
nal u
se o
nly
OURCUSTOMERSOUR CUSTOMERS ARE THE LIFE BLOOD OF OUR BUSINESS AND THIS YEAR HAS SEEN US INCREASE OUR FOCUS ON THEM. WE HAVE CONCENTRATED ON SEAMLESS CUSTOMER OUTCOMES BY BRINGING TOGETHER ALL OUR CUSTOMER FACING TEAMS INTO TWO DIVISIONS – CONSUMER AND COMMERCIAL. WE HAVE OVER 250 PEOPLE IN AUSTRALIA WHO INTERACT WITH CUSTOMERS DAILY AND ARE DEDICATED TO MAKING THEIR EXPERIENCE WITH CARSALES, A GREAT ONE.
ConsumerThis year has seen us increase our focus on the consumer and put our goal of delivering a frictionless buy/ sell/own experience at the centre of all we do. This has been positively reflected in customer satisfaction metrics as well as the performance of our complementary adjacent products and services.
Our peace of mind offering was extended this year to help consumers buy and sell with greater trust and certainty. For those consumers who want to get an immediate sales result or are not confident about dealing with buyers in a traditional sale process, our instant offer product has proved popular. The introduction of RedBook Warranty enables buyers to cover their cars outside manufacturer warranty periods, to avoid unexpected costs. PayProtect, an escrow service powered by Assembly, has been integrated into the transaction journey to help remove payment risks for both buyers and sellers transacting online.
Our RedBook Inspect vehicle inspections service continues to resonate with buyers, driving solid consumer growth, and with business customers such as Uber. RedBook Inspect retail pre-purchase, asset finance inspection services and private inspections have all performed well, with over 125,000 inspections carried out this year alone. More RedBook Inspect Approved Roadworthy Stations have been rolled out in QLD, NSW and ACT, which will allow us to maximise utilisation of the assets of the business.
One of the major opportunities that carsales has in Australia lies with our
4.7 million members. This audience drives higher engagement. Investment in greater personalisation and one-to-one member marketing capability is yielding good results. This year has seen us grow both active members and member sign-in rates.
tyresales has continued to grow its market share and is now cementing itself as a significant player in the Australian tyre market. tyresales continues to delight consumers by being a transparent, safe and cost-efficient place to buy the right tyres for their vehicle. This year has seen accelerated growth, almost doubling the volume of tyres sold year on year. We have worked to
expand our consumer offering whilst maintaining a customer satisfaction rating of well over four stars on productreview.com.au.
4.7m members in Australia
125,000inspections carried out this year
over
ANNUAL REPORT 2017 CARSALES.COM LIMITED12F
or p
erso
nal u
se o
nly
Commercial carsales is helping to change the way the automotive industry works, bringing manufacturers, dealers and media agencies closer together. Our philosophy of ‘genuine buyers, authentic data, products that work’ is paying dividends in the results delivered to all our customers, and our financial performance. Our focus more than ever is around creating innovative, data-rich products and services that provide unmatched insights into industry and consumer behaviour, as well as helping our customers achieve their commercial goals in a way that works for them. Our commercial customers are increasingly seeing carsales as a business partner to help them achieve success in all areas of their business, rather than just a supplier of leads, advertising space and raw data.
The vast reservoir of valuable data our business generates is transforming the way our commercial customers make decisions and interact with consumers. Consumers move effortlessly between desktops, tablets and smartphones and our data enables us to assist our commercial customers to interact with consumers via a more personalised experience.
Our unparalleled commitment to dealers over the years has been rewarded with strong beneficial relationships and a focus on delivering successful outcomes for all parties. This year we have made further investments in our relationships by setting up the Dealer Comparison Board and Dealer Advisory Board to enable us to work together more closely, and roll out mutually beneficial products and services.
We are continually investing in our platforms to deliver better performance and increased
functionality for our dealer customers, whilst also migrating the platform to the cloud in order to scale globally. In adding more mobile solutions for dealers, we aim to put the most relevant information into dealers’ hands in real time.
Our focus on depth products for dealers has delivered good growth this year and the demand for these products across our customer base bodes well for the growth opportunity in coming years. Our dealer customers now receive more information than ever into the performance of their businesses on our platforms and the quality of consumer interactions generated. We aim to constantly improve the depth and breadth of these insights as we invest further in data science and data visualisation tools.
We are training more and more dealers and sharing knowledge at more and more events so our customers can make smarter business decisions. This year saw the advent of more training seminars for our dealer clients, and the registered numbers exceeded expectation. There were over 180 attendees from dealers nationally, and the attendee mix of each session included employees from both franchised and independent businesses. The training commitment will continue into FY18, with sessions conducted quarterly throughout the country.
We continue to evolve our non-classified advertising products and services to be more data-centric and provide attribution, whether they arefor dealer, agency or OEM customers. Our relationships with manufacturers have continued to improve and our wider suite of advertising solutions and insightful products are all gaining increased traction. The increased take- up of clearance centres, website builds, certified pre-owned programs, click-to-buy sales and one-off consumer events such as the Hyundai Hail Sale have delivered our manufacturers and dealers pleasing results.
We continue to expand our portfolio of bespoke ‘native’ ad units that are focused on delivering strong commercial outcomes rather than simply generating ad impressions. We help our manufacturers save money as well as spend money more wisely. Clients can target consumers more effectively to reach the right audience at the right time in the right context as we continue to add value from our investments in insights and data science. Our investment in programmatic solutions takes advantage of the structural change sweeping the advertising industry whilst maintaining our laser-like focus on data integrity and protection.
ANNUAL REPORT 2017 CARSALES.COM LIMITED 13F
or p
erso
nal u
se o
nly
THIS YEAR HAS SEEN CARSALES INCREASE ITS COMMITMENT TO OUR OVERSEAS BUSINESSES AS WE BUILD FOR FUTURE GROWTH. Our strategy is to be the compelling and trusted market leader in every market in which we operate and to act as a truly global business. FY17 has seen us strengthen the management and processes in our international businesses, and continue the roll out of our technology and IP, making us the number one auto classifieds network in Latin America.
We are seeing positive signs that our focus on improving operational metrics and customer experience is positioning us well to deliver growth for all our international investments.
We have significant interests in the top three economies in Latin America. The purchase of Demotores (with operations in Argentina, Chile and Colombia) in 2017 helped extend our presence in the region and strengthened our market position in Chile. Our confidence in the region underpins our investment strategy of taking full or majority ownership of investments.
Mexico has a strong new car market with production now at an all-time high. The Mexican market saw its best ever year in terms of new car sales in the calendar year 2016, and 2017 is promising to be just as impressive. We continue to strengthen our position in the Mexican market as we extend into Mexico City, and have seen significant increases in dealer numbers, leads and conversion across the country.
We have delivered a new retail site and app in Mexico, a new retail site in Chile and our leading technology has been installed across the region, underpinning our performance and improved customer experience.
Webmotors is continuing to extend its position as the number one auto portal in Brazil with strong traffic and lead growth. Investments in product and
technology together with a strategic focus and operational excellence sees Webmotors well positioned to benefit for a rebound in macro-economic conditions.
Our Latin American businesses are now working collaboratively across the region. This has been significantly aided by seconding senior carsales staff from head office into the region to strengthen the teams, share our knowledge and facilitate collaboration.
SK Encar has delivered strong growth through continued deployment of dealer products, including inspections and depth products, combined with growth in display advertising. South Korean turmoil both domestically and within the region, has failed to deter the business from achieving strong results during the year.
OURGLOBAL BUSINESS
We are seeing positive signs that our focus on improving operational metrics and customer experience is
positioning us well to deliver growth for all our international investments.
ANNUAL REPORT 2017 CARSALES.COM LIMITED14F
or p
erso
nal u
se o
nly
OURBRANDS
Domestic products and services
Domestic
International
clAcelera hacia tu próximo auto
ANNUAL REPORT 2017 CARSALES.COM LIMITED 15F
or p
erso
nal u
se o
nly
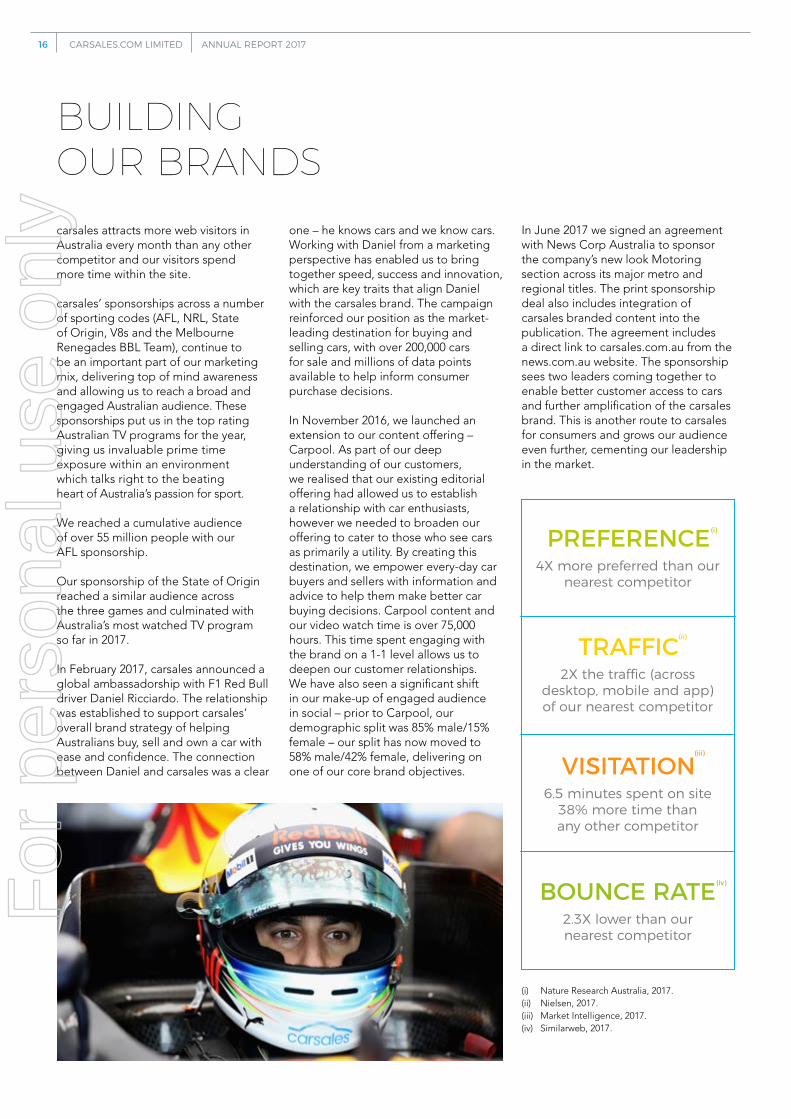
carsales attracts more web visitors in Australia every month than any other competitor and our visitors spend more time within the site.
carsales’ sponsorships across a number of sporting codes (AFL, NRL, State of Origin, V8s and the Melbourne Renegades BBL Team), continue to be an important part of our marketing mix, delivering top of mind awareness and allowing us to reach a broad and engaged Australian audience. These sponsorships put us in the top rating Australian TV programs for the year, giving us invaluable prime time exposure within an environment which talks right to the beating heart of Australia’s passion for sport.
We reached a cumulative audience of over 55 million people with our AFL sponsorship.
Our sponsorship of the State of Origin reached a similar audience across the three games and culminated with Australia’s most watched TV program so far in 2017.
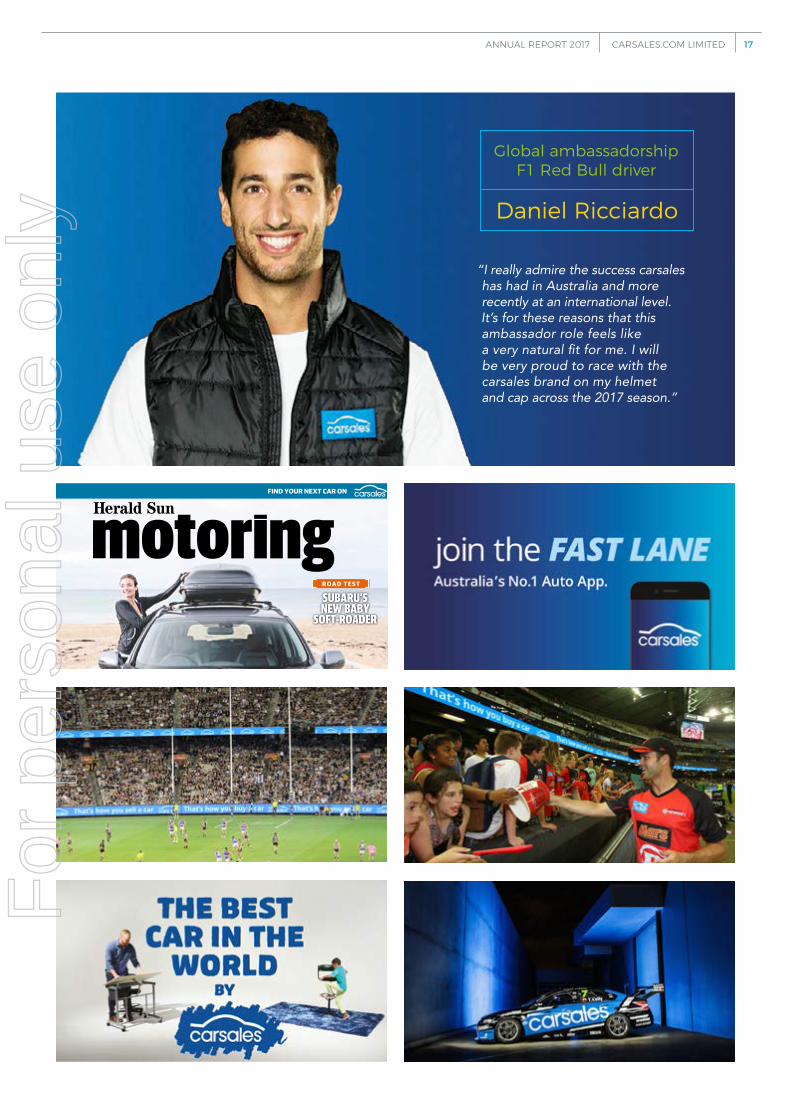
In February 2017, carsales announced a global ambassadorship with F1 Red Bull driver Daniel Ricciardo. The relationship was established to support carsales’ overall brand strategy of helping Australians buy, sell and own a car with ease and confidence. The connection between Daniel and carsales was a clear
one – he knows cars and we know cars. Working with Daniel from a marketing perspective has enabled us to bring together speed, success and innovation, which are key traits that align Daniel with the carsales brand. The campaign reinforced our position as the market-leading destination for buying and selling cars, with over 200,000 cars for sale and millions of data points available to help inform consumer purchase decisions.
In November 2016, we launched an extension to our content offering – Carpool. As part of our deep understanding of our customers, we realised that our existing editorial offering had allowed us to establish a relationship with car enthusiasts, however we needed to broaden our offering to cater to those who see cars as primarily a utility. By creating this destination, we empower every-day car buyers and sellers with information and advice to help them make better car buying decisions. Carpool content and our video watch time is over 75,000 hours. This time spent engaging with the brand on a 1-1 level allows us to deepen our customer relationships. We have also seen a significant shift in our make-up of engaged audience in social – prior to Carpool, our demographic split was 85% male/15% female – our split has now moved to 58% male/42% female, delivering on one of our core brand objectives.
In June 2017 we signed an agreement with News Corp Australia to sponsor the company’s new look Motoring section across its major metro and regional titles. The print sponsorship deal also includes integration of carsales branded content into the publication. The agreement includes a direct link to carsales.com.au from the news.com.au website. The sponsorship sees two leaders coming together to enable better customer access to cars and further amplification of the carsales brand. This is another route to carsales for consumers and grows our audience even further, cementing our leadership in the market.
desktop, mobile and app) of our nearest competitor
VISITATION6.5 minutes spent on site
38% more time than any other competitor
BOUNCE RATE2.3X lower than our nearest competitor
PREFERENCE4X more preferred than our
nearest competitor
(i)
(ii)
(iii)
(iv)
ANNUAL REPORT 2017 CARSALES.COM LIMITED16F
or p
erso
nal u
se o
nly
“I really admire the success carsales has had in Australia and more recently at an international level. It’s for these reasons that this ambassador role feels like a very natural fit for me. I will be very proud to race with the carsales brand on my helmet and cap across the 2017 season.”
Global ambassadorship F1 Red Bull driver
Daniel Ricciardo
R O A D T E S T
SUBARU’S NEW BABY
SOFT-ROADER
ROOM TO GROW FAMILY SIZE: HONDA’S BIGGER CR-V
ANNUAL REPORT 2017 CARSALES.COM LIMITED 17F
or p
erso
nal u
se o
nly
OURFUTUREFOR 20 YEARS CARSALES HAS BEEN A LEADING INNOVATOR IN AUTOMOTIVE DIGITAL ADVERTISING IN AUSTRALIA.
Innovation will be central to the next era of carsales as we maximise the value of the data we generate. Our investment in data science and insights means we are delivering more and more insightful data to our customers. This is, in turn, building stronger relationships with manufacturers and dealers and giving consumers better experiences.
We will continue to invest in innovation in order to streamline experiences for customers and make the process of buying, selling or advertising easier. Machine learning and artificial intelligence will be significant technologies that we can exploit to deliver benefits to customers and the Company.
Our in-house developed products like Cyclops (an artificial intelligence-based product that reads photographs), Ryvuss (our intelligent search engine) and Pegasus (the latest version of our website), will be augmented by our natural language search interface – a first for automotive classifieds in Australia. Our new recommendation engine will make searching and researching faster and simpler, further augmenting the consumer experience.
Year after year, our business pushes technological boundaries and optimises processes. We are investing in a suite of data management and marketing activation tools so we can develop a unified real-time view of our customers – a ‘single source of truth’ – leading to a deeper, more anticipatory customer relationship.
The automotive market is evolving powered by technological change and demands from consumers. carsales is uniquely placed in the Australian automotive market to
lead this evolution with strong relationships with dealers, manufacturers, and all the other participants in the automotive value chain.
A.I. in action – CyclopsCyclops Image Recognition Software was developed this year to improve the efficiency, accuracy and consistency of photos uploaded to ads on site.
The cutting-edge software, with 97.2% accuracy, automatically selects and assigns angles to each image uploaded by our photographers directly onto the carsales platform to help showcase various aspects of the vehicle. Cyclops also has an AI feedback mechanism so it automatically learns from its mistakes and improves accuracy over time.
Prior to the implementation of Cyclops on the carsales platform, every image of a car uploaded into our carsales Media Library by Photo Services staff was manually categorised according to the angle featured in the image. Now with Cyclops, each image is automatically assigned an angle.
For example, a user who is selling an SUV and has uploaded images of the front exterior, side exterior, front seats and dashboard will be prompted to upload an image of the backseat too. This is because Cyclops knows this is one of the most common features people research when purchasing an SUV.
ANNUAL REPORT 2017 CARSALES.COM LIMITED18F
or p
erso
nal u
se o
nly
We will continue to invest in innovation in order to streamline experiences for customers and make the process of buying, selling or advertising easier.
ANNUAL REPORT 2017 CARSALES.COM LIMITED 19F
or p
erso
nal u
se o
nly
THE CARSALES WORLD
carsales.com LtdStaff: 502Offices: Melbourne, Sydney, Perth, Adelaide and Brisbane Stratton FinanceStaff: 230Offices: Melbourne and Sydney tyresalesStaff: 14Offices: Melbourne and Perth
Auto ExchangeStaff: 16Offices: Perth and Melbourne
RedBook InspectStaff: 52Office: Sydney
SK Encar – South Korea*Staff: 125 Office: Seoul
SoloAutos – MexicoStaff: 53Office: Guadalajara
Chileautos – ChileStaff: 36Office: Santiago Demotores – ArgentinaStaff: 27Office: Buenos Aires Webmotors – Brazil*Staff: 206Office: São Paulo
* Reflects minority shareholding investments.
RedBook International Staff: 28
China Office: Beijing
Thailand Office: Bangkok
Malaysia Office: Kuala Lumpur
New Zealand Office: Auckland
ANNUAL REPORT 2017 CARSALES.COM LIMITED20F
or p
erso
nal u
se o
nly
THE CLOSE OF FY17 SEES OUR INTERNATIONAL PORTFOLIO WELL POSITIONED WITH STRONG ORGANIC GROWTH CONTINUING IN SK ENCAR, POSITIVE MOMENTUM BUILDING IN WEBMOTORS AND OUR LATAM STRATEGY ENHANCED BY THE ACQUISITION OF DEMOTORES, GIVING US ACCESS TO THE LARGE ARGENTINIAN MARKET AND CONSOLIDATING OUR NO.1 POSITION IN CHILE.
EXPANDING GLOBAL NETWORK
AUSTRALIA/NEW ZEALAND
223,805*cars
LATIN AMERICA
509,414*
cars
*Cars advertised for sale on carsales network sites as at 30 June 2017.
ANNUAL REPORT 2017 CARSALES.COM LIMITED 21F
or p
erso
nal u
se o
nly
Operational and Financial ReviewPrinciple Activitiescarsales is the Australian automotive classified market leader and facilitates anyone to buy and sell a car, bike, boat, caravan and much more across our network of sites (set out on page 15).
Our key services, customers and geographies include:
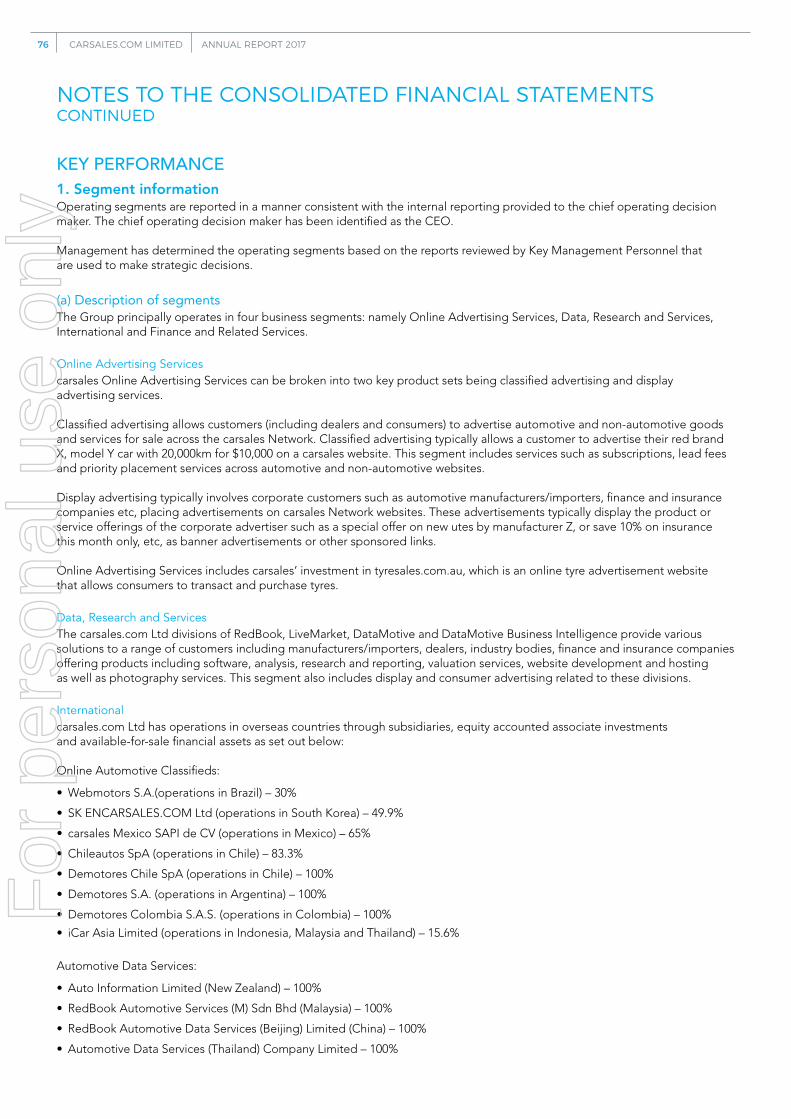
Online Advertising Servicescarsales Online Advertising Services can be broken into two key product sets being classified advertising and display advertising services.
Classified advertising allows customers (including dealers and consumers) to advertise automotive and non-automotive goods and services for sale across the carsales Network. Classified advertising typically allows a customer to advertise their red brand X, model Y car with 20,000km for $10,000 on a carsales website. This segment includes services such as subscriptions, lead fees and priority placement services (depth products) across automotive and non-automotive websites.
Display advertising typically involves corporate customers, such as automotive manufacturers/importers, finance and insurance companies etc, placing advertisements on carsales Network websites. These advertisements typically display the product or service offerings of the corporate advertiser such as a special offer on new utes by manufacturer Z, or save 10% on insurance this month only etc, as banner advertisements or other sponsored links.
Online advertising includes carsales’ investment in tyresales.com.au which is an online tyre retailer that allows consumers to transact and purchase tyres; and RedBook Inspect which provides inspection services published online as part of classified advertisements.
Data, Research and ServicesThe carsales divisions of RedBook, LiveMarket, DataMotive and DataMotive Business Intelligence provide various solutions to a range of customers including manufacturers/importers, dealers, industry bodies, and finance and insurance companies. They offer products including software, analysis, research and reporting, valuation services, website development and hosting as well as photography services.
Finance and Related ServicesFinance and Related Services includes the Stratton Finance Pty Ltd subsidiary which provides innovative finance arrangements for vehicles, boats, and other leisure items, vehicle procurement and other related services to customers. Revenues arise from commissions paid by finance providers and other related service providers. It also includes the equity accounted associates RateSetter Australia Pty Ltd and PromisePay Pte Ltd.
Internationalcarsales has operations in overseas countries through subsidiaries, equity accounted associate investments and available-for-sale financial assets as set out below: Online Automotive Classifieds:
• Webmotors S.A. (operations in Brazil) – 30%
• SK ENCARSALES.COM Ltd (operations in South Korea) – 49.9%
• carsales Mexico SAPI de CV (SoloAutos) (operations in Mexico) – 65%
• Chileautos SpA (operations in Chile) – 83.3%
• Demotores Chile SpA (operations in Chile) – 100%
• Demotores S.A. (operations in Argentina) – 100%
• Demotores Colombia S.A.S. (operations in Colombia) – 100%
• iCar Asia Limited (operations in Indonesia, Malaysia and Thailand) – 15.6%
Automotive Data Services:
• Auto Information Limited (New Zealand) – 100%
• RedBook Automotive Services (M) Sdn Bhd (Malaysia) – 100%
• RedBook Automotive Data Services (Beijing) Limited (China) – 100%
• Automotive Data Services (Thailand) Company Limited – 100%
DIRECTORS’ REPORTYOUR DIRECTORS PRESENT THEIR REPORT ON THE CONSOLIDATED ENTITY (REFERRED TO HEREAFTER AS THE GROUP) CONSISTING OF CARSALES.COM LTD AND THE ENTITIES IT CONTROLLED AT THE END OF, OR DURING, THE YEAR ENDED 30 JUNE 2017.
This year has seen solid contributions from carsales’ core domestic business units and very pleasingly Stratton Finance moved back into revenue growth in the fourth quarter. Our other adjacent business opportunities such as RedBook Inspect and tyresales are continuing to demonstrate strong ongoing revenue growth potential.
ANNUAL REPORT 2017 CARSALES.COM LIMITED22F
or p
erso
nal u
se o
nly
Group Financial Results2017 was a strong year in most parts of the business as we continued to strengthen our domestic market position and deliver on our strategy of growth in core digital advertising and data services, complementary adjacent businesses and international markets. FY17 was another year of record financial performance with Group operating revenue rising to $372.1m, up 8% on the prior comparative period (pcp).
Group earnings remained solid with EBITDA up 4% on pcp to $176.5m and EBITDA margins of 47%.
Excluding the Finance and Related Services segment, revenue growth was 13% on pcp and EBITDA growth was 7% on pcp.
Adjusted NPAT attributable to the owners of carsales.com Ltd was $119.1m, up 8% on the pcp. Reported NPAT attributable to the owners of carsales.com Ltd was $109.5m, up $0.2m on pcp.
The Directors believe the additional information on International Financial Reporting Standards (IFRS) measures included in this report is relevant and useful in measuring the financial performance of the Group. In particular, the presentation of ‘adjusted net profit’ and ‘adjusted earnings per share’ provides the best measure to assess the performance of the Group by excluding gain on associate dilution, one-off gain on sale of business, associate one-off tax gain, associate fair value revaluation loss, and non-cash acquired intangible asset amortisation from the reported IFRS measures.
carsales Domestic Highlights Core domestic segments of Online Advertising Services and Data, Research and Services exhibited good revenue growth of 12% and 10% respectively, reflecting a solid performance from core digital advertising products.
Growth was enhanced by acceleration in our adjacent businesses (particularly tyresales and Redbook Inspect) and premium listing/depth products.
Online Advertising Services
• Dealer revenue was up 8% on pcp to $133.5m reflecting both solid growth in revenue from traditional transactional revenue products (subscriptions, leads and listings) as well as continued growth in the demand for premium listing and depth products. The introduction of free leads for used cars under $4k positively impacted used car inventory levels.
• Private revenue is was up 27% on pcp to $65.0m reflecting both strong growth from adjacent markets (particularly tyresales and Redbook Inspect) and an improved performance in core private online ads, which benefited from an increase in the take up of premium listing products. Private automotive ad volumes were up 8% in the second half supported by the extension of the basic free ad threshold to cars under $5k.
• Display revenue up 7% to $70.6m reflecting the continued demand from OEMs for our evolving product set. Our insights and analytics capability is being integrated with the core display product set making our products stickier and enabling better targeting of our solutions. Our relationships with OEMs continue to improve across the board with refreshed products such as clearance centres, certified pre-owned programmes and ‘main events’ continuing to deliver significant value for customers.
Data, Research and Services
Data, Research and Services revenue was up 10% to $39.3m. There was strong demand for our Data, Research and Services from OEMs, with the business demonstrating its agility in responding to changing customer needs in an increasingly data driven
market place. There was continued solid growth from Livemarket, driven by volume growth and yield. Our RedBook business continues to expand its product range and capability and to display pleasing growth.
Finance and Related Services
Finance and Related Services revenue is down 12% to $55.4m, with gross profit down 5% on pcp to $44.7m, reflecting volume capacity constraints experienced by a major lender throughout the year. The business responded well to this challenge with overall core finance broking revenue declining by only 3% on pcp and 8% up on pcp in the second half. Underlining this improvement, the volume of loans financed still grew between FY16 and FY17. However, this was offset by lower yields being achieved on reduced average volume bonuses. Finance lead generation remains strong and initiatives are being put in place to improve conversion rates, with a lower cost to serve.
Domestic Operations
Costs were well controlled across the business leading to EBITDA up 4% on pcp to $176.5m. EBITDA margins declined from 50% to 47% reflecting the issues experienced in the Finance segment, and the increased contribution of lower margin adjacent services, particularly tyresales and Redbook Inspect. Underlying core domestic business margins improved 1% on pcp. Depreciation and amortisation increased by $2.5m on the prior period reflecting acquisition intangible asset amortisation and depreciation of capitalised labour supporting group wide integration and globalisation projects. Net finance costs fell by $1.5m to $6.9m reflecting lower average debt levels through the year.
ANNUAL REPORT 2017 CARSALES.COM LIMITED 23F
or p
erso
nal u
se o
nly
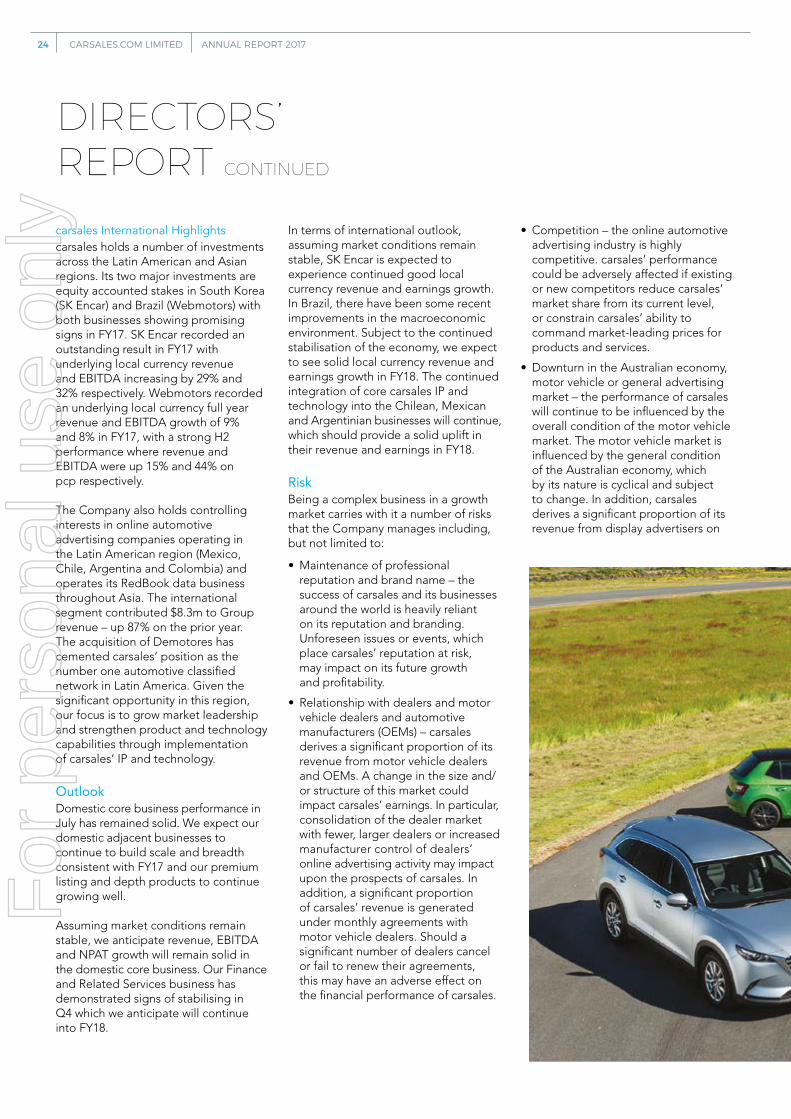
carsales International Highlightscarsales holds a number of investments across the Latin American and Asian regions. Its two major investments are equity accounted stakes in South Korea (SK Encar) and Brazil (Webmotors) with both businesses showing promising signs in FY17. SK Encar recorded an outstanding result in FY17 with underlying local currency revenue and EBITDA increasing by 29% and 32% respectively. Webmotors recorded an underlying local currency full year revenue and EBITDA growth of 9% and 8% in FY17, with a strong H2 performance where revenue and EBITDA were up 15% and 44% on pcp respectively.
The Company also holds controlling interests in online automotive advertising companies operating in the Latin American region (Mexico, Chile, Argentina and Colombia) and operates its RedBook data business throughout Asia. The international segment contributed $8.3m to Group revenue – up 87% on the prior year. The acquisition of Demotores has cemented carsales’ position as the number one automotive classified network in Latin America. Given the significant opportunity in this region, our focus is to grow market leadership and strengthen product and technology capabilities through implementation of carsales’ IP and technology.
OutlookDomestic core business performance in July has remained solid. We expect our domestic adjacent businesses to continue to build scale and breadth consistent with FY17 and our premium listing and depth products to continue growing well.
Assuming market conditions remain stable, we anticipate revenue, EBITDA and NPAT growth will remain solid in the domestic core business. Our Finance and Related Services business has demonstrated signs of stabilising in Q4 which we anticipate will continue into FY18.
In terms of international outlook, assuming market conditions remain stable, SK Encar is expected to experience continued good local currency revenue and earnings growth. In Brazil, there have been some recent improvements in the macroeconomic environment. Subject to the continued stabilisation of the economy, we expect to see solid local currency revenue and earnings growth in FY18. The continued integration of core carsales IP and technology into the Chilean, Mexican and Argentinian businesses will continue, which should provide a solid uplift in their revenue and earnings in FY18.
RiskBeing a complex business in a growth market carries with it a number of risks that the Company manages including, but not limited to:
• Maintenance of professional reputation and brand name – the success of carsales and its businesses around the world is heavily reliant on its reputation and branding. Unforeseen issues or events, which place carsales’ reputation at risk, may impact on its future growth and profitability.
• Relationship with dealers and motor vehicle dealers and automotive manufacturers (OEMs) – carsales derives a significant proportion of its revenue from motor vehicle dealers and OEMs. A change in the size and/or structure of this market could impact carsales’ earnings. In particular, consolidation of the dealer market with fewer, larger dealers or increased manufacturer control of dealers’ online advertising activity may impact upon the prospects of carsales. In addition, a significant proportion of carsales’ revenue is generated under monthly agreements with motor vehicle dealers. Should a significant number of dealers cancel or fail to renew their agreements, this may have an adverse effect on the financial performance of carsales.
• Competition – the online automotive advertising industry is highly competitive. carsales’ performance could be adversely affected if existing or new competitors reduce carsales’ market share from its current level, or constrain carsales’ ability to command market-leading prices for products and services.
• Downturn in the Australian economy, motor vehicle or general advertising market – the performance of carsales will continue to be influenced by the overall condition of the motor vehicle market. The motor vehicle market is influenced by the general condition of the Australian economy, which by its nature is cyclical and subject to change. In addition, carsales derives a significant proportion of its revenue from display advertisers on
DIRECTORS’ REPORT CONTINUED
ANNUAL REPORT 2017 CARSALES.COM LIMITED24F
or p
erso
nal u
se o
nly
its network of websites. A decline or significant change in the advertising market as a result of broader economic influences or changing advertiser trends that could have a negative impact on carsales’ earnings.
• Cyber Security – the cyber threat to companies around the world is growing and unrelenting, carsales as an online business is not immune to these risks. carsales is vigilant and proactive in its approach to cyber security, investing resources to meet the challenges of a complex cyber environment in order to protect our customers’ data. A cyberattack or hack of carsales systems could have serious impact on the Company’s reputation, operational and financial performance.
• Information Technology – carsales’ business operations rely on owned and 3rd party IT infrastructure and systems, including reliance on Amazon Web Services and other cloud service providers. Any interruption to these operations or loss of customer data could impair carsales’ ability to operate its customer facing websites which could have a negative impact on carsales’ financial performance and reputation. carsales’ future performance will also depend on its ability to monitor and manage major projects such as website upgrades and other projects involving its IT infrastructure.
• International expansion – with the expansion of the business into new high growth international geographies, the Company becomes exposed to the macroeconomic environment of these markets as well as to fluctuations in exchange rates. The Company may not be able to fully recoup its investment in these markets should it not be able to accelerate the growth of its businesses through the implementation of carsales’ business models, intellectual property and technologies.
ANNUAL REPORT 2017 CARSALES.COM LIMITED 25F
or p
erso
nal u
se o
nly
OUR PEOPLE
160new staff joined
in Australia
80people
learning Spanish
150,582phone calls answered by customer service team
59,486customer emails
responded to
1,879,692Australian customer ads
and edits approved by staff
7,900applicants for vacant roles
OVER 4,000
hours of training attended
OVER 300
people attended discussion group sessions
84% customer service team Customer
Satisfaction score
Graduate Program applications
OVER 400
ANNUAL REPORT 2017 CARSALES.COM LIMITED26F
or p
erso
nal u
se o
nly
Our people are highly skilled, experienced and have our values and behaviours at their core. We are always looking at ways to provide more opportunities for our team to learn and evolve, and we work hard to provide a diverse environment that is inclusive and collaborative with a strong social conscience. To achieve this environment, we promote a culture of feedback so we can continuously improve. Some of our more formal feedback initiatives include our annual engagement survey and discussion groups.
WE WORK IN A FAST-PACED AND DYNAMIC BUSINESS ENVIRONMENT, WHICH MEANS THAT ATTRACTING AND RETAINING THE BEST GLOBAL TALENT IS ESSENTIAL TO OUR SUSTAINED SUCCESS.
Agostino GiramondoSales and Strategy Director – OEM and Media
carsales is an extraordinary business, the opposite of ordinary, and filled with people exceptional in character. I know this as I can compare it to other organisations I’ve worked with that have all been good, but not in the league of carsales. I love being a part of something that makes a difference to its customers and employees. I love that everyone cares and that you have flexibility when needed. Every day we have our tasks, but the workplace is open and I get to interact with so many smart and passionate people across the business. It means I am always learning.
ANNUAL REPORT 2017 CARSALES.COM LIMITED 27F
or p
erso
nal u
se o
nly
OUR PEOPLE CONTINUED
I was a terrible lawyer so I was relieved to find a home in technology. The technology network introduced me to carsales (via a stop with the
government and a start-up), and now I get to spend my days working with the research, development and operations teams to create the best consumer experience possible. Since joining carsales I’ve attended my first AFL game, debated the best beer, celebrated birthdays, babies, product releases, perfected my high-five and taken road trips to see the Toyota factory and Star Wars.
carsales has really supported my career development. Last year when I spoke at the 2016 Product Management Festival in Switzerland I stood on stage with a ‘good luck’ card signed by our CEO, COO and CIO and knew that the whole team was behind me.
DiversityWe are committed to creating a diverse and inclusive work environment, with particular focus on gender equality.
A diverse and inclusive working environment provides a wide range of perspectives, innovation and engagement, and improved operational performance. To achieve this environment, we promote a workforce that embraces and respects diversity and inclusion through our Diversity and Inclusion Council, as well as our Diversity Strategy.
We are proud to have been awarded the Workforce Gender Equality Employer of Choice citation for 2016 in recognition of our systematic and strategic approach to achieving a gender diverse workplace. We will continue to strive to exceed the expectations of WGEA year on year. In accordance with the Workplace Gender Equality Act 2012, carsales submitted a report to WGEA. This report provided information on carsales’ policies and gender diversity numbers across the business.
This report is available in the Investor Centre on the Company website at shareholder.carsales.com.au/Investor-Centre/.
In addition to our diversity strategy, we also have a set of specific gender equality objectives we focus on, as set out below.
Objective 1Continue to grow the number of women in senior roles and professions where women are traditionally under represented.
InitiativeInitiatives include ongoing education of managers on the importance of a diverse workforce and an executive-led Diversity Steering Committee.
Continue to maintain quotas for recruitment shortlists and review all job advertisements for gender bias.
OutcomeIn FY17 64% of appointments were female and 35% of managerial appointments were female.
Objective 2Continue to implement career development programs to prepare women within the business to take on more senior roles.
InitiativeThis year we developed a new leadership program, focused on the accountabilities of a leader and leading a high performance team. Additionally we continued providing training and development programs including communication, presentation, management and influence skills training.
Created and launched recruitment for the Next Gear Graduate Program.
OutcomeOur development programs had 35% female attendance, and 64% of FY17 promotions have been female.
The 2018 Graduate intake has a 50/50 gender split.
Objective 3Foster an inclusive culture and environment in which women network and mentor each other to progress their careers within carsales.
InitiativeWe continued providing women with mentoring opportunities and encouraging the women’s networking group. We also celebrated International Women’s Day.
OutcomeThe FY17 mentor program has over 40 female participants involved.
Our female networking groups hosted several sessions and the business collectively celebrated International Women’s Day with a networking event and inspiring guest speakers.
Objective 4Continue to enhance flexible workplace arrangements for both women and men. Enabling our people to manage work/life commitments and preferences.
InitiativeThe company continue to provide 12 weeks parental leave and 2 weeks Dad/Partner leave, as well as supporting part time options, child care referrals and flexible re-entry into the business from a period of parental leave.
OutcomeIn FY17, 11 members of the carsales team took parental leave and carsales is currently supporting 12 members of staff with formal flexible working arrangements.
Engaging our people in driving social change
In 2016 carsales’ began itscommitment to the White Ribbon Accreditation Program. The ambition is to prevent men’s violence against women through raising awareness, education and support. We are proud to be taking a corporate leadership role in what is a significant social issue in Australia and we recognise this confronting issue may be impacting our people and the 2.6 million consumers we connect with online each month.
We have invested extensively in raising awareness and have educated all people managers on how to identify and support staff directly or indirectly impacted by domestic of family violence.
ANNUAL REPORT 2017 CARSALES.COM LIMITED 29F
or p
erso
nal u
se o
nly
OUR PEOPLE CONTINUED
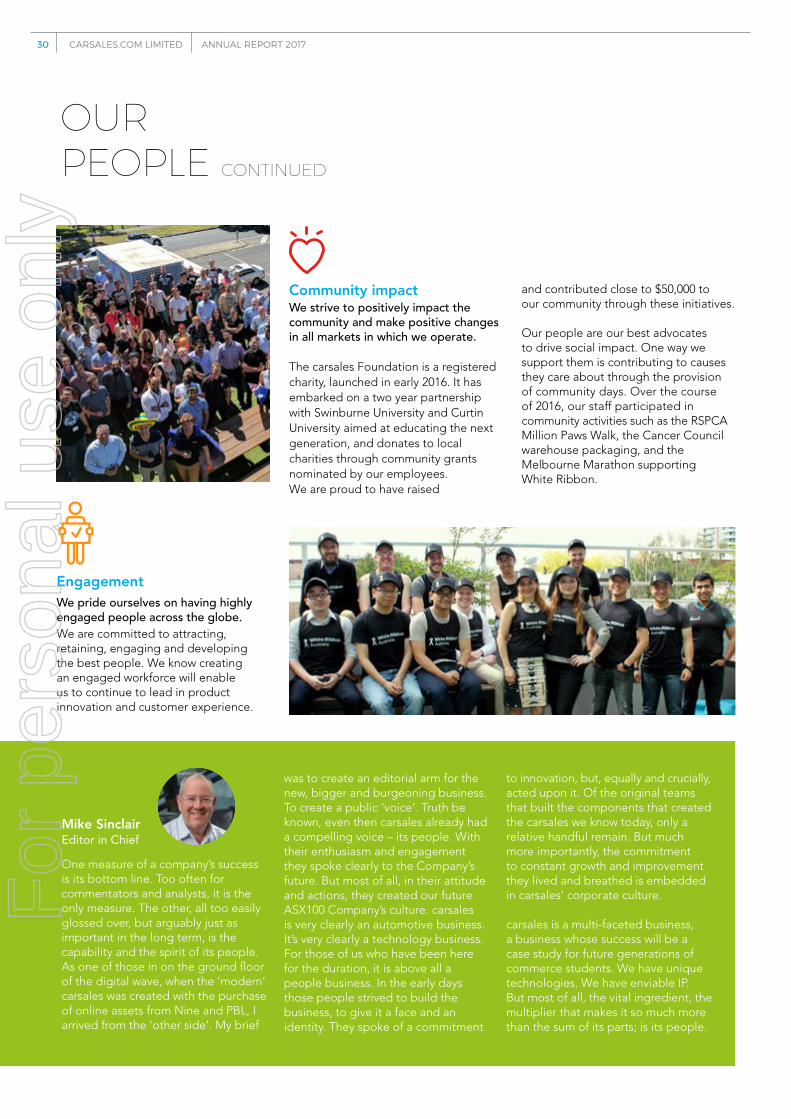
Community impactWe strive to positively impact the community and make positive changes in all markets in which we operate.
The carsales Foundation is a registered charity, launched in early 2016. It has embarked on a two year partnership with Swinburne University and Curtin University aimed at educating the next generation, and donates to local charities through community grants nominated by our employees. We are proud to have raised
and contributed close to $50,000 to our community through these initiatives.
Our people are our best advocates to drive social impact. One way we support them is contributing to causes they care about through the provision of community days. Over the course of 2016, our staff participated in community activities such as the RSPCA Million Paws Walk, the Cancer Council warehouse packaging, and the Melbourne Marathon supporting White Ribbon.
EngagementWe pride ourselves on having highly engaged people across the globe.We are committed to attracting, retaining, engaging and developing the best people. We know creating an engaged workforce will enable us to continue to lead in product innovation and customer experience.
One measure of a company’s success is its bottom line. Too often for commentators and analysts, it is the only measure. The other, all too easily glossed over, but arguably just as important in the long term, is the capability and the spirit of its people. As one of those in on the ground floor of the digital wave, when the ‘modern’ carsales was created with the purchase of online assets from Nine and PBL, I arrived from the ‘other side’. My brief
was to create an editorial arm for the new, bigger and burgeoning business. To create a public ‘voice’. Truth be known, even then carsales already had a compelling voice – its people. With their enthusiasm and engagement they spoke clearly to the Company’s future. But most of all, in their attitude and actions, they created our future ASX100 Company’s culture. carsales is very clearly an automotive business. It’s very clearly a technology business. For those of us who have been here for the duration, it is above all a people business. In the early days those people strived to build the business, to give it a face and an identity. They spoke of a commitment
to innovation, but, equally and crucially, acted upon it. Of the original teams that built the components that created the carsales we know today, only a relative handful remain. But much more importantly, the commitment to constant growth and improvement they lived and breathed is embedded in carsales’ corporate culture. carsales is a multi-faceted business, a business whose success will be a case study for future generations of commerce students. We have unique technologies. We have enviable IP. But most of all, the vital ingredient, the multiplier that makes it so much more than the sum of its parts; is its people.
Mike SinclairEditor in Chief
ANNUAL REPORT 2017 CARSALES.COM LIMITED30F
or p
erso
nal u
se o
nly
Learning and development
Our continued commitment to learning and development has seen our team attend over 4,000 hours of training and development. Some of these include mentoring programs, our annual CEO scholarship award, leadership development, conferences, online learning plus internal and external training programs.
Graduate ProgramThe carsales Next Gear Graduate Program launched this year. Eight of four hundred applicants will commence in the commercial, consumer and technology areas of business in 2018.
HackathonsHackathons are an opportunity for our people to engage cross functionally in a freestyle format aimed at promoting collaboration and innovation. This year participation levels were at a record high, with global first technology created and launched in our business.
Engagement surveyAnnually we conduct an Employee Opinion Survey, with improvements seen year on year. Pleasingly in a year of significant internal change, our engagement increased by 6% and outperformed the specific ‘tech’ industry benchmark.
David CampsellDirector International Operations
I joined carsales in 2007 as part of the merger with CarPoint (and related businesses) having started my career back in 1994 with what was then known as Equipment Research Group (ERG) before that business was purchased by Trader Classifieds in 2000. I’ve seen plenty of changes in the business during that time, which have significantly changed the way we all operate: changes such as not waiting for Thursdays, when the Trading Post was released, to find your next car, the widespread acceptance of mobile phones, and the introduction of social media such as Facebook.
Along the way carsales has always worked hard to stay up with and generally ahead of the curve, being willing to try something new, and listening to our customers. carsales has great leaders that provide a vision for the business to see it succeed not only here in Australia, but now in many countries around the world.
4,000hours of training and
development attended by our team
ANNUAL REPORT 2017 CARSALES.COM LIMITED 31F
or p
erso
nal u
se o
nly
OUR PEOPLE CONTINUED
EnvironmentWe understand that our resources are finite and it is important for us to protect the world we operate in. Whilst the nature of the carsales business has a low environmental impact, and we are not subject to any specific environmental legislation, the Company aims to minimise its environmental footprint. In all Company offices, carsales promotes recycling by having bins throughout our offices with a clear explanation on how to correctly recycle. We purchase only 100% recycled paper, enforce printing limits including default double-sided, black and white printing, and have implemented timed lights in all meeting rooms. The carsales head office in Richmond is certified as a 4.5 star NABERS-rated building and the new state of the art Sydney office is certified as yet to be rated.
carsales has introduced policies to reduce air travel and increased our use of video conferencing by implementing Skype for Business across the organisation, which are having a significant impact on both the
Company’s environmental commitments and our financial targets. We replaced old mechanical hard drives in our storage area network with low-power SSDs (solid state discs) and renewed our complete bank of printers with new low-power ENERGY STAR certified and rated EPEAT Gold devices. The Company’s move to cloud-based solutions such as Amazon Web Services (AWS) helps deliver on our commitment to reduce our environmental footprint. Our key partner AWS’s long term goal is to power the global AWS infrastructure with 100% renewable energy. AWS exceeded its goal of 40% renewable energy by the end of 2016, and has set a new goal to be powered by 50% renewable energy by the end of 2017.
By working with AWS, we benefit from its continuous desire to increase the energy efficiency of its facilities and equipment, the innovation of the design and manufacture of its servers, storage, and networking equipment to reduce energy. AWS works with its various power providers that supply AWS datacentres around the world to
increase the availability of renewables in their power supply while maintaining low prices. AWS has funded 10 wind and solar power purchase agreement (PPA) to increase the overall amount of renewable energy available on the grids that serve AWS datacentres.
recycled paper100%
purchasing
Richa KheraLead UX Researcher
My journey at carsales has been an interesting two-year rollercoaster so far. Apart from the challenge of moving to a new country and switching to a whole new culture,
I can proudly say working over here helped me transition comfortably. It always feels great to be a part of a workforce that has an amazing culture and making friends who are now ‘my mates’.
Over this period, I have witnessed the change in language of a lot of people encouraging user centred design; our users being buyers, sellers, owners, dealers, etc. Coming from a pure user experience background, I was always a strong advocate of understanding
users’ thinking, feelings and emotions and then translating all of that into engaging user interfaces and interactions. With our team having grown from a very small number to a large bunch of great UX designers working cross functionally in this business, it feels great to spread all of that research work amongst everyone here and assist in design direction.
ANNUAL REPORT 2017 CARSALES.COM LIMITED32F
or p
erso
nal u
se o
nly
CORPORATE GOVERNANCE
carsales is committed to being ethical, transparent and accountable in everything that the Company does. We believe this is essential for the long term performance and sustainability of our Company and supports the interests of our shareholders and other stakeholders. The Board of Directors is responsible for ensuring that the Company has an appropriate corporate governance framework to protect and enhance Company performance and build sustainable value for shareholders.
This corporate governance framework acknowledges the ASX Corporate Governance Council’s Corporate Governance Principles and Recommendations (ASX Principles and Recommendations) and is designed to support our business operations, deliver on our strategy, monitor performance and manage risk.
Our Corporate Governance Statement addresses the
recommendations contained in the third edition of the
ASX Principles and Recommendations and is available on our website at
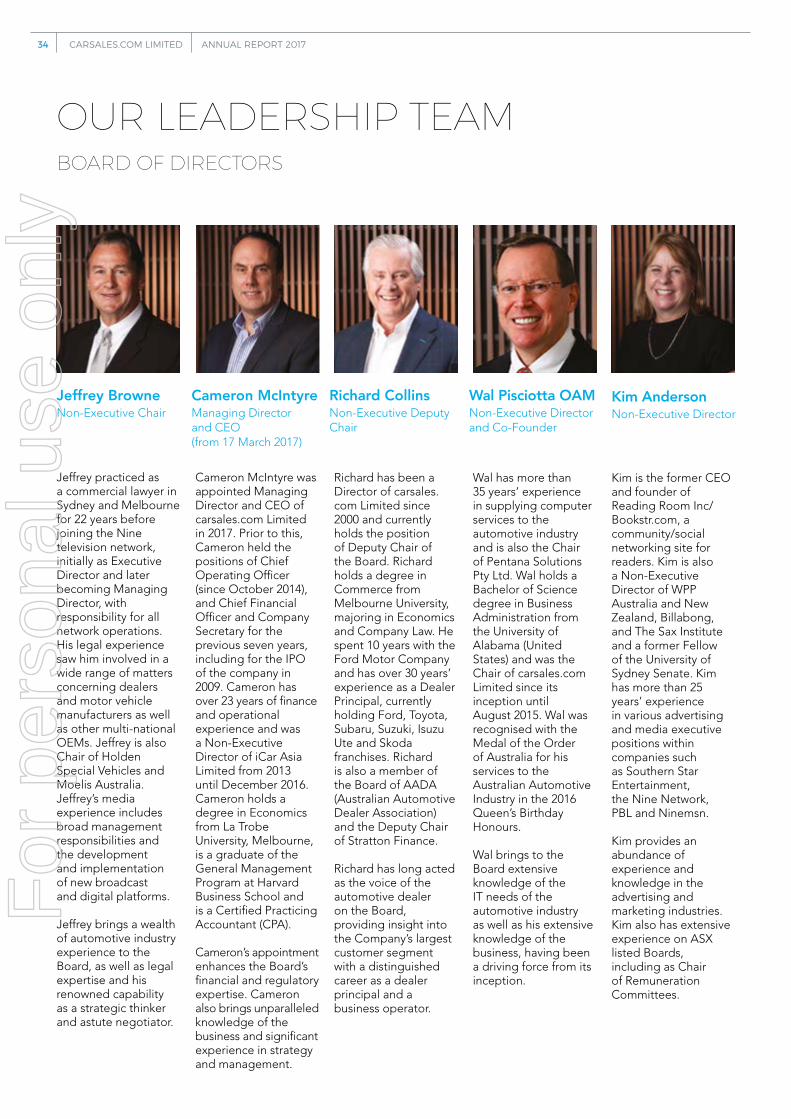
Jeffrey practiced as a commercial lawyer in Sydney and Melbourne for 22 years before joining the Nine television network, initially as Executive Director and later becoming Managing Director, with responsibility for all network operations. His legal experience saw him involved in a wide range of matters concerning dealers and motor vehicle manufacturers as well as other multi-national OEMs. Jeffrey is also Chair of Holden Special Vehicles and Moelis Australia. Jeffrey’s media experience includes broad management responsibilities and the development and implementation of new broadcast and digital platforms.
Jeffrey brings a wealth of automotive industry experience to the Board, as well as legal expertise and his renowned capability as a strategic thinker and astute negotiator.
Cameron McIntyre was appointed Managing Director and CEO of carsales.com Limited in 2017. Prior to this, Cameron held the positions of Chief Operating Officer (since October 2014), and Chief Financial Officer and Company Secretary for the previous seven years, including for the IPO of the company in 2009. Cameron has over 23 years of finance and operational experience and was a Non-Executive Director of iCar Asia Limited from 2013 until December 2016. Cameron holds a degree in Economics from La Trobe University, Melbourne, is a graduate of the General Management Program at Harvard Business School and is a Certified Practicing Accountant (CPA).
Cameron’s appointment enhances the Board’s financial and regulatory expertise. Cameron also brings unparalleled knowledge of the business and significant experience in strategy and management.
Richard has been a Director of carsales.com Limited since 2000 and currently holds the position of Deputy Chair of the Board. Richard holds a degree in Commerce from Melbourne University, majoring in Economics and Company Law. He spent 10 years with the Ford Motor Company and has over 30 years’ experience as a Dealer Principal, currently holding Ford, Toyota, Subaru, Suzuki, Isuzu Ute and Skoda franchises. Richard is also a member of the Board of AADA (Australian Automotive Dealer Association) and the Deputy Chair of Stratton Finance.
Richard has long acted as the voice of the automotive dealer on the Board, providing insight into the Company’s largest customer segment with a distinguished career as a dealer principal and a business operator.
Wal has more than 35 years’ experience in supplying computer services to the automotive industry and is also the Chair of Pentana Solutions Pty Ltd. Wal holds a Bachelor of Science degree in Business Administration from the University of Alabama (United States) and was the Chair of carsales.com Limited since its inception until August 2015. Wal was recognised with the Medal of the Order of Australia for his services to the Australian Automotive Industry in the 2016 Queen’s Birthday Honours.
Wal brings to the Board extensive knowledge of the IT needs of the automotive industry as well as his extensive knowledge of the business, having been a driving force from its inception.
Kim is the former CEO and founder of Reading Room Inc/Bookstr.com, a community/social networking site for readers. Kim is also a Non-Executive Director of WPP Australia and New Zealand, Billabong, and The Sax Institute and a former Fellow of the University of Sydney Senate. Kim has more than 25 years’ experience in various advertising and media executive positions within companies such as Southern Star Entertainment, the Nine Network, PBL and Ninemsn.
Kim provides an abundance of experience and knowledge in the advertising and marketing industries. Kim also has extensive experience on ASX listed Boards, including as Chair of Remuneration Committees.
Jeffrey BrowneNon-Executive Chair
Cameron McIntyreManaging Director and CEO (from 17 March 2017)
Richard CollinsNon-Executive Deputy Chair
Wal Pisciotta OAMNon-Executive Director and Co-Founder
Kim AndersonNon-Executive Director
ANNUAL REPORT 2017 CARSALES.COM LIMITED34F
or p
erso
nal u
se o
nly
Pat has been a Director of the Company since 2007 and was the Chief Operating Officer and Finance Director of Nine Entertainment Co Pty Limited (formerly PBL Media Pty Ltd) a position he held from February 2006 until 29 June 2012. Pat is a member of The Institute of Chartered Accountants in Ireland and Australia. He is a graduate of the Harvard Business School’s Advanced Management Program. He also served as a Director and Company Secretary of Nine Entertainment Co Pty Limited and was Chair of Ninemsn. Pat is currently a Non-Executive Director of iSentia, APN Outdoor, Little Company of Mary Health Care and Chair of HealthEngine and LocalAgentFinder.
Pat brings immense financial and regulatory expertise to the Board, Chairing the Audit and Risk Management Committee. Pat also provides the Board with insights relating to operations of global companies.
Edwina has worked in the automotive industry since 2003, and is currently Dealer Principal of Gillen Motors and Director of Phil Gilbert Motor Group, managing 200 staff with two brands in two busy metropolitan locations. Edwina was the Chair of the Hyundai NSW Dealer Council and a member of the Hyundai National Dealer Council from 2010 - 2015. Edwina holds a Bachelor of Laws and Bachelor of Arts from Sydney University and practiced commercial law before moving into the automotive industry.
Edwina brings significant OEM knowledge along with experience operating dealerships with a `digital first’ marketing approach. Edwina’s background in law also contributes to the regulatory capabilities of the Board.
Steve has more than 25 years’ experience in supplying computer services to the automotive industry and is currently Chief Executive Officer at Pentana Solutions Pty Ltd. Steve holds a Bachelor of Business degree from Monash University and is an experienced board Director, currently sitting on six boards in addition to his position as Alternate Director of carsales.com Limited.
Nicole is an experienced corporate lawyer who holds the position of General Counsel and Company Secretary at carsales.com Limited. Nicole has a Bachelor of Laws (Hons) and Bachelor of Arts from Monash University. Before joining carsales, Nicole acted as in-house legal counsel with Medibank Private and REA Group. Previous to this Nicole worked for Minter Ellison, one of Australia’s premier legal firms where her areas of specialty included intellectual property law.
Patrick O’SullivanNon-Executive Director
Edwina GilbertNon-Executive Director
Steve KlossAlternate Non-Executive Director
Nicole BirmanCompany Secretary
ANNUAL REPORT 2017 CARSALES.COM LIMITED 35F
or p
erso
nal u
se o
nly
OUR LEADERSHIP TEAM CONTINUED
EXECUTIVE LEADERSHIP TEAM
Michael HolmesExecutive Director Dealer
Kellie CordnerChief Marketing Officer
Jason BlackmanChief Information Officer
Lisa Sheehan (contract – maternity leave cover for Jo Allan)Chief People Officer
Cameron McIntyreManaging Director and CEO
ANNUAL REPORT 2017 CARSALES.COM LIMITED36F
or p
erso
nal u
se o
nly
Ajay BhatiaManaging Director Consumer Business
Paul BarlowManaging Director International
Nicole BirmanGeneral Counsel and Company Secretary
Anthony SainesManaging Director Commercial
Andrew DemeryChief Financial Officer
ANNUAL REPORT 2017 CARSALES.COM LIMITED 37F
or p
erso
nal u
se o
nly
Dear Shareholder
As Chair of carsales’ Remuneration and Nomination Committee, I am pleased to present our Remuneration Report for FY17.
The objective of our remuneration principles is to attract and retain talented Senior Executives who will create sustainable shareholder value. As a Board, we firmly believe that reward for performance should be competitive but not excessive and should be appropriate for the results delivered in the short and long term, aligning with shareholder outcomes.
The company’s ability to attract and retain the high-calibre executives required to lead this growing and increasingly complex and global business is important for shareholders. We are mindful of this and have tried to balance these competitive pressures with the requirements of shareholders when determining Senior Executive pay.
The 2016 AGM remuneration vote was a clear message to the Board about how Senior Executive pay is managed and disclosed. The Committee made a commitment to respond in a constructive way and has undertaken a comprehensive review of the remuneration policies for our Senior Executives.
Since the AGM, we have appointed new independent remuneration advisers and approached our review with an open mind. We have held extensive dialogue with many of our largest shareholders as well as representative bodies and proxy advisors during the year. We have listened and sought to respond to your concerns. I would like to thank all those who took part in the process for their time and insight. It is clear that shareholders and other stakeholders would like our remuneration policy to be simpler and more transparent, and for us to reduce the perceived high levels of fixed remuneration for the CEO in FY16.
We have made a number of significant changes to our remuneration policies, plans and disclosures which will make them simpler and better align pay and performance. We have brought forward many of these improvements into FY17 and where relevant used principles from our new policies in making our decisions for pay in FY17 ahead of the introduction of the Short Term Incentive (STI) and Long Term Incentive (LTI) plans in FY18.
As set out in the following report the key changes to the policies include:
• a simplified remuneration package for the incoming CEO comprising salary, STI and LTI components, with clear caps for the maximum that can be earned under each;
• increasing the proportion of variable ‘at risk’ compensation in the incoming CEO’s package; and
• increased transparency through disclosure of the caps applied to the STIs awarded to Senior Executives, including more information in circumstances where discretion has been applied.
The change in CEO during the year gave us the opportunity to demonstrate our commitment to enhanced transparency of remuneration packages, with full details of Mr McIntyre’s salary package disclosed upon his appointment.
The Board considers the total remuneration outcome for each Senior Executive is commensurate with the overall performance of the Group in FY17 and the increased responsibilities resulting from the appointment of the new CEO in March 2017.
carsales is committed to ensuring the Remuneration Report presents Senior Executive remuneration in a consistent, transparent and straightforward manner, while complying with the Corporations Act 2001. As in previous years, in this report the Company is voluntarily disclosing the actual cash remuneration received by Senior Executives, in addition to the statutory reporting obligations. The Remuneration and Nomination Committee believes that carsales’ remuneration framework is fully aligned with and supports the Group’s financial and strategic goals now and into the future.
Yours sincerely
Kim AndersonChair of the Remuneration and Nomination Committee
OUR REMUNERATION CHAIR’S REPORT
ANNUAL REPORT 2017 CARSALES.COM LIMITED38F
or p
erso
nal u
se o
nly
The remuneration report is set out under the following main headings:
1. Addressing shareholder feedback from the 2016 AGM2. Remuneration principles3. Company 5 year financial performance4. Remuneration snapshot5. Remuneration outcomes6. Non-Executive Directors’ remuneration
The Board has established a Remuneration and Nomination Committee which provides advice on remuneration, incentive policies and practices, as well as specific recommendations on remuneration packages and other terms of employment for the CEO, Senior Executives and Non-Executive Directors (together Key Management Personnel).
The term ‘Senior Executives’ refers to the CEO and those executives with responsibility and authority for planning, directing and controlling the activities of the Company throughout the year, namely:
Greg Roebuck Managing Director and Chief Executive Officer (retired 17 March 2017) Cameron McIntyre Managing Director and Chief Executive Officer (appointed 17 March 2017) – formerly Chief Operating OfficerAjay Bhatia Managing Director Consumer Business Anthony Saines Managing Director CommercialPaul Barlow Managing Director InternationalChris Polites Director – Dealer (resigned 22 March 2017)
There were no changes in KMPs between 30 June 2017 and the date of publication.
The information provided in this remuneration report has been audited as required by section 308(3C) of the Corporations Act 2001.
1. Addressing shareholder feedback from the 2016 AGMFollowing the 2016 AGM, the Remuneration and Nomination Committee and entire Board reviewed the Company’s remuneration practices and instituted a number of changes, detailed below.
1.1 Shareholder feedback and action taken to address concernsAs a result of shareholder concerns expressed last year, the Board has engaged with various stakeholders (including investors and proxy advisors) and a remuneration advisor (Ernst & Young) during the year to consider how best to address the issues raised. As a direct result of this, the Board has instituted changes in the Company’s remuneration practices and disclosures. Details of the shareholder concerns and the Company’s actions to address those concerns are set out in the following table:
Shareholder Feedback / Concern Company’s Response
CEO’s package: perceived above market fixed remuneration for the CEO; non-monetary benefits provided to the CEO.
The salary of the CEO in FY16 was unique given the circumstances of the CEO at the time (Greg Roebuck). As a founder of the business and the long term CEO, Mr Roebuck was already a significant shareholder in the Company and as he was approaching retirement the Board took unusual measures to provide Mr Roebuck with remuneration in a form that would keep him engaged as long as possible. These measures involved awarding Mr Roebuck a fixed base salary and non-monetary benefits such as a travel allowance that was higher in comparison to the relative amounts awarded under the variable share based incentive plans. The travel allowance was designed to promote regular breaks from the business for Mr Roebuck to increase his longevity as CEO and allow him the opportunity to consider strategic issues affecting the business away from the day to day demands of his role.
In designing the remuneration package for the new CEO, Mr McIntyre, the Board took into account shareholders’ concerns over Mr Roebuck’s package. Mr McIntyre’s package comprises a fixed salary significantly lower than Mr Roebuck’s salary. Further, the ratio between Mr McIntyre’s fixed vs variable salary is 35% fixed vs 65% variable (30% short term incentive and 35% long term incentive). The Board considers that Mr McIntyre’s remuneration is appropriate, is in line with his peers and reflects his experience and shareholding in the Company.
REMUNERATION REPORT
ANNUAL REPORT 2017 CARSALES.COM LIMITED 39F
or p
erso
nal u
se o
nly
Short Term Incentive: significant discretion applied by the Board in determining the CEO’s short term incentive payment with a lack of transparency in how the discretion was applied; limited disclosures on maximum STI opportunity.
The Board has undertaken a wholesale review of the Company’s short term incentive (STI) and long term incentive (LTI) plans with a view to creating a simpler and more transparent plan. Due to the timing of the 2016 AGM and period of review, which included obtaining advice from remuneration experts, these changes were not able to be introduced in time for FY17, and will be in effect from FY18. Specific details of the Company’s FY18 STI and LTI plans are set out below in section 1.2.
In relation to the discretion applied to the CEO’s STI payment, the previous Company STI plan included a portion that was reserved for Board discretion separate to the measures used to determine the other payments under the plan. The new Company STI (from FY18) removes this separate Board discretion component, and applies Board discretion as an overlay, or a ‘sanity check’ to ensure the outcome of the plan is in line with overall company and individual performance. To ensure transparency, when the Board uses discretion in the awarding of an STI, an explanation will be provided.
In response to the concerns over the inability of shareholders to determine the maximum STI opportunity for the CEO and other Senior Executives of the Company, the Company has introduced disclosures setting out the dollar amount of the maximum STI opportunity for each Senior Executive and showing the outcome of the STI as a dollar amount, as a percentage of the on target earnings and of the maximum STI opportunity for the relevant Senior Executive.
Long term incentive: limited disclosure of performance targets.
The Company has considered feedback from some shareholders wishing to see the performance targets for STI and LTI plans upfront. The Company also received feedback from other shareholders who accept the sensitivity in disclosing targets in the circumstances that the Company does not provide guidance on its results.
The Company believes that its current practice of disclosing its targets retrospectively is appropriate and will continue to do so. However, the Company will make efforts to provide further explanation on how the targets were determined when disclosing the targets retrospectively.
The Company only refers to general statements around specific projects relevant to its STI and LTI plans. The Company will continue this practice to ensure it does not reveal important strategic information to its competitors.
Senior Executives have not received any LTI over the past two years despite the Company delivering record results. As a result the Board has overhauled the LTI plan, to better reflect the Company’s strategic objectives, and simplified the incentive program to ensure it provides adequate incentives and recognises an executive’s contribution to the overall performance of the Company.
Disclosures and transparency: general appetite for further disclosures by the Company on relevant matters, increasing the transparency of remuneration practices.
Throughout this Remuneration Report, the Company has provided additional commentary around matters on which shareholders indicated a desire for more transparency.
This includes commentary around application of Board discretion; explanations of role changes that contributed to remuneration decisions; and details of maximum payment caps of STIs. This new approach was first evidenced in the ASX announcement of the new CEO, which contained additional disclosures than in previous Remuneration Reports. The announcement included Mr McIntyre’s fixed remuneration, maximum STI opportunity (both as a dollar value and as a percentage of fixed remuneration) and the maximum LTI opportunity subject to shareholder approval.
REMUNERATION REPORT CONTINUED
ANNUAL REPORT 2017 CARSALES.COM LIMITED40F
or p
erso
nal u
se o
nly
1.2 New STI and LTI plans from FY18Following feedback from the 2016 AGM on the FY16 Remuneration Report, the Company has adopted a new incentive plan for its Senior Executives to be applied from FY18. 1.2.1 FY18 Short Term Incentive PlanFrom FY18, the Company will make awards under a new STI plan with the major components being, 70% financial, and 30% company-wide strategic, personal, and cultural objectives. 70% Financial Measures
Under the new STI plan, 70% of the award will be measured against two separate financial metrics (each comprising 35% of the total STI award). For each measure there will be a minimum threshold – if this is not achieved, there will not be any award for that portion of the STI. These financial metrics will be look-through revenue and Adjusted Net Profit After Tax (adjusted NPAT).
30% Strategic Objectives
The 30% Strategic Objectives portion of the STI will be measured against:
• successful project delivery recognising the importance of strategic projects which may not have an immediate financial impact on the Company;
• achievement of people and culture targets recognising the vital role the Company’s culture plays in its success; and
• individual goals of the executive recognising the unique role each of our executives play in the Company’s operations.
The FY18 plan does not include a DSTI. Instead, 25% of the total STI payable to each Senior Executive will be deferred for an additional 12 months in equity, subject to a continued service condition.
In addition, the previous Board discretion as a separate component will be removed from the STI plan. The Board will maintain discretion to review the performance against individual targets and the overall outcome of the STI award and ensure it is congruent with the overall performance of the Company and of the individual Senior Executive, within the participant’s maximum STI opportunity.
The maximum STI payable for Senior Executives will be capped at 60% of base salary (including superannuation), except for the CEO, who has a cap of 87% of base salary (including superannuation).
1.2.2 FY18 Long Term Incentive PlanFrom FY18, the Company will make awards under a new LTI plan.
Under the new LTI plan, 70% of the award will be determined by a revenue and earnings matrix and will be awarded in performance rights. The remaining 30% of the award will be determined by reference to achievement of clearly identified strategic milestones and will be awarded in options. The performance period for the LTI will remain at three years.
The revenue and earnings matrix recognises the importance of both of revenue and earnings growth to the Company’s long term financial performance and by including a minimum ‘gate’ threshold for both these metrics that must be achieved in the performance period prior to any performance rights vesting, ensures that executives are incentivised to grow both earnings and revenue, and not sacrifice one over the other. Similarly, it aligns the objectives of the Senior Executives with those of the Company’s shareholders.
The inclusion of strategic milestones recognises that there are important projects the Company is undertaking to promote future sustainability and growth, and these should not be sacrificed for short term return. The fact that the award for the successful completion of the strategic milestones will be paid in options aligns with the expected long term benefit of these projects.
ANNUAL REPORT 2017 CARSALES.COM LIMITED 41F
or p
erso
nal u
se o
nly
2. Remuneration principles2.1 Principles used to determine the nature and amount of remuneration for FY17The governance of Senior Executive remuneration is a core focus of the Remuneration and Nomination Committee, which ensures that remuneration outcomes for our Senior Executives align with Company performance. The objective of the Company’s executive remuneration framework is to ensure reward for performance is competitive and appropriate for the results delivered. The framework aligns Senior Executive remuneration with the achievement of strategic objectives, the creation of value for shareholders and is informed by market practice for delivery of reward.
The Board ensures that the Senior Executive remuneration framework satisfies the following key criteria for good remuneration governance practices:
Alignment to shareholders’ interests:
• Has economic profit as a core component of plan design.
• Focuses on sustained growth in shareholder return, consisting of dividends, growth in share price, constant return on assets as well as focuses on key non-financial drivers of value such as innovation and culture.
• Attracts and retains high caliber executives.
• Transparency.
Alignment to participants’ interests:
• Rewards capability and experience.
• Reflects competitive remuneration for contribution to growth in shareholder wealth.
• Provides a clear structure and goals for earning remuneration.
• Provides recognition for contribution to operational performance.
To ensure the remuneration framework is market competitive and therefore most likely to ensure the retention of talent, the Company will from time to time benchmark remuneration structures against relevant peers. The Company considers relevant peers to be ASX listed companies that are similar in size, structure and industry to that of carsales. The Company accepts that while this peer group is small it is the most relevant group from which talent competition arises. Increasingly the Company considers global competitors for talent to be relevant, but has focused on companies with an Australian presence for the purposes of this remuneration framework in the current year.
So that the Remuneration and Nomination Committee is fully informed of market best practices, trends, regulatory developments and shareholder views, the Company engaged Ernst & Young (EY) to conduct a number of remuneration reviews during the financial year including:
• benchmarking of the remuneration of the Senior Executives;
• a review of the Company’s Short Term Incentive program (STI); and
• a review of the Company’s Long Term Incentive (LTI) program.
EY was engaged by and reported directly to the Chair of the Remuneration and Nomination Committee. The report prepared by EY was provided directly to the Chair of the Remuneration and Nomination Committee and did not include remuneration recommendations. The Company notes that no remuneration recommendations were received from external parties in 2017.
The report by EY provided input into the Remuneration Committee’s decision-making processes and was considered along with other factors in establishing the Company’s new STI and LTI programs.
REMUNERATION REPORT CONTINUED
ANNUAL REPORT 2017 CARSALES.COM LIMITED42F
or p
erso
nal u
se o
nly
2.2 Service conditionsAll Senior Executives have service agreements determining cash salary, superannuation, performance based cash bonuses and participation in the Company Employee Option Plan. They have no fixed employment terms and no special termination payment conditions. All agreements provide for dismissal due to gross misconduct. The termination notice period is 6 months by either party and there is a 6 month non-compete period.
All Senior Executives are entitled to participate in the STI, DSTI and LTI plans. The separate DSTI plan has been removed for FY18. From FY18 a portion of the STI achievement will be deferred for 12 months.
2.3 Executive remuneration for FY17The Senior Executive remuneration framework for FY17 had five components:
• Cash salary and superannuation.
• Short term incentives.
• Deferred incentives.
• Long term incentives.
• Other benefits.
2.3.1 Cash salary and superannuationSenior Executives are offered a competitive cash salary and superannuation package. These are structured as a total employment cost package that may be delivered as a combination of cash and prescribed non-financial benefits at the Senior Executive’s discretion. Each Senior Executive’s package is reviewed annually, or subsequent to promotion, by the Remuneration and Nomination Committee, to ensure the Senior Executive’s pay is competitive within the market and is in line with Company policies.
There is no guaranteed cash salary and superannuation increase included in any Senior Executive’s contract.
Statutory retirement benefits are provided via contributions to approved superannuation funds. Under current legislation carsales permits superannuation choice for all employees. The Company default superannuation fund is held with MLC.
2.3.2 Short Term IncentivesSTIs are paid to Senior Executives in the form of an annual cash payment on the achievement of objectives as described below. The size of the STI opportunity available to each Senior Executive is based on their accountabilities and impact of their role on the organisation or business unit(s) which they lead.
The Remuneration and Nomination Committee annually considers appropriate targets and key performance indicators (KPIs) to link the STI plan and the level of payout if targets are met. This includes recommending to the Board the maximum payout under the STI plan and minimum levels of performance to trigger payment of an STI.
The Remuneration and Nomination Committee is responsible for assessing whether the KPIs are met and whether or not STIs will be paid. The STI plan makes provision for adjustments up or down in line with under or over achievement against the target performance levels. In addition, the Board, in consultation with the Remuneration and Nomination Committee, has discretion to adjust STI payments on the basis of performance of the individual or the Company as a whole, subject always to the maximum STI opportunity of the Senior Executive.
Senior Executives that leave during the relevant period may be paid a portion of their STI at the Board’s discretion. In the case of a good leaver the Board may grant a pro-rata share of their STI entitlements. Where a Senior Executive is a bad leaver and departs under adverse circumstances no pro-rata share is granted.
ANNUAL REPORT 2017 CARSALES.COM LIMITED 43F
or p
erso
nal u
se o
nly
2.3.2.1 FY17 STI Plan Structure
The KPIs linked to STI plans contain 3 major components and within each component are a series of objectives:
• Financial performance (70% of On-target Earnings Value): The financial objectives set against key financial targets relate to performance against Board approved annual financial objectives of the Company. The targets set in this component of the plan will normally relate to the achievement against:
1. Company EBITDA and 2. Company Net Profit After Tax (NPAT).
This section of the plan enables the Senior Executive to earn up to an additional 70% of on-target earnings for over achievement against each of the above mentioned objectives.
Financial objectives are always set ensuring that the Company is mindful of expected consensus earnings expectations.
• Project delivery (20% of On-target Earnings Value): The project objectives involve the execution of pre-determined project targets for which each Senior Executive is responsible. Projects may include the deployment of new products and technology, developing new markets or improving particular important performance metrics.
This section of the plan enables the Senior Executive to earn up to an additional 4% of on-target earnings for over achievement against each of the above mentioned objectives.
• People and culture (10% of On-target Earnings Value): carsales is a business that prides itself on having a highly engaged and motivated workforce with a strong sense of values, culture and passion for what it does. The people and culture section of the plan is designed to ensure that Senior Executives are incentivised to nurture and build on these principles and values. Each Senior Executive has performance objectives to ensure there is ongoing development and enhancement of Company culture. The performance of this is measured through the annual Employee Engagement Survey.
This section of the plan enables the Senior Executive to earn up to an additional 2% of on-target earnings for over achievement against the above mentioned objective.
2.3.3 Deferred Short Term Incentives Deferred Short Term Incentives (DSTI) are paid to Senior Executives in the form of an annual award of performance rights on the achievement of determined objectives and are not exercisable for a further 12 months after the testing date.
2.3.3.1 FY17 DSTI Plan Structure
The vesting of performance rights is subject to the achievement of a financial year ending 30 June 2017 earnings per share (EPS) target but is only exercisable 12 months post that testing date.
The minimum and maximum EPS targets for the performance rights to vest have been set by the Board. In considering the appropriate EPS targets, the Board has used the historical earnings performance of the Company, forward looking market consensus earnings expectations and other internal forward looking plans as inputs for determining the appropriate objective, including the level of investment required in early stage adjacent businesses over the year.
Performance rights will not be capable of exercise if at the testing date the minimum targeted growth rate has not been achieved.
Performance rights are capable of exercise if at the testing date the EPS target has been achieved or exceeded as follows:
• If the EPS achieved is equal to the minimum target, 70% of the performance rights will be capable of exercise.
• If the EPS achieved is between the minimum and maximum targets, vested performance rights will be capable of exercise on a pro-rata basis between 70% and 100%.
• If the EPS achieved is equal to or exceeds the maximum target, 100% of the performance rights will be capable of exercise. The performance conditions applying to the performance rights are tested at 30 June 2017.
Subject to the performance conditions being satisfied, performance rights may be exercised after the Board releases the 2018 Annual Report to the ASX.
REMUNERATION REPORT CONTINUED
ANNUAL REPORT 2017 CARSALES.COM LIMITED44F
or p
erso
nal u
se o
nly
2.3.4 Long Term IncentivesLTIs are provided to eligible employees via the carsales.com Ltd Employee Option Plan which was established via a prospectus lodged with ASIC in 2000. Upon recommendation by the Remuneration and Nomination Committee, the Board determines who shall be eligible to participate in the plan. The LTI is intended to incentivise management to deliver high performance outcomes over the long term in a structure that aligns with the interests of shareholders.
The LTI awards are a combination of options and performance rights under this plan and are issued for no cash consideration. Options and performance rights are issued subject to vesting rules and expiry periods. Options and performance rights vest on fixed dates provided that employment has not been terminated, and targets have been achieved. The Company’s LTI presently has a 3-year vesting period.
Options and performance rights issued to the CEO contain the same terms, conditions and performance targets as those issued to Senior Executives.
Senior Executives who leave the Company have 30 days from their date of departure to exercise any vested options they may be holding unless such departure is under adverse conditions. In exceptional circumstances, and at the Board’s discretion, Senior Executives may be allowed to retain unvested options and performance rights and exercise them in a future period when they vest.
There are three years of unvested LTI awards which have performance periods that include the FY17 financial year as follows:
Financial year of grant Performance periodRelevant performance year to determine vesting Vesting date
FY15 1 July 2014 – 30 June 2017 FY17 August 2017FY16 1 July 2015 – 30 June 2018 FY18 August 2018FY17 1 July 2016 – 30 June 2019 FY19 August 2019
The FY15 award has been performance tested in the FY17 year and the amount of the award vesting is set out in section 5.4.
The vesting of the LTI is subject to the achievement of an EPS target (FY15, FY16 and FY17 awards) and a Relative Total Shareholder Return (RTSR) target (FY17 award only) with a testing date of 30 June in the relevant year and are exercisable after the Board releases the Annual Report to the ASX for that year. The minimum and maximum EPS and RTSR targets for the options and performance rights have been set by the Board. The rationale for the choice of EPS as a target has been historically as a result of having only a small pool of relevant comparable peers, being other ASX listed online corporations, and the direct alignment to changes in shareholder wealth. However following feedback from shareholders who sought an additional performance metric be added by the Company to the LTI plan, the Board introduced a second performance measure being Relative Total Shareholder Return (RTSR) for awards made under the FY17 LTI plan, as well as the EPS target.
In considering the appropriate EPS target, the Board uses the historical earnings performance of the Company, forward looking market consensus earnings expectations and other internal forward looking plans as inputs for determining the appropriate objective.
The minimum EPS target required for any of the awarded options and performance rights to vest is a target that will require the Company to achieve an EPS value that will reflect a significant compound annual growth rate (CAGR) in EPS between the baseline year and the testing year.
The Company will publish in its Annual Report the minimum and maximum EPS target that was applicable to the grant, along with the actual EPS achieved by the Company in that relevant year.
ANNUAL REPORT 2017 CARSALES.COM LIMITED 45F
or p
erso
nal u
se o
nly
Options and performance rights subject to the EPS target will be capable of exercise, at the relevant testing date if the EPS target for the relevant period has been achieved or exceeded as follows:
• if the EPS achieved is equal to the minimum target, 70% of the vested options and performance rights will be capable of exercise;
• if the EPS achieved is equal to or exceeds the maximum target, 100% of the vested options and performance rights will be capable of exercise; and
• if the EPS achieved is between the minimum and maximum targets, vested options and performance rights will be capable of exercise on a pro-rata basis between 70% and 100%.
The RTSR metric measures the returns provided to carsales.com Ltd shareholders over a 3 year period from 1 July 2016 to 30 June 2019, including movements in share price and dividends paid. The RTSR metric is adjusted for any significant corporate share capital restructuring (for example a stock split or rights issue). The company’s actual TSR is then compared against a comparator group to create a RTSR metric.
The comparator group used in the RTSR calculation is the ASX200 as at 30 June 2016. The company has selected this comparator group as there are not enough similar domestic peers of appropriate size and risk profile to make a customised comparator group meaningful.
Options and performance rights subject to the RTSR target will be capable of exercise, at the relevant testing date if the RTSR target for the relevant period has been achieved or exceeded as follows:
• if the relative ranking against the comparator group is below the 50th percentile no performance rights or options will be capable of exercise;
• if the relative ranking against the comparator group is at the 50th percentile 50% performance rights or options will be capable of exercise;
• if the relative ranking against the comparator group is between the 50th percentile and the 75th percentile performance rights or options will be capable of exercise on a straight line pro-rata basis from 50% to 100%; and
• if the relative ranking against the comparator group is at or above the 75th percentile 100% performance rights or options will be capable of exercise.
The expiry date of the FY15 and FY16 awards are five years from the grant date and the FY17 award is 15 years from the grant date. The expiry date for the FY17 and all future equity based awards was extended to 15 years as a result of the review by EY to bring the award program into line with market best practice.
2.3.5 Other benefitsSenior Executives receive salary continuance insurance cover that is also provided to all other carsales employees. The policy is held with OnePath Life Ltd, but is not allocated on an individual employee basis.
In addition, the former CEO was provided with a paid travel benefit during the year which includes the cost of fringe benefit tax (FBT).
2.4 Non-Executive DirectorsFees and payments to Non-Executive Directors are determined by the demands that are made on their time, as well as their responsibilities. Non-Executive Directors receive fixed, rather than variable pay.
REMUNERATION REPORT CONTINUED
ANNUAL REPORT 2017 CARSALES.COM LIMITED46F
or p
erso
nal u
se o
nly
3. Company 5 year financial performanceThe graphs below demonstrate carsales’ financial performance over the past five years along with how that performance has translated to shareholders in the form of earnings per share (EPS), share price performance and to Key Management Personnel (KMP) total remuneration shown as a percentage of adjusted profit for the year.
Adjusted EPS and KMPremuneration
FY130
10
40
30
20
50
0
2
8
6
4
10
FY14 FY15 FY16 FY17
Adjusted EPS
Ad
just
ed E
PS c
ents
Ratio
%
KMP % of adjusted NPAT
Dividend paymentand ratio
FY1330
40
70
80
90
50
60
100
60
70
90
80
100
FY14 FY15 FY16 FY17
Dividend payments in respective year
$’m
Ratio
%
Dividend payout ratio %
Share price and movementpercentage
FY130.0
2.0
8.0
6.0
4.0
14.0
12.0
10.0
-40
-20
40
20
0
60
FY14 FY15 FY16 FY17
Closing share price$
Mo
vem
ent %
Share price movement (cents)
Dividend payment for FY15 includes a special dividend of 1.4 cents per share ($3,361,000).
4. Remuneration snapshot4.1 Cash based benefits that were realised in FY17To make it easier for our shareholders to understand the actual amounts the Company’s KMPs received in the current financial year, the Company has opted to include additional disclosures to those required under the Australian Accounting Standards and the Corporations Act 2001.
The figures in the tables below are in addition to the disclosures made in section 4.2 (which provides a breakdown of Senior Executive remuneration in accordance with statutory requirements and Australian Accounting Standards) The following tables below are designed to reflect value of benefits that have actually been received by the Non-Executive Directors and Senior Executives in FY16 and FY17 rather than the value received on an accounting treatment basis and have not been prepared in accordance with the Australian Accounting Standards.
The approach to presenting the tables below has been as follows:
• The amounts shown in the table include cash salary (which includes superannuation), non-monetary benefits and STI payable in cash under the STI plan in respect of that year.
• The DSTI and LTI that has been earned as a result of performance in previous financial years but was subject to a restriction period that ended either in June or August 2017 (June or August 2016 for the FY16 financial year).
• The DSTI value in the table reflects the net value of shares received by the Senior Executive. The net value is calculated as the quantity of shares received at the 30 June 2017 closing share price (30 June 2016 closing share price for the FY16 financial year).
• The LTI values in the table reflect the net value of options and shares received by the Senior Executive. The net value is calculated as the quantity of shares and options received at the 30 June 2017 share price (30 June 2016 closing share price for the FY16 financial year), less the exercise cost of converting options to shares.
• The 2016 table is presented on the same basis as 2017 unless specified otherwise.
Other Senior ExecutivesAjay Bhatia 743,751 - - 155,575 57,969 - 957,295Anthony Saines 669,876 - - 208,250 58,181 - 936,307Paul Barlow 561,126 - - 161,700 42,163 - 764,989Chris Polites (ii) 309,959 - - 102,900 28,984 - 441,843Total Key Management Personnel compensation (Group) 6,098,384 61,387 2,245,215 1,208,175 292,700 - 9,905,861 (i) Cameron McIntyre was a Senior Executive for the entire year, as Chief Operating Officer up until his appointment as Managing Director and CEO on 17 March 2017. (ii) Chris Polites resigned on 22 March 2017 and ceased being a Senior Executive from that date.
4.2 Accounting based benefitsThe tables below have been prepared in accordance with the requirements of the Corporations Act and relevant Australian Accounting Standards. The figures provided under the share based payments columns are based on accounting values and do not reflect actual cash amounts received by Senior Executives in FY17.
Total Key Management Personnel compensation (Group) 5,923,794 1,208,175 61,387 227,152 174,590 262,603 (421,147) (437,103) 986,107 7,985,558 (i) The negative share based payments reflect the reversal of the accounting provision for the FY17 Long Term Incentive award which did not meet the minimum
threshold required for performance rights to vest, and for Mr Roebuck the lapsing of the FY18 LTI award on his retirement.(ii) Cameron McIntyre was a Senior Executive for the entire year, as Chief Operating Officer up until his appointment as Managing Director and CEO on 17 March 2017. (iii) Chris Polites resigned on 22 March 2017 and ceased being a Senior Executive from that date.
Total Key Management Personnel compensation (Group) 6,243,730 2,076,000 287,220 180,888 162,626 137,247 42 63,870 9,151,623 (i) The negative share based payments reflect the reversal of the accounting provision for the FY16 Long Term Incentive award which did not meet the minimum
threshold required for performance rights to vest.
5. Remuneration outcomes5.1 SalaryAnnual cash salary and superannuation entitlements of Senior Executives for FY17 is set out below:
NameAnnual cash salary and superannuation
from 1 July 2016 to 31 March 2017(ii)
Annual cash salary and superannuation from 1 April 2017 to 30 June 2017
G Roebuck(i) $1,900,000 -C McIntyre(ii) $1,150,000 $1,269,615A Bhatia $730,000 $785,000A Saines $656,500 $710,000P Barlow $551,500 $590,000C Polites(i) $532,500 - (i) Greg Roebuck and Chris Polites resigned effective 17 March and 22nd March 2017 respectively and were no longer considered Senior Executives from those dates. (ii) Cameron McIntyre’s CEO salary of $1,269,615 changed on 17 March 2017 when he was appointed to the role.
ANNUAL REPORT 2017 CARSALES.COM LIMITED 51F
or p
erso
nal u
se o
nly
The figures in each column of the table above are presented as annualised salary figures, rather than the actual amount paid in respect of each period. Actual cash paid to each Senior Executive is shown in the cash remuneration tables in section 4.1. All Senior Executives except for Greg Roebuck received a salary increase on 1 July 2016. The increases in cash salary and superannuation awarded by the Board for the period commencing 1 July 2016 were less than 10% compared to the salary for the FY16 financial year.
As a result of the appointment of a new CEO from 17 March 2017 the Executive Leadership Team was restructured along with the roles and responsibilities of the Senior Executives impacted effective from 1 April 2017 and annual cash salary and superannuation was increased for each of the Senior Executives reflecting their increased responsibilities. The salaries set out above for the period 1 April 2017 to 30 June 2017 will continue to apply for the FY18 year.
As part of the new structure the role of Chief Operating Officer was not replaced. Anthony Saines (previously responsible for media and manufacturer revenue) was promoted to Managing Director Commercial and took responsibility for all of the Group’s domestic revenue from commercial customers. Ajay Bhatia (previously CIO) was promoted to Managing Director Consumer Business and took responsibility for all of the Group’s domestic consumer revenue. Paul Barlow was promoted to Managing Director International and continues his responsibilities for the Group’s expanding international businesses and revenues.
No Senior Executive elected to receive any proportion of their salary package in the form of non-financial benefits.
5.2 FY17 STI payments (cash bonus) plan outcomesThe Board has conducted an assessment of the performance of plan objectives and the information below describes each component of the plan’s performance outcomes.
To protect the commercial sensitivity of each objective outcome the Company has used the following references and applied a relevant reference to the plan objective:
Exceeded – The actual objective outcome exceeded the target objective outcome.
On target – The actual objective outcome was equal to the target objective outcome.
Partial achievement – The actual objective outcome while below the target objective outcome was still high enough that some achievement was reported.
Missed – The actual objective outcome was materially below the target objective outcome.
• Financial Performance
– Company EBITDA – Partially Achieved – Company NPAT – Exceeded
• Project Delivery – There were 5 projects that were part of this section of the STI plan, including objectives relating to customer satisfaction, technology development objectives, new revenue streams and new commercial products. Due to commercial sensitivity each specific project objective is not outlined below only the statuses recorded against the overall project numbers are provided:
– One project objective was – Exceeded – Three project objectives were – On Target – One project objective was – Missed
• People and Culture
– Employee Engagement – Exceeded
2017
Actual STI payment
$% of
target paid% of target
forfeitedSTI cap
$% of STI cap paid
G Roebuck* 257,250 98 2 750,000 34C McIntyre 322,500 108 - 540,000 60A Bhatia 155,575 98 2 247,125 63A Saines 208,250 98 2 358,500 58P Barlow 161,700 98 2 253,500 64C Polites* 102,900 98 2 165,000 62 * Greg Roebuck and Chris Polites resigned on 17 March and 22nd March 2017 respectively. The targets and cap set out above are the pro-rated annual targets and
caps that applied and the actual STI payment was pro-rated to reflect the period of the year that the individuals were employed by the Company.
REMUNERATION REPORT CONTINUED
ANNUAL REPORT 2017 CARSALES.COM LIMITED52F
or p
erso
nal u
se o
nly
As a result of the appointment of the new CEO, in addition to changes in the annual cash salary and superannuation as set out in section 5.1 above, Senior Executives were given an increased STI target opportunity (and STI cap) reflecting their increased responsibilities and the importance of their roles to overall Group financial performance. The STI targets and caps set out in the table above reflect the pro-rata of the Senior Executives’ previous roles’ targets and caps, and new positions’ targets and caps for the relevant period in each role.
The overall financial results for FY17 were once again record results. For the purposes of determining the STI outcomes above, the Company EBITDA KPI was partly achieved and the Company NPAT KPI was exceeded. In assessing the KPI achievement the Board considered that the financial performance for the majority of the Group has been strong with achievements materially in line or ahead of the expectations of the Board in setting the FY17 KPIs for Senior Executives. The reported results were significantly impacted by the performance of Stratton Finance which suffered an unexpected material impact caused by constraints from a major lender. These constraints were outside the control of both that business and the Group, with the ability to mitigate restricted by the nature of the requirements on a consumer finance broking business. Therefore the Board concluded it was appropriate to adjust the FY17 financial KPI targets to take account of these constraints, as well as the corporate and non-recurring gains and losses set out in the reconciliation of reported to adjusted NPAT on page 82.
In addition, in determining the STI award for Cameron McIntyre, the Board has considered the transition between CEOs and his performance as CEO in leading the Company to a strong second half result.
The Board notes that after applying the discretion described above with the exception of the CEO, the payments awarded under the STI plan in FY17 are less than 100% of the on-target earnings opportunity and below those awarded to each Senior Executive last year.
When a Senior Executive leaves the Company the Board will assess the nature of their departure and therefore whether they are deemed a ‘good leaver’ or a ‘bad leaver’. In the case of Greg Roebuck and Chris Polities the Board deemed that both had been good leavers of the company and in making that determination awarded them a short term incentive which was based on entitlements.
5.3 DSTI plan outcomes5.3.1 FY17 award outcomesUnder the FY17 DSTI award 12,155 performance rights were issued to Mr Roebuck as the CEO on 28 October 2016, with an exercise price of $0.00. These performance rights were approved by shareholders at the AGM held on 28 October 2016. The performance rights lapsed when Mr Roebuck retired on 17 March 2017.
25,375 performance rights were issued to Senior Executives on 28 October 2016, with an exercise price of $0.00.
The performance period for the FY17 award is for the FY17 year, with vesting deferred for a further year to August 2018. The performance achieved in the FY17 is set out below:
DSTI Minimum entitlement Maximum entitlement Actual achievedGrant Vesting date % payable EPS target ($) % payable EPS target ($) % payable EPS ($)Year ending 30 June 2017 August 2018 70% 0.474 100% 0.499 78% 0.480
The actual EPS achieved for the DSTI grant vesting in August 2017 of $0.480 per share is above the minimum entitlement requirement of $0.474 per share. In calculating the achieved EPS of $0.480 the Company included the earnings and related costs from all acquisitions that occurred up until 28 October 2016 and specifically excludes:
• Demotores Group – Acquired 100% interest in February 2017
In addition, all of the one-off items of a corporate nature incurred in the FY17 year excluded in calculating adjusted NPAT (such as the associate fair value revaluation loss) as set out on page 82 have been excluded from the calculation of the achieved EPS.
ANNUAL REPORT 2017 CARSALES.COM LIMITED 53F
or p
erso
nal u
se o
nly
5.3.2 FY16 award outcomesThe 2016 DSTI award was performance tested at 30 June 2016 and met the minimum EPS target as set out in the 2016 Annual Report with 80% of the award vesting, subject to the continued vesting condition. This award vests immediately after the Board released the 2017 Annual Report to the ASX. The amounts payable under this award based on the accounting Black Scholes valuations are as follows:
Actual DSTI award vesting
2017 $Paid
%Forfeited
%Forfeited
$G Roebuck* - - 100% 120,000C McIntyre 80,000 80% 20% 20,000A Bhatia 44,000 80% 20% 11,000A Saines 44,160 80% 20% 11,040P Barlow 32,000 80% 20% 8,000C Polites 22,000 80% 20% 5,500 * As set out in section 4.6 Mr Roebuck forfeited his 2016 DSTI award in return for a cash payment of $95,915 on retirement at 17 March 2017.
The cash value to each Senior Executive of the 2016 DSTI vesting based on the 30 June 2017 share price is as follows:
5.4 LTI plan outcomes for FY175.4.1 LTI plan outcome for the FY15 award vesting in FY17EPS targets relating to Senior Executive options and performance rights, together with the Company’s actual achievements are as follows:
LTI Minimum entitlement Maximum entitlement Actual achievedGrant Vesting date % payable EPS target ($) % payable EPS target ($) % payable EPS ($)Year ending 30 June 2015 August 2017 70% 0.572 100% 0.602 0% 0.493
The exercise price of each option is fixed by the Board when the options and performance rights are issued. Amounts received on the exercise of options are recognised as share capital. The performance rights have a $0.00 exercise price and are converted to shares when all vesting conditions have been met. The option price is based on a 5 day volume weighted average price from June 30 of the corresponding financial year. Options and performance rights granted under the plan carry no dividend or voting rights until vested.
Minimum and maximum EPS targets for the options and performance rights were set for the period ending 30 June 2017 and the award of options and performance rights was approved by shareholders at the 2014 AGM on 24 October 2014.
EPS targets exclude any corporate activity associated with mergers and acquisitions, corporate or capital re-organisations that have occurred after 24 October 2014.
REMUNERATION REPORT CONTINUED
ANNUAL REPORT 2017 CARSALES.COM LIMITED54F
or p
erso
nal u
se o
nly
The actual EPS achieved for the LTI grant vesting in August 2017 of 0.493 per share is above the reported FY17 EPS of 0.454 per share. In calculating the achieved EPS of 0.493 the Company excluded the earnings and related costs from the following acquisitions and investments that occurred after 24 October 2014:
• RateSetter – acquired March 2015
• RedBook Inspect (formerly Auto Inspect) – acquired June 2015
• SoloAutos – acquired October 2015
• Chileautos – acquired March 2016
• PromisePay – acquired May 2016
• Demotores Group – acquired February 2017
In addition, all of the one-off items of a corporate nature incurred in the FY17 year excluded in calculating adjusted NPAT (such as the associate fair value revaluation loss) as set out on page 82 have been excluded from the calculation of the achieved EPS.
The amounts payable (cash value at 30 June 2017) under the LTI grant vesting in August 2017 are as follows:
Actual LTI payment
2017 $Paid
%Forfeited
%Forfeited
$G Roebuck - - 100% 805,838C McIntyre - - 100% 284,112A Bhatia - - 100% 121,761A Saines - - 100% 162,351P Barlow - - 100% 81,170C Polites - - 100% 66,967 5.4.2 Unvested Plan Structure for FY16 and FY17 awards (vesting beyond FY17)The following award details are outlined for all unvested grants.
Award date
Number of options
Number of performance
rights
Optionsexercise
price $
Performance rights exercise
price $
Vesting date
Financial year
grantedManaging Director* 23/10/2015 96,972 20,133 10.24 0 August 18 FY16Other Senior Executives 23/10/2015 129,339 24,860 10.24 0 August 18 FY16Managing Director* 28/10/2016 149,907 31,287 12.23 0 August 19 FY17Other Senior Executives 28/10/2016 221,113 46,150 12.23 0 August 19 FY17 * The Managing Director refers to Cameron McIntyre.
Other Senior Executives included in the table above are only those Senior Executives at 30 June 2017.
5.5 Non-monetary benefits and other paymentsThe following payments were made to Greg Roebuck on his retirement as Managing Director and CEO on the 17th March 2017 in accordance with his employment contract and within appropriate limits:
Other benefits – cash paid
$
Other benefits – accounting basis
$Payment of notice period on retirement 890,192 890,192Cash payment in lieu of FY17 vesting DSTI 95,915 95,915Payout of accrued annual leave and long service leave 1,259,108 -Total other payments 2,245,215 986,107
ANNUAL REPORT 2017 CARSALES.COM LIMITED 55F
or p
erso
nal u
se o
nly
Mr Roebuck had a 6 month notice period which was paid in full. In addition, as a good leaver the awarded cash value of the DSTI due to vest in August 2017 after publication of the FY17 annual report was also paid and the performance rights lapsed accordingly. The payout of accrued annual leave and long service leave is reflected in the cash payment on retirement but has been included in salary in the accounting benefits table in the current and previous financial years as the annual leave accrued.
Non-monetary benefits of $61,387 (including FBT) were paid to Greg Roebuck during the year comprising a small travel allowance taken in the early part of the FY17 year ahead of the AGM and the value of gifts presented to Mr Roebuck on his retirement.
5.6 Additional information5.6.1 STI, DSTI and LTI Payments (cash, options & performance rights) achievement against maximum entitlementAll Senior Executives received grants that were equal to or less than their maximum potential STI & DSTI entitlements. The relative proportions of remuneration which are linked to performance and those that are fixed based on the accounting values table in section 4.2 are as follows:
Cash salary and superannuation At risk – STI At risk – DSTI At risk – LTI
Other Senior Executives Ajay Bhatia 78 78 16 18 5 - 1 4Anthony Saines 72 71 22 25 5 - 1 4Paul Barlow 73 74 21 23 5 - 1 3Chris Polites 73 70 24 28 3 - * 2 * Percentage of relative proportion of remuneration related to performance not disclosed as the total amount of DSTI and LTI was negative reflected by forfeiture
of options and performance rights due to the executives ceasing of employment on 17 March 2017 and 22 March 2017.
REMUNERATION REPORT CONTINUED
ANNUAL REPORT 2017 CARSALES.COM LIMITED56F
or p
erso
nal u
se o
nly
5.6.2 Share based compensation disclosuresThe terms and conditions of each grant of options and performance rights affecting remuneration in the current or a future reporting period are as follows:
Grant date Date exercisable Expiry dateExercise price
$
Value at grant date
$Vested
%Performance
achievedOctober 2011 August 2013 October 2016 $4.69 $1.10 100 YesOctober 2011 August 2014 October 2016 $4.69 $1.19 100 YesOctober 2012 August 2014 October 2017 $5.93 $2.33 100 YesOctober 2012 August 2015 October 2017 $5.93 $2.43 75 YesOctober 2014 August 2017 October 2019 $10.71 $2.36 - No(i)
October 2014 August 2017 October 2019 $0.00 $9.12 - No(i)
October 2015 August 2017 October 2020 $0.00 $8.74 80 Yes(ii)
October 2015 August 2018 October 2020 $10.24 $1.86 n/a To be determinedOctober 2015 August 2018 October 2020 $0.00 $8.44 n/a To be determinedOctober 2016 August 2018 October 2031 $0.00 $9.86 78 Yes(iii)
October 2016 August 2019 October 2031 $0.00 $9.49 n/a To be determinedOctober 2016 August 2019 October 2031 $0.00 $4.87 n/a To be determinedOctober 2016 August 2019 October 2031 $12.23 $1.10 n/a To be determinedOctober 2016 August 2019 October 2031 $12.23 $0.98 n/a To be determined (i) LTI options and performance rights granted in October 2014 that are exercisable in August 2017 will not vest as a result of the Company not meeting
the minimum EPS target which had been set.(ii) Subject to satisfactory completion of the remaining service period 80% of this award is expected to vest based on the performance achievements
tested at 30 June 2016 as set out in the FY16 annual report.(iii) Subject to satisfactory completion of the remaining service period 78% of this award is expected to vest in August 2018 based on the performance
achievements tested at 30 June 2017 as set out in on page 53.
When exercisable, each option is convertible into one ordinary share upon payment of the exercise price by the option holder, provided that the option holder complies with the rules of the carsales.com Ltd Employee Option Plan. Performance rights will automatically be converted to one ordinary share upon the vesting date provided the holder complies with the rules of carsales.com Ltd Employee Option Plan.
Options and performance rights not exercised expire at the earliest of (a) the expiry date applicable to the option or performance right, (b) 30 days post the employee ceasing to be employed by carsales.com Ltd, (c) where EPS or RTSR vesting conditions are not met at the relevant date, or (d) where there has been a special circumstance, then within 90 days after that special circumstance has occurred or as specified by the Board.
ANNUAL REPORT 2017 CARSALES.COM LIMITED 57F
or p
erso
nal u
se o
nly
Details of options and performance rights granted over ordinary shares in the Company provided as remuneration to each of the Senior Executives are set out below:
Further information on the options and performance rights is set out in Note 24 to the financial statements.
5.6.3 Shares provided on exercise of remuneration options and performance rightsDetails of ordinary shares in the Company provided as a result of the exercise of options by each Senior Executive are set out below.
Senior ExecutivesA Bhatia - - -A Saines - - -P Barlow - - -C Polites - - - * The value at the exercise date of options and performance rights that were granted as part of remuneration and were exercised during the year has been
determined as the intrinsic value of the options and performance rights at that date.
REMUNERATION REPORT CONTINUED
ANNUAL REPORT 2017 CARSALES.COM LIMITED58F
or p
erso
nal u
se o
nly
5.6.4 Share-based compensation benefitsFor each grant of options and performance rights, the percentage of the available grant that vested in the financial year, and the percentage that was forfeited because the person did not meet the service and performance criteria is set out below. The vesting periods for options and performance rights are detailed above. No options and performance rights will vest if the conditions are not satisfied, hence the minimum value of the options and performance rights yet to vest is nil. The value of the options and performance rights yet to vest has been determined as the amount of the grant date fair value of the options and performance rights that is yet to be expensed.
Share-based compensation benefits (options and performance rights)
* Vesting is contingent upon Board approval. Options are exercisable after the Board releases the results to ASX in August each year.
ANNUAL REPORT 2017 CARSALES.COM LIMITED 59F
or p
erso
nal u
se o
nly
(i) Option holdings and performance rights
The numbers of options and performance rights over ordinary shares in the Company held during the financial year by each Director of carsales.com Ltd and other Key Management Personnel of the Company, including their personally related parties, are set out below.
Other Senior ExecutivesA Bhatia 98,870 96,175 - (41,609) - 153,436 5,032 148,404A Saines 127,118 118,845 - (55,478) - 190,485 5,050 185,435P Barlow 66,779 67,476 - (27,739) - 106,516 3,660 102,856C Polites 53,664 48,088 - (22,885) (76,351) 2,516 2,516 - (i) Other change reflects options and performance rights outstanding at cessation of employment.(ii) Represents performances rights under the 2016 DSTI award that will vest immediately after the release of the 2017 annual report to the ASX.
(ii) Share holdings
The numbers of shares in the Company held during the financial year by each Director of carsales.com Ltd and other Key Management Personnel of the Company, including their personally related parties, are set out below. There were no shares granted during the reporting period as compensation.
Other Senior ExecutivesOrdinary sharesA Bhatia 26,135 - (25,000) 1,135A Saines 26,915 - (10,915) 16,000P Barlow 75,248 - (45,248) 30,000C Polites 23,000 - - 23,000 * Greg Roebuck and Chris Polites resigned effective 17 March and 22 March 2017 respectively and were no longer considered Senior Executives from those dates.
The total balance represents the total shareholding at the date they ceased to be Senior Executives.
5.6.5 Other transactions with Key Management Personnel(i) Directors of carsales.com Ltd
W Pisciotta and S Kloss (Alternate Director) are Directors and shareholders of Pentana Solutions Pty Ltd, which entered into a relationship agreement with carsales.com Ltd in 2010 for 5 years for the supply of data and services, which was subsequently extended to March 2017. Under the contract, Pentana Solutions supplies data for the exclusive use of carsales.com Ltd in return for a fixed annual payment, plus a percentage of revenues generated through Pentana Solutions. Heads of agreement have been signed with Pentana to further extend the supply of data and services to 2021.
R Collins is a shareholder of automotive dealerships which utilised the Group’s services under terms and conditions no more favourable than dealing with other customers at arm’s length in the same circumstances.
E Gilbert is a Director of automotive dealerships which utilised the Group’s services under terms and conditions no more favourable than dealing with other customers at arm’s length in the same circumstances.
The Company does not disclose the exact value of its contracts with R Collins or E Gilbert so as not to reveal information that is commercially sensitive to the relevant automotive dealerships. However, the Company can disclose that the total value of contracts between the Company and automotive dealerships in which R Collins is a shareholder for the financial year was less than $0.75m; and the total value of contracts between the Company and the automotive dealerships of which E Gilbert is a Director for the financial years was less than $0.25m.
ANNUAL REPORT 2017 CARSALES.COM LIMITED 61F
or p
erso
nal u
se o
nly
REMUNERATION REPORT CONTINUED
5.6.6 Shares under option and performance rightsUnissued ordinary shares of carsales.com Ltd under option at the date of this report are as follows:
Date options granted Expiry date
Issue price of shares
$Number under
options
Number under performance
rightsOctober 2012 October 2017 $5.93 26,527 -October 2012 March 2018 $5.93 168,621 -October 2013 October 2018 $9.10 61,141 -October 2014 October 2019 $10.71 50,819 -October 2014 October 2019 $0.00 - 12,512October 2015 October 2020 $10.24 587,456 -October 2015 October 2020 $0.00 - 162,019October 2016 October 2031 $12.23 886,824 -October 2016 October 2031 $0.00 - 215,336
1,781,388 389,867
No option or performance rights holder has any right under the options or performance rights to participate in any other share issue of the Company. No options or performance rights have been issued post 30 June 2017.
5.6.7 Shares issued on the exercise of options and performance rightsThe following ordinary shares of carsales.com Ltd were issued during the year ended 30 June 2017 on the exercise of options granted under the carsales.com Ltd Employee Option Plan. No amounts are unpaid on any of the shares.
6. Non-Executive Directors’ remunerationThe current base remuneration pool was last approved by shareholders at the Annual General Meeting held on 23 October 2015.
Non-Executive Directors’ fees are determined within an aggregate Directors’ fee pool limit, which is periodically recommended for approval by shareholders. The maximum payable to be shared by all Non-Executive Directors currently stands at $1,500,000 per annum. The Directors determine how these are to be shared by the Directors.
The Board will from time to time invite a remuneration specialist to conduct a review and benchmarking of fees. The annualised fees paid to the Board are comfortably below the $1,500,000 pool approved by shareholders.
The following fee table applies:
$Chair fee 295,000Deputy Chair fee 140,000Base Director fee 120,000
Alternate Director fee 110,000First committee 25,000Second committee 30,000Subsidiary Board Director Fee 51,250
The Board has determined that the Second Committee fee should be slightly higher than the First Committee fee to recognise the significant additional time required of members serving on two Board committees.
The Non-Executive Directors had the following committee and other roles during the year:
DirectorsThe following persons were Directors of carsales.com Ltd during the financial year and up to the date of this report unless indicated otherwise:
Jeffrey Browne Non-Executive Chair
Greg Roebuck Managing Director – Resigned from the Board on 17 March 2017
Cameron McIntyre Managing Director – Appointed to the Board on 17 March 2017
Wal Pisciotta Non-Executive Director
Richard Collins Non-Executive Deputy Chair
Pat O’Sullivan Non-Executive Director
Kim Anderson Non-Executive Director
Edwina Gilbert Non-Executive Director
Steve Kloss Alternate Non-Executive Director
Meetings of DirectorsFull meetings of
Directors Audit and RiskRemuneration and
NominationA B A B A B
Jeffrey Browne (Board Chair) 14 15 ** ** ** **Richard Collins 12 15 4 4 ** **Wal Pisciotta 15 15 ** ** ** **Greg Roebuck (retired 17/3/2017) 12 12 ** ** ** **Cameron McIntyre (appointed 17/3/2017) 3 3 ** ** ** **Pat O’Sullivan (Chair – Audit and Risk Management) 13 15 4 4 5 5Kim Anderson (Chair – Remuneration and Nomination) 15 15 4 4 5 5Edwina Gilbert 15 15 ** ** 5 5Steve Kloss (Alternate Non-Executive Director) 12 15 ** ** ** ** A. Number of meetings attended.B. Number of meetings held during the time the Director held office or was a member of the committee during the year.** Not a member of the relevant committee.
Dividends – carsales.com LtdDividends paid to members during the financial year were as follows:
2017 $’000
2016 $’000
Final fully franked ordinary dividend for the year ended 30 June 2016 of19.5 cents (2015: 17.7 cents plus a special dividend 1.4 cents) per share paid on 17 October 2016. 47,028 45,898Interim fully franked ordinary dividend for the year ended 30 June 2017 of 18.7 cents (2016: 17.8 cents) per share paid on 20 April 2017. 45,146 42,878
92,174 88,776
At the end of the financial year the Directors have recommended the payment of a fully franked final ordinary dividend of $51,984,000 (21.5 cents per share) to be paid on 19 October 2017 out of retained profits at 30 June 2017.
Significant changes in the state of affairsDuring the financial year the Company continued to expand into new geographic markets by investing in controlling stakes in the Demotores Group with operations in Argentina, Chile and Colombia, a leading automotive classified business in its respective markets. Further details are set out in Note 20 to the financial statements. Further matters are set out in the Operating and Financial Review on pages 22 to 25.
OTHER DIRECTORS’ DISCLOSURES CONTINUED
ANNUAL REPORT 2017 CARSALES.COM LIMITED64F
or p
erso
nal u
se o
nly
Matters subsequent to the end of the financial yearNo matter or circumstance has arisen since 30 June 2017 that has significantly affected, or may affect:
(a) the Group’s operations in future financial years, or
(b) the results of those operations in future financial years, or
(c) the Group’s state of affairs in future financial years.
Insurance of officersDuring the financial year, carsales.com Ltd paid a premium to insure the Directors and officers of the Company and its Australian-based controlled entities. The contract of insurance prohibits disclosure of the nature of the liability and the amount of the premium.
Indemnification of Directors and officersAll current Directors and officers are indemnified under a deed of indemnity, insurance and access.
Non-audit servicesThe Company may decide to employ the auditor on assignments additional to their statutory audit duties where the auditor’s expertise and experience with the Company are important.
Details of the amounts paid or payable to the auditor (PwC) for non-audit services provided during the year are set out below. The Board of Directors has considered the position and, in accordance with advice received from the Audit and Risk Management Committee, is satisfied that the provision of the non-audit services is compatible with the general standard of independence for auditors imposed by the Corporations Act 2001. The Directors are satisfied that the provision of non-audit services by the auditor, as set out below, did not compromise the auditor independence requirements of the Corporations Act 2001 for the following reasons:
• all non-audit services have been reviewed by the Audit and Risk Management Committee to ensure they do not impact the impartiality and objectivity of the auditor; and
• none of the services undermine the general principles relating to auditor independence as set out in APES 110 Code of Ethics for Professional Accountants.
During the year the following fees were paid or payable for non-audit services provided by the auditor of the parent entity, its related practices and non-related audit firms:
2017 $’000
2016 $’000
Other assurance servicesPwC Australian firmDue diligence services 238,454 224,566Total remuneration for other assurance services 238,454 224,566
Taxation servicesPwC Australian firmTax compliance services 86,526 143,350Tax consulting and tax advice on acquisitions 63,102 88,124Total remuneration for taxation services 149,628 231,474
Other advisory servicesOther services 37,850 88,472
Total remuneration for non-audit services 425,932 544,512
ANNUAL REPORT 2017 CARSALES.COM LIMITED 65F
or p
erso
nal u
se o
nly
OTHER DIRECTORS’ DISCLOSURES CONTINUED
Auditor’s independence declarationA copy of the auditor’s independence declaration as required under section 307C of the Corporations Act 2001 is set out on page 67.
Rounding of amountsThe Company is of a kind referred to in ASIC Corporations (Rounding in Financial/Directors’ Reports) Instrument 2016/191, issued by the Australian Securities and Investments Commission, relating to the ‘rounding off’ of amounts in the Director’s Report. Amounts in the Director’s Report have been rounded off in accordance with that Class Order to the nearest thousand dollars or, in certain cases, to the nearest dollar.
AuditorPwC continues in office in accordance with section 327 of the Corporations Act 2001.
Corporate governance reportAs allowed under the ASX Corporate Governance Principles and Recommendations (Third Edition) the Company has included its report on compliance with the principles in the year to 30 June 2017 in the Corporate Governance section of the Investor Centre on the carsales website. The full report can be found at the following URL: http://shareholder.carsales.com.au/Investor-Centre/?page=Corporate-Governance
This report is made in accordance with a resolution of Directors.
Liability limited by a scheme approved under Professional Standards Legislation.
Auditor’s Independence Declaration
As lead auditor for the audit of carsales.com Limited for the year ended 30 June 2017, I declare that tothe best of my knowledge and belief, there have been:
(a) no contraventions of the auditor independence requirements of the Corporations Act 2001 inrelation to the audit; and
(b) no contraventions of any applicable code of professional conduct in relation to the audit.
This declaration is in respect of carsales.com Limited and the entities it controlled during the period.
Anton Linschoten MelbournePartnerPricewaterhouseCoopers
8 August 2017
ANNUAL REPORT 2017 CARSALES.COM LIMITED 67F
or p
erso
nal u
se o
nly
Consolidated statement of comprehensive income 69Consolidated statement of financial position 70Consolidated statement of changes in equity 71Consolidated statement of cash flows 72Notes to the consolidated financial statements 73
Key performanceCapital and financial risk management Other assets and liabilities Group structure Other
1. Segment information 7. Capital risk management 14. Trade and other receivables 19. Interest in other entities
23. Remuneration of auditors
2. Revenue 8. Cash and cash equivalents 15. Property, plant and equipment
20. Business combinations and disposals
24. Share-based payments
3. Expenses 9. Borrowings 16. Intangible assets 21. Related party transactions
25. Parent entity financial information
4. Income tax 10. Contributed equity 17. Payables and provisions 22. Deed of cross guarantee
26. Contingent liabilities
5. Reconciliation of profit after income tax to net cash inflow from operating activities
11. Reserves and retained earnings
18. Commitments 27. Other accounting policies
6. Earnings per share 12. Dividends 28. Events occurring after the reporting period
13. Financial risk management
Directors’ declaration 113Independent auditor’s report 114 to the members of carsales.com Ltd Shareholder information 120
FINANCIAL STATEMENT CONTENTS
ANNUAL REPORT 2017 CARSALES.COM LIMITED68F
or p
erso
nal u
se o
nly
CONSOLIDATED STATEMENT OF COMPREHENSIVE INCOMEFOR THE YEAR ENDED 30 JUNE 2017
Notes2017
$’0002016
$’000Revenue from continuing operationsSale of goods and services 2 372,114 344,010Revenue from continuing operations 372,114 344,010
ExpensesCosts of sale (34,030) (30,195)Sales and marketing expenses (98,055) (88,817)Service development and maintenance (31,059) (26,132)Operations and administration (32,473) (28,556)Earnings before interest, taxes, depreciation and amortisation 176,497 170,310
Depreciation and amortisation expense (9,966) (7,527)Finance income 9 640 537Finance costs 9 (7,517) (8,903)Share of net profit from associates accounted for using the equity method 19(c) 8,498 5,223(Loss)/gain on associates fair value adjustment and investment dilution 19(e) (6,877) 955Gain on sale of business 20(d) - 931Profit before income tax 161,275 161,526Income tax expense 4(a) (48,261) (47,450)Profit from continuing operations 113,014 114,076
Other comprehensive incomeItems that may be reclassified to profit or loss:Exchange differences on translation of foreign operations (8,575) (1,374)Share of remeasurement of net defined benefit liability of associates 11(a) 148 (333)Changes in the fair value of available-for-sale financial assets 11(a) 29 -Other comprehensive income for the year (8,398) (1,707)
Total comprehensive income for the year 104,616 112,369
Profit is attributable to:Owners of carsales.com Ltd 109,479 109,249Non-controlling interests 3,535 4,827
113,014 114,076Total comprehensive income for the year is attributable to:Owners of carsales.com Ltd 101,145 107,782Non-controlling interests 3,471 4,587
104,616 112,369
Earnings per share-based on profit from continuing operations, attributable to the ordinary equity holders of the parent entity: Cents CentsBasic earnings per share 6 45.4 45.4Diluted earnings per share 6 45.3 45.3
The above consolidated statement of comprehensive income should be read in conjunction with the accompanying notes.
ANNUAL REPORT 2017 CARSALES.COM LIMITED 69F
or p
erso
nal u
se o
nly
Notes2017
$’0002016
$’000ASSETSCurrent assetsCash and cash equivalents 8 39,795 28,709Trade and other receivables 14 48,404 44,722Inventories 833 1,112Total current assets 89,032 74,543
Non-current assetsInvestments accounted for using the equity method 19(c) 224,472 266,976Available-for-sale financial assets 19(d) 13,301 -Property, plant and equipment 15 7,289 6,608Deferred tax assets 4(d) 5,144 6,078Intangible assets 16 199,954 191,569Total non-current assets 450,160 471,231
The above consolidated statement of financial position should be read in conjunction with the accompanying notes.
CONSOLIDATED STATEMENT OF FINANCIAL POSITIONAS AT 30 JUNE 2017
ANNUAL REPORT 2017 CARSALES.COM LIMITED70F
or p
erso
nal u
se o
nly
CONSOLIDATED STATEMENT OF CHANGES IN EQUITY FOR THE YEAR ENDED 30 JUNE 2017
Attributable to owners of carsales.com Ltd
Notes
Contributed equity $’000
Other reserves
$’000
Retained earnings
$’000
Non-controlling
interests $’000
Total equity $’000
Balance at 1 July 2015 91,905 21,471 113,829 2,308 229,513Profit for the year - - 109,249 4,827 114,076Exchange differences on translation of foreign operations
- (1,134) - (240) (1,374)
Share of remeasurement of net defined benefit liability of associates
- (333) - - (333)
Total comprehensive income for the year - (1,467) 109,249 4,587 112,369
Transactions with owners in their capacity as owners:Contributions of equity upon exercise of employee share options
10(b) 2,173 - - - 2,173
Non-controlling interest on acquisition of subsidiaries
- - - 2,589 2,589
Dividends paid to members of the parent 12 4,948 - (88,776) - (83,828)Dividends paid to non-controlling interest - - - (5,304) (5,304)Increase in share-based payment reserve inclusive of tax
- 2,858 - - 2,858
Balance at 30 June 2016 99,026 22,862 134,302 4,180 260,370
Notes
Contributed equity $’000
Other reserves
$’000
Retained earnings
$’000
Non-controlling
interests $’000
Total equity $’000
Balance at 1 July 2016 99,026 22,862 134,302 4,180 260,370Profit for the year - - 109,479 3,535 113,014Exchange differences on translation of foreign operations - (8,511) - (64) (8,575)Share of remeasurement of net defined benefit liability of associates - 148 - - 148Changes in the fair value of available-for-sale financial assets 11(a) - 29 - - 29Total comprehensive income for the year - (8,334) 109,479 3,471 104,616
Transactions with owners in their capacity as owners:Contributions of equity upon exercise of employee share options 10(b) 467 - - - 467Share capital contributed by non-controlling interest - - - 150 150Dividends paid to members of the parent 12 6,368 - (92,174) - (85,806)Dividends paid to non-controlling interest - - - (2,258) (2,258)Decrease in share-based payment reserve inclusive of tax - (379) - - (379)Balance at 30 June 2017 105,861 14,149 151,607 5,543 277,160
The above consolidated statement of changes in equity should be read in conjunction with the accompanying notes.
ANNUAL REPORT 2017 CARSALES.COM LIMITED 71F
or p
erso
nal u
se o
nly
Notes2017
$’0002016
$’000Cash flows from operating activitiesReceipts from customers (including GST) 403,815 376,501Payments to suppliers and employees (including GST) (235,272) (213,518)Income taxes paid (43,767) (43,437)Net cash inflow from operating activities 5 124,776 119,546
Cash flows from investing activitiesInvestment in subsidiaries, net of cash acquired (6,654) (28,466)Investment in associates (1,040) (10,743)Payments for property, plant and equipment (2,395) (3,440)Payments for intangible assets (469) (881)Interest received 640 537Proceeds from sale property, plant and equipment 38 -Proceeds from sale of business 1,402 100Dividends received from associates 11,994 5,649Capital reduction in associates 13,511 -Net cash inflow/(outflow) from investing activities 17,027 (37,244)
Cash flows from financing activitiesProceeds from issues of shares and other equity securities 467 2,173Proceeds from borrowings 73,510 82,402Repayment of borrowings (107,576) (70,423)Dividends paid to non-controlling interests (2,258) (5,304)Dividends paid to company shareholders 12 (85,806) (83,828)Interest paid (7,561) (8,496)Net cash (outflow) from financing activities (129,224) (83,476)
Effects of exchange rates on cash and cash equivalents (1,493) 3,060 *
Net increase in cash and cash equivalents 11,086 1,886Cash and cash equivalents at the beginning of the financial year 28,709 26,823Cash and cash equivalents at end of year 8 39,795 28,709 * Prior year cash flow was reclassified to present the effect of foreign exchange rate changes on the cash and cash equivalents balances.
The above consolidated statement of cash flows should be read in conjunction with the accompanying notes.
CONSOLIDATED STATEMENT OF CASH FLOWS FOR THE YEAR ENDED 30 JUNE 2017
ANNUAL REPORT 2017 CARSALES.COM LIMITED72F
or p
erso
nal u
se o
nly
NOTES TO THE CONSOLIDATED FINANCIAL STATEMENTS
About this reportThis Financial Report covers the consolidated financial statements of the consolidated entity consisting of carsales.com Ltd, its subsidiaries and investments in associates. The Financial Report is presented in the Australian currency.
carsales.com Ltd is a company limited by shares, incorporated and domiciled in Australia. Its registered office and principal place of business is:
carsales.com LtdLevel 4, 449 Punt RoadRichmond Vic 3121
A description of the nature of the consolidated entity’s operations and its principal activities is included in the Chair and Chief Executive Officer’s Report on page 8, and in the Directors’ Reports on page 22, each of which are not part of this Financial Report.
The Financial Report was authorised for issue by the Directors on 8 August 2017. The Directors have the power to amend and reissue the Financial Report.
Through the use of the internet, we have ensured that our corporate reporting is timely and complete. All press releases, Financial Reports and other information are available at our shareholder’s centre on our website: www.carsales.com.au
For queries in relation to our reporting please call +61 (3) 9093 8600.
These financial statements have been streamlined where key information is grouped together for ease of understanding and readability. The notes include information which is required to understand the financial statements and is material and relevant to the operations, financial position and performance of the Group. Information is considered material and relevant if, for example:
• the amount in question is significant because of its size or nature;
• it is important for understanding the results of the Group;
• it helps to explain the impact of significant changes in the Group’s business – for example, acquisitions; or
• it relates to an aspect of the Group’s operations that is important to its future performance.
Navigating this reportThe notes are organised into the following sections:
• key performance: provides a breakdown of the key individual line items in the financial statements that the Directors consider most relevant to understanding performance and shareholder returns for the year and summarises the accounting policies, judgements and estimates relevant to understanding these line items;
• capital and financial risk management: provides information about the capital management practices of the Group, the Group’s exposure and management of various financial risks and explains how these affect the Group’s financial position and performance;
• other assets and liabilities: provides information on other balance sheet assets and liabilities that do not materially affect performance or give rise to material financial risk;
• group structure: explains aspects of the group structure, such as our portfolio of associate accounted investments and acquisitions and how these have affected the financial position and performance of the Group; and
• other: provides information on items which require disclosure to comply with Australian Accounting Standards and other regulatory pronouncements, however, are not considered critical in understanding the financial performance or position of the Group.
Significant and other accounting policies that summarise the measurement basis used and presentation policies and are relevant to an understanding of the financial statements are provided throughout the notes to the financial statements.
ANNUAL REPORT 2017 CARSALES.COM LIMITED 73F
or p
erso
nal u
se o
nly
Key reporting highlightsNotes containing information relevant to understanding significant changes to the Group’s affairs and performance in the current year are as follows:
• the Group recorded record revenue and EBITDA – Note 1; and
• full year dividend declared – Note 12.
Key estimates and judgementsThe preparation of financial statements in conformity with AIFRS requires the use of certain critical accounting estimates. It also requires management to exercise its judgement in the process of applying the Group’s accounting policies. The areas involving a higher degree of judgement or complexity, or areas where assumptions and estimates are significant to the financial statements, are set out below:
• goodwill impairment testing – Note 16(a);
• valuation of share-based payments – Note 24; and
• carrying value of Webmotors associate – Note 19(c).
Basis of preparationThese general purpose financial statements have been prepared in accordance with Australian Accounting Standards, other authoritative pronouncements of the Australian Accounting Standards Board, Urgent Issues Group Interpretations and the Corporations Act 2001. carsales.com Ltd is a for-profit entity for the purpose of preparing the financial statements.
(i) Compliance with International Financial Reporting StandardsThe Financial Report of carsales.com Ltd complies with International Financial Reporting Standards (IFRS) as issued by the International Accounting Standards Board (IASB).
(ii) Historical cost conventionThese financial statements have been prepared under the historical cost convention.
(iii) Financial statement presentationThe accounting policies adopted are consistent with those of the previous financial year unless otherwise stated.
(iv) Going concernThe financial statements have been prepared on a going concern basis.
Basis of consolidationThe consolidated financial statements incorporate the assets and liabilities of all subsidiaries of carsales.com Ltd (‘Company’ or ‘parent entity’) as at 30 June 2017 and the results of all subsidiaries for the year then ended. carsales.com Ltd and its subsidiaries together are referred to in this Financial Report as the Group or the consolidated entity.
Foreign currency translation(i) Functional and presentation currencyItems included in the financial statements of each of the Group’s entities are measured using the currency of the primary economic environment in which the entity operates (‘the functional currency’). The consolidated financial statements are presented in Australian dollars, which is carsales.com Ltd’s functional and presentation currency.
(ii) Transactions and balancesForeign currency transactions are translated into the functional currency using the exchange rates prevailing at the dates of the transactions. Foreign exchange gains and losses resulting from the settlement of such transactions and from the translation at year end exchange rates of monetary assets and liabilities denominated in foreign currencies are recognised in the consolidated statement of comprehensive income.
NOTES TO THE CONSOLIDATED FINANCIAL STATEMENTSCONTINUED
ANNUAL REPORT 2017 CARSALES.COM LIMITED74F
or p
erso
nal u
se o
nly
(iii) Group companiesThe results and financial position of foreign operations (none of which has the currency of a hyperinflationary economy) that have a functional currency different from the presentation currency are translated into the presentation currency as follows:
• assets and liabilities for each consolidated statement of financial position presented are translated at the closing rate at the date of that balance sheet;
• income and expenses for each consolidated statement of comprehensive income are translated at average exchange rates (unless this is not a reasonable approximation of the cumulative effect of the rates prevailing on the transaction dates, in which case income and expenses are translated at the dates of the transactions); and
• all resulting exchange differences are recognised as a separate component of equity.
On consolidation, exchange differences arising from the translation of any net investment in foreign entities and of borrowings are taken to other comprehensive income. When a foreign operation is sold or any borrowings forming part of the net investment are repaid, a proportionate share of such exchange differences are recognised in the consolidated statement of comprehensive income as part of the gain or loss on sale where applicable.
Foreign currency translation Goodwill and fair value adjustments arising on the acquisition of a foreign operation are treated as assets and liabilities of the foreign operation and translated at the closing rate.
Goods and Services Tax (GST)Revenues, expenses and assets are recognised net of the amount of associated GST, unless the GST incurred is not recoverable from the tax authority. In this case it is recognised as part of the cost of acquisition of the asset or as part of the expense.
Receivables and payables are stated inclusive of the amount of GST receivable or payable. The net amount of GST recoverable from, or payable to, the tax authority is included with other receivables or payables in the consolidated statement of financial position.
Cash flows are presented on a gross basis. The GST components of cash flows arising from investing or financing activities which are recoverable from, or payable to, the taxation authority are presented as operating cash flow.
Rounding of amountsThe Company is of a kind referred to in ASIC Corporations Instrument 2016/191, issued by the Australian Securities and Investments Commission, relating to the ‘rounding off’ of amounts in the Financial Report. Amounts in the Financial Report have been rounded off in accordance with that Instrument to the nearest thousand dollars, or in certain cases, the nearest dollar.
New Accounting Standards and InterpretationsThe Group has applied the following standard which have had no impact in the current reporting period commencing 1 July 2016:
• Clarification of acceptable methods of depreciation and amortisation (AASB 2014-4) (effective 1 January 2016).
ANNUAL REPORT 2017 CARSALES.COM LIMITED 75F
or p
erso
nal u
se o
nly
NOTES TO THE CONSOLIDATED FINANCIAL STATEMENTSCONTINUED
KEY PERFORMANCE1. Segment informationOperating segments are reported in a manner consistent with the internal reporting provided to the chief operating decision maker. The chief operating decision maker has been identified as the CEO.
Management has determined the operating segments based on the reports reviewed by Key Management Personnel that are used to make strategic decisions.
(a) Description of segmentsThe Group principally operates in four business segments: namely Online Advertising Services, Data, Research and Services, International and Finance and Related Services.
Online Advertising Servicescarsales Online Advertising Services can be broken into two key product sets being classified advertising and display advertising services.
Classified advertising allows customers (including dealers and consumers) to advertise automotive and non-automotive goods and services for sale across the carsales Network. Classified advertising typically allows a customer to advertise their red brand X, model Y car with 20,000km for $10,000 on a carsales website. This segment includes services such as subscriptions, lead fees and priority placement services across automotive and non-automotive websites.
Display advertising typically involves corporate customers such as automotive manufacturers/importers, finance and insurance companies etc, placing advertisements on carsales Network websites. These advertisements typically display the product or service offerings of the corporate advertiser such as a special offer on new utes by manufacturer Z, or save 10% on insurance this month only, etc, as banner advertisements or other sponsored links.
Online Advertising Services includes carsales’ investment in tyresales.com.au, which is an online tyre advertisement website that allows consumers to transact and purchase tyres.
Data, Research and ServicesThe carsales.com Ltd divisions of RedBook, LiveMarket, DataMotive and DataMotive Business Intelligence provide various solutions to a range of customers including manufacturers/importers, dealers, industry bodies, finance and insurance companies offering products including software, analysis, research and reporting, valuation services, website development and hosting as well as photography services. This segment also includes display and consumer advertising related to these divisions.
Internationalcarsales.com Ltd has operations in overseas countries through subsidiaries, equity accounted associate investments and available-for-sale financial assets as set out below:
Online Automotive Classifieds:
• Webmotors S.A.(operations in Brazil) – 30%
• SK ENCARSALES.COM Ltd (operations in South Korea) – 49.9%
• carsales Mexico SAPI de CV (operations in Mexico) – 65%
• Chileautos SpA (operations in Chile) – 83.3%
• Demotores Chile SpA (operations in Chile) – 100%
• Demotores S.A. (operations in Argentina) – 100%
• Demotores Colombia S.A.S. (operations in Colombia) – 100%
• iCar Asia Limited (operations in Indonesia, Malaysia and Thailand) – 15.6%
Automotive Data Services:
• Auto Information Limited (New Zealand) – 100%
• RedBook Automotive Services (M) Sdn Bhd (Malaysia) – 100%
• RedBook Automotive Data Services (Beijing) Limited (China) – 100%
• Automotive Data Services (Thailand) Company Limited – 100%
ANNUAL REPORT 2017 CARSALES.COM LIMITED76F
or p
erso
nal u
se o
nly
Finance and Related ServicesFinance and Related Services includes the Stratton Finance Pty Ltd subsidiary that provides innovative vehicle finance arrangements, vehicle procurement and other related services to customers. Segment revenues arise from commissions paid by finance providers and other related service providers. It also includes the equity accounted associate RateSetter Australia Pty Ltd and PromisePay Pte Ltd.
EBITDA 142,710 23,378 (93) 10,502 176,497Depreciation and amortisation (9,966)Net finance costs (6,877)Profit before income tax 159,654Income tax expense (48,261)Share of profit/(loss) from associates 9,992 (1,494) 8,498Associate fair value revaluation loss (7,145) (7,145)Gain on associate dilution 268 268Non-controlling interests (3,535)Profit for the year 109,479
EBITDA 131,783 21,357 1,332 15,838 170,310Depreciation and amortisation (7,527)Net finance costs (8,366)Gain on sale of business 931 931Profit before income tax 155,348Income tax expense (47,450)Share of profit/(loss) from associates 6,230 (1,007) 5,223Gain on associate dilution 955 955Non-controlling interests (4,827)Profit for the year 109,249
(c) Notes to, and forming part of, the segment information(i) Segment revenue and gross profitSegment revenue is derived from sales to external customers as set out in the table above. The nature of the segment revenue is as described in Note 1(a) above. Gross profit is revenue less costs of sale.
(ii) Segment EBITDAThe consolidated entity’s chief operating decision maker assesses the performance of the segments based on a measure of EBITDA. Interest revenue and expense, depreciation and amortisation are not reported to the chief operating decision maker by segment. These items are assessed at a consolidated entity level.
(iii) Segment assetsSegment assets include goodwill, trade receivables and investments accounted for using equity method. Unallocated assets include property, plant and equipment, intangibles and other assets utilised across multiple segments. All unallocated assets are assessed by the chief operating decision maker at a consolidated entity level.
(iv) LiabilitiesLiabilities are not reported to the chief operating decision maker by segment. All liabilities are assessed at a consolidated entity level.
2. Revenue
2017 $’000
2016 $’000
From continuing operationsSales revenueSale of services 338,250 314,627Sale of goods 33,864 29,383
372,114 344,010
Recognition and measurementRevenue is measured at the fair value of the consideration received or receivable. Amounts disclosed as revenue are net of returns, trade allowances and amounts collected on behalf of third parties. Where services have not been provided but the Group is obligated to provide the services in the future, revenue recognition is deferred. Where the Group has utilised the services of a sales agency to sell advertising services on behalf of the Group, the sale is recorded at a value net of sales commissions paid to the sales agency.
Revenue is recognised for the major business activities as follows:
(i) Advertising servicesRevenue is recorded when a customer’s advertisement has been displayed or when a referral has been generated leading to an enforceable claim by the Group. Subscription services are recognised across the period to which they relate.
(ii) Sale of goods – retailRevenue is recorded when goods have been provided to a customer leading to an enforceable claim by the Group.
(iii) Finance and related servicesFees and commissions are recognised on an accruals basis when the service has been provided or on completion of the underlying transaction. Used car disposal revenue and cost of goods are recognised gross (revenue being the fair value of the cash received for the sale of the vehicle, and the cost of goods being the trade in price of the vehicle).
(iv) DividendsDividends are recognised as revenue when the right to receive payment is established.
(v) R&D tax rebateThe research and development claim of the company gives rise to a tax offset and this tax offset is recognised as other income.
NOTES TO THE CONSOLIDATED FINANCIAL STATEMENTSCONTINUED
ANNUAL REPORT 2017 CARSALES.COM LIMITED78F
or p
erso
nal u
se o
nly
3. Expenses2017
$’0002016
$’000Profit before income tax includes the following specific expenses:Total employee benefits 87,978 77,058Defined contribution superannuation expense 7,376 6,034Research and development 6,044 5,130Minimum lease payments 6,275 5,534
Recognition and measurement(i) Retirement benefit obligationsAll employees of the Group are entitled to benefits on retirement, disability or death from the Group’s superannuation plan. The Group has a defined contribution plan. The defined contribution plan receives fixed contributions from Group companies and the Group’s legal or constructive obligation is limited to these contributions. The employees of the parent entity are all members of the defined contribution section of the Group’s plan.
Past service costs are recognised immediately in profit or loss, unless the changes to the superannuation fund are conditional on the employees remaining in service for a specified period of time (the vesting period). In this case, the past service costs are amortised on a straight-line basis over the vesting period.
(ii) Research and developmentResearch expenditure is recognised as an expense as incurred. Costs incurred on development projects (relating to the design and testing of new or improved services) are recognised as intangible assets when it is probable that the project will, after considering its commercial and technical feasibility, be completed and generate future economic benefits and its costs can be measured reliably. The expenditure capitalised comprises all directly attributable costs, including costs of materials, services, direct labour and an appropriate proportion of overheads. Other development expenditures that do not meet these criteria are recognised as an expense as incurred. Development costs previously recognised as an expense are not recognised as an asset in a subsequent period. Capitalised development costs are recorded as an intangible asset and amortised from the point of which the asset is ready for use on a straight-line basis over its useful life, which varies from three to five years.
(iii) LeasesLeases in which a significant portion of the risks and rewards of ownership are not transferred to the Company as lessee are classified as operating leases. Payments made under operating leases (net of any incentives received from the lessor) are charged to the profit or loss on a straight-line basis over the period of the lease.
4. Income tax(a) Income tax expense
2017 $’000
2016 $’000
Current tax 49,244 47,698Adjustments for current tax of prior periods (1,464) 218Deferred tax (903) (1,009)Adjustments for deferred tax of prior periods 1,384 543
48,261 47,450Deferred income tax expense included in income tax expense comprises:Decrease/(Increase) in deferred tax assets 808 (256)Decrease in deferred tax liabilities (327) (210)
481 (466)
ANNUAL REPORT 2017 CARSALES.COM LIMITED 79F
or p
erso
nal u
se o
nly
(b) Numerical reconciliation of income tax expense to prima facie tax payable
2017 $’000
2016 $’000
Profit from continuing operations before income tax expense 161,275 161,526Tax at the Australian tax rate of 30.0% (2016: 30%) 48,383 48,458Tax effect of amounts which are not deductible (taxable) in calculating taxable income:Non-assessable income (R&D tax offset) (300) (255)Share options 168 22Sundry items 576 317Adjustment for prior periods (80) 761Share of (profit)/losses from associates (2,549) (1,567)Non-taxable gain on associate dilution (80) (286)Non-deductible impairment 2,143 -Income tax expense 48,261 47,450
(c) Amounts recognised directly into equityAggregate current and deferred tax arising in the reporting period and not recognised in the income statement or other comprehensive income but directly (credited) or debited to equity:
2017 $’000
2016 $’000
Current tax – (credited) directly to equity (474) (489)Net deferred tax – debited/(credited) directly to equity 598 (155)
124 (644)
(d) Deferred tax assetsThe balance comprises temporary differences attributable to:
Employee benefits
$’000
Employee Share Trust
$’000
Doubtful debts$’000
Expense accruals
$’000Intangibles
$’000Tax losses
$’000Other $’000
Total $’000
At 1 July 2015 1,944 1,513 193 1,521 - - - 5,171Acquisition of subsidiary 7 - - - - - - 7(Charged)/credited to the profit or loss 194 (443) 371 235 (490) 215 174 256Credited directly to equity - 644 - - - - 644At 30 June 2016 2,145 1,714 564 1,756 (490) 215 174 6,078(Charged)/credited to the profit or loss (475) (474) (305) 97 (670) 1,166 (147) (808)Debited directly to equity - (124) - - - - - (124)Exchange differences - - - - - (2) - (2)At 30 June 2017 1,670 1,116 259 1,853 (1,160) 1,379 27 5,144
2017 $’000
2016 $’000
Deferred tax assets to be recovered within 12 months 3,338 4,184Deferred tax assets to be recovered after more than 12 months 1,806 1,894
5,144 6,078
Certain liability balances are shown as part of deferred tax assets, as they originate in the same jurisdiction as, and can be offset against, other deferred tax assets. The liability balance for intangibles shown as part of deferred tax assets relates to in house software in Australia.
NOTES TO THE CONSOLIDATED FINANCIAL STATEMENTSCONTINUED
ANNUAL REPORT 2017 CARSALES.COM LIMITED80F
or p
erso
nal u
se o
nly
(e) Deferred tax liabilitiesThe balance comprises temporary differences attributable to:
Intangibles $’000
Total $’000
At 1 July 2015 - -(Credited) to the profit or loss (210) (210)Intangibles recognised from business acquisition 1,939 1,939At 30 June 2016 1,729 1,729
At 1 July 2016 1,729 1,729(Credited) to the profit or loss (327) (327)Intangibles recognised from business acquisition 1,521 1,521At 30 June 2017 2,923 2,923
2017 $’000
2016 $’000
Deferred tax liabilities expected to be settled within 12 months 342 210Deferred tax liabilities expected to be settled after more than 12 months 2,581 1,519
2,923 1,729
Recognition and measurementThe income tax expense or revenue for the period is the tax payable on the current period’s taxable income based on the applicable income tax rate for each jurisdiction adjusted by changes in deferred tax assets and liabilities attributable to temporary differences and to unused tax losses.
The current income tax charge is calculated on the basis of the tax laws enacted or substantively enacted at the end of the reporting period in the countries where the company’s subsidiaries and associates operate and generate taxable income. Management periodically evaluates positions taken in tax returns with respect to situations in which applicable tax regulation is subject to interpretation. It establishes provisions where appropriate on the basis of amounts expected to be paid to tax authorities.
Deferred income tax is provided in full, using the liability method, on temporary differences arising between the tax bases of assets and liabilities and their carrying amounts in the consolidated financial statements. However, the deferred income tax is not accounted for if it arises from initial recognition of an asset or liability in a transaction other than a business combination that at the time of the transaction affects neither accounting nor taxable profit or nor loss. Deferred income tax is determined using tax rates (and laws) that have been enacted or substantially enacted by the balance sheet date and are expected to apply when the related deferred income tax asset is realised or the deferred income tax liability is settled.
Deferred tax assets are recognised for deductible temporary differences and unused tax losses only if it is probable that future taxable amounts will be available to utilise those temporary differences and losses.
Deferred tax liabilities and assets are not recognised for temporary differences between the carrying amount and tax bases of investments in controlled entities where the Company is able to control the timing of the reversal of the temporary differences and it is probable that the differences will not reverse in the foreseeable future.
Deferred tax assets and liabilities are offset when there is a legally enforceable right to offset current tax assets and liabilities and when the deferred tax balances relate to the same taxation authority. Current tax assets and tax liabilities are offset where the entity has a legally enforceable right to offset and intends either to settle on a net basis, or to realise the asset and settle the liability simultaneously.
Where there are current and deferred tax balances attributable to amounts recognised directly in equity, there are also recognised directly in equity.
Tax consolidation legislationThe Company and its wholly-owned Australian entities have implemented the tax consolidation legislation.
The head entity, carsales.com Ltd, and the controlled entities in the tax consolidated group account for their own current and deferred tax amounts. These tax amounts are measured as if each entity in the tax consolidated group continues to be a standalone taxpayer in its own right.
In addition to its own current and deferred tax amounts, carsales.com Ltd also recognises the current tax liabilities (or assets) and the deferred tax assets arising from unused tax losses and unused tax credits assumed from controlled entities in the tax consolidated group. Assets or liabilities arising under tax funding agreements with the tax consolidated entities are recognised as amounts receivable from or payable to other entities in the Group.
ANNUAL REPORT 2017 CARSALES.COM LIMITED 81F
or p
erso
nal u
se o
nly
Accounting estimates and assumptions used for income taxUncertain tax positionsThe Group applies its current understanding of the tax law to estimate tax liabilities where the ultimate tax position is uncertain. When the tax position is ultimately determined or tax laws change, the actual tax liability may differ from this current estimate.
Research and development claimThe research and development claim available to the Company is estimated in the accounts because a full assessment of the position cannot be made by the year end. It is the policy of the Company to only bring to account that preliminary portion of expenses that is reasonably expected to be claimable at period end.
5. Reconciliation of profit after income tax to net cash inflow from operating activities2017
$’0002016
$’000Profit for the year 113,014 114,076Depreciation and amortisation 9,966 7,527Non-cash employee benefits expense – share-based payments (255) 2,214Loss on disposal of assets 90 -Net finance related costs 7,137 8,893Share of (profit) of associates (8,498) (5,223)Loss/(gain) on associate fair value adjustment and investment dilution 6,877 (955)Net exchange differences (84) (96)Change in operating assets and liabilities:
(Increase) in trade debtors (1,660) (4,955)Decrease in inventories 279 758Decrease/(Increase) in deferred tax assets 934 (900)(Increase) in other operating assets (2,944) (2,612)Capitalised labour (9,218) (8,264)Increase in trade creditors 1,541 1,544Increase in other operating liabilities 3,415 2,108Increase in provision for income taxes payable 3,349 4,686Increase in deferred tax liabilities 822 -Increase in other provisions 11 745
Net cash inflow from operating activities 124,776 119,546
6. Earnings per share(a) Reported earnings per share
Basic earnings per share Diluted earnings per share2017 2016 2017 2016
Reported profit attributable to equity holders of the Company 109,479,000 109,249,000 109,479,000 109,249,000Weighted average number of ordinary shares 241,383,158 240,645,736 241,383,158 240,645,736Dilutive impact of potential ordinary shares* - - 491,188 742,315Total weighted average number of ordinary shares used in EPS calculation 241,383,158 240,645,736 241,874,346 241,388,051Reported earnings per share 45.4 45.4 45.3 45.3 *The dilutive impact of potential ordinary shares represents unexercised options and performance rights as at the balance date 30 June 2017 (2016: 30 June 2016).
(b) Adjusted earnings per shareBasic earnings per share Diluted earnings per share
2017 2016 2017 2016Reported profit attributable to equity holders of the Company 109,479,000 109,249,000 109,479,000 109,249,000Less: gain on associate dilution (268,000) (955,000) (268,000) (955,000)Less: gain on sale of business - (931,000) - (931,000)Less: associate one-off tax gain (804,000) - (804,000) -Add: associate fair value revaluation loss 7,145,000 - 7,145,000 -Add: acquired intangibles amortisation 3,578,000 3,180,000 3,578,000 3,180,000Adjusted profit attributable to equity holders of the Company 119,130,000 110,543,000 119,130,000 110,543,000
Adjusted earnings per share* 49.4 45.9 49.3 45.8 * The Directors believe the presentation of ‘adjusted earnings per share’ provides the best measure to assess the performance of the Group by excluding gain
on associate dilution, one-off gain on sale of business, associate one-off tax gain, associate fair value revaluation loss, and non-cash acquired intangible asset amortisation from the reported IFRS measure.
NOTES TO THE CONSOLIDATED FINANCIAL STATEMENTSCONTINUED
ANNUAL REPORT 2017 CARSALES.COM LIMITED82F
or p
erso
nal u
se o
nly
Recognition and measurementBasic earnings per share is calculated by dividing:
• the profit attributable to equity holders of the Company, excluding any costs of servicing equity other than ordinary shares;
• by the weighted average number of ordinary shares outstanding during the financial year, adjusted for bonus elements in ordinary shares issued during the year.
Diluted earnings per share adjusts the figures used in the determination of basic earnings per share to take into account:
• the after income tax effect of interest and other financing costs associated with dilutive potential ordinary shares; and
• the weighted average number of additional ordinary shares that would have been outstanding assuming the conversion of all dilutive potential ordinary shares.
Options and performance rights granted to employees under the carsales.com Ltd Employee Option Plan are considered to be potential ordinary shares and have been included in the determination of diluted earnings per share to the extent to which they are dilutive. The options and performance rights have not been included in the determination of basic earnings per share. Details relating to the options are set out in Note 24.
CAPITAL AND FINANCIAL RISK MANAGEMENT7. Capital risk managementThe Company’s capital position at 30 June is as follows:
The Company’s objectives when managing capital are to safeguard its ability to continue as a going concern, so that it can continue to provide returns for shareholders and benefits for other stakeholders and to maintain an optimal capital structure to reduce the cost of capital.
In order to maintain or adjust the capital structure, the Group may adjust the amount of dividends paid to shareholders, return capital to shareholders, issue new shares or sell assets to reduce debt.
Consistent with others in the industry, the Group monitors its capital on an ongoing basis. There are no externally imposed capital requirements.
Investments and other financial assetsThe Group classifies its investments in the following categories: financial assets at fair value, loans and receivables, and held-to-maturity investments. The classification depends on the purpose for which the investments were acquired. Management determines the classification of its investments at initial recognition and re-evaluates this designation at each reporting date.
Loans and receivables are non-derivative financial assets with fixed or determinable payments that are not quoted in an active market. They are included in current assets, except for those with maturities greater than 12 months after the reporting date, which are classified as non-current assets. Loans and receivables are included in trade and other receivables (Note 14) in the consolidated statement of financial position.
ANNUAL REPORT 2017 CARSALES.COM LIMITED 83F
or p
erso
nal u
se o
nly
8. Cash and cash equivalents2017
$’0002016
$’000Cash on hand 2 7Bank balances 39,793 28,702
39,795 28,709
Recognition and measurementFor cash flow statement presentation purposes, cash and cash equivalents includes cash on hand, deposits held at call with financial institutions, other short term, highly liquid investments with original maturities of three months or less that are readily convertible to known amounts of cash and that are subject to an insignificant risk of changes in value and bank overdrafts. Bank overdrafts are shown within borrowings in current liabilities on the consolidated statement of financial position.
Risk exposureThe Company’s exposure to interest rate risk is discussed in Note 9. The maximum exposure to credit risk at the reporting date is the carrying amount of each class of cash and cash equivalents mentioned above.
In December 2016, carsales.com Ltd entered into a $265 million syndicated revolving loan facility agreement (‘the agreement’). The loan facility consists of two commitments of $175 million and $90 million which become due in August 2019 and February 2020 respectively. The loan is provided by a syndicate comprising National Australia Bank, Australia and New Zealand Bank and HSBC. Borrowings under the loan facility bear interest at a floating rate of BBSY Bid plus a margin, with margin determined by reference to the leverage ratio of the Gearing Group. In addition to two commitments, the loan facility also has an accordion feature which enables further commitments of up to $135 million to be added under the agreement.
In March 2015, Stratton Finance Pty Ltd entered into a $10 million loan with the principal repayable in equal monthly instalments over a period of 5 years. The loan was provided by the National Australia Bank and is described as a NAB Business Markets Flexible Rate Loan. The interest rate is the weighted average of the interest rates applicable to each of the Business Markets Facility Components (being the Fixed Amount, the Flexible Maturity Fixed Amount, the Cap Amount, the Range Amount and/or the Floating Amount) for that 30 day pricing period. As at 30 June 2017, a principal of $5,545,000 was outstanding.
2017 $’000
2016 $’000
Finance income 640 537Finance costs (7,517) (8,903)
(6,877) (8,366)
Finance incomeFinance income is recognised on a time proportionate basis using the effective interest method. When a receivable is impaired, the Group reduces the carrying amounts to its recoverable amount, being the estimated future cash flow discounted at the original effective interest rate of the instrument, and continues unwinding the discount as finance income. Finance income on impaired loans is recognised using the original effective interest rate.
NOTES TO THE CONSOLIDATED FINANCIAL STATEMENTSCONTINUED
ANNUAL REPORT 2017 CARSALES.COM LIMITED84F
or p
erso
nal u
se o
nly
Recognition and measurementBorrowings are initially recognised at fair value, net of transaction costs incurred. Borrowings are subsequently measured at amortised cost. Any difference between the proceeds (net of transaction costs) and the redemption amount is recognised in the profit or loss over the period of the borrowings using the effective interest method. Fees paid on the establishment of loan facilities are recognised net against the loan and amortised on a straight-line basis over the term of the facility.
Borrowings are derecognised from the consolidated statement of financial position when the obligation specified in the contract is discharged, cancelled or expired. The difference between the carrying amount of a financial liability that has been extinguished or transferred to another party and the consideration paid, including any non-cash assets transferred or liabilities assumed, is recognised in other income or other expenses.
Borrowings are classified as current liabilities unless the Group has an unconditional right to defer settlement of the liability for at least 12 months after the balance sheet date.
Borrowing costs incurred for the construction of any qualifying asset are capitalised during the period of time that is required to complete and prepare the asset for its intended use or sale. Other borrowing costs are expensed.
Interest rate riskThe Group’s main interest rate risk arises from long term borrowings. The Group’s fixed rate borrowings and receivables are carried at amortised cost. They are therefore not subject to interest rate risk as defined in AASB 7 since neither the carrying amount nor the future cash flows will fluctuate because of a change in market rates.
The consolidated entity’s exposure to the cash flow risk of changes in market interest rates relates primarily to the cash at bank and the cash advance facility. Cash and cash equivalents draw interest at variable interest rates, while the interest on the overdraft facility was 8.8% (2016: 8.9%). As at reporting date, the Group had $193,045,000 (2016: $227,197,000) variable rate borrowings at a weighted average interest rate of 3.0% (2016: 3.3%). carsales.com Ltd has a Board-approved treasury policy and treasury strategy for the management of interest rate risk. The Company does not currently hedge against interest rate risk. The Board keeps the decision to actively hedge interest rate risk under regular review and this will be reassessed during the 2018 financial year. Any derivative contracts will be entered into solely for interest rate risk management and no speculative hedging is permitted under the policy.
Liquidity riskPrudent liquidity risk management implies maintaining sufficient cash and marketable securities, the availability of funding through an adequate amount of committed credit facilities and the ability to close out market positions. The Group manages liquidity risk by continuously monitoring forecast and actual cash flows and matching the maturity profiles of financial assets and liabilities.
Financing arrangementsThe Group had access to the following undrawn borrowing facilities at the end of the reporting period:
Floating rate2017
$’0002016
$’000Expiring within one year 3,400 63,000Expiring beyond one year 77,500 45,000
80,900 108,000
Maturities of financial liabilitiesThe following table sets out the Group’s exposure to liquidity risk. The amounts disclosed in the table are the contractual undiscounted cash flows.
Net fair value of financial assets and liabilitiesThe net fair value of cash and cash equivalents and non-interest bearing monetary financial assets and non-interest bearing financial liabilities of the consolidated entity approximates their carrying amounts. There are no off-balance sheet financial instruments in place.
Summarised sensitivity analysisThe following table summarises the sensitivity of the Group’s financial assets and financial liabilities to interest rate risk.
NOTES TO THE CONSOLIDATED FINANCIAL STATEMENTSCONTINUED
ANNUAL REPORT 2017 CARSALES.COM LIMITED86F
or p
erso
nal u
se o
nly
Recognition and measurementOrdinary shares are classified as equity.
Ordinary shares entitle the holder to participate in dividends and the proceeds on winding up of the Company in proportion to the number of, and amounts paid on, the shares held.
On a show of hands every holder of ordinary shares present at a meeting in person or by proxy is entitled to one vote, and upon a poll each share is entitled to one vote.
Ordinary shares have no par value and the Company does not have a limited amount of authorised capital.
Incremental costs directly attributable to the issue of new shares, options or performance rights are shown in equity as a deduction, net of tax, from the proceeds. Incremental costs directly attributable to the issue of new shares or options or performance rights for the acquisition of a business are not included in the cost of the acquisition as part of the purchase consideration.
(b) Movements in ordinary share capital
Date DetailsNumber of
shares Issue price $’0001 July 2015 Opening balance 240,081,596 91,905August 2015 Exercise of employee options 61,237 $4.69–$5.93 333August 2015 Exercise of employee performance rights 123,739 - -September 2015 Exercise of employee options 40,433 $4.69–$5.93 211October 2015 Exercise of employee options 55,172 $4.69–$4.90 269October 2015 Exercise of employee performance rights 50,146 - -October 2015 Dividend Reinvestment Plan 300,352 $9.65 2,898November 2015 Exercise of employee options 11,301 $5.93 67December 2015 Exercise of employee options 107,443 $5.93 637February 2016 Exercise of employee options 12,860 $4.69–$5.93 73March 2016 Exercise of employee options 47,257 $5.93 280April 2016 Exercise of employee options 13,923 $4.69–$5.93 73April 2016 Dividend Reinvestment Plan 174,860 $11.72 2,050May 2016 Exercise of employee options 16,125 $5.93 96June 2016 Exercise of employee options 26,854 $4.69–$5.93 13430 June 2016 241,123,298 99,026
Date DetailsNumber of
shares Issue price $’0001 July 2016 Opening balance 241,123,298 99,026September 2016 Exercise of employee options 47,557 $4.69–$5.93 237October 2016 Exercise of employee performance rights 30,200 $0.00 -October 2016 Dividend Reinvestment Plan 206,250 $11.92 2,459November 2016 Exercise of employee options 6,071 $9.10 55February 2017 Exercise of employee options 11,279 $5.93–$9.10 84March 2017 Exercise of employee options 2,625 $5.93–$9.10 21April 2017 Dividend Reinvestment Plan 349,178 $11.20 3,909May 2017 Exercise of employee options 4,862 $5.93–$9.10 41June 2017 Exercise of employee options 3,972 $5.93–$9.10 2930 June 2017 241,785,292 105,861
Information relating to the carsales.com Ltd Employee Option Plan, including details of options and performance rights issued, exercised and lapsed during the financial year and options and performance rights outstanding at the end of the financial year, is set out in Note 24.
ANNUAL REPORT 2017 CARSALES.COM LIMITED 87F
or p
erso
nal u
se o
nly
11. Reserves and retained earnings(a) Reserves
2017 $’000
2016 $’000
Share-based payment reserve 22,778 23,157Foreign currency translation reserve (8,473) 38Share of remeasurement of net defined benefit liability of associates (185) (333)Available-for-sale asset revaluation reserve 29 -
14,149 22,862
(i) Share-based payment reserve
Balance 1 July 23,157 20,299Option expense (255) 2,214Tax on Employee Share Trust charged to equity (124) 644Balance 30 June 22,778 23,157
The share-based payments reserve is used to recognise the fair value of options and performance rights issued but not exercised.
(ii) Foreign currency translation reserve
Balance 1 July 38 1,172Currency translation differences arising during the year (8,511) (1,134)Balance 30 June (8,473) 38
Exchange differences arising on translation of the foreign operations are taken to the foreign currency translation reserve, as described in ‘Basis of preparation’ and accumulated within a separate reserve within equity. The reserve is recognised in profit and loss when the net investment is disposed of.
(iii) Share of remeasurement of net defined benefit liability of associates
Balance 1 July (333) -Share of remeasurement of net defined benefit liability of associates 148 (333)Balance 30 June (185) (333)
(iv) Available-for-sale asset revaluation reserve
Balance 1 July - -Changes in the fair value of available-for-sale financial assets 29 -Balance 30 June 29 -
(b) Retained earningsMovements in retained earnings were as follows:
Balance 1 July 134,302 113,829Net profit for the year 109,479 109,249Dividends (92,174) (88,776)Balance 30 June 151,607 134,302
NOTES TO THE CONSOLIDATED FINANCIAL STATEMENTSCONTINUED
ANNUAL REPORT 2017 CARSALES.COM LIMITED88F
or p
erso
nal u
se o
nly
12. DividendsProvision is made for the amount of any dividend declared, being appropriately authorised and no longer at the discretion of the entity, on or before the end of the financial year but not distributed at balance date.
(a) Ordinary shares2017
$’0002016
$’000Final fully franked cash dividend for the year ended 30 June 2016 of 19.5 cents (2015: 17.7 cents per fully paid ordinary share plus a special dividend of 1.4 cents) per fully paid ordinary share paid on 17 October 2016. 44,569 43,000Final fully franked ordinary dividend for the year ended 30 June 2016 of 19.5 cents (2015: 17.7 cents plus a special dividend of 1.4 cents) – satisfied through the issuance of shares under the Dividend Reinvestment Plan. 2,459 2,898
47,028 45,898Interim fully franked cash dividend for the year ended 30 June 2017 of 18.7 cents (2016: 17.8 cents) per fully paid share paid on 20 April 2017 (2016: 15 April 2016). 41,237 40,828Interim fully franked ordinary dividend for the year ended 30 June 2017 of 18.7 cents (2016: 17.8 cents) per share – satisfied through issuance of shares under the Dividend Reinvestment Plan. 3,909 2,050
45,146 42,878Total dividends paid 92,174 88,776 (b) Dividends not recognised at year end
2017 $’000
2016 $’000
In addition to the above dividends, since year end, the Directors have recommended the payment of a final dividend of 21.5 cents per fully paid ordinary share (2016: final dividend 19.5 cents). The aggregate amount of the declared dividend expected to be paid on 19 October 2017 out of retained earnings at 30 June 2017, but not recognised as a liability at year end, is 51,984 47,019 (c) Franked dividends
2017 $’000
2016 $’000
Franking credits available for subsequent financial years based on a tax rate of 30.0% (2016: 30.0%) 45,860 42,176
The above amounts represent the balance of the franking account as at the end of the reporting period, adjusted for:
(a) franking credits that will arise from the payment of the amount of the provision for income tax;
(b) franking debits that will arise from the payment of dividends recognised as a liability at the reporting date; and
(c) franking credits that will arise from the receipt of dividends recognised as receivables at the reporting date.
The consolidated amounts include franking credits that would be available to the parent entity if distributable profits of subsidiaries were paid as dividends.
(d) Dividend Reinvestment Plan (DRP)The carsales.com Ltd DRP will be maintained for the 2017 final dividend, offering shareholders the opportunity to acquire further ordinary shares in carsales. The DRP will not be offered at a discount and the price will be calculated using the daily volume weighted average sale price of carsales.com Ltd shares sold in the ordinary course of trading on the ASX during the five days after, but not including, the Record Date (22 September 2017). The last date for shareholders to nominate their participation in the DRP is 5:00pm (AEST) on 25 September 2017. Shares issued under the DRP will rank equally with carsales.com Ltd existing fully paid ordinary shares. Shareholders eligible to participate in the DRP are currently limited to those whose registered address on the carsales.com Ltd share registry is in Australia or New Zealand.
Eligible shareholders who wish to participate in the DRP can make their elections online at www.computershare.com.au/easyupdate/CAR or complete the DRP form, which will be sent to shareholders for completion and submission to Computershare Investor Services Pty Ltd (carsales share registry). Further information can be obtained from Computershare on 1300 850 505.
ANNUAL REPORT 2017 CARSALES.COM LIMITED 89F
or p
erso
nal u
se o
nly
13. Financial risk managementThe Group’s activities expose it to a variety of financial risks: credit risk, interest rate risk and liquidity and foreign exchange risk.
The Group’s overall risk management program focuses on the unpredictability of financial markets and seeks to minimise potential adverse effects on the financial performance of the Group. The Group uses different methods to measure different types of risk to which it is exposed.
Risk management is the responsibility of the Chief Financial Officer (CFO) and follows approved policies of the Board of Directors. The CFO identifies, evaluates and hedges financial risks in close cooperation with the Group’s operating units.
(a) Market risk(i) Foreign exchange riskThe Group operates internationally and is exposed to foreign exchange risk arising from various currency exposures, primarily with respect to the Brazilian Real (BRL), the Korean Won (KRW), the Mexican Peso (MXP), the Chilean Peso (CLP) and Argentine Peso (ARS).
Foreign exchange risk arises from future commercial transactions and recognised assets and liabilities denominated in foreign currency that is not the entity’s functional currency.
Hedging contracts are sometimes used to manage foreign currency exchange risk. The Company has a treasury strategy and a treasury policy and will actively hedge any major known commitments using forward exchange contracts. The Company does net investment hedge quasi-equity intercompany loans used to fund investments in subsidiaries, but does not net investment hedge the carrying value of associates in the balance sheet. Trading and dividend cash flows between associates and the Group are not hedged unless the cash flows are significant and the amount and future payment date are certain. No foreign currency derivatives were entered into in the year.
The analysis below reflects management’s view of possible movements in relevant foreign currencies against the Australian dollar. The table summarises the range of possible outcomes that would affect the Group’s net profit and equity as a result of foreign currency movements.
The estimated impact on carsales.com Ltd’s share of the reported net profits of our significant overseas associates and subsidiaries through potential movements in exchange rates are as follows:
Impact on profit: 2017 $’000
-5%
2016$’000
-5%
2017 $’000
5%
2016 $’000
5%AUD to KRW (+5% to -5%) 390.7 252.3 (390.7) (252.3)AUD to BRL (+5% to -5%) 144.2 160.8 (144.2) (160.8)AUD to MXP (+5% to -5%) (81.3) (22.2) 81.3 22.2AUD to CLP (+5% to -5%) 34.8 13.7 (34.8) (13.7)AUD to ARS (+5% to -5%) (29.5) - 29.5 -Net Movement 458.9 404.6 (458.9) (404.6)
Impact on equity: 2017 $’000
-5%
2016$’000
-5%
2017 $’000
5%
2016 $’000
5%AUD to KRW (+5% to -5%) 6,893 6,911 (6,893) (6,911)AUD to BRL (+5% to -5%) 3,032 3,971 (3,032) (3,971)AUD to MXP (+5% to -5%) 284 464 (284) (464)AUD to CLP (+5% to -5%) 1,037 936 (1,037) (936)AUD to ARS (+5% to -5%) 209 - (209) -Net Movement 11,455 12,282 (11,455) (12,282)
(ii) Price riskThe group’s exposure to equity securities price risk arises from the 15.6% investment in iCar Asia Limited held by the group and classified in the balance sheet as an available-for-sale financial asset (see Note 19(d)). Changes in the fair value are recognised directly in other comprehensive income.
Other than the investment in iCar Asia Limited, the Group is not exposed to significant price equities risk.
NOTES TO THE CONSOLIDATED FINANCIAL STATEMENTSCONTINUED
ANNUAL REPORT 2017 CARSALES.COM LIMITED90F
or p
erso
nal u
se o
nly
(b) Credit riskCredit risk of the Group arises predominantly from outstanding receivables from customers.
The Group’s credit risk on its receivables is recognised on the consolidated statement of financial position at the carrying amount of those receivable assets, net of any provisions for doubtful debts. There are no significant concentrations of receivables within the Group. Receivable balances are monitored on an ongoing basis with the result that the Group’s exposure to bad debts is not considered to be material.
Details of impaired and past due receivables are disclosed in Note 14.
Credit risk also arises from cash and cash equivalents and deposits with banks and financial institutions. For banks and financial institutions, only independently rated parties with a minimum rating of ‘A’ are accepted by carsales.com Ltd.
(c) Interest rate riskInterest rate risk is set out in Note 9.
(d) Liquidity riskLiquidity risk is set out in Note 9.
(e) Fair value estimationThere are no financial assets or liabilities that are measured at fair value at 30 June 2017 other than the available-for-sale investment in iCar Asia Limited which is listed on the ASX and therefore has a readily determinable fair value.
OTHER ASSETS AND LIABILITIES14. Trade and other receivables
Accrued income 3,312 1,948Other receivables 2,033 2,657Prepayments 3,165 3,158Trade and other receivables 48,404 44,722
Recognition and measurementTrade receivables are recognised initially at fair value and subsequently measured at amortised cost, less provision for impairment. Trade receivables are due for settlement generally within 30 days following the provision of advertising, data services or finance services.
Collectability of trade receivables is reviewed on an ongoing basis. Debts that are known to be uncollectable are written off by reducing the carrying amount directly. An allowance account (provision for impairment of trade receivables) is used when there is objective evidence that the Group will not be able to collect all amounts due according to the original terms of the receivables. Significant financial difficulties of the debtor, probability that the debtor will enter bankruptcy or financial reorganisation, and default or delinquency in payments (more than 30 days overdue) are considered indicators that the trade receivable is impaired. The amount of the impairment allowance is the difference between the asset’s carrying amount and the present value of estimated future cash flows, discounted at the original effective interest rate. Cash flows relating to short term receivables are not discounted if the effect of discounting is immaterial.
The amount of the impairment loss is recognised in the consolidated statement of comprehensive income within the ‘operations and administration’ expense. When a trade receivable for which an impairment allowance had been recognised becomes uncollectable in a subsequent period, it is written off against the allowance account. Subsequent recoveries of amounts previously written off are credited against other expenses in the consolidated statement of comprehensive income.
(a) Impaired trade receivablesThe individually impaired receivables mainly relate to customers that are in unexpectedly difficult economic situations. The creation and release of the provision for impaired receivables has been included in ‘operations and administration’ expenses in the consolidated statement of comprehensive income. Amounts charged to the provision account are generally written off when there is no expectation of recovering additional cash.
ANNUAL REPORT 2017 CARSALES.COM LIMITED 91F
or p
erso
nal u
se o
nly
(b) Accrued incomeServices provided in the current reporting period are recognised on accrual basis. Settlement is generally within 30 days.
(c) Other receivablesThese amounts generally arise from transactions outside the usual operating activities of the Group. Interest is not charged and collateral is not normally obtained.
The other classes within trade and other receivables do not contain impaired assets and are not past due. Based on the credit history of these other classes, it is expected that these amounts will be received when due.
(d) Fair value and credit riskDue to the short term nature of these receivables, their carrying amount is assumed to approximate their fair value.
The maximum exposure to credit risk at the reporting date is the carrying amount of each class of receivables mentioned above.
15. Property, plant and equipment
Plant and equipment
$’000
Motor vehicles
$’000
Leasehold impro-
vements$’000
Total$’000
At 30 June 2017Cost 8,076 705 8,763 17,544Accumulated depreciation (6,126) (213) (3,916) (10,255)Net book amount 1,950 492 4,847 7,289
At 30 June 2016Cost 6,704 363 8,032 15,099Accumulated depreciation (4,949) (154) (3,388) (8,491)Net book amount 1,755 209 4,644 6,608
Recognition and measurementProperty, plant and equipment is stated at historical cost less depreciation. Historical cost includes expenditure that is directly attributable to the acquisition of the items.
Subsequent costs are included in the asset’s carrying amount or recognised as a separate asset, as appropriate, only when it is probable that future economic benefits associated with the item will flow to the Group and the cost of the item can be measured reliably. All other repairs and maintenance are charged to the profit or loss during the financial period in which they are incurred.
Depreciation on assets is calculated using the straight-line method to allocate their cost, net of their residual values, over their estimated useful lives, as follows:
• Vehicles 3 – 5 years
• Furniture, fittings and equipment 3 – 10 years
• Computer hardware and peripherals 3 – 5 years
• Leased plant and equipment 10 – 15 years or minimum lease period if shorter
• Leasehold improvements 3 – 10 years or minimum lease period if shorter
The assets’ residual values and useful lives are reviewed, and adjusted if appropriate, at each reporting date.
An asset’s carrying amount is written down immediately to its recoverable amount if the asset’s carrying amount is greater than its estimated recoverable amount.
Gains and losses on disposals are determined by comparing proceeds with carrying amount. These are included in the consolidated statement of comprehensive income.
NOTES TO THE CONSOLIDATED FINANCIAL STATEMENTSCONTINUED
ANNUAL REPORT 2017 CARSALES.COM LIMITED92F
or p
erso
nal u
se o
nly
Leases of property, plant and equipment where the Group has substantially all the risks and rewards of ownership are classified as finance leases. Finance leases are capitalised at the lease’s inception at the fair value of the leased property or, if lower, the present value of the minimum lease payments. The corresponding rental obligations, net of finance charges, are included in other short term and long term payables. Each lease payment is allocated between the liability and finance cost. The finance cost is charged to the profit or loss over the lease period so as to produce a constant periodic rate of interest on the remaining balance of the liability for each period. The property, plant and equipment acquired under finance leases is depreciated over the asset’s useful life or over the shorter of the asset’s useful life and the lease term if there is no reasonable certainty that the Group will obtain ownership at the end of the lease term.
16. Intangible assets
ComputerBrands and
customerOther
intangible Goodwill software relationships assets(i) Total
$’000 $’000 $’000 $’000 $’000As at 1 July 2015Cost 146,843 17,704 - 4,453 169,000Accumulated amortisation and impairment - (9,499) - (3,553) (13,052)Net book amount 146,843 8,205 - 900 155,948
Year ended 30 June 2016Opening net book amount 146,843 8,205 - 900 155,948Acquisition of subsidiaries 26,543 - 3,245 - 29,788Additions - 8,942 - 135 9,077Disposals - (186) - - (186)Amortisation charge - (4,106) (868) (463) (5,437)Reclassifications to brand intangibles(ii) (4,524) - 6,463 - 1,939Exchange differences 895 - (455) - 440Closing net book amount 169,757 12,855 8,385 572 191,569
At 30 June 2016Cost 169,757 26,438 9,253 4,588 210,036Accumulated amortisation and impairment - (13,583) (868) (4,016) (18,467)Net book amount 169,757 12,855 8,385 572 191,569
Year ended 30 June 2017Opening net book amount 169,757 12,855 8,385 572 191,569Acquisition of subsidiaries 4,686 707 1,140 - 6,533Additions - 9,908 - 71 9,979Disposals - - - - -Amortisation charge - (6,104) (1,099) (546) (7,749)Reclassifications to brand intangibles(ii) (3,329) - 4,469 - 1,140Exchange differences (1,433) (47) (25) (13) (1,518)
Closing net book amount 169,681 17,319 12,870 84 199,954
At 30 June 2017Cost 169,681 37,899 14,838 4,647 227,065Accumulated amortisation and impairment - (20,580) (1,968) (4,563) (27,111)Net book amount 169,681 17,319 12,870 84 199,954 (i) Other intangible assets include database, domain names and other.(ii) Reclassifications reflect the fair value adjustment of the brand and customer relationships intangibles acquired as part of business combinations. The reclassification
from goodwill includes the net deferred tax effect of the brand intangibles being reclassified.
ANNUAL REPORT 2017 CARSALES.COM LIMITED 93F
or p
erso
nal u
se o
nly
Recognition and measurement(i) GoodwillGoodwill represents the excess of the cost of an acquisition over the fair value of the Group’s share of the net identifiable assets of the acquired subsidiary at the date of acquisition. Goodwill on acquisitions of subsidiaries is included in intangible assets. Goodwill is not amortised. Instead, goodwill is tested for impairment annually, or more frequently if events or changes in circumstances indicate that it might be impaired, and is carried at cost less accumulated impairment losses. Gains and losses on the disposal of an entity include the carrying amount of goodwill relating to the entity sold.
Goodwill is allocated to cash-generating units for the purpose of impairment testing. (ii) Computer softwareSoftware includes capitalised development costs being an internally generated intangible asset.
Costs incurred in developing products or systems and costs incurred in acquiring software and licences that will contribute to future period financial benefits through revenue generation and/or cost reduction are capitalised to software and systems.
(iii) Brands and customer relationshipsAcquired brands represent the value of brands in acquired subsidiaries and businesses that are separately fair valued at the date of acquisition from the remaining goodwill. Acquired brands are written off over a 10-year period.
Acquired customer relationships have a finite useful life and are carried at fair value at acquisition date less accumulated depreciation and impairment losses. Amortisation is calculated using the straight-line method to allocate the cost of the asset over its estimated useful life, which is between seven to 10 years.
(iv) Other intangible assetsRedBook database costs capitalised to date include direct payroll and payroll-related costs of employees’ time spent on developing the database. These intangible assets have finite lives and are subject to amortisation on a straight-line basis. The useful lives for these assets are as follows:
• Software 4 – 5 years
• Domain names 5 – 10 years
• Database 10 years
• Brand intangibles 10 years
• Customer relationships 7 – 10 years
(a) Cash generating unitsGoodwill is allocated to the Group’s cash-generating units (CGUs) and tested annually to determine whether they have suffered any impairment. For the purposes of assessing impairment, assets are grouped at the lowest levels for which there are separately identifiable cash inflows which are largely independent of the cash inflows from other assets or groups of assets (cash-generating units).
A segment-level summary of the goodwill allocation is presented below.
2017Total
$’000
Online Advertising Services 72,076
Data, Research and Services 14,541
Finance and Related Services 58,698
145,315
Mexico 4,112
Chile 17,324
Argentina 2,930
International 24,366
169,681
NOTES TO THE CONSOLIDATED FINANCIAL STATEMENTSCONTINUED
ANNUAL REPORT 2017 CARSALES.COM LIMITED94F
or p
erso
nal u
se o
nly
2016Total
$’000
Online Advertising Services 72,076
Data, Research and Services 14,541
Finance and Related Services 58,415
145,032
Mexico 4,778
Chile 19,947
International 24,725
169,757
(b) Impairment testing and key assumptions Goodwill and intangible assets that have an indefinite useful life are not subject to amortisation and are tested annually for impairment, or more frequently if events or changes in circumstances indicate that they might be impaired. Other assets are tested for impairment whenever events or changes in circumstances indicate that the carrying amount may not be recoverable, which includes carsales’ equity held associate investments. An impairment loss is recognised for the amount by which the asset’s carrying amount exceeds its recoverable amount. The recoverable amount is the higher of an asset’s fair value less costs to sell and value in use.
Key assumptionsBoth value in use and fair value less cost to sell valuation methods have been employed in determining the recoverable amounts of CGUs. Both methods are predicated on cash flow projections which necessitates the adoption of assumptions and estimates. The key assumptions and estimates used in management’s calculations primarily relate to:
• five or ten year cash flow forecasts sourced from internal budgets and long term forecasts;
• terminal value growth rates applied to the period beyond the five to ten year cash flow forecasts; and
• pre-tax discount rates, used to discount the cash flows to present value.
‘Best estimates’ have been used in formulating the assumptions and estimates. However, changes in any of the key assumptions, including increases in discount rates or changes in operating conditions may cause the recoverable amount of CGUs to fall below their carrying amounts, resulting in an impairment loss being recognized.
The key assumptions for each CGU are detailed as follows:
2017 2016 2017 2016
CGU Valuation method
Years of cash flow
projectionTerminal
growth ratePre-tax
discount rateOnline Advertising Services Value in use 5 2.5% 2.0% 13.8% 10.6%Data, Research and Services Value in use 5 2.5% 2.0% 13.8% 10.6%Finance and Related Services Value in use 5 3.0% 2.5% 14.0% 10.6%Chile Value in use 5 3.0% - 13.8% -Mexico Fair value less costs to sell 10 3.0% - 15.9% -Argentina Fair value less costs to sell - - - - -
Given the recent nature of the Demotores acquisition in Argentina, the recoverable amounts for Argentina have been based on fair values less costs to sell supported with reference to the transaction price.
(c) Impact of possible changes in key assumptionsManagement does not consider that a reasonable change in any of the key assumptions would lead to impairment.
During the year Stratton Finance (part of the Finance and Related Services segment) experienced a revenue and profitability decline as a result of significant volume capacity reduction at a major lender. The approved budgets used in the preparation of the value in use models show a recovery in revenue and profitability based on increasing volumes of finance written by Stratton and other cash flow generative action plans put in place by management. Management does not believe that a reasonably possible change in the key assumptions would lead to impairment in the carrying value of the Finance and Related Services CGU, however the performance of the business continues to be kept under review.
Recognition and measurement(i) PayablesThese amounts represent liabilities for goods and services provided to the Group prior to the end of financial year that are unpaid. The amounts are unsecured and are usually paid within 30 days of recognition.
(ii) Short term obligationsLiabilities for wages and salaries, including non-monetary benefits, annual leave and accumulating sick leave expected to be settled within 12 months after the end of the period in which the employees render the related service are recognised in respect of employees’ service up to the end of the reporting period and are measured at the amount expected to be paid when the liabilities are settled. The liability for annual leave and accumulating sick leave is recognised in the provision for employee benefits. All other short term employee benefit obligations are presented as payables.
(iii) Other long term employee benefit obligationsThe liability for long service leave and annual leave that is not expected to be settled within 12 months after the end of the period in which the employees render the related services is recognised in the provision for employee benefits and measured as the present value of expected future payments to be made in respect of services provided by employees up to the end of the reporting period using the projected unit credit method. Consideration is given to expected future wage and salary levels, experience of employee departures and period of service. Expected future payments are discounted using market yields at the end of the reporting period on high-quality corporate bonds with terms to maturity and currency that match, as closely as possible, the estimated future cash outflows.
(iv) Bonus plansThe Group recognises a liability and an expense for bonuses and profit sharing based on a formula that takes into consideration the profit attributable to the Company’s shareholders after certain adjustments. The Company recognises a provision where contractually obliged or where there is a past practice that has created a constructive obligation.
18. CommitmentsNon-cancellable operating leasesThe Group leases offices in a number of locations. The most significant of these leases is the Melbourne head office where the lease is a non-cancellable operating lease expiring within five years. Upon renewal date, the Company has the option to renew the lease for a further five years at terms which are negotiable. The Group also leases various motor cars and printers under non-cancellable operating leases.
2017 $’000
2016 $’000
Commitments for minimum lease payments in relation to non-cancellable operating leases are payable as follows:Within one year 6,223 5,223Later than one year but not later than five years 11,934 12,518Later than five years 1,044 2,266
19,201 20,007
Bank guarantee facilityGuarantees in respect of bank facilities drawn down but not included in the accounts of the Group are $3,650,000 (2016: $3,200,000).
NOTES TO THE CONSOLIDATED FINANCIAL STATEMENTSCONTINUED
ANNUAL REPORT 2017 CARSALES.COM LIMITED96F
or p
erso
nal u
se o
nly
GROUP STRUCTURE19. Interests in other entities(a) Material subsidiariesThe Group’s principal subsidiaries at 30 June 2017 are set out below. Unless otherwise stated, they have share capital consisting solely of ordinary shares that are held directly by the Group and the proportion of ownership interests held equals the voting rights held by the Group. The country of incorporation or registration is also their principal place of business.
Name of entity
Place of business/ country of incorporation
Ownership interest held by
the Group(i)
Ownership interest held by non-controlling
interestsPrincipal activities
2017
%2016
%2017
%2016
%Webpointclassifieds Pty Ltd Australia 100.0 100.0 - - (1)Equipment Research Group Pty Ltd Australia 100.0 100.0 - - (2)Discount Vehicles Australia Pty Ltd Australia 100.0 100.0 - - (1)Automotive Data Services Pty Ltd Australia 100.0 100.0 - - (2)Auto Information Limited New Zealand 100.0 100.0 - - (2)RedBook Automotive Services (M) Sdn Bhd Malaysia 100.0 100.0 - - (2)RedBook Automotive Data Services (Beijing) Limited China 100.0 100.0 - - (2)Automotive Data Services (Thailand) Company Limited Thailand 100.0 100.0 - - (2)tyresales Pty Ltd Australia 50.0 50.0 50.0 50.0 (3)Auto Exchange Holdings Pty Ltd Australia 100.0 100.0 - - (4)Automotive Exchange Pty Ltd Australia 50.0 50.0 50.0 50.0 (1)carsales.com Investments Pty Ltd Australia 100.0 100.0 - - (4)carsales Holdings Pty Ltd Australia 100.0 100.0 - - (4)carsales.com Ltd Employee Share Trust Australia 100.0 100.0 - - (5)carsales Finance Pty Ltd Australia 100.0 100.0 - - (4)Carconnect Pty Ltd (ii) Australia 50.1 50.1 49.9 49.9 (6)Stratton Finance Pty Ltd Australia 50.1 50.1 49.9 49.9 (6)Stratton Franchise Pty Ltd Australia 50.1 50.1 49.9 49.9 (6)Stratton Marine And Outdoor Finance Pty Ltd Australia 43.8 37.6 56.2 62.4 (6)RedBook Inspect Pty Ltd (iii) Australia 50.1 50.1 49.9 49.9 (7)carsales Latam Pty Ltd Australia 100.0 100.0 - - (4)carsales Mexico SAPI de CV Mexico 65.0 65.0 35.0 35.0 (1)carsales Chile SpA Chile 100.0 100.0 - - (4)Chileautos SpA Chile 83.3 83.3 16.7 16.7 (1)carsales Foundation Pty Ltd Australia 100.0 100.0 - - (8)carsales Argentina Pty Ltd Australia 100.0 - - - (4)
Demotores Holdings LLCUnited States of America 100.0 - - - (4)
Demotores Chile SpA Chile 100.0 - - - (1)Demotores S.A. Argentina 100.0 - - - (1)Demotores Colombia S.A.S. Colombia 100.0 - - - (1) (i) The proportion of ownership interest is equal to the proportion of voting power held. (ii) Stratton Fleet Services Pty Ltd has been renamed to Carconnect Pty Ltd during the year ended 30 June 2017.(iii) Auto Inspect Pty Ltd has been renamed to RedBook Inspect Pty Ltd during the year ended 30 June 2017.
1. Classified advertising.2. Data and research.3. Online retail.4. Holding company.5. Share trust company.6. Finance and related services.7. Car inspection.8. Trustee company.
ANNUAL REPORT 2017 CARSALES.COM LIMITED 97F
or p
erso
nal u
se o
nly
(i) SubsidiariesSubsidiaries are all those entities over which the Group has the power to govern the financial and operating policies, generally accompanying a shareholding of more than one-half of the voting rights. The existence and effect of potential voting rights that are currently exercisable or convertible are considered when assessing whether the Group controls another entity.
Subsidiaries are fully consolidated from the date on which control is transferred to the Group. They are de-consolidated from the date that control ceases.
The purchase method of accounting is used to account for the acquisition of subsidiaries by the Company (refer to Note 20).
Intercompany transactions, balances and unrealised gains on transactions between companies are eliminated. Unrealised losses are also eliminated unless the transaction provides evidence of the impairment of the asset transferred. Accounting policies of subsidiaries have been changed where necessary to ensure consistency with the policies adopted by the Company.
Non-controlling interests in the results and equity of subsidiaries are shown separately in the consolidated income statement, statement of comprehensive income, statement of changes in equity and balance sheet respectively.
(ii) Employee Share TrustThe Group has formed a trust to administer the Group’s employee share scheme. This trust is consolidated, as the substance of the relationship is that the trust is controlled by the Group.
(b) Non-controlling interests (NCI)Set out below is summarised financial information for each subsidiary that has non-controlling interests that are material to the Group. The amounts disclosed for each subsidiary are before intercompany eliminations.
$’000Summarised statement of comprehensive incomeProfit/(loss) for the period (4) 2,581 4,674 1,339 (2,627) 881Profit/(loss) allocated to NCI (2) 1,290 2,348 668 (919) 150Dividends paid to NCI - 1,050 1,008 200 - -
Other comprehensive income - - - - (10) (54)
NOTES TO THE CONSOLIDATED FINANCIAL STATEMENTSCONTINUED
ANNUAL REPORT 2017 CARSALES.COM LIMITED98F
or p
erso
nal u
se o
nly
30 June 2016tyresales
$’000
Auto Exchange
$’000
Stratton Finance
$’000
RedBook Inspect
$’000SoloAutos
$’000Chileautos
$’000Summarised statement of comprehensive incomeProfit/(loss) for the period (210) 557 8,470 1,114 (718) 346Profit/(loss) allocated to NCI (105) 278 4,290 556 (251) 59Dividends paid to NCI - 350 4,667 287 - -Other comprehensive income - - - - (373) 133
30 June 2017tyresales
$’000
Auto Exchange
$’000
Stratton Finance
$’000
RedBook Inspect
$’000SoloAutos
$’000Chileautos
$’000Summarised cash flowsCash flows from operating activities 1,127 3,294 6,265 893 (2,012) 576Cash flows from investing activities (51) (123) (1,377) (760) (35) -Cash flows from financing activities 9 (2,100) (3,749) (74) - -Net increases/(decrease) in cash and cash equivalents 1,085 1,071 1,139 59 (2,047) 576
30 June 2016tyresales
$’000
Auto Exchange
$’000
Stratton Finance
$’000
RedBook Inspect
$’000SoloAutos
$’000Chileautos
$’000Summarised cash flowsCash flows from operating activities 670 447 12,665 1,056 (722) 217Cash flows from investing activities (68) (113) (5,093) (169) 17 -Cash flows from financing activities - (700) (7,806) (789) - -Net increases/(decrease) in cash and cash equivalents 602 (366) (234) 98 (705) 217
(c) Interests in associates
Name of entity
Place of business/ country of incorporation % of ownership interest
Nature of relationship
Measurement method
2017%
2016%
Webmotors S.A. Brazil 30.0 30.0 Associate Equity methodiCar Asia Limited* Australia - 20.2 Associate Equity methodSK ENCARSALES.COM Ltd South Korea 49.9 49.9 Associate Equity methodRateSetter Australia Pty Ltd Australia 20.5 20.0 Associate Equity methodPromisePay Pte Ltd Singapore 10.1 10.1 Associate Equity methodTotal equity accounted investments
Name of entity Quoted fair value Carrying amount Share of profit/(loss)
2017 $’000
2016$’000
2017 $’000
2016$’000
2017 $’000
2016$’000
Webmotors S.A. - - 63,678 83,381 3,028 3,376iCar Asia Limited* - 42,665 - 21,658 (1,241) (2,456)SK ENCARSALES.COM Ltd - - 144,759 145,710 8,204 5,309RateSetter Australia Pty Ltd - - 9,520 9,237 (1,019) (1,006)PromisePay Pte Ltd - - 6,515 6,990 (474) -Total equity accounted investments - 42,665 224,472 266,976 8,498 5,223 * As set out in Note 19(e) the investment in iCar Asia Limited was reclassified to available-for-sale financial assets during the year.
RateSetter and PromisePay are both equity accounted for as carsales exercises significant influence over these entities through the right to appoint a Director to the respective Boards.
ANNUAL REPORT 2017 CARSALES.COM LIMITED 99F
or p
erso
nal u
se o
nly
(i) AssociatesAssociates are all entities over which the Group has significant influence but not control or joint control, generally accompanying a shareholding of between 20% and 50% of the voting rights. Investments in associates are accounted for using the equity method of accounting, after initially being recognised at cost. The Group’s investment in associates includes goodwill identified on acquisition. Acquisition-related costs of associates are capitalised.
The Group’s share of its associates’ post-acquisition profits or losses is recognised in profit or loss, and its share of post-acquisition other comprehensive income is recognised in other comprehensive income. The cumulative post-acquisition movements are adjusted against the carrying amount of the investment. Dividends receivable from associates are recognised as reduction in the carrying amount of the investment.
When the Group’s share of losses in an associate equals or exceeds its interest in the associate, including any other unsecured long term receivables, the Group does not recognise further losses unless it has incurred obligations or made payments on behalf of the associate.
Unrealised gains on transactions between the Group and its associates are eliminated to the extent of the Group’s interest in the associates. Unrealised losses are also eliminated unless the transaction provides evidence of an impairment of the asset transferred. Accounting policies of associates have been changed where necessary to ensure consistency with the policies adopted by the Group.
(ii) Contingent liabilities in respect of associates
2017 $’000
2016 $’000
Contingent liabilities – associates
Contingent liabilities relating to liabilities of the associate for which the Company is severally liable 482 568
(iii) Summarised financial information for significant associates
Reconciliation of carrying valueOpening carrying value 83,381 82,811 21,658 19,362 145,710 144,851Investment in associate/capital return (13,511) - - 3,797 - -Profit/(loss) for the period 3,632 3,922 (1,241) (2,456) 9,963 7,064Amortisation of intangibles (604) (546) - - (1,759) (1,755)Gain on dilution - - - 955 - -Other comprehensive income (2,377) (1,055) - - (4,004) (552)
Dividends received (6,843) (1,751) - - (5,151) (3,898)
Impairment loss - - (7,145) - - -Transfer to available-for-sale financial asset - - (13,272) - - -Closing carrying value 63,678 83,381 - 21,658 144,759 145,710 * These numbers are management estimates based on available market data.
The intangibles and goodwill recognised on acquisition have now been separately identified in the table above.
NOTES TO THE CONSOLIDATED FINANCIAL STATEMENTSCONTINUED
ANNUAL REPORT 2017 CARSALES.COM LIMITED100F
or p
erso
nal u
se o
nly
Webmotors S.A. iCar Asia Limited SK ENCARSALES.COM Ltd
Other comprehensive income - - - - 129 (665)Total comprehensive income 12,108 11,255 (7,166) (12,159) 20,094 9,975
carsales shareProfit from continuing operations 3,028 3,376 (1,241) (2,456) 8,204 5,309Other comprehensive income (2,377) (1,055) - - (4,004) (552)Total 651 2,321 (1,241) (2,456) 4,200 4,757Dividends received from associates and joint venture entities 6,843 1,751 - - 5,151 3,898 * These numbers are management estimates of the financial performance of iCar Asia Limited between 1 July 2016 and 9 December 2016, the period over which
carsales held the asset as an associate.
(iv) WebmotorsUnder accounting standards, there is no requirement to annually test for impairment in relation to carsales’ equity held associate investments. Nevertheless, each year the Company does consider whether there are any triggers for impairment in relation to these investments. In light of the continued decline of the economy in Brazil, management has impairment tested the carrying value of the equity accounted investment in Webmotors. This review was performed using a value in use cash flow model. This model was prepared on the same basis as the impairment testing model used for goodwill (as set out earlier in this note) and incorporates cash flow projections based on approved budgets for the next 5 years, which show higher cash flow growth rates than those observed in FY17 which in part are predicated on an improvement in the Brazilian economy. A growth rate beyond the budget period of 4.5% and a pre-tax discount rate of 21.6% has been used in the model.
The value indicated by the value in use model exceeded the carrying value of the investment in Webmotors by more than 20% at 30 June 2017. As such, no impairment charge has been recognised.
However, the valuation outcome is sensitive to the underlying performance of the Brazilian economy which manifests itself in the model in two key areas:
1. The timing of the recovery of the Brazilian economy has a significant impact on the operating cash flow growth that Webmotors is able to generate; and
2. The current macro-economic environment (specifically key inputs such as market risk premium, inflation/interest rates) has a significant impact on the discount rate.
Management does not believe that a reasonably possible change in these key assumptions would lead to impairment in the carrying value of the investment in Webmotors.
However, should the Brazilian economy continue to decline resulting in an increase in the discount rate of 2%, or a reduction in the assumed growth rate of cash flows of 7% per annum over the budget period, the valuation indicated by the value in use model would be approximately equal to the carrying value of the investment in Webmotors.
At 1 July - -Transfer from equity accounted associates 13,272 -Gain recognised through other comprehensive income 29 -At 30 June 13,301 -
ANNUAL REPORT 2017 CARSALES.COM LIMITED 101F
or p
erso
nal u
se o
nly
Recognition and measurementInvestments are designated as available-for-sale financial assets if they do not have fixed maturities and fixed or determinable payments, and management intends to hold them for the medium to long term. Financial assets that are not classified into any of the other categories (at FVPL, loans and receivables or held-to-maturity investments) are also included in the available-for-sale category.
The financial assets are presented as non-current assets unless they mature, or management intends to dispose of them within 12 months of the end of the reporting period.
(e) Fair value adjustment and investment dilution
Name of entity2017
$’0002016
$’000Associate dilution 268 955Fair value adjustment on transfer to available-for-sale financial assets (7,145) -Total fair value adjustment and investment dilution (6,877) 955
Associate dilutionAs a result of a change in the Company’s holding of investments in associates, there is a gain on associate dilution of $268,000 (2016: $955,000).
Fair value adjustment on transfer to available-for-sale financial assetsThe fair value adjustment arose from the change in accounting treatment from equity accounting the Group’s investment 15.6% in iCar Asia Limited to an available-for-sale financial asset as a result of carsales non-executive directors stepping down from the Board of iCar Asia Limited on 9 December 2016 and no longer having significant influence.
20. Business combinations and disposals(a) Demotores acquisition
On 24 February 2017, carsales.com Ltd acquired 100% acquisition of the Demotores Group which consists of Demotores Chile SpA, Demotores S.A, Demotores Colombia S.A.S and Demotores Holding LLC.
Details of the purchase consideration, the net assets acquired and goodwill are as follows:
$’000Purchase consideration:Cash paid 6,667Working capital adjustment (216)
6,451The assets and liabilities acquired are estimated as follows:Cash and cash equivalents 80Accounts receivable 1,275Plant and equipment 78Intangible assets 1,847Trade and other payables (861)Deferred tax liabilities (372)Net Assets 2,047Add: Goodwill 4,404Net assets acquired 6,451
(i) Initial accountingBoth the net asset value and the allocation of the purchase price to acquired assets are still preliminary. In particular, the fair values assigned to intangible assessed are still being assessed and may be subject to change. The acquisition accounting will be finalised within 12 months of the acquisition date.
(ii) Working capital adjustmentA working capital adjustment of $216,000 is receivable by carsales.com Ltd from the vendor. The working capital adjustment remained outstanding at 30 June 2017.
NOTES TO THE CONSOLIDATED FINANCIAL STATEMENTSCONTINUED
ANNUAL REPORT 2017 CARSALES.COM LIMITED102F
or p
erso
nal u
se o
nly
(b) Chileautos acquisitionOn 25 March 2016 carsales.com Ltd acquired 83.3% of Chileautos SpA (Chileautos).
Details of the purchase consideration, the net assets acquired and goodwill are as follows:
$’000Purchase consideration:Cash paid 19,657
The assets and liabilities acquired are estimated as follows:Cash and cash equivalents 342Accounts receivable 193Plant and equipment 3Intangible assets 4,469Trade and other payables (68)Tax liabilities (5)Deferred tax liability (1,140)Net assets 3,794Less: Non-controlling interests (77) Add: Goodwill 15,940Net assets acquired 19,657
(i) Finalisation of Chileautos acquisition accountingGiven that the acquisition occurred close to the previous financial year end, the final net asset valuation and allocation of the purchase price to acquired assets was preliminary. In accordance with the Group’s accounting policy, the accounting for the acquisition of Chileautos was finalised during the current year and the preliminary step acquisition balances have been updated accordingly.
The intangible assets acquired comprises brands and customer relationships.
Revised goodwill is $15,940,000 (preliminary goodwill $19,024,000).
(ii) Option to purchase remaining sharescarsales retains an option to purchase the remaining 16.7% stake in Chileautos at its election at any time during the next three years at a fixed price.
(iii) Non-controlling interestThe Group has recognised the non-controlling interests in Chileautos at proportionate share of net identifiable assets.
The current ownership structure of Chileautos is as follows:
carsales Chile SpA 83.3%Non-controlling interestsCarlos Gonzalo Prieto Concha 7.5%Andres Cooper Ochsenius 1.7%Juan Francisco Bettancourt Mujica 7.5%
100%
ANNUAL REPORT 2017 CARSALES.COM LIMITED 103F
or p
erso
nal u
se o
nly
Recognition and measurementThe acquisition method of accounting is used to account for all business combinations, including business combinations involving entities or businesses under common control, regardless of whether equity instruments or other assets are acquired. The consideration transferred for the acquisition of a subsidiary comprises the fair values of the assets transferred, the liabilities incurred and the equity interests issued by the Company. The consideration transferred also includes the fair value of any contingent consideration arrangement and the fair value of any pre-existing equity interest in the subsidiary. Contingent payments classified as debt are subsequently remeasured through profit or loss. Identifiable assets acquired and liabilities and contingent liabilities assumed in a business combination are, with limited exceptions, measured initially at their fair values at the acquisition date. On an acquisition-by-acquisition basis, the Company recognises any non-controlling interest in the acquiree either at fair value or at the non-controlling interest’s proportionate share of the acquiree’s net identifiable assets.
The excess of the consideration transferred, the amount of any non-controlling interest in the acquiree and the acquisition-date fair value of any previous equity interest in the acquiree over the fair value of the Company’s share of the net identifiable assets acquired is recorded as goodwill. If those amounts are less than the fair value of the net identifiable assets of the subsidiary acquired and the measurement of all amounts has been reviewed, the difference is recognised directly in profit or loss as a discount on purchase. If the Company recognises previously acquired deferred tax assets after the initial acquisition accounting is completed these will be recorded directly in profit or loss.
Where settlement of any part of cash consideration is deferred, the amounts payable in the future are discounted to their present value as at the date of exchange. The discount rate used is the entity’s incremental borrowing rate, being the rate at which a similar borrowing could be obtained from an independent financier under comparable terms and conditions.
(c) SoloAutos acquisitionOn 2 October 2015 carsales.com Ltd acquired 65% of carsales Mexico SAPI de CV (SoloAutos).
Details of the purchase consideration, the net assets acquired and goodwill are as follows:
$’000Purchase consideration:Cash paid 10,624
The assets and liabilities acquired are estimated as follows:Cash and cash equivalents 4,269VAT receivable 877Plant and equipment 88Intangible assets 3,245Net assets 8,479Less: Non-controlling interests (2,661)Add: Goodwill 4,806Net assets acquired 10,624
(i) Finalisation of SoloAutos acquisition accountingGiven that the acquisition occurred close to the previous financial year end, the final net asset valuation and allocation of the purchase price to acquired assets was preliminary. In accordance with the Group’s accounting policy, the accounting for the acquisition of SoloAutos was finalised during the current year and the preliminary step acquisition balances have been updated accordingly.
The intangible assets acquired comprises brands and customer relationships.
(ii) Earn-out agreementAs part of the inducement agreement there is a portion of deferred consideration that is payable to the other shareholder in respect of the purchase of the trade and assets of the business from SoloAutos. The earn-out is calculated on the basis of the entity’s performance over a three-year period after the acquisition date provided the other shareholder is in continuous employment. This amounts to a maximum of USD $2.15 million and is treated as employee compensation expense in the post-combination period.
carsales has the option to purchase the remaining 35% of the shares subject to satisfaction of the terms and conditions at a price that approximates the fair value of the non-controlling interest at the date of exercise of the option.
NOTES TO THE CONSOLIDATED FINANCIAL STATEMENTSCONTINUED
ANNUAL REPORT 2017 CARSALES.COM LIMITED104F
or p
erso
nal u
se o
nly
(iii) Non-controlling interestThe Group has recognised the non-controlling interests in SoloAutos at proportionate share of net identifiable assets. The current ownership structure of SoloAutos is as follows:
carsales Latam Pty Ltd 65%Non-controlling interestsJose Antonio Ramirez (and other legacy shareholders) 35%
100%
(d) Sale of businessThe profit from sale of business of $931,000 represents the net profit of sale of Homesales business on 30 June 2016.
21. Related party transactions(a) SubsidiariesInterests in subsidiaries are set out in Note 19.
(b) Key Management Personnel compensation
2017 $
2016 $
Short term employee benefits 7,193,356 8,606,950Deferred short term employee benefits 227,152 180,888Post-employment benefits 174,590 162,626Long term employment benefits 262,603 137,247Share-based payments (858,250) 63,912Other termination 986,107 -
7,985,558 9,151,623
(c) Transactions with other related partiesThe following transactions occurred with related parties, the nature of which are described in the Remuneration Report.
2017 $
2016 $
Sales of goods and servicesSale of services to related parties 1,318,262 988,588
Purchases of goods and servicesPurchases of goods and services from related parties 3,461,834 3,471,979
All transactions were made on normal commercial terms and conditions at market rates and include transactions with associates.
(d) Outstanding balances arising from sales/purchases of goods and servicesThe following balances are outstanding at the end of the reporting period in relation to transactions with related parties:
2017 $
2016 $
Current receivables (sales of goods and services)Other related parties 164,996 137,367
Current payables (purchases of goods and services)Other related parties 923,774 876,268
There is no allowance account for impaired receivables in relation to any outstanding balances, and no expense has been recognised in respect of impaired receivables due from related parties.
ANNUAL REPORT 2017 CARSALES.COM LIMITED 105F
or p
erso
nal u
se o
nly
22. Deed of cross guaranteeThe following controlled entities have entered into a deed of cross guarantee:
Company Financial year entered into agreementcarsales.com Limited 30 June 2015carsales Holdings Pty Ltd 30 June 2015carsales Finance Pty Ltd 30 June 2015Auto Exchange Holdings Pty Ltd 30 June 2015Automotive Data Services Pty Ltd 30 June 2015carsales.com Investments Pty Ltd 30 June 2015Discount Vehicles Australia Pty Ltd 30 June 2015Equipment Research Group Pty Ltd 30 June 2015Webpointclassifieds Pty Ltd 30 June 2015carsales Latam Pty Ltd 30 June 2016carsales Foundation Pty Ltd 30 June 2016carsales Argentina Pty Ltd 30 June 2017
The companies that are party to this deed guarantee the debts of the others and represent the ‘Closed Group’ from the date of entering into the agreement.
These wholly-owned entities have been relieved from the requirement to prepare a Financial Report and Directors’ Report under Class Order 98/1418 (as amended) issued by the Australian Securities and Investments Commission.
(a) Consolidated statement of comprehensive incomeSet out below is a consolidated income statement for the year ended 30 June 2017 of the Closed Group.
Consolidated statement of comprehensive income2017
$’0002016
$’000Revenue from continuing operationsSale of goods and services 271,510 254,953Revenue from continuing operations 271,510 254,953
ExpensesCosts of sale (195) (119)Sales and marketing expenses (57,013) (54,369)Operations and administration (22,319) (21,543)Service development and maintenance (28,182) (24,875)Earnings before interest, taxes, depreciation and amortisation 163,801 154,047
Depreciation and amortisation expense (7,251) (5,437)Finance income 992 656Finance costs (7,053) (8,598)Dividends received 14,109 10,972Loss on associate fair value adjustment (11,656) -Gain on sale of business - 931
Profit before income tax 152,942 152,571Income tax expense (45,493) (43,287)Profit from continuing operations 107,449 109,284Total comprehensive income for the year 107,449 109,284
NOTES TO THE CONSOLIDATED FINANCIAL STATEMENTSCONTINUED
ANNUAL REPORT 2017 CARSALES.COM LIMITED106F
or p
erso
nal u
se o
nly
(b) Consolidated statement of financial positionSet out below is a consolidated statement of financial position as at 30 June 2017 of the Closed Group.
Consolidated statement of financial position2017
$’0002016
$’000Current assetsCash and cash equivalents 22,001 13,517Trade and other receivables 56,488 55,894Total current assets 78,489 69,411
Current liabilitiesTrade and other payables 21,068 21,359Current tax liabilities 8,818 6,312Provisions 4,718 5,266Deferred revenue 6,107 5,990Total current liabilities 40,711 38,927
NOTES TO THE CONSOLIDATED FINANCIAL STATEMENTSCONTINUED
OTHER23. Remuneration of auditorsDuring the year the following fees were paid or payable for services provided by the auditor of the parent entity, its related practices and non-related audit firms:
(a) PricewaterhouseCoopers
2017$’000
2016$’000
PricewaterhouseCoopers firm Audit and review of Financial Reports 407,610 370,616 Due diligence services 238,454 224,566
Total remuneration for audit and other assurance services 646,064 595,182
Taxation services Tax compliance services, including review of Company income tax returns 86,526 143,350 International tax consulting and tax advice on mergers and acquisitions 63,102 88,124
Total remuneration for taxation services 149,628 231,474
Other services Other services 37,850 88,472
Total remuneration of PricewaterhouseCoopers 833,542 915,128
(b) Non-PwC audit firms
Audit and other assurance services Audit and review of financial statements 33,039 33,097
Total remuneration for audit and other assurance services 33,039 33,097
Total auditors’ remuneration 866,581 948,225
It is the Company’s policy to employ PwC on assignments additional to their statutory audit duties where PwC’s expertise and experience with the Company are important. These assignments are principally tax advice and due diligence reporting on acquisitions, or where PwC is awarded assignments on a competitive basis. It is the Company’s policy to seek competitive tenders for all major consulting projects.
ANNUAL REPORT 2017 CARSALES.COM LIMITED108F
or p
erso
nal u
se o
nly
24. Share-based paymentsShare-based compensation benefits are provided to employees via the carsales.com Ltd Employee Option Plan.
Total expenses arising from share-based payment transactions recognised during the period as part of employee benefit expense were ($255,000) (2016: $2,214,000).
Employee Option PlanSet out below are summaries of options and performance rights granted under the plan:2017
Grant date Expiry dateExercise
price
Balance at start of the
year Number
Options granted
during the year
Number
Perfor- mance rights
granted during the
year Number
Total exercised
during the year
Number
Expired or lapsed
during the year
Number Other*
Balance at the
end of the year Number
Vested and
exercisable at end of the
year Number
Oct 2011 Oct 2016 $4.69 36,257 - - (36,257) - - - -Oct 2012 Oct 2017/
Mar 2018$5.93 216,720 - - (21,572) - - 195,148 195,148
Oct 2013 Oct 2018 $9.10 374,626 - - (18,537) (294,948) - 61,141 61,141
Weighted average exercise price $7.44 $12.23 $0.00 $4.38 $7.00 $8.74 $6.69 * Other change reflect options and performance rights outstanding at cessation of employment.
NOTES TO THE CONSOLIDATED FINANCIAL STATEMENTSCONTINUED
The estimate of the weighted average share price at the date of exercise of options exercised regularly during the year ended 30 June 2017 is estimated to be approximately $11.56 (2016: approximately $10.47).
The weighted average remaining contractual life of share options outstanding at the end of the period was 8.58 years (2016: 3.34 years).
The establishment of the carsales.com Ltd Employee Option Plan was undertaken under a prospectus lodged with ASIC in 2000. Staff eligible to participate in the plan are those invited by the Board of Directors.
Options and performance rights are granted under the plan for no consideration with conditions including a vesting period and expiry date. Senior Executives’ vesting conditions, including EPS targets, are noted in the Remuneration Report on page 44.
Options and performance rights granted under the plan carry no dividend or voting rights.
When exercisable, each option is convertible into one ordinary share in return for payment of the option’s exercise price. Each performance rights is convertible into one ordinary share for $0.00 exercise price, upon satisfaction of all vesting requirements.
The exercise price of options is set in advance by the Board of Directors.
Fair value of options and performance rights grantedThe assessed fair value at grant date of options granted during the year ended 30 June 2017 is $1.10 (2016: $1.86). The assessed fair value at grant date of options based on the Relative Total Shareholder Return (RTSR) measure during the year ended 30 June 2017 is $0.98 (2016: n/a).The assessed value at grant date of performance rights granted during the year ended 30 June 2017 ranged between $9.49 and $9.86 (2016: between $8.44 and $8.74). The assessed fair value at grant date of performance rights based on the Relative Total Shareholder Return (RTSR) measure granted during the year ended 30 June 2017 is $4.87 (2016: n/a). The fair value at grant date is determined using a Black-Scholes option pricing model that takes into account the exercise price, the term of the options and performance rights, the impact of dilution, the share price at grant date and expected price volatility of the underlying share, the expected dividend yield and the risk-free interest rate for the term of the option.
The model inputs for options and performance rights granted during the year ended 30 June 2017 included:
Options Performance rights2017 2016 2017 2016
Exercise price $12.23 $10.24 $0.00 $0.00Grant date October 2016 October 2015 October 2016 October 2015Expiry date October 2031 October 2020 October 2031 October 2020Share price at grant date $11.05 $9.71 $11.05 $9.71Expected price volatility of the Company’s shares 23.0% 31.8% 23.0% 31.8%Expected dividend yield 3.8% 3.5% 3.8% 3.5%Risk-free interest rate 1.8% 2.8% 1.7% 2.8%
The expected price volatility is based on historical volatility adjusted for any expected changes to future volatility due to publicly available information.
ANNUAL REPORT 2017 CARSALES.COM LIMITED110F
or p
erso
nal u
se o
nly
25. Parent entity financial information(a) Summary financial information
Recognition and measurementThe financial information for the parent entity, carsales.com Ltd, has been prepared on the same basis as the consolidated financial statements, except as set out below.
Investments in subsidiariesInvestments in subsidiaries are accounted for at cost in the financial statements of carsales.com Ltd. Dividends received from subsidiaries are recognised in the parent entity’s profit or loss, rather than being deducted from the carrying amount of these investments. Investments in subsidiaries are tested for impairment whenever changes in events or circumstances indicate that the carrying amount may not be recoverable. Such events may include receipt of dividends, refer Note 16 for details of impairment accounting policies.
26. Contingent liabilitiesThe Group and the parent entity from time to time may incur obligations arising from litigation or other contracts entered into in the normal course of business. Neither the Group or parent entity have any material contingent liabilities where the probability of outflow in any settlement is greater than remote as at 30 June 2017 or 30 June 2016 other than the associates contingent liabilities as set out in Note 19(c).
ANNUAL REPORT 2017 CARSALES.COM LIMITED 111F
or p
erso
nal u
se o
nly
NOTES TO THE CONSOLIDATED FINANCIAL STATEMENTSCONTINUED
27. Other accounting policiesThe following standards will be applicable in future reporting periods and the Group will adopt the standards upon the operative date. The Group is assessing the impact of these standards however they are not expected to have significant impact aside from as specifically set out below:
• AASB 9 Financial Instruments (effective 1 January 2018).
• AASB 15 Revenue from Contracts with Customers (effective 1 January 2018). – The Group will be reporting revenue based on the new standard in the December 2018 half-year report. The Group has assessed the new standard impact on the 30 June 2017 consolidated income statement and the impact is not material.
• IFRS 16 Leases (effective 1 January 2019). – The Group will be reporting revenue based on the new standard in the December 2018 half-year report. The Group has assessed the new standard impact and it is expected to be not material.
The following standards are not applicable to carsales.com Ltd and therefore there is no impact on the Group:
• Superannuation Entities (AASB 1056) (effective 1 January 2016).
• Accounting for acquisitions of interests in joint operations (AASB 2014-3) (effective 1 January 2016).
28. Events occurring after the reporting periodNo matter or circumstance has occurred subsequent to period end that has significantly affected, or may significantly affect, the operations of the group the results of those operations or the state of affairs of the Group or economic entity in subsequent financial years.
ANNUAL REPORT 2017 CARSALES.COM LIMITED112F
or p
erso
nal u
se o
nly
DIRECTORS’ DECLARATION30 JUNE 2017
In the Directors’ opinion:
(a) the financial statements and notes set out on pages 68 to 112 are in accordance with the Corporations Act 2001, including:
(i) Complying with Accounting Standards, the Corporations Regulations 2001 and other mandatory professional reporting requirements.
(ii) Giving a true and fair view of the consolidated entity’s financial position as at 30 June 2017 and of its performance for the financial year ended on that date.
(b) there are reasonable grounds to believe that the Company will be able to pay its debts as and when they become due and payable.
The basis of preparation confirms that the financial statements also comply with International Financial Reporting Standards as issued by the International Accounting Standards Board.
The Directors have been given the declarations by the Managing Director and CEO, and Chief Financial Officer required by section 295A of the Corporations Act 2001.
Cameron McIntyreManaging Director and CEO
Melbourne8 August 2017
ANNUAL REPORT 2017 CARSALES.COM LIMITED 113F
or p
erso
nal u
se o
nly
INDEPENDENT AUDITOR’S REPORT TO THE MEMBERS OFCARSALES.COM LTD
Liability limited by a scheme approved under Professional Standards Legislation.
Independent auditor’s reportTo the shareholders of carsales.com Limited
Report on the audit of the financial report
Our opinion
In our opinion:
The accompanying financial report of carsales.com Limited (the Company) and its controlled entities(together the Group) is in accordance with the Corporations Act 2001, including:
a) giving a true and fair view of the Group’s financial position as at 30 June 2017 and of its financialperformance for the year then ended
b) complying with Australian Accounting Standards and the Corporations Regulations 2001.
What we have audited
The Group financial report comprises:
the consolidated statement of financial position as at 30 June 2017
the consolidated statement of comprehensive income for the year then ended
the consolidated statement of changes in equity for the year then ended
the consolidated statement of cash flows for the year then ended
the notes to the consolidated financial statements, which include a summary of significantaccounting policies
the director’s declaration.
Basis for opinion
We conducted our audit in accordance with Australian Auditing Standards. Our responsibilities underthose standards are further described in the Auditor’s responsibilities for the audit of the financialreport section of our report.
We believe that the audit evidence we have obtained is sufficient and appropriate to provide a basis forour opinion.
Independence
We are independent of the Group in accordance with the auditor independence requirements of theCorporations Act 2001 and the ethical requirements of the Accounting Professional and EthicalStandards Board’s APES 110 Code of Ethics for Professional Accountants (the Code) that are relevant toour audit of the financial report in Australia. We have also fulfilled our other ethical responsibilities inaccordance with the Code.
Our audit approach
An audit is designed to provide reasonable assurance about whether the financial report is free frommaterial misstatement. Misstatements may arise due to fraud or error. They are considered material ifindividually or in aggregate, they could reasonably be expected to influence the economic decisions ofusers taken on the basis of the financial report.
ANNUAL REPORT 2017 CARSALES.COM LIMITED114F
or p
erso
nal u
se o
nly
We tailored the scope of our audit to ensure that we performed enough work to be able to give anopinion on the financial report as a whole, taking into account the geographic and managementstructure of the Group, its accounting processes and controls and the industry in which it operates.
Materiality Audit scope Key audit matters
For the purpose of our audit weused overall Group materialityof $8.0 million whichrepresents approximately 5% ofthe Group’s profit before tax.
We applied this threshold,together with qualitativeconsiderations, to determinethe scope of our audit and thenature, timing and extent ofour audit procedures and toevaluate the effect ofmisstatements on the financialreport as a whole.
We chose Group profit beforetax because, in our view, it isthe metric against which theperformance of the Group ismost commonly measured andis a generally acceptedbenchmark.
We selected 5% based on ourprofessional judgement notingthat it is also within the rangeof commonly acceptable profitrelated thresholds.
Our audit focused on where theGroup made subjectivejudgements; for example,significant accountingestimates involvingassumptions and inherentlyuncertain future events.
The Group operates inAustralia and in a number ofcountries in Asia and theAmericas, and has a corporateaccounting function based inMelbourne.
The audit procedures werepredominantly performed atthe Group’s corporate office inMelbourne.
For certain overseas associateentities, local auditors wereinstructed to perform specifiedrisk focused audit procedures.
Amongst other relevant topics,we communicated the followingkey audit matters to the Auditand Risk Committee:
Carrying value of goodwill
Carrying value ofWebmotors S.A. equityaccounted investment
Accounting for iCar AsiaLimited investment.
These are further described inthe Key audit matters section ofour report.
ANNUAL REPORT 2017 CARSALES.COM LIMITED 115F
or p
erso
nal u
se o
nly
INDEPENDENT AUDITOR’S REPORT TO THE MEMBERS OFCARSALES.COM LTD CONTINUED
Key audit matters
Key audit matters are those matters that, in our professional judgement, were of most significance in ouraudit of the financial report for the current period. The key audit matters were addressed in the contextof our audit of the financial report as a whole, and in forming our opinion thereon, and we do notprovide a separate opinion on these matters. Further, any commentary on the outcomes of a particularaudit procedure is made in that context.
Key audit matter How our audit addressed the key audit matter
Carrying value of goodwill
(Refer to note 16)
The Group recognised a goodwill balance of $169.7m,which represents approximately a third of the totalassets of the Group. The Group’s goodwillpredominately relates to 4 Cash Generating Units(CGUs) – Online Advertising ($72.1m); Data andResearch ($14.5m); Finance and Related Services($58.7m); and Chile ($17.3m).
At 30 June 2017, the Group performed an impairmentassessment over these goodwill balances by:
1. Calculating the ‘Value in Use’ for each CGU,using discounted cash flow models (themodels).
2. Comparing the resulting ‘Value in Use’ to theCGUs’ carrying values to determine the needfor any impairment.
The impairment models included cash flows for eachCGU for a forecast 5 year period. A terminal growthrate was applied in determining the terminal value.
The assessment by the Group did not identify a needfor impairment.
We considered the carrying value of goodwill to be akey audit matter as the balance is material and therewas significant judgement involved by the Group inthe impairment assessment, particularly with respectto determining appropriate:
Discount rates
Annual growth rates (short-term)
Terminal growth rates.
The Group performed a sensitivity analysis for eachCGU, with particular focus on the Finance andRelated Services CGU due to the reduction inprofitability of Stratton during FY2017, and did notidentify any impairment.
We compared the Group’s net assets as at 30 June 2017 toits market capitalisation and noted headroom.
We assessed the allocation of assets, liabilities and cashflows to the CGUs and were satisfied they were directlyattributable to the individual CGU.
We performed a number of procedures over these 4CGU’s including the following:
Compared the forecasted cash flows for 2018used in the models with the FY2018 budgetformally approved by the Board.
Assessed the cash flow forecasts for each CGU inthe models by considering the key factors andunderlying drivers for growth in the context ofthe Group’s future plans.
Considered the historical accuracy of theGroup’s cash flow forecasts by comparing theforecasts used in the prior year to the actualperformance of each CGU in the current year.
Compared the terminal growth rates in themodels to historical growth rates and economicforecasts.
With the assistance of PwC valuation experts, we assessedthe discount rates used in the models by comparing themto our expected range based on market data, comparablecompanies and industry research.
We performed a sensitivity analysis for the CGU’s byreducing the annual growth rates and increasing thediscount rates within a range viewed as reasonablyforeseeable.
ANNUAL REPORT 2017 CARSALES.COM LIMITED116F
or p
erso
nal u
se o
nly
Key audit matter How our audit addressed the key audit matter
Carrying value of Webmotors S.A. equityaccounted investment
(Refer note 19)
The carrying value of the Webmotors S.A. equityaccounted investment was a key audit matter due tothe financial significance of the investment ($63.7m)and the continued decline of the economy in Brazilresulting in underperformance against budget inFY2017.
As required by Australian Accounting Standards, theGroup assessed whether there were any indicators ofimpairment for each of their equity accountedinvestments and concluded there were none with theexception of the Webmotors S.A. investment.
The Group prepared a ‘Value in Use’ discounted cashflow model to assess the carrying value of theWebmotors S.A investment as at 30 June 2017 (VIUModel).
The VIU Model included cash flows for a forecast 5year period. A terminal growth rate was applied indetermining the terminal value.
The VIU Model did not identify the need forimpairment of the Webmotors S.A. investment.
We compared the historical performance of theWebmotors S.A. investment against the correspondingrevenue and profitability forecasts used in the initialvaluation of the business underpinning the initialinvestment.
To assess the VIU Model, we performed a number ofprocedures including the following:
Compared the forecasted cash flows used in theVIU Model with the budget formally approvedby the Webmotors S.A. Board.
Assessed the 5 year cash flow forecasts in theVIU Model by considering the key factors andunderlying drivers for growth in the context ofWebmotors S.A. future plans.
Considered the historical accuracy of theGroup’s cash flow forecasts by comparing theforecasts used in the prior year to the actualperformance in the current year.
Compared the terminal growth rate in the VIUModel to historical growth rates and economicforecasts.
With the assistance of PwC valuation experts, we assessedthe discount rate used in the Webmotors S.A. impairmentassessment by comparing it to our expected range basedon market data, comparable companies and industryresearch.
We performed a sensitivity analysis by reducing the cashflow growth rate and increasing the discount rate within arange viewed as reasonably foreseeable.
Accounting for iCar Asia Limited investment
(Refer to note 19)
During the first half of FY2017, the Group’s ownershipstake in iCar Asia Limited (iCar) was diluted to 15.6%as a result of additional capital raising by iCar. On 9December 2016, the Group’s two nominee directorsstepped down from the iCar board and at this time theGroup concluded that they no longer held significantinfluence over iCar and ceased to equity account forthis investment.
In accordance with Australian Accounting Standards,the Group is now required to account for the iCarinvestment as an available-for-sale financial asset and
To assess whether the investment in iCar wasappropriately classified as available-for-sale inaccordance with Australian Accounting Standards, weobtained the original purchase agreement and consideredthe board composition, ownership control andparticipation in the operational decisions of iCar.
We compared the iCar share price used in the Group’simpairment calculation to the listed share price at 9December 2016.
We recalculated the closing carrying value of theinvestment as at 30 June 2017 using the listed share price
ANNUAL REPORT 2017 CARSALES.COM LIMITED 117F
or p
erso
nal u
se o
nly
INDEPENDENT AUDITOR’S REPORT TO THE MEMBERS OFCARSALES.COM LTD CONTINUED
Key audit matter How our audit addressed the key audit matter
measure it at fair value at each reporting date.
During the first half of FY2017 there was a significantfall in the iCar share price from 85 cents as at 30 June2016 to 26.5 cents as at 9 December 2016 (the datethe Group ceased having significant influence over theinvestment). This resulted in a write down of thecarrying amount of the equity accounted investment($20.4m) at 9 December 2016 to its fair value($13.2m). The impairment loss of $7.1m wasrecognised in the Group’s profit and loss.
The subsequent share price movements since 9December 2016 to 30 June 2017 have been accountedfor through other comprehensive income to reserves.
We considered this to be a key audit matter due to thefinancial significance of the impairment and thejudgement involved in determining the appropriateclassification and corresponding accounting for theinvestment.
at 30 June 2017 and reconciled this to the correspondingmovement within the Group’s other comprehensiveincome.
Other information
The directors are responsible for the other information. The other information comprises the Financialperformance, Chairman’s And Chief Executive Officer’s Report, Business overview, Directors’ Reportand Shareholder information included in the Group’s annual report for the year ended 30 June 2017,but does not include the financial report and our auditor’s report thereon.
Our opinion on the financial report does not cover the other information and accordingly, we do notexpress any form of assurance conclusion thereon.
In connection with our audit of the financial report, our responsibility is to read the other informationidentified above and, in doing so, consider whether the other information is materially inconsistent withthe financial report or our knowledge obtained in the audit, or otherwise appears to be materiallymisstated.
If, based on the work we have performed, we conclude that there is a material misstatement of this otherinformation, we are required to report that fact. We have nothing to report in this regard.
Responsibilities of the directors for the financial report
The directors of the Company are responsible for the preparation of the financial report that gives a trueand fair view in accordance with Australian Accounting Standards and the Corporations Act 2001 andfor such internal controls as the directors determine is necessary to enable the preparation of thefinancial report that gives a true and fair view and is free from material misstatement, whether due tofraud or error.
In preparing the financial report, the directors are responsible for assessing the ability of the Group tocontinue as a going concern, disclosing, as applicable, matters related to going concern and using thegoing concern basis of accounting unless the directors either intend to liquidate the Group or to ceaseoperations, or have no realistic alternative but to do so.
ANNUAL REPORT 2017 CARSALES.COM LIMITED118F
or p
erso
nal u
se o
nly
Auditor’s responsibilities for the audit of the financial report
Our objectives are to obtain reasonable assurance about whether the financial report as a whole is freefrom material misstatement, whether due to fraud or error, and to issue an auditor’s report that includesour opinion. Reasonable assurance is a high level of assurance, but is not a guarantee that an auditconducted in accordance with the Australian Auditing Standards will always detect a materialmisstatement when it exists. Misstatements can arise from fraud or error and are considered material if,individually or in the aggregate, they could reasonably be expected to influence the economic decisionsof users taken on the basis of the financial report.
A further description of our responsibilities for the audit of the financial report is located at the Auditing and Assurance Standards Board website at: http://www.auasb.gov.au/auditors_responsibilities/ar1.pdf This description forms part of our auditor’s report.
Report on the remuneration report
Our opinion on the remuneration report
We have audited the remuneration report included in pages 38 to 62 of the directors’ report for the yearended 30 June 2017.
In our opinion, the remuneration report of carsales.com Limited, for the year ended 30 June 2017complies with section 300A of the Corporations Act 2001.
Responsibilities
The directors of the Company are responsible for the preparation and presentation of the remunerationreport in accordance with section 300A of the Corporations Act 2001. Our responsibility is to express anopinion on the remuneration report, based on our audit conducted in accordance with AustralianAuditing Standards.
PricewaterhouseCoopers
Anton LinschotenPartner
Melbourne8 August 2017
ANNUAL REPORT 2017 CARSALES.COM LIMITED 119F
or p
erso
nal u
se o
nly
The shareholder information set out below was applicable as at 10 July 2017.
There were 274 holders of less than a marketable parcel of ordinary shares. There were no redeemable preference shares or convertible notes outstanding.
SHAREHOLDER INFORMATION30 JUNE 2017
ANNUAL REPORT 2017 CARSALES.COM LIMITED120F
or p
erso
nal u
se o
nly
B. Equity security holdersTwenty largest quoted equity security holdersThe names of the 20 largest holders of quoted equity securities are listed below:
Ordinary shares
Name Number heldPercentage of issued shares
HSBC Custody Nominees (Australia) Limited 75,651,623 31.3J P Morgan Nominees Australia Limited 31,069,325 12.8BNP Paribas Nominees Pty Ltd <Agency Lending DRP A/C> 15,634,242 6.5National Nominees Limited 14,908,236 6.2Citicorp Nominees Pty Limited 14,880,269 6.1Clear-Way Investments Pty Ltd <The James Family A/C> 10,993,662 4.5BNP Paribas Noms Pty Ltd <DRP> 3,579,372 1.5Essena Pty Ltd 3,281,284 1.4AMP Life Limited 2,329,379 1.0Billkaren Pty Ltd <Robinson Family A/C> 2,250,000 0.9Four Us Pty Ltd 1,926,555 0.8Citicorp Nominees Pty Limited <Colonial First State INV A/C> 1,908,559 0.8Steven Kloss Pty Ltd <Kloss Family A/C> 1,787,000 0.7Gregory Paul Roebuck 1,605,347 0.7Kilienz Pty Ltd <PW & AE Aitken Family A/C> 1,240,000 0.5Mr Andrew Gajtan Curmi 1,160,500 0.5RBC Investor Services Australia Nominees Pty Ltd <Bkmini A/C> 1,133,342 0.5Mrs Anne Beirne 1,000,000 0.4Milton Corporation Limited 995,000 0.4Australian Foundation Investment Company Limited 790,000 0.3
188,123,695 77.8
Number on issue
Number of holders
Options and performance rights issued under the carsales.com Ltd Employee Option Plan to take up ordinary shares 2,672,376 94
ANNUAL REPORT 2017 CARSALES.COM LIMITED 121F
or p
erso
nal u
se o
nly
C. Substantial holderSubstantial holder in the Company is set out below:
Number held PercentageYarra Capital Management 16,166,023 6.7
D. Voting rightsThe voting rights attaching to each class of equity securities are set out below:
(a) Ordinary sharesOn a show of hands every member present at a meeting in person or by proxy shall have one vote and upon a poll each share shall have one vote.
(b) OptionsNo voting rights.
SHAREHOLDER INFORMATION CONTINUED30 JUNE 2017
ANNUAL REPORT 2017 CARSALES.COM LIMITED122F
or p
erso
nal u
se o
nly
CORPORATE DIRECTORY
DirectorsJeffrey Browne(Non-Executive Chair)
Greg Roebuck(Managing Director and CEO) (Retired 17 March 2017)
Cam McIntyre(Managing Director and CEO) (Appointed 17 March 2017)
Richard Collins(Non-Executive Deputy Chair)
Wal Pisciotta OAM(Non-Executive Director)
Pat O’Sullivan(Non-Executive Director)
Kim Anderson(Non-Executive Director)
Edwina Gilbert(Non-Executive Director)
Steve Kloss(Alternate Non-Executive Director)
Company secretaryNicole Birman
Registered officeLevel 4, 449 Punt Road Richmond Vic 3121 T +61 3 9093 8600 F +61 3 9093 8697 carsales.com.au
Share registryComputershare Ltd 452 Johnston Street Abbotsford Vic 3067 T +61 3 9415 4000 F +61 3 9473 2500 computershare.com