136


CONTENTSAbout Antonoil 4
Financial Summary 10
Financial Highlights 12
Chairman’s Statement 14
Corporate Milestones 18
Corporate Information 20
Management Discussions and Analysis 22
Directors’ Report 42
Profiles of Directors and Senior Management 53
Corporate Governance Report 56
Employee Relations 68
Investor Relations 70
Independent Auditor’s Report 71
Balance Sheets 73
Consolidated Income Statement 75
Consolidated Statement of Comprehensive Income 76
Consolidated Statement of Changes in Equity 77
Consolidated Cash Flow Statement 78
Notes to the Consolidated Financial Statements 79

THE BEST INDEPENDENTCHINESE OILFIELD SERVICES PARTNER,
THE BEST CHINESE PARTNER WORLDWIDE

ABOUT ANTONOIL
4 Anton Oilfield Services Group
Anton Oilfield Services Group (“Antonoil” or the
“Company” and, together with its subsidiaries,
the “Group”) is a leading independent
integrated oilfield services provider. The Group
provides products and services for the entire
process of oil and gas development and
production, including reservoir management,
drilling technology, well completion, down-hole
operations, oil production as well as tubular
service. With its comprehensive product lines
and integrated service capacity, the Group is
empowered to help oil companies solve the
challenges they encounter in oil and gas fields
such as increasing production, improving
drilling efficiency, lowering costs and
optimizing waste management. Its fast growth
benefits from the accelerating development
of natural gas in China and the Group’s
increased presence in the overseas markets.
The Group’s strategic objective is to become a
leading global oilfield services provider with a
solid foothold in China.
The Group is headquartered in Beijing and has
established an international network across
the global markets. In China, the markets
cover the Tarim area, Erdos area, Southwest
area and other areas of China, whereas,
the overseas markets include Iraq and other
Middle East market, Central Asia and Africa
market and the Americas market. Antonoil is
the best independent Chinese oilfield services
partner, the best Chinese partner worldwide.

About Antonoil
Annual Report 2013 5
THE BEST INDEPENDENT CHINESEOILFIELD SERVICES PARTNER,
THE BEST CHINESE PARTNER WORLDWIDE
TraditionalCulture
ModernChina
GlobalStandards
Antonoil promotes corevalues built on traditional
oriental culture and iscommitted to offering the best service experience
for customers
Antonoil is based inChina and develops
its core competenciesby firmly grasping the
advantages andopportunities arising
in modern China
Antonoil follows globalstandards and
possesses rich serviceexperience overseas

About Antonoil
6 Anton Oilfield Services Group
BUSINESS
The business of the Group is classified into two major segments, namely oil and gas field development technical services and tubular services. Oil and gas field development technical services refer to the solutions provided to and implemented for oil companies to help them complete oil and gas field development and enhance production and reduce costs against various technical problems in the wellbore during the drilling, completion and production stages of field development; and tubular services refer to the services and products provided to the customers in respect of the use of oil tubular goods (drilling tools, tubing and casing), including technical services such as testing, repair, coating and leasing, and production and sale of tubular goods.
The profit centers of the Group are based on the business clusters and the Group reports its results based on four clusters including drilling technology cluster, well completion cluster, down-hole operation cluster and tubular services cluster. The services and products of drilling technology cluster, well completion cluster and down-hole operation cluster belong to oil and gas field development technical services. Each business cluster is detailed as follows:
DRILLING TECHNOLOGY CLUSTER
Drilling technology cluster provides engineering technical services and products during the drilling stage to solve problems encountered in directional drilling, drilling assessment, drilling acceleration, enhanced reservoir contact and integrated drilling. The Group is a leading drilling technical service provider in China and its services include directional drilling, drilling fluids, integrated drilling and rig services.
Directional drilling
It is operated by the engineers who make the drilling tool set drilling wellbores along the pre-set path to enhance the oil and gas recovery rate by reaching the best position in the reserves. The Group is a leading directional drilling service provider in China and its services include directional drilling technology, sidetracking drilling technology and steerable drilling technology which can complete directional wells (which deviate from a certain angle relative to vertical wells) and horizontal wells (which are the sections vertical or almost vertical to the vertical well sections in the boreholes) in various complicated environments such as HTHP and thin payzones and measure the position
and direction of the drilling tool set on a real time basis through the attached measure tool to adjust the drilling process and track the borehole path leading to the pre-set target. It also collects the information of interval lithology through the attached measuring tool to identify the strata, and oil, gas or water and interface, judge strata change, estimate the path on the payzone and reduce the drilling cycle. The sidetracking drilling technology of the Group is an effective means to enhancing production and recovery rate, especially for the producing wells with decreasing yield and abandoned wells to resume production. The steerable drilling technology of the Group is a directional drilling technology which can enhance reservoir contact and yield per well. It includes rotary steerable drilling technology and geological steerable drilling technology and can optimise wellbore path, protect oil and gas reserve, enhance reservoir contact and drilling efficiency and reduce operational risks and the drilling costs. It is particularly effective for complicated reserve, thin payzones, long horizontal wells and highly deviated wells.
Drilling fluid
It is circulation medium used in oil and gas wellbores during the drilling process. Drilling fluid is also called mud, whose basic functions include: carry and suspend debris, stabilize borehole wall and balance the formation pressure, cool and lubricate drilling bits and tools, transfer hydrodynamic force, protect reservoir and environment etc. Drilling fluid includes conventional water-based drilling fluid and high-end oil-based drilling fluid. The Group signed strategic cooperation agreement with Magcobar, a world-renowned drilling fluid services company to provide oil-based drilling fluid services to customers. The Group has a team of senior drilling fluid technical experts, oil-based mud station, R&D center and the mud materials plant with first class equipment, providing customers with integrated services including drilling fluid on-site services, drilling fluid technology R&D, technical research and design, and sales services.
Integrated drilling
It is the single well general contracting and block general contracting service for oil companies. The Group has accumulated its technologies for several years and it is equipped with the strength to provide integrated drilling services to oil companies. Its services include project management, project general contracting, project supervision and single drilling

About Antonoil
Annual Report 2013 7
technical services. During provision of integrated services, the Group will be responsible for providing oil companies with a series of services and products as necessary for oil and gas field devopment. The Group made a further move with the integrated service strategy as it formed a joint venture company with Schlumberger, known as Tongzhou IPM (TIPM), to provide integrated project management (IPM) services to China’s onshore oil and gas fields. The service model has the benefit of achieving production increase and cost savings through end-to-end management of oil and gas exploration and development, from project design, resource allocation to project implementation, and integrating individual services into the entire process. It targets to apply in large-scale integrated projects such as multiple well integrated projects, block integrated projects, as well as ultra complex wells, shale gas wells, sub-contract blocks, etc.
Rig services
Completion of well drilling services with rig operation, includes completion of well drilling services with rigs directly held by the Group and completion of well drilling services by managing the rigs owned by our partners.
WELL COMPLETION CLUSTER
Well completion is the technique which connects wellbores and reserves after drilling, thus completing the preparation works as necessary for wellbore completion and oil production. Whether a well can achieve maximum oil and gas production in an economical way to a large extent depends on the well completion technique used for that well. A successful well completion can optimise oil production efficiency, protect the reservoir and extend the life of the oil and gas production capacity. The Group is a leading well completion technical service and tool provider in China, which provides technical services and products to solve various technical problems experienced by oil companies during well completion stage. It designs well completion solutions and techniques comprised of various well completion tools for different formations and reservoirs, thus completing the preparation works as necessary for wellbore completion and oil production. Its services include well completion integration, screen well completion, gravel packing completion and oil production tools.
Well completion integration
This business includes technical services for reservoir completion and well completion tools to solve various technical problems during open hole well completion and casing well completion. The Group is a leading well cementing and completion technical service and tool provider in China and its services and products include integrated well completion solution design and service, well cementing and completion pipe string and ancillary tool technology, well cementing and completion tools such as liner hangers/staged hydraulic cement injection machines/sliding sleeves/float collars/float shoes, and swellable packers/thermostable anti-corrosion packers/ external casing packers.
Screen well completion
It is a sand prevention technique used for wellbores in unconsolidated formations against aggregates in reservoirs during well completion with a view to minimising the effect of piling aggregates, that is, reduction or suspension in production, and enhancing oil and gas well production and extending the life of production. The Group is a leading screen well completion service and tool provider in China and is equipped with the most comprehensive series of screen well completion technologies and tools able to be used in vertical wells and horizontal wells. The screen well completion tools of the Group include composite screens, punched slotted screens, sand screens, pack screens, wire wrapped screens, slotted screens and innovative water control screens.
Gravel packing well completion
Gravel packing is also a sand prevention and production enhancement technique used, during well completion, in unconsolidated formations, the reserves seriously affected by aggregates, and thick but water-resistant reserves, especially effective for sand control and heavy oil production enhancement. The Group is a leading gravel packing well completion service and tool provider in China and owns leading gravel packing well completion technologies and tools able to be used in cased and open holes. The gravel packing well completion services offered by the Group includes fracturing packing well completion service and tool, and cyclic packing well completion service and tool.
About Antonoil
8 Anton Oilfield Services Group
Oil production tools
The Group provides oil companies with anti-corrosion and wear-resistant oil production tools such as couplings, sucker rods, pressure-regulating water injection pumps and regular pumps. Compared with the traditional oil production tools, the oil production equipment used by the Group are more adaptable to complicated well conditions and more durable.
DOWN-HOLE OPERATION CLUSTER
Down-hole operation cluster provides oil companies with engineering technical services and products during the well completion and oil production stages. It develops oil and gas fields and optimises production through down-hole operation. The Group is a leading down-hole operation technical service provider in China and its down-hole operation cluster includes production enhancement operation, coiled tubing operation, pressure pumping, tubular helium testing and oil production technologies.
Stimulation operation
It includes acidizing and fracturing stimulation technologies and various featured stimulation technologies, which are mainly used for the development of low pressure or low permeability reservoirs to enhance their production and recovery rate, especially applicable to the development of tight gas and shale gas. The Group is a leading acidizing and fracturing technical service provider in China and can complete highly challenging operations. Its services include horizontal well multistage fracturing, HTHP well fracturing, vertical well multistage fracturing, horizontal well plugging removal, and gas propulsion perforation. The stimulation technologies of the Group have been successfully used in conventional natural gas and tight gas development. With its established and well-recognized brand, the Group’s technologies are also promoted for shale gas development.
Coiled tubing operation
Coiled tubing refers to jointless piping spooled on a reel to be used for oil and gas well interventions when stretched. Coiled tubing operation is a special operation which continuously inserts small-sized coiled tubing into the wells in order to carry out various operations for well development. Compared with the traditional operation, coiled tubing operation can be used in drilling, completion and oil production with many benefits. For example, it is time saving, flexible in pumping, accurate to position fluids and does fewer damage to the formation and safe in operation. The Group is a pioneer in coiled tubing operation technologies in China and its services include coiled tubing sandblast, gas lift, dripping, acidizing, hydro jet, dewatering gas production, plug milling, casing fracturing and other featured coiled tubing applications.
Pressure pumping
It harnesses the hydraulic horsepower (HHP) of the pressure pumping equipment and other related operational capabilities to help clients implement pressure pumping design and solutions of varying scales, with the benefit of expanding the permeability of oil and gas reservoirs and improving production capacity. Pressure pumping has become the necessary measure to developing unconventional oil and gas reservoirs.
Tubular helium testing
It is a technology which uses the mixed gas of helium and nitrogen to test tubing threaded connector against helium leak in the natural gas wells, thus solving the problem of helium connector leak. It is important to guarantee production safety of high pressure wells, sulfur-rich wells and key natural gas wells. The Group is a leading tubular helium testing technology provider in China and also sets the industrial standard. It is promoting the tubular helium testing technology to the surface facilities of natural gas fields and underground gas storage facilities from conventional natural gas wells.

About Antonoil
Annual Report 2013 9
Oil production technology
It provides oil companies with engineering technical services and products during oil production stage. The oil production technical services of the Group include EOR, water plugging, well flushing and gas lift services. It helps oil companies solve the technical problems during oil production and enhance production and recovery rate through various operations. The services have been extended to operations and management services, including wellhead management, oil and gas gathering & transport management, central processing facility management.
TUBULAR SERVICE CLUSTER
It provides services and products in respect of tubulars including drilling tools, tubing and casing for oil companies and drilling companies. It includes technical services such as tubular testing, repair, coating and leasing, and production and sale of tubular goods.
Tubular technical services
It includes multistage testing and whiting for drilling tools, drilling tool wear-resistant belt welding, repair of drilling tools, casing and tubing, coatings for drilling pipes and tubings, and leasing of drilling tools. The Group is a leading tubular technical service provider in China and has extensive and leading tubular testing service capability and comprehensive tubular repair service capability.
The Group invested in Northern Heavy Anton Machiney Manufacturing Co., Ltd, which provides the production and sale of heavy-weight drilling pipes, drilling collars, ordinary drilling pipes and processing and sale of tubing and casing.

FINANCIAL SUMMARY
10 Anton Oilfield Services Group
CONDENSED CONSOLIDATED INCOME STATEMENTS
For the year ended 31 December
2009 2010 2011 2012 2013RMB (’000)
Revenue 690,030 950,715 1,258,909 2,004,583 2,533,536
Other gains/(losses), net 3,748 575 2,155 10,646 19,950
Operating costs (656,287) (805,874) (1,086,209) (1,617,250) (1,981,130)
Operating profit 37,491 145,416 174,855 397,979 572,356
Finance (costs)/income, net 1,801 (2,697) (16,094) (30,610) (72,678)
Profit before income tax 38,331 142,295 112,517 367,369 489,977
Profit for the year 37,606 125,926 91,668 317,705 403,138
Attributable to:Equity holders of the Company 32,020 116,655 77,344 302,579 382,568
Non-controlling interests 5,586 9,271 14,324 15,126 20,570
Dividends 18,000 39,400 35,700 97,600 119,953
Earnings per share for profit
attributable to the equity holders ofthe Company during the year(expressed in RMB per share)
Basic 0.0153 0.0557 0.0369 0.1430 0.1779
Diluted 0.0153 0.0557 0.0365 0.1402 0.1733

Financial Summary
Annual Report 2013 11
CONDENSED CONSOLIDATED BALANCE SHEETS
As at 31 December
2009 2010 2011 2012 2013
RMB (’000)
Assets
Non-current assets 723,685 844,067 956,922 1,378,551 2,100,954
Current assets 1,067,795 1,346,847 1,540,698 2,214,283 3,866,898
Total Assets 1,791,480 2,190,914 2,497,620 3,592,834 5,967,852
Total Equity 1,546,079 1,650,561 1,740,097 2,080,954 2,375,297
Liabilities
Non-current liabilities 2,479 2,150 15,804 303,286 1,984,305
Current liabilities 242,922 538,203 741,719 1,208,594 1,608,250
Total liabilities 245,401 540,353 757,523 1,511,880 3,592,555
Total equity and liabilities 1,791,480 2,190,914 2,497,620 3,592,834 5,967,852
Net current assets 824,873 808,644 798,979 1,005,689 2,258,648
Total assets less current liabilities 1,548,558 1,652,711 1,755,901 2,384,240 4,359,602

FINANCIAL HIGHLIGHTS
12 Anton Oilfield Services Group
REVENUE BREAKDOWN BY REGION

Financial Highlights
Annual Report 2013 13
REVENUE BREAKDOWN BY BUSINESS CLUSTERS

CHAIRMAN’S STATEMENT
14 Anton Oilfield Services Group
Chairman’s Statement
Annual Report 2013 15
Dear Shareholders,
In 2013, Antonoil continued to maintain steady growth despite moderate financial results. However, we are happy to report that we made sound progress on our integrated-service strategy and also established a globalized regional marketing network.
In the domestic market, our major clients shifted their focus more towards returns from their operations, which led to the adjustment of our market. Therefore, although the investment in the upstream sector remained stable without decreasing, the structure of our clients’ CAPEX spending changed due to their shift of focus, causing the delays in certain projects. As a result, our business was temporarily affected. The shift, nevertheless, is believed to be bringing more transparency and openness to the industry in the long run. From our perspective, this industry transformation does present challenges but it also entails opportunities.
In 2013, we accomplished two major initiatives which were built on our strategies embarked on two years ago. First is our product line development, whereby we stepped up our efforts in the development of integrated services. In 2013, we successfully built up and met our initial target of pressure pumping equipment and rig equipment service capacity so that we can now boast a truly integrated product line to cover our markets with more products. The other initiative is with regard to our market layout. In 2013, we implemented a regionalization strategy for all global key markets. The domestic and overseas markets were divided into seven regional companies, a strategy that enabled us to focus on the key markets while ensuring comprehensive market coverage.
The success in building our integrated products and focused coverage of global key markets prepared Antonoil for the necessary service capacity and organizational structure expected from a leading global oilfield services company with a solid foothold in China. We’re thus well positioned to capture the industry boom once the industry transformation completes. We are fully confident of achieving sustainable high-speed growth.
REVIEW
Antonoil’s overall performance in 2013 maintained steady growth even factoring in the impact from industry transformation. We recorded revenue of RMB2.53 billion, an increase of 26.4% from 2012. In the domestic market, building of production capacity in major gas basins accelerated because of the requirements from environmental protection and national energy policies. Shale gas development made breakthroughs and showed a positive momentum. We continued to persist in our natural gas strategy in 2013 and our domestic business grew 25.8% from 2012, as we closely focused on the demand for natural gas development in Tarim Basin, Erdos Basin and Sichuan Basin. In the overseas market, robust demand came from our two key markets, Iraq and South America. Antonoil not only consolidated its position and market share among the Chinese clients, we also secured national and international oil companies as our new clients in the Middle East and South America, driving a 28.4% growth in our overseas business from 2012.
In 2013, each of our business clusters continued to grow. In response to clients’ demand for stimulation and drilling acceleration, we introduced multiple new technologies and, by successfully promoting them into wide applications, new technologies continued to drive our revenue growth. In 2013, our regular service capacity reached phased targets, with 51,200 hydraulic horsepower of additional pressure pumping service capacity, and seven drilling rigs newly purchased. All delivered equipment was quickly deployed for use. Meanwhile, we introduced more reservoir analysis and geological research professionals with a view to strengthening our reservoir technology capability. All these developments helped further improve our integrated service model.
In 2013, net profit attributable to equity holders of the Company amounted to RMB380 million, up 26.4% from last year. Net profit margin attributable to equity holders of the Company maintained a stable level of 15.1%. The fact that our profitability remained sound and steady amid the industry transformation indicates that our high-growth profit model is sustainable.

Chairman’s Statement
16 Anton Oilfield Services Group
For Antonoil to realize its long-term growth, 2013 witnessed a year of our concentrated effort to prepare for both human and capital resources. As for talent, on one hand, we increased our efforts to hire more industry leading professionals; on the other hand, we recruited more graduate hires and set up a fast-track training mechanism so as to create a larger talent pool. As for capital, we broadened our financing channels both at home and abroad, including the successful inaugural issuance of US$250 million senior notes, greatly enlarging our capital reserve.
As our business grows rapidly, QHSE has become a critical management focus which calls for our close attention. In 2013, our Board set up a QHSE Committee and recruited QHSE professionals with international experience. The management system for quality, health, safety and environment based on internationally accepted standards has now taken shape.
Through our full preparations in 2013, Antonoil consolidated its advantages in areas such as an integrated product line, R&D capabilities in new technologies, talents as a core competency, QHSE management based on international standards, and brand influence. We are ready to fully embrace both opportunities and challenges.
OUTLOOK
Looking ahead into 2014, domestically, oil companies are actively pushing forward the opening up of the market in response to the call for market-based reform. Under the guidance of the national energy strategy, oil companies are increasing their investments to actively push ahead shale gas exploration and development as well as to start pilot projects for tight oil development. All these developments present unprecedented growth opportunities especially to independent oilfield service companies. In the overseas market, robust demand in our target markets translates into tremendous opportunities as well. Meanwhile, challenges exist because of increased competition brought by the opening up of the domestic market, political uncertainties in the overseas market and the cost pressure confronted by the Group.

Chairman’s Statement
Annual Report 2013 17
In 2014, Antonoil will aggressively promote our brand as “the Best Independent Chinese Oilfield Services Partner, the Best Chinese Partner Worldwide”. We will make every effort to accomplish full product coverage and comprehensive market coverage, requiring us to ensure every market to have as full service coverage as possible, and to introduce as many products as possible to each of our markets. In 2014, we shall continue to improve our existing market layout, strengthen our marketing efforts, and strive to take part in all tendering opportunities in each key market to increase our influence. Meanwhile, we will further implement our integrated-service strategy, make moderate investment in equipment that sees strong demand, and accelerate the introduction of asset-light products in a bid to synergize with our equipment so that we can broadly meet the market demand.
Under the new market environment, our clients release their tenders in earlier time than before, allowing us to have a better visibility of market opportunities. As a result, we can foresee a bigger project pipeline than previous years, and order visibility is also higher than any previous year. With our order backlog continuing to increase, the most important task for Antonoil is to enhance the level of our quality management during production to truly realize “the Best” brand of ours.
To Antonoil, 2014 is the first year after our clients made their adjustment. In the beginning, we may still be subject to the impact from last year caused by the shift. Later in the year, it is believed that our full preparation for the adjustment and the strong order opportunities will let us gradually recover, so that we will eventually emerge from the transformation by 2014 and establish ourselves as a stronger company to embrace a new round of industry development.
APPRECIATION
On behalf of the Board of Directors, I would like to express my heartfelt thanks to our customers, employees, business partners and shareholders. It is owing to your long-standing trust and support that Antonoil has been able to find tenacity and strength to achieve next step of growth in each of our development stages. In 2014, we are fully committed to building our brand as “The Best Independent Chinese Oilfield Services Partner, the Best Chinese Partner Worldwide”.
ChairmanLUO Lin
18 March, 2014

CORPORATE MILESTONES
Annual Report 201318 19Anton Oilfield Services Group
Corporate Milestones
5 8
1 7 9
11 12
JANUARYThe Board established QHSE Committee
MAYFirst self-owned drilling unit made a
successful spud in Sichuan Basin
AUGUSTThe onboarding of graduates marked the sixth consecutive year of massive
hiring campaign for young talents
DECEMBERAugmented third-party rig management and expanded rig sources
JULYFiber-diverting volume fracturing service jointly offered with Schlumberger achieved pioneering success in Tarim basin
SEPTEMBERAnnounced renewal of strategic cooperation agreement with Schlumberger for a term of three years, strengthening strategic cooperation between both companies
NOVEMBERSuccessfully completed inaugural
US$250M senior notes issue
Newly launched coiled tubing-conveyed resettable packer multistage fracturing technology won batch order in Erdos basin, marking its large-scale application
Entered international oil company market in Iraq, signing coiled tubing and acidizing technical service contract in a new project in southern Iraq

CORPORATE INFORMATION
Annual Report 201320 21Anton Oilfield Services Group
BOARD OF DIRECTORS
Executive Directors
Mr. LUO LinMr. WU DiMr. LIU Enlong
Non-executive Director
Mr. Jean Francois POUPEAU
Independent Non-executive
Directors
Mr. ZHANG YongyiMr. ZHU XiaopingMr. WANG Mingcai
AUDIT COMMITTEE
Mr. ZHU Xiaoping (Chairman)Mr. ZHANG YongyiMr. WANG Mingcai
REMUNERATION COMMITTEE
Mr. WANG Mingcai (Chairman)Mr. ZHU XiaopingMr. LUO Lin
NOMINATION COMMITTEE
Mr. ZHANG Yongyi (Chairman)Mr. WANG MingcaiMr. LUO Lin
QHSE (“QUALITY, HEALTH, SAFETY
AND ENVIRONMENT”) COMMITTEE
Mr. Jean Francois POUPEAU (Chairman)Mr. LUO LinMr. LIU Enlong
AUTHORIZED REPRESENTATIVES
Mr. LUO LinDr. NGAI Wai Fung
COMPANY SECRETARY
Dr. NGAI Wai Fung (FCIS, FCS (PE), CPA, FCCA)
COMPANY’S WEBSITE
www.antonoil.com
INVESTOR RELATIONS HOTLINE
+86 10 57397584+852 29077108email: [email protected]
PRINCIPAL PLACE OF BUSINESS IN HONG
KONG
Unit 2109, Cosco Tower183 Queen’s Road CentralCentralHong Kong
PRINCIPAL PLACE OF BUSINESS IN PRC
No. 8, Pingcui West Road, DonghuquChaoyang DistrictBeijing, China 100102
REGISTERED OFFICE
PO Box 309, Ugland HouseGrand Cayman KY1-1104Cayman Islands
PRINCIPAL SHARE REGISTRAR AND
TRANSFER OFFICE
Royal Bank of Canada Trust Company (Cayman) Limited4th Floor, Royal Bank House24 Shedden Road, George TownGrand Cayman KY1-1110Cayman Islands
HONG KONG BRANCH SHARE REGISTRAR
AND TRANSFER OFFICE
Computershare Hong Kong Investor Services LimitedShops 1712-1716, 17th FloorHopewell Centre183 Queen’s Road EastWanchaiHong Kong
AUDITORS
PricewaterhouseCoopersCertified Public Accountants
LEGAL ADVISERS
as to Hong Kong and U.S. law:Sidley Austin
as to PRC law:Tian Yuan Law Firm
as to Cayman Islands law:Maples and Calder
PRINCIPAL BANKS
Bank of BeijingThe Royal Bank of Scotland plcChina Merchants Bank
STOCK CODE ON MAIN BOARD OF THE
STOCK EXCHANGE OF HONG KONG
LIMITED
3337
DATE OF LISTING
14 December 2007

In 2013,the Groupcontinued togain steadygrowth
MANAGEMENT DISCUSSIONS AND ANALYSIS
22 Anton Oilfield Services Group
BUSINESS REVIEW
China’s Natural Gas Production Capacity
Building Continued, Unconventional Oil and
Gas Development Showed Momentum
China’s natural gas market witnessed continued growth in 2013 and profound reforms in the industry were underway. Driven by factors such as the national economic growth, conscious efforts to improve energy mix and combat smog in the cities, China’s natural gas consumption registered a double-digit high growth, becoming the third largest natural gas consumer in the world last year. According to data from the Ministry of Land and Resources, the country’s natural gas output continued to grow in 2013, with annual output surpassing 100 billion cubic meters for three years in a row. Growth rate of the domestic natural gas demand, however, outpaced that of domestic production, leading to severe demand-supply constraints and forcing China to increase its imports. China’s natural gas dependence has for the first time exceeded 30 percent in 2013, according to Ministry of Land and Resources. How to accelerate production capacity
building for domestic resources and step up exploration efforts to ensure energy security is becoming one of the major factors governing China’s national energy policy.
Against this backdrop, China’s conventional gas production capacity building continued to move ahead last year. Tarim Basin, Erdos Basin and Sichuan Basin, the three major gas basins, all accelerated their pace of capacity building and production. Tarim Basin, relying on the technology to add proven reserves and increase production, saw the output from its major natural gas field rising steadily. Erdos Basin saw its primary oil and gas field’s production reaching 50 million tons of oil equivalent, successfully building itself into “Daqing of Western China”. Sichuan Basin achieved major strides in natural gas exploration in its central region and discovered China’s largest monomer marine uncompartmentalized natural gas reservoir, according to the Ministry of Land and Resources. Meanwhile, domestic conventional oil and gas resources are dominated by ultra-deep or low-permeability low-grade resources, making them more difficult and costly to extract and, therefore, stimulating demand for technologies to improve drilling efficiency and production.

Annual Report 2013 23
Management Discussions and Analysis
As of unconventional gas, several large-scale shale gas projects were formally kicked off in 2013. Production target for the shale gas also became clearer. Wells with high production emerged one after another thanks to the technological advancement and breakthroughs made earlier, indicating that China’s shale gas development is on a sound footing and momentum. Meanwhile, National Energy Administration released the Shale Gas Industry Policy in 2013, calling for stepped-up fiscal support for the industry and encouraging local governments to subsidize shale gas producers and to exempt or reduce tax for shale gas production companies. The policy paper, which also encourages all types of investors to enter the shale gas market, will boost the development and utilization of shale gas.
Liberalization of the oil and gas industry is being realized at an accelerating pace. In 2013, the government introduced many concrete and specific measures to accelerate the energy reform. For example, the State Council, in its 12th Five-Year Plan for Energy Development, clearly states that it will encourage the diversification of the energy investment, with a view to attracting private capital into energy field that is not explicitly prohibited by the law and regulations. National Development and Reform Commission said clearly that it will push forward the natural gas pricing reform, demanding the gradual establishment of a pricing mechanism that can truly reflect the demand and supply in the market and the scarcity of resources. The Third Plenum of 18th Chinese Communist Party’s Congress stressed that market should play a decisive role in resource allocation, driving state-owned oil companies to open up their internal markets while at the same time encourage them to explore external markets. The spirit of the Third Plenum also encourage oil companies to expand joint-venture (JV) cooperation, bringing in non-state capital including private and social capital to forge JVs and cooperation, as well as to promote cooperation and development of such areas as undeveloped reserve and shale gas. Stimulated by the policies mentioned above, the traditional oil and gas industry landscape is being gradually reshaped, allowing more room for private companies with vitality and innovation to play a better role, and private companies with established scale and reputation are quickly becoming mainstream players.
Chinese Investors Stepped up Overseas
M&A and Investment, International Oil & Gas
Cooperation Became More Active
Guided by the goal of ensuring energy security, the Chinese government encouraged Chinese investors to continue deepening the “Go Out” strategy on one hand, and on the other, facilitated large energy international cooperation in an innovative way, a strategy that has increased China’s influence in the global energy governance arena. As a result, China investors entered another year of aggressive overseas expansion in 2013.
In 2013, Chinese investors conducted a flurry of overseas M&A, acquiring assets in places as far from Middle East’s Iraq to South America, North America, Central Asia and Africa. Chinese investors also achieved success in bidding for world’s large-sized oil and gas fields last year. Demand for follow-up exploration and development activities will likely increase. Meanwhile, production capacity building for Chinese investors’ existing projects advanced steadily last year and some of the large-scale projects even realized phased production capacity building target well ahead of schedule, rapidly marching towards even bigger production capacity level.
In 2013, China conducted international oil and gas cooperation with many countries whose oil and gas output is among the fastest-growing ones in the world. Owing to lack of operation capability, those countries badly need technology to complement their existing ones in order to increase their declining oil production and drill for newly increased resources, providing immense new market potential for China’s oilfield service companies.
As Chinese investors expanded investment in up-stream assets, China’s oilfield service providers also established a more important position in the global market. As China’s oilfield service companies’ competitiveness in the overseas market gradually began to be noticed through their quality service and cost advantage, national oil companies and international oil companies, during exploration and development of their projects and in the process of building a global supply chain, have realized the advantage and importance of Chinese partners, and are now actively seeking reliable and reputed Chinese oilfield service providers to become their long-term partners, offering an important opportunity for well-established and competitive Chinese oilfield service companies.

Management Discussions and Analysis
24 Anton Oilfield Services Group
Business Performance
Recognizing the increasing demand and capacity for natural gas and the gradual opening-up on the upstream of the industry in China and in the context of Chinese investors intensifying investment overseas and the global oil and gas industry stepping up its efforts to cooperate with Chinese companies, the Group, as China’s leading independent oilfield technical services provider, is quickening the pace to leverage its unique advantages. It strives to create the best service experience for its clients in each target market and introduces products and services catering to the market demand. During 2013, the Group continued to gain steady growth.
In 2013, the Group’s total revenue amounted to RMB2,533.5 million, representing an increase of RMB528.9 million, or 26.4%, from RMB2,004.6 million in 2012. The revenue growth was mainly attributable to the Group’s continued expansion in the domestic natural gas market and strong demand from overseas markets for the Group’s business.
In 2013, the Group’s operating profit reached RMB572.4 million, an increase of RMB174.4 million, or 43.8%, from RMB398.0 million in 2012. Net profit was registered at RMB403.1 million, an increase of RMB85.4 million, or 26.9% from RMB317.7 million in 2012. Profit attributable to equity holders of the Company amounted to RMB382.6 million, an increase of RMB80.0 million, or 26.4%, from RMB302.6 million in 2012. Net profit margin attributable to equity holders of the Company was 15.1%, flat with 15.1% in 2012. The Group was able to maintain healthy profitability thanks primarily to economies of scale from rapid business growth, stable gross profit margin and the resulting dilution of sales and administrative expenses ratio.
As the Group completes building its footprint in high-growth markets of oil and gas globally, it further implemented a regional strategy for key markets in 2013 to offer products and services suited to the local needs on the basis of studying each individual market’s own features and characteristics in terms of geology, well depth, penetration rate, oil reservoir characteristics and the differences in terms of client composition and management model, and market features, with an objective to grow its local influence and increase its market penetration.
In 2013, revenue of the domestic market saw 25.8% growth over the previous year. The successful implementation of the regional strategy has further
accelerated the Group’s business growth in the three basins. In the Tarim Basin, the Group actively deployed new technologies to address formidable challenges on drilling optimization and stimulation in ultra-deep wells to the greater benefit of the clients. In the Erdos Basin where the client base is diverse, the Group continued to roll out a host of horizontal well multistage fracturing technologies targeting low permeability, low yield wells to meet the client need for fast production increase. In particular, the application of the new coiled tubing multistage fracturing technology was a remarkable success. Meanwhile, pressure pumping service capability was deployed by the Group and was put swiftly into operation in the region. In the Sichuan Basin, a large number of large-scale shale gas projects officially kicked off. In response to the fast-emerging local demand for shale gas development services, the Group has already entered major markets of shale gas development and contributed a variety of critical new technical services and fracturing equipment services.
The revenue of overseas market recorded 28.4% growth over the previous year. The Group made encouraging progress on implementing its “follow-up” strategy in the overseas market, and continued to strengthen the services coverage for the overseas projects of Chinese investors in 2013. In the Middle East, the Group responded to the lack of local technical expertise and increased its provision of required technical services and helped to build local production capacity. Thanks to the brand recognition the Group has garnered through many years of high-quality services in overseas projects, the Group started to gradually move beyond the “follow-up” strategy. In 2013, the Group’s overseas business entered for the first time projects of national oil companies and international oil companies. In South America, production capacity recovery was a key theme across countries. Local expertise and human resources fell short of the requirements. After two years of laying the groundwork by introducing more talents and required services, the Group has already established a strong presence on the ground and turned this area a new growth driver of its overseas business.
The Group continued to move ahead with the implementation of the integrated service strategy. In 2013, through greater investment in pressure pumping equipment and rigs, the Group significantly enhanced its regular services capacity and further enriched its integrated product line. As at 31 December 2013, the Group owned a total capacity of 75,200 hhp for pressure pumping service. As at 31 December 2013, out of the 7 rigs purchased, 4 were already delivered in 2013. All
Annual Report 2013 25
Management Discussions and Analysis
the equipment in position had been mobilized in the market. The Group also accelerated the rollout of new technologies. The newly offered coiled tubing-conveyed resettable packer multistage fracturing technology and the fiber-diverting multistage fracturing technical service jointly offered with Schlumberger gained rapid growth and wide adoption. In the meantime, the Group accelerated the development of integrated project management (IPM) capabilities. “Tongzhou Integrated Oilfield Technology Co., Ltd.” (“Tongzhou IPM”), a joint venture with Schlumberger, has already started operating and participated in a number of integrated tight gas and shale gas engineering projects. The Group also intensified efforts in building up its oil reservoirs and actively sought out integrated oil reservoir engineering project opportunities.
To prepare for long-term development, the Group acted preemptively to ramp up its talent and capital
pool. The efforts reaped fruitful results in 2013. With regard to talent, the Group increased efforts to attract leading industry professionals and experienced talents on a large scale on the one hand and expanded its graduate recruitment program on the other with an intake of 680 graduates from petroleum universities and other prestigious universities around China, most of whom being students with distinction and student cadres. In addition, a fast training mechanism was also developed. On the capital side, the Group successfully completed a US$250.0 million senior notes issue due 2018, setting the milestone as the first Chinese independent oilfield services provider to access the international debt capital market. Furthermore, the Group completed the issuance of the second tranche of the medium-term notes in China, which raised RMB200.0 million. By diversifying funding sources, both offshore and domestic, the Group has substantially enhanced the security of its capital reserves.

Management Discussions and Analysis
26 Anton Oilfield Services Group
In 2013, the Group’s capital efficiency remained in a healthy level. As at 31 December 2013, the average trade receivable turnover days of 2013 were recorded at 150, an increase of 16 days compared with the previous year; the average inventory turnover days of 2013 reached 131, an increase of 7 days from 2012; the average trade payable turnover days of 2013 stood at 157, an increase of 8 days compared with the previous year.
The Group’s strategic goal is to become a leading global oilfield services provider with a solid foothold in China. Facing the swift changes in the configuration of the global oil and gas industry, independent Chinese oilfield technical services companies are now given an unprecedented room to realize its strengths. Seizing the opportunities, the Group developed a “No.1” brand proposition: “the Best Independent Chinese
Oilfield Services Company, the Best Chinese Partner Worldwide”. The Group strives to communicate its value of combining traditional culture, modern China and global standards to national oil companies, private oil and gas investors and international oil companies, and to become a responsible partner to these clients.
Geographical Market Analysis
In 2013, the Group’s revenue from the domestic market was RMB 1,957.6 million, representing an increase of RMB 401.6 million or 25.8% from last year’s RMB 1,556.0 million, and the domestic market accounted for 77.3% of the Group’s total revenue. Revenue from the overseas markets reached RMB 575.9 million, representing an increase of 28.4%, or RMB 127.3 million from RMB 448.6 million in the previous year, and accounted for 22.7% of the Group’s total revenue.
Revenue Breakdown of Domestic and Overseas Markets
Revenue from the respective
market as a percentage
of total revenue
2013 2012 Change 2013 2012(RMB’ million) (RMB’ million) (%)
Domestic 1,957.6 1,556.0 25.8% 77.3% 77.6% Overseas 575.9 448.6 28.4% 22.7% 22.4% Total 2,533.5 2,004.6 26.4% 100.0% 100.0%
Revenue Analysis for Domestic Market
Revenue from the respective
region as a percentage
of domestic revenue
2013 2012 Change 2013 2012(RMB million) (RMB million) (%)
Northwest China 798.3 557.4 43.2% 40.8% 35.8% North China 765.7 528.6 44.9% 39.1% 34.0% Southwest China 242.9 205.4 18.3% 12.4% 13.2% Northeast China 150.7 264.6 -43.0% 7.7% 17.0% Total 1,957.6 1,556.0 25.8% 100.0% 100.0%
Annual Report 2013 27
Management Discussions and Analysis
Revenue Analysis for Overseas Market
Revenue from the respective
region as a percentage
of overseas revenue
2013 2012 Change 2013 2012(RMB million) (RMB million) (%)
The Middle East 416.7 340.9 22.2% 72.4% 76.0% Central Asia 76.4 85.2 -10.3% 13.3% 19.0% Americas 73.2 10.0 632.0% 12.6% 2.2% Africa 9.6 12.5 -23.2% 1.7% 2.8% Total 575.9 448.6 28.4% 100.0% 100.0%
Domestic Market
In 2013, the Group promoted regionalization strategy centered on the three major basins, successfully boosting business growth there. Targeting the emerging demand from domestic natural gas development, including that of conventional gas and tight gas, as well as demand arising from shale gas development, the Group provides key technologies, for drilling optimization and stimulation, in the natural gas sector, and endeavors in developing and introducing new
technologies, which achieved large-scale applications quickly because of its noticeable results in drilling acceleration and production increase. Meanwhile, the Group also stepped up its efforts to develop technology needed in the shale gas development, preparing technologies and services capacity reserve for large-scale shale gas development. Driven by the strong domestic natural gas demand, in 2013, revenue from the northwest, north and southwest regions where the three major basins are located totalled RMB1,806.9 million, up 39.9% from RMB1,291.4 million in 2012.

Management Discussions and Analysis
28 Anton Oilfield Services Group
Major Business Development in the Domestic Market
Tarim Basin is the biggest oil and gas basin in China’s mainland in terms of its area and the reservoir is extremely complex with ultra-high depth, high temperature and high pressure conditions, posing world-class challenge in drilling engineering. Confronted with tight production targets and its own harsh geological conditions, clients in this region are in dire need of technologies that could help them achieve drilling optimization and production increase. The Group has been a major pioneer of new technologies in the area for many years, actively developing fit-for-purpose technologies for local geologies and quickly apply them on a large scale, thus helping clients achieve drilling acceleration and production increase. In 2013, driven by local clients’ demand for drilling acceleration, the Group’s oil-based drilling fluid business kept growing steadily. The rotary steerable drilling technique for directional drilling has effectively addressed the drilling acceleration challenges brought about by the ultra-deep wells and established sound well trajectory, boosting the growth of the directional drilling business in the region. Targeting the needs for stimulation at the block of ultra-deep wells, the Group partnered with Schlumberger and jointly introduced the fiber-diverting multistage fracturing technical service, achieving remarkable results in boosting production and thereby developing quickly into the major stimulation technique and is being promoted aggressively in the region. In addition, the Group’s reservoir evaluation department along with expert teams actively explore business opportunities for the integrated reservoir engineering services.
The Erdos Basin continued to remain as a key market for the Group. The basin has the objective of building itself into “Daqing of Western China”, targeting 50 million tons of oil equivalent output. As China’s major oil and gas supplier, the basin is faced with its “low permeability, low pressure and low output” features and the aggressive production target. Thus, the Erdos Basin is also the first market allowing more participants to enter the exploration and development activities in the up-stream business in order to accelerate production capacity building. As a result, the Group has a diversified customer base in the area. In 2013, faced with the pressing needs to increase
production in the area, the Group ramped up its efforts to promote stimulation technologies, introducing the new coiled tubing-conveyed resettable packer multistage fracturing technology which became an important new multistage fracturing technique, and continuing to implement the open-hole multistage fracturing technique for horizontal wells on a broader scale. The Group also swiftly increased its pressure pumping service capacity. Together, the Group made significant efforts in adding to the production capacity building in the region.
The Sichuan Basin bears an extremely significant potential for conventional and unconventional natural gas, and has discovered China’s largest monomer marine uncompartmentalized natural gas reservoir. The basin is also in the forefront of China’s exploration and development of shale gas. Several shale gas projects of considerable size have been kicked off and clients’ demand for shale gas services began to emerge. Meanwhile, the basin’s complex geological conditions, including well depth, high sulfur content and low permeability, pose multiple challenges to the development. The Group continued to introduce a string of relevant technologies to meet customers’ need for improving drilling efficiency and increasing production. In 2013, the Group provided multiple targeted fit-for-purpose services including bridge-plug milling with coiled tubing and coiled tubing wireline logging technology, laying foundation for the Group to undertake future general contracting service in the large-scale development of shale gas.
In other markets, the Group continued to provide helium testing service as well as casing and cementing services for domestic underground gas storage facilities. In the meantime, the Group actively explored the new model of developing tight oil in China.

Annual Report 2013 29
Management Discussions and Analysis
Overseas Market
In 2013, the Group’s “follow-up strategy” adopted at the overseas markets proceeded very well and the Group continued to strengthen the services coverage in overseas projects invested by Chinese investors to meet the urgent need for production capacity construction from Middle East, Central Asian and South American countries. While sticking to the “follow-up strategy”, the Group, by taking advantage of its brand awareness gained from quality services offered in overseas projects in past years, has for the first time expanded its overseas customer base to national and international oil companies in 2013. To better meet the needs of local clients, the Group has initially completed regionalization at the overseas markets and, through streamlining management and better allocation of integrated products to serve the local market, developed customized products suitable for local market conditions. In 2013, revenue from the Middle East reached RMB 416.7 million, increasing 22.2% from RMB 340.9 million in 2012, maintaining its position as the Group’s biggest overseas market. Revenue from Americas market was RMB 73.2 million, up 632.0% from the previous year, indicating there is significant growth potential in this market.
Major Business Development in the Overseas Market
Iraq, one of the major regions for exploration and production activities for international oil companies, is also one of the few regions in the world with insufficient oilfield technical service capacity. In response to the massive demand for recovering oil production, Iraq signed technical service contracts with international oil companies, under which those oil companies will arrange technical service providers to help Iraq reach the capacity building target. In view of the insufficient local technical service capacity, the Group offers a broad spectrum of services and strengthens business coverage at Chinese-invested Al-Ahdab, Halfaya and Buzurgan projects and realized steady business growth. At the same time, the Group has created a sound brand reputation and carved a niche for itself in Iraq by virtue of its high quality services and outstanding operational results. In 2013, the Group successfully opened up the markets of international and national oil companies.
South American market has been developing at an accelerating pace in recent years, becoming a strategic overseas foothold for Chinese investors. In most cases, Chinese investors’ cooperation with national oil companies is in the form of joint ventures. The local oil reservoir’s characteristics call for a strong demand for horizontal wells technique and heavy oil production technology. Meanwhile, local production and development was conducted inefficiently in the past, resulting in a fast declining output from existing oil and gas fields, and subsequently creating an increasing demand for production capacity building. To meet these demands, the Group increased introduction of talents and provided respective services. In 2013, the Group achieved strong business growth in Colombia, a country the Group will use as a foothold to actively expand its business to South American markets.
Business Cluster Analysis
In 2013, the Group saw continued growth across all business clusters. The drilling technology cluster posted RMB589.4 million in revenue, an increase of 36.1% from 2012. The well completion cluster recorded a revenue of RMB547.9 million, an increase of 19.6% from 2012. The down-hole operation cluster saw its revenue grow by 26.3% from 2012 to RMB1,081.5 million. The tubular services cluster booked RMB314.7 million in revenue, an increase of 22.5% from 2012. In terms of contribution to the Group’s total revenue for 2013, the down-hole operation cluster contributed the highest share of 42.7% of Group revenue, same as the previous year, followed by the drilling technology cluster with a share of 23.3% of Group revenue for 2013, up 1.7 percentage points from the previous year, the well completion cluster with 21.6% of Group revenue for 2013, down 1.3 percentage points from the previous year, and the tubular services cluster with 12.4% of Group revenue for 2013, down 0.4 percentage points from the previous year.

Management Discussions and Analysis
30 Anton Oilfield Services Group
In 2013, the Group made strong efforts to shape up its product lines, which yielded significant results. The Group has developed a suite of technologies that effectively combine oil reservoir technologies and engineering technologies. With a full range of products and featured technologies covering all phases of oil and gas development and production, the Group is able to address such client challenges as increasing production, improving drilling efficiency, lowering costs and optimizing waste management in oil and gas fields. In particular, through the investment in pressure pumping equipment and rigs throughout 2013, the
Group has met its initial target for the building regular services capacity. Meanwhile, having quickly built up its strength in reservoir study and analysis, the Group is now fully equipped to meet the client needs on oil reservoir technologies from evaluation in the early stage onto analysis, well completion and production. At present, the Group is competent for undertaking large and medium-sized integrated projects. It was also accelerating the development of product lines towards light assets so as to further attain an asset-light integrated services mode.
Revenue Breakdown by Cluster
2013 2012 ChangeAs a percentage
of total revenue
(million RMB) (million RMB) (%) 2013 2012
Oil and gas field development technical services 2,218.8 1,747.7 27.0% 87.6% 87.2%Down-hole operation cluster 1,081.5 856.5 26.3% 42.7% 42.7%Drilling technology cluster 589.4 433.0 36.1% 23.3% 21.6%Well completion cluster 547.9 458.2 19.6% 21.6% 22.9%Tubular services cluster 314.7 256.9 22.5% 12.4% 12.8% Total 2,533.5 2,004.6 26.4% 100.0% 100.0%
Down-hole Operation Cluster
In 2013, the down-hole operation cluster kept steady growth and posted RMB1,081.5 million in revenue, an increase of 26.3% from RMB856.5 million in 2012. The products lines in this cluster continued to revolve around the client need for stimulation. On the one hand, the cluster ramped up regular services capacity with pressure pumping equipment, allowing the Group to initially depend its integrated services offering in key target markets on self-owned services equipment. On the other hand, the deployment of new technologies in the high-end segment further quickened and achieved encouraging results.
The down-hole operation cluster comprises the following businesses, namely:
1) Stimulation. This business offers open-hole multistage fracturing for horizontal wells and other featured stimulation technologies, which are applied for the development of low pressure, low permeability reservoirs for higher production and recovery rate. In 2013, this business recorded RMB406.9 million in revenue, down 1.5% from RMB413.2 million in 2012;
2) Coiled tubing service. This business combines coiled tubing equipment with various tools to create a variety of technologies with diverse applications, including stimulation in low-permeability wells, specialized operations in ultra-complex wells and regular operations in conventional wells. In 2013, this business recorded RMB361.4 million in revenue, up 50.8% from RMB239.7 million in 2012;

Annual Report 2013 31
Management Discussions and Analysis
3) Pressure pumping service. This business leverages the hydraulic horsepower service capacity of pressure pumping equipment and related operational expertise to help the clients complete pressure pumping design and operations of various sizes. In 2013, this business recorded RMB76.2 million in revenue, up 180.1% from RMB27.2 million in 2012;
4) Helium testing service. This business offers casing and tubing helium testing technologies for natural gas wells and underground gas storage facilities. By addressing the difficult challenge of gas seal leakage, it provides important safety assurances for the production of high-pressure and high sulfur content wells and key natural gas wells. In 2013, this business recorded RMB120.4 million in revenue, up 14.9% from RMB104.8 million in 2012;
5) Oil production service. This business offers management services for the production and operation of oilfield ground stations. In 2013, this business recorded RMB116.6 million in revenue, up 62.8% from RMB71.6 million in 2012;
6) Proppant. This business offers a critical material used to prop up the fractures in a fracturing process. The high-end ceramic proppant produced by the Group is high temperature and high pressure resistant, non-toxic, non-corrosive and non-radioactive. It helps keep the integrity of the oil and gas channel after a fracturing operation, thus increasing the production. This business is still under construction and is expected to officially come to market in 2014.
EBITDA for the down-hole operation cluster increased by 24.9% from RMB470.8 million in 2012 to RMB587.9 million in 2013. The EBITDA margin of the cluster was 54.4% in 2013, a slight decrease of 0.6 percentage points from 55.0% of 2012. The consistent EBITDA margin was largely due to cost savings on raw materials from new technology deployment and improved procurement management. The higher EBITDA margin of the newly launched pressure pumping service was also a reason.
Management Discussions and Analysis
32 Anton Oilfield Services Group
Major Development in the Down-hole Operation Cluste
Continued improvement of the technology system around multistage fracturing. In 2013, the Group’s open-hole multistage fracturing service for horizontal wells continued to prevail in the market. The coiled tubing-conveyed resettable packer multistage fracturing technology quickly became one of the main new multistage fracturing technologies and gained wide adoption among clients in the same year as it was introduced in the Erdos Basin, thanks to encouraging stimulation results. Meanwhile, the bridge-plug milling with coiled tubing technology the Group rolled out for multistage fracturing for shale gas also gained momentous growth.
Initial completion of service capacity building on pressure pumping equipment. In 2013, the Group added 51,200 HHP of pressure pumping service capacity, bringing the total pressure pumping service capacity up to 75,200 HHP. Upon delivery, the equipment was quickly deployed for use in local markets of the Erdos Basin and the Sichuan Basin and has so far been fully and effectively utilized. As development efforts accelerated on tight oil and gas as well as shale gas, massive demand for fracturing operations emerge. The Group’s available pressure pumping service capacity, track record and brand recognition have become important competitive advantages in the pursuit of long-term service contracts further to existing business in the local markets.
Active promotion of fracturing proppant business and initiation of business building on down-hole chemicals. Recognizing the buoyant demand both from domestic and overseas markets for high-quality proppant, the Group leveraged its advantages on raw materials and talent from China as well as its strength on fracturing technology and market to provide high-end ceramic proppant. Production and marketing is expected to commence in 2014. The Group owns the advanced technology formula and is able to provide a full range of down-hole chemical materials. Promotion will likely start in 2014 to further empower the Group’s extension along the value chain of fracturing.
For oil production business, the production and operation management service offered to oilfield ground stations grew vibrantly in the overseas market. In light of the intense demand among global oil companies for post-production oilfield services, the Group drew strength from its Chinese human resources and technologies and aggressively moved ahead in the overseas market. In particular, its business in Iraq has seen a significant improvement.
Drilling Technology Cluster
In 2013, the drilling technology cluster saw strong growth, posting RMB589.4 million in revenue, an increase of 36.1% from RMB433.0 million in 2012. Business development efforts within this cluster mainly revolved around building the Group’s integrated service capabilities and meeting client demand for drilling optimization. In 2013, the cluster put together the Group’s first-ever rig fleet, enabling the Group to offer integrated services from the main means of oil and gas development, namely drilling engineering technology. In view of the client demand for drilling optimization, the various product lines within this cluster delivered multiple technological applications around performance drilling, which demonstrated excellent performance in terms of helping clients improve drilling success rate and efficiency, shorten the drilling cycle and reduce drilling costs.
The drilling technology cluster comprises the following businesses:
1) Directional drilling. This business mainly provides direction drilling engineering, rotary steerable drilling, sidetracking and drilling optimization services to help clients effectively complete directional and horizontal wells in various complex situations such as high-temperature, high pressure wells and thin reservoirs. Revenue booked under this business in 2013 reached RMB242.9 million, an increase of 36.5% from RMB178.0 million in 2012;
2) Drilling fluid service. This business provides drilling fluid materials, technology and operations. In 2013, it recorded RMB188.4 million in revenue, an increase of 38.6% from RMB135.9 million in 2012;
3) Drilling new technology service. This business aims to improve drilling efficiency, enhance drilling and well completion engineering quality, save costs, address complex challenges and realize performance drilling. It provides an integrated
Annual Report 2013 33
Management Discussions and Analysis
set of technology solutions from design to complementary tools, production process and related equipment. In 2013, this business booked RMB125.2 million in revenue, an increase of 5.1% from RMB119.1 million in 2012;
4) Rig services. By managing and operating the rigs directly owned by the Group as well as third-party rigs, this business provides general contracting services for rig-driven drilling projects, drilling and well completion projects and block engineering projects. This business was established in 2013 and posted a revenue of RMB32.9 million;
5) IPM engineering project management service. This business provides integrated project management (IPM) services mainly through “Tongzhou Integrated Oilfield Technology Co., Ltd.” (“Tongzhou IPM”), a joint venture with Schlumberger. This business was activated in the second half of 2013 and recorded a revenue of RMB13.7 million.
EBITDA of the drilling technology cluster increased from RMB107.9 million in 2012 to RMB136.5 million in 2013, an increase of 26.5%. EBITDA margin for 2013 stood at 23.2%, down 1.7 percentage points from 24.9% in 2012, mainly because more investment was committed to the ramp-up of rig service capacity.
Major Development in the Drilling Technology Cluster
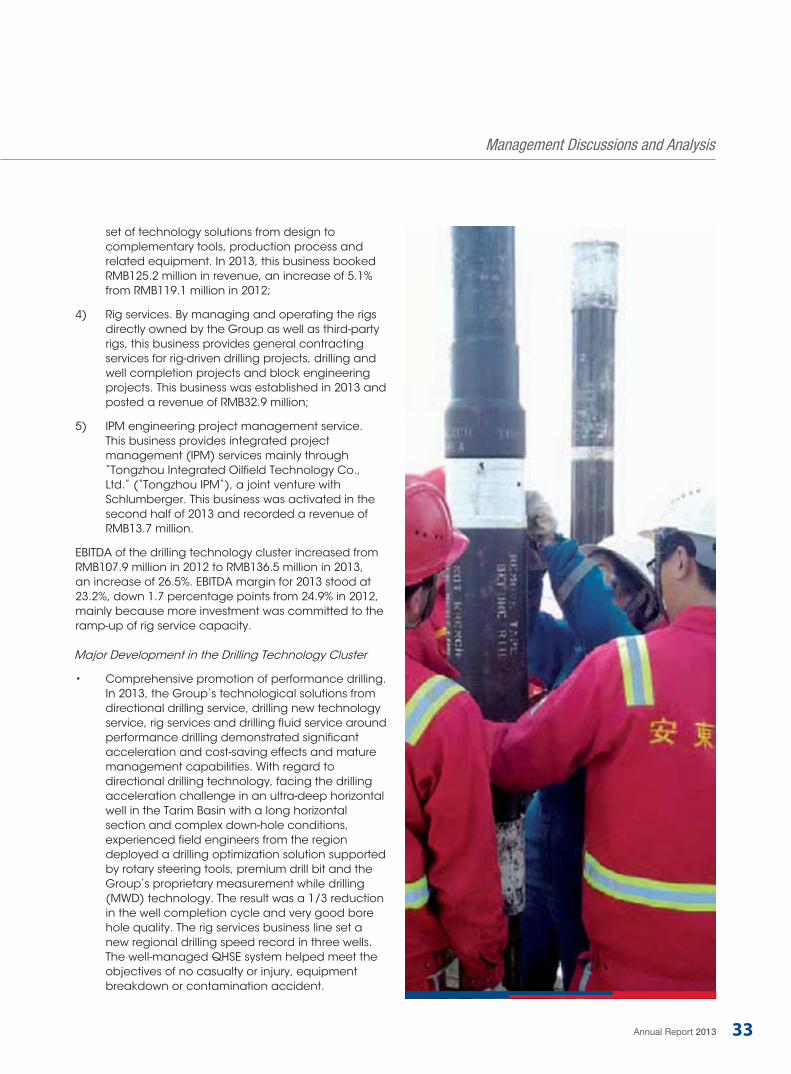
Comprehensive promotion of performance drilling. In 2013, the Group’s technological solutions from directional drilling service, drilling new technology service, rig services and drilling fluid service around performance drilling demonstrated significant acceleration and cost-saving effects and mature management capabilities. With regard to directional drilling technology, facing the drilling acceleration challenge in an ultra-deep horizontal well in the Tarim Basin with a long horizontal section and complex down-hole conditions, experienced field engineers from the region deployed a drilling optimization solution supported by rotary steering tools, premium drill bit and the Group’s proprietary measurement while drilling (MWD) technology. The result was a 1/3 reduction in the well completion cycle and very good bore hole quality. The rig services business line set a new regional drilling speed record in three wells. The well-managed QHSE system helped meet the objectives of no casualty or injury, equipment breakdown or contamination accident.

Management Discussions and Analysis
34 Anton Oilfield Services Group
The well completion cluster comprises the following business:
1) Well completion integration. This business includes technical services for reservoir completion and well completion tools. In 2013, this business recorded a revenue of RMB378.1 million, an increase of 32.5% from RMB285.3 million in the previous year;
2) Gravel packing service. This business came from Shandong Precede, a majority-owned subsidiary acquired by the Group in 2008, which provides gravel packing well completion products and services. In 2013, this business booked a revenue of RMB169.8 million, a slight decrease of 1.8% from RMB172.9 million in 2012.
EBITDA of the well completion cluster increased by 35.6% from RMB145.8 million in 2012 to RMB197.7 million in 2013. EBITDA margin for 2013 was 36.1%, up by 4.3 percentage points from 31.8% in 2012, which is mainly attributable to cost reduction from a higher proportion of proprietary tools within this cluster.
Major Development in the Well Completion Cluster
Diversification towards reservoir completion. In 2013, the well completion cluster expanded from single tool service to integrated general contracting service for reservoir well completion, i.e. starting with geological survey of reservoirs, conducting reservoir study and analysis for each individual well or well block and then presenting an optimal well completion engineering solution to provide integrated well completion technical services to the clients. The Group first tested this model in the Tarim Basin by teaming up with Schlumberger to offer fiber-diverting volume fracturing technical service. In the pilot test, two wells after adopting the technical service saw an exponential increase in daily gas yield and the high production was stable. Because of the significant production increase effect, after promotion for less than a year, this technical service has matured and received wide adoption. This was a key milestone for the diversification of the well completion cluster to reservoir completion.
Promotion of proprietary well completion tools. In order to speed up the shift towards proprietary well completion tools to reduce the dependency on external supply partnerships for certain tools, which had constraints in terms of cost, delivery lead time and quality, the Group started in 2013 the construction of an industrial base in the
The rapid buildup of sizable rig services capacity provided critical equipment support for implementing the Group’s integrated services model. The Group started with moderate investment in rig purchases and drilling teams. It then used the managerial expertise of the in-house drilling teams to rapidly achieve management of third-party rigs and ultimately built up more rig services capacity with a primary focus on managing third-party rigs and complemented by self-owned rigs. The result was an asset-light technical services provider model. In 2013, the Group expeditiously completed the purchase of 7 rigs, 4 of which were delivered during the year. Since the first self-owned rig started drilling in June, all the rigs in position were quickly mobilized to provide general contracting drilling services in the Sichuan Basin and the Erdos Basin. In addition, the Group officially initiated professional rig management for third-party rigs and drilling teams. This has given the Group access to a large pool of rig resources and a process to quickly mobilize such resources.
Accelerated the construction of the integrated services model. In 2013, Tongzhou IPM already started to provide IPM services for a shale gas and tight gas projects. Meanwhile, the Group has accelerated the development of expertise on oil reservoir, intensified efforts to attract leading geological and reservoir professionals, and actively explored opportunities on reservoir integration projects.
Well Completion Cluster
In 2013, the well completion cluster experienced steady growth and recorded RMB547.9 million in revenue, up 19.6% compared with RMB458.2 million in 2012. Business development efforts within this cluster focus on reservoir completion on the one hand, which started with geological survey of reservoirs and reservoir evaluation and analysis for each individual well or well block, based on which an optimal well completion engineering solution was presented. On the other hand, the Group accelerated the development of proprietary well completion tools. Through in-house completion tool testing, processing and manufacturing capacity, this cluster aims to minimize the deployment costs of a well completion operation, ascertain service quality of premium well completion technology through a full suite of completion tools, and promote faster development of premium completion technologies.

Annual Report 2013 35
Management Discussions and Analysis
Tianjin Binhai New Area for the design, testing, experiment, processing and assembling of well completion tools. The base is scheduled to become operational in two phases in 2014 and 2015. Upon completion, the base will supply fully proprietary well completion tools to the Group and greatly enhance its competitiveness on well completion service.
Tubular Services Cluster
In 2013, the tubular services cluster grew steadily and posted RMB314.7 million in revenue, an increase of 22.5% over RMB256.9 million in 2012. Business development efforts within this cluster focused on developing the one-stop third-party tubular services model and providing full life-cycle technical services for oil tubular products (including drilling tools, casing and tubing). The objective is to help improve the safety of tubular use, lower costs and simplify management for the clients.
EBITDA of this cluster grew 41.8% from RMB105.4 million in 2012 to RMB149.5 million in 2013. EBITDA margin for 2013 reached 47.5%, up 6.5 percentage points from 41.0% in 2012, mainly due to a higher EBITDA margin on the new business.
Major Development in the Tubular Services Cluster
Comprehensive improvement of inspection and evaluation service capabilities. In the process of natural gas development, quality problems with oil tubing and casing often lead to more frequent safety accidents and expose the oil company to graver losses. Therefore, the advent of the natural gas era has put much higher requirements on the safety of tubular use. The Group already owns mature drilling tool inspection capabilities. Building on this foundation, the Group quickly extended its service to the inspection and evaluation of oil tubing and casing in 2013. It currently owns the leading inspection lines in the country. At the same time, the Group strengthened other tubular inspection service capabilities. Therefore, notable progress has been made in 2013 on inspection services and evaluation capabilities, which laid a solid foundation for the Group to scale up its inspection service.
Vibrant growth of the drilling tools leasing business. As oil companies increasingly require drilling companies to take on the purchase of drilling tools, drilling companies have been motivated to
actively seek the leasing of drilling tool resources. The size of the drilling tool leasing market has quickly grown. The Group started its drilling tool leasing business years ago. By working with strategic suppliers, the Group built up a sizable stock of drilling tools for lease. At the same, time, it built one of China’s finest tubular services bases in the Tarim region which was equipped with a full set of drilling tool service and repair capabilities. This gave the Group an absolute competitive advantage. Therefore, in a booming market, the Group’s drilling tool leasing business experienced strong growth in 2013 and remained in an unquestionable leadership position.
Alignment of Strategic Resources
In 2013, the Group preemptively deployed and aligned all-round strategic resources through investment, R&D and human capital. In investment side, the Group focused on boosting capacity for pressure pumping equipment and drilling rigs in order to quickly ramp up the previously inadequate regular service capacity and prepare for future development. The Group, by prioritizing the customers’ needs for accelerating and increasing production and improving the Group’s own integrated industry chain, continued to strengthen R&D endeavor in areas of self-developed products. For nurturing human resources development, the Group continued to implement “Talent First” strategy with a view to consciously building a talent reserve pool for the Group’s long-term business growth, thus providing reliable human resources support and solid backup. In 2013, the Group’s capital expenditure spending amounted to approximately RMB 864.5 million, up 210.5% from RMB 278.4 million from 2012.

Management Discussions and Analysis
36 Anton Oilfield Services Group
Alignment of Investment
Year 2013 was an important period during which the Group built up its regular service capacity. The Group gained sufficient fund reserve after a successful US dollar bond issuance aimed at long-term development, and thus, in 2013, the Group stepped up investment, quickly establishing regular service capacity with pressure pumping and drilling rig being its core offering. The delivered equipment was swiftly deployed to use in the market, indicating that the Group’s regular equipment and technical service can reinforce and complement each other and demonstrating the advantage of the Group’s integration strategy. The storage of regular service capacity in advance enabled the Group to undertake medium to large-scale integrated projects, laying foundation for it to tap the emerging opportunities in the field.
Major investment projects
Pressure pumping, as the Group’s featured investment in key regular service equipment for production increase. In 2013, the Group added 51,200 HHP pressure pumping service capacity, bringing the total to 75,200 HHP as of 31 December 2013. Meanwhile, the Group also made conscious
efforts to build new capacity for R&D, configuration and manufacturing of the fracturing-related materials. Coupled with the Group’s fracturing technology, techniques, tools and equipment, these will constitute an integrated fracturing service capacity.
On coiled tubing, the Group set up 2 coiled tubing operation units in 2013. As of 31 December, 2013, the Group had 6 coiled tubing units in operation, of which 3 were deployed in China and 3 in the Middle East. In addition, one had arrived at the Group’s global headquarters in Dubai and was selecting market opportunities. Meanwhile, an additional 2 coiled tubing operation units are being built, which are expected to be completed in the second half of 2014. Upon its completion, the Group will have service capacity comprising 9 coiled tubing operation units.
On tubular helium testing, the Group set up 4 new
tubular helium testing operation units in 2013. As at 31 December, 2013, the Group had a total of 15 tubular helium testing operation units. Meanwhile, there is one helium testing operation unit that is currently under construction, which is expected to be completed in the first half of 2014.

Annual Report 2013 37
Management Discussions and Analysis
On rig service, in order to meet the clients’ demand for drilling rigs in their integrated operations, the Group in 2013 purchased 7 drilling rigs, 4 of which were delivered as at 31 December 2013 and rapidly deployed in the local market. The Group established a business model of driving sales of directional drilling and drilling fluid services through rigs, which was well received and it operated at full capacity. Besides purchasing drilling rigs, in December, the Group also successfully launched a rig management business model, under which it will offer professional and dedicated management service for partners’ rigs and drilling crew covering key aspects such as quality, safety, technology and workforce. While keeping the Group’s business model as an asset-light technical service company, this model expanded the Group’s integrated service capacity for general contracting. The fast ramp up of the drilling rig service capacity will facilitate the growth of the Group’s integrated general contracting business.
The Group set up 10 new directional drilling operation units in 2013. As of 31 December 2013, the Group had established a total of 30 directional drilling operation units, of which 20 are operating domestically and 10 deployed overseas.
On tubular services, in order to develop the integrated service model that hinges on inspection, the Group strengthened capacity building for tubular inspection and evaluation technical services. Meanwhile, the Group expanded oil drilling tool offerings in its leasing business, boosting its capacity for the leasing and operation capacity.
In terms of establishing in-house independent manufacturing capacity and constructing industrial bases, plant for the well completion tools base in Tianjin Binhai New Area is on schedule, and construction is expected to be completed in 2015 with some production lines be operational in mid-2014. The manufacturing base, once completed, will have integrated tool design, experimentation, assembly, testing and processing functions with well completion tools as its main products. In the meantime, the base will leverage the strategic location of Tianjin to establish itself as center for Group’s procurement, storage, logistics, export and import. The construction of downhole operation base in Suining, Sichuan province is on schedule and is expected to be operational in
second half of 2014. The base, once completed, will provide equipment storage, maintenance and repair, staff training, and forefront support for the downhole operation. It will also serve as the office space and accommodation for downhole operation engineers and act as the purchasing headquarters of the southwestern part of China. In Xinjiang, the Group’s existing production and service base can no longer meet the growing market demand. To overcome this constraint, the Group has entered into a strategic partnership with the local government, under which a new production and service base will be built to meet the mounting market demand. The base, whose main structures have already been completed in 2013, is expected to be in use in the second half of 2014. In the overseas market, Halfaya and Al-Ahdab on-site service bases in Iraq provided solid support for the forefront operations, life and production in the field.
Alignment of R&D Resource
Based on its strategic needs, the Group actively moved forward the research and development (“R&D”)of proprietary products in connection with the need for stimulation and drilling acceleration and improvement in an integrated value chain in a bid to further increase operational efficiency and thus lower the customers’ overall costs. In 2013, the Group invested RMB87.5 million in R&D, down by 1.1% comparing to RMB88.5 million of last year. In 2013, the Group obtained a total of 37 patent rights and 10 software copyrights, increasing the total number of patent rights and software copyrights owned by the Group to 408 and 10, respectively.
Key R&D projects
Directional drilling software
Development of new rotary liner hangers series
Coiled tubing casing multistage fracturing technology
Oilfield acidizing corrosion inhibitor technology
New clean fracturing fluid technology
New technology of phased array testing evaluation
Fast and efficient tubular cleaning technology

Management Discussions and Analysis
38 Anton Oilfield Services Group
Alignment of Human Resources
The development of human resources is crucial for building a global leading oilfield technical service company. The Group has always prioritized human resource cultivation as part of its strategic resource alignment program. In 2013, the Group further deepened the ‘Talents First’ strategy, preparing talent reserve preemptively. While attracting top industry talents globally, the Group also recruited graduate hires on a large scale. At the same time, it further improved the talent management and training mechanism to provide far-sighted strategic talent reserve for the Group. As of 31 December 2013, the Group had a permanent staff of 2,213, up 37.2% from 1,613 at the end of 2012.
Major development in human resources
Talent recruitment further accelerated. In 2013, the Group continued to bring in top industry talents for all businesses in line with its development strategy. In order to benchmark towards the internationally accepted QHSE system, the Group also actively recruited leading international QHSE professionals. In addition, the Group expanded campus recruitment in order to meet its rapidly growing business needs. In 2013, the Group recruited 680 graduate hires from petroleum universities and prestigious universities all over the nation. Meanwhile, efforts were also made to strengthen the cultivation and creation of talent echelon, in a bid to secure the talent power required to support the Group’ long-term business growth.
Further improvement was made in overall talent structure. Keeping in line with the regional strategic layout, the Group aligned its domestic and overseas operations in 2013, stepping up talent deployment in each major market which facilitated the formation of a global network.
A fast track talent development mechanism was also put in place. In light of the considerable number of graduates joining, the Group offered training courses to quickly grow them as field engineers. Industry experts across all businesses within the Group acted as trainers, providing both technical and on-the-job training. The graduates were given onsite, real time training with rigs. These new recruits were placed in various business units to help them improve the hands-on skills, deepen their understanding of technologies, and increase their professional knowledge of the QHSE process.
In 2013, the Group granted a total of 35,640,000 ordinary share options to 300-plus top-performing employees and core staff members. Among the total share options awarded, 33,730,000 are exercisable at a price of HKD3.878 per share, 1,296,000 at a price of HKD5.742 per share and 298,000 at a price of HKD5.600 per share, 70,000 at a price of HKD5.570 per share and 246,000 at a price of HKD4.960 per share.
Branding
In 2013, reforms in China’s oil and gas industry gathered pace and Chinese companies accelerated their overseas expansion. Against this backdrop, the Group seized the opportunity and proposed “The Best Independent Chinese Oilfield Services Company, the Best Chinese Partner Worldwide” as the brand positioning for Antonoil.
The essence of this “No.1” brand proposition lies heavily in the Group combining traditional culture, modern China and global standards. The Group’s corporate culture, derived from the traditional oriental culture and wisdom, attaches great importance to self-improvement and responsibility-shouldering. Meanwhile, the Group taps into the advantage of modern China and develops its core competencies by seizing the opportunities arising from the oil and gas industry development in the country. In addition, the fact that the Group’s product quality and technology can match the global standards, coupled with its rich overseas work experience, means it is competitive globally.
The Group will make its every effort to extend and promote its brand concept among Chinese oil companies and global oil companies, striving to become their long-term partners world-wide.
Outlook
In 2014, on the domestic front, development of natural gas continues to grow, particularly with shale gas development demonstrating good momentum. Market liberalization brings about more opportunities. On the overseas front, demands from the Middle East and South America markets further increase. At the same time, domestically, investment strategy shift of customers brings about challenges. Open tender leads to more severe competition. Overseas, global markets experience political unrest and uncertainties exist. Opportunities and challenges therefore coexist.

Annual Report 2013 39
Management Discussions and Analysis
The Group is bracing up for the mix of opportunities and challenges from the development of oil and gas industry with confidence and readiness. Domestically, the Group continues to focus on the natural gas space. By offering new technologies for the development of conventional resources in the Tarim Basin and integrated services related to stimulation in the Erdos Basin, and providing technologies for shale gas development in the Sichuan Basin, the Group is becoming a close partner to its clients. On the overseas front, while the Group continues to cement its client base with Chinese investors, it is gradually moving beyond the “follow-up” strategy to forge partnerships with NOCs and IOCs.
In 2014, the Group will put more emphasis on product line management. On the one hand, it will actively advance the building of new asset-light business lines and focus on natural gas, especially the stimulation, optimization, waste management technologies needed in shale gas development. On the other hand, the Group will broaden its service portfolio of the existing product lines. Meanwhile, the Group will strengthen the development of reservoir expertise, improve reservoir analysis and evaluation capabilities and enable the perfect combination of reservoir expertise and engineering technologies.
With regard to human resources development, the Group will further accelerate the recruitment of leading industry professionals in 2014 to support the building of product lines, with an asset-light focus. It will maintain a sizable graduate hire program and strengthen talent training and mentoring to stock up talent for the Group’s sustainable development. On QHSE, the Group will continue to fully enforce the QHSE management requirements, adopt international standards, and emphasize that “QHSE must come first at Antonoil”. On financial management, the Group will exercise cost discipline and control, coupled with new technology promotion, and secure stable revenue growth and healthy profitability for the Group. At the same time, it will improve post-financing capital management to advance faster towards realizing the Group strategy. In 2014, the Group will continue to improve the its brand system, conduct branding campaigns and fully leverage its brand equity to drive business growth. By communicating to Chinese and international oil companies of its brand ethos consisting of traditional oriental culture, modern Chinese technology and global standards, the Group will further enhance its brand profile as “the Best Independent Chinese Oilfield Services Company and the Best Chinese Partner Worldwide”.
FINANCIAL REVIEW
In order to provide investors with a more direct analysis of the Group’s cost structure, the Group has since 2012 adopted an accounting format consistent with its internal management, which classifies costs and expenses by function instead of classification by nature as in previous disclosures. The new format helps investors to better analyze direct cost of sales and major expenses.
Revenue
The Group’s revenue in 2013 amounted to RMB2,533.5 million, representing an increase of RMB528.9 million or 26.4% as compared to RMB2,004.6 million in 2012. The increase of the Group’s revenue was mainly attributable to the Group’s continued expansion in domestic natural gas market and the strong demand for the Group’s business from overseas market.
Costs of Sales
The costs of sales in 2013 increased to RMB1,411.0 million, representing an increase of 27.9%, from RMB1,103.3 million in 2012. The increase was mainly attributable to the increase in cost corresponding to its business growth.
Other Gains
Other gains in 2013 increased to RMB20.0 million from RMB10.6 million in 2012. The increase was mainly attributable to the gains on disposal of subsidiaries.
Selling Expenses
The selling expenses in 2013 amounted to RMB173.1 million, representing an increase of RMB18.6 million or 12.0% as compared to RMB154.5 million in 2012. This was mainly attributable to the Group’s expanded business operations.
Administrative Expenses
The administrative expenses in 2013 amounted to RMB299.8 million, representing an increase of RMB39.8 million or 15.3% as compared to RMB260.0 million in 2012. This was mainly attributable to the Group’s expanded business operations.

Management Discussions and Analysis
40 Anton Oilfield Services Group
R&D Expenses
The R&D expenses in 2013 amounted to RMB64.4 million, representing a decrease of RMB1.9 million or 2.9% as compared to RMB66.3 million in 2012. This was mainly attributable to the Group’s stable investment in research and development.
Sales Tax and Surcharges
The sales tax and surcharge in 2013 amounted to RMB32.8 million, representing a decrease of RMB0.3 million or 0.9% as compared to RMB33.1 million in 2012. The decrease was mainly due to the reform of national tax system whereby taxes borne by certain businesses were changed from sales tax last year to value-added tax, which were not included in sales tax and surcharges.
Operating Profit
As a result of the foregoing, the operating profit of the Group in 2013 amounted to RMB572.4 million, representing an increase of RMB174.4 million or 43.8% as compared to RMB398.0 million in 2012. The operating profit margin for 2013 was 22.6%, representing an increase of 2.7 percentage points from 19.9% in 2012.
Finance Costs (Net)
Net finance costs in 2013 was RMB72.7 million, an increase of approximately RMB42.1 million as compared to 2012. The increase was mainly due to the increase in finance costs generated from the completion of the issue of US Dollar bonds.
Share of Loss of a Joint Venture
The share of loss of a joint venture in 2013 amounted to RMB9.7 million, mainly because a joint venture, Tongzhou IPM, was still at the stage of personnel recruitment and training in preparation for the Chinese market in spite of the revenue generated by the joint venture. No share of loss or profit of a joint venture was incurred in 2012.
Income Tax Expense
Income tax expense in 2013 amounted to RMB86.8 million, representing an increase of RMB37.1 million from 2012, mainly due to an increase of income tax expense as a result of a significant increase of profit before tax.
Profit for the Year
As a result of the foregoing, the Group’s profit for 2013 was RMB403.1 million, representing an increase of RMB85.4 million, or 26.9%, from 2012.
Profit Attributable to Equity Holders of the
Company
The Group’s profit attributable to equity holders of the Company in 2013 amounted to RMB382.6 million, representing an increase of RMB80.0 million, or 26.4%, from 2012.
Trade and Notes Receivables
As at 31 December 2013, the Group’s net trade and notes receivables were RMB1,332.3 million, representing an increase of RMB384.0 million as compared to 31 December of 2012. The average trade receivables turnover days (excluding quality guarantee deposits and other deposits) in 2013 were 150 days, representing an increase of 16 days as compared to 2012. This was mainly attributable to the Group’s expanded business operations.
Inventory
As at 31 December 2013, the Group’s inventory was RMB540.7 million, representing an increase of RMB53.7 million as compared to 31 December 2012, mainly due to the Group’s expanded business operations.
LIQUIDITY AND CAPITAL RESOURCES
As at 31 December 2013, the Group’s cash and bank deposits amounted to approximately RMB1,802.6 million (including: restricted bank deposits, term deposits with initial terms of over three months, cash and cash equivalents), representing an increase of RMB1,263.6 million as compared to 31 December 2012.
As at 31 December 2013, the Group’s outstanding short-term bank loans amounted to RMB395.9 million. Credit facilities granted to the Group by domestic banks in China amounted to RMB575.0 million, of which approximately RMB190.2 million were not used. Credit facilities granted to the Group by foreign banks in China amounted to RMB243.9 million remains unused. The aggregate principal amount of Medium-term Notes of the Group registered at the National Association of Financial Market Institutional Investors totals RMB 500.0
Annual Report 2013 41
Management Discussions and Analysis
million, in which the issuance of the second tranche of RMB200.0 million Medium-term Notes was completed in 2013. In addition, the Group completed the issuance of USD250.0 million due 2018 senior notes in November 2013.
As at 31 December 2013, the gearing ratio of the Group was 56.5%, representing an increase of 19.1 percentage points from the gearing ratio of 37.4% as at 31 December 2012. This was mainly due to the increase in long-term borrowing and short-term borrowing. Net debt included borrowings and trade and notes payables. Total capital was calculated as equity plus net debt.
The equity attributable to equity holders of the Company increased from RMB1,971.9 million as at 31 December 2012 to RMB2,282.7 million as at 31 December 2013. The increase was mainly due to the increase in profit for the year.
SUBSTANTIAL DISPOSAL OF SUBSIDIARIES
In February 2013, the Group disposed of its 55% interests in Bazhou Anton Chang Xiang Applied Chemical Technology Co., Ltd., Bazhou Chang Xiang Applied Chemical Technology Co., Ltd., Bazhou Cheng Xi Petroleum Commodity Co., Ltd., and Bazhou Cheng Xi Petroleum Commodity Kazakhstan Co., Ltd. (together the “Bazhou Companies”), for a total consideration of RMB56,497,000, with a gain on disposal was approximately RMB13.3 million.
EXCHANGE RISK
The Group mainly conducts its business in RMB. Some imported and exported goods require to be settled in foreign currencies. The Group believes that the exchange risk involved in the settlement amounts being denominated in foreign currencies is insignificant. The exchange risk of the Group mainly arises from its foreign currency deposits and trade receivables denominated in foreign currencies. Any fluctuations in RMB exchange rate against US dollars may have a negative impact on the Group’s operating results and financial position.
CASH FLOW FROM OPERATING ACTIVITIES
For the year ended 31 December 2013, net cash inflow from operating activities of the Group amounted to RMB378.5 million, representing an increase of RMB28.9 million compared to 2012. This was mainly because the Group enhanced the management of trade receivables recovery.
CAPITAL EXPENDITURE AND INVESTMENT
The Group’s capital expenditure for 2013 was RMB864.5 million, of which, investments in fixed assets were RMB812.6 million, investments in intangible assets (including land use rights) were RMB23.1 million, the payment for the equity investments was RMB28.8 million. The Group’s net capital expenditure was RMB808.7 million, which included a recoupment of investment of RMB55.8 million.
The Group has budgeted approximately RMB750.0 million for capital expenditure in 2014, which will be used in investments in fulfilling the equipment purchase contracts signed in 2013 and adding moderate amount of stimulation equipment.
CONTRACTUAL LIABILITY
The Group’s contractual commitments mainly consist of payment obligations under the Group’s operating lease arrangements and capital commitments. The Group leases offices and certain equipment and machinery through operating leases. As at 31 December 2013, the Group’s operating lease commitments amounted to approximately RMB64.5 million. As at the balance sheet date (31 December 2013), the Group had capital commitments of approximately RMB231.2 million, which was not provided for in the balance sheet.
CONTINGENT LIABILITIES
As at 31 December 2013, the Group did not have any material contingent liabilities or guarantees.
OFF-BALANCE SHEET ARRANGEMENTS
As at 31 December 2013, the Group did not have any off-balance sheet arrangement.

DIRECTORS’ REPORT
42 Anton Oilfield Services Group
The Board of the Company is pleased to present the Directors’ Report together with the audited financial statements of the Group for the year ended 31 December 2013.
PRINCIPAL ACTIVITIES
The Company acts as an investment holding company. The Group provides oil and gas field development technical services, and tubular services covering the entire life cycle of oil and gas field development, including drilling, completion and production stages.
RESULTS OF OPERATIONS
The financial results of the Company for 2013 are set out on pages 73 to 138 of this Annual Report.
FIVE YEAR FINANCIAL SUMMARY
The five year financial summary of the Company is set out on pages 10 to 11 in the section “Financial Summary” of this Annual Report.
DIVIDENDS
At the Board meeting held on 18 March 2014, the Board recommended a payment of a final dividend for the year ended 31 December 2013 of RMB0.0547 per share, totaling RMB120.0 million (2012: RMB0.0456 per share, totaling RMB98.3 million).
SUBSIDIARIES
Particulars of the Company’s subsidiaries are set out in Note 9 to the financial statements of this Annual Report.
MAJOR CUSTOMERS AND SUPPLIERS
The largest customer and the five largest customers of the Company accounted for approximately 24.3% and 53.1% respectively of the Company’s revenues for the year ended 31 December 2013.
For the year ended 31 December 2013, the total amount of purchases made by the Company from its five largest suppliers amounted to RMB391.8 million, and accounted for 27.0% of the total purchases for the year. The amount of purchases from the largest supplier amounted to RMB128.0 million, and accounted for 8.8% of the total purchases for the year. Two of the five largest suppliers of the Group is an affiliate of Schlumberger NV, a substantial shareholder of the Group. Save as disclosed, as far as the Company is aware, none of the Directors, their associates and shareholders who are interested in more than 5% of the share capital of the Company has any interest in the five largest suppliers and customers.
PROPERTY, PLANT AND EQUIPMENT
Additions to the property, plant and equipment of the Company for the year ended 31 December 2013 totaled RMB853.2 million. Details of movements are shown under Note 6 to the financial statements of this Annual Report.

Directors’ Report
Annual Report 2013 43
SHARE CAPITAL
Details of the movements in share capital of the Company during the year are set out in Note 16 to the financial statements of this Annual Report.
PRE-EMPTIVE RIGHTS
There is no provision regarding pre-emptive right under the Articles of Association of the Company and the Cayman Islands laws, which would oblige the Company to offer new shares on a pro rata basis to its existing shareholders.
PURCHASE, SALE OR REDEMPTION OF THE COMPANY’S LISTED SECURITIES
For the year ended 31 December 2013, the Company repurchased a total 4,452,000 shares (2012: Nil) on The Stock Exchange of Hong Kong Limited (the “Stock Exchange”) at an aggregate consideration of approximately HK$22,225,080 (before expenses). All the repurchased shares were subsequently cancelled by the Company during the year. Particulars of the repurchases were as follows:
Number of Aggregate
ordinary Consideration
shares Purchase price per share paid (before
Month of the repurchases repurchased Highest Lowest expenses)
HK$ HK$ HK$
March 2013 324,000 5.0200 4.9800 1,619,680April 2013 1,800,000 5.0400 5.0000 9,018,240June 2013 378,000 5.0000 4.9700 1,885,660July 2013 1,950,000 4.9900 4.9600 9,701,500
Total: 4,452,000 22,225,080
Save as disclosed above, neither the Company nor any of its subsidiaries has purchased, sold or redeemed any of the Company’s listed securities during the year ended 31 December 2013.
RESERVES
Details of movements in the reserves of the Company during the year ended 31 December 2013 are set out in Note 17 to the financial statements of this Annual Report.
DISTRIBUTABLE RESERVES
As at 31 December 2013, the aggregate amount of reserves which is available for distribution to the equity shareholders of the Company was RMB1,165.0 million.
BOND AND SENIOR NOTES
Details of the bonds and senior notes are set out in Note 18 to the financial statements of this Annual Report.

Directors’ Report
44 Anton Oilfield Services Group
DIRECTORS
The members of the Board during the year and up to the date of this Annual Report are:
Executive Directors
Mr. Luo Lin (appointed on 3 August 2007)Mr. Wu Di (appointed on 22 March 2010)Mr. Liu Enlong (appointed on 16 May 2011)
Non-executive Director
Mr. Jean Francois Poupeau (appointed on 21 January 2013)
Independent Non-executive Directors
Mr. Zhang Yongyi (appointed on 17 November 2007)Mr. Zhu Xiaoping (appointed on 17 November 2007)Mr. Wang Mingcai (appointed on 17 November 2007)
The biographical details of the Directors and senior management are set out under the section “Profiles of Directors and Senior Management” of this Annual Report.
In accordance with Article 130 of the Articles of Association, every Director (including those appointed for a specific term) shall be subject to retirement by rotation at least once every three years. Accordingly, Mr. Luo Lin, an Executive Director shall retire and being eligible, will offer himself for re-election at the forthcoming annual general meeting (the “AGM”) of the Company.
In accordance with the letters of appointment for all Independent Non-executive Directors, Mr. Zhang Yongyi, Mr. Zhu Xiaoping and Mr. Wang Mingcai, Independent Non-executive Directors shall retire and being eligible, will offer themselves for re-election at the AGM.
DIRECTORS’ SERVICE CONTRACTS AND LETTERS OF APPOINTMENT
Mr. Luo Lin, being the Executive Director, has entered into a service contract with the Company for a term of three years commencing from 4 June 2013, which may be terminated by not less than three months’ notice in writing served by either party on the other.
Mr. Wu Di, being the Executive Director, has entered into a service contract with the Company for a term of three years commencing from 2 April 2013, which may be terminated by not less than three months’ notice in writing served by either party on the other.
Mr. Liu Enlong, being the Executive Director, has entered into a service contract with the Company for a term of three years commencing from 16 May 2011, which may be terminated by not less than three months’ notice in writing served by either party on the other.
Mr. Jean Francois Poupeau, being the Non-executive Director, has entered into the letter of appointment with the Company for a period of three years commencing from 21 January 2013, which may be terminated by not less than three months’ notice in writing served by either party on the other.
The letter of appointment of each of Mr. Zhang Yongyi, Mr. Zhu Xiaoping and Mr. Wang Mingcai, being the Independent Non-executive Directors, has been renewed by the Company for a term of one year commencing from 9 January 2014, which may be terminated by not less than three months’ notice in writing served by either party on the other.
Save as disclosed above, no Director for re-election at the AGM has a service contract with the Company or any of its subsidiaries which is not determinable by the employing company within one year without payment of compensation other than the normal statutory compensation.
Directors’ Report
Annual Report 2013 45
DIRECTORS’ INTEREST IN MATERIAL CONTRACTS
There was no contract of significance connected to the business of the Group to which the Company, its subsidiaries, or its holding company or any of its fellow subsidiaries was a party and in which any director of the Company had a direct or indirect material interest, subsisting at the end of the year or at any time during the year.
DIRECTORS’ INTERESTS IN COMPETING BUSINESS
Mr. Jean Francois Poupeau, the Non-executive Director, is an Executive Vice President of Schlumberger Limited, the world’s leading oilfield services company, which is engaged in similar businesses as the Company.
Save as disclosed above, none of the Directors and their respective associates (as defined in the Rules Governing the Listing of Securities on the Stock Exchange (the “Listing Rules”) has an interest in any business which competes or may compete with the business in which the Group is engaged during the year.
Pro Development Holdings Corp. is beneficially controlled by Mr. Luo Lin, the Executive Director, who is the controlling shareholder of the Company.
The controlling shareholder and the Executive Directors have provided annual confirmations in respect of the compliance with non-competition undertaking given by them.
The Independent Non-executive Directors have also reviewed the compliance by the controlling shareholder and the Executive Directors with the Non-competition Undertaking during the year. The Independent Non-executive Directors have confirmed that, as far as they can ascertain, there is no breach by any of the controlling shareholder and the Executive Directors of the non-competition undertaking given by them.
REMUNERATION OF DIRECTORS
In compliance with the Corporate Governance Code (the “Code”) as set out in Appendix 14 to the Listing Rules, the Company has established a remuneration committee (the “Remuneration Committee”) to make recommendations to the Board on the Company’s policy and structure for all the Directors’ remuneration. Directors’ remuneration structure may include a director’s fee, a fixed salary, share options scheme and performance bonus. Directors’ remuneration is determined by the Board with reference to Directors’ duties and responsibilities, the recommendations of the Remuneration Committee and the performance and results of the Group. Details of the remuneration of the Directors are set out in Note 28 to the financial statements of this Annual Report.
CONFIRMATION OF INDEPENDENCE OF INDEPENDENT NON-EXECUTIVE DIRECTORS
The Company has received an annual confirmation of independence pursuant to Rule 3.13 of the Listing Rules from each of the Independent Non-executive Directors and considers that Mr. Zhang Yongyi, Mr. Zhu Xiaoping and Mr. Wang Mingcai to be independent.
DIRECTORS’ AND CHIEF EXECUTIVE’S INTERESTS AND SHORT POSITIONS IN SHARES,
UNDERLYING SHARES AND DEBENTURES OF THE COMPANY OR ITS ASSOCIATED
CORPORATION
As at 31 December 2013, the interests and short positions of each Director and chief executive in the shares, underlying shares and debentures of the Company and its associated corporation (within the meaning of Part XV of the Securities and Futures Ordinance (the “SFO”)) as recorded in the register required to be kept by the Company under Section 352 of the SFO or otherwise notified to the Company and the Stock Exchange pursuant to the Model Code for Securities Transaction by Directors of Listed Issuers of the Listing Rules (the “Model Code”) were as follows:

Directors’ Report
46 Anton Oilfield Services Group
(i) Long positions in ordinary shares of HK$0.10 each:
Number of Approximate
ordinary percentage
Name of Director Note Capacity shares held of shareholdings
Luo Lin 1 Founder of a discretionary trust 705,334,150 32.62% and beneficial owner
Wang Mingcai Beneficial owner 150,000 0.007%
Note:
1. Mr. Luo Lin is the founder of the Loles Trust, which is indirectly interested in the entire issued share capital of Pro Development Holdings Corp., which in turn is interested in 696,946,150 shares of the Company. Mr. Luo Lin and his family members are the beneficiaries of the Loles Trust. Mr. Luo Lin also holds 8,388,000 shares in the capacity of a beneficial owner.
(ii) Long positions in underlying shares of share options:
The Directors have been granted options under the Company’s share option scheme, details of which are set out in “Share Option Scheme” below.
Save as disclosed above, at no time during the year ended 31 December 2013, the Directors and chief executive (including their spouses and children under 18 years of age) had any interests in, or had been granted, or exercised, any rights to subscribe for shares of the Company and its associated corporations required to be disclosed pursuant to the SFO or otherwise notified to the Company and the Stock Exchange pursuant to the Model Code.
INTERESTS AND SHORT POSITIONS IN THE SHARES AND UNDERLYING SHARES OF
SUBSTANTIAL SHAREHOLDERS
As at 31 December 2013, the Company had been notified of the substantial shareholders and other persons (other than the Directors or the chief executive of the Company) who had interests or short positions in the shares or the underlying shares of the Company as recorded in the register required to be kept by the Company pursuant to Section 336 of the SFO were as follows:
Long positions in the shares or underlying shares of the Company:
Number of Approximate
ordinary percentage
Name of substantial shareholder Note Capacity shares held of shareholding
Credit Suisse Trust Limited 1 Trustee 696,946,150 32.23%Seletar Limited 1 Trustee 696,946,150 32.23%Serangoon Limited 1 Trustee 696,946,150 32.23%Avalon Assets Limited 1 Trustee 696,946,150 32.23%Pro Development Holdings Corp. 1 Beneficial owner 696,946,150 32.23%Schlumberger NV 2 Interest of controlled
corporation423,361,944 19.58%
Notes:
1. The 696,946,150 shares referred to the same batch of shares.
2. Schlumberger Far East, Inc. directly holds 423,361,944 shares of the Company. Schlumberger Far East, Inc. is a wholly-owned subsidiary of Schlumberger Holding Limited. Schlumberger Holding Limited is a wholly-owned subsidiary of Schlumberger Oilfield Holding Limited. Schlumberger Oilfield Holding Limited is a wholly-owned subsidiary of Schlumberger NV.
Directors’ Report
Annual Report 2013 47
Save as disclosed above, as at 31 December 2013, so far was known to the Directors, no other persons (other than the Directors or the chief executive of the Company) had an interest or short position in the shares and underlying shares of the Company which would fall to be disclosed to the Company and the Stock Exchange under the provisions of Divisions 2 and 3 of Part XV of the SFO or as recorded in the register required to be kept by the Company under Section 336 of the SFO.
SHARE OPTION SCHEME
The Company conditionally adopted its share option scheme on 17 November 2007 and amended its terms on 27 May 2010 (the “Share Option Scheme”). The Share Option Scheme shall be valid and effective for a period of 10 years from 17 November 2007, subject to early termination by the Company in a general meeting or by the Board. The purpose of the Share Option Scheme is to grant option to the eligible participants in recognition and acknowledgement of their contributions made or to be made to the Group. Under the Share Option Scheme, the Board may offer to grant an option to any director or employee, or any advisor, consultant, suppliers, customers or agents.
The shares which may be issued upon exercise of all outstanding options granted and yet to be exercised under the Share Option Scheme and any other share option schemes of the Company at any time shall not exceed 30% of the shares in issue from time to time.
The maximum number of shares available for issue under options which may be granted under the Share Option Scheme or other share option scheme adopted by the Company must not in aggregate exceed 10% of the shares in issue as at the date of approval of the Scheme limit (i.e. 27 May 2010), being 209,305,400 shares.
As at the date of this Annual Report, the total number of shares available for issue which includes share options available to be granted and outstanding options under the Share Option Scheme was 153,938,814 shares, representing 7.02% of the issued share capital of the Company.
The total number of shares issued and which may fall to be issued upon exercise of the options granted pursuant to the Share Option Scheme to an eligible participant in any 12-month period shall not exceed 1% of the number of shares in issue as at the date of grant unless approved by the shareholders in general meeting.
The subscription price of a share in respect of any particular option granted under the Share Option Scheme shall be determined by the Board provided that it shall not be less than the highest of: (i) the closing price of the shares as stated in the Stock Exchange’s daily quotation sheet on the date of grant; (ii) the average of closing prices of the shares as stated in the Stock Exchange’s daily quotation sheets for the 5 business days immediately preceding the date of grant; and (iii) the nominal value of a share. Upon acceptance of the option, the grantee shall pay HK$1.00 to the Company by way of consideration for the grant. An option may be exercised in accordance with the terms of the Share Option Scheme at any time after the date upon which the option is deemed to be granted and accepted and prior to the expiry of 10 years from that date. The period during which an option may be exercised will be determined by the Board in its absolute discretion, save that no option may be exercised more than 10 years after it has been granted.
As at 31 December 2013, the Directors individually and other employees of the Company in aggregate had the following interests in options to subscribe for shares of the Company under the Share Option Scheme. Each option gives the holder the right to subscribe for one ordinary share of the Company of HK$0.10 each.

Directors’ Report
48 Anton Oilfield Services Group
Grantees
Date of grantof shareoptions
Exerciseperiod ofshare options
Exerciseprice per
share Notes
Number ofshare options
as at1 January
2013
Number ofshare options
grantedduring
the year
Number ofshare options
exercised during
the year
Number ofshare options
cancelledduring
the year
Number ofshare options
lapsedduring
the year
Number ofshare options
as at31 December
2013HK$
Directors
Zhang Yongyi 20 May 2011 20 May 2012 to19 May 2014
1.450 2,10 500,000 — 500,000 — — 0
19 January 2012 19 January 2013 to18 January 2015
1.072 2,12 500,000 — 250,000 — — 250,000
10 January 2013 10 January 2014 to9 January 2016
3.878 2,17 — 500,000 — — — 500,000
Subtotal: 1,000,000 500,000 750,000 — — 750,000
Zhu Xiaoping 20 May 2011 20 May 2012 to19 May 2014
1.450 2,10 500,000 — 250,000 — — 250,000
19 January 2012 19 January 2013 to18 January 2015
1.072 2,12 500,000 — 250,000 — — 250,000
10 January 2013 10 January 2014 to9 January 2016
3.878 2,17 — 500,000 — — — 500,000
Subtotal: 1,000,000 500,000 500,000 — — 1,000,000
Wang Mingcai 20 May 2011 20 May 2012 to19 May 2014
1.450 2,10 500,000 — — — — 500,000
19 January 2012 19 January 2013 to18 January 2015
1.072 2,12 500,000 — 250,000 — — 250,000
10 January 2013 10 January 2014 to9 January 2016
3.878 2,17 — 500,000 — — — 500,000
Subtotal: 1,000,000 500,000 250,000 — — 1,250,000
Luo Lin 29 April 2009 29 April 2010 to28 April 2013
0.684 1,7 2,000,000 — 2,000,000 — — 0
9 April 2010 9 April 2011 to8 April 2014
0.750 1,8 80,000 — — — — 80,000
20 May 2011 20 May 2012 to19 May 2015
1.450 1,10 2,000,000 — — — — 2,000,000
19 January 2012 19 January 2013 to18 January 2016
1.072 1,12 100,000 — — — — 100,000
18 June 2012 18 June 2013 to17 June 2016
1.160 1,14 1,900,000 — — — — 1,900,000
10 January 2013 10 January 2014 to9 January 2017
3.878 1,17 — 130,000 — — — 130,000
21 June 2013 21 June 2014 to20 June 2019
5.742 5,18 — 796,000 — — — 796,000
Subtotal: 6,080,000 926,000 2,000,000 — — 5,006,000
Wu Di 20 May 2011 20 May 2012 to 19 May 2015
1.450 1,10 1,100,000 — 366,000 — — 734,000
19 January 2012 19 January 2013 to18 January 2016
1.072 1,12 900,000 — 300,000 — — 600,000
18 June 2012 18 June 2013 to17 June 2016
1.160 1,14 100,000 — — — — 100,000
10 January 2013 10 January 2014 to 9 January 2017
3.878 1,17 — 600,000 — — — 600,000
Subtotal: 2,100,000 600,000 666,000 — — 2,034,000
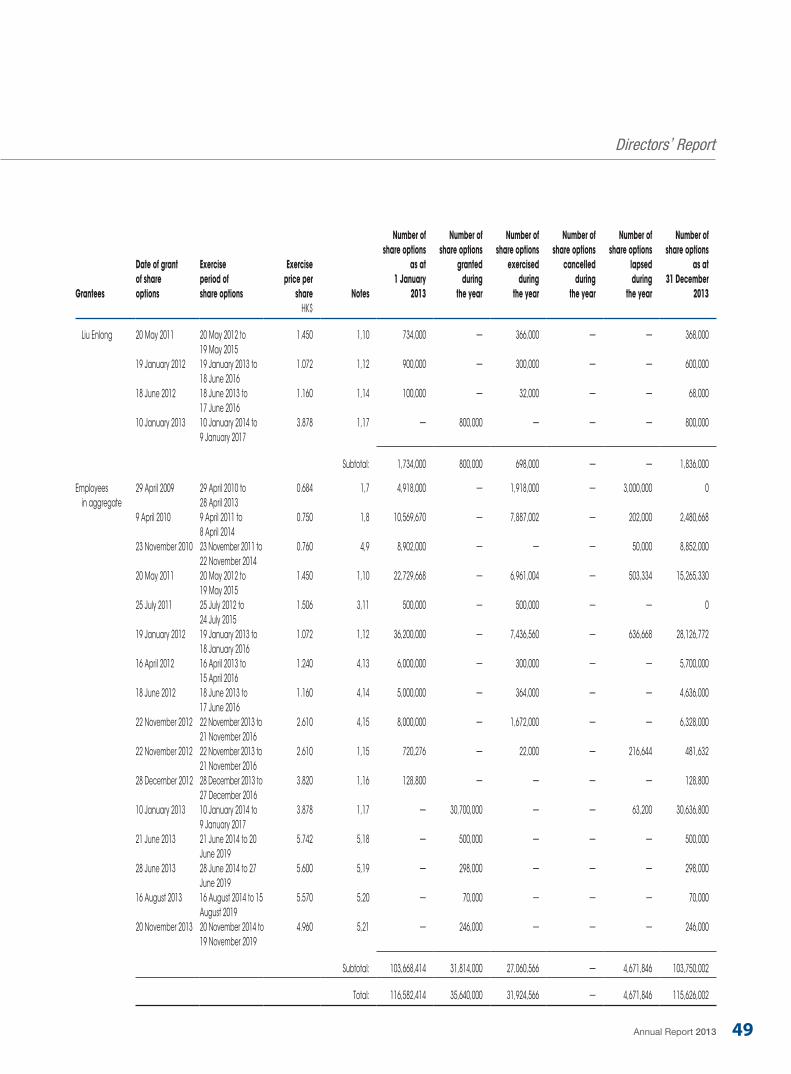
Directors’ Report
Annual Report 2013 49
Grantees
Date of grant
of share
options
Exercise
period of
share options
Exercise
price per
share Notes
Number of
share options
as at
1 January
2013
Number of
share options
granted
during
the year
Number of
share options
exercised
during
the year
Number of
share options
cancelled
during
the year
Number of
share options
lapsed
during
the year
Number of
share options
as at
31 December
2013
HK$
Liu Enlong 20 May 2011 20 May 2012 to19 May 2015
1.450 1,10 734,000 — 366,000 — — 368,000
19 January 2012 19 January 2013 to 18 June 2016
1.072 1,12 900,000 — 300,000 — — 600,000
18 June 2012 18 June 2013 to17 June 2016
1.160 1,14 100,000 — 32,000 — — 68,000
10 January 2013 10 January 2014 to9 January 2017
3.878 1,17 — 800,000 — — — 800,000
Subtotal: 1,734,000 800,000 698,000 — — 1,836,000
Employees in aggregate
29 April 2009 29 April 2010 to28 April 2013
0.684 1,7 4,918,000 — 1,918,000 — 3,000,000 0
9 April 2010 9 April 2011 to8 April 2014
0.750 1,8 10,569,670 — 7,887,002 — 202,000 2,480,668
23 November 2010 23 November 2011 to 22 November 2014
0.760 4,9 8,902,000 — — — 50,000 8,852,000
20 May 2011 20 May 2012 to19 May 2015
1.450 1,10 22,729,668 — 6,961,004 — 503,334 15,265,330
25 July 2011 25 July 2012 to24 July 2015
1.506 3,11 500,000 — 500,000 — — 0
19 January 2012 19 January 2013 to18 January 2016
1.072 1,12 36,200,000 — 7,436,560 — 636,668 28,126,772
16 April 2012 16 April 2013 to15 April 2016
1.240 4,13 6,000,000 — 300,000 — — 5,700,000
18 June 2012 18 June 2013 to17 June 2016
1.160 4,14 5,000,000 — 364,000 — — 4,636,000
22 November 2012 22 November 2013 to21 November 2016
2.610 4,15 8,000,000 — 1,672,000 — — 6,328,000
22 November 2012 22 November 2013 to21 November 2016
2.610 1,15 720,276 — 22,000 — 216,644 481,632
28 December 2012 28 December 2013 to27 December 2016
3.820 1,16 128,800 — — — — 128,800
10 January 2013 10 January 2014 to9 January 2017
3.878 1,17 — 30,700,000 — — 63,200 30,636,800
21 June 2013 21 June 2014 to 20 June 2019
5.742 5,18 — 500,000 — — — 500,000
28 June 2013 28 June 2014 to 27 June 2019
5.600 5,19 — 298,000 — — — 298,000
16 August 2013 16 August 2014 to 15 August 2019
5.570 5,20 — 70,000 — — — 70,000
20 November 2013 20 November 2014 to 19 November 2019
4.960 5,21 — 246,000 — — — 246,000
Subtotal: 103,668,414 31,814,000 27,060,566 — 4,671,846 103,750,002
Total: 116,582,414 35,640,000 31,924,566 — 4,671,846 115,626,002

Directors’ Report
50 Anton Oilfield Services Group
Notes:
1. The option period for the share options granted above commences on the date of grant and ends on the last day of forty-eight months counting respectively from the said date. The grantees are vested with, and entitled to exercise up to one-third of their share options during the option period commencing from each of first, second and third anniversaries of the date of grant.
2. The option period for the share options granted above commences on the date of grant and ends on the last day of thirty-six months counting respectively from the said date. The grantees are vested with, and entitled to exercise up to 50% of their share options during the option period commencing from each of first and second anniversaries of the date of grant.
3. The option period for the share options granted above commences on the date of grant and ends on the last day of forty-eight months counting respectively from the said date. The grantees are vested with, and entitled to exercise all of their share options during the option period commencing from each of first anniversary of the date of grant until the expiry date.
4. The grantee may not exercise the options to subscribe for shares until after twelve months from the date of grant. If the grantee has worked for less than twelve months, all options of the grantee will lapse automatically and will no longer be exercisable. If the grantee has worked for thirty-six months or above, the grantee can exercise all options. If the grantee has worked for twelve months or above but less than thirty-six months, the number of effective options the grantee actually obtains is “the number of options granted X the number of working quarters of the grantee/12 (only the number of full quarters is counted)”. The remaining options will lapse automatically. All options are entitled to be exercised before the forth anniversaries of the date of grant.
5. The option period for the share options granted above commences on the date and ends on the last day of seventy-two months counting respectively from the said date. The grantees are vested with, and entitled to exercise up to one-third of their share options during the option period commencing from each of first, second and third anniversaries of the date of grant.
6. The closing price of the Company’s shares listed on the Stock Exchange immediately before the date on which the options were granted was HK$1.63*.
7. The closing price of the Company’s shares listed on the Stock Exchange immediately before the date on which the options were granted was HK$0.63*.
8. The closing price of the Company’s shares listed on the Stock Exchange immediately before the date on which the options were granted was HK$0.75*.
9. The closing price of the Company’s shares listed on the Stock Exchange immediately before the date on which the options were granted was HK$0.76*.
10. The closing price of the Company’s shares listed on the Stock Exchange immediately before the date on which the options were granted was HK$1.44*.
11. The closing price of the Company’s shares listed on the Stock Exchange immediately before the date on which the options were granted was HK$1.52*.
12. The closing price of the Company’s shares listed on the Stock Exchange immediately before the date on which the options were granted was HK$1.08*.
13. The closing price of the Company’s shares listed on the Stock Exchange immediately before the date on which the options were granted was HK$1.28*.
14. The closing price of the Company’s shares listed on the Stock Exchange immediately before the date on which the options were granted was HK$1.16*.
15. The closing price of the Company’s shares listed on the Stock Exchange immediately before the date on which the options were granted was HK$2.60*.
16. The closing price of the Company’s shares listed on the Stock Exchange immediately before the date on which the options were granted was HK$3.70*.
17. The closing price of the Company’s shares listed on the Stock Exchange immediately before the date on which the options were granted was HK$3.54*.
18. The closing price of the Company’s shares listed on the Stock Exchange immediately before the date on which the options were granted was HK$5.73*.
19. The closing price of the Company’s shares listed on the Stock Exchange immediately before the date on which the options were granted was HK$5.47*.
20. The closing price of the Company’s shares listed on the Stock Exchange immediately before the date on which the options were granted was HK$5.63*.
21. The closing price of the Company’s shares listed on the Stock Exchange immediately before the date on which the options were granted was HK$4.99*.
* Source from Bloomberg
Directors’ Report
Annual Report 2013 51
SUFFICIENCY OF PUBLIC FLOAT
Based on the information publicly available to the Company and within the knowledge of the Directors, the Company has maintained the sufficiency of public float requirement as specified in the Listing Rules to the date of this Annual Report.
TAXATION
For the year ended 31 December 2013, no foreign shareholder who is not resident of the PRC is liable for individual or Enterprise Income Tax, Capital Gains Tax, Stamp Duty or Estate Duty of the PRC in relation to their holding of shares of the Company. Shareholders are urged to consult their tax advisers regarding the PRC, Hong Kong and other tax consequences of owing and disposing of the Company’s shares.
DONATION
For the year ended 31 December 2013, the Company contributed a total of RMB2.6 million as charitable and other donations. In the future, the Company will continue to fulfill its commitment to be an enterprise with sound social responsibilities.
RELATED PARTY/CONTINUING CONNECTED TRANSACTIONS
The related party transactions for the year ended 31 December 2013 are set out in Note 35 to the Financial Statements of this Annual Report.
On 24 April 2013, the Company entered into a master mutual supply and purchase agreement with Schlumberger (“Master Agreement”), pursuant to which the Group agreed to supply products and services to Schlumberger and Schlumberger agreed to supply and procure its affiliates to supply to the Group products and services for a period of three financial years until 31 December 2015. Please refer to the announcement of the Company dated 24 April 2013 and the circular of the Company dated 16 May 2013 for further details.
Schlumberger is a substantial shareholder of the Company interested in approximately 19.58% of the issued share capital of the Company as at 31 December 2013. Accordingly, Schlumberger is a connected person of the Company for the purpose of the Listing Rules and the entering into of the Master Agreement between the Company and Schlumberger constituted continuing connected transactions for the Company under Chapter 14A of the Listing Rules. Further, as the aggregate annual amount of the transactions under the Master Agreement exceeds 5% of the applicable ratios, the Master Agreement is subject to the reporting, announcement and Independent Shareholders’ (as defined in the Announcement) approval requirements under Rule 14A.35 of the Listing Rules.
The Master Agreement was approved by the Independent Shareholders at an extraordinary general meeting of the Company held on 3 June 2013.
The transaction amounts pursuant to the Master Agreement during the financial year of 2013 were as follows:
RMB’000 US’000
Supply of Products and Services by the Group to Schlumberger or Affiliates 6,652 1,091Supply of Products and Services by Schlumberger or Affiliates to the Group 203,267 33,339
* The translation of Renminbi amounts into US dollar amounts has been made at rate of RMB6.0969 to US$1.00. The exchange rates are in the release of Bank of China on 31 December 2013.
Directors’ Report
52 Anton Oilfield Services Group
The Independent Non-executive Directors have reviewed the continuing connected transactions set out above and have confirmed that they were entered into:
(i) in the ordinary and usual course of business of the Group;
(ii) on normal commercial terms or on terms no less favourable to the Group than terms available to or from independent third parties; and
(iii) in accordance with the relevant agreement governing them on terms that are fair and reasonable and in the interests of the shareholders of the Company as a whole.
PricewaterhouseCoopers, the Company’s auditors, were engaged to report on the Group’s continuing connected transaction in accordance with Hong Kong Standard on Assurance Engagements 3000 Assurance Engagements Other Than Audits or Reviews of Historical Financial Information and with reference to Practice Note 740 Auditor’s letter on Continuing Connected Transactions under the Hong Kong Listing Rules issued by the Hong Kong Institute of Certified Public Accountants. PricewaterhouseCoopers have issued their unqualified letter containing their findings and conclusions in respect of the continuing connected transaction disclosed above by the Company in accordance with Rule 14A.38 of the Listing Rules. A copy of the auditors’ letter has been provided by the Company to the Stock Exchange.
POST BALANCE SHEET EVENT
At a meeting held on 18 March 2014, the Board recommended a final dividend to be paid out of the share premium account of the Company in respect of the year ended 31 December 2013 of RMB0.0547 per share, totaling RMB120.0 million (2012: RMB0.0456 per share, totaling RMB98.3 million). This dividend is subject to the approval of shareholders at the AGM to be held on 29 May 2014, and compliance with the Companies Law of the Cayman Islands.
AMENDMENTS TO THE MEMORANDUM AND ARTICLES OF ASSOCIATION
There was no significant change in the Company’s constitutional documents during the year ended 31 December 2013.
AUDIT COMMITTEE
Pursuant to the requirements of the Code and the Listing Rules, the Company has established an audit committee (the “Audit Committee”) comprising all three Independent Non-executive Directors, namely, Mr. Zhu Xiaoping (Chairman of the Audit Committee), Mr. Zhang Yongyi and Mr. Wang Mingcai. The Audit Committee has reviewed the audited financial statements for the year ended 31 December 2013.
AUDITORS
The Company has appointed PricewaterhouseCoopers as the auditors of the Company for the year ended 31 December 2013. PricewaterhouseCoopers has conducted the audit of the financial statements which were prepared in accordance with International Financial Reporting Standards (“IFRS”). A resolution for their re-appointment as auditors of the Company for the year ending 31 December 2014 will be proposed at the AGM.
By the order of the Board
Luo Lin
Chairman
18 March 2014

PROFILES OF DIRECTORSAND SENIOR MANAGEMENT
Annual Report 2013 53
EXECUTIVE DIRECTORS
LUO Lin (羅林), aged 47, is the Chairman and Chief Executive Officer and the founder of the Group and is responsible for the overall business of the Group. Prior to establishing the Group, Mr. Luo worked at the Tarim Basin and was the Deputy General Manager of a subsidiary of the Southwest Petroleum Bureau (西南石油局) responsible for marketing from 1992 to 1999. Mr. Luo has 22 years of experience in the petroleum industry. He has an Executive Master of Business Administration (EMBA) degree from Tsinghua University and a bachelor’s degree in well bore engineering from Southwest Petroleum Institute (西南石油學院). Mr. Luo is also a certified lawyer and a chartered accountant in the PRC.
WU Di (吳迪), aged 47, is an Executive Director of the Company. Mr. Wu joined the Group in 2010, and is now an Executive Vice President in charge of the business in Erdos Basin. Prior to joining the Group, Mr. Wu was employed by China National Petroleum Corporation (CNPC) between 1990 and 2010 and was appointed as the Chief Geologist of the Development Business Department of Tarim Oilfield Company (塔里木油田分公司) and the Director of its Development Department. He has more than 24 years of experience in the petroleum industry. Mr. Wu has a master’s degree in oil and gas field development engineering from China University of Petroleum, Beijing and a bachelor’s degree in oil reservoir engineering from Southwest Petroleum Institute (西南石油學院), and is also a senior engineer with professorship.
LIU Enlong (劉恩龍), aged 52, is an Executive Director of the Company. Mr. Liu joined the Group in 2010, and is now an Executive Vice President in charge of the drilling technology cluster of the Group. Prior to joining the Group, Mr. Liu was employed by Canadian Energy Technology Company in 2005 responsible for technical services, employed by CNPC between 1982 and 2001, and was appointed as the Deputy Manager and Chief Engineer of Tarim Oilfield No.4 Exploration Corporation (塔里木油田第四勘探公司) in 1997. He has more than 32 years of experience in the petroleum industry. Mr. Liu has a bachelor’s degree in well bore engineering from Jianghan Petroleum Institute (江漢石油學院) and is also a senior engineer in well bore engineering.
NON-EXECUTIVE DIRECTOR
Jean Francois Poupeau, aged 52, is a Non-executive Director of the Company. Mr. Poupeau has over 28 years of oilfield services and drilling experiences in the global oilfield services industry. After obtaining a bachelor degree in Geology from the Tulane University of New Orleans, U.S.A. in 1983, and a master’s degree in Petroleum Engineering from the same university in 1985, Mr. Poupeau joined Schlumberger Limited (“Schlumberger”), the world’s leading oilfield services company. From July 2007 to May 2010, Mr. Poupeau was President of the Drilling and Measurements business segment of Schlumberger and from May 2010 to April 2012, Mr. Poupeau was the President of the Drilling Group of Schlumberger. Mr. Poupeau is currently an Executive Vice President of Schlumberger.
INDEPENDENT NON-EXECUTIVE DIRECTORS
ZHANG Yongyi (張永一), aged 78, is an Independent Non-executive Director of the Company. Mr. Zhang has extensive experience in the petroleum industry. Mr. Zhang was appointed as the Deputy General Manager of CNPC in 1992. Prior to this, he had taught in the Southwest Petroleum Institute (西南石油學院) for more than 32 years. Mr. Zhang was appointed as Chairman of the Supervisory Committee for State-owned Large and Medium Enterprises (國有大中型企業監事會主席) in 2000 and appointed by the State Council of the PRC as inspector (國務院稽察特派員) in 1998.
ZHU Xiaoping (朱小平), aged 65, is an Independent Non-executive Director of the Company. Mr. Zhu has extensive experience in corporate finance and is currently an Accounting Professor of the Renmin University of China (中國人民大學). He served as the Director of the China Accounting Society (中國會計學會理事) and Director of the China Audit Society (中國審計學會理事). Mr. Zhu is also a Director of Tibet Rhodiola Pharmaceutical Holding Company Limited (西藏諾迪康藥業股份有限公司) and China Resources Double-crane Pharmaceutical Co., Ltd. (華潤雙鶴藥業股份有限公司), both of which are listed on the Shanghai Stock Exchange.

Profiles of Directors and Senior Management
54 Anton Oilfield Services Group
WANG Mingcai (王明才), aged 69, is an Independent Non-executive Director of the Company. Mr. Wang has extensive experience in the petroleum industry, and was the General Manager and Chairman of the board of directors of Sino-U.S. Oil Development Corporation (中美石油開發公司). Mr. Wang has previously worked as the Vice Chief Engineer of Exploring and Development Bureau of China National Petroleum Company (中國石油天然氣總公司). He also held positions such as Vice General Manager of China National Oil & Gas Exploration and Development Corporation (中國石油天然氣堪探開發公司), President of CNPC Venezuela Corporation (中油國際委內瑞拉公司), Executive Director of CNPC (Hong Kong) Limited (中國 (香港)石油有限公司) (Stock Code: 0135), a company that has been listed on the Main Board of the Stock Exchange since 2001.
SENIOR MANAGEMENT
PI Zhifeng (皮至峰), aged 36, is a President of the Company, and supports the Chief Executive Officer on managing the business of the Company. He is in charge of strategic development, business management and strategic marketing of the Group. Mr. Pi joined the Group in 2004, and was responsible for the management of strategies, business establishment and capital market. Prior to joining the Group, Mr. Pi was responsible for investment in China Chengxin Financial Consultancy Co., Ltd (中誠信財務顧問有限公司). Mr. Pi has a Master of Business Administration degree from the University of Chicago Booth School of Business in the U.S.
FAN Yonghong (范永洪), aged 43, is an Executive Vice President of the Company, and is in charge of market operations, operational management and informatization of the Group. Mr. Fan joined the Group in 2004, and was responsible for the setup of the well service business and the management of business clusters of the Group. Prior to joining the Group, Mr. Fan was employed by PetroChina Tarim Oilfield Company (中石油塔里木油田分公司) between 1991 and 2004 and once served as the deputy section chief. He has 18 years of experience in the petroleum industry. Mr. Fan has an Executive Master of Business Administration (EMBA) degree from China Europe International Business School (CEIBS) and graduated from China University of Petroleum, majoring in petroleum engineering.
SHEN Haihong (沈海洪), aged 45, is an Executive Vice President of the Company, and is in charge of QHSE management, manufacturing and supply chain management. Mr. Shen joined the Group in 2007, and was in charge of the tubular service cluster as well as operational management and operational support of the Group. Prior to joining the Group, Mr. Shen was employed by CNPC between 1991 and 2006 and was appointed as the deputy general manager of Toha Oilfield Drilling Company (吐哈石油鑽井公司), and as the deputy director of the Enterprises Department of Toha Directorate (吐哈指揮部企管處). He has more than 24 years of experience in the petroleum industry. Mr. Shen has a Master of Business Administration degree from Tsinghua University and a bachelor’s degree in well bore engineering from Southwest Petroleum Institute (西南石油學院), and is also a senior engineer in well bore engineering.
LI Kang (李康), aged 49, is an Executive Vice President of the Company, and is in charge of the Group’s human resources management. Mr. Li joined the Group in 2012. Prior to joining the Group, Mr. Li was the human resources director of Asia-Pacific region at Motorola. He has 21 years of experience in human resources management. Mr. Li has a doctoral degree in management science from Tianjin University (天津大學).
MA Enhai (馬恩海), aged 50, is an Executive Vice President of the Company, and is in charge of financial management of the Group. Mr. Ma joined the Group in 2010. Prior to joining the Group, Mr. Ma was appointed as the general manager of financial department of Lenovo Group (聯想集團), the chief financial officer of Ramaxel Group (記憶集團) and the chief financial officer of Liando Group (聯東集團). He has more than 23 years of experience in financial accounting and management. Mr. Ma has an Executive Master of Business Administration (EMBA) degree from Tsinghua University.

Profiles of Directors and Senior Management
Annual Report 2013 55
LI Bingnan (李冰南), aged 45, is an Executive Vice President of the Company, and is in charge of the well completion cluster of the Group. Mr. Li joined the Group in 2002, and was responsible for the business development of the Group in the early stage, marketing in the northwest market, management of the tubular service cluster, and human resources management of the Group. Prior to joining the Group, Mr. Li was employed by Jianghan Petroleum Bureau (江漢石油管理局) between 1991 and 2002, and was appointed as a manager for the environmental protection equipment plant of the Jianghan Petroleum Bureau in 2000. He has more than 23 years of experience in the petroleum industry. Mr. Li has an Executive Master of Business Administration (EMBA) degree from China Europe International Business School (CEIBS) and has a bachelor’s degree in well bore engineering from Jianghan Petroleum Institute (江漢石油學院).
LI Jingqun (李靜群), aged 50, is an Executive Vice President of the Company, and is in charge of the down-hole operation cluster of the Group. Mr. Li joined the Group in 2012. Prior to joining the Group, Mr. Li was Deputy Chief Engineer of CNPC Changqing Drilling and Exploration Company (中石油長慶鑽探). He has 27 years of experience in the petroleum industry. Mr. Li has a master’s degree majoring in coal, oil and gas geology and exploration from Jianghan Petroleum Institute (江漢石油學院).
CHEN Wei (陳偉), aged 49, is an Executive Vice President of the Company, and is in charge of the business in the SouthWest area. Mr. Chen joined the Group in 2000, and was responsible for the management of the down-hole operation cluster, business development of the Group in the early stage and marketing in the southwest area and the domestic market. Prior to joining the Group, Mr. Chen was employed by CNPC between 1982 and 2000 responsible the for the general management of Chuan Zhong Oil and Gas Company (川中油氣公司). He has more than 30 years of experience in the petroleum industry. Mr. Chen has a bachelor’s degree in well bore engineering from Southwest Petroleum Institute (西南石油學院).
MA Jian (馬健), aged 46, is an Executive Vice President of the Company, and is in charge of the international business of the Group. Mr. Ma joined the Group in 2002, and was responsible for business development of the Group in the early stage, marketing in the domestic market and various management operations. Prior to joining the Group, Mr. Ma worked at Halliburton China from 2000 to 2002 as a Well Bore Projects Manager. From 1991 to 1999, he worked as a Petroleum Engineer at the drilling company in Jianghan Oilfield (江漢油田鑽井工程處), and has 23 years of experience in the petroleum industry. Mr. Ma has a doctoral degree from China University of Petroleum and is a guest professor at Yangtze University (長江大學). Mr. Ma has a master’s degree in business administration from Huazhong University of Science and Technology (華中科技大學) and a bachelor’s degree in well bore engineering from Jianghan Petroleum Institute (江漢石油學院).
COMPANY SECRETARY
Dr. NGAI Wai Fung (魏偉峰), aged 52, is the Company Secretary of the Company. Dr. Ngai currently is the director and chief executive officer of SW Corporate Services Group Limited. He is the vice president of the Hong Kong Institute of Chartered Secretaries. Dr. Ngai has over 22 years’ experience and knowledge in senior management and professional matters in listed companies, including IPO, Merger and Acquisition, corporate financing, internal control, governance and company secretary etc. Dr. Ngai is a fellow of the Hong Kong Institute of Chartered Secretaries and a fellow of the Institute of Chartered Secretaries and Administrators in the United Kingdom. He also is a member of the Hong Kong Institute of Certified Public Accountants and a fellow member of the Association of Chartered Certified Accountants in the United Kingdom. Dr. Ngai obtained a Doctorate in Finance from the Shanghai University of Finance and Economics, a Master’s degree in Corporate Finance from the Hong Kong Polytechnic University, a Master’s degree in Business Administration (MBA) from Andrews University of the United States and a Bachelor’s degree (Honours) in Law from the University of Wolverhampton, the United Kingdom.

CORPORATE GOVERNANCE REPORT
56 Anton Oilfield Services Group
Since the listing of its shares on 14 December 2007 on the Stock Exchange, the Company has been implementing the principles of the Code and adopted the Code Provision under Appendix 14 of the Listing Rules as its own code. The Company has been in compliance with all the applicable Code Provisions (other than those deviating from Code A.2.1 of the Code Provisions).
Under the structure of the existing Board of Directors, there are three Executive Directors, one Non-executive Director and three Independent Non-executive Directors to ensure the independent and objective running of the Board, and the relevant board committees play an important role in the Company’s decision-making, monitoring and advisory work.
CORPORATE GOVERNANCE STRUCTURE
As the core of corporate governance for the Company, the Board has distinct duties from those of the management. The Board is responsible for providing direction to and effective supervision of the management, while the management is in charge of executing established strategies and directions. Generally speaking, the Board is responsible for:
‧ Formulating long term strategies and supervising their execution of the Group, its subsidiaries and associated companies
‧ Approval of operational plan and financial budget
‧ Approval of the relevant annual and interim results
‧ Reviewing and monitoring the risk management and internal control of the Group
‧ Ensuring good corporate governance and compliance
The Board authorised the management to execute established strategies and directions, the management is in charge of daily operation and reports to the Board. Accordingly, the Board has set out clear written guidelines, in particular, it clearly determined the scope of authority of the management, and those items requiring the Board’s approval.
There are agreed procedures for the Directors, upon reasonable request, to seek independent professional advice at the Company’s expense in appropriate circumstances.
BOARD OF DIRECTORS
Board Composition
The constitution of Board of Directors adheres strictly to the principle of ensuring balance, fairness and diversity in the backgrounds of our Board members, and the Board strives to recruit the most suitable candidates to lead the Group towards a rapid and healthy growth. As at the date of this Annual Report, the Board currently comprises three Executive Directors namely, Mr. Luo Lin, Mr. Wu Di, Mr. Liu Enlong and, one Non-executive Director namely, Mr. Jean Francois Poupeau and three Independent Non-executive Directors namely, Mr. Zhang Yongyi, Mr. Zhu Xiaoping and Mr. Wang Mingcai. The Chairman of the Company is Mr. Luo Lin. The background of these Directors brings different expertise and experiences to the Board. The biographical details of all Directors are set out under the section “Profiles of Directors and Senior Management” of this Annual Report.
To the best knowledge of the Company, there is no relationship (including financial, business, family or other material relationship) among members of the Board.

Corporate Governance Report
Annual Report 2013 57
Board Diversity
The Board recognised the benefits of diversity in the Board in enhancing the Board effectiveness and corporate governance. In this regard, the Board has adopted a Board Diversity Policy (the “Board Diversity Policy”) in August 2013 which sets out the approach to achieving diversity on the Board. The Nomination Committee will give consideration to a number of factors as set out in the Board Diversity Policy when identifying suitably qualified candidates to become members of the Board, including but not limited to gender, age, cultural and educational background, ethnicity, professional experience, industry experience, skills, knowledge and length of service. The Board is considered well balanced and of a diverse mix appropriate for the needs of the Company. The Company will also take into account its own business model and specific needs from time to time to determine the optimal composition of the Board. The Nomination Committee will review the Board Diversity Policy on a regular basis to ensure its continued effectiveness.
Chairman and Chief Executive Officer
Code Provision A.2.1 of the Code stipulates that the roles of chairman and chief executive should be separate and should not be performed by the same individual. The division of responsibilities between the chairman and chief executive should be clearly established and set out in writing. The Company does not separate the Chairman’s and Chief Executive Officer’s duties. Mr. Luo Lin served as both Chairman and Chief Executive Officer during the reporting period. Mr. Luo was the main founder of the Group, he has been responsible for the operational management since the Group’s establishment, and was instrumental to leading the development of the Group. Mr. Luo possesses rich petroleum industry experience and excellent operational management ability. The Board is of the view that continuing to have Mr. Luo to serve as Chief Executive Officer of the Company will safeguard the continuity of the operational management and can protect shareholders’ interest.
Independence of Independent Non-Executive Directors
The Company has received annual confirmation letters from all the Independent Non-executive Directors confirming their independence pursuant to Rule 3.13 of the Listing Rules. Consequently, the Board is of the opinion that all the current Independent Non-executive Directors comply with the relevant guidelines set out in Rule 3.13 of the Listing Rules, thus the Company regards all the Independent Non-executive Directors as independent parties.
In 2013, the Company has complied with the requirements of Rule 3.10 of the Listing Rules and has at least three Independent Non-executive Directors, including one Independent Non-executive Director, Mr. Zhu Xiaoping, with appropriate professional qualifications or accounting or related financial management expertise. Throughout the year, the Board has at least one-third in number of its members comprising Independent Non-executive Directors in compliance with Rule 3.10A of the Listing Rules.
All Independent Non-executive Directors have served the Board since 17 November 2007.
Appointment And Re-Election of The Directors
The term of the appointment for Executive Directors and Non-executive Director is three years and for Independent Non-executive Directors is one year. According to the Company’s Articles of Association, at every annual general meeting of the Company, one-third of the current Directors shall retire from office by rotation (or if the number of Directors is not three or a multiple of three, then the nearest but not less than one-third) provided that each Director (including those appointed for a specific term but not including those appointed to fill a casual vacancy or as an addition to the existing Board in accordance with Articles 114 and 115) must retire by rotation at least once every three years. The retiring Directors can be re-elected and continue to participate in the relevant meeting in the capacity as Director.
Newly appointed Directors will receive induction packages containing the duties and responsibilities of directors under the Listing Rules and other applicable rules and regulations.

Corporate Governance Report
58 Anton Oilfield Services Group
The Company has arranged appropriate insurance cover to indemnify the Directors and officers of the Group for their potential liabilities incurred by them in discharging their duties.
Corporate Governance Functions
The Board has adopted the written terms of reference on corporate governance functions in March 2012 so as to assist the Board in performing corporate governance functions. The relevant authority and duties are clearly set out in its terms of reference which are summarized as follows:
(a) To develop and review the Company’s policies and implementation on corporate governance;
(b) To review and monitor the training and continuous professional development of Directors and senior management;
(c) To review and monitor the Company’s policies and implementation on compliance with legal and regulatory requirements;
(d) To develop, review and monitor the code of conduct and compliance manual (if any) applicable to employees and directors; and
(e) To review the Company’s compliance with the Code Provisions of Appendix 14 to the Listing Rules and disclosure in the Corporate Governance Report.
The following is a summary of the work performed by the Board on corporate governance functions during 2013:
(a) Reviewed the Company’s corporate governance policy and analyzed the best corporate governance practices;
(b) Formulated and accepted the terms of reference of the QHSE (Quality, Health, Safety, Environment) Committee;
(c) Discussed and amended the terms of reference of the Nomination Committee; and
(d) Reviewed the Board composition, discussed and formulated the Board Diversity Policy of the Board.
DIRECTORS’ SECURITIES TRANSACTIONS
The Directors have adopted the Model Code set out in Appendix 10 to the Listing Rules as the code of practice for carrying out securities transactions by the Directors. After specific enquiry with all members of the Board, the Company confirms that all Directors have fully complied with the relevant standards stipulated in the above-mentioned rules during the reporting year.

Corporate Governance Report
Annual Report 2013 59
CONTINUOUS PROFESSIONAL DEVELOPMENT
During the year ended 31 December 2013, the Directors confirmed that they have complied with the Code Provision A.6.5 of the Code on Directors’ training. During the year, all the Directors have participated in continuous professional development by attending seminars and/or reading materials on the following topics to develop and refresh their knowledge and skills and provided a record of training to the Company.
Name of Directors Topics on training covered (Notes) Hours
Mr. Luo Lin C, L, R 7Mr. Liu Enlong C, L, R 7Mr. Wu Di C, L, R 7Mr. Jean Francois Poupeau C, L, R 7Mr. Zhang Yongyi C, L, R 7Mr. Zhu Xiaoping C, L, R 7Mr. Wang Mingcai C, L, R 7
Notes:
C: Corporate governance
L: Listing Rules updates
R: Other relevant regulatory updates
BOARD/BOARD COMMITTEE MEETINGS AND GENERAL MEETINGS
The Company set up the Audit Committee, Remuneration Committee and Nomination Committee on 17 November 2007 and set up QHSE (“Quality, Health, Safety, Environment”) committee on 21 January 2013. During the reporting year, the Company had convened eight Board of Directors’ meetings, two Audit Committee meetings, one Remuneration Committee meeting, one Nomination Committee meeting and one QHSE committee meeting. Also, the Company had convened one Annual General Meeting and one Extraordinary General Meeting during the reporting year.
Attendances of meetings by Directors during the reporting year were set out in the table below:
Meeting attendance/number of meetings
Directors
Board
Meeting
Audit
Committee
Meeting
Remuneration
Committee
Meeting
Nomination
Committee
Meeting
QHSE
Committee
Meeting
Annual
General
Meeting
Extra
General
Meeting
Executive Directors
Mr. Luo Lin (Chairman of the Board and Chief Executive Officer) 8/8 N/A 1/1 1/1 1/1 1/1 1/1Mr. Wu Di 8/8 N/A N/A N/A N/A 1/1 1/1Mr. Liu Enlong 8/8 N/A N/A N/A 1/1 1/1 1/1
Non-executive Director
Mr. Jean Francois Poupeau 8/8 N/A N/A N/A 1/1 1/1 1/1
Independent Non-executive
Directors
Mr. Zhang Yongyi 8/8 2/2 N/A 1/1 N/A 1/1 1/1Mr. Zhu Xiaoping 8/8 2/2 1/1 N/A N/A 1/1 1/1Mr. Wang Mingcai 8/8 2/2 1/1 1/1 N/A 1/1 1/1
Corporate Governance Report
60 Anton Oilfield Services Group
In addition to the Board Meetings for results announcement, which are held twice per year, the Company also holds Board Meetings every quarter (“Quarterly Meetings”) to better exercise the strategic and monitoring roles of the Board. Senior management is invited to attend to enhance Board and management communications. The Company’s Quarterly Meetings mainly focus on key issues in four areas, i.e. strategic work, operation status, financial operation and budgeting, and capital market. Each quarter, a summary report is made on these four areas in the previous quarter and discussions are conducted on the plans in these areas for the next quarter. During the reporting period, the dates of holding Quarterly Meeting were set out as follows:
1st Quarterly
Meeting
2nd Quarterly
Meeting
3rd Quarterly
Meeting
4th Quarterly
Meeting
Date 21 January 2013 15 April 2013 12 July 2013 27 September 2013
MONTHLY MANAGEMENT REPORT
During the inter-sessional period, each Executive Director receives a copy of the financial report and the management report each month, and holds business meetings with the management to obtain information of monthly operating conditions, monitor business progress, and mentor the management with effective planning.

Corporate Governance Report
Annual Report 2013 61
BOARD COMMITTEES
The Board has established the Audit Committee, Remuneration Committee and Nomination Committee (all chaired by Independent Non-executive Director) with defined terms of reference (available on the Company’s website) since the listing of the Company, which are on no less exacting terms than those set out in the Corporate Governance Code.
In addition, the Board has also established QHSE (“Quality, Health, Safety, Environment”) Committee (chaired by Non-executive Director) on 21 January 2013.
Each Committee has authority to engage outside consultants or experts as it considers necessary to discharge the Committee’s responsibilities. To further reinforce independence and effectiveness, all Audit Committee members are Independent Non-executive Directors, and the Nomination and Remuneration Committees have been structured with a majority of Independent Non-executive Directors as members since their establishment in November 2007.
Audit Committee
The Company has set up the Audit Committee since 17 November 2007 which took effect upon listing of the Company.
There are three members in the Audit Committee, all of them are the Independent Non-executive Directors, namely Mr. Zhu Xiaoping, Mr. Zhang Yongyi and Mr. Wang Mingcai. Mr. Zhu Xiaoping is the Chairman of the Audit Committee. Mr. Zhu Xiaoping has appropriate professional qualifications or accounting or related financial management expertise as required under Rule 3.10 (2) of the Listing Rules. The authority and duties of this Committee are clearly set out in its terms of reference.

Corporate Governance Report
62 Anton Oilfield Services Group
The major roles and functions of the Audit Committee are as follows:
(a) To monitor the relationship between the Company and the external auditors, make proposals to the Board on the appointment, renewal and dismissal of the external auditors of the Group as well as the relevant remuneration and terms of appointment;
(b) To review the Company’s financial information; and
(c) To oversee of the Company’s financial reporting system and internal control procedures.
The Audit Committee held 2 meetings during 2013 and the following major matters were reviewed and discussed in the meetings:
(a) Reviewed the annual results of 2012 and the Interim results of 2013 and made recommendations to the Board for approval;
(b) Made recommendation on the re-appointment of the auditor; and
(c) Reviewed the financial reporting system and the internal control system.
Remuneration Committee
The Company has set up the Remuneration Committee since 17 November 2007 which took effect upon listing of the Company. The Remuneration Committee comprises two Independent Non-executive Directors, Mr. Wang Mingcai and Mr. Zhu Xiaoping, and one Executive Director, Mr. Luo Lin. Mr. Wang Mingcai is the Chairman of the Remuneration Committee. The authority and duties of this Committee are clearly set out in its terms of reference.
The major roles and functions of the Remuneration Committee are as follows:
(a) To review and recommend the terms of remuneration, benefits, bonus and other allowances of the Directors and senior management;
(b) To submit proposals to the Board on the remuneration policy and structure of all the Directors and senior management; and
(c) To approve and monitor the execution of the Company’s Share Option Scheme.
The Board has authority to approve the recommendations made by the Remuneration Committee.
The Remuneration Committee held 1 meeting during 2013 and the following major matters were reviewed and discussed in the meeting:
(a) The remuneration system and the payroll standard of Directors and senior management in the international and domestic oilfield service industries; and
(b) The proposed performance-based remuneration policy for Directors and senior management.
Corporate Governance Report
Annual Report 2013 63
Nomination Committee
The Company has set up the Nomination Committee since 17 November 2007 which took effect upon listing of the Company. The Nomination Committee is composed of two Independent Non-executive Directors, Mr. Zhang Yongyi and Mr. Wang Mingcai, and one Executive Director, Mr. Luo Lin. Mr. Zhang Yongyi is the Chairman of the Nomination Committee. The authority and duties of this Committee are clearly set out in its terms of reference.
The major roles and functions of the Nomination Committee are as follows:
(a) To review the structure, number and composition and diversity of the Board and make recommendation to the Board on the policy and procedures for the nomination of Directors;
(b) To identify individuals suitably qualified to become Board members and may select individuals nominated for directorship, and consider individuals on merit and against the objective criteria, with due regard for the benefits of diversity on the Board;
(c) To make recommendations to the Board on the appointment or re-appointment of Directors, succession planning for Directors, in particular the chairman and the chief executive;
(d) To review the independence of the Independent Non-executive Directors and submit proposals to the Board; and
(e) To review the Board Diversity Policy in particular the measurable objectives contained therein to ensure their appropriateness and the progress made towards achieving those objectives will be ascertained.
The Nomination Committee held 1 meeting during 2013 and the following major matters were reviewed and discussed in the meeting:
(a) Discussed and made recommendations to the Board on the Board Diversity Policy; and
(b) Discussed and amended the terms of reference of the Nomination Committee.
QHSE (“Quality, Health, Safety, Environment”) Committee
The Company set up the QHSE Committee on 21 January 2013. The QHSE Committee is composed of one Non-executive Director, Mr. Jean Francois Poupeau, and two Executive Directors, Mr. Luo Lin and Mr. Liu Enlong. Mr. Jean Francois Poupeau is the chairman of the QHSE Committee. The QHSE Committee is tasked with the responsibilities of providing guidance and advice on the quality, health, safety and environment (QHSE) strategies of the Company. QHSE represents an important standard for the oilfield services industry. The Company strives to introduce international standards to enhance its service level at home and abroad. The QHSE Committee meets at least once every year.
The major roles and functions of the QHSE Committee are as follows:
(a) To assist the Board to review the current status of the Company’s QHSE performance;
(b) To assist the Board with oversight of the Company’s QHSE management, reporting processes and systems;
(c) To assist the Board to formulate the Company’s QHSE plans and supervise its effective implementation; and
(d) To make recommendations to the Board in respect of matters affecting the Company’s QHSE standards.
The QHSE Committee held 1 meeting during 2013 and the following major matters were reviewed and discussed in the meeting:
(a) The building of a sound QHSE management system with reference to internationally accepted standards; and
(b) Establishment of a safety culture across the group and the incorporation of QHSE capability in staff evaluation model.
Corporate Governance Report
64 Anton Oilfield Services Group
REMUNERATION OF THE MEMBERS OF THE SENIOR MANAGEMENT BY BAND
Pursuant to Code B.1.5 of the Code Provisions, the remuneration of the members of the senior management by band for the year ended 31December 2013 was set out below:
Remuneration band Number of individuals
RMB 1,000,001 to RMB 1,500,000 7RMB 1,500,001 to RMB 2,100,000 2
ACCOUNTABILITY AND AUDIT
The Directors understand that they must assume the responsibility of preparing the financial accounts of each year. The Board was not aware of any material uncertainties relating to events or conditions that might cast significant doubt upon the Group’s ability to continue as a going concern and the Board has prepared the financial statements on a going concern basis.
The declaration of duties by the Auditors of the Group on the Group’s financial statements is contained on pages 71 and 72 of the Independent Auditor’s Report.
The Group has set up the Internal Audit Department, the Legal Department and the Quality Control Department in charge of the internal control and risk management duties. The Executive Directors of the Company receive internal financial report and management report every month for monitoring the operational progress of each business department and making reasonable planning.
During the year, the Group had reviewed its internal control system. Based on the review, the Board was satisfied with the effectiveness of the current internal control system of the Group, including the adequency of resources, staff qualifications and experience, training programmes and budget of the Group’s activity and financial reporting function.
AUDITORS’ REMUNERATION
An analysis of the remuneration for audit and non-audit services provided by the auditor appointed by the Group during the year is as follows:
2013 2012RMB ’000 RMB ’000
Audit services 3,800 3,700Non-audit services 550 — Total: 4,350 3,700
COMPANY SECRETARY
The Company Secretary is Dr. Ngai Wai Fung (“Dr. Ngai”), who has been appointed by the Board. Dr. Ngai is the director and chief executive officer of a corporate service provider, SW Corporate Services Group Limited. The primary corporate contact person at the Company is Mr. Pi Zhi Feng, the President.
Dr. Ngai has taken no less than 15 hours of relevant professional training during the financial year ended 31 December 2013 in compliance with Rule 3.29 of the Listing Rules.

Corporate Governance Report
Annual Report 2013 65
CORPORATE GOVERNANCE AWARDS
In 2013, the Group was named “Asia’s Most Promising Company on Corporate Governance” conferred by Corporate Governance Asia, “A Most Promising Company in China” conferred by The Asset, and also received “Golden Bauhinia Awards 2013” -- “Best Listed Company”.
SHAREHOLDERS’ RIGHTS
The Company encourages shareholders to attend shareholders’ meetings. Directors, chairman of each of Audit Committee, Remuneration Committee, Nomination Committee (or a delegated member of the Committee), chairman of the independent board committee (if any) and management will attend the annual general meeting of the Company to answer queries about the Group’s business.
In 2013, the Company had convened one annual general meeting (the “2013 AGM”). The 2013 AGM provided an ideal chance for communication between the Board and the shareholders. The Chairmen of the Board, Audit Committee, Remuneration Committee and Nomination Committee and the Company’s external auditor were all present at the AGM held on 3 June 2013, to answer shareholders’ inquiries.
THE PROCEDURES FOR SHAREHOLDERS TO CONVENE AN EXTRAORDINARY GENERAL
MEETING (“EGM”)
Pursuant to the Article 79 of the articles of association of the Company, any two or more members of the Company or any one member of the Company which is a recognised clearing house (or its nominee (s)) holding at the date of the requisition not less than one-tenth of the paid up capital of the Company which carries the right of voting at general meetings of the Company shall deposit the written requisition at the principal office of the Company in Hong Kong, which is presently situated at unit 2109, Cosco Tower, 183 Queen’s Road Central, Hong Kong, specifying the objects of the meeting and signed by the requisitionist(s)(the “Requisitionist(s)”).
The request will be verified with the Company’s branch share registrars in Hong Kong and upon their confirmation that the request is proper and in order, the company secretary of the Company will ask the Board to convene an EGM by serving sufficient notice in accordance with the statutory requirements to all the registered members. On the contrary, if the request has been verified is not in order, the shareholders will be advised of this outcome and accordingly, an EGM will not be convened as requested.
If within 21 days from the date of the deposit of the requisition the Board fails to proceed to convene such meeting to be held within a further 21 days, the Requisitionist(s) themselves or any of them representing more than one-half of the total voting rights of all of them, may convene a meeting in the same manner, as nearly as possible, as that in which meetings may be convened by the Board provided that any meeting so convened shall not be held after the expiration of three months form the date of deposit of the requisition, and all reasonable expenses incurred by the Requisitionist (s) as a result of the failure of the Board shall be reimbursed to them by the Company.
THE PROCEDURES AND CONTACT DETAILS FOR PUTTING FORWARD PROPOSALS AT
SHAREHOLDERS’ MEETING
The annual general meeting and other general meetings provide an important opportunity for shareholders to express their views and the Company encourages and promotes shareholder attendance and participation at general meetings.
Board members, in particular, the chairman or his delegates, appropriate members of management team and external auditors will attend annual general meetings to answer shareholders’ questions.
Shareholders attending at the annual general meeting and other general meetings are allowed to have a reasonable opportunity to ask questions regarding the items on the meeting agenda, including but not limiting to questions to the external auditor regarding the conduct of the audit and the preparation and content of the auditor’s report.

Corporate Governance Report
66 Anton Oilfield Services Group
CONSTITUTIONAL DOCUMENTS
There was no change in the Company’s constitutional documents during the year ended 31 December 2013.
THE PROCEDURES BY WHICH ENQUIRIES MAY BE PUT TO THE BOARD AND SUFFICIENT
CONTACT DETAILS TO ENABLE THESE ENQUIRIES TO BE PROPERLY DIRECTED
Shareholders, investors and members of the public should direct their questions about their shareholdings to the Company’s Branch Share Registrar in Hong Kong. The contact details for the Share Registrar are:
Computershare Hong Kong Investor Services Limited
17M Floor, Hopewell Centre183 Queen’s Road EastWanchai, Hong KongTelephone: (852) 2862 8628Fax: (852) 2865 0990Website: www.computershare.com
To contact the Company in relation to your query on investor relations, the contact details are as follows:
Tel: (86 10) 5739 7584 (852) 2907 7108Email: [email protected]
DISCLAIMERS
The information contained in the section headed “Shareholders’ Rights” in this report is for reference only and does not represent and shall not be regarded as legal or professional advice to the shareholders. Shareholders should seek their own independent legal advice as to their rights as shareholders of the Company. The Company disclaims any and all liabilities and losses that may be incurred by the shareholders for using or relying on any information contained in the section headed “Shareholders’ Rights” in this report.

Corporate Governance Report
Annual Report 2013 67
FINANCIAL CALENDAR 2014
Announcement of 2013 Results
18 March 2014
Last Day to Register for Attending 2014 Annual General Meeting
26 May 2014
2014 Annual General Meeting
29 May 2014
Last Day to Register for Receiving 2013 Final Dividends
4 June 2014
2013 Final Dividend Payment Date
Around 16 June 2014

EMPLOYEE RELATIONS
68 Anton Oilfield Services Group
TEAM
As at 31 December 2013, the Group had 2,213 permanent employees, an increase of 37.2% from 1,613 from last year. In addition, the outsourced labour amounted to 1,350 persons last year, up 43.6% from last year.
SYSTEM
In 2013, the Group optimized and adjusted the organizational structure in accordance with its regionalization strategy and continued to strengthen the creation of a strategic talents pool for long-term development. The Group formed systematic induction, training and job rotation arrangements for new graduate hires and continuously optimized the training mechanism for field engineers, while it also stepped up its efforts to attract, cultivate and develop international talent, with a view to providing manpower support for long-term business growth. The Group has also formulated HR information management system planning for the next 3-5 years and initiated upgrading of HR information system, in a bid to improve the level and efficiency of overall HR management.
In December 2013, the Group once again received the “100 Best HRM Companies” - “Best Human Resources Management Companies” and “Best Post-90s Employee Management Practice Award” instituted by 51job.com, a leading online recruitment company; also in December, 2013, the company received “HRA Best Recruitment Practice Award” from Human Resource Association for Chinese & Foreign Enterprises (HRA).
TALENT RECURITMENT AND INDENTIFICATION
Campus recruitment and internal talent cultivation have always constituted the core part of the Group’s HR strategy. In 2013, the Group continued to implement the “Talent First” strategy to enrich the talent reserve. It rolled out an 8-month long campus recruitment program at prestigious Chinese and foreign universities. In China, the Group targeted more than 100 well-known universities, including the nation’s key petroleum universities and top colleges such as Peking University, Tsinghua University and other foreign language universities. It also embarked on an overseas campus recruitment program last year and established a recruitment network abroad. The campus recruitment last year was the largest one we have had so far. Meanwhile, the Group also hired top talents and seasoned professionals from state-owned enterprises and Fortune 500 companies. Such effort, together with public recruitment, helped bring in hundreds of experienced professionals, many of them top-class engineers and management professionals.

Employee Relations
Annual Report 2013 69
TRAINING
The Group offered intensive training and on-the-job learning programs to the large number of new graduate hires, which have been formalized as standard procedures, methods and contents for trainees. As for field engineers, the Group put in place an industry-specific skillset training framework, initially establishing a tier-based technical skill requirement and training curricula. The Group also nurtured its own in-house trainers such as QHSE lecturers. In 2013, three quarters of the Group’s training programs were conducted by in-house trainers. The Group also cooperated with Schlumberger in areas of training last year, including in the HSE area.
EMPLOYEE RELATIONS
Anton employees, who are all united and confident, uphold the Company’s values and comply with the code of conduct. The Group cares for every employee’s physical and mental wellness, and emphasize on their happiness. In 2013, Anton organized a series of “All Employees Long-Distance Running” programs. The Group has a variety of employee societies and associations, such as the Anton Arts Ensemble and basketball, football, table tennis and badminton teams. Employees may choose to participate in any of these group activities based on their personal interest and individual strength. In 2013, the Company organized friendship games in badminton and table tennis. It also ran an action-packed calendar of employee events such as health seminar, speech contest, and suburban excursion. All these further improved the cohesiveness of the organization, greatly enhancing the employees’ identification and bonding with the Company and reflecting the care it takes for them.
In 2013, the Group proposed the initiative of “Going to the Frontline”, which was well received and implemented by the executives of all departments. They headed for the frontline, engaged with the customers, and interacted with the frontline employees, truly implementing a culture of engineers. By doing so, site engineers and frontline employees felt the care and importance the Group extended to them, which effectively motivated them as well as increased their enthusiasm for work and sense of belonging. The initiative not only helped the Group to better understand customers’ needs and solve their problems, but also propelled the Group’s own business and work.

INVESTOR RELATIONS
70 Anton Oilfield Services Group
The Group strives to maintain open and efficient communications with the capital market and keep the market abreast of its strategic development and operational update, aiming to achieve a fair reflection of our value by the market. Further to its previous efforts, the Group’s investor relations accomplished the following breakthroughs in 2013 and continued to be a company highly recognized by the capital market:
Successfully completed inaugural USD senior notes. Through this transaction, the Group became the first Chinese independent oilfield services provider to enter the international debt market, setting yet another record following the Group’s initial public offering on the international capital market in 2007, also a first among Chinese independent oilfield services providers;
Selected by Hang Seng Indexes Company Limited as a constituent of Hong Kong Infrastructure Index, Hang Seng Global Composite Index, and Hang Seng Index Composite Index Series;
established a regular mechanism on share repurchase to combine with dividends to optimize shareholder return;
Initiated by 14 sell-side analysts during the year, bringing the number of covered analysts of the Group to 26;
As at the last trading day of 2013, the Group’s market capitalization continued to witness year-on-year growth, with share price performance outperforming the Hang Seng Index.

INDEPENDENT AUDITOR’S REPORT
Annual Report 2013 71
Independent Auditor’s Report
To the shareholders of Anton Oilfield Services Group
(incorporated in the Cayman Islands with limited liability)
We have audited the consolidated financial statements of Anton Oilfield Services Group (“the Company”) and its subsidiaries (together, the “Group”) set out on pages 73 to 138, which comprise the consolidated and company balance sheets as at 31 December 2013, and the consolidated income statement, the consolidated statement of comprehensive income, the consolidated statement of changes in equity and the consolidated cash flow statement for the year then ended, and a summary of significant accounting policies and other explanatory information.
DIRECTORS’ RESPONSIBILITY FOR THE CONSOLIDATED FINANCIAL STATEMENTS
The directors of the Company are responsible for the preparation of consolidated financial statements that give a true and fair view in accordance with International Financial Reporting Standards and the disclosure requirements of the Hong Kong Companies Ordinance, and for such internal control as the directors determine is necessary to enable the preparation of consolidated financial statements that are free from material misstatement, whether due to fraud or error.
AUDITOR’S RESPONSIBILITY
Our responsibility is to express an opinion on these consolidated financial statements based on our audit. We conducted our audit in accordance with International Standards on Auditing. Those standards require that we comply with ethical requirements and plan and perform the audit to obtain reasonable assurance about whether the consolidated financial statements are free from material misstatement.
An audit involves performing procedures to obtain audit evidence about the amounts and disclosures in the consolidated financial statements. The procedures selected depend on the auditor’s judgment, including the assessment of the risks of material misstatement of the consolidated financial statements, whether due to fraud or error. In making those risk assessments, the auditor considers internal control relevant to the entity’s preparation of consolidated financial statements that give a true and fair view in order to design audit procedures that are appropriate in the circumstances, but not for the purpose of expressing an opinion on the effectiveness of the entity’s internal control. An audit also includes evaluating the appropriateness of accounting policies used and the reasonableness of accounting estimates made by the directors, as well as evaluating the overall presentation of the consolidated financial statements.
We believe that the audit evidence we have obtained is sufficient and appropriate to provide a basis for our audit opinion.

Independent auditor’s report
72 Anton Oilfield Services Group
OPINION
In our opinion, the consolidated financial statements give a true and fair view of the state of affairs of the Company and of the Group as at 31 December 2013, and of the Group’s profit and cash flows for the year then ended in accordance with International Financial Reporting Standards and have been properly prepared in accordance with the disclosure requirements of the Hong Kong Companies Ordinance.
OTHER MATTERS
This report, including the opinion, has been prepared for and only for you, as a body, and for no other purpose. We do not assume responsibility towards or accept liability to any other person for the contents of this report.
PricewaterhouseCoopers
Certified Public Accountants
Hong Kong, 18 March 2014

BALANCE SHEETSAs at 31 December 2013
(Amounts expressed in thousands of RMB)
Annual Report 2013 73
As at 31 December
Note Group Company
2013 2012 2013 2012
ASSETS
Non-current assets
Property, plant and equipment 6 1,601,686 955,056 — —Land use rights 7 22,021 28,757 — —Intangible assets 8 375,440 371,185 — —Investment in subsidiaries 9 — — 3,572,510 3,558,627Investment in joint ventures 10 16,776 4,000 — —Other non-current assets 11 60,002 — — —Deferred income tax assets 23 25,029 19,553 — —
2,100,954 1,378,551 3,572,510 3,558,627 Current assets
Inventories 12 540,707 487,040 — —Trade and notes receivables 13 1,332,294 948,305 — —Prepayments and other receivables 14 191,328 239,931 383,664 116,512Restricted bank deposits 15 32,414 15,629 — —Cash and cash equivalents 15 1,770,155 523,378 1,308,283 1,567
3,866,898 2,214,283 1,691,947 118,079 Total assets 5,967,852 3,592,834 5,264,457 3,676,706 EQUITY
Capital and reserves attributable
to equity holders of the Company
Share capital 16 202,983 200,836 202,983 200,836Reserves – Proposed final dividend 31 119,953 97,600 119,953 97,600 – Others 17 1,959,739 1,673,425 3,160,294 3,324,983
2,282,675 1,971,861 3,483,230 3,623,419Non-controlling interests 92,622 109,093 — — Total equity 2,375,297 2,080,954 3,483,230 3,623,419

Balance sheetsAs at 31 December 2013(Amounts expressed in thousands of RMB)
74 Anton Oilfield Services Group
As at 31 December
Note Group Company
2013 2012 2013 2012
LIABILITIES
Non-current liabilities
Long-term bonds 18 1,982,596 299,051 1,486,035 —Other long-term payables 19 — 3,256 — —Deferred income tax liabilities 23 1,709 979 — —
1,984,305 303,286 1,486,035 — Current liabilities
Short-term borrowings 20 395,875 191,568 — —Current portion of long-term borrowings 20 — 20,000 — —Current portion of other long-term payable 19 3,414 11,604 — —Trade and notes payables 21 703,878 730,444 — —Accruals and other payables 22 449,118 217,670 295,192 53,287Current income tax liabilities 55,965 37,308 — —
1,608,250 1,208,594 295,192 53,287 Total liabilities 3,592,555 1,511,880 1,781,227 53,287 Total equity and liabilities 5,967,852 3,592,834 5,264,457 3,676,706 Net current assets 2,258,648 1,005,689 1,396,755 64,792 Total assets less current liabilities 4,359,602 2,384,240 4,969,265 3,623,419
The financial statements were approved by the Board of Directors on 18 March 2014 and were signed on its behalf.
LUO Lin WU Di
Executive Director Executive Director
The notes on page 79 to 138 are an integral part of these financial statements.

CONSOLIDATED INCOME STATEMENTFor the year ended 31 December 2013
(Amounts expressed in thousands of RMB, except per share data)
Annual Report 2013 75Annual Report 2013 75
Year ended 31 December
Note 2013 2012
Revenue 24 2,533,536 2,004,583Cost of sales 25 (1,410,992) (1,103,307) Gross Profit 1,122,544 901,276 Other gains, net 26 19,950 10,646Selling expenses 25 (173,068) (154,480)Administrative expenses 25 (299,833) (260,045)Research and development expenses 25 (64,397) (66,274)Sales tax and surcharges 25 (32,840) (33,144) Operating profit 572,356 397,979 Interest income 27 1,348 1,932Finance expenses 27 (74,026) (32,542) Finance costs, net (72,678) (30,610)
Share of loss of joint ventures 10 (9,701) — Profit before income tax 489,977 367,369Income tax expense 29 (86,839) (49,664) Profit for the year 403,138 317,705 Profit attributable to:
Equity holders of the Company 382,568 302,579Non-controlling interests 20,570 15,126
403,138 317,705 Earnings per share for profit attributable to the equity holders of
the Company during the year (expressed in RMB per share)
– Basic 30 0.1779 0.1430 – Diluted 30 0.1733 0.1402 Dividends 31 119,953 97,600
The notes on page 79 to 138 are an integral part of these financial statements.

CONSOLIDATED STATEMENT OF COMPREHENSIVE INCOMEFor the year Ended 31 December 2013(Amounts expressed in thousands of RMB)
76 Anton Oilfield Services Group
Year ended 31 December
2013 2012
Profit for the year 403,138 317,705Other comprehensive income, net of tax:
Items that may be reclassified to profit or loss Currency translation differences (14,469) (1,882) Other comprehensive income for the year, net of tax (14,469) (1,882) Total comprehensive income for the year 388,669 315,823 Total comprehensive income attributable to:
– Equity holders of the Company 368,099 300,697 – Non-controlling interests 20,570 15,126
388,669 315,823
The notes on page 79 to 138 are an integral part of these financial statements.

CONSOLIDATED STATEMENTOF CHANGES IN EQUITY
For the year ended 31 December 2013(Amounts expressed in thousands of RMB)
Annual Report 2013 77
Attributable to the equity holders of the Company
NoteShare
capital
Share
premium
Capital
reserve
Statutory
reserve
Retained
earnings
Currency
translation
differences Total
Non-
controlling
interests
Total
equity
Balance at 1 January 2012 198,115 579,601 340,267 40,646 516,998 (9,497) 1,666,130 73,967 1,740,097Profit for the year — — — — 302,579 — 302,579 15,126 317,705Other comprehensive income: Currency translation differences — — — — — (1,882) (1,882) — (1,882) Total comprehensive income — — — — 302,579 (1,882) 300,697 15,126 315,823 Share option scheme 16(b) — — 17,980 — — — 17,980 — 17,980Share option exercised 16(b) 2,721 29,943 (8,916) — — — 23,748 — 23,748Acquisition of subsidiaries — — — — — — — 30,000 30,000Transfer to statutory reserves 17(a) — — — 15,465 (15,465) — — — —Dividends 31 — (36,694) — — — — (36,694) (10,000) (46,694) Balance at 31 December 2012 200,836 572,850 349,331 56,111 804,112 (11,379) 1,971,861 109,093 2,080,954 Profit for the year — — — — 382,568 — 382,568 20,570 403,138Other comprehensive income: Currency translation differences — — — — — (14,469) (14,469) — (14,469) Total comprehensive income — — — — 382,568 (14,469) 368,099 20,570 388,669 Share option scheme 16(b) — — 31,238 — — — 31,238 — 31,238Share option exercised 16(b) 2,363 37,472 (10,484) — — — 29,351 — 29,351Transfer to statutory reserves 17(a) — — — 21,645 (21,645) — — — —Repurchase and cancellation of shares 16(a) (216) (17,469) — — — — (17,685) — (17,685)Dispose of subsidiaries 34 — — — — — — — (23,916) (23,916)Dividends 31 — (98,314) — — — — (98,314) (12,500) (110,814)Others — — (1,875) — — — (1,875) (625) (2,500) Balance at 31 December 2013 202,983 494,539 368,210 77,756 1,165,035 (25,848) 2,282,675 92,622 2,375,297
The notes on page 79 to 138 are an integral part of these financial statements.

CONSOLIDATED CASH FLOW STATEMENTFor the year ended 31 December 2013(Amounts expressed in thousands of RMB)
78 Anton Oilfield Services Group78 Anton Oilfield Services Group
Year ended 31 December
Note 2013 2012
Cash flows from operating activities
Net cash inflows from operations 32 490,093 412,163Interest paid (42,031) (15,422)Interest received 1,348 1,932Income tax paid (70,875) (49,110) Net cash generated from operating activities 378,535 349,563 Cash flows from investing activities
Purchase of property, plant and equipment (816,680) (232,179)Proceeds from disposal of property, plant and equipment 4,095 2,227Purchase of land use rights — (21,244)Purchase of intangible assets (23,069) (22,195)Proceeds from acquisition of subsidiaries — 2,645Investment of a joint venture 10 (22,477) —Payment of considerations of prior year acquisition (6,360) (7,600)Disposal of subsidiaries, net 34 55,761 (13)Proceeds from disposal of term deposits with initial terms of over three months — 5,000 Net cash used in investing activities (808,730) (273,359) Cash flows from financing activities
Proceeds from issuance of long-term bonds 18 1,682,953 299,128Proceeds from short-term borrowings 511,379 329,000Repayments of short-term borrowings (387,241) (580,293)Repayments of long-term borrowings — (25,003)Repayments of sale and leaseback (11,100) (11,100)Proceeds from share options exercised 16(b) 29,351 23,748Dividends distribution (112,814) (46,694)Repurchase of own shares 16(a) (17,685) — Net cash generated from/(used in) financing activities 1,694,843 (11,214) Net increase in cash and cash equivalents 1,264,648 64,990
Cash and cash equivalents, at beginning of the year 523,378 462,154
Exchange loss on cash and cash equivalents (17,871) (3,766) Cash and cash equivalents at end of the year 1,770,155 523,378
The notes on page 79 to 138 are an integral part of these financial statements.

NOTES TO THE CONSOLIDATEDFINANCIAL STATEMENTS
For the year ended 31 December 2013(Amounts expressed in thousands of RMB unless otherwise stated)
Annual Report 2013 79
1. GENERAL INFORMATION
Anton Oilfield Services Group (the ‘Company’) was incorporated in the Cayman Islands on 3 August 2007 as an exempted company with limited liability under the Companies Law of Cayman Islands. The address of its registered office is PO Box 309, Ugland House, Grand Cayman, KY1-1104, Cayman Islands.
The Company is an investment holding company. The Company and its subsidiaries (the ‘Group’) are mainly engaged in providing oilfield technology services, manufacturing and trading of related products in the People’s Republic of China (the ‘PRC’) and other oversea countries. The Company listed its shares on the Main Board of The Stock Exchange of Hong Kong Limited on 14 December 2007.
The directors regard Pro Development Holdings Corp., a company incorporated in British Virgin Islands as the ultimate holding company of the Company, which is controlled by Mr. Luo Lin, the Company’s controlling shareholder.
These consolidated financial statements have been approved for issue by the Board of Directors on 18 March 2014.
2. SUMMARY OF SIGNIFICANT ACCOUNTING POLICIES
The principal accounting policies applied in the preparation of these consolidated financial statements are set out below. These policies have been consistently applied to all the years presented, unless otherwise stated.
2.1 Basis of preparation
The consolidated financial statements have been prepared in accordance with International Financial Reporting Standards (‘IFRS’) and under the historical cost convention, as modified by the revaluation of derivative financial liabilities.
The preparation of financial statements in conformity with IFRS requires the use of certain critical accounting estimates. It also requires management to exercise its judgment in the process of applying the Group’s accounting policies. The areas involving a higher degree of judgment or complexity, or areas where assumptions and estimates are significant to the consolidated financial statements are disclosed in Note 4.

Notes to the consolidated financial statementsFor the year ended 31 December 2013(Amounts expressed in thousands of RMB unless otherwise stated)
80 Anton Oilfield Services Group
2. SUMMARY OF SIGNIFICANT ACCOUNTING POLICIES (Continued)
2.1 Basis of preparation (Continued)
(a) New and amended standards adopted by the Group
Amendment to IAS 1, ‘Financial statement presentation’ regarding other comprehensive income. The main change resulting from these amendments is a requirement for entities to group items presented in ‘other comprehensive income’ (OCI) on the basis of whether they are potentially reclassifiable to profit or loss subsequently (reclassification adjustments).
Amendment to IFRS 7, ‘Financial instruments: Disclosures’, on asset and liability offseting. The amendments require new disclosure requirements which focus on quantitative information about recognised financial instruments that are offset in the statement of financial position, as well as those recognised financial instruments that are subject to master netting or similar arrangements irrespective of whether they are offset.
IFRS 10, ‘Consolidated financial statements’ builds on existing principles by identifying the concept of control as the determining factor in whether an entity should be included within the consolidated financial statements of the parent company. The standard provides additional guidance to assist in the determination of control where this is difficult to assess.
IFRS 11, ‘Joint arrangements’ focuses on the rights and obligations of the parties to the arrangement rather than its legal form. There are two types of joint arrangements: joint operations and joint ventures. Joint operations arise where the investors have rights to the assets and obligations for the liabilities of an arrangement. A joint operator accounts for its share of the assets, liabilities, revenue and expenses. Joint ventures arise where the investors have rights to the net assets of the arrangement; joint ventures are accounted for under the equity method. Proportional consolidation of joint arrangements is no longer permitted.
IFRS 12, ‘Disclosures of interests in other entities’ includes the disclosure requirements for all forms of interests in other entities, including joint arrangements, associates, structured entities and other off balance sheet vehicles.
IFRS 13, ‘Fair value measurement’, aims to improve consistency and reduce complexity by providing a precise definition of fair value and a single source of fair value measurement and disclosure requirements for use across IFRSs. The requirements, which are largely aligned between IFRSs and US GAAP, do not extend the use of fair value accounting but provide guidance on how it should be applied where its use is already required or permitted by other standards within IFRSs.

Notes to the consolidated financial statementsFor the year ended 31 December 2013
(Amounts expressed in thousands of RMB unless otherwise stated)
Annual Report 2013 81
2. SUMMARY OF SIGNIFICANT ACCOUNTING POLICIES (Continued)
2.1 Basis of preparation (Continued)
(b) New standards and interpretations not yet effective for the financial year beginning
1 January 2013 and relevant to the Group.
IFRS 9, ‘Financial instruments’, addresses the classification, measurement and recognition of financial assets and financial liabilities. IFRS 9 was issued in November 2009. It replaces the parts of IAS 39 that relate to the classification and measurement of financial instruments. IFRS 9 requires financial assets to be classified into two measurement categories: those measured as at fair value and those measured at amortised cost. The determination is made at initial recognition. The classification depends on the entity’s business model for managing its financial instruments and the contractual cash flow characteristics of the instrument. For financial liabilities, the standard retains most of the IAS 39 requirements. The main change is that, in cases where the fair value option is taken for financial liabilities, the part of a fair value change due to an entity’s own credit risk is recorded in other comprehensive income rather than the income statement, unless this creates an accounting mismatch. The Group is yet to assess IFRS 9’s full impact. The Group will also consider the impact of the remaining phases of IFRS 9 when completed by the Board.
IFRIC 21,’Levies’, sets out the accounting for an obligation to pay a levy that is not income tax. The interpretation addresses what the obligating event is that gives rise to pay a levy and when should a liability be recognised. The Group is not currently subjected to significant levies so the impact on the Group is not material.
Amendments to IAS 36, ‘Impairment of assets’, on the recoverable amount disclosures for non-financial assets. This amendment removed certain disclosures of the recoverable amount of CGUs which had been included in IAS 36 by the issue of IFRS 13.
The Group is in the process of making an assessment of the impact of these standards, amendments and interpretations on the consolidated financial statements of the Group in the initial application and does not anticipate that the adoption will result in any material impact on the Group’s operating results or financial position.
Notes to the consolidated financial statementsFor the year ended 31 December 2013(Amounts expressed in thousands of RMB unless otherwise stated)
82 Anton Oilfield Services Group
2. SUMMARY OF SIGNIFICANT ACCOUNTING POLICIES (Continued)
2.2 Subsidiaries
2.2.1 Consolidation
A subsidiary is an entity (including a structured entity) over which the Group has control. The Group controls an entity when the Group is exposed to, or has rights to, variable returns from its involvement with the entity and has the ability to affect those returns through its power over the entity. Subsidiaries are consolidated from the date on which control is transferred to the Group. They are deconsolidated from the date that control ceases.
(a) Business combination
The Group applies the acquisition method to account for business combinations. The consideration transferred for the acquisition of a subsidiary is the fair values of the assets transferred, the liabilities incurred to the former owners of the acquiree and the equity interests issued by the Group. The consideration transferred includes the fair value of any asset or liability resulting from a contingent consideration arrangement.
Identifiable assets acquired and liabilities and contingent liabilities assumed in a business combination are measured initially at their fair values at the acquisition date. The Group recognises any non-controlling interest in the acquiree on an acquisition-by-acquisition basis, either at fair value or at the non-controlling interest’s proportionate share of the recognised amounts of acquiree’s identifiable net assets.
Acquisition-related costs are expensed as incurred.
If the business combination is achieved in stages, the acquisition date carrying value of the acquirer’s previously held equity interest in the acquiree is re-measured to fair value at the acquisition date; any gains or losses arising from such re-measurement are recognised in profit or loss.
Any contingent consideration to be transferred by the Group is recognised at fair value at the acquisition date. Subsequent changes to the fair value of the contingent consideration that is deemed to be an asset or liability is recognised in accordance with IAS 39 either in profit or loss or as a change to other comprehensive income. Contingent consideration that is classified as equity is not remeasured, and its subsequent settlement is accounted for within equity.
The excess of the consideration transferred, the amount of any non-controlling interest in the acquiree and the acquisition-date fair value of any previous equity interest in the acquiree over the fair value of the identifiable net assets acquired is recorded as goodwill. If the total of consideration transferred, non-controlling interest recognised and previously held interest measured is less than the fair value of the net assets of the subsidiary acquired in the case of a bargain purchase, the difference is recognised directly in the income statement.
Intra-group transactions, balances and unrealised gains on transactions between group companies are eliminated. Unrealised losses are also eliminated. When necessary, amounts reported by subsidiaries have been adjusted to conform with the Group’s accounting policies.

Notes to the consolidated financial statementsFor the year ended 31 December 2013
(Amounts expressed in thousands of RMB unless otherwise stated)
Annual Report 2013 83
2. SUMMARY OF SIGNIFICANT ACCOUNTING POLICIES (Continued)
2.2 Subsidiaries (Continued)
2.2.1 Consolidation (Continued)
(b) Changes in ownership interests in subsidiaries without change of control
Transactions with non-controlling interests that do not result in loss of control are accounted for as equity transactions – that is, as transactions with the owners in their capacity as owners. The difference between fair value of any consideration paid and the relevant share acquired of the carrying value of net assets of the subsidiary is recorded in equity. Gains or losses on disposals to non-controlling interests are also recorded in equity.
(c) Disposal of subsidiaries
When the Group ceases to have control, any retained interest in the entity is re-measured to its fair value at the date when control is lost, with the change in carrying amount recognised in profit or loss. The fair value is the initial carrying amount for the purposes of subsequently accounting for the retained interest as an associate, joint venture or financial asset. In addition, any amounts previously recognised in other comprehensive income in respect of that entity are accounted for as if the Group had directly disposed of the related assets or liabilities. This may mean that amounts previously recognised in other comprehensive income are reclassified to profit or loss.
2.2.2 Separate financial statements
Investments in subsidiaries are accounted for at cost less impairment. Cost also includes direct attributable costs of investment. The results of subsidiaries are accounted for by the Company on the basis of dividend and receivable.
Impairment testing of the investments in subsidiaries is required upon receiving dividends from these investments if the dividend exceeds the total comprehensive income of the subsidiary in the period the dividend is declared or if the carrying amount of the investment in the separate financial statements exceeds the carrying amount in the consolidated financial statements of the investee’s net assets including goodwill.
2.3 Joint arrangements
The Group has applied IFRS 11 to all joint arrangements as of 1 January 2012. Under IFRS 11 investments in joint arrangements are classified as either joint operations or joint ventures depending on the contractual rights and obligations each investor. The Group has assessed the nature of its joint arrangements and determined them to be joint ventures. Joint ventures are accounted for using the equity method.
Under the equity method of accounting, interests in joint ventures are initially recognised at cost and adjusted thereafter to recognise the Group’s share of the post-acquisition profits or losses and movements in other comprehensive income. When the Group’s share of losses in a joint venture equals or exceeds its interests in the joint ventures (which includes any long-term interests that, in substance, form part of the Group’s net investment in the joint ventures), the Group does not recognise further losses, unless it has incurred obligations or made payments on behalf of the joint ventures.

Notes to the consolidated financial statementsFor the year ended 31 December 2013(Amounts expressed in thousands of RMB unless otherwise stated)
84 Anton Oilfield Services Group
2. SUMMARY OF SIGNIFICANT ACCOUNTING POLICIES (Continued)
2.3 Joint arrangements (Continued)
Unrealised gains on transactions between the Group and its joint ventures are eliminated to the extent of the Group’s interest in the joint ventures. Unrealised losses are also eliminated unless the transaction provides evidence of an impairment of the asset transferred. Accounting policies of the joint ventures have been changed where necessary to ensure consistency with the policies adopted by the Group.
2.4 Segment reporting
Operating segments are reported in a manner consistent with the internal reporting provided to the chief operating decision-maker. The chief operating decision-maker, who is responsible for allocating resources and assessing performance of the operating segments, has been identified as the chief executive officer, vice presidents and directors who make strategic decisions.
2.5 Foreign currency translation
(a) Functional and presentation currency
Items included in the financial statements of each of the Group’s entities are measured using the currency of the primary economic environment in which the entity operates (the ‘Functional Currency’). The financial statements are presented in Renminbi (‘RMB’), which is the Company’s functional and the Group’s presentation currency.
(b) Transactions and balances
Foreign currency transactions are translated into the Functional Currency using the exchange rates prevailing at the dates of the transactions or valuation where items are re-measured. Foreign exchange gains and losses resulting from the settlement of such transactions and from the translation at year-end exchange rates of monetary assets and liabilities denominated in foreign currencies are recognised in the consolidated income statement.
(c) Group companies
The results and financial position of all the Group entities (none of which has the currency of a hyperinflationary economy) that have a functional currency different from the presentation currency are translated into the presentation currency as follows:
(i) assets and liabilities for each balance sheet presented are translated at the closing rate at the date of that balance sheet;
(ii) income and expenses for each consolidated income statement are translated at average exchange rates (unless this average is not a reasonable approximation of the cumulative effect of the rates prevailing on the transaction dates, in which case income and expenses are translated at the rate on the dates of the transactions); and
(iii) all resulting exchange differences are recognised in other comprehensive income.
Goodwill and fair value adjustments arising on the acquisition of a foreign entity are treated as assets and liabilities of the foreign entity and translated at the closing rate. Exchange differences arising are recognised in other comprehensive income.

Notes to the consolidated financial statementsFor the year ended 31 December 2013
(Amounts expressed in thousands of RMB unless otherwise stated)
Annual Report 2013 85
2. SUMMARY OF SIGNIFICANT ACCOUNTING POLICIES (Continued)
2.5 Foreign currency translation (Continued)
(d) Disposal of foreign operation and partial disposal
On the disposal of a foreign operation (that is, a disposal of the Group’s entire interest in a foreign operation, or a disposal involving loss of control over a subsidiary that includes a foreign operation, a disposal involving loss of joint control over joint ventures that includes a foreign operation, or a disposal involving loss of significant influence over an associate that includes a foreign operation), all of the exchange differences accumulated in equity in respect of that operation attributable to the equity holders of the Company are reclassified to profit or loss.
In the case of a partial disposal that does not result in the Group losing control over a subsidiary that includes a foreign operation, the proportionate share of accumulated exchange differences are re-attributed to non-controlling interests and are not recognised in profit or loss. For all other partial disposals (that is, reductions in the Group’s ownership interest in associates or joint ventures that do not result in the Group losing significant influence or joint control) the proportionate share of the accumulated exchange difference is reclassified to profit or loss.
2.6 Property, plant and equipment
Property, plant and equipment, other than construction in progress, are stated at historical cost less accumulated depreciation and impairment losses. Historical cost includes expenditure that is directly attributable to the acquisition of the items.
Construction-in-progress represents property, plant and equipment under construction and is stated at cost. This includes the costs of construction, machinery and other expenditures necessary for the purpose of preparing the construction-in-progress for its intended use and those borrowing costs incurred before the assets ready for intended use that are eligible for capitalisation. Construction-in-progress is not depreciated until such time as the relevant asset is completed and ready for its intended use.
Subsequent costs are included in the asset’s carrying amount or recognised as a separate asset, as appropriate, only when it is probable that future economic benefits associated with the item will flow to the Group and the cost of the item can be measured reliably. The carrying amount of the replaced part is derecognised. All other repairs and maintenance are charged to the income statement during the financial period in which they are incurred.
Depreciation of property, plant and equipment is calculated using the straight-line method except for drill pipes which are leased out as operating lease are depreciated using unit-of-production method, to allocate their costs to their residual values over their estimated useful lives, as follows:
Estimated useful life
Buildings 5-50 yearsMachinery and equipment 5-10 yearsMotor vehicles 5-10 yearsFurniture, fixtures and others 5 years

Notes to the consolidated financial statementsFor the year ended 31 December 2013(Amounts expressed in thousands of RMB unless otherwise stated)
86 Anton Oilfield Services Group
2. SUMMARY OF SIGNIFICANT ACCOUNTING POLICIES (Continued)
2.6 Property, plant and equipment (Continued)
The assets’ residual values and useful lives are reviewed, and adjusted if appropriate, at each balance sheet date.
An asset’s carrying amount is written down immediately to its recoverable amount if the asset’s carrying amount is greater than its estimated recoverable amount (Note 2.9).
Gains and losses on disposals are determined by comparing the proceeds with the carrying amount and are recognised within ‘other gains, net’, in the consolidated income statement.
2.7 Land use rights
Land use rights represent upfront prepayments made for the land use rights and leasehold land located in the PRC, which are classified as operating lease, and are expensed in the consolidated income statement on a straight-line basis over the periods of the leases or when there is impairment, the impairment is expensed in the consolidated income statement.
2.8 Intangible assets
(a) Goodwill
Goodwill arises on the acquisition of subsidiaries, associates and joint ventures and represents the excess of the consideration transferred over the Group’s interest in net fair value of the net identifiable assets, liabilities and contingent liabilities of the acquiree and the fair value of the non-controlling interest in the acquiree.
For the purpose of impairment testing, goodwill acquired in a business combination is allocated to each of the cash-generating units (‘CGUs’), or groups of CGUs, that is expected to benefit from the synergies of the combination. Each unit or group of units to which the goodwill is allocated represents the lowest level within the entity at which the goodwill is monitored for internal management purposes. Goodwill is monitored at the operating segment level.
Goodwill impairment reviews are undertaken annually or more frequently if events or changes in circumstances indicate a potential impairment. The carrying value of goodwill is compared to the recoverable amount, which is the higher of value in use and the fair value less costs to sell. Any impairment is recognised immediately as an expense and is not subsequently reversed.
(b) Computer software
Computer software are capitalised on the basis of the costs incurred to acquire and bring to use the specific software. These costs are amortised over their estimated useful lives, ranging from 5 to 10 years.

Notes to the consolidated financial statementsFor the year ended 31 December 2013
(Amounts expressed in thousands of RMB unless otherwise stated)
Annual Report 2013 87
2. SUMMARY OF SIGNIFICANT ACCOUNTING POLICIES (Continued)
2.8 Intangible assets (Continued)
(c) Patents
Patents are initially recorded at actual cost incurred to acquire and amortised on a straight-line basis over their estimated useful lives, ranging from 3 to 10 years. Development costs that are directly attributable to the design, development and application of patents are recognised as intangible assets when the following criteria are met:
It is technically feasible to complete the patents so that it will be available for use;
Management intends to complete the patents and use or sell it;
There is an ability to use or sell the patents;
It can be demonstrated how the patents will generate probable future economic benefits;
Adequate technical, financial and other resources to complete the development and to use or sell the patents are available; and
The expenditure attributable to the patents during its development can be reliably measured.
Directly attributable costs that are capitalised as part of the patent include material costs, patent development employee costs and an appropriate portion of relevant overheads. Other development expenditures that do not meet these criteria are recognised as an expense as incurred. Development costs previously recognised as an expense are not recognised as an asset in a subsequent period.
2.9 Impairment of non-financial assets
Assets that have an indefinite useful life, for example goodwill, are not subject to amortisation and are tested annually for impairment. Assets that are subject to depreciation or amortisation are reviewed for impairment whenever events or changes in circumstances indicate that the carrying amount may not be recoverable. An impairment loss is recognised for the amount by which the asset’s carrying amount exceeds its recoverable amount. The recoverable amount is the higher of an asset’s fair value less costs to sell and value in use. For the purposes of assessing impairment, assets are grouped at the lowest levels for which there are separately identifiable cash flows (cash-generating units). Non-financial assets other than goodwill that suffered an impairment are reviewed for possible reversal of the impairment at each reporting date.
2.10 Financial assets
2.10.1 Classification
The Group classifies its financial assets as loans and receivables. The classification depends on the purpose for which the financial assets were acquired. Management determine the classification of its financial assets at initial recognition.
Loans and receivables are non-derivative financial assets with fixed or determinable payments that are not quoted in an active market. They are included in current assets, except for maturities greater than 12 months after the end of the reporting period which are classified as non-current assets. The Group’s loans and receivables comprise ‘trade and notes receivables’, ‘prepayments and other receivables’ and ‘cash and cash equivalents’ in the balance sheets.

Notes to the consolidated financial statementsFor the year ended 31 December 2013(Amounts expressed in thousands of RMB unless otherwise stated)
88 Anton Oilfield Services Group
2. SUMMARY OF SIGNIFICANT ACCOUNTING POLICIES (Continued)
2.10 Financial assets
2.10.2 Recognition and measurement
Regular way purchases and sales of financial assets are recognised on the trade-date-the date on which the Group commits to purchase or sell the asset. Investments are initially recognised at fair value plus transaction costs for all financial assets not carried at fair value through profit or loss. Financial assets are derecognised when the rights to receive cash flows from the investments have expired or have been transferred and the Group has transferred substantially all risks and rewards of ownership. Loans and receivables are subsequently carried at amortised cost using the effective interest method.
2.10.3 Offsetting financial instruments
Financial assets and liabilities are offset and the net amount reported in the balance sheet when there is a legally enforceable right to offset the recognised amounts and there is an intention to settle on a net basis or realise the asset and settle the liability simultaneously.
2.10.4 Impairment of financial assets
Assets carried at amortised cost
The Group assesses at the end of each reporting period whether there is objective evidence that a financial asset or group of financial assets is impaired. A financial asset or a group of financial assets is impaired and impairment losses are incurred only if there is objective evidence of impairment as a result of one or more events that occurred after the initial recognition of the asset (a ‘loss event’) and that loss event (or events) has an impact on the estimated future cash flows of the financial asset or group of financial assets that can be reliably estimated.
Evidence of impairment may include indications that the debtors or a Group of debtors is experiencing significant financial difficulty, default or delinquency in interest or principal payments, the probability that they will enter bankruptcy or other financial reorganisation, and where observable data indicate that there is a measurable decrease in the estimated future cash flows, such as changes in arrears or economic conditions that correlate with defaults.
For loans and receivables category, the amount of the loss is measured as the difference between the asset’s carrying amount and the present value of estimated future cash flows (excluding future credit losses that have not been incurred) discounted at the financial asset’s original effective interest rate. The carrying amount of the asset is reduced and the amount of the loss is recognised in the consolidated income statement. If a loan or held- to-maturity investment has a variable interest rate, the discount rate for measuring any impairment loss is the current effective interest rate determined under the contract. As a practical expedient, the Group may measure impairment on the basis of an instrument’s fair value using an observable market price.
If, in a subsequent period, the amount of the impairment loss decreases and the decrease can be related objectively to an event occurring after the impairment was recognised (such as an improvement in the debtor’s credit rating), the reversal of the previously recognised impairment loss is recognised in the consolidated income statement.

Notes to the consolidated financial statementsFor the year ended 31 December 2013
(Amounts expressed in thousands of RMB unless otherwise stated)
Annual Report 2013 89
2. SUMMARY OF SIGNIFICANT ACCOUNTING POLICIES (Continued)
2.11 Inventories
Inventories are stated at the lower of cost and net realisable value. Cost is determined using the weighted average method. The cost of finished goods and work in progress comprises design costs, raw materials, direct labour, other direct costs and related production overheads (based on normal operating capacity). Net realisable value is the estimated selling price in the ordinary course of business, less applicable variable selling expenses.
2.12 Trade and other receivables
Trade receivables are amounts due from customers for merchandise sold or services performed in the ordinary course of business. If collection of trade and other receivables is expected in one year or less (or in the normal operating cycle of the business if longer), they are classified as current assets. If not, they are presented as non-current assets.
Trade and other receivables are recognised initially at fair value and subsequently measured at amortised cost using the effective interest method, less provision for impairment.
2.13 Cash and cash equivalents
Cash and cash equivalents include cash in hand, deposits held at call with banks, other short-term highly liquid investments with original maturities of three months or less.
2.14 Share capital
Ordinary shares are classified as equity. Incremental costs directly attributable to the issue of new shares or options are shown in equity as a deduction, net of tax, from the proceeds.
2.15 Trade payables
Trade payables are obligations to pay for goods or services that have been acquired in the ordinary course of business from suppliers. Trade payables are classified as current liabilities if payment is due within one year or less (or in the normal operating cycle of the business if longer). If not, they are presented as non-current liabilities.
Trade payables are recognised initially at fair value and subsequently measured at amortised cost using the effective interest method.
2.16 Borrowings
Borrowings are recognised initially at fair value, net of transaction costs incurred. Borrowings are subsequently stated at amortised cost; any difference between the proceeds (net of transaction costs) and the redemption value is recognised in the consolidated income statement over the period of the borrowings using the effective interest method.
Borrowings are classified as current liabilities unless the Group has an unconditional right to defer settlement of the liability for at least 12 months after the end of the reporting period.

Notes to the consolidated financial statementsFor the year ended 31 December 2013(Amounts expressed in thousands of RMB unless otherwise stated)
90 Anton Oilfield Services Group
2. SUMMARY OF SIGNIFICANT ACCOUNTING POLICIES (Continued)
2.17 Current and deferred income tax
The tax expense for the period comprises current and deferred tax. Tax is recognised in theconsolidated income statement, except to the extent that it relates to items recognised in other comprehensive income or directly in equity. In this case the tax is also recognised in other comprehensive income or directly in equity, respectively.
(a) Current income tax
The current income tax charge is calculated on the basis of the tax laws enacted or substantively enacted at the balance sheet date in the countries where the Company’s subsidiaries and associates operate and generate taxable income. Management periodically evaluates positions taken in tax returns with respect to situations in which applicable tax regulation is subject to interpretation. It establishes provisions where appropriate on the basis of amounts expected to be paid to the tax authorities.
(b) Deferred income tax
Inside basis differences
Deferred income tax is recognised, using the liability method, on temporary differences arising between the tax bases of assets and liabilities and their carrying amounts in the consolidated financial statements. However, deferred tax liabilities are not recognised if they arise from the initial recognition of goodwill, the deferred income tax is not accounted for if it arises from initial recognition of an asset or liability in a transaction other than a business combination that at the time of the transaction affects neither accounting nor taxable profit or loss. Deferred income tax is determined using tax rates (and laws) that have been enacted or substantively enacted by the balance sheet date and are expected to apply when the related deferred income tax asset is realised or the deferred income tax liability is settled.
Deferred income tax assets are recognised only to the extent that it is probable that future taxable profit will be available against which the temporary differences can be utilised.
Outside basis differences
Deferred income tax is provided on temporary differences arising on investments in subsidiaries and joint ventures, except for deferred income tax liability where the timing of the reversal of the temporary difference is controlled by the Group and it is probable that the temporary difference will not reverse in the foreseeable future.
(c) Offsetting
Deferred income tax assets and liabilities are offset when there is a legally enforceable right to offset current tax assets against current tax liabilities and when the deferred income taxes assets and liabilities relate to income taxes levied by the same taxation authority on either the taxable entity or different taxable entities where there is an intention to settle the balances on a net basis.

Notes to the consolidated financial statementsFor the year ended 31 December 2013
(Amounts expressed in thousands of RMB unless otherwise stated)
Annual Report 2013 91
2. SUMMARY OF SIGNIFICANT ACCOUNTING POLICIES (Continued)
2.18 Employee benefits
(a) Pension and other social obligations
The Group has various defined contribution plans for pensions, housing fund and other social obligations in accordance with the local conditions and practices in the municipalities and provinces in which they operate. A defined contribution plan is a pension and/or other social benefits plan under which the Group pays fixed contributions into a separate publicly administered pension and/or other social insurance plan on mandatory bases. The Group will have no legal or constructive obligations to pay further contributions if the fund does not hold sufficient assets to pay all employees benefits relating to employee service in the current and prior periods. The contributions are recognised as employee benefit expenses when incurred.
(b) Share-based compensation
The Group operates a number of equity-settled share-based compensation plans, under which the Group receives services from employees as consideration for equity instruments (options) of the Group. The fair value of the employee services received in exchange for the grant of the options is recognised as an expense. The total amount to be expensed is determined by reference to the fair value of the options granted at the grant date:
Including any market performance conditions;
Excluding the impact of any service and non-market performance vesting conditions (for example, profitability, sales growth targets and remaining an employee of the entity over a specified time period); and
Including the impact of any non-vesting conditions (for example, the requirement for employees to save).
Non-market vesting conditions are included in assumptions about the number of options that are expected to vest. The total expense is recognised over the vesting period, which is the period over which all of the specified vesting conditions are to be satisfied. At the end of each reporting period, the Group revises its estimates of the number of options that are expected to vest based on the non-marketing vesting conditions. It recognises the impact of the revision to original estimates, if any, in the income statement, with a corresponding adjustment to equity.
The cash subscribed for the shares issued when the options are exercised is credited to share capital (nominal value) and share premium, net of any directly attributable transaction costs.

Notes to the consolidated financial statementsFor the year ended 31 December 2013(Amounts expressed in thousands of RMB unless otherwise stated)
92 Anton Oilfield Services Group
2. SUMMARY OF SIGNIFICANT ACCOUNTING POLICIES (Continued)
2.19 Revenue recognition
Revenue is measured at the fair value of the consideration received or receivable, and represents amounts receivable for goods and services supplied, stated net of value-added tax, returns, rebates and discounts.
The Group recognises revenue when the amount of revenue can be reliably measured, it is probable that future economic benefits will flow to the Group and specific criteria have been met for each of the Group’s activities as described below. The Group bases its estimates on historical results, taking into consideration the type of customer, the type of transaction and the specifics of each arrangement.
(a) Sales of goods
Revenue associated with the sales of goods is recognised when the title to the goods, such as drilling tools, tubing and casing, has been passed to the customer, which is at the date when the customer receives and accepts the goods and collectability of the related receivables is reasonably assured.
(b) Sales of services
Sales of services are recognised in the accounting period in which the services are rendered, by reference to stage of completion of the specific transaction and assessed on the basis of actual services provided.
(c) Lease income
Operating lease income is recognised over the term of the lease, based on the standard unit charge prescribed in the lease contracts, number of equipment leased out and the duration of lease period.
(d) Interest income
Interest income is recognised on a time-proportion basis using the effective interest method.
2.20 Borrowing costs
General and specific borrowing costs directly attributable to the acquisition, construction or production of qualifying assets, which are assets that necessarily take a substantial period of time to get ready for their intended use or sale, are added to the cost of those assets, until such time as the assets are substantially ready for their intended use or sale.
All other borrowing costs are recognised in profit or loss in the period in which they are incurred.

Notes to the consolidated financial statementsFor the year ended 31 December 2013
(Amounts expressed in thousands of RMB unless otherwise stated)
Annual Report 2013 93
2. SUMMARY OF SIGNIFICANT ACCOUNTING POLICIES (Continued)
2.21 Leases
Leases in which a significant portion of the risks and rewards of ownership are retained by the lessor are classified as operating leases. Payments made under operating leases (net of any incentives received from the lessor) are charged to the income statement on a straight-line basis over the period of the lease.
The Group leases certain property, plant and equipment. Leases of property, plant and equipment where the Group has substantially all the risks and rewards of ownership are classified as sale and leasebacks. Sale and leasebacks are capitalised at the lease’s commencement at the lower of the fair value of the leased property and the present value of the minimum lease payments.
Each lease payment is allocated between the liability and finance charges. The corresponding rental obligations, net of finance charges, are included in other long-term payables. The interest element of the finance cost is charged to the income statement over the lease period so as to produce a constant periodic rate of interest on the remaining balance of the liability for each period. The property, plant and equipment acquired under sale and leasebacks is depreciated over the shorter of the useful life of the asset and the lease term.
2.22 Sale and lease back transactions
A sale and leaseback transaction involves the sale of an asset and the leasing back of the same asset. The lease payment and the sale price are usually interdependent because they are negotiated as a package, the accounting treatment of a sale and leaseback transaction depends upon the type of lease involved.
If a sale and leaseback transaction results in a finance lease, any excess of sales proceeds over the carrying amount shall not be immediately recognised as income by a seller-lessee. Instead, it shall be deferred and amortised over the lease term.
2.23 Government grants
Grants from the government are recognised at fair value where there is reasonable assurance that the grant will be received and the Group will comply with all attached conditions.
Government grants related to cost are deferred and recognised in the income statement over the period necessary to match them with the related costs that they are intended to compensate.
2.24 Dividend distribution
Dividend distribution to the Company’s shareholders is recognised as a liability in the Group’s financial statements in the period in which the dividends are approved by the Company’s shareholders.

Notes to the consolidated financial statementsFor the year ended 31 December 2013(Amounts expressed in thousands of RMB unless otherwise stated)
94 Anton Oilfield Services Group
3. FINANCIAL RISK MANAGEMENT
3.1 Financial risk factors
The Group’s activities expose it to a variety of financial risks: market risk (including currency risk and fair value interest rate risk), credit risk and liquidity risk. The Group’s overall risk management programme focuses on the unpredictability of financial markets and seeks to minimise potential adverse effects on the Group’s financial performance.
(a) Market risk
(i) Foreign exchange risk
The Group mainly operates in the PRC with most of the transactions denominated and settled in RMB, while the Group also has purchases from and sales to overseas. During the year ended 31 December 2013, the Group developed its businesses overseas with most of the transactions denominated and settled in US$. Foreign exchange risk also arise from certain bank deposits and borrowings denominated in US$. The Group is exposed to foreign currency exchange risk primarily with respect to US$.
As at 31 December 2013, if RMB had strengthened/weakened by 3% (2012: 3%) against the US$ with all other variables held constant, profit for the year and profit attributable to equity holders of the Company would have been RMB16,949,000 (2012: RMB1,547,000) lower/higher mainly as a result of foreign exchange losses/gains on translation of US$-denominated cash and cash equivalent, trade receivables and accruals, other payables and long-term bonds.
(ii) Fair value interest rate risk
Long-term bonds obtained at fixed rates expose the Group to fair value interest rate risk. The long-term bonds issued by the Group are disclosed in Note 18.
(b) Credit risk
The Group has policies in place to ensure that sales of products and services are made to customers with an appropriate credit history. The Group’s historical experience in collection of trade and other receivables falls within the recorded allowance and the directors are of the opinion that adequate provision for uncollectible receivables has been made in the financial statements.
A considerable portion of sales were made to the several major oilfield operators of the PRC and their affiliates, which are state-owned entities with good credit reputation, therefore the trade receivables of the Group had concentration risk (Note 5). Most of the Group’s cash and cash equivalents were placed with state-owned banks in the PRC and Hong Kong, the corresponding credit risk is relatively low.

Notes to the consolidated financial statementsFor the year ended 31 December 2013
(Amounts expressed in thousands of RMB unless otherwise stated)
Annual Report 2013 95
3. FINANCIAL RISK MANAGEMENT (Continued)
3.1 Financial risk factors (Continued)
(c) Liquidity risk
The liquidity risk of the Group is controlled by maintaining sufficient cash and cash equivalents, which is generated primarily from operating and financing activities.
The table below analyses the Group’s financial liabilities that will be settled on a net basis into relevant maturity groupings based on the remaining period at the balance sheet date to the contractual maturity date. The amounts disclosed in the table are the contractual undiscounted cash flows.
Group
As at 31 December 2013 Within 1 year 1-2 years Over 2 years
Short-term borrowings 431,951 — —
Trade and notes payables 703,878 — —
Accruals and other payables 355,345 — —
Current portion of long-term payables 3,526 — —
Long-term bonds 55,895 356,108 1,800,029
1,550,595 356,108 1,800,029
Group
As at 31 December 2012 Within 1 year 1-2 years Over 2 years
Short-term borrowings 191,683 — —Trade and notes payables 730,444 — —Accruals and other payables 217,670 — —Long-term borrowings 20,043 — —Long-term bonds 20,214 20,214 306,860Long-term payables 12,430 3,313 —
1,192,484 23,527 306,860

Notes to the consolidated financial statementsFor the year ended 31 December 2013(Amounts expressed in thousands of RMB unless otherwise stated)
96 Anton Oilfield Services Group
3. FINANCIAL RISK MANAGEMENT (Continued)
3.2 Capital risk management
The Group’s objectives when managing capital are to safeguard the Group’s ability to continue as a going concern in order to provide returns for shareholders and benefits for other stakeholders and to maintain an optimal capital structure to reduce the cost of capital.
The Group monitors capital on the basis of the gearing ratio. This ratio is calculated as total borrowings divided by total capital. Total borrowings include borrowings, bonds and trade and notes payables, as shown in the consolidated balance sheet. Total capital is calculated as equity, as shown in the consolidated balance sheet, plus total borrowings.
The gearing ratios 31 December 2013 and 2012 are as follows:
As at 31 December
2013 2012
Total borrowings 3,082,349 1,241,063Total equity 2,375,297 2,080,954 Total capital 5,457,646 3,322,017 Gearing ratio 56% 37%
The increase in gearing ratio in 2013 was mainly due to the increase in trade and notes payable and long-term bonds for operating needs.
3.3 Fair value estimation
The carrying amounts of the Group’s financial assets including cash and cash equivalents, deposits in approved financial institutions, trade and notes receivables, other receivables and financial liabilities including trade and other payables, short-term borrowings and current portion of long-term payables approximate their fair values due to their short maturities.
As at 31 December, the estimated fair value of long-term bonds was approximately RMB2,561 million (31 December 2012: RMB314 million).

Notes to the consolidated financial statementsFor the year ended 31 December 2013
(Amounts expressed in thousands of RMB unless otherwise stated)
Annual Report 2013 97
4. CRITICAL ACCOUNTING ESTIMATES AND JUDGEMENTS
Estimates and judgments are continually evaluated and are based on historical experience and other factors, including expectations of future events that are believed to be reasonable under the circumstances.
The Group makes estimates and assumptions concerning the future. The resulting accounting estimates will, by definition, seldom equal the related actual results. The estimates and assumptions that have a significant risk of causing a material adjustment to the carrying amounts of assets and liabilities within the next financial year are discussed below.
(a) Estimated impairment of goodwill
The Group tests annually whether goodwill has suffered any impairment in accordance with the accounting policy stated in Note 2.9. The recoverable amounts of cash-generating units have been determined based on value-in-use calculations. These calculations require the use of estimates (Note 8). Based on management’s assessment results, there was no impairment of goodwill as at 31 December 2013 and 2012 and no reasonable change to the assumptions would lead to an impairment.
(b) Useful lives of patents
The Group’s management decided the estimated useful lives of patents and respective amortisation. The expected economic useful lives of patents can be significantly different following technology innovation and development. When the expected economic useful lives differ from the original estimates, management will adjust the useful lives accordingly. It is possible that the estimates made based on existing experience are different to the actual outcomes within the next financial period and could cause an adjustment to the amortisation and carrying amount of patents.
(c) Impairment of trade receivables
The Group’s management makes provision for doubtful debts based on the assessment of the recoverability of trade receivables with reference to the extent and duration that the amount will be recovered. Provisions are applied to trade and other receivables where events or changes in circumstances indicate that the balances may not be collectible. The identification of doubtful debts requires the use of judgment and estimates. Where the expectation is different from the original estimate, such difference will impact the carrying value of receivables and doubtful debt expenses in the period in which such estimate has been changed.
(d) Fair value of share options
The fair value of share options granted is determined by using valuation techniques. The Group uses its judgment to select a variety of methods and make assumptions that are mainly based on the specific terms prescribed in the share option contracts and relevant market conditions at the grant dates.

Notes to the consolidated financial statementsFor the year ended 31 December 2013(Amounts expressed in thousands of RMB unless otherwise stated)
98 Anton Oilfield Services Group
5. SEGMENT INFORMATION
The chief executive officer, executive vice presidents and directors are the Group’s chief operating decision-makers. Management has determined the operating segments based on the information reviewed by the chief operating decision makers for the purposes of allocating resources and assessing performance.
The Group’s reportable segments are entity or group of entities that offer different products and services, which is the basis by which the chief operating decision makers make decisions about resources to be allocated to the segments and assesses their performance. Financial information of these entities has been separated to present discrete segment information to be reviewed by the chief operating decision makers.
The chief operating decision makers assess performance of four reportable segments: drilling technology, well completion, down-hole operation and tubular services.
The measurement of profit or loss, assets and liabilities of the operating segments are the same as those described in the summary of significant accounting policies. The chief operating decision makers evaluate the performance of the operating segments based on profit or loss before income tax expense, depreciation and amortisation, interest income, finance expenses (net) and share of loss of joint ventures (‘EBITDA’). The corporate overheads and corporate assets are the general management expenses and assets incurred and held by the headquarters of the Group.
Drilling
technology
Well
completion
Down-hole
operation
Tubular
services Total
For the year ended 31 December 2013
Revenue 589,442 547,855 1,081,565 314,674 2,533,536
EBITDA 136,452 197,742 587,918 149,521 1,071,633
Depreciation and amortisation (24,686) (10,941) (63,261) (23,678) (122,566)
Interest income 3 249 35 227 514
Finance expenses, net (219) (2,302) (1,923) — (4,444)
Share of loss of joint ventures 3,551 — — — 3,551
Income tax expense (6,567) (12,569) (48,019) (19,684) (86,839) For the year ended 31 December 2012
Revenue 432,956 458,161 856,543 256,923 2,004,583 EBITDA 107,911 145,833 470,843 105,448 830,035 Depreciation and amortisation (10,496) (17,945) (33,929) (26,425) (88,795)Interest income 53 355 49 690 1,147Finance expenses, net (905) — — (96) (1,001)Income tax expense (4,236) (14,091) (23,825) (7,512) (49,664)

Notes to the consolidated financial statementsFor the year ended 31 December 2013
(Amounts expressed in thousands of RMB unless otherwise stated)
Annual Report 2013 99
5. SEGMENT INFORMATION (Continued)
Drilling
technology
Well
completion
Down-hole
operation
Tubular
services Total
As at 31 December 2013
Total assets 641,864 1,151,504 1,609,498 510,064 3,912,930
Total assets include:Investments in joint ventures 12,776 — — 4,000 16,776
Additions to non-current assets (other than deferred tax assets) 142,794 112,165 375,661 163,825 794,445 As at 31 December 2012
Total assets 697,904 954,503 989,095 359,738 3,001,240 Total assets include:Investments in joint ventures — — — 4,000 4,000 Additions to non-current assets (other than deferred tax assets) 132,039 28,205 253,792 37,175 451,211
A reconciliation of total EBITDA to total profit before income tax is provided as follows:
Year ended 31 December
2013 2012
EBITDA for reportable segments 1,071,633 830,035Corporate overheads (458,711) (374,017)Depreciation (107,609) (69,234)Amortisation (14,957) (19,561)Interest income 514 1,147Finance expenses, net (4,444) (1,001)Share of loss of joint ventures 3,551 — Profit before income tax 489,977 367,369
Reportable segments’ assets are reconciled to total assets as follows:
As at 31 December
2013 2012
Assets for reportable segments 3,912,930 3,001,240Corporate assets for general management 2,054,922 591,594 Total Assets 5,967,852 3,592,834

Notes to the consolidated financial statementsFor the year ended 31 December 2013(Amounts expressed in thousands of RMB unless otherwise stated)
100 Anton Oilfield Services Group
5. SEGMENT INFORMATION (Continued)
Geographical Information
Revenue Non-current Assets
2013 2012 2013 2012
PRC 1,957,689 1,555,987 1,852,808 1,215,104Iraq 416,480 327,564 205,214 150,860Other countries 159,367 121,032 42,932 12,587 Total 2,533,536 2,004,583 2,100,954 1,378,551
Client Information
Sales made to individually significant customer of each operating segment (accounts for over 10% of the total revenue of each operating segment) are as following:
For the year ended 31 December 2013
Drilling
technology
Well
completion
Down-hole
operation
Tubular
services Total
Client 1 22,141 37,924 200,418 — 260,483
Client 2 — — 277,665 — 277,665
Client 3 196,459 165,436 35,325 217,587 614,807
Total 218,600 203,360 513,408 217,587 1,152,955
For the year ended 31 December 2012
Drilling technology
Well completion
Down-hole operation
Tubular services Total
Client a 108,507 — — 156,279 264,786Client b — — 183,274 — 183,274Client c — — 151,948 — 151,948Client d — — 90,387 — 90,387Client e 65,504 — — — 65,504Client f — — — 26,249 26,249 Total 174,011 — 425,609 182,528 782,148
Note: Client a and e are controlled by one oilfield operator and client b and f are controlled by another oilfield operator.

Notes to the consolidated financial statementsFor the year ended 31 December 2013
(Amounts expressed in thousands of RMB unless otherwise stated)
Annual Report 2013 101
6. PROPERTY, PLANT AND EQUIPMENT – GROUP
Buildings
Machinery
and
equipment
Motor
vehicles
Furniture,
fixtures and
others
Construction-
in-progress Total
As at 1 January 2012
Cost 136,636 381,252 49,420 25,576 83,188 676,072Accumulated depreciation (19,023) (85,031) (21,124) (12,318) — (137,496) Net book value 117,613 296,221 28,296 13,258 83,188 538,576 Year ended 31 December 2012
Opening net book value 117,613 296,221 28,296 13,258 83,188 538,576Additions 21,168 282,789 3,578 6,841 116,818 431,194Acquisition of subsidiaries 13,378 7,239 5,771 880 41,110 68,378Transfer in/(out) 9,177 53,074 543 1,130 (63,924) —Depreciation charge (10,148) (52,860) (10,009) (4,935) — (77,952)Disposals — (2,687) (552) (200) — (3,439)Disposals of a subsidiary — — — — (1,701) (1,701) Closing net book value 151,188 583,776 27,627 16,974 175,491 955,056 As at 31 December 2012
Cost 181,801 720,617 59,085 34,740 175,491 1,171,734Accumulated depreciation (30,613) (136,841) (31,458) (17,766) — (216,678) Net book value 151,188 583,776 27,627 16,974 175,491 955,056
Year ended 31 December 2013
Opening net book value 151,188 583,776 27,627 16,974 175,491 955,056
Additions 26,716 232,220 8,609 14,790 570,866 853,201
Transfer in/(out) 3,195 378,257 5,633 592 (387,677) —
Depreciation charge (10,273) (105,257) (7,506) (6,884) — (129,920)
Disposals (28) (6,210) (266) (32) — (6,536)
Disposals of subsidiaries (Note34) (12,961) (5,966) (3,011) (541) (47,636) (70,115)
Closing net book value 157,837 1,076,820 31,086 24,899 311,044 1,601,686
As at 31 December 2013
Cost 196,865 1,291,327 62,577 48,222 311,044 1,910,035
Accumulated depreciation (39,028) (214,507) (31,491) (23,323) — (308,349)
Net book value 157,837 1,076,820 31,086 24,899 311,044 1,601,686

Notes to the consolidated financial statementsFor the year ended 31 December 2013(Amounts expressed in thousands of RMB unless otherwise stated)
102 Anton Oilfield Services Group
6. PROPERTY, PLANT AND EQUIPMENT – GROUP (Continued)
(a) The Group entered into a sale and leaseback contract in 2011, pursuant to which the Group disposed some machinery and equipment with carrying amount of RMB30,975,000 and finance leased back. The contract term is 3 years.
Machinery and equipment includes the following amounts where the Group is a lessee under a sale and leaseback contract:
As at 31 December
2013 2012
Cost - capitalised sale and leasebacks 38,198 38,198Accumulated depreciation (9,766) (5,828)
28,432 32,370
(b) As at 31 December 2013, buildings with a total net book value amounting to RMB35,854,000 were pledged as counter-guarantee for short-term borrowing, respectively (Note 20) (31 December 2012: buildings with net book value amounting to RMB37,742,000 and RMB6,770,000 were pledged as counter-guarantee for short-term and long-term borrowings).

Notes to the consolidated financial statementsFor the year ended 31 December 2013
(Amounts expressed in thousands of RMB unless otherwise stated)
Annual Report 2013 103
7. LAND USE RIGHTS – GROUP
Land use rights represent the Group’s prepayments for the leasehold land located in the PRC which are held on leases within 50 years. The movement is as follows:
As at 1 January 2012
Cost 33,405Accumulated amortisation (2,124) Net book value 31,281 Year ended 31 December 2012
Opening net book value 31,281Additions 22,995Acquisition of subsidiaries 6,126Disposal of a subsidiary (30,995)Amortisation charge (650) Closing net book value 28,757 As at 31 December 2012
Cost 31,531Accumulated amortisation (2,774) Net book value 28,757
Year ended 31 December 2013
Opening net book value 28,757
Additions —
Disposal of subsidiaries (Note 34) (6,002)
Amortisation charge (734)
Closing net book value 22,021
As at 31 December 2013
Cost 25,529
Accumulated amortisation (3,508)
Net book value 22,021
As at 31 December 2013, land use rights with net book value of RMB12,370,000 were pledged as counter-guarantee for short-term borrowing (Note 20) (31 December 2012: Land use rights amounting to RMB13,022,000 and RMB6,585,000 were pledged as counter-guarantee for short-term and long-term borrowings).

Notes to the consolidated financial statementsFor the year ended 31 December 2013(Amounts expressed in thousands of RMB unless otherwise stated)
104 Anton Oilfield Services Group
8. INTANGIBLE ASSETS – GROUP
Patents Goodwill
Computer
software Total
As at 1 January 2012
Cost 117,682 265,697 6,857 390,236Accumulated amortisation and impairment (23,166) — (1,648) (24,814) Net book value 94,516 265,697 5,209 365,422 Year ended 31 December 2012
Opening net book value 94,516 265,697 5,209 365,422Additions 20,568 3,764 1,627 25,959Amortisation charge (19,419) — (777) (20,196) Closing net book value 95,665 269,461 6,059 371,185 As at 31 December 2012
Cost 138,250 269,461 8,484 416,195Accumulated amortisation and impairment (42,585) — (2,425) (45,010) Net book value 95,665 269,461 6,059 371,185
Year ended 31 December 2013
Opening net book value 95,665 269,461 6,059 371,185
Additions 17,579 — 7,854 25,433
Disposal of subsidiaries (Note 34) — (3,764) (155) (3,919)
Amortisation charge (15,483) — (1,776) (17,259)
Closing net book value 97,761 265,697 11,982 375,440
As at 31 December 2013
Cost 155,829 265,697 16,183 437,709
Accumulated amortisation and impairment (58,068) — (4,201) (62,269)
Net book value 97,761 265,697 11,982 375,440
Goodwill is allocated to the cash-generating units of the Group identified according to their operations.

Notes to the consolidated financial statementsFor the year ended 31 December 2013
(Amounts expressed in thousands of RMB unless otherwise stated)
Annual Report 2013 105
8. INTANGIBLE ASSETS – GROUP (Continued)
An operating segment-level summary of the goodwill allocation is presented below.
As at 31 December 2013
Down-hole
operation
Well
completion Total
Jilin Dongxin Oil Engineering Technology Co., Ltd. (吉林省東新石油工程技術有限公司, ‘Jilin Dongxin’) 26,325 — 26,325
Shandong Precede Petroleum Technology Co., Ltd. (山東普瑞思德石油技術有限公司, ‘Shandong Precede’) — 132,486 132,486
Screen business — 106,886 106,886
26,325 239,372 265,697
As at 31 December 2012
Drilling
technology
Down-hole
operation
Well
completion Total
Jilin Dongxin — 26,325 — 26,325Shandong Precede — — 132,486 132,486Screen business — — 106,886 106,886Bazhou Anton Chang Xiang Applied Chemical Technology Co., Ltd. (巴州安東暢想油田應用化學技術 有限公司, ‘Bazhou Anton’) 3,764 — — 3,764
3,764 26,325 239,372 269,461
The recoverable amount of an operating segment is determined based on value-in-use calculations. These calculations use pre-tax cash flow projections based on financial budgets approved by management covering a five-year period. The Company expects cash flow beyond the five-year period will be similar to that if the fifth year based on existing production capacity. Cash flows beyond the five-year period are extrapolated using zero growth rates.
The key assumptions used for value-in-use calculations in 2013 are as follows:
As at 31 December 2013 Jilin Dongxin
Shandong
Precede
Screen
business
Gross margin 35.00% 50.00% 20.00%
Discount rate 13.00% 13.00% 13.00%
As at 31 December 2012 Jilin DongxinShandong
PrecedeScreen
business Bazhou Anton
Gross margin 13.08% 47.97% 27.60% 25.70%Discount rate 13.00% 13.00% 13.00% 13.00%
Management determined budgeted gross margin based on past performance and its expectations of market development. The discount rates used are pre-tax and reflect specific risks relating to the relevant business.
Based on the assessments, no goodwill was impaired as at 31 December 2013.

Notes to the consolidated financial statementsFor the year ended 31 December 2013(Amounts expressed in thousands of RMB unless otherwise stated)
106 Anton Oilfield Services Group
9. INVESTMENT IN SUBSIDIARIES – COMPANY
As at 31 December
2013 2012
Unlisted shares, at cost 2,862,439 2,862,439Amounts due from a subsidiary* 686,216 686,216Share option granted to employees of subsidiaries 23,855 9,972
3,572,510 3,558,627
* The amounts due from a subsidiary are unsecured, interest free and with no fixed maturity dates. It is the directors’ intention to convert these amounts due from a subsidiary into investment at cost in due course. Therefore the directors considered them as quasi-equity contributions which are stated at cost.
As at 31 December 2013, the Company directly or indirectly held equity interests in the following subsidiaries, all of which are unlisted and limited liability companies:
Company name
Place and date
of incorporation Registered capital
Equity
interest
held
by the
Group Principal activities
Directly held:
Pure Energy Investments Limited (‘Pure Energy’) Hong Kong,17 August 2007
HK$100 100% Investment holding
Anton Oilfield Services International Company Limited (‘Anton International’)
Hong Kong ,17 July 2008
HK$10,000 100% Oilfield services and sales of equipment
RockWell Energy Services Ltd. (‘Rockwell’) British Virgin Islands,15 April 2010
US$50,000 100% Oilfield technology consulting services
Indirectly held:
Beijing Hinen-Hitech Petroleum Technology Development Co., Ltd. (北京海能海特石油科技發展有限公司, ‘Hinen-Hitech’)
Beijing, the PRC,18 September 2000
RMB500,000 100% Manufacturing and sales of petroleum drilling and sand control equipment
Jilin Dongxin Jilin Province, the PRC,1 September 2001
RMB5,500,000 100% Oilfield services and sales of production equipment
Anton Oilfield Services (Group) Limited (安東石油技術(集團)有限公司, ‘Anton Oil’)
Beijing, the PRC,28 January 2002
US$131,000,000 100% Oilfield services and sales of equipment
Xinjiang Tong’ao Oilfield Services Limited (新疆通奥油田技術服務有限公司, ‘Xinjiang Tong’ao’)
Xinjiang UygurAutonomous Region,the PRC,21 February 2002
RMB51,000,000 100% Oilfield services

Notes to the consolidated financial statementsFor the year ended 31 December 2013
(Amounts expressed in thousands of RMB unless otherwise stated)
Annual Report 2013 107
9. INVESTMENT IN SUBSIDIARIES - COMPANY (Continued)
Company name
Place and date
of incorporation Registered capital
Equity
interest
held
by the
Group Principal activities
Beijing Tongsheng Well Engineering And Technology Limited (北京通盛威爾工程技術有限公司, ‘Tongsheng Well’)
Beijing, the PRC,24 December 2004
RMB11,000,000 100% Oilfield services
Anton Tong’ao Technological Products Co., Limited (安東通奥科技產業股份有限公司, ‘Anton Tong’ao’)
Xinjiang Uygur Autonomous Region, the PRC,15 December 2005
RMB90,000,000 90% Manufacturing of rod casing
Beijing Huarme Petroleum Technology Co., Ltd. (北京華瑞美爾石油科技有限公司, ‘Huarme’)
Beijing, the PRC,17 April 2006
RMB500,000 100% Manufacturing and sales of petroleum drilling and sand control equipment
Beijing Anton Oil Machine Technology Limited (北京安東石油機械技術有限公司, ‘Anton Machine’)
Beijing, the PRC,29 September 2006
RMB10,000,000 100% Research and development of new materials and technology
Xinjiang Foyou Oil Engineering Construction Limited (新疆佛友石油工程建設有限責任公司, ‘Xinjiang Foyou’)
Xinjiang Uygur Autonomous Region, the PRC, 22 December 2006
RMB35,000,000 100% Oilfield services
Anton Energy Services Corp. Canada, 14 August 2007
USD$100,000 100% Sales and leasing of drilling equipments
Shandong Precede Shandong Province, the PRC, 2 September 2008
RMB12,000,000 75% Oilfield services and sales of equipment
Roxxon Industry Group Limited (‘Roxxon Hong Kong’)
Hong Kong, 11 September 2008
HK$10,000 100% Oilfield services
Dongying Precede Well Completion and Sand Prevention Engineering Technology Research Centre (東營市普瑞斯德完井防砂工程 技術研究中心, ‘Dongying Research Centre’)
Shandong Province, the PRC, 10 November 2008
RMB100,000 100% Research and development of oilfield well completion technology
Qingdao Precede Oil Technology Limited (青島普瑞思德石油技術有限公司, ‘Qingdao Precede’)
Shandong Province, the PRC, 22 January 2009
RMB1,000,000 100% Oilfield services and sales of production equipment

Notes to the consolidated financial statementsFor the year ended 31 December 2013(Amounts expressed in thousands of RMB unless otherwise stated)
108 Anton Oilfield Services Group
9. INVESTMENT IN SUBSIDIARIES - COMPANY (Continued)
Company name
Place and date
of incorporation Registered capital
Equity
interest
held
by the
Group Principal activities
Anton International Kazakhstan Ltd. (‘Anton HSK’) Kazakhstan, 31 March 2009
US$1,000 100% Oilfield services
Anton International FZE Ltd. (‘Anton Dubai’) The United Arab Emirates, 12 April 2009
US$7,300,000 100% Oilfield services
Sichuan Anton Oil Gas Engineering And Technology Services Ltd. (四川安東油氣工程技術服務有限公司, ‘Sichuan Anton‘)
Sichuan Province, the PRC, 14 July 2009
RMB50,000,000 100% Oilfield services and sales of production equipment
Anton Oilfield Services Africa Co., Ltd. (‘Anton Sudan’)
Sudan, 9 September 2009
US$1,000,000 100% Oilfield services
Anton Oilfiled Services Oversea Kish LLC. (‘Anton Iran’)
Kish Island, Iran, 1 February 2010
— 99% Oilfield services
Anton Oil Technical Group (International) Limited (‘Anton Oil Tech’)
British Virgin Islands, 15 April 2010
US$10,000,000 100% Import and export petroleum machinery and tools
T&C International Trading Ltd. (‘T&C’) British Virgin Islands, 15 April 2010
US$ 10,000,000 100% Import and export petroleum machinery and tools
Anton Oilfield Technology, Inc. (‘Anton Houston’) United States of America, 5 May 2010
US$500,000 100% Oilfield technology research and consulting service
Anton Software Technology Ltd. (北京安東軟件技術有限公司, ‘Anton Software’)
Beijing, the PRC, 19 October 2010
RMB7,500,000 100% Software services, sales of electronic products
Tianjin Antonoil Machinery Manufacture Co., Ltd. (天津安東石油機械製造有限公司, ‘Tianjin Machine’)
Tianjin, the PRC, 27 January 2011
RMB50,000,000 100% Oilfield services, sales of production equipment and consulting service
Anton Oilfield Services DMCC. (‘DMCC’) The United Arab Emirates, 28 March 2011
US$545,140 100% Oilfield services
Tianjin Antonoil Import and Export Trading Co.,Ltd. (天津安東進出口貿易有限公司, ‘Tianjin Trading’)
Tianjin, the PRC, 13 July 2011
US$5,000,000 100% Oilfield services, sales of production equipment and consulting service

Notes to the consolidated financial statementsFor the year ended 31 December 2013
(Amounts expressed in thousands of RMB unless otherwise stated)
Annual Report 2013 109
9. INVESTMENT IN SUBSIDIARIES - COMPANY (Continued)
Company name
Place and date
of incorporation Registered capital
Equity
interest
held
by the
Group Principal activities
Andes Petroleum Company SAS (‘SAS’) Bogota, Columbia, 27 October 2011
US$100,000 100% Oilfield services
Sichuan Tongsheng Drilling Technology Ltd. (四川通盛鉆探工程有限公司, ‘Sichuan Tongsheng’)
Sichuan Province, the PRC, 13 February 2012
RMB5,000,000 100% Construction and service of drilling,sales of drilling product
Xinjiang Anton Oilfield Services Limited (新疆安東石油技術服務有限責任公司, ‘Xinjiang Anton’)
Xinjiang Uygur Autonomous Region, the PRC, 24 February 2012
RMB30,000,000 100% Oilfield services
Anton Oilfield Service Sucursal Colombia (‘Anton Camara’)
Bogota, Columbia, 4 April 2012
COP200,000,000 100% Oilfield services
Anton New Material (Suining)Limited (安東新材料(遂寧)有限公司 , ‘Suining Material’)
Sichuan Province, the PRC, 6 June 2012
RMB10,000,000 100% Oilfield services and sales of product
Wabolt Petroleum Limited (‘Wabolt’) Hong Kong, 6 September 2012
RMB8,190,000 100% Oilfield services
AntonTongao International JLT (‘UAE’) (‘Tong’ao International’)
Dubai, 23 September 2012
AED555,000 100% Oilfield services and sales of production equipment
Antonoil De Suramerica C.A. (‘Anton C.A.’) Venezuela, 19 December 2012
VEB300,000 100% Oilfield services and sales of productionequipment
Antonoil Service Company S.A. (‘Anton Ecuador’)
Ecuador, 17 January 2013
US$80,000 100% Oilfield services and sales of production equipment
Anton Bolin Oil Technology (Beijing) Company Limited (安東柏林石油科技 (北京)有限公司, ’Anton Bolin’)
Beijing, the PRC, 24 January 2013
RMB18,440,000 100% Oilfield services and sales of production equipment
Anton Oilfield Services South America.Co.Ltd (‘Anton Panama’)
Panama, 22 April 2013
US$10,000 100% Oilfield services and sales of production equipment

Notes to the consolidated financial statementsFor the year ended 31 December 2013(Amounts expressed in thousands of RMB unless otherwise stated)
110 Anton Oilfield Services Group
10. INVESTMENT IN JOINT VENTURES
As of 31 December 2012, the investment represents 50% equity interest in Northern Heavy Anton Machinery Manufacturing Co., Ltd. (北重安東機械製造有限公司, ‘Northern Heavy’). In 2013, another investment was made to Tongzhou IPM Oilfield Technology Company Limited (同舟一體化油田技術有限公司, ‘TIPM’), which was jointly set up by Anton Oil, a subsidiary of the Company, and Schlumberger Oilfield(s) Pte.Ltd., with the Group’s share of equity interest as 40% (Pursuant to the Articles of Association of TIPM, all significant financial and operating decisions require unanimous affirmative vote of all its directors who are appointed by both ventures). Both the joint ventures are unlisted limited liability companies established in the PRC.
2013 2012
As at 1 January 4,000 4,000Addition 22,477 —Share of loss (9,701) — As at 31 December 16,776 4,000
Company name
Place and date
of incorporation Registered capital
Equity
interest
held by
the Group Principal activities
Northern Heavy Inner Mongolia, the PRC, 30 October 2007
RMB100,000,000 50% Manufacturing and sales of drill collars and heavy-weight drill pipes
TIPM Sichuan Province, the PRC, 24 December 2012
US$12,000,000 40% Oilfield technology consulting service and sales of production equipment
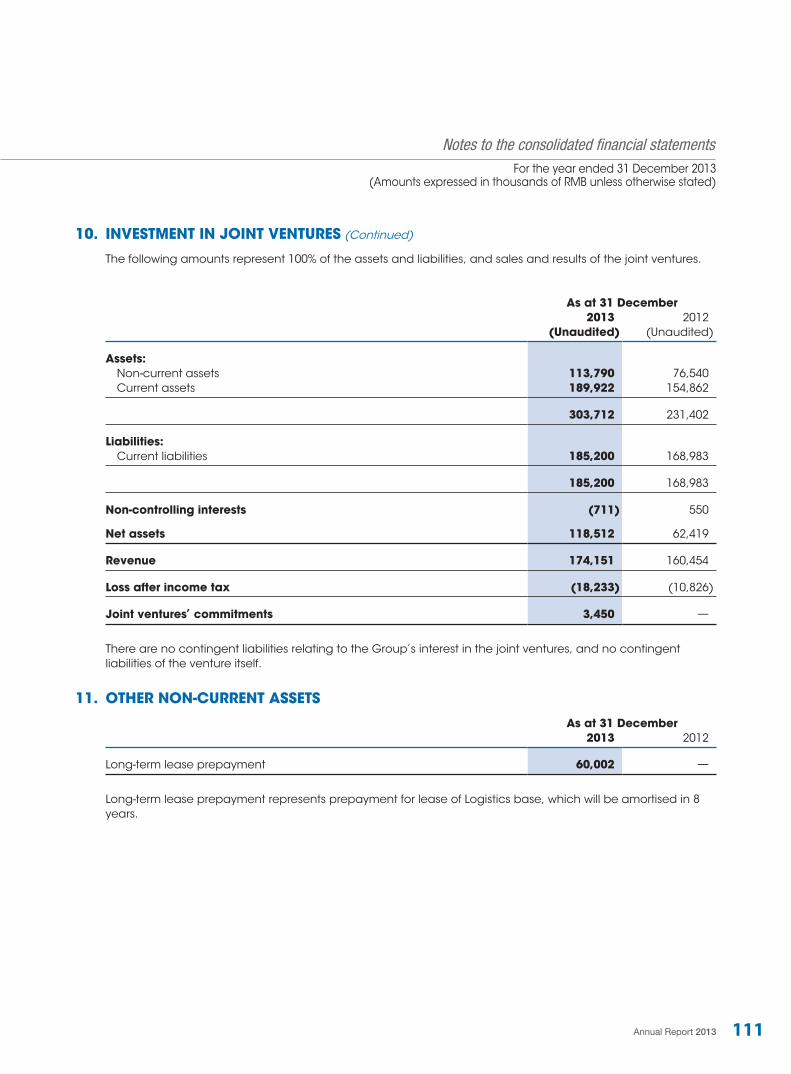
Notes to the consolidated financial statementsFor the year ended 31 December 2013
(Amounts expressed in thousands of RMB unless otherwise stated)
Annual Report 2013 111
10. INVESTMENT IN JOINT VENTURES (Continued)
The following amounts represent 100% of the assets and liabilities, and sales and results of the joint ventures.
As at 31 December
2013 2012(Unaudited) (Unaudited)
Assets:
Non-current assets 113,790 76,540 Current assets 189,922 154,862
303,712 231,402 Liabilities:
Current liabilities 185,200 168,983
185,200 168,983 Non-controlling interests (711) 550
Net assets 118,512 62,419 Revenue 174,151 160,454 Loss after income tax (18,233) (10,826) Joint ventures’ commitments 3,450 —
There are no contingent liabilities relating to the Group’s interest in the joint ventures, and no contingent liabilities of the venture itself.
11. OTHER NON-CURRENT ASSETS
As at 31 December
2013 2012
Long-term lease prepayment 60,002 —
Long-term lease prepayment represents prepayment for lease of Logistics base, which will be amortised in 8 years.

Notes to the consolidated financial statementsFor the year ended 31 December 2013(Amounts expressed in thousands of RMB unless otherwise stated)
112 Anton Oilfield Services Group
12. INVENTORIES – GROUP
As at 31 December
2013 2012
Raw materials 202,154 135,253Work-in-progress 133,705 167,896Finished goods 210,309 202,363Spare parts and others 6,716 3,698
552,884 509,210Less: provision for inventory obsolescence (a) (12,177) (22,170)
540,707 487,040
As at 31 December 2013 and 2012, all inventories were stated at cost.
(a) Movements of provision for inventory obsolescence during the year are analysed as follows:
2013 2012
As at 1 January 22,170 9,270Addition — 12,900Write-off (9,993) — As at 31 December 12,177 22,170
13. TRADE AND NOTES RECEIVABLES – GROUP
As at 31 December
2013 2012
Trade receivables, net (a) 1,302,044 919,430Trade receivables from a related party (Note 35(c)) 4,832 —Notes receivable (d) 25,418 28,875
1,332,294 948,305
Note:
(a) Ageing analysis of gross trade receivables at the respective balance sheet dates is as follows:
As at 31 December 2013
Gross amount Impairment Net value
1 - 6 months (i) 1,179,863 — 1,179,863
6 months - 1 year (i) 75,508 (3,141) 72,367
1 - 2 years (ii) 65,584 (10,938) 54,646
2 - 3 years (ii) 7,800 (7,800) —
Over 3 years (ii) 13,985 (13,985) —
1,342,740 (35,864) 1,306,876

Notes to the consolidated financial statementsFor the year ended 31 December 2013
(Amounts expressed in thousands of RMB unless otherwise stated)
Annual Report 2013 113
13. TRADE AND NOTES RECEIVABLES – GROUP
Note: (Continued)
(a) Ageing analysis of gross trade receivables at the respective balance sheet dates is as follows: (Continued)
As at 31 December 2012Gross amount Impairment Net value
1 - 6 months (i) 735,256 — 735,2566 months - 1 year (i) 137,975 (6,286) 131,6891 - 2 years (ii) 47,000 (1,737) 45,2632 - 3 years (ii) 8,679 (3,815) 4,864Over 3 years (ii) 7,205 (4,847) 2,358
936,115 (16,685) 919,430
(i) As at 31 December 2013, trade receivables with amount of RMB1,252,230,000 (31 December 2012: RMB866,945,000) aged within one year. These trade receivables were neither past due nor impaired due to the Group’s credit policy.
(ii) The Group’s past-due trade receivables were those receivables aged over one year. As at 31 December 2013, trade receivables amounting to RMB54,646,000 (31 December 2012: RMB52,485,000) were past due but not impaired. For the past-due trade receivables without impairment, management considered such long ageing items were receivable from customers with good cooperation and no default history, therefore the risk of impairment was low.
(b) Most of the trade receivables are with credit terms of one year, except for retention money which would be collected one year after the completion of the sales. The maximum exposure to credit risk at the reporting date is the carrying value of the receivables mentioned above.
(c) Movements of impairment of trade receivables are as follows:
2013 2012
As at 1 January 16,685 17,792Additions 31,920 28,277Written-off (12,741) (29,384) As at 31 December 35,864 16,685
(d) Notes receivables are bank acceptance with maturity dates within six months.
(e) Trade and notes receivables were denominated in the following currencies:
As at 31 December
2013 2012
RMB 1,094,850 791,430US$ 237,444 156,261Others — 614
1,332,294 948,305

Notes to the consolidated financial statementsFor the year ended 31 December 2013(Amounts expressed in thousands of RMB unless otherwise stated)
114 Anton Oilfield Services Group
14. PREPAYMENTS AND OTHER RECEIVABLES – GROUP AND COMPANY
As at 31 December
Group Company
2013 2012 2013 2012
Advances to suppliers 48,147 74,997 — —Other receivables 143,181 164,786 — 383Amounts due from subsidiaries (a) — — 383,664 116,129Amounts due from a related party (Note 35 (c)) — 148 — —
191,328 239,931 383,664 116,512
Ageing analysis of prepayments and other receivables at the respective balance sheet dates is as follows:
As at 31 December
Group Company
2013 2012 2013 2012
1 - 6 months 90,887 119,815 286,901 5,8746 months - 1year 19,464 89,515 — 8,4141 - 2 years 62,742 23,276 — —2 - 3 years 12,039 900 — 102,058Over 3 years 8,301 8,530 96,763 166 Prepayments and other 193,433 242,036 383,664 116,512 receivables, gross Less: Impairment of prepayments and other receivables (b) (2,105) (2,105) — — Prepayments and other receivables, net 191,328 239,931 383,664 116,512
(a) Amounts due from subsidiaries are unsecured, interest free and payable on demand.
(b) Movements of impairment of prepayments and other receivables are as follows
2013 2012
As at 1 January 2,105 3,819Additions — 95Reversal — (8)Write-off — (1,801) As at 31 December 2,105 2,105

Notes to the consolidated financial statementsFor the year ended 31 December 2013
(Amounts expressed in thousands of RMB unless otherwise stated)
Annual Report 2013 115
15. CASH AND BANK – GROUP AND COMPANY
As at 31 December
Group Company
2013 2012 2013 2012
Restricted bank deposits (a) 32,414 15,629 — —Cash and cash equivalents – Cash on hand 1,140 959 — — – Deposits in bank 1,769,015 522,419 1,308,283 1,567
1,802,569 539,007 1,308,283 1,567
(a) As at 31 December 2013, bank deposits amounting to RMB32,414,000 were held as securities for letter of guarantee and for issuance of notes payable (31 December 2012: RMB15,629,000).
(b) Cash and bank were denominated in the following currencies:
As at 31 December
Group Company
2013 2012 2013 2012
RMB 298,770 419,516 — —US$ 1,442,338 97,535 1,272,594 292HK$ 35,932 4,574 35,689 1,275EUR 3,868 4,301 — —KZT 17,998 11,069 — —Others 3,663 2,012 — —
1,802,569 539,007 1,308,283 1,567

Notes to the consolidated financial statementsFor the year ended 31 December 2013(Amounts expressed in thousands of RMB unless otherwise stated)
116 Anton Oilfield Services Group
16. SHARE CAPITAL AND SHARE OPTIONS
(a) Share capital
Authorised
Number
of shares HK$’000
As at 31 December 2012 and 2013 3,500,000,000 350,000
Number of
shares issued
and fully paid
of HK$0.1 each Share capital
(thousands) HK$’000 RMB’000
As at 31 December 2011 2,101,551 210,155 198,115Addition 33,363 3,336 2,721 As at 31 December 2012 2,134,914 213,491 200,836Addition (Note(b)) 31,925 3,193 2,363Deduction (Note) (4,452) (445) (216) As at 31 December 2013 2,162,387 216,239 202,983
Note: During the year ended 31 December 2013, the Company acquired 4,452,000 of its own shares through purchase on the Hong Kong Stock Exchange, which were then all cancelled. The total amount paid to acquire the shares was RMB17,685,000 and has been deducted from share capital and share premium.
(b) Share options
In 2013, options to subscribe for 35,640,000 shares at the exercise price ranging from HK$3.878 to HK$5.742 (2012: 61,949,000 shares at the exercise price ranging from HK$1.072 to HK$3.820) have been conditionally granted to certain key employees and three independent non-executive director. The options are exercisable gradually from the first anniversary of the service commencement date and have an option period of 3 to 6 years.

Notes to the consolidated financial statementsFor the year ended 31 December 2013
(Amounts expressed in thousands of RMB unless otherwise stated)
Annual Report 2013 117
16. SHARE CAPITAL AND SHARE OPTIONS (Continued)
(b) Share options (Continued)
Movements in the number of share options outstanding and their related weighted average exercise prices are as follows:
Average
exercise
price in HK$
per share
Number of
share options
(thousands)
As at 31 December 2011 104,138Granted (on 19 Jan 2012) 1.072 40,000Granted (on 16 Apr 2012) 1.240 6,000Granted (on 18 Jun 2012) 1.160 7,100Granted (on 22 Nov 2012) 2.610 8,720Granted (on 28 Dec 2012) 3.820 129Exercised (33,363)Forfeited (7,591)Expired (8,550) As at 31 December 2012 116,583Granted (on 10 Jan 2013) 3.878 33,730Granted (on 21 Jun 2013) 5.742 1,296Granted (on 28 Jun 2013) 5.600 298Granted (on 16 Aug 2013) 5.570 70Granted (on 20 Nov 2013) 4.960 246Exercised (31,925)Forfeited (4,672)Expired — As at 31 December 2013 115,626

Notes to the consolidated financial statementsFor the year ended 31 December 2013(Amounts expressed in thousands of RMB unless otherwise stated)
118 Anton Oilfield Services Group
16. SHARE CAPITAL AND SHARE OPTIONS (Continued)
(b) Share options (Continued)
Share options outstanding (in thousands) at the end of the year have the following expiry dates and exercise prices:
Number of
share options
(thousands)
Expiry date
Exercise price
HK$ per share
As at 31
December
2013
8 April 2014 0.750 2,56119 May 2014 1.450 1,25022 November 2014 0.760 8,85218 January 2015 1.072 1,00019 May 2015 1.450 17,8679 January 2016 3.878 3,03018 January 2016 1.072 29,17715 April 2016 1.240 5,70017 June 2016 1.160 6,70421 November 2016 2.610 6,80927 December 2016 3.820 1299 January 2017 3.878 30,63721 June 2019 5.742 1,29627 June 2019 5.600 29815 August 2019 5.570 7019 November 2019 4.960 246
2.103 115,626
The exercise price of the granted options is equal to the highest of (i) the closing price of the shares of the Company in the daily quotation sheet issued by the Stock Exchange on the date of grant; (ii) the average closing price of the shares as stated in the daily quotation sheets issued by the Stock Exchange for the five business days immediately preceding the date of grant; and (iii) the par value of the shares. Options are conditional on the employee completing one to three years’ service (the vesting period) and have a contractual option term of three to four years. The Group has no legal or constructive obligation to repurchase or settle the options in cash.

Notes to the consolidated financial statementsFor the year ended 31 December 2013
(Amounts expressed in thousands of RMB unless otherwise stated)
Annual Report 2013 119
16. SHARE CAPITAL AND SHARE OPTIONS (Continued)
(b) Share options (Continued)
As of 31 December 2013, out of the 115,626,000 outstanding options (31 December 2012: 116,583,000 options), 34,373,000 options (31 December 2012: 29,412,000 options) were exercisable. Options exercised in 2013 resulted in 31,925,000 shares (2012: 33,363,000 shares) being issued at a weighted average price of HK$1.14 each (2012: HK$0.87 each). The related weighted average share price at the time of exercise was HK$5.28 (2012: HK$1.85) per share.
The fair value of the options granted during the year ended 31 December 2013 is determined using the Binomial Option Pricing Model. The major assumptions used in the pricing model for options granted in 2013 were the exercise price shown above, and the other parameters are shown below:
Parameters
Option
granted in
2013
Optiongranted in
2012
Share price as of the valuation date (HK$) 3.38-5.72 1.06-3.82Expected dividend yield 1.00% 1.00%Forfeiture rate 0.00%-2.00% N.AMaturity years 2.0-6.0 1.0-3.0Risk free rate 0.30%-1.58% 0.25%-0.60%Annualised volatility 49.30%-58.75% 46.88%-52.47%
The weighted average fair value of options granted during the year determined using the Binomial valuation model was HK$1.20 per option (2012: HK$0.47). The volatility measured at the standard deviation of continuously compounded share returns is derived from historical volatility of the share price over the last 6 years.
The total expense recognised in the consolidated income statement for the year ended 31 December 2013 for share options amounted to RMB31,238,000 (2012: RMB17,980,000), with a corresponding amount credited in capital reserve.

Notes to the consolidated financial statementsFor the year ended 31 December 2013(Amounts expressed in thousands of RMB unless otherwise stated)
120 Anton Oilfield Services Group
17. RESERVES
Group
Share
premium
Capital
reserve
Statutory
reserve
Retained
earnings
Exchange
differences Total
As at 31 December 2011 579,601 340,267 40,646 516,998 (9,497) 1,468,015Profit for the year — — — 302,579 — 302,579Exchange differences — — — — (1,882) (1,882)Share option scheme (Note16(b)) — 17,980 — — — 17,980Share option exercised (Note16(b)) 29,943 (8,916) — — — 21,027Transfer to statutory reserves (a) — — 15,465 (15,465) — —Dividends (Note 31) (36,694) — — — — (36,694) As at 31 December 2012 572,850 349,331 56,111 804,112 (11,379) 1,771,025 Profit for the year — — — 382,568 — 382,568Exchange differences — — — — (14,469) (14,469)Share option scheme (Note16(b)) — 31,238 — — — 31,238Share option exercised (Note16(b)) 37,472 (10,484) — — — 26,988Transfer to statutory reserves (a) — — 21,645 (21,645) — —Repurchase and cancellation of Shares (Note 16(a)) (17,469) — — — — (17,469)Dividends (Note 31) (98,314) — — — — (98,314)Others — (1,875) — — — (1,875) As at 31 December 2013 494,539 368,210 77,756 1,165,035 (25,848) 2,079,692
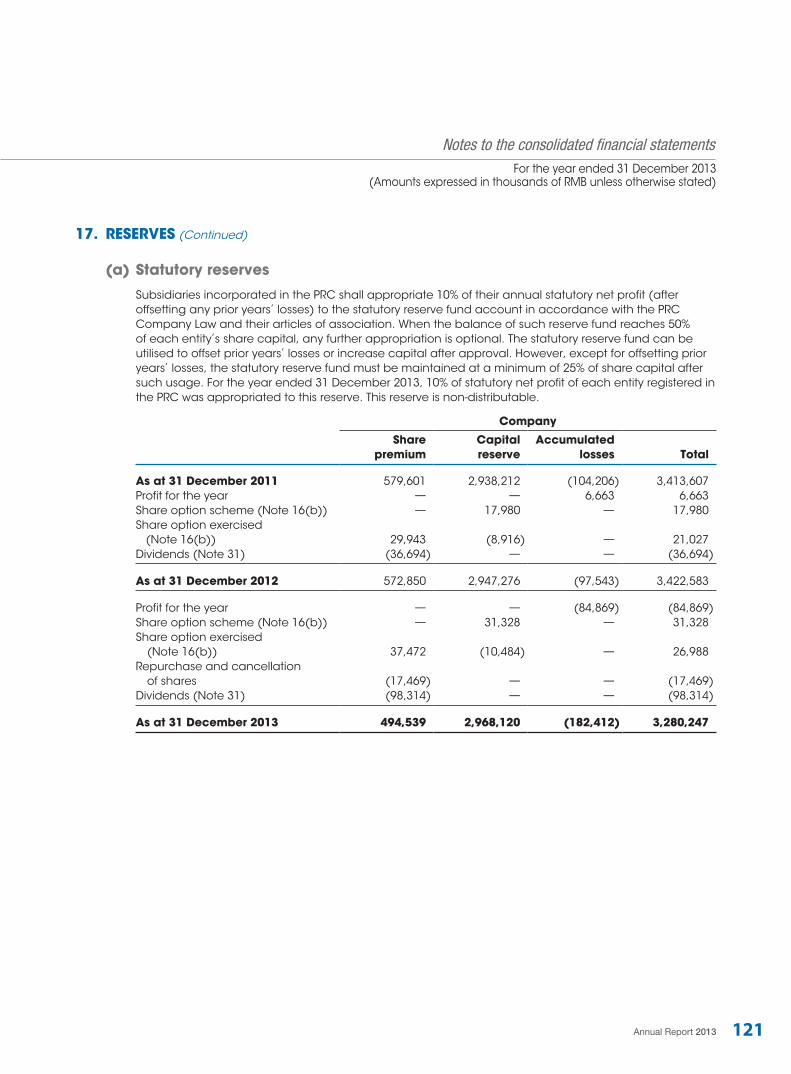
Notes to the consolidated financial statementsFor the year ended 31 December 2013
(Amounts expressed in thousands of RMB unless otherwise stated)
Annual Report 2013 121
17. RESERVES (Continued)
(a) Statutory reserves
Subsidiaries incorporated in the PRC shall appropriate 10% of their annual statutory net profit (after offsetting any prior years’ losses) to the statutory reserve fund account in accordance with the PRC Company Law and their articles of association. When the balance of such reserve fund reaches 50% of each entity’s share capital, any further appropriation is optional. The statutory reserve fund can be utilised to offset prior years’ losses or increase capital after approval. However, except for offsetting prior years’ losses, the statutory reserve fund must be maintained at a minimum of 25% of share capital after such usage. For the year ended 31 December 2013, 10% of statutory net profit of each entity registered in the PRC was appropriated to this reserve. This reserve is non-distributable.
Company
Share
premium
Capital
reserve
Accumulated
losses Total
As at 31 December 2011 579,601 2,938,212 (104,206) 3,413,607Profit for the year — — 6,663 6,663Share option scheme (Note 16(b)) — 17,980 — 17,980Share option exercised (Note 16(b)) 29,943 (8,916) — 21,027Dividends (Note 31) (36,694) — — (36,694) As at 31 December 2012 572,850 2,947,276 (97,543) 3,422,583 Profit for the year — — (84,869) (84,869)Share option scheme (Note 16(b)) — 31,328 — 31,328Share option exercised (Note 16(b)) 37,472 (10,484) — 26,988Repurchase and cancellation of shares (17,469) — — (17,469)Dividends (Note 31) (98,314) — — (98,314) As at 31 December 2013 494,539 2,968,120 (182,412) 3,280,247
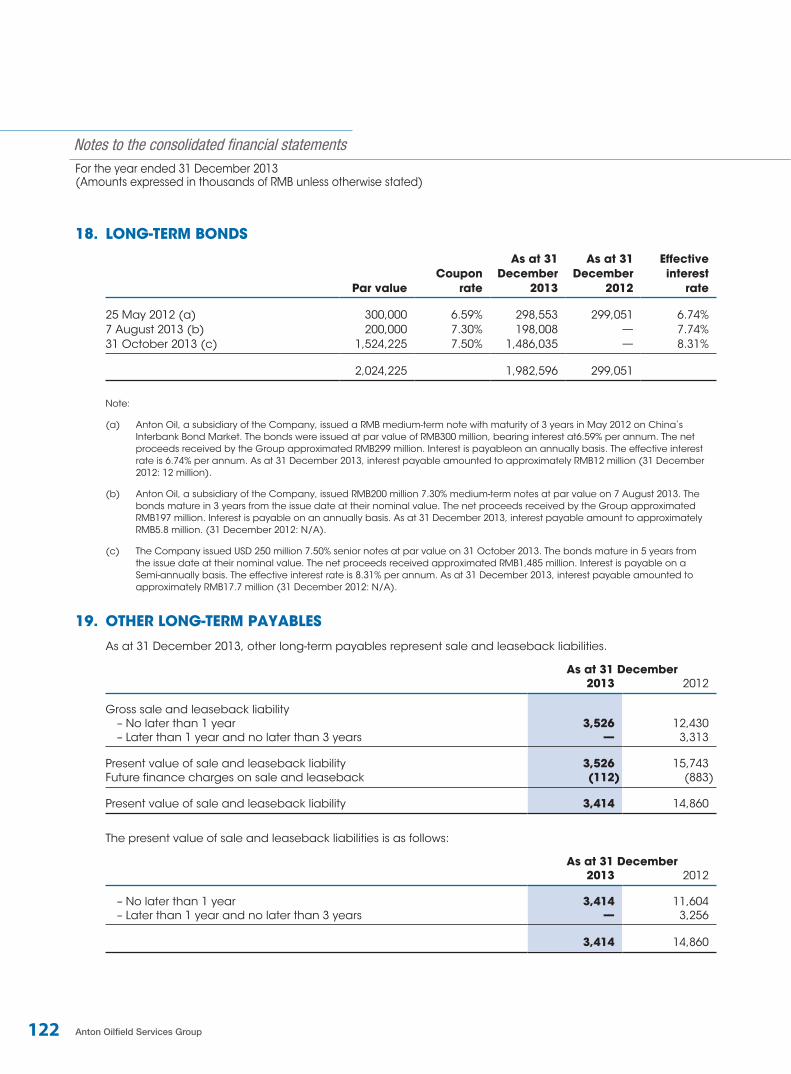
Notes to the consolidated financial statementsFor the year ended 31 December 2013(Amounts expressed in thousands of RMB unless otherwise stated)
122 Anton Oilfield Services Group
18. LONG-TERM BONDS
Par value
Coupon
rate
As at 31
December
2013
As at 31
December
2012
Effective
interest
rate
25 May 2012 (a) 300,000 6.59% 298,553 299,051 6.74%7 August 2013 (b) 200,000 7.30% 198,008 — 7.74%31 October 2013 (c) 1,524,225 7.50% 1,486,035 — 8.31%
2,024,225 1,982,596 299,051
Note:
(a) Anton Oil, a subsidiary of the Company, issued a RMB medium-term note with maturity of 3 years in May 2012 on China’s Interbank Bond Market. The bonds were issued at par value of RMB300 million, bearing interest at6.59% per annum. The net proceeds received by the Group approximated RMB299 million. Interest is payableon an annually basis. The effective interest rate is 6.74% per annum. As at 31 December 2013, interest payable amounted to approximately RMB12 million (31 December 2012: 12 million).
(b) Anton Oil, a subsidiary of the Company, issued RMB200 million 7.30% medium-term notes at par value on 7 August 2013. The bonds mature in 3 years from the issue date at their nominal value. The net proceeds received by the Group approximated RMB197 million. Interest is payable on an annually basis. As at 31 December 2013, interest payable amount to approximately RMB5.8 million. (31 December 2012: N/A).
(c) The Company issued USD 250 million 7.50% senior notes at par value on 31 October 2013. The bonds mature in 5 years from the issue date at their nominal value. The net proceeds received approximated RMB1,485 million. Interest is payable on a Semi-annually basis. The effective interest rate is 8.31% per annum. As at 31 December 2013, interest payable amounted to approximately RMB17.7 million (31 December 2012: N/A).
19. OTHER LONG-TERM PAYABLES
As at 31 December 2013, other long-term payables represent sale and leaseback liabilities.
As at 31 December2013 2012
Gross sale and leaseback liability – No later than 1 year 3,526 12,430 – Later than 1 year and no later than 3 years — 3,313 Present value of sale and leaseback liability 3,526 15,743Future finance charges on sale and leaseback (112) (883) Present value of sale and leaseback liability 3,414 14,860
The present value of sale and leaseback liabilities is as follows:
As at 31 December2013 2012
– No later than 1 year 3,414 11,604 – Later than 1 year and no later than 3 years — 3,256
3,414 14,860

Notes to the consolidated financial statementsFor the year ended 31 December 2013
(Amounts expressed in thousands of RMB unless otherwise stated)
Annual Report 2013 123
20. BORROWINGS
As at 31 December 2013 As at 31 December 2012Amounting Interest rate Amounting Interest rate
Long-term borrowings
– Secured bank borrowings (a) — — 20,000 7.07%Less: Amount due within one year under current liabilities — — (20,000) 7.07%
— — Short-term borrowings
– Unsecured bank borrowings RMB denominated 307,380 6%-7.2% 59,000 6%
US$ denominated 38,495
Libor+2.000%-
Libor+4.000% 67,568Libor+3.711%-Libor+6.644%
– Secured bank borrowings RMB denominated (b) 50,000 6% 65,000 6%-8.53%
395,875 191,568
(a) As at 31 December 2012, secured long-term bank borrowings were all denominated in RMB and secured by land use rights amounting to RMB6,585,000 (Note 7) and buildings of the Group with a net book value of RMB6,770,000 (Note 6), bearing interest at 7.07% per annum.
(b) As at 31 December 2013, secured short-term bank borrowings were all guaranteed by Beijing Zhongguancun Sci-tech Guaranty Co., Ltd., a third party, with the Group’s buildings of net book value amounting to RMB35,854,000 (Note 6) and land use rights with net book value of RMB12,370,000 (Note 7) pledged as counter-guarantee.
As at 31 December 2012, secured short-term bank borrowings amounting to RMB50,000,000, were guaranteed by Beijing Zhongguancun Sci-tech Guaranty Co., Ltd., a third party, with the Group’s buildings amounted to RMB37,742,000 (Note 6) and land use rights amounted to RMB13,022,000 (Note 7) pledged as counter-guarantee. Secured short-term bank borrowings amounting to RMB15,000,000, were guaranteed by Li Ming, the minority interest shareholder of Bazhou Cheng Xi Petroleum Commodity Co., Ltd., a subsidiary of the Company.
(c) As at 31 December 2013, the undrawn bank borrowing facilities of the Group approximated RMB434 million (31 December 2012: RMB434 million) with maturity date between 14 March 2014 and 26 November 2014.
21. TRADE AND NOTES PAYABLES – GROUP
As at 31 December
2013 2012
Trade payables 537,736 643,134Trade payables to related parties (Note 35(c)) 40,688 50,354Notes payables 125,454 36,956
703,878 730,444

Notes to the consolidated financial statementsFor the year ended 31 December 2013(Amounts expressed in thousands of RMB unless otherwise stated)
124 Anton Oilfield Services Group
21. TRADE AND NOTES PAYABLES – GROUP (Continued)
Ageing analysis of trade and notes payables at the respective balance sheet dates is as follows:
As at 31 December
2013 2012
Less than 1 year 675,590 692,1881 - 2 years 20,588 24,9302 - 3 years 4,079 8,983Over 3 years 3,621 4,343
703,878 730,444
Trade and notes payable were denominated in the following currencies:
As at 31 December
2013 2012
RMB 692,176 703,099US$ 11,702 23,074KZT — 4,271
703,878 730,444
22. ACCRUALS AND OTHER PAYABLES – GROUP AND COMPANY
As at 31 December
Group Company
2013 2012 2013 2012
Advance from customers 10,936 16,268 — —Accrued expenses 28,278 15,572 5,377 2,508Payroll and welfare payable 48,741 46,624 31 31Taxes other than income taxes payable (a) 16,754 90,235 — —Consideration for acquisition of subsidiaries in prior years — 6,360 — —Amounts due to subsidiaries in prior years (b) — — 289,784 50,748Payables to equipment venders 256,363 — — —Dividend payable 5,000 3,000 — —Interest payable 36,076 12,128 — —Others 46,970 27,483 — —
449,118 217,670 295,192 53,287
(a) Taxes other than income taxes payable mainly comprise accruals for business tax, value-added tax and individual income tax.
(b) Amounts due to subsidiaries are unsecured, non-interest bearing and have no fixed term of repayment.

Notes to the consolidated financial statementsFor the year ended 31 December 2013
(Amounts expressed in thousands of RMB unless otherwise stated)
Annual Report 2013 125
23. DEFERRED INCOME TAX – GROUP
Deferred income tax assets and liabilities are offset when there is a legally enforceable right to offset current tax assets against current tax liabilities and when the deferred income tax assets and liabilities relate to income taxes levied by the same taxation authority on either the taxable entity or different taxable entities where there is an intention to settle the balances on a net basis.
As at 31 December
2013 2012
Deferred tax assets: – Deferred tax asset to be recovered after more than 12 months 7,981 — – Deferred tax asset to be recovered within 12 months 17,048 19,553
25,029 19,553 Deferred tax liabilities: – Deferred tax liabilities to be settled after more than 12 months 1,709 484 – Deferred tax liabilities to be settled within 12 months — 495
1,709 979
Deferred tax assets:
Tax losses
Impairment
provision of
receivables
and inventories Total
As at 31 December 2011 13,871 3,772 17,643Credited to the consolidated income statement 577 1,333 1,910 As at 31 December 2012 14,448 5,105 19,553Credited to the consolidated income statement 3,051 2,425 5,476
As at 31 December 2013 17,499 7,530 25,029
Deferred income tax assets are recognised for tax loss carry-forwards to the extent that the realisation of the related tax benefit through future taxable profits is probable. The Group did not recognise deferred income tax assets of RMB2,278,000 (2012: RMB2,811,000) in respect of losses amounting to RMB9,132,000 (2012: RMB10,955,000) that can be carried forward against taxable income as the Group is going to close the relevant subsidiaries.

Notes to the consolidated financial statementsFor the year ended 31 December 2013(Amounts expressed in thousands of RMB unless otherwise stated)
126 Anton Oilfield Services Group
23. DEFERRED INCOME TAX – GROUP (Continued)
Deferred tax liabilities:
Acquisition of
subsidiaries
Withholding
tax from
investment
income Total
As at 31 December 2011 530 427 957(Credited) /Charged to the consolidated income statement (472) 494 22 As at 31 December 2012 58 921 979(Credited) /Charged to the consolidated income statement (10) 740 730 As at 31 December 2013 48 1,661 1,709
As at 31 December 2013, deferred income tax liabilities of RMB46,893,000 (31 December 2012: RMB32,202,000) have not been recognised for the withholding tax that would be payable on the unremitted earnings of subsidiaries in the PRC. Deferred income tax liability is not recognised where the timing of the reversal of the temporary difference is controlled by the Group and it is probable that the temporary difference will not reverse in the foreseeable future.
24. REVENUE
Revenue by category is analysed as following:
Year ended 31 December
2013 2012
Sales of goods 258,548 515,931Sales of services 2,274,988 1,488,652
2,533,536 2,004,583

Notes to the consolidated financial statementsFor the year ended 31 December 2013
(Amounts expressed in thousands of RMB unless otherwise stated)
Annual Report 2013 127
25. EXPENSE BY NATURE
Operating profit is arrived at after charging/(crediting) the following:
Year ended 31 December
2013 2012
Materials and services 966,696 865,468Staff costs – Salaries and other staff expenses 342,523 248,130 – Share-based compensation 31,238 17,980Depreciation 121,872 72,579Amortisation 15,629 20,846Sales tax and surcharges 32,840 33,144Other operating expenses 470,332 359,103 In which: – addition in impairment of receivables 31,920 28,364 – addition in impairment of inventories — 12,900 – auditor’s remuneration - audit service 3,800 3,700 – auditor’s remuneration - non-audit service 550 — Total operating cost 1,981,130 1,617,250
26. OTHER GAINS, NETYear ended 31 December
2013 2012
Government grants and subsidies 11,991 12,185Gains on disposal of subsidiaries (Note 34) 13,251 —Donation (2,626) (1,043)Loss on disposal of assets (2,441) (1,211)Others (225) 715
19,950 10,646
27. FINANCE COSTS, NET
Year ended 31 December
2013 2012
Interest income 1,348 1,932Interest expenses on bank borrowings and bonds (64,373) (27,473)Interest expenses on sale and leaseback liability (1,606) (1,606)Exchange loss, net (3,402) (1,884)Others (4,645) (1,579)
(72,678) (30,610)
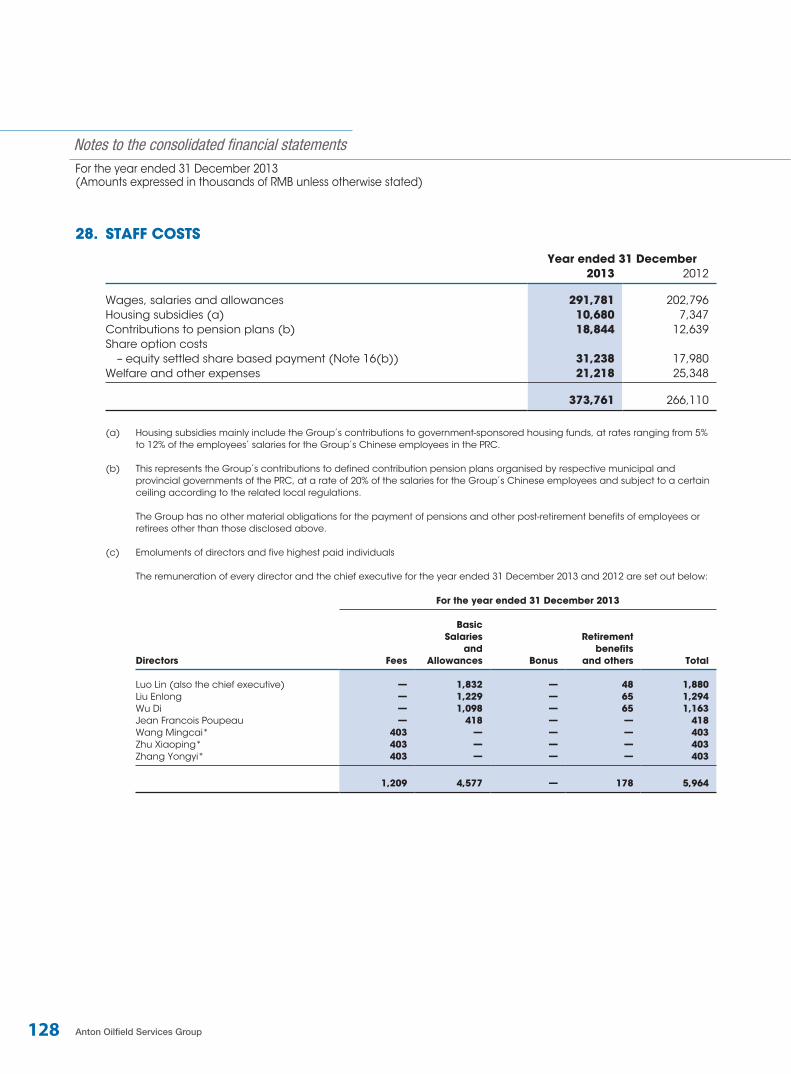
Notes to the consolidated financial statementsFor the year ended 31 December 2013(Amounts expressed in thousands of RMB unless otherwise stated)
128 Anton Oilfield Services Group
28. STAFF COSTS
Year ended 31 December
2013 2012
Wages, salaries and allowances 291,781 202,796Housing subsidies (a) 10,680 7,347Contributions to pension plans (b) 18,844 12,639Share option costs – equity settled share based payment (Note 16(b)) 31,238 17,980Welfare and other expenses 21,218 25,348
373,761 266,110
(a) Housing subsidies mainly include the Group’s contributions to government-sponsored housing funds, at rates ranging from 5% to 12% of the employees’ salaries for the Group’s Chinese employees in the PRC.
(b) This represents the Group’s contributions to defined contribution pension plans organised by respective municipal and provincial governments of the PRC, at a rate of 20% of the salaries for the Group’s Chinese employees and subject to a certain ceiling according to the related local regulations.
The Group has no other material obligations for the payment of pensions and other post-retirement benefits of employees or retirees other than those disclosed above.
(c) Emoluments of directors and five highest paid individuals
The remuneration of every director and the chief executive for the year ended 31 December 2013 and 2012 are set out below:
For the year ended 31 December 2013
Directors Fees
Basic
Salaries
and
Allowances Bonus
Retirement
benefits
and others Total
Luo Lin (also the chief executive) — 1,832 — 48 1,880
Liu Enlong — 1,229 — 65 1,294
Wu Di — 1,098 — 65 1,163
Jean Francois Poupeau — 418 — — 418
Wang Mingcai* 403 — — — 403
Zhu Xiaoping* 403 — — — 403
Zhang Yongyi* 403 — — — 403
1,209 4,577 — 178 5,964

Notes to the consolidated financial statementsFor the year ended 31 December 2013
(Amounts expressed in thousands of RMB unless otherwise stated)
Annual Report 2013 129
28. STAFF COSTS (Continued)
(c) Emoluments of directors and five highest paid individuals (Continued)
The remuneration of every director and the chief executive for the year ended 31 December 2013 and 2012 are set out below: (Continued)
For the year ended 31 December 2012
Directors Fees
Basic Salaries
and Allowances Bonus
Retirement benefits
and others Total
Luo Lin (also the chief executive) — 1,272 — 29 1,301Liu Enlong — 1,002 — 38 1,040Wu Di — 1,060 — 40 1,100Wang Mingcai* 390 — — — 390Zhu Xiaoping* 390 — — — 390Zhang Yongyi* 390 — — — 390
1,170 3,334 — 107 4,611
* 9,900,000 share options on aggregate were granted to three independent non-executive directors in February 2008, April 2009, May 2011, January 2012 and January 2013 , with total expense recognised in the consolidated income statement for the year ended 31 December 2013 amounted to RMB1,055,000 (2012: RMB536,000) which are not included in this summary.
(d) Five highest paid individuals
The five individuals whose emoluments were the highest in the Group for the year include one (2012: two) directors whose emoluments are reflected in the analysis presented above. The emolument payable to the other four (2012: three) individuals during the year are as follows:
Year ended 31 December
2013 2012
Basic salaries, housing allowances, other allowances and benefits-in-kind 6,437 3,239Contributions to pension schemes 123 53
6,560 3,292

Notes to the consolidated financial statementsFor the year ended 31 December 2013(Amounts expressed in thousands of RMB unless otherwise stated)
130 Anton Oilfield Services Group
28. STAFF COSTS (Continued)
(d) Five highest paid individuals (Continued)
The emoluments fell within the following bands:
Number of individuals
2013 2012
Emoluments bandsRMB nil – RMB1,000,000 — —RMB1,000,000 – RMB1,500,000 2 3More than RMB1,500,000 2 —
4 3
(e) During the years ended 31 December 2013 and 2012, no directors or the five highest paid individuals of the Group waived any emoluments and no emoluments were paid by the Group to any of the directors or the five highest paid individuals of the Group as an inducement to join or upon joining the Group or as compensation for loss of office.
29. INCOME TAX EXPENSE
The Company is incorporated in the Cayman Islands as an exempted company with limited liability under the Companies Law of the Cayman Islands and, accordingly, is exempted from payment of Cayman Islands income tax.
PRC enterprise income tax (‘EIT’) is provided on the basis of the profits of the PRC established subsidiaries for statutory financial reporting purposes, adjusted for income and expense items which are not assessable or deductible for income tax purposes. The applicable enterprise income tax rate for the subsidiaries of the Group was 25% in 2013 (2012: 25%), based on the relevant PRC tax laws and regulations, except for certain subsidiaries which are taxed at preferential tax rates as detailed below. The statutory income tax is assessed on an individual entity basis, based on their results of operations. The commencement dates of tax holiday period of each entity are individually determined.
The applicable EIT tax rates of the Group companies which are taxed at preferential tax rates in mainland PRC during the years ended 31 December 2013 and 2012 are detailed as follows:
Year ended 31 December
2013 2012
Anton Oil (i) 15% 15%Tongsheng Well (i) 15% 15%Hinen-Hitech (i) 15% 15%Anton Tong’ao (ii) 15% 15%Xinjiang Tong’ao (iii) 15% 15%Shandong Precede (iv) 15% 15%Sichuan Anton (v) 15% 15%Anton Software (vi) — 25%

Notes to the consolidated financial statementsFor the year ended 31 December 2013
(Amounts expressed in thousands of RMB unless otherwise stated)
Annual Report 2013 131
29. INCOME TAX EXPENSE (Continued)
The applicable EIT statutory tax rates of the Group companies which are taxed at out of mainland PRC during the years ended 31 December 2013 and 2012 are detailed as follows:
Year ended 31 December
2013 2012
The Company — —Anton Energy Services Corp. 29.5% 29.5%Anton International 16.5% 16.5%Pure Energy 16.5% 16.5%Anton HSK 20% 20%Anton Dubai (vii) — —Anton Sudan 35% 35%Roxxon Hong Kong 16.5% 16.5%RockWell 16.5% 16.5%T&C 16.5% 16.5%Anton Oil Tech 16.5% 16.5%Anton Houston 15% 15%Anton Iran 25% 25%DMCC — —SAS 33% 33%Anton C.A. 33% 33%Anton Camara 33% 33%Wabolt 16.5% 16.5%Tong’ao International — —Anton Panama 20% N/AAnton Ecuador 22% N/A
(i) Being high technology enterprises certified by Beijing Municipal Science And Technology Commission and local finance and taxation administration, Anton Oil, Hinen-Hitech and Tongsheng Well have been granted a preferential rate of 15% respectively which is required to be filed and approved by Beijing Local Taxation Bureau annually.
(ii) Pursuant to Ba Kai Guo Shui Deduction Bei Zi [2011] No.29 issued by the State Administration of Taxation, Bazhou Technical Economic Development Area, Korla, Xinjiang Uygur Autonomous Region, Anton Tong’ao has been granted a preferential rate of 15% during 2011 to 2013 as a high technology enterprise.
(iii) Pursuant to Lun Guo Shui Jian Tong Deduction Bei Zi [2012] No.28 issued by the State Administration of Taxation, Luntai County office, Xinjiang Tong’ao has been granted a preferential rate of 15% in 2013 as an enterprise set up in the western area of the PRC.
(iv) Being a high technology enterprise certified by Shandong Science And Technology Department and local finance and taxation administration, Shandong Precede has been granted a preferential rate of 15%, which is required to be filed and approved by Shandong Local Taxation Bureau annually.
(v) Pursuant to Chuan Guo Shui Fa [2012] No.28 issued by the State Administration of Taxation Chuan Shan District office, Sichuan Anton, as an enterprise set up in the western area of the PRC, has been granted a preferential rate of 15% during 2011 to 2020.

Notes to the consolidated financial statementsFor the year ended 31 December 2013(Amounts expressed in thousands of RMB unless otherwise stated)
132 Anton Oilfield Services Group
29. INCOME TAX EXPENSE (Continued)
(vi) Pursuant to Caishui [2008] No.1, Anton software qualifies for a tax holiday of 2-year exemption, starting from 2013 followed by a 50% reduction during 2015 to 2017.
(vii) Anton Dubai’s branch in Iraq is levied by local tax authority at 35% of the deemed taxable income which is calculated as 7% of the total revenue.
Year ended 31 December
2013 2012
Current income tax – PRC income tax 61,665 32,693 – Others 29,920 18,859Deferred income tax (Note 23) – Deferred tax relating to the origination and reversal of temporary differences (4,746) (1,888)
86,839 49,664
The taxation of the Group’s profit before tax differs from the theoretical amount that would arise using applicable tax rates of the Group companies as follows:
Year ended 31 December
2013 2012
Profit before income tax 489,977 367,369 Tax calculated at applicable tax rates 132,701 64,870Preferential tax rates and tax exemption on the income of certain subsidiaries (51,163) (21,616)Expenses not deductible for taxation purposes 5,921 5,971Additional deduction of research and development expense (3,063) (3,890)Tax losses for which no deferred income tax asset was recognised 2,278 2,811Utilisation of previously unrecognised tax losses (237) (605)Withholding tax from overseas income 413 2,293Others (11) (170) Income tax expense 86,839 49,664

Notes to the consolidated financial statementsFor the year ended 31 December 2013
(Amounts expressed in thousands of RMB unless otherwise stated)
Annual Report 2013 133
30. EARNINGS PER SHARE
(a) Basic
Basic earnings per share is calculated by dividing the profit attributable to equity holders of the Company by the weighted average number of ordinary shares in issue during the year.
Year ended 31 December
2013 2012
Profit attributable to equity holders of the Company (RMB’000) 382,568 302,579Weighted average number of ordinary shares in issue (thousands of shares) 2,150,873 2,115,501 Basic earnings per share (expressed in RMB per share) 0.1779 0.1430
(b) Diluted
Diluted earnings per share is calculated adjusting the weighted average number of ordinary shares outstanding to assume conversion of all dilutive potential ordinary shares. As at 31 December 2013, the only dilutive factor of the Company was the outstanding share options. For the purpose of calculating diluted earnings per share, the Company assumed the outstanding share options had been exercised upon the grant dates of the options. Meanwhile, a calculation is made in order to determine the number of shares that could have been acquired at fair value (determined as the average market share price of the Company’s shares from 1 January 2013 to 31 December 2013) based on the monetary value of the subscription rights attached to outstanding share options, which are deducted from the total number of outstanding share options to determine the number of diluted shares deemed to be issued at no consideration.
Year ended 31 December
2013 2012
Profit attributable to equity holders of the Company (RMB’000) 382,568 302,579Weighted average number of ordinary shares in issue (thousands of shares) 2,150,873 2,115,501Adjustments for assumed conversion of share options (thousands of shares) 57,038 42,404 Weighted average number of ordinary shares for diluted earnings per share (thousands of shares) 2,207,911 2,157,905 Diluted earnings per share (expressed in RMB per share) 0.1733 0.1402

Notes to the consolidated financial statementsFor the year ended 31 December 2013(Amounts expressed in thousands of RMB unless otherwise stated)
134 Anton Oilfield Services Group
31. DIVIDENDS
On 3 June 2013, upon the approval from the annual general meeting of the shareholders, the Company declared 2012 final dividend of RMB0.0456 per ordinary share, totaling RMB98,314,000 (2011 final dividend: RMB36,694,000 of RMB0.0170 per share).
A dividend in respect of the year ended 31 December 2013 of RMB0.0547 per ordinary share, amounting to a total dividend of RMB119,953,000, is recommended by the directors on 18 March 2014 (Note 36(a)), which is to be paid out of the share premium account of the Company. Such dividend is subject to the approval by the shareholders at the next Annual General Meeting. These financial statements do not reflect this dividend payable.
32. NOTES TO THE CONSOLIDATED CASH FLOW STATEMENT
a. Reconciliation of profit for the year to net cash inflows generated from operations:
Year ended 31 December
2013 2012
Profit for the year 403,138 317,705Adjustments for: Property, plant and equipment – depreciation charge (Note 25) 121,872 72,579 – net loss on disposals (Note 26) 2,441 1,211 Amortisation of land use rights and intangible assets (Note 25) 15,629 20,846 Addition of impairment of receivables (Note 25) 31,920 28,364 Addition of impairment of inventories (Note 25) — 12,900 Charge of share option scheme (Note 16(b)) 31,238 17,980 Gain on disposal of subsidiaries (Note 26) (13,251) — Share of loss of joint ventures 9,701 — Net foreign exchange loss (Note 27) 3,402 1,884 Interest income (Note 27) (1,348) (1,932) Interest expenses on bank borrowings and bonds (Note 27) 64,373 27,473 Interest expenses on sale and leaseback liability (Note 27) 1,606 1,606 Income tax expense 86,839 49,664 Changes in other non-current assets (60,002) — Changes in working capital: Inventories (100,933) (189,823) Trade and notes receivables (472,214) (215,770) Prepayments and other receivables (46,529) (19,885) Trade and notes payables 375,628 290,808 Accruals and other payables 53,368 1,802 Restricted bank deposits (16,785) (5,249) Net cash inflows from operations 490,093 412,163

Notes to the consolidated financial statementsFor the year ended 31 December 2013
(Amounts expressed in thousands of RMB unless otherwise stated)
Annual Report 2013 135
32. NOTES TO THE CONSOLIDATED CASH FLOW STATEMENT (Continued)
b. Significant non-cash transactions
The principal non-cash transactions for the year ended 31 December 2013 were short-term bank loans borrowed via trade finance agreement whereby the bank made payments to the Group’s suppliers directly, which involved no cash receipts or payments by the Group. The aggregate amount of such short-term bank loans borrowed during the year ended 31 December 2013 approximated RMB80 million (2012: RMB102 million).
33. COMMITMENTS
(a) Capital commitments
Capital commitments related to investments in property, plant and equipment at the balance sheet date but not yet provided for in the balance sheets were as follows:
As at 31 December
2013 2012
Contracted but not provided for – Property, plant and equipment 231,208 289,442
231,208 289,442
(b) Operating lease commitments – where the Group is the lessee
The Group leases various offices and warehouses under non-cancellable operating lease agreements.
The future aggregate minimum lease payments under non-cancellable operating leases are as follows:
As at 31 December
2013 2012
No later than 1 year 9,546 3,0801 to 2 years 7,452 1,1562 to 3 years 6,809 533Over 3 years 40,720 —
64,527 4,769

Notes to the consolidated financial statementsFor the year ended 31 December 2013(Amounts expressed in thousands of RMB unless otherwise stated)
136 Anton Oilfield Services Group
34. DISPOSAL OF SUBSIDIARIES
In February 2013, Anton Oil entered into a share transfer agreement with an independent third party to dispose of the Group’s 55% equity interest in Bazhou Anton Chang Xiang Applied Chemical Technology Co., Ltd. (巴州安東暢想油田應用化學技術有限公司, ‘Bazhou Anton’), Bazhou Chang Xiang Applied Chemical Technology Co., Ltd. (巴州暢想應用化學技術有限公司, ‘Bazhou Changxiang’), Bazhou Cheng Xi Petroleum Commodity Co., Ltd. (巴州誠熙石油物資有限公司, ‘Bazhou Chengxi’) and Bazhou Cheng Xi Petroleum Commodity Kazakhstan Co., Ltd. (‘Bazhou HSK’), for a total consideration of RMB56,497,000. This disposal was completed on 6 February 2013, with a gain on disposal approximating RMB13.25 million which has been recognised as ‘other gains’.
The following table sets forth the consolidated assets, revenue and profit of the disposed subsidiaries:
As at
6 February
2013
As at31 December
2012(Unaudited) (Audited)
Cash and cash equivalents 736 2,795Fixed assets 70,115 70,115Land use right 6,002 6,003Intangible assets 155 155Other assets 164,278 156,138 Total assets 241,286 235,206Total liabilities 181,302 177,444 Total equity 59,984 57,762
For the
period from
1 January
2013 to
6 February
2013
For the period from
14 May 2012 (acquisition
date) to30 June 2012
(Unaudited) (Unaudited)
Revenue 113 10,771Net (loss)/profit for the period (3,302) 1,432
35. RELATED PARTY TRANSACTIONS
Parties are considered to be related if one party has the ability, directly or indirectly, control the other party or exercise significant influence over the other party in making financial and operation decisions. Parties are also considered to be related if they are subject to common control. Members of key management of the Group are also considered as related parties.

Notes to the consolidated financial statementsFor the year ended 31 December 2013
(Amounts expressed in thousands of RMB unless otherwise stated)
Annual Report 2013 137
35. RELATED PARTY TRANSACTIONS (Continued)
(a) The following companies are related parties of the Group during the year ended 31 December 2013 and 2012:
Names of related parties Nature of relationship
Northern Heavy Joint venture invested by Anton Oil
TIPM Joint venture invested by Anton Oil
Schlumberger NV (‘SLB NV’) Shareholder of the Company since 6 July 2012
China Nanhai Magcobar Mud Corp. Ltd. (‘Nanhai Magcobar’)
Controlled by the same ultimate parent company of SLB NV
Schlumberger Oilfield China (‘SLB China’) Controlled by the same ultimate parent company of SLB NV
Schlumberger Drilling (Singapore) Pte. Ltd. (‘SLB Singapore’)
Controlled by the same ultimate parent company of SLB NV
Schlumberger JHP Oilfield Technologies (Shandong) Co.,Ltd. (‘SLB JHP’)
Controlled by the same ultimate parent company of SLB NV
Smith Drilling Equipment (Changzhou) Ltd. (‘Smith Drilling’)
Controlled by the same ultimate parent company of SLB NV
Dowell Schlumberger (Western) S.A. (‘Dowell SLB’)
Controlled by the same ultimate parent company of SLB NV
Schlumberger Technologies (Beijing) Ltd. (‘SLB Beijing’)
Controlled by the same ultimate parent company of SLB NV
(b) Transactions with related parties
Year ended 31 December
2013 2012
Purchases of goods or services
Northern Heavy 14,900 36,172TIPM 701 —Nanhai Magcobar 65,666 33,094SLB China 101,788 18,515SLB Beijing 12,797 674Smith Drilling 5,034 2,676Dowell SLB 17,281 3,122
218,167 94,253 Sales of goods
SLB China 6,652 —Northern Heavy 1,155 1,047
7,807 1,047
Goods are sold and purchased based on the price lists in force and terms that would be available to third parties.
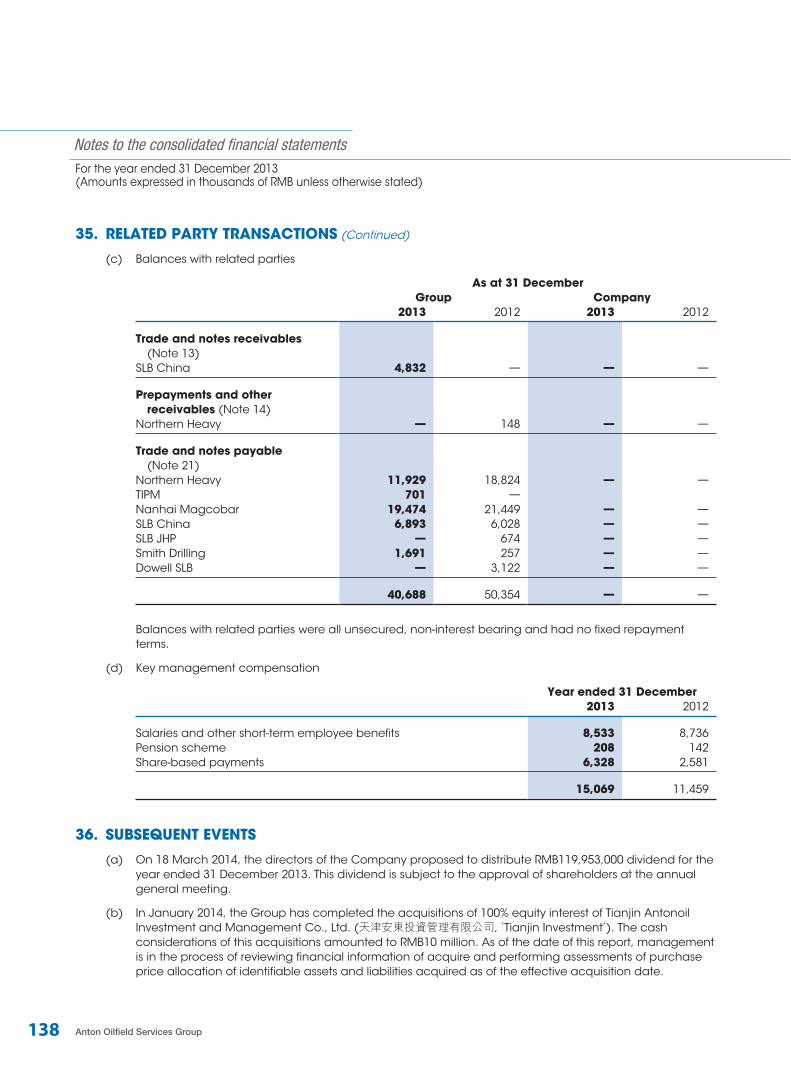
Notes to the consolidated financial statementsFor the year ended 31 December 2013(Amounts expressed in thousands of RMB unless otherwise stated)
138 Anton Oilfield Services Group
35. RELATED PARTY TRANSACTIONS (Continued)
(c) Balances with related parties
As at 31 December
Group Company
2013 2012 2013 2012
Trade and notes receivables
(Note 13)SLB China 4,832 — — — Prepayments and other
receivables (Note 14)Northern Heavy — 148 — — Trade and notes payable (Note 21)Northern Heavy 11,929 18,824 — —TIPM 701 —Nanhai Magcobar 19,474 21,449 — —SLB China 6,893 6,028 — —SLB JHP — 674 — —Smith Drilling 1,691 257 — —Dowell SLB — 3,122 — —
40,688 50,354 — —
Balances with related parties were all unsecured, non-interest bearing and had no fixed repayment terms.
(d) Key management compensation
Year ended 31 December
2013 2012
Salaries and other short-term employee benefits 8,533 8,736Pension scheme 208 142Share-based payments 6,328 2,581
15,069 11,459
36. SUBSEQUENT EVENTS
(a) On 18 March 2014, the directors of the Company proposed to distribute RMB119,953,000 dividend for the year ended 31 December 2013. This dividend is subject to the approval of shareholders at the annual general meeting.
(b) In January 2014, the Group has completed the acquisitions of 100% equity interest of Tianjin Antonoil Investment and Management Co., Ltd. (天津安東投資管理有限公司, ‘Tianjin Investment’). The cash considerations of this acquisitions amounted to RMB10 million. As of the date of this report, management is in the process of reviewing financial information of acquire and performing assessments of purchase price allocation of identifiable assets and liabilities acquired as of the effective acquisition date.


