33
BIHAR AN INTRODUCTION
| Date post: | 14-Dec-2015 |
| Category: |
Documents |
| Upload: | madeleine-fowler |
| View: | 216 times |
| Download: | 0 times |

BIHAR AN INTRODUCTION
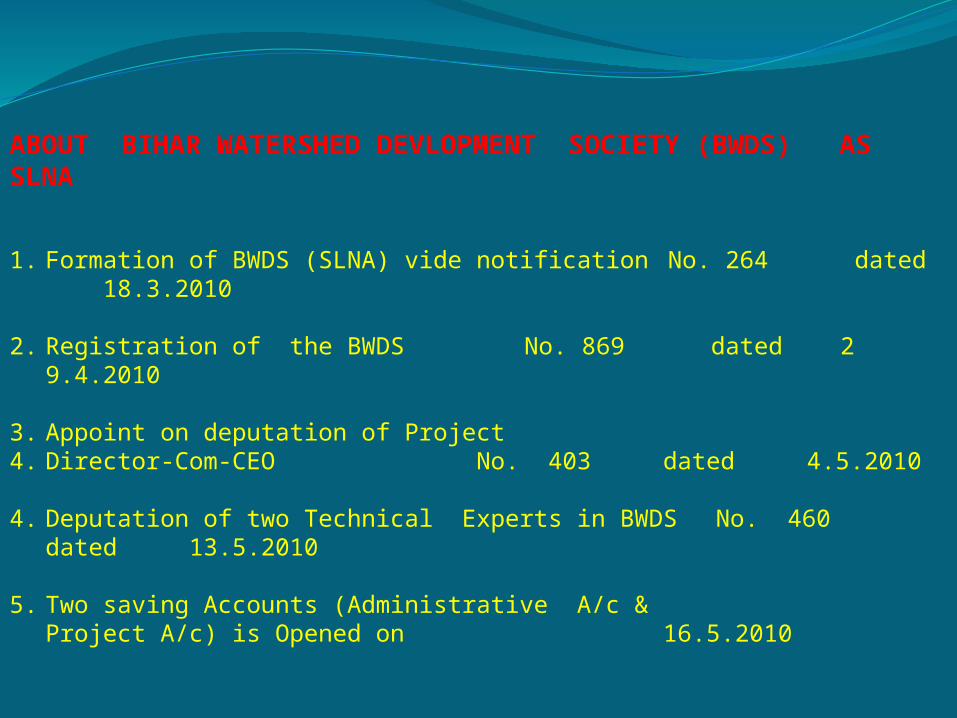
ABOUT BIHAR WATERSHED DEVLOPMENT SOCIETY (BWDS) AS SLNA
1. Formation of BWDS (SLNA) vide notification No. 264 dated 18.3.2010
2. Registration of the BWDS No. 869 dated 2 9.4.2010
3. Appoint on deputation of Project 4. Director-Com-CEO No. 403 dated
4.5.2010
4. Deputation of two Technical Experts in BWDS No. 460 dated 13.5.2010
5. Two saving Accounts (Administrative A/c & Project A/c) is Opened on 16.5.2010

Located between latitudes
24 17" - 27 31'20"
Attitudes 83 19' - 88 17'E
Climate Sub arid Subtropical Monsoon type
Mean Annual Rainfall
Varies between 2000 mm (Near Northern & North Eastern corner) to 1000 mm (on Western border along Ganga Areas)
Total Area 93.6 lakh Ha.
Forest Area 6.22 lakh Ha
Land put to Non-Agricultural uses
16.47 lakh Ha.
Net area sown 55.56 lakh Ha.
Area sown more than once 18.40 lakh Ha.
Total cropped area 73.96 lakh Ha.

Bihar IndiaTotal 829.99 lakh 10286.10 lakhRural Population 89.53% 72.18%S.C. Population 15.72% 16.20%S.T. Population 0.91% 8.20%
Total 47.00 64.84
Male 59.7 75.26
Female 33.1 53.67
Total 43.84% (in 2002)
Male 72.1% 83-84 rural.
Female 64.9% 83-84 rural.
Human Population and Literacy rate (2001 census)
Percentage of population below poverty line :
Literacy rate :
Population :
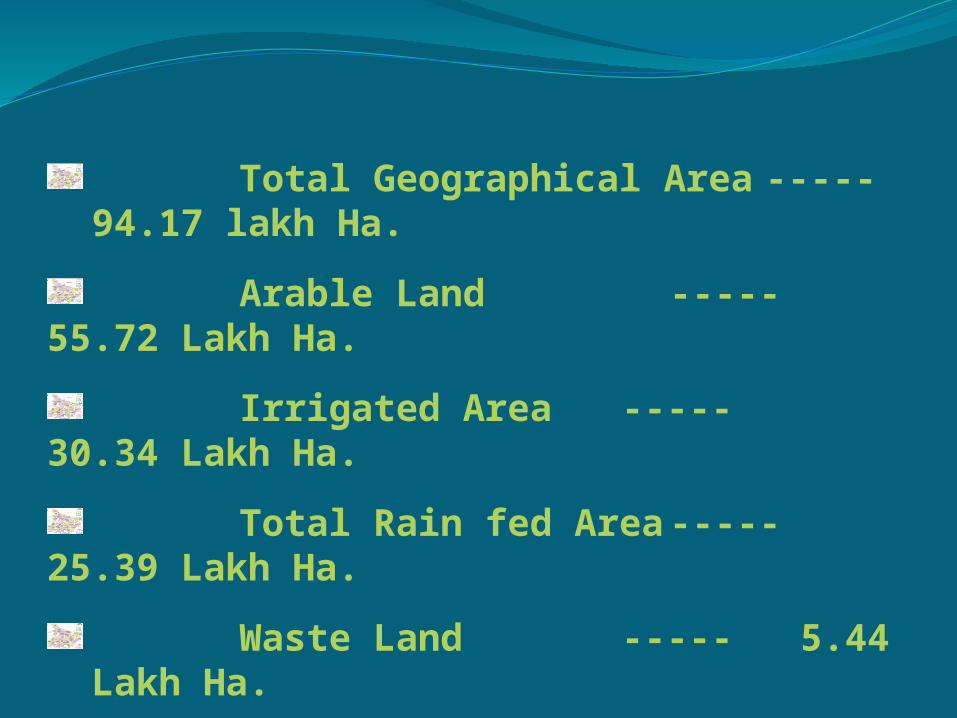
Total Geographical Area ----- 94.17 lakh Ha.
Arable Land ----- 55.72 Lakh Ha.
Irrigated Area ----- 30.34 Lakh Ha.
Total Rain fed Area ----- 25.39 Lakh Ha.
Waste Land ----- 5.44 Lakh Ha.

IWDP- South Bihar - District-wise/ Activity-wise Progress up to March 10
S.No.
District
Watershed Area
Bunding
Sanction Achievement
Total areaHa.
Sanctioned areaHa.
Phy (cum)
Fin (Rs.)
Phy (cum)
Fin (Rs.)
1 Aurangabad 6418.00 3718.30 42891.1 1126353 15921.32 399280
2 Nawada 5211.62 3903.62 62483.38 1488691 40889 1029140
3 Rohtas 1029.10 97.96 6972.08 160304 6972 160356
4 Bhabua 3404.64 170.14 3316.12 76737 3316.2 76734
5 Munger 11438.19 5830.93 123365.26 2879819 50562 1295034
6 Jamui 20413.37 14482.28 274886 6931526 135469.34 3551962.00
7 Banka 20425.05 12479.24 480911.33 11212020 238241.14 6331666
8 Gaya 15253.59 10368.88 158674.41 4150804 80079.69 2040226
Total 83593.56 51051.351153499.3
428026254.11
571450.69
14884398.00
Annexure II

S.No.
District
Watershed Area
Grass Seeding
Sanction Achievement
Total areaHa.
Sanctioned areaHa.
Phy (Ha)
Fin (Rs.)
Phy (Ha)
Fin (Rs.)
1 Aurangabad 6418.00 3718.30 387.02 38702 56 9250
2 Nawada 5211.62 3903.62 340.76 34876 281.4 35612
3 Rohtas 1029.10 97.96 0 0 0 0
4 Bhabua 3404.64 170.14 0 0 0 0
5 Munger 11438.19 5830.93 1161.67 131794.28 51.5 6340
6 Jamui 20413.37 14482.28 13987 729842 623.99 167544.00
7 Banka 20425.05 12479.24 3428.88 340877 1188.54 119280
8 Gaya 15253.59 10368.88 3069.24 323831 382.39 57423
Total 83593.56 51051.35 22374.48 1599922.12 2583.82 395449.00
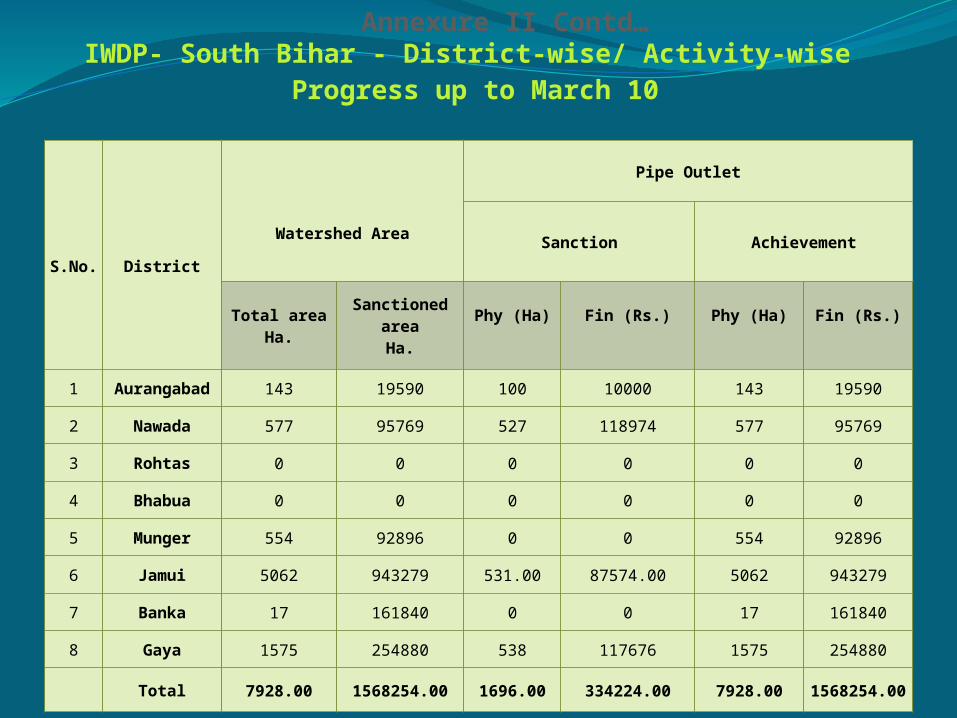
IWDP- South Bihar - District-wise/ Activity-wise Progress up to March 10
Annexure II Contd…
S.No.
District
Watershed Area
Pipe Outlet
Sanction Achievement
Total areaHa.
Sanctioned areaHa.
Phy (Ha)
Fin (Rs.)
Phy (Ha)
Fin (Rs.)
1 Aurangabad 143 19590 100 10000 143 19590
2 Nawada 577 95769 527 118974 577 95769
3 Rohtas 0 0 0 0 0 0
4 Bhabua 0 0 0 0 0 0
5 Munger 554 92896 0 0 554 92896
6 Jamui 5062 943279 531.00 87574.00 5062 943279
7 Banka 17 161840 0 0 17 161840
8 Gaya 1575 254880 538 117676 1575 254880
Total 7928.00 1568254.00 1696.00 334224.00 7928.00 1568254.00
IWDP- South Bihar - District-wise/ Activity-wise Progress up to March 10
Annexure II Contd…

S.No.
District
Watershed Area
Stone Outlet
Sanction Achievement
Total areaHa.
Sanctioned areaHa.
Phy (Ha)
Fin (Rs.)
Phy (Ha)
Fin (Rs.)
1 Aurangabad 333 52593 119 2832 333 52593
2 Nawada 939 125191 114 13981 939 125191
3 Rohtas 34 3547 34 3547 34 3547
4 Bhabua 0 0 0 0 0 0
5 Munger 1368 309101 215 42248 1368 309101
6 Jamui 730 140165 0.00 0.00 730 140165
7 Banka 1619 278526 294 59680 1619 278526
8 Gaya 637 122671 496 95212 637 122671
Total 5660.00 1031794.00 1272.00 217500.00 5660.00 1031794.00
IWDP- South Bihar - District-wise/ Activity-wise Progress up to March 10
Annexure II Contd…

S.No.
District
Watershed Area
Continuous Contour Trench
Sanction Achievement
Total areaHa.
Sanctioned areaHa.
Phy (Ha)
Fin (Rs.)
Phy (Ha)
Fin (Rs.)
1 Aurangabad 0 0 0 0 0 0
2 Nawada 4531 106087 783 21111 4531 106087
3 Rohtas 0 0 0 0 0 0
4 Bhabua 0 0 0 0 0 0
5 Munger 7167 163931 556 16730 7167 163931
6 Jamui 46257 1181490 24132.57 707122.00 46257 1181490
7 Banka 32772.84 763401 8854 194764 32772.84 763401
8 Gaya 27967.8 709218 20146.85 541700 27967.8 709218
Total 118695.96 2924127.00 54472.42 1481427.00 118695.96 2924127.00
IWDP- South Bihar - District-wise/ Activity-wise Progress up to March 10
Annexure II Contd…

S.No.
District
Watershed Area
Staggered Contour Trench
Sanction Achievement
Total areaHa.
Sanctioned areaHa.
Phy (Ha)
Fin (Rs.)
Phy (Ha)
Fin (Rs.)
1 Aurangabad 0 0 0 0 0 0
2 Nawada 0 0 0 0 0 0
3 Rohtas 0 0 0 0 0 0
4 Bhabua 0 0 0 0 0 0
5 Munger 471 10776 146 3345 471 10776
6 Jamui 15920 443085 0.00 0.00 15920 443085
7 Banka 100129 2638618 17719 214244 100129 2638618
8 Gaya 20732 594692 11423.4 321361 20732 594692
Total 137252.18 3687171.00 29288.40 538950.00 137252.18 3687171.00
IWDP- South Bihar - District-wise/ Activity-wise Progress up to March 10
Annexure II Contd…

S.No.
District
Watershed Area
Refilling of Contour Trench
Sanction Achievement
Total areaHa.
Sanctioned areaHa.
Phy (Ha)
Fin (Rs.)
Phy (Ha)
Fin (Rs.)
1 Aurangabad 0 0 0 0 0 0
2 Nawada 0 0 0 0 0 0
3 Rohtas 0 0 0 0 0 0
4 Bhabua 0 0 0 0 0 0
5 Munger 0 0 0 0 0 0
6 Jamui 48 1106 0.00 0.00 48 1106
7 Banka 455 9172 334 6735 455 9172
8 Gaya 0 0 0 0 0 0
Total 503.40 10278.00 334.00 6735.00 503.40 10278.00
IWDP- South Bihar - District-wise/ Activity-wise Progress up to March 10
Annexure II Contd…

S.No.
District
Watershed Area
Water Absorbtion Trench
Sanction Achievement
Total areaHa.
Sanctioned areaHa.
Phy (Ha)
Fin (Rs.)
Phy (Ha)
Fin (Rs.)
1 Aurangabad 5442 152523 945.35 22497 5442 152523
2 Nawada 12696 398972 10518 323289 12696 398972
3 Rohtas 0 0 0 0 0 0
4 Bhabua 0 0 0 0 0 0
5 Munger 14944 502468.94 3534 102744 14944 502468.94
6 Jamui 9946 333482 8524.49 322009.00 9946 333482
7 Banka 77794 2436528 17188 453681 77794 2436528
8 Gaya 20706 602406 18576.67 519252 20706 602406
Total 141528.00 4426379.94 59286.51 1743472.00 141528.00 4426379.94
IWDP- South Bihar - District-wise/ Activity-wise Progress up to March 10
Annexure II Contd…

S.No.
District
Watershed Area
Diversion Trench
Sanction Achievement
Total areaHa.
Sanctioned areaHa.
Phy (Ha)
Fin (Rs.)
Phy (Ha)
Fin (Rs.)
1 Aurangabad 0 0 0 0 0 0
2 Nawada 0 0 0 0 0 0
3 Rohtas 0 0 0 0 0 0
4 Bhabua 0 0 0 0 0 0
5 Munger 0 0 0 0 0 0
6 Jamui 0 0 0.00 0.00 0 0
7 Banka 4294 121796 1736 49580 4294 121796
8 Gaya 0 0 0 0 0 0
Total 4294.00 121796.00 1736.00 49580.00 4294.00 121796.00
IWDP- South Bihar - District-wise/ Activity-wise Progress up to March 10
Annexure II Contd…

S.No.
District
Watershed Area
Earthen Gully Plug
Sanction Achievement
Total areaHa.
Sanctioned areaHa.
Phy (Ha)
Fin (Rs.)
Phy (Ha)
Fin (Rs.)
1 Aurangabad 357 316172 176 154824 357 316172
2 Nawada 433 42149 184 22178 433 42149
3 Rohtas 0 0 0 0 0 0
4 Bhabua 0 0 0 0 0 0
5 Munger 1338 216364.19 9 578 1338 216364.19
6 Jamui 2950 1426993 838.00 434636.00 2950 1426993
7 Banka 1575 3197052 1098 1449796 1575 3197052
8 Gaya 1571 1486902 755 323138 1571 1486902
Total 8224.00 6685632.19 3060.00 2385150.00 8224.00 6685632.19
IWDP- South Bihar - District-wise/ Activity-wise Progress up to March 10
Annexure II Contd…

S.No.
District
Watershed Area
Stone Gully Plug
Sanction Achievement
Total areaHa.
Sanctioned areaHa.
Phy (Ha)
Fin (Rs.)
Phy (Ha)
Fin (Rs.)
1 Aurangabad 3 6832 0 0 3 6832
2 Nawada 0 0 0 0 0 0
3 Rohtas 6 1028 6 1030 6 1028
4 Bhabua 0 0 0 0 0 0
5 Munger 218 352965 4 6575 218 352965
6 Jamui 1193 952283 324.00 230923.00 1193 952283
7 Banka 342 389862 213 82426 342 389862
8 Gaya 1342 1247974 612 206778 1342 1247974
Total 3104.00 2950944.00 1159.00 527732.00 3104.00 2950944.00
IWDP- South Bihar - District-wise/ Activity-wise Progress up to March 10
Annexure II Contd…

S.No.
District
Watershed Area
Loose Boulder Structure
Sanction Achievement
Total areaHa.
Sanctioned areaHa.
Phy (Ha)
Fin (Rs.)
Phy (Ha)
Fin (Rs.)
1 Aurangabad 370 739574 151 272110 370 739574
2 Nawada 270 441268 260 388343 270 441268
3 Rohtas 3 13913 3 13914 3 13913
4 Bhabua 0 0 0 0 0 0
5 Munger 45 138747 5 9280 45 138747
6 Jamui 249 1493578 38.00 159480.00 249 1493578
7 Banka 796 1647592 128 169966 796 1647592
8 Gaya 430 1513899 116 490548.48 430 1513899
Total 2163.00 5988571.00 701.00 1503641.48 2163.00 5988571.00
IWDP- South Bihar - District-wise/ Activity-wise Progress up to March 10
Annexure II Contd…

S.No.
District
Watershed Area
Plantation (Forestry)
Sanction Achievement
Total areaHa.
Sanctioned areaHa.
Phy (Ha)
Fin (Rs.)
Phy (Ha)
Fin (Rs.)
1 Aurangabad 84716 443975 6610 31640 84716 443975
2 Nawada 196535 1321187 90393 637761 196535 1321187
3 Rohtas 0 0 0 0 0 0
4 Bhabua 1400 5873 1050 4472 1400 5873
5 Munger 62988 265215 600 16800 62988 265215
6 Jamui 596021 2796877 110177.00 1151876.00 596021 2796877
7 Banka 1279726 6350687 252678 1208503 1279726 6350687
8 Gaya 212773 1051117 44222 335862 212773 1051117
Total 2434159.00 12234931.00 505730.00 3386914.00 2434159.00 12234931.00
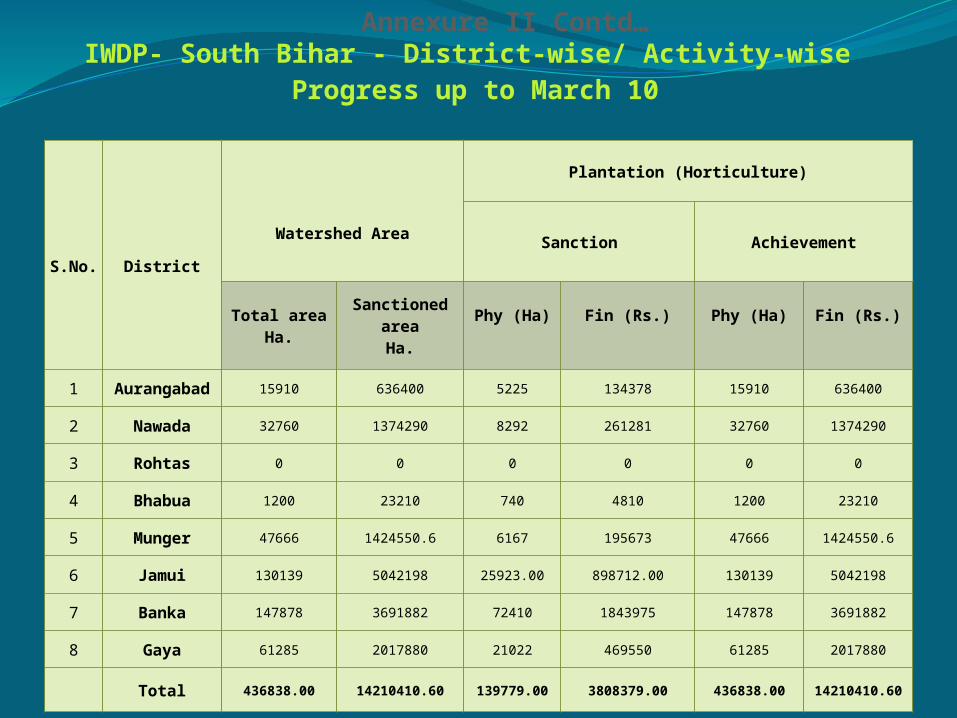
IWDP- South Bihar - District-wise/ Activity-wise Progress up to March 10
Annexure II Contd…
S.No.
District
Watershed Area
Plantation (Horticulture)
Sanction Achievement
Total areaHa.
Sanctioned areaHa.
Phy (Ha)
Fin (Rs.)
Phy (Ha)
Fin (Rs.)
1 Aurangabad 15910 636400 5225 134378 15910 636400
2 Nawada 32760 1374290 8292 261281 32760 1374290
3 Rohtas 0 0 0 0 0 0
4 Bhabua 1200 23210 740 4810 1200 23210
5 Munger 47666 1424550.6 6167 195673 47666 1424550.6
6 Jamui 130139 5042198 25923.00 898712.00 130139 5042198
7 Banka 147878 3691882 72410 1843975 147878 3691882
8 Gaya 61285 2017880 21022 469550 61285 2017880
Total 436838.00 14210410.60 139779.00 3808379.00 436838.00 14210410.60
IWDP- South Bihar - District-wise/ Activity-wise Progress up to March 10
Annexure II Contd…

S.No.
District
Watershed Area
Earthen Check Dam
Sanction Achievement
Total areaHa.
Sanctioned areaHa.
Phy (Ha)
Fin (Rs.)
Phy (Ha)
Fin (Rs.)
1 Aurangabad 42 2257625 7 346701 42 2257625
2 Nawada 6 503193 1 80301 6 503193
3 Rohtas 1 16800 0 0 1 16800
4 Bhabua 2 44020 0 0 2 44020
5 Munger 15 807317 3 81047 15 807317
6 Jamui 58 3792984 21.00 1326211.00 58 3792984
7 Banka 47 2055452 30 1274539 47 2055452
8 Gaya 95 8649798 38 3188192 95 8649798
Total 266.00 18127189.00 100.00 6296991.00 266.00 6296991.00
IWDP- South Bihar - District-wise/ Activity-wise Progress up to March 10
Annexure II Contd…

S.No.
District
Watershed Area
Concrete Check Dam
Sanction Achievement
Total areaHa.
Sanctioned areaHa.
Phy (Ha)
Fin (Rs.)
Phy (Ha)
Fin (Rs.)
1 Aurangabad 0 0 0 0 0 0
2 Nawada 5 963363 1 40128 5 963363
3 Rohtas 0 0 0 0 0 0
4 Bhabua 0 0 0 0 0 0
5 Munger 11 1933313 0 0 11 1933313
6 Jamui 16 3453252 1.00 31500.00 16 3453252
7 Banka 28 4502890 1 40040 28 4502890
8 Gaya 16 2979941 1 26900 16 2979941
Total 76.00 13832759.00 4.00 138568.00 76.00 13832759.00
IWDP- South Bihar - District-wise/ Activity-wise Progress up to March 10
Annexure II Contd…

S.No.
District
Watershed Area
Gabion Structure
Sanction Achievement
Total areaHa.
Sanctioned areaHa.
Phy (Ha)
Fin (Rs.)
Phy (Ha)
Fin (Rs.)
1 Aurangabad 3 99840 0 0 3 99840
2 Nawada 6 118314 0 0 6 118314
3 Rohtas 0 0 0 0 0 0
4 Bhabua 0 0 0 0 0 0
5 Munger 47 1107179 0 0 47 1107179
6 Jamui 119 6634544 2.00 75476.00 119 6634544
7 Banka 38 1156852 0 0 38 1156852
8 Gaya 22 1222174 4 168740 22 1222174
Total 235.00 10338903.00 6.00 244216.00 235.00 10338903.00
IWDP- South Bihar - District-wise/ Activity-wise Progress up to March 10
Annexure II Contd…

S.No.
District
Watershed Area
Water Harvesting Structure
Sanction Achievement
Total areaHa.
Sanctioned areaHa.
Phy (Ha)
Fin (Rs.)
Phy (Ha)
Fin (Rs.)
1 Aurangabad 109 8686675 20 1441337 109 8686675
2 Nawada 90 8490002 18 1862080 90 8490002
3 Rohtas 3 190940 2 48686 3 190940
4 Bhabua 18 1682441 12 1273166 18 1682441
5 Munger 133 11679468 16 927755 133 11679468
6 Jamui 322 24794182 59.00 2891529.00 322 24794182
7 Banka 290 12494278 110 5082190 290 12494278
8 Gaya 197 19515828 56 3807690 197 19515828
Total 1162.00 87533814.00 293.00 17334433.00 1162.00 87533814.00
IWDP- South Bihar - District-wise/ Activity-wise Progress up to March 10
Annexure II Contd…

S.No.
District
Watershed Area
Others
Sanction Achievement
Total areaHa.
Sanctioned areaHa.
Phy (Ha)
Fin (Rs.)
Phy (Ha)
Fin (Rs.)
1 Aurangabad 0 0 0 0 0 0
2 Nawada 0 0 0 0 0 0
3 Rohtas 0 0 0 0 0 0
4 Bhabua 0 0 1 21472 0 0
5 Munger 4 317184 0 0 4 317184
6 Jamui 0 0 0.00 0.00 0 0
7 Banka 10831 2405111 966 82781 10831 2405111
8 Gaya 15 1543017 4 142493 15 1543017
Total 10850.00 4265312.00 971.00 246746.00 10850.00 4265312.00
IWDP- South Bihar - District-wise/ Activity-wise Progress up to March 10
Annexure II Contd…

IWDP- South Bihar - District-wise/ Activity-wise Progress up to March 10
S.No. District
Watershed Area Supervision Cost NGO Management Cost
Total area
Sanctioned area
SanctionRs.
Achievement
Rs.
SanctionRs.
AchievementRs.
1Aurangaba
d6418.00 3718.30 1109570 213991 3386524 1616202
2 Nawada 5211.62 3903.62 1083838 410833 3637023 2430713
3 Rohtas 1029.10 97.96 34806 24104 91016 91015
4 Bhabua 3404.64 170.14 154160 119031 429538 429538
5 Munger11438.1
95830.93 1586433.83 178714 4977380 1242633
6 Jamui20413.3
714482.28 4144394 882482.00 14141105 4125133.00
7 Banka20425.0
512479.24 3739073 1476242 13345412 6006651
8 Gaya15253.5
910368.88 3940473 1023770 11520690 4934891
Total83593.5
651051.35 15792747.83 4329167.00 51528688.00 20876776.00
Annexure II Contd…

IWDP- South Bihar - District-wise/ Activity-wise Progress up to March 10
S.No. District
Watershed Area Capacity Building
Women/Trng. & Dev
Total area
Sanctioned area
SanctionRs.
Achievement
Rs.
SanctionRs.
AchievementRs.
1Aurangaba
d6418.00 3718.30 357934 164391 3123100 310500
2 Nawada 5211.62 3903.62 372548 144115 3687350 1340916
3 Rohtas 1029.10 97.96 45508 23369 0 0
4 Bhabua 3404.64 170.14 131453 61094 0 0
5 Munger11438.1
95830.93 414855 198329 3338600 0
6 Jamui20413.3
714482.28 951057 473526.00 9653200 0.00
7 Banka20425.0
512479.24 946716 399195.5 6897050 1661250
8 Gaya15253.5
910368.88 767245 345569 7386600 0
Total83593.5
651051.35 3987316.00 1809588.50 34085900.00 3312666.00
Annexure II Contd…
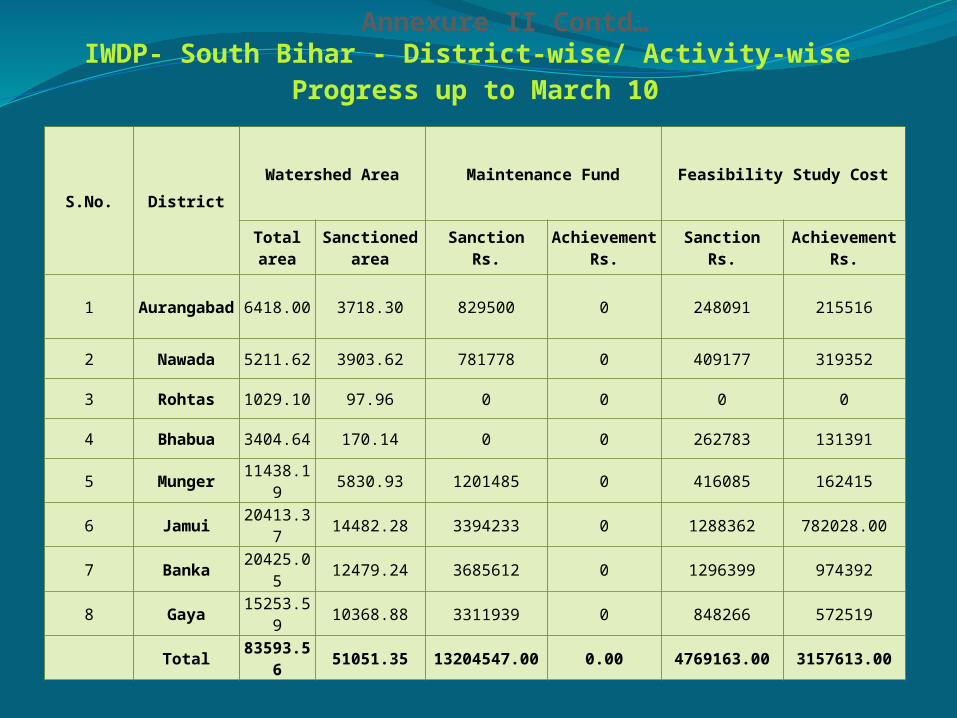
IWDP- South Bihar - District-wise/ Activity-wise Progress up to March 10
S.No. District
Watershed Area Maintenance Fund Feasibility Study Cost
Total area
Sanctioned area
SanctionRs.
Achievement
Rs.
SanctionRs.
AchievementRs.
1Aurangaba
d6418.00 3718.30 829500 0 248091 215516
2 Nawada 5211.62 3903.62 781778 0 409177 319352
3 Rohtas 1029.10 97.96 0 0 0 0
4 Bhabua 3404.64 170.14 0 0 262783 131391
5 Munger11438.1
95830.93 1201485 0 416085 162415
6 Jamui20413.3
714482.28 3394233 0 1288362 782028.00
7 Banka20425.0
512479.24 3685612 0 1296399 974392
8 Gaya15253.5
910368.88 3311939 0 848266 572519
Total83593.5
651051.35 13204547.00 0.00 4769163.00 3157613.00
Annexure II Contd…

IWDP- South Bihar - District-wise/ Activity-wise Progress up to March 10
S.No.
District
Watershed Area Grand Total (Financial)
Total areaSanctioned
areaSanctionRs. Lakh
DisbursementRs.
Expenditure Rs. Lakh
1Aurangab
ad6418.00 3718.30 236.32 99.64 53.45
2 Nawada 5211.62 3903.62 254.75 157.05 94.80
3 Rohtas 1029.10 97.96 5.58 5.36 3.66
4 Bhabua 3404.64 170.14 28.10 26.09 21.22
5 Munger 11438.19 5830.93 342.68 83.85 44.86
6 Jamui 20413.37 14482.28 946.63 297.05 183.00
7 Banka 20425.05 12479.24 857.65 409.71 291.82
8 Gaya 15253.59 10368.88 757.62 295.54 197.29
Total 83593.56 51051.35 3429.33 1374.29 890.10
Capacity Building initiative 24.52 24.52
Total Disb. 1398.81 914.62
Annexure II Contd…

Summary-District-wise status of implementation of IWDP in South Bihar - w.e.f April 2006. Phasing up to March 2011
As on 30 April 10
NABARD, Bihar Regional Office, Patna
Area in Ha. Amt. in Rs. lakh
Sr. No. District Target area Project Sanctioned -CBP stage Project Sanctioned -FIP stage
No. WS Area Amount Sanct. No. WS Area Amount Sanct.
1 Banka 18000 6 7232.20 46.10 12 13192.85 815.23
2 Gaya 15000 4 5345.00 40.04 11 9908.59 719.20
3 Jamui 19000 5 6403.94 33.53 14 14009.43 914.94
4 Munger 12000 5 6180.75 33.49 5 5257.44 310.13
5 Nawada 5000 3 1534.62 24.81 4 3677.00 229.96
6 Rohtas 3000 1 1029.10 5.58 0 0.00 0.00
7 Kaimur 3000 3 3404.64 28.10 0 0.00 0.00
8 Aurangabad 5000 3 2972.00 21.07 3 3446.00 215.24
Sub total 80000 30 34102.25 232.71 49 49491.31 3204.70
Annexure I contd….

Summary-District-wise status of implementation of IWDP in South Bihar - w.e.f April 2006. Phasing up to March 2011
As on 30 April 10
NABARD, Bihar Regional Office, Patna
Area in Ha. Amt. in Rs. lakh
Sr. No. District Target area Amt. Disb. Phy. Progress Fin. Progress
CBP FIP CBP FIP CBP FIP
1 Banka 18000 40.03 369.69 452.684739.22 35.28 271.92
2 Gaya 15000 36.79 361.10 332.693056.67 28.80 211.74
3 Jamui 19000 31.86 462.98 408.673230.76 29.06 199.76
4 Munger 12000 24.60 112.99 204.45672.37 12.84 41.88
5 Nawada 5000 15.62 147.73 98.831708.81 10.20 106.12
6 Rohtas 3000 5.36 0.00 64.260 3.66 0
7 Kaimur 3000 26.08 0.00 109.040 21.22 0
8 Aurangabad 5000 20.19 107.60 179.96955.50 13.38 56.28
Sub total 80000 200.53 1562.09 1850.57 14363.33 154.44 887.70
9 Training/Capacity Building/DD Charges etc. 24.69
Annexure I contd….
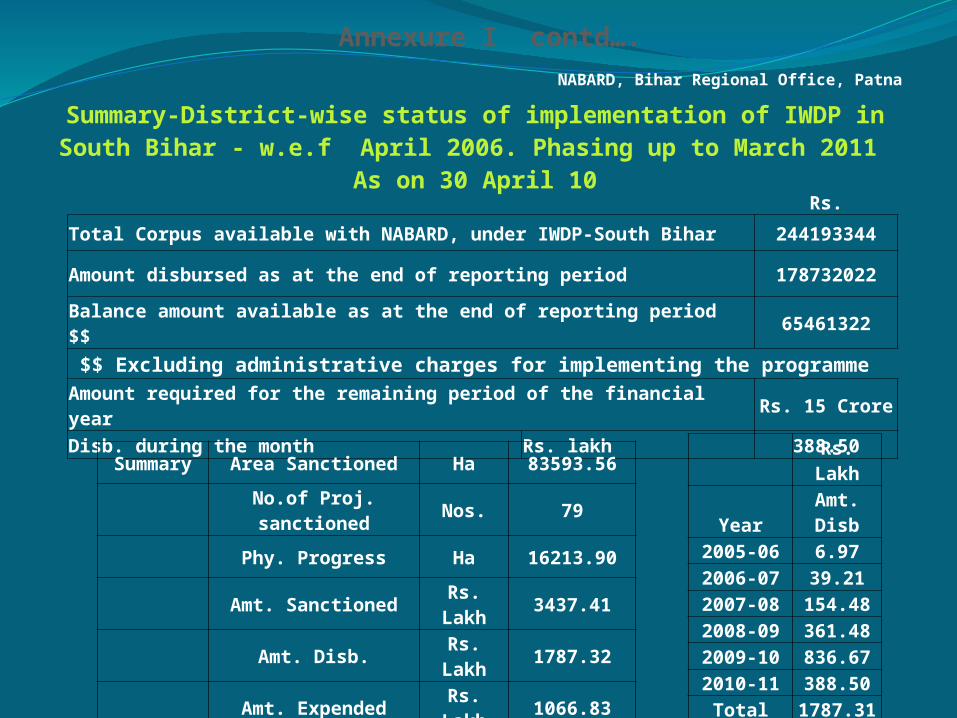
NABARD, Bihar Regional Office, Patna
Summary-District-wise status of implementation of IWDP in South Bihar - w.e.f April 2006. Phasing up to March 2011
As on 30 April 10
Rs.
Total Corpus available with NABARD, under IWDP-South Bihar 244193344
Amount disbursed as at the end of reporting period 178732022
Balance amount available as at the end of reporting period $$ 65461322
$$ Excluding administrative charges for implementing the programme
Amount required for the remaining period of the financial year Rs. 15 Crore
Disb. during the month Rs. lakh 388.50
Summary Area Sanctioned Ha 83593.56
No.of Proj. sanctioned Nos. 79
Phy. Progress Ha 16213.90
Amt. Sanctioned Rs. Lakh 3437.41
Amt. Disb. Rs. Lakh 1787.32
Amt. Expended Rs. Lakh 1066.83
Rs. Lakh
YearAmt. Disb
2005-06 6.972006-07 39.212007-08 154.48
2008-09 361.48
2009-10 836.67
2010-11 388.50
Total 1787.31
Annexure I contd….

Planning for Project s to be taken up under IWMP during
2010-11
Total Area: Will be Reported within a week
Total Cost: Will be Reported within a week
Preparation of PPR/SPSP Shall be submitted by Sept. 2010
Engagement of Staff (SLNA/DC/WC ) Next 4 Months
Preparation of DPR By March 2011

THANKS


