74
PLANNING AND MEASURING PERFORMANCE OF A SHAREPOINT FARM Ivan Neganov
| Date post: | 14-Dec-2015 |
| Category: |
Documents |
| Upload: | dwayne-hays |
| View: | 214 times |
| Download: | 0 times |

PLANNING AND MEASURING PERFORMANCE OF A SHAREPOINT FARM
Ivan Neganov

About
Ivan NeganovFounder and CEO of SoftForte, Inc. 11 years of experience in developing WCM solutions based on ASP.NET and SharePoint platforms. Focusing on SharePoint since 2007.
Blog: neganov.blogspot.com
the Science of Quality
Web: www.softforte.com
Email: [email protected]
2Part I – Planning for Performance

Agenda
Part I – Planning for Performance
Part II – Planning for Throughput
3
Part I – Planning for Performance
Performance Defined
4Part I – Planning for Performance

How Fast is “Fast”?
Human Psysiology Factor Under 0.1 sec – virtually unnoticeable. Under 1 sec – perceived as interactive Under 10 sec – willing to focus on a task
2006 Akamai/Jupiter Research 33% of broadband consumers will wait no longer than 4 sec for a page to load.
2009 Akamai/Forrester Research 2 sec. – average expectation of online shopper 3 sec. – max time 40% shoppers are willing to wait for a page to load http://www.akamai.com/html/about/press/releases/2009/press_091409.html
KB40 – Keynote Business 40. Keynote Systems, Inc. maintains index of fastest business internet sites: http://www.keynote.com/keynote_competitive_research/performance_indices/
WM100 – Webmetrics maintains index of top 100 sites by performance http://www.webmetrics.com/resources/benchmarking.html
5Part I – Planning for Performance

SharePoint Response Time Guidance
http://technet.microsoft.com/en-ca/library/cc262787.aspx
6Part I – Planning for Performance
Type of operation Examples
Acceptable user response time
Common operation
· Browsing to the home page
· Browsing to a document library
<3 seconds
Uncommon operation
· Creating a subsite Creating a list
· Uploading a document to a document library
<5 seconds
Rare operation · Backing up a site· Creating a site collection
<7 seconds

How Fast is “Fast” in my Company?
Study publicly available metrics Study organization’s historical metrics Estimate average and peak traffic Define a matrix of PLT1 and PLT2:
For various pagesFor various authentication groupsFor peak and average usage
7Part I – Planning for Performance

Response Time
Page Load Time (PLT) or User Response Time (URT) – time until a page fully renders.
Microsoft uses PLT1 and PLT2 – the
very first access to the page, and subsequent access to the same page.
8Part I – Planning for Performance
Part I – Planning for Performance
CNS Model:ClientNetworkServer
9Part I – Planning for Performance

URT Formula
10Part I – Planning for Performance

URT Formula (Netforecast)
R – response time
Payload – total size of page and all its resources
AppTurns – round trips made at application level (excluding TCP handshake/congestion control round trips & authentication)
RTT – round trip time
Cs – constant server time component
Cc – constant client time component
Reference: http://www.webperformancematters.com/journal/2007/7/24/latency-bandwidth-and-response-times.html
11Part I – Planning for Performance
Need for Testing
Simply applying the formula will lead to significant errors.
You need to calibrate every part of it. Testing produces data for calibration.
12Part I – Planning for Performance

Part I – Planning for Performance
Client Performance
13Part I – Planning for Performance
Client Scripting Performance
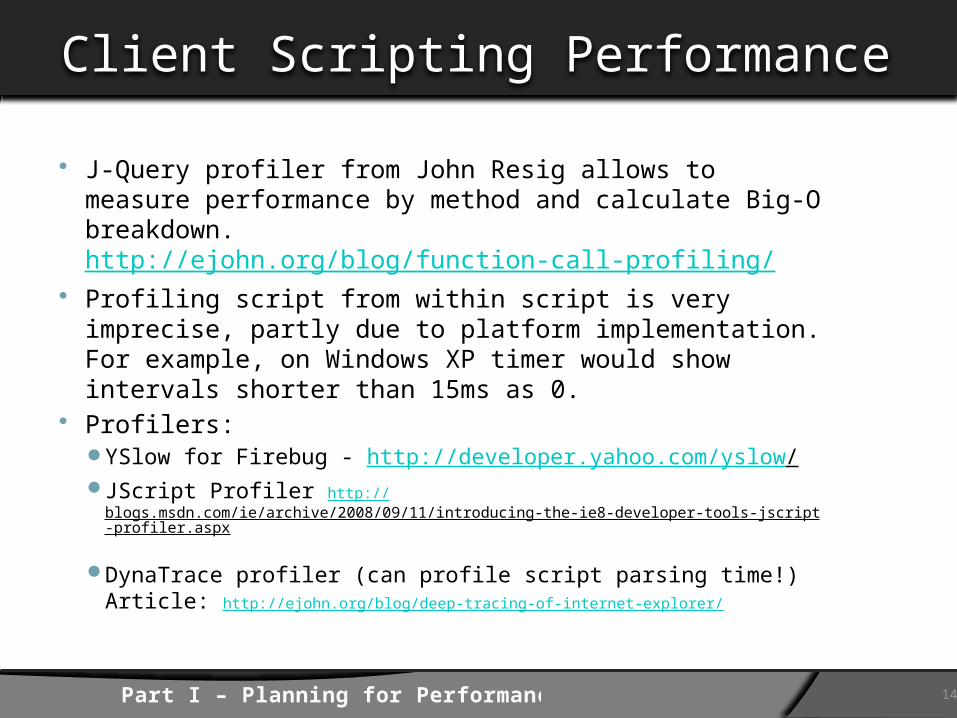
J-Query profiler from John Resig allows to measure performance by method and calculate Big-O breakdown. http://ejohn.org/blog/function-call-profiling/
Profiling script from within script is very imprecise, partly due to platform implementation. For example, on Windows XP timer would show intervals shorter than 15ms as 0.
Profilers: YSlow for Firebug - http://developer.yahoo.com/yslow/ JScript Profiler http://
blogs.msdn.com/ie/archive/2008/09/11/introducing-the-ie8-developer-tools-jscript-profiler.aspx
DynaTrace profiler (can profile script parsing time!) Article: http://ejohn.org/blog/deep-tracing-of-internet-explorer/
14Part I – Planning for Performance
Part I – Planning for Performance
Network Performance
15Part I – Planning for Performance

Network Performance – the Bottleneck
Bandwidth limitations – can be addressed via technology
Latency limitations – Speed of LightRTT/2 = (36,000 *2)/300,000
RTT ~ 0.5 sec.
TCP limitations Signal strength/QoS
16Part I – Planning for Performance
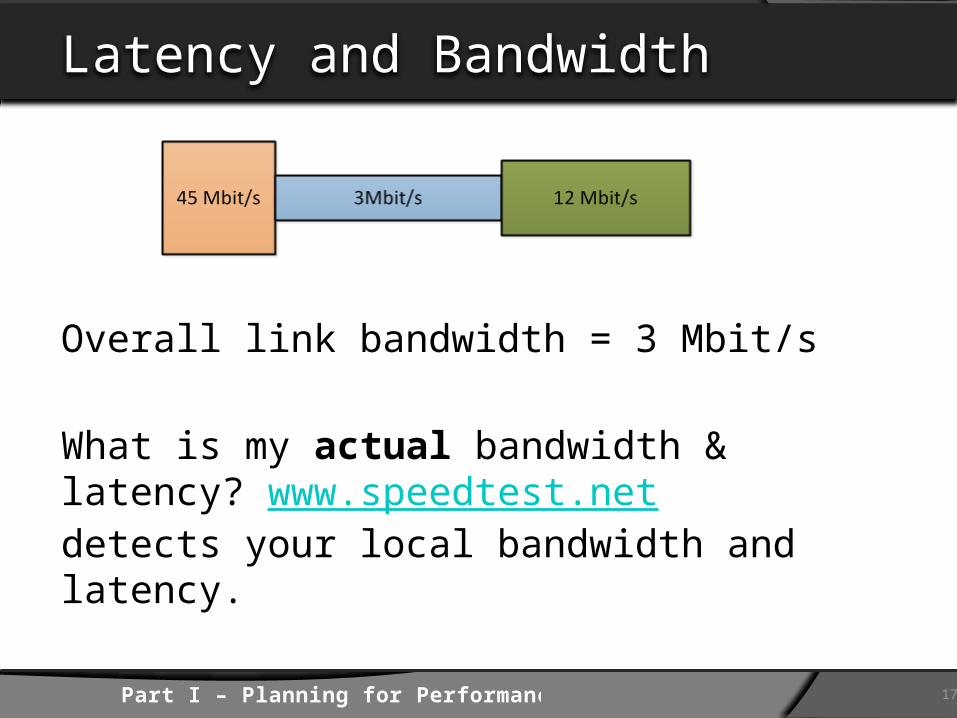
Latency and Bandwidth
Overall link bandwidth = 3 Mbit/s
What is my actual bandwidth & latency? www.speedtest.net detects your local bandwidth and latency.
17Part I – Planning for Performance

TCP Communication
A max. packet size on Ethernet is 1500 bytes, aka MTU or max. transfer unit.
On IPv4 networks IP overhead takes 40 bytes, hence max payload equals 1460 bytes, aka MSS or max. segment size.
TCP requires acknowledgement (ACK) of all packets sent but allows sending a number of packets without waiting for ACK to improve speed. Eventually ACK must arrive.
If some packets are lost, i.e. there is no ACK within a timeout, then packets are re-transmitted.
18Part I – Planning for Performance

TCP Communication: Naïve Model
19Part I – Planning for Performance
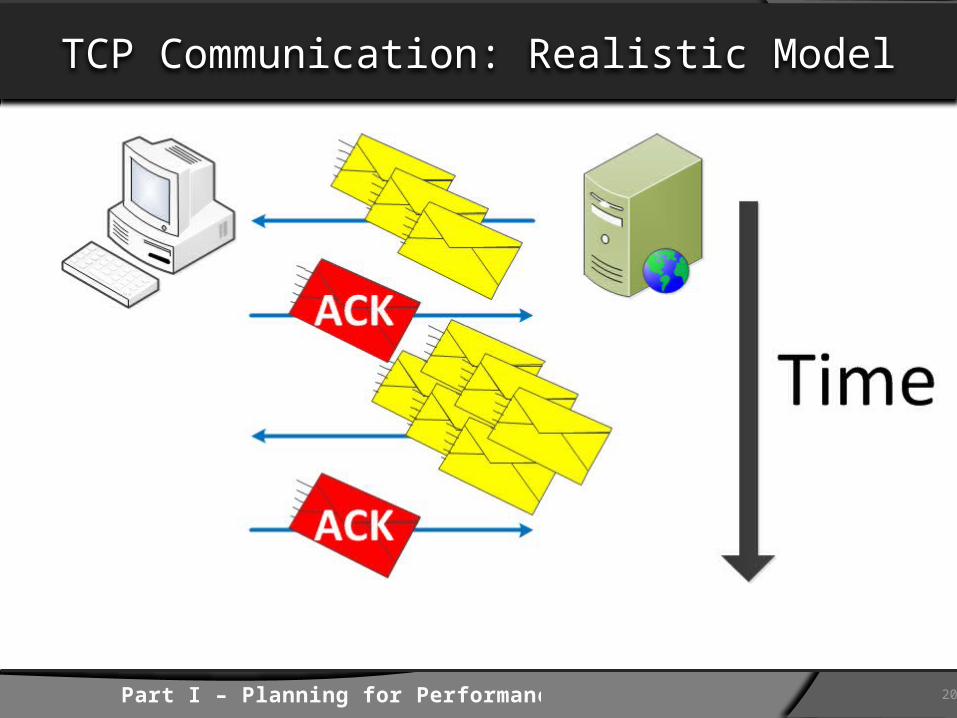
TCP Communication: Realistic Model
20Part I – Planning for Performance

TCP Communication: TCP Window
21Part I – Planning for Performance
TCP Window
TCP Window is a number of bytes a receiver can accept without sending ACK immediately.
Too large window means network congestion >> lost packets >> re-transmission >> performance degradation
Too small window means low bandwidth utilization >> performance degradation
22Part I – Planning for Performance
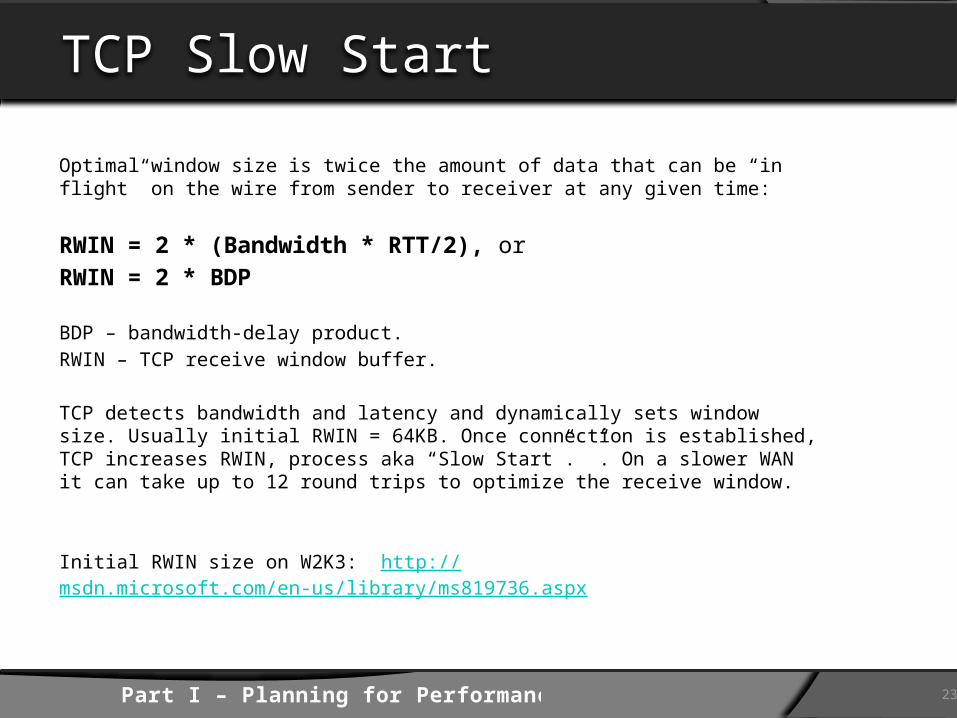
TCP Slow Start
Optimal window size is twice the amount of data that can be “in flight” on the wire from sender to receiver at any given time:
RWIN = 2 * (Bandwidth * RTT/2), or
RWIN = 2 * BDP
BDP – bandwidth-delay product.
RWIN – TCP receive window buffer.
TCP detects bandwidth and latency and dynamically sets window size. Usually initial RWIN = 64KB. Once connection is established, TCP increases RWIN, process aka “Slow Start”. ”. On a slower WAN it can take up to 12 round trips to optimize the receive window.
Initial RWIN size on W2K3: http://msdn.microsoft.com/en-us/library/ms819736.aspx
23Part I – Planning for Performance

TCP Congestion Control
Sender maintains congestion window, CWND and constantly tweaks it according to bandwidth and delay to avoid congestion:
Effective bandwidth = CWND/RTT
Various congestion control algorithms are known, ex. Tahoe, Reno. Windows Vista, 7 and 2008 use CTCP. It is advantageous over WAN, enabled by default on 2008, but not on Vista and Windows 7.
Reference: http://technet.microsoft.com/en-us/library/bb726965.aspx
24Part I – Planning for Performance

TCP Congestion Window Scaling
25Part I – Planning for Performance
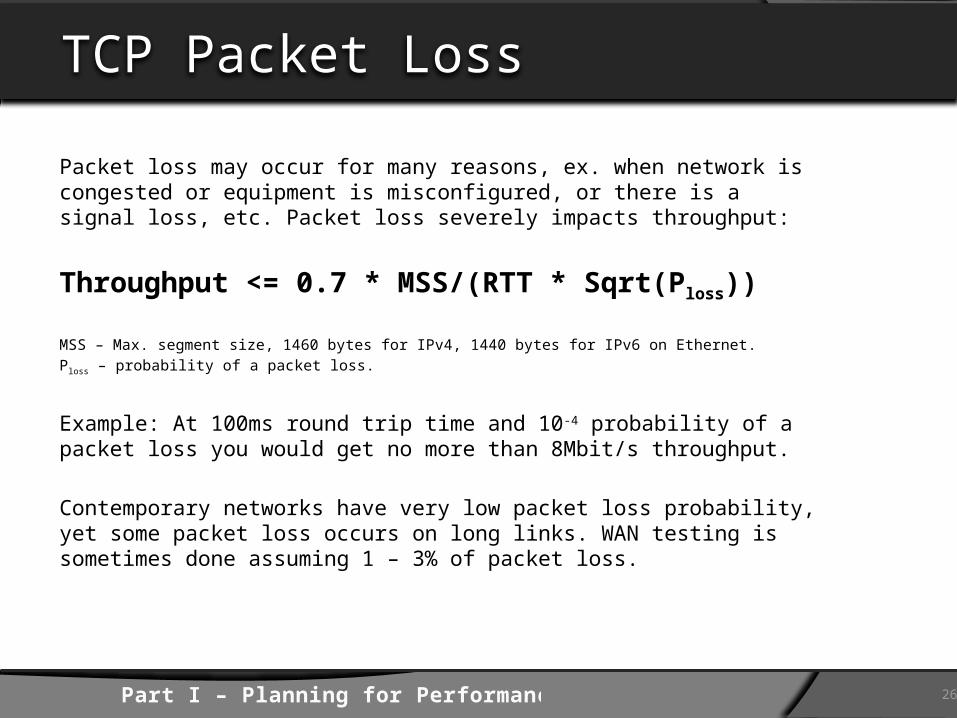
TCP Packet Loss
Packet loss may occur for many reasons, ex. when network is congested or equipment is misconfigured, or there is a signal loss, etc. Packet loss severely impacts throughput:
Throughput <= 0.7 * MSS/(RTT * Sqrt(Ploss))
MSS – Max. segment size, 1460 bytes for IPv4, 1440 bytes for IPv6 on Ethernet.
Ploss – probability of a packet loss.
Example: At 100ms round trip time and 10-4 probability of a packet loss you would get no more than 8Mbit/s throughput.
Contemporary networks have very low packet loss probability, yet some packet loss occurs on long links. WAN testing is sometimes done assuming 1 – 3% of packet loss.
26Part I – Planning for Performance
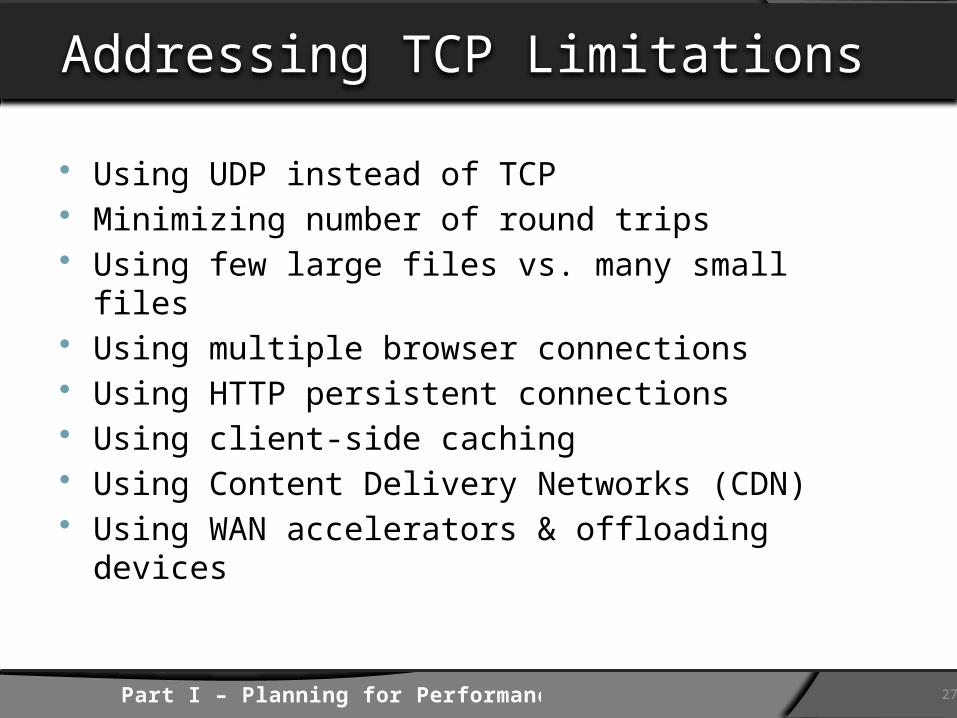
Addressing TCP Limitations
Using UDP instead of TCP Minimizing number of round trips Using few large files vs. many small files Using multiple browser connections Using HTTP persistent connections Using client-side caching Using Content Delivery Networks (CDN) Using WAN accelerators & offloading
devices
27Part I – Planning for Performance

Multiple Browser Connections
Contemporary browsers use multiple TCP connections per hostname:IE6, IE7 – 2 connections max;IE8, FireFox 3.5 – 6 connections max.
Open multiple (source) ports for multiple TCP connections.
Despite having multiple connections a lot of sequential loading still takes place. IE8 is the first browser to download multiple script files in parallel.
28Part I – Planning for Performance
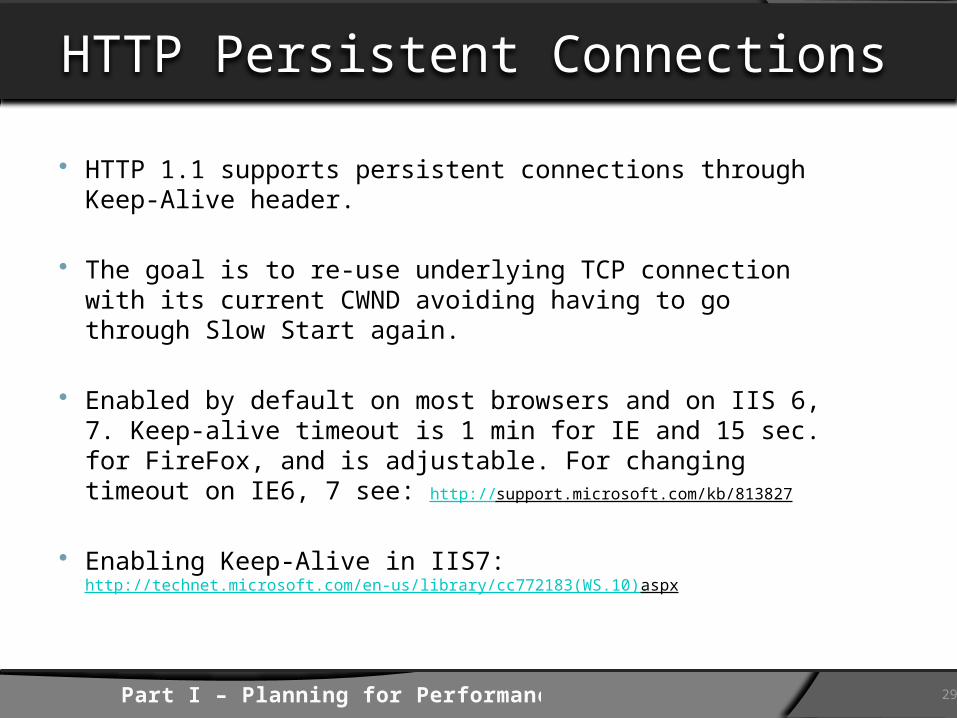
HTTP Persistent Connections
HTTP 1.1 supports persistent connections through Keep-Alive header.
The goal is to re-use underlying TCP connection with its current CWND avoiding having to go through Slow Start again.
Enabled by default on most browsers and on IIS 6, 7. Keep-alive timeout is 1 min for IE and 15 sec. for FireFox, and is adjustable. For changing timeout on IE6, 7 see: http://support.microsoft.com/kb/813827
Enabling Keep-Alive in IIS7: http://technet.microsoft.com/en-us/library/cc772183(WS.10).aspx
29Part I – Planning for Performance

Content Delivery Networks
CDNs distribute cached content on multiple servers, which are close to end users. Internet traffic is redirected to the closest CDN server instead of the origin server.
Advantages: Low latency & high bandwidth when accessing a CDN server result in much better
performance for the end users. As a result of many users hitting CDN cache the load on original server is reduced. Excellent for media streaming.
Disadvantages: Very expensive, typically affordable to large enterprises only. Ex. $0.5/GB on 50 TB
monthly ~25,000$/month Less efficient for highly volatile content. It can be technically difficult to invalidate CDN cache explicitly.
Free CDNs, primarily AJAX support: Google AJAX Libraries API - http://code.google.com/apis/ajaxlibs/ Microsoft AJAX CDN - http://
weblogs.asp.net/scottgu/archive/2009/09/15/announcing-the-microsoft-ajax-cdn.aspx More Info about CDNs: http://
en.wikipedia.org/wiki/Content_delivery_network#Free_CDNs
30Part I – Planning for Performance

WAN Accelerators & Offloading Devices
Use packet compression, differencing, caching, optimal route calculation algorithms, reducing packet loss.
Solutions include Cisco, Citrix, Packeteer, Riverbed, F5, Brocade.
Microsoft’s ISA and IAG, and their successor Unified Access Gateway (UAG 2010) provide caching, offloaded compression, differencing and authentication delegation.
31Part I – Planning for Performance

Determining Network Performance
Nature of network transmission complicates its mathematical modeling and projection of results between different networks. This increases amount of calibration testing needed.
Create a reference set of web pages and test them on various networks. Calibrate earlier discussed CNS formulas using these test results.
Tools are available: http://www.webpagetest.org/ http://kite.keynote.com/ http://msdn.microsoft.com/en-us/magazine/dd188562.aspx http://www.fiddler2.com/fiddler2 http://www.aptimize.com
32Part I – Planning for Performance

Part I – Planning for Performance
Server Performance
33Part I – Planning for Performance

Server Performance
Create baseline measurement for various load profiles and PLT1/PLT2
Use Performance counters:ASP.NET Request Execution TimeASP.NET Request Wait TimeServer Response Time (SRT) = the sum of
the two.
Essential performance counters: http://support.microsoft.com/kb/815159
34Part I – Planning for Performance
SharePoint 2010 Performance Improvements
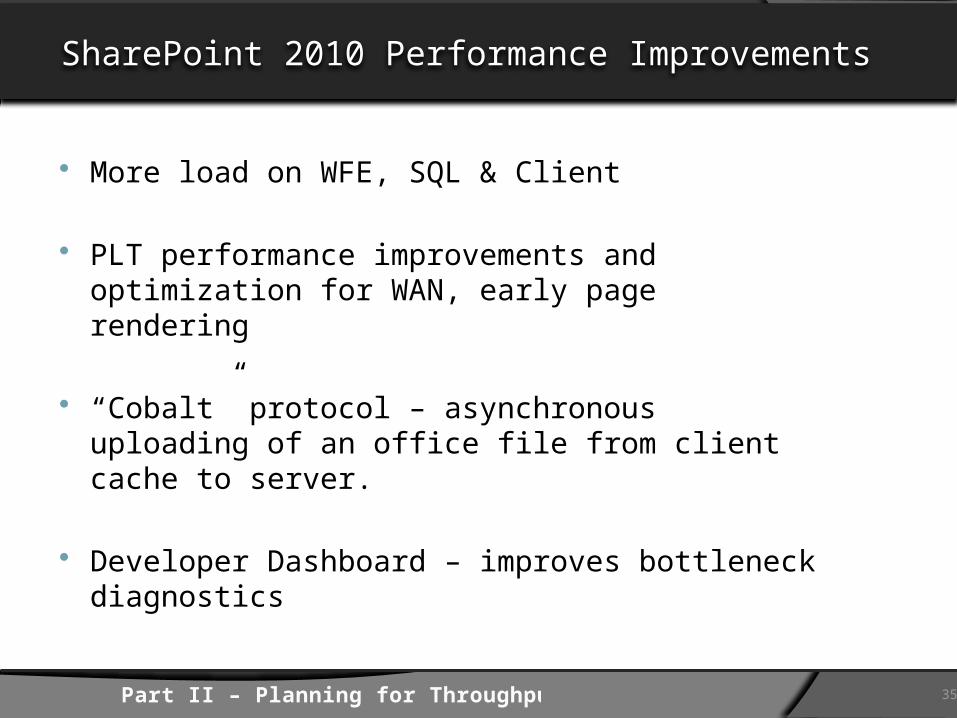
More load on WFE, SQL & Client
PLT performance improvements and optimization for WAN, early page rendering
“Cobalt” protocol – asynchronous uploading of an office file from client cache to server.
Developer Dashboard – improves bottleneck diagnostics
35Part II – Planning for Throughput

DEMOPerformance Measurement ToolsSharePoint Developer DashboardMeasuring PLT1 & PLT2
36

Part II – Planning for Throughput
Objectives Models Rules of Thumb Selecting Hardware SharePoint 2010 & Capacity
Management
37Part II – Planning for Throughput
About Capacity Planning
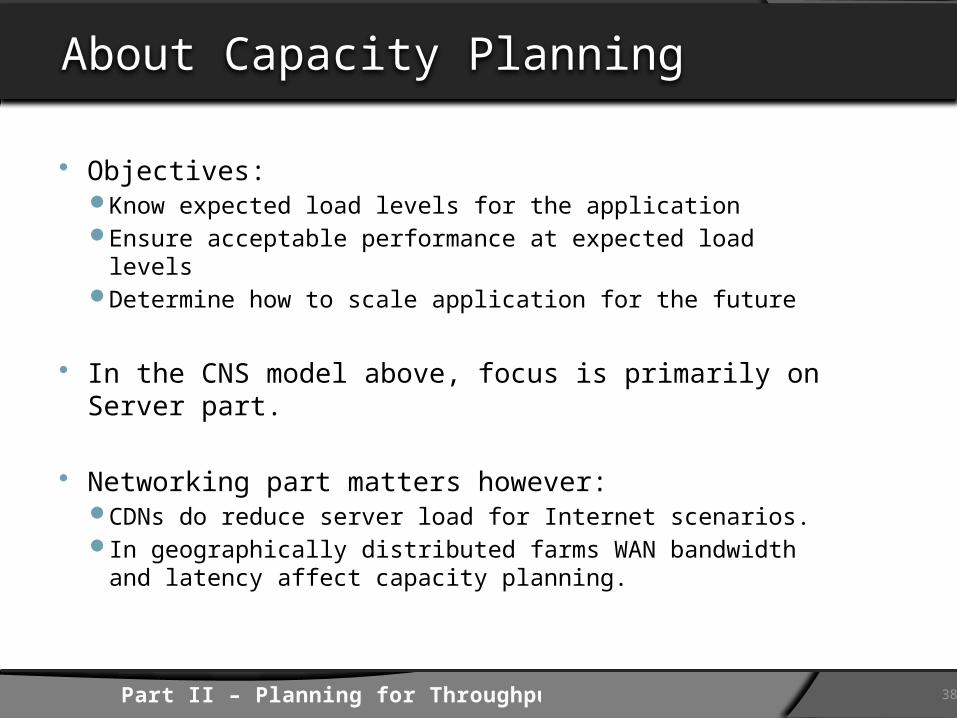
Objectives:Know expected load levels for the applicationEnsure acceptable performance at expected load levelsDetermine how to scale application for the future
In the CNS model above, focus is primarily on Server part.
Networking part matters however: CDNs do reduce server load for Internet scenarios. In geographically distributed farms WAN bandwidth and
latency affect capacity planning.
38Part II – Planning for Throughput

Theoretical Web Server Model
http://cuip.net/~dloquinte/researchfiles/IIT(RET)/reliability/webmodel.pdf
39Part II – Planning for Throughput
Server Under Load: Theoretical Model
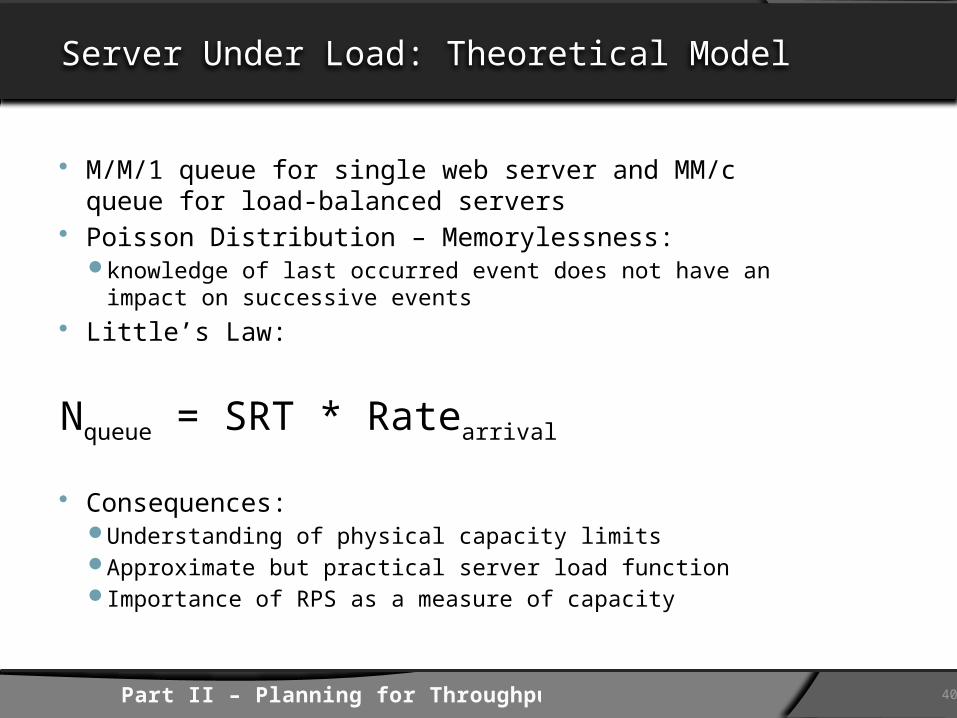
M/M/1 queue for single web server and MM/c queue for load-balanced servers
Poisson Distribution – Memorylessness: knowledge of last occurred event does not have an impact on
successive events Little’s Law:
Nqueue = SRT * Ratearrival
Consequences: Understanding of physical capacity limits Approximate but practical server load function Importance of RPS as a measure of capacity
40Part II – Planning for Throughput

Theoretical Server Response Time
Server performance is analyzed together with the server load.
From queuing analysis for M/M/1 queue:
SRT = SRT(0)/(1 – U)
SRT – server response time
SRT(0) – server response time at 0 utilization
U – utilization, or average percentage of time the server is busy.
41Part II – Planning for Throughput

SRT is a Function of Utilization
42Part II – Planning for Throughput

Load-Balanced Servers
43Part II – Planning for Throughput

SharePoint Farm Capacity Planning
Theory explains guidance parameters & helps with rough estimates
Rules-of-Thumb, best practices & reference performance tests are used to determine components of the farm
Requests per Second (RPS) are used to measure farm capacity
Additional tools: SPCP: http://
technet.microsoft.com/en-us/library/bb961988.aspx
44Part I – Planning for Performance

Throughput Targets: Classic Usage Model
1. All SharePoint site users can be classified into 4 groups:
1. Light users – generate 20 RPH or 2 User Ops/Hour
2. Typical users – generate 36 RPH or 3.6 User Ops/Hour
3. Heavy users – generate 60 RPH or 6 User Ops/Hour
4. Extreme users – generate 120 RPH or 12 User Ops/Hour
3. RPH are calculated based on daily average non-401 requests made by distinct users.
4. Given total number of users in each class set percentage of them that is active, i.e. actively using the SharePoint site. This is also known as concurrency. Even at peak usage 10% is a high concurrency, 5% is typical.
5. Weighted sum yields total demand in RPS.
Reference: http://technet.microsoft.com/en-us/library/cc261795.aspx
45Part II – Planning for Throughput

Classic Usage Model - Example
There are total of 30,000 users of the portal. 25,000 of them are typical users.4,500 of them are heavy users.500 of them are extreme users.
During the peak hour on average 10% of typical users and 5% of heavy and extreme users are accessing the site.
What is the required farm capacity?
Capacity = (0.1 * 25,000 * 36 + 0.05 * 4,500 * 60 + 0.05 * 500 * 120)/3600 = 29.6 RPS
46Part II – Planning for Throughput
SharePoint Activities Affect Capacity
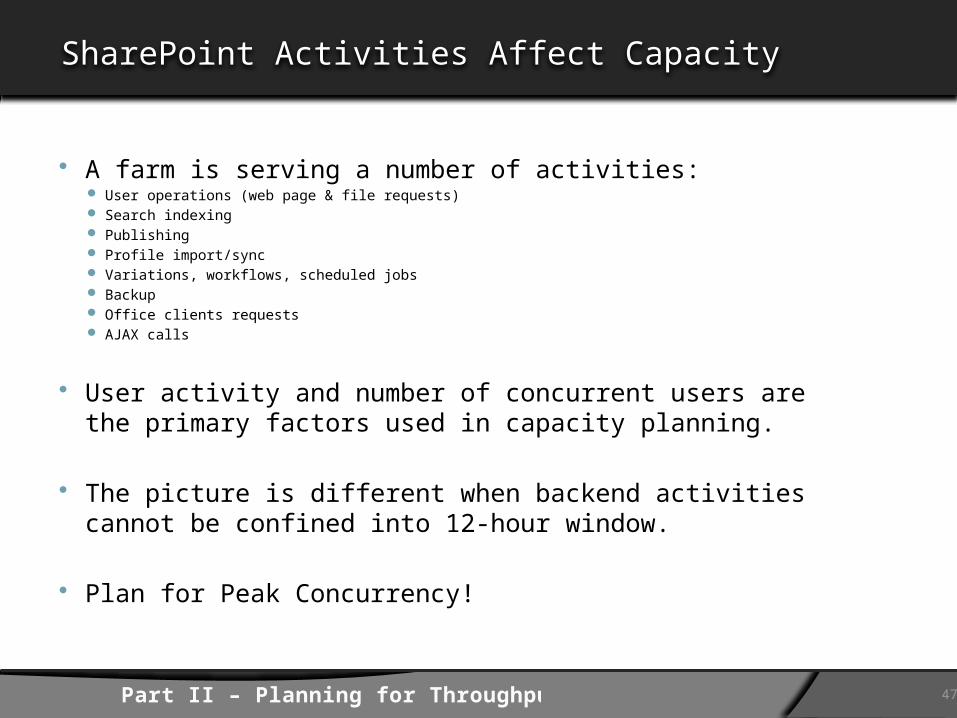
A farm is serving a number of activities: User operations (web page & file requests) Search indexing Publishing Profile import/sync Variations, workflows, scheduled jobs Backup Office clients requests AJAX calls
User activity and number of concurrent users are the primary factors used in capacity planning.
The picture is different when backend activities cannot be confined into 12-hour window.
Plan for Peak Concurrency!
47Part II – Planning for Throughput

Rules-of-Thumb: Web Front End
Portal Collaboration Scenario
WSS Collaboration Scenario
http://technet.microsoft.com/en-
us/library/cc261716.aspx
48Part II – Planning for Throughput

Rules-of-Thumb: Web Front End
HA prevail over capacity requirements for small and medium installations.
Max RPS achieved at 5 WFEs per DB server. More WFEs overload ConfigDB.
1 DC per 3-4 WFEs, if NTLM authentication is used.
Set 1 WFE as crawl target, remove it from load balancer.
Average WFE CPU utilization should be 30%.
49Part II – Planning for Throughput

Rules-of-Thumb: Storage Sizing
Important for performance planning because storage estimates contribute to IOPS requirement for the disk subsystem.
100 GB per content database
Use reference installations, or Microsoft estimation guidance: http://technet.microsoft.com/en-ca/library/cc261716.aspx
50Part II – Planning for Throughput

IOPS
Two common measures of disk throughput: IOPS – used for random access to disk, typical for SharePoint
workloads. MB/s – used for mostly sequential access, common to serving
large files, running large reports on cubes.
Use performance counter: Disk Transefers/sec to determine peak IOPS based on RPS.
10K RPM drives give 100-130 IOPS; 15K RPM drives give 150-180 IOPS.
Use sqlio.exe utility to determine actual IOPS of a hardware.
51Part II – Planning for Throughput
Rules-of-Thumb: SQL Server
Resources on SQL for SharePoint Planning: http://technet.microsoft.com/en-us/library/cc263261.aspx
Resources on SQL Mirroring: http://technet.microsoft.com/en-us/library/cc287861.aspx
52Part II – Planning for Throughput

Rules-of-Thumb: SQL Server
Disk Latency: Disk sec/transfer Data files < 10ms T-log files < 5ms
Disk Capacity:
*RAID-5 can be used for static web content.
53Part II – Planning for Throughput

Rules-of-Thumb: SQL Server
Typical Deployment Sizes:
54Part II – Planning for Throughput
Metric SmallMediu
m Large
Content db size < 50GB 50GB > 50GB
# of Content dbs < 20 20 > 20
# of concurrent requests to SQL < 200 200 > 200
# of Users < 1000 1000 > 1000
# of items in regularly accessed list < 2000 2000 > 2000
# of columns in regularly accessed list < 20 20 > 20

Rules-of-Thumb: SQL Server
Recommended Capacities:
55Part II – Planning for Throughput
Resource Small Medium Large
Recommended DB server memory 8 GB + 16 GB + 32 GB +
Processor L2 cache 2 MB > 2 MB > 2MB
Bus bandwidth Medium High High
Disks latencies (msec) < 20 < 10 < 10 (data)< 5 (T-log)
Network Gigabit Gigabit Gigabit
Network latency (msec) < 1 < 1 < 1
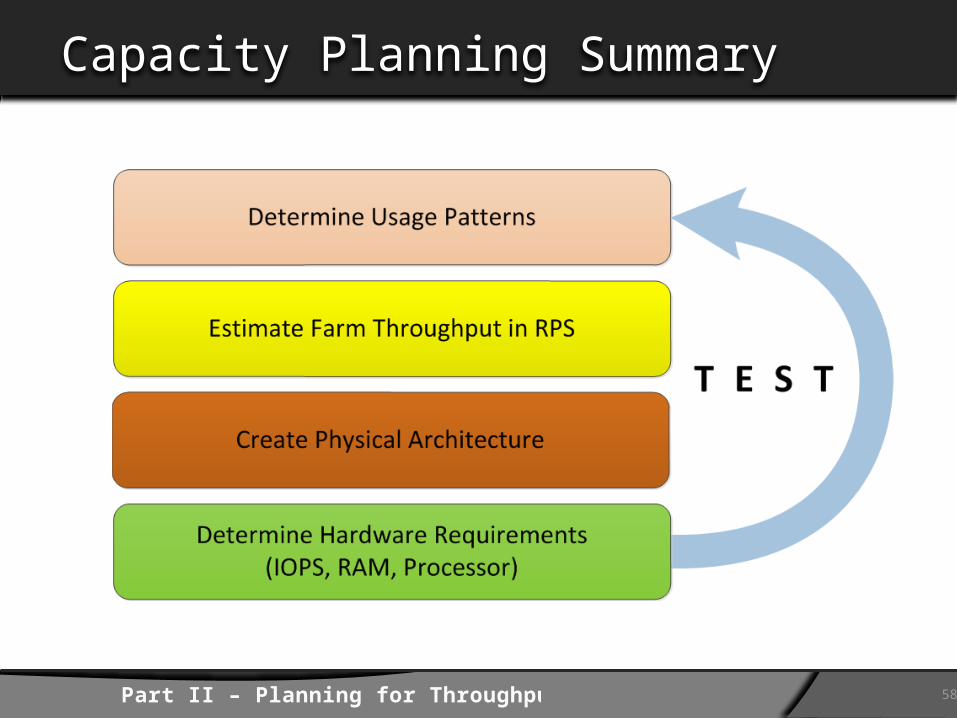
Capacity Planning Summary
58Part II – Planning for Throughput

SharePoint 2010 Capacity Improvements
Large list throttling WFE will return 503 when overloaded Office clients are aware of this, and will in turn throttle server
requests Co-authoring of documents; PPT broadcasting.
HTTP throttling Blocks robots, search indexing Gives first priority to client traffic
Bit rate throttling – used by assets library, implemented in IIS Media Services extension
SQL Server 2008 Throttling – Resource Governor can limit use of resources by specific processes
Software boundaries improvement
59Part II – Planning for Throughput

SharePoint 2010 Capacity Planning
60Part II – Planning for Throughput

SharePoint 2010 Capacity Management
Logging DB Developer Dashboard Load Testing Toolkit (a part of
SharePoint Administration Toolkit) There is more to come…
61Part II – Planning for Throughput

DEMOCapacity Validation Load Test

Performance Counters
Performance counters are central in determining all aspects of performance. One example for capacity planning:
ASP.NET Applications\Request/sec
A comprehensive list of relevant counters is available here:
http://blogs.msdn.com/ketaanhs/archive/2010/03/13/moss-performance-counters.aspx
63Part II – Planning for Throughput
Load Testing Tools
SharePoint 2010:Load Testing Kit, part of SharePoint Administration Toolkit – reference Web & Load tests.
VSTT
Useful blog post by Bill Baer lists tools used for stress testing of SharePoint
http://blogs.technet.com/wbaer/archive/2007/08/02/stress-testing-microsoft-office-sharepoint-server-2007-windows-sharepoint-services-3-0.aspx
64Part II – Planning for Throughput

Part III – Best Practices
Information Architecture Web Front End (WFE) Servers SQL Server
65Part III – Best Practices
Information Architecture: Best Practices
Account for software boundaries:http://technet.microsoft.com/en-us/library/cc262787.aspx
For large lists, follow performance guidance: http://
technet.microsoft.com/en-us/library/cc262813.aspx
Separate content with different usage profiles into different site collections
Account for authentication performance impact: Anonymous - fastest Kerberos NTLM Basic Forms - slowest
66Part III – Best Practices

WFE Best Practices: Caching
Output caching & cache profiles Native to ASP.NET 2.0, individual page level Turned off by default in 2007. Need Publishing Infrastructure Feature on. Enable for read-only users. Never cache search results for authenticated users, alternatively disable search results page. Uses RAM on WFE, adjust ASP.NET private byte limit
BLOB caching Used on document libraries only Minimizes round-trips to database for HTML, CSS, image or media files, etc. by creating disk-based cache on WFE Not enabled by default Important to use max-age attribute to instruct clients to cache resources Affects disk I/O of the WFE servers
Object caching Benefit for certain page items: navigation data, cross-list query data Uses RAM: default 100MB. Monitor cache hit ratio counters and adjust RAM to have over 90% hits. The only caching turned on by default
Office Web Applications Caching (SharePoint 2010) Branch Caching (Windows 2008)
More Info: http://technet.microsoft.com/en-us/library/cc298466.aspx
67Part III – Best Practices

WFE Best Practices: IIS Compression
Static IIS compression is on by default in IIS 6, 7. Used for *.html, *.htm, *.css, *.txt files by default.
Dynamic compression is off by default on both IIS 6 & 7. Used for *.asp, *exe files by default.
Using IIS compression increases load on WFE CPU, but it reduces disk I/O, which is much slower, so it can dramatically boost performance.
You need to configure compression levels, and add extensions for *.js, *.aspx etc.
IIS 7 can be configured to compress items before adding them to cache. This needs to be turned on to reduce load on the CPU.
68Part III – Best Practices
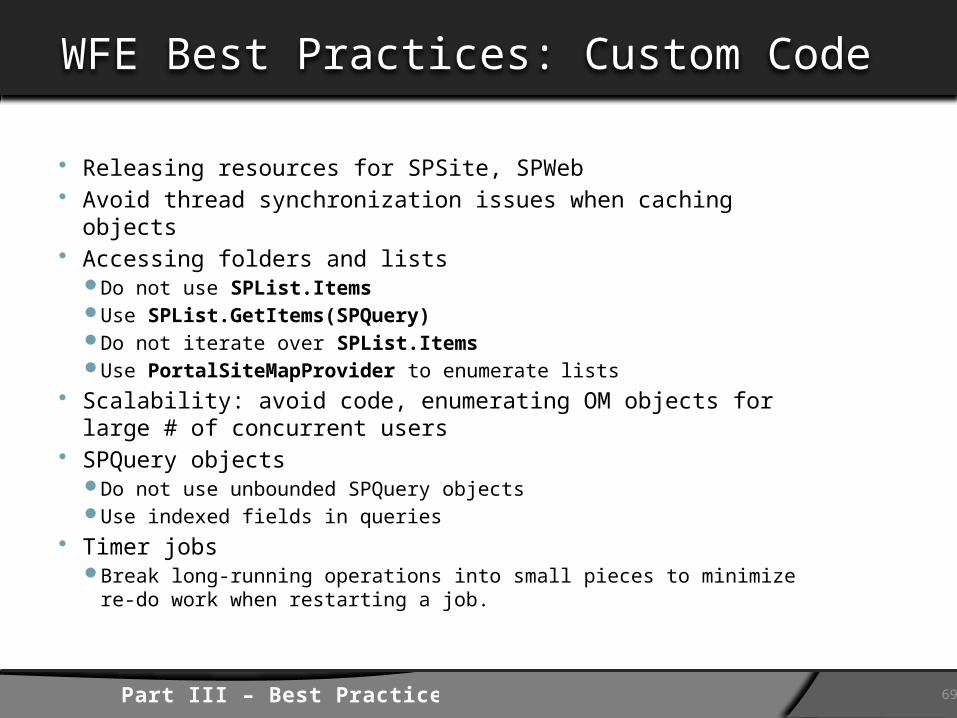
WFE Best Practices: Custom Code
Releasing resources for SPSite, SPWeb Avoid thread synchronization issues when caching objects Accessing folders and lists
Do not use SPList.Items Use SPList.GetItems(SPQuery) Do not iterate over SPList.Items Use PortalSiteMapProvider to enumerate lists
Scalability: avoid code, enumerating OM objects for large # of concurrent users
SPQuery objects Do not use unbounded SPQuery objects Use indexed fields in queries
Timer jobs Break long-running operations into small pieces to minimize re-do work
when restarting a job.
69Part III – Best Practices

WFE Best Practices: Other
Load scripts outside of script engine using document.write(<script src=…); SharePoint 2010 does this!
Make sure HTTP 1.1 keep-alive header is on. It is used by persistent connections, turned on by default in IIS 6,7
Minimize number of small file downloads. Reason: many small files do not use link capacity fully. Single large file downloads are more efficient.
Load scripts on demand where possible. Ex. Core.js script on Internet sites
70Part III – Best Practices
WFE Best Practices: More Info
SharePoint Dispose Checker Toolhttp://code.msdn.microsoft.com/SPDisposeCheck
12 Steps for Faster Web Pages – Jim Pierson: http://msdn.microsoft.com/en-us/magazine/dd188562.aspx
Tuning web server performance: http://technet.microsoft.com/en-us/library/cc298550.aspx
Andrew Connell on Performance: http://msdn.microsoft.com/en-us/library/ee857096.aspx
Common Coding Issues with SharePoint OM:http://msdn.microsoft.com/en-us/library/bb687949.aspx
Optimizing Custom WP for the WAN: http://technet.microsoft.com/en-us/library/cc263412.aspx
Configuring Caching & Performance – James Petrosky:http://www.microsoft.com/winme/0712/31729/Module5/Local/index.html
71Part III – Best Practices

Search Best Practices (MOSS 2007)
Use dedicated server for Indexing when possible.
Do not combine search and query roles on the same server.
Set one of WFEs as a crawl target, and remove it from load balancer
Search query performance is improved when using multiple load-balanced query servers: http://technet.microsoft.com/en-us/library/cc262574.aspx
72Part III – Best Practices

SQL Server Best Practices
Ensure correct Host Bus Adapter drivers and firmware versions.
Configure correct NTFS allocation unit size (done during formatting the drive, as a format.exe option) 64K – best. Equals to SQL Server extent size. Default is 4K, can
result in 30% performance hit.
Ensure correct Windows sector alignment. Windows 2008 aligns sectors by default (done during partitioning of the drive) Incorrect alignment can result in up to 50% performance hit.
More Info: http://msdn.microsoft.com/en-us/library/dd758814.aspx
73Part III – Best Practices

SQL Server Best Practices
Database file placement priority among faster disks: tempdb data and T-log files Db T-log files Search database data files Content Database data files
Place tempdb, Content db and T-logs on separate LUNs.
Use multiple data files for Content and Search db distribute them across disks. # of files should be <= # of processor cores Multiple data files are not supported for other dbs.
Place SharePoint Search crawl and query tables on separate spindles.
74Part III – Best Practices

SQL Server Best Practices
100 GB content databases (soft) limit.
Break content into content databases by IO profile. Example: store collaboration sites content and publishing portal content in different databases.
Use dedicated database for large site collections (> 50 GB)
Configure tempdb files = # of processors
Configure tempdb to be 25% of content db size. Alternatively either at least 10% or the size of the largest table, whichever is greater.
More Info: http://technet.microsoft.com/en-us/library/cc263261.aspx
http://technet.microsoft.com/en-us/library/cc298801.aspx
75Part III – Best Practices

Q & APlease complete your evaluations to enter in the prize drawing!


