+ All Categories
Home > Documents > About the Consortium Contextual Factors 5 15 1 23% VS ... Infographic Final.pdfHigh schools...

About the Consortium Contextual Factors 5 15 1 23% VS ... Infographic Final.pdfHigh schools...

Date post: 30-Mar-2018
Category:
Upload: ngocong
View: 213 times
Download: 0 times
Share this document with a friend
2
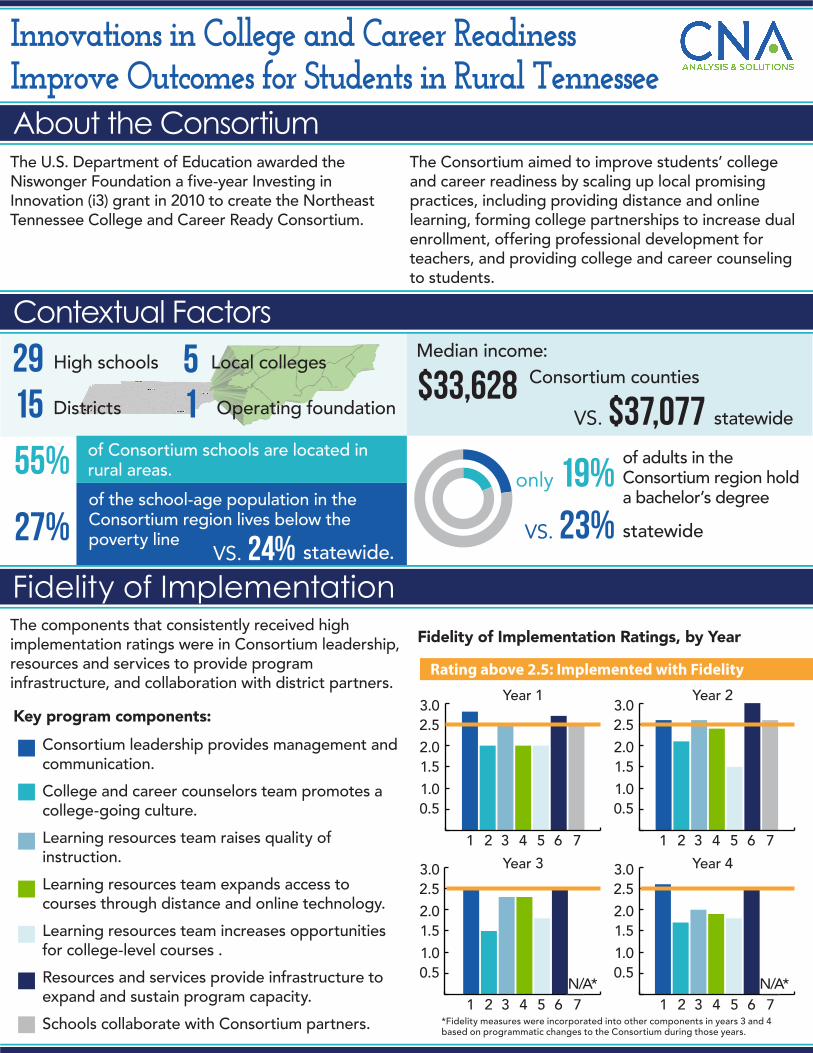
High schools Districts 29 15 Operating foundation 1 Local colleges 5 55% 27% VS. 24% only 19% VS. 23% of Consortium schools are located in rural areas. statewide. of the school-age population in the Consortium region lives below the poverty line Consortium counties Median income: $33,628 statewide VS. $37,077 of adults in the Consortium region hold a bachelor’s degree statewide Innovations in College and Career Readiness Improve Outcomes for Students in Rural Tennessee About the Consortium Contextual Factors The U.S. Department of Education awarded the Niswonger Foundation a five-year Investing in Innovation (i3) grant in 2010 to create the Northeast Tennessee College and Career Ready Consortium. The Consortium aimed to improve students’ college and career readiness by scaling up local promising practices, including providing distance and online learning, forming college partnerships to increase dual enrollment, offering professional development for teachers, and providing college and career counseling to students. The components that consistently received high implementation ratings were in Consortium leadership, resources and services to provide program infrastructure, and collaboration with district partners. Year 1 Year 2 Year 3 Year 4 123456 7 Consortium leadership provides management and communication. College and career counselors team promotes a college-going culture. Learning resources team raises quality of instruction. Learning resources team expands access to courses through distance and online technology. Learning resources team increases opportunities for college-level courses . Resources and services provide infrastructure to expand and sustain program capacity. Schools collaborate with Consortium partners. Key program components: Rating above 2.5: Implemented with Fidelity 123456 7 123456 7 N/A* N/A* 123456 7 Fidelity of Implementation Ratings, by Year 3.0 2.0 1.0 2.5 1.5 0.5 3.0 2.0 1.0 2.5 1.5 0.5 3.0 2.0 1.0 2.5 1.5 0.5 3.0 2.0 1.0 2.5 1.5 0.5 Fidelity of Implementation *Fidelity measures were incorporated into other components in years 3 and 4 based on programmatic changes to the Consortium during those years.
Transcript

High schools

Districts

2915 Operating foundation1

Local colleges5

55%

27%VS. 24%

only 19%VS. 23%

of Consortium schools are located in rural areas.

statewide.

of the school-age population in the Consortium region lives below the poverty line

Consortium countiesMedian income:

$33,628 statewideVS. $37,077

of adults in the Consortium region hold a bachelor’s degreestatewide

Innovations in College and Career Readiness Improve Outcomes for Students in Rural TennesseeAbout the Consortium

Contextual Factors

The U.S. Department of Education awarded the Niswonger Foundation a five-year Investing in Innovation (i3) grant in 2010 to create the Northeast Tennessee College and Career Ready Consortium.

The Consortium aimed to improve students’ college and career readiness by scaling up local promising practices, including providing distance and online learning, forming college partnerships to increase dual enrollment, offering professional development for teachers, and providing college and career counseling to students.

The components that consistently received high implementation ratings were in Consortium leadership, resources and services to provide program infrastructure, and collaboration with district partners.

Year 1 Year 2

Year 3 Year 41 2 3 4 5 6 7

Consortium leadership provides management and communication. College and career counselors team promotes a college-going culture.Learning resources team raises quality of instruction.Learning resources team expands access to courses through distance and online technology. Learning resources team increases opportunities for college-level courses .Resources and services provide infrastructure to expand and sustain program capacity.Schools collaborate with Consortium partners.

Key program components:

Rating above 2.5: Implemented with Fidelity

1 2 3 4 5 6 7

1 2 3 4 5 6 7N/A* N/A*

1 2 3 4 5 6 7

Fidelity of Implementation Ratings, by Year

3.0

2.0

1.0

2.5

1.5

0.5

3.0

2.0

1.0

2.5

1.5

0.5

3.0

2.0

1.0

2.5

1.5

0.5

3.0

2.0

1.0

2.5

1.5

0.5

Fidelity of Implementation

*Fidelity measures were incorporated into other components in years 3 and 4 based on programmatic changes to the Consortium during those years.

2030

5060

40

100

Consortium’s Impact on Student OutcomesCNA Education examined the Consortium’s impact on student outcomes after up to four full years of exposure to the intervention. We compared each participating school with a matched Tennessee non-Consortium school with similar characteristics.

www.cna.org/centers/ipr/education/bringing@CNAEducationResearch

@[email protected]

We found that the Niswonger Foundation i3 grant has statistically significant effects on: • College readiness (after 3 years of exposure). • AP participation (after 2, 3, and 4 years of exposure).• AP performance (after 3 and 4 years of exposure).• College enrollment (after 3 years of exposure).• College persistence (after 2 and 3 years of exposure).

Consortium SchoolsComparison Schools

2 yearsexposure

22.8%25.6%

21.5%27.8%

21.9%26.4%

3 yearsexposure

4 yearsexposure

AP ParticipationProbability of enrolling in an AP

course

2 yearsexposure

3 yearsexposure

4 yearsexposure

Probability of enrolling in collegeCollege Enrollment

Innovations in College and Career Readiness Improve Outcomes for Students in Rural Tennessee

19.5 19.5 19.6 19.9 19.7 19.7

2 yearsexposure

Composite ACT Scores

3 yearsexposure

4 yearsexposure

College Readiness

20

15

10

5

0

2030

5060

40

100

2030

5060

40

100 2 years

exposure3 years

exposure4 years

exposure

Probability of earning an AP exam score of 3 or higher

AP Performance

8.7% 9.6% 8.8% 10.3% 8.7% 11.1%

56.3%58.6%

54.3%57.7% 60.6%64.6%

2 yearsexposure

3 yearsexposure

Probability of persisting in college for two consecutive fall semesters

College Persistence

2030

5060

40

100

39.5%42.5%37.9%40.6%


Recommended