46


i
About the Guest Editors
Dr. Kouichi Sakurai
Full Professor, Department of Informatics,
Kyushu University, Japan
Dr. Lopa Mandal
Professor, Department of Information Technology,
Institute of Engineering & Management, Kolkata, India
Dr. Baisakhi Das
Associate Professor, Department of Information Technology,
Institute of Engineering & Management, Kolkata, India
ii
Preface
In the era of fourth industrial revolution or Industry 4.0, Computational Intelligence, Data Science and
smart Information and Communication technology (ICT) are gaining huge importance in our society.
Governments around the world started relying heavily on information and communication technologies
to build smart and hyper-connected infrastructures that allow cities to provide better services to people
and reduce energy consumption, as the global urban population is growing substantially. These
intelligent technologies allow cities to introduce new ways of monitoring the atmosphere, buildings,
street lighting, traffic, crowds, crime, etc.
In building a smarter and more intelligent city around the world, Computational intelligence and ICT
are the underlying technologies; but if not wisely applied, ICT can be a major environmental problem.
At present, about 2 percent of global greenhouse gas (GHG) emissions are accounted for by the global
ICT industry. This footprint is expected to increase dramatically to about 14 percent by 2040, according
to a recent report. Intelligent use of advances in ICT will assist in minimizing GHG while still achieving
its goals. ICT is theoretically able to reduce the carbon footprint in other fields by a factor of 10, based
on the Global e-Sustainability Initiative (GeSI) report. ICT technologies such as Green ICT, the Internet
of Things (IoT) and Artificial Intelligence (AI) can play important roles, not just in making our
environment smarter, but also greener and more sustainable.
To address this need of the hour, International Conference on Computational Intelligence, Data Science
and Cloud Computing (IEM-ICDC) 2020, was organized by Department of Information Technology,
Institute of Engineering & Management, Kolkata, India, during September 25-27, 2020. The three-day
online event was graced by eminent speakers and researchers from academia and industry from all over
the world, working in the field of Computational Intelligence, Data science, Cloud Computing, IoT,
Blockchain and recent trends in ICT.
8 papers from the tracks “Computational Intelligence” and “ICT” of the conference IEM-ICDC 2020
has been selected for publication in this conference special issue of American Journal of Advanced
Computing named as "Computational Intelligence and Smart Information and Communication
Technology”.
American Journal of Advanced Computing: International Conference on Computational Intelligence,
Data Science and Cloud Computing (IEM-ICDC) 2020 Special Issue on "Computational Intelligence
and Smart Information and Communication Technology" aims to bring together researchers and
practitioners in the fields of Smart Cities, Renewable Information and Communication Technology,
Artificial Intelligence, Innovation, and Energy-Aware Systems involved in smart ICT developments
and applications. We hope that this will be helpful and be a motivating force for future research in the
practical designs of cutting-edge systems in related fields.
Kyushu University, Japan Dr. Kouichi Sakurai
Institute of Engineering & Management, Kolkata, India Dr. Lopa Mandal
Institute of Engineering & Management, Kolkata, India Dr. Baisakhi Das

iii
Content Page No.
An empirical study on fall-detection using K-means based training data
subset selection Jothi R
1
Study of Security and Privacy Challenges and their solutions in IoT data Nidhi Malik, Saksham Jain and Leena Singh
6
Computer Vision Based Pre-Processing System for Autonomous Vehicles Tarun Tiwari and Aparajita Nandi
12
Rapid Measurement of Physical Quality of Dry Chili – A Machine Vision
Approach Tamal Dey, Gopinath Bej, Abhra Pal, Amitava Akuli, Sabyasachi Majumdar,
Tapas Sutradhar, Rishin Banerjee, Nabarun Bhattacharyya
18
Mobile Application Development for West Bengal Tourism Moumita Naskar and Matangini Chattopadhyay
24
A Review on SQL Injection Attack in Internet of Things Sarwath Unnisa and Vijayalakshmi A
29
Classifying Infected and Uninfected Red Blood Cell Images
for Malaria Detection using Convolutional Neural Networks Sweta Agarwal, Bishal Chettri, Anshu Das, Nitin Sandilya and Udit Chakraborty
34
Prime Generation: Algorithms and Analyses Shreya Guha
39

An empirical study on fall-detection using K-means
based training data subset selection
R. Jothi
School of Computer Science and Engineering Vellore Institute of Technology,
Chennai, Tamilnadu, India .
Abstract—Falls in elderly people are a significant cause for
injury. Effective prevention strategies are therefore helpful in
addressing this problem. A number of machine learning
approaches have been proposed for identification of near fall
situations, thus by preventing fall related injuries. However,
many of the existing algorithms are supervised and require
long training time, especially on large datasets. This paper
investigates training data subset selection using a well-known
unsupervised algorithm K-means clustering. The effect of
cascading the priori information obtained from K-means is
evaluated using three supervised algorithms namely K-nearest
neighbor, Decision-Tree and Random forest. Experimental
results illustrate that computational time is reduced
significantly and the fall recognition rate is preserved on the
reduced training dataset.
Keywords—Fall detection, K-means, Training data subset
selection, Activity recognition
I. INTRODUCTION
Human falls are becoming common health issue in elderly people. Falls result in injury and thus impacts one’s health and productive life cycle. According to the World Health Organization [1], approximately each year around 37.3 million falls occur and the majority of fall victims are people aged 65 and above. The increase in fall-rate each year postulate effective prevention strategies that emphasize on education, training and safer environments for reducing fall related risks. In this context, fall detecting devices are commonly utilized by healthcare professional. These assistive devices alert when a fall event occurs so that necessary assistance can be given immediately [2].
Machine learning algorithms have been widely employed for fall detection [2, 3]. Most of these algorithms regard fall detection as an activity recognition problem which classifies the input features into one of the activities such as walking, standing, sitting, running and falling, etc. Here, the set of activities constitute class labels and the signals received from various sources like accelerator, magnetometer, etc., form feature vectors of the classification problem.
Traditional machine learning algorithms such as K-nearest neighbour [3], Hidden Markov Model [4], Multi-layer perceptron [5] and Support Vector Machine [6, 7] are used for wearable fall-detection. T. Zhang et al. [6] proposed a fall-detection system which extracts temporal and magnitude features from accelerometer signals and then classifies them as normal or abnormal (fall) activity using one-class Support vector machine. Cheng et al. [4] proposed a framework for daily activity monitoring and fall-detection using surface electromyography (SEMG) and accelerometer signals. The framework first segments the activities into static and dynamic types using Decision-Tree algorithm based on SEMG and accelerometer signals. The dynamic
activities are further recognized as normal transition or fall activities using Hidden Markov Model (HMM) based on accelerometer amplitude threshold.
Other classification algorithms such as neural networks have also been studied for fall-detection [8]. Neural networks are a kind of machine learning models where a set of neurons connected to each other and perform some task by analysing training examples. Typically the neurons are arranged in sequential layers where output of a layer i is connected (feed-forwarded) as input to the subsequent layer i + 1. On receiving certain input, each neuron is triggered based on activation function. Multi-layer perceptron (MLP) is a type of feed-forward neural network which uses back-propogation for training the network. MLP finds its uses in various scientific applications including fall-detection. One of the studies on fall-detection reported that MLP has shown good performance as compared to other algorithms namely Naive Bayes, Decision tree, Support Vector Machine, ZeroR and OneR [8].
Most of the fall-detection algorithms are based on supervised-learning and their long training time pose computational limitations for large datasets [4]. S.Zhang et al. [9] have proposed an efficient K-NN algorithm using preliminary partitions obtained using K-means algorithm. Given dataset is divided into a number of clusters using K-means and K-NN algorithm is applied on each of these clusters separately. Experimental analysis on medical image data report that their proposed K-NN algorithm have shown improved accuracy and efficiency.
This paper investigates the effectiveness of employing K-means algorithm for reducing cost of training in three supervised learning algorithms namely K-NN, Decision-Tree and Random forest. For experimental purpose, Kaggle fall-detection dataset is considered. Results indicate that cascading of K-means significantly reduces time taken for training the fall-detection algorithms.
Rest of the paper is organized as follows. Section II briefly explains related algorithms and Section III describes proposed methodology. Section IV presents details of the dataset and the experimental analysis. Finally, results are concluded in Section V.
II. RELATED METHODS
A. K-Nearest Neighbour Classifier
K-nearest Neighbour (K-NN) algorithm classifies a data instance based on the number of closest training instances in a given dataset. Given a data instance xi, K-NN first computes distance of xi with every other data instances and choose top-K neighbours and classifies xi based on majority voting from the K neighbours. Here, the number of neighbours K is user-defined parameter, and choice of K
ISSN No. (Online) - 2368-1209 ISSN No. (Print) - 2691-5944
American Journal of Advanced Computing IEM-ICDC 2020 Special Issue on "Computational Intelligence and Smart Information and Communication Technology" January 2021, Volume 1, Issue 1
1

impacts the classification results [6]. Fig. 1 illustrates how K-NN algorithm classifies a test point based on 3 nearest neighbours.
Fig. 1. K-NN Algorithm K=3 The test point represented by star symbol will
be assigned to the class as that of points represented by circle as it is having
3 nearest neighbors from circle class.
B. Decision-Tree and Random-Forest Algorithms
Decision-tree classifier is another popular
classification algorithm which is based on a tree-structure.
The internal nodes in the tree represent test on an attribute
and branches originating from that node represent each
possible value that the attribute may take. Leaf nodes in the
tree nodes represent the class label. The path from root to the
leaf nodes indicate the classification rules. Given a dataset D,
the tree is constructed using attributes in D. The choice of
attributes for branching are depends on their discriminating
nature, which is computed using information gain (IG).
Suppose an attribute Ai of the dataset D has m possible
values {v1,v2, . . . , vm}. Let H(Ai) denote entropy before
branching on an attribute Ai and H'(Ai) denote entropy after
branching on Ai. Then IG of Ai is computed as follows [10].
𝐼𝐺(𝐷, 𝐴𝑖) = 𝐻( 𝐴𝑖) − 𝐻′( 𝐴𝑖)
Here, entropy is a measure of degree of homogeneity of
samples in a node in the tree. Entropy is calculated as -pj
logpj, where pj is probability that the attribute Ai will have
value vj . If all the samples in a node are homogeneous, i.e.,
belong to same class then, entropy is less and vice versa.
Generally an attribute that attains more reduction in entropy
leads to higher information gain and thus preferred over all
other attributes for forming branching condition on the
node. Information gain is computed for all the attributes and
the attribute having highest IG value is chosen as next
splitting attribute. The splitting continues once all the
attributes have been used for branching or all the samples in
a node belong to same class label. Fig. 2 illustrates an
example of decision tree for a binary classification problem
having three attributes namely A1, A2 and A3. Assuming A1
attribute has highest information gain, A1 becomes root node
of the tree. Suppose if a test sample has < High, yes, 4 >.
Then it will be classified as class-A using the rules depicted
in the tree of Fig. 2.
Random forest is a variant of decision-tree algorithm.
While decision-tree algorithm builds the tree using the entire
set of samples and features in the dataset, random-forest
algorithm constructs multiple trees based on random subset
of samples and features. Class decision of a test sample is
finally based on the output of all the subtrees.
Fig. 2. Decision Tree Algorithm for a binary classification with three attributes A1, A2 and A3.
(a)
(b)
Fig. 3: K-means clustering: (a) An example 2-dimensional dataset. (b) Clusters obtained using K-means algorithm.
C. K-means Clustering Algorithm
K-means is one of the popular unsupervised learning
algorithms used for cluster analysis. K-means works on the
principle of partitioning a given set of points to k clusters C1,
C2 …. Ck such that sum of squared error (SSE) is minimized.
The SSE is computed as follows. 𝑆𝑆𝐸 = ∑ ∑‖𝑥𝑗 − 𝜇𝑖‖ (2)𝑛𝑗=1
𝑘𝑖=1
where n is the number of points in cluster Ci and µ i is the
center of cluster Ci. Getting local minimum of the objective
function SSE is NP-hard problem. The complete steps of the
algorithm is explained in Algorithm 1 [10].
Algorithm 1: K-means Algorithm
Input: Dataset D, number of clusters k. Output: k clusters. 1. Randomly choose k points from D as centers of k clusters
C1, C2, . . . Ck.
2. Assign each point xi to its nearest cluster.
3. Recompute the new cluster centers.
4. Repeat steps 2 and 3 until there is no change in
reassignment of points.
As K-means clustering chooses initial partitioning based on random centers, resulting clusters may not be stable due to the local optima. To address this issue, several initial seed selection methods have been proposed in the literature. This paper adapts deterministic initialization approach presented
ISSN No. (Online) - 2368-1209 ISSN No. (Print) - 2691-5944
American Journal of Advanced Computing IEM-ICDC 2020 Special Issue on "Computational Intelligence and Smart Information and Communication Technology" January 2021, Volume 1, Issue 1
2
in [11]. Fig. 3 illustrates clustering of a dataset using K-means clustering.
III. PROPOSED METHODOLOGY
Once the given dataset is partitioned into k clusters, top p neighbours of each of these cluster centers are chosen. Let us call these points as core points. The number of core points p is studied empirically and discussed in Section 4.2. If each core point agrees with its corresponding activity class label in the given dataset D, it will be considered for training subset D'. Algorithm 2 explains the proposed algorithm.
Algorithm 2: Proposed Algorithm
Input: Dataset D. Output: Training subset D'.
1. Set number of clusters k as the number of classes in the fall-
detection dataset. For the current study, number classes is 6.
2. Get a set of clusters C1 , C2 . . ., C6 using K-means algorithm.
3. Initialize the number of core points p to be chosen from each
cluster, where n is size of the cluster under consideration.
4. Initialize D' = { ϕ}.
5. For each clusters Ci, choose top p nearest neighbours to its
cluster center µ i ; Let us call these points as core points.
6. For each core point xj ∈ Ci
6.1 If both xj and µ i belong to the same activity class in
the given dataset D, then add these points to D'. 6.2 Else ignore this core point.
7. Return D'.
IV. EXPERIMENTAL ANALYSIS
A. Dataset
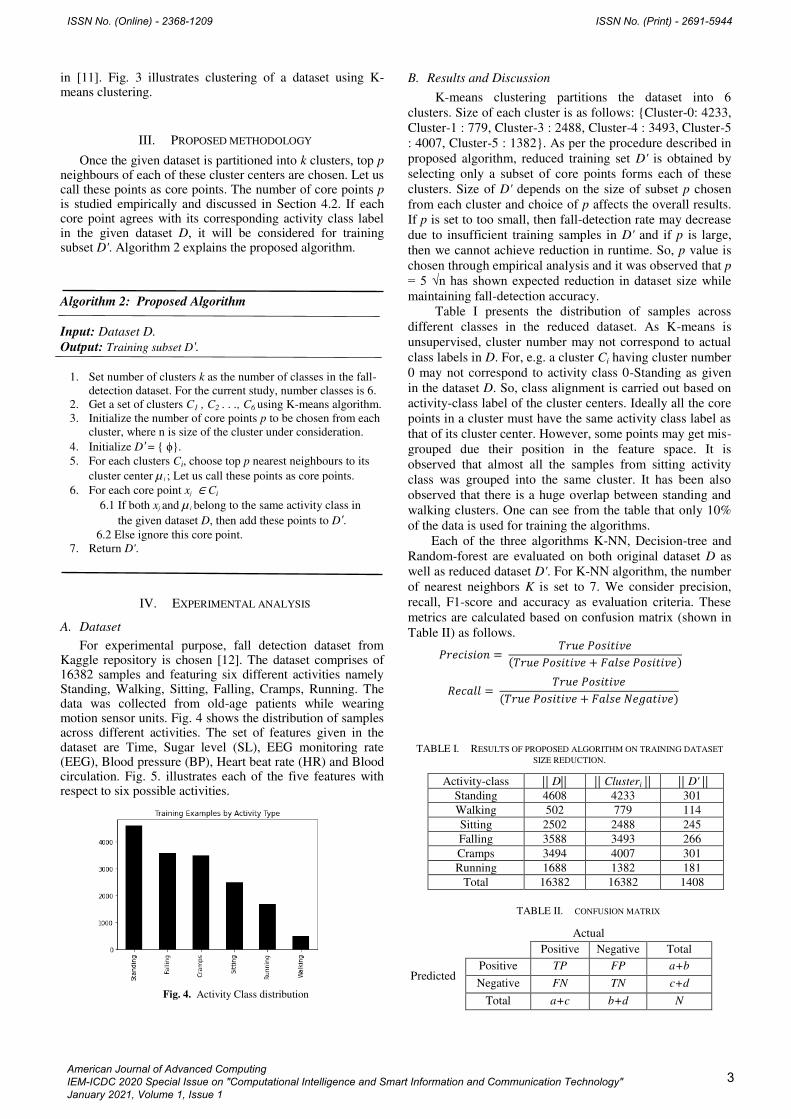
For experimental purpose, fall detection dataset from Kaggle repository is chosen [12]. The dataset comprises of 16382 samples and featuring six different activities namely Standing, Walking, Sitting, Falling, Cramps, Running. The data was collected from old-age patients while wearing motion sensor units. Fig. 4 shows the distribution of samples across different activities. The set of features given in the dataset are Time, Sugar level (SL), EEG monitoring rate (EEG), Blood pressure (BP), Heart beat rate (HR) and Blood circulation. Fig. 5. illustrates each of the five features with respect to six possible activities.
Fig. 4. Activity Class distribution
B. Results and Discussion
K-means clustering partitions the dataset into 6
clusters. Size of each cluster is as follows: {Cluster-0: 4233,
Cluster-1 : 779, Cluster-3 : 2488, Cluster-4 : 3493, Cluster-5
: 4007, Cluster-5 : 1382}. As per the procedure described in
proposed algorithm, reduced training set D' is obtained by
selecting only a subset of core points forms each of these
clusters. Size of D' depends on the size of subset p chosen
from each cluster and choice of p affects the overall results.
If p is set to too small, then fall-detection rate may decrease
due to insufficient training samples in D' and if p is large,
then we cannot achieve reduction in runtime. So, p value is
chosen through empirical analysis and it was observed that p
= 5 √n has shown expected reduction in dataset size while
maintaining fall-detection accuracy.
Table I presents the distribution of samples across
different classes in the reduced dataset. As K-means is
unsupervised, cluster number may not correspond to actual
class labels in D. For, e.g. a cluster Ci having cluster number
0 may not correspond to activity class 0-Standing as given
in the dataset D. So, class alignment is carried out based on
activity-class label of the cluster centers. Ideally all the core
points in a cluster must have the same activity class label as
that of its cluster center. However, some points may get mis-
grouped due their position in the feature space. It is
observed that almost all the samples from sitting activity
class was grouped into the same cluster. It has been also
observed that there is a huge overlap between standing and
walking clusters. One can see from the table that only 10%
of the data is used for training the algorithms.
Each of the three algorithms K-NN, Decision-tree and
Random-forest are evaluated on both original dataset D as
well as reduced dataset D'. For K-NN algorithm, the number
of nearest neighbors K is set to 7. We consider precision,
recall, F1-score and accuracy as evaluation criteria. These
metrics are calculated based on confusion matrix (shown in
Table II) as follows. 𝑃𝑟𝑒𝑐𝑖𝑠𝑖𝑜𝑛 = 𝑇𝑟𝑢𝑒 𝑃𝑜𝑠𝑖𝑡𝑖𝑣𝑒(𝑇𝑟𝑢𝑒 𝑃𝑜𝑠𝑖𝑡𝑖𝑣𝑒 + 𝐹𝑎𝑙𝑠𝑒 𝑃𝑜𝑠𝑖𝑡𝑖𝑣𝑒) 𝑅𝑒𝑐𝑎𝑙𝑙 = 𝑇𝑟𝑢𝑒 𝑃𝑜𝑠𝑖𝑡𝑖𝑣𝑒(𝑇𝑟𝑢𝑒 𝑃𝑜𝑠𝑖𝑡𝑖𝑣𝑒 + 𝐹𝑎𝑙𝑠𝑒 𝑁𝑒𝑔𝑎𝑡𝑖𝑣𝑒)
TABLE I. RESULTS OF PROPOSED ALGORITHM ON TRAINING DATASET
SIZE REDUCTION.
Activity-class || D|| || Clusteri || || D' || Standing 4608 4233 301
Walking 502 779 114
Sitting 2502 2488 245
Falling 3588 3493 266
Cramps 3494 4007 301
Running 1688 1382 181
Total 16382 16382 1408
TABLE II. CONFUSION MATRIX
Actual
Positive Negative Total
Predicted Positive TP FP a+b
Negative FN TN c+d
Total a+c b+d N
ISSN No. (Online) - 2368-1209 ISSN No. (Print) - 2691-5944
American Journal of Advanced Computing IEM-ICDC 2020 Special Issue on "Computational Intelligence and Smart Information and Communication Technology" January 2021, Volume 1, Issue 1
3
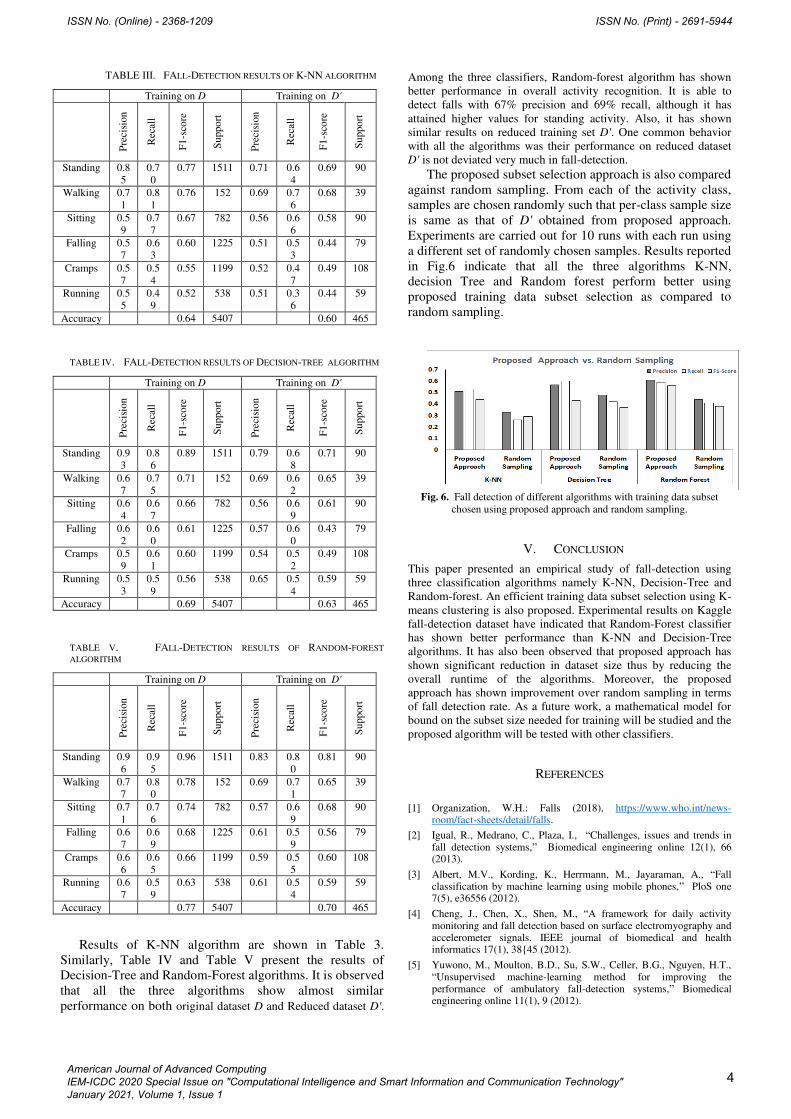
TABLE III. FALL-DETECTION RESULTS OF K-NN ALGORITHM
Training on D Training on D'
Pre
cisi
on
Rec
all
F1
-sco
re
Su
ppo
rt
Pre
cisi
on
Rec
all
F1
-sco
re
Su
ppo
rt
Standing 0.8
5
0.7
0
0.77 1511 0.71 0.6
4
0.69 90
Walking 0.7
1
0.8
1
0.76 152
0.69 0.7
6
0.68 39
Sitting 0.5
9
0.7
7
0.67 782 0.56 0.6
6
0.58 90
Falling 0.5
7
0.6
3
0.60 1225 0.51 0.5
3
0.44 79
Cramps 0.5
7
0.5
4
0.55 1199 0.52 0.4
7
0.49 108
Running 0.5
5
0.4
9
0.52 538 0.51 0.3
6
0.44 59
Accuracy 0.64 5407 0.60 465
TABLE IV. FALL-DETECTION RESULTS OF DECISION-TREE ALGORITHM
Training on D Training on D'
Pre
cisi
on
Rec
all
F1
-sco
re
Su
ppo
rt
Pre
cisi
on
Rec
all
F1
-sco
re
Su
ppo
rt
Standing 0.9
3
0.8
6
0.89 1511 0.79 0.6
8
0.71 90
Walking 0.6
7
0.7
5
0.71 152 0.69 0.6
2
0.65 39
Sitting 0.6
4
0.6
7
0.66 782 0.56 0.6
9
0.61 90
Falling 0.6
2
0.6
0
0.61 1225 0.57 0.6
0
0.43 79
Cramps 0.5
9
0.6
1
0.60 1199 0.54 0.5
2
0.49 108
Running 0.5
3
0.5
9
0.56 538 0.65 0.5
4
0.59 59
Accuracy 0.69 5407 0.63 465
TABLE V. FALL-DETECTION RESULTS OF RANDOM-FOREST
ALGORITHM
Training on D Training on D'
Pre
cisi
on
Rec
all
F1
-sco
re
Su
ppo
rt
Pre
cisi
on
Rec
all
F1
-sco
re
Su
ppo
rt
Standing 0.9
6
0.9
5
0.96 1511 0.83 0.8
0
0.81 90
Walking 0.7
7
0.8
0
0.78 152 0.69 0.7
1
0.65 39
Sitting 0.7
1
0.7
6
0.74 782 0.57 0.6
9
0.68 90
Falling 0.6
7
0.6
9
0.68 1225 0.61 0.5
9
0.56 79
Cramps 0.6
6
0.6
5
0.66 1199 0.59 0.5
5
0.60 108
Running 0.6
7
0.5
9
0.63 538 0.61 0.5
4
0.59 59
Accuracy 0.77 5407 0.70 465
Results of K-NN algorithm are shown in Table 3.
Similarly, Table IV and Table V present the results of
Decision-Tree and Random-Forest algorithms. It is observed
that all the three algorithms show almost similar
performance on both original dataset D and Reduced dataset D'.
Among the three classifiers, Random-forest algorithm has shown
better performance in overall activity recognition. It is able to
detect falls with 67% precision and 69% recall, although it has
attained higher values for standing activity. Also, it has shown
similar results on reduced training set D'. One common behavior
with all the algorithms was their performance on reduced dataset
D' is not deviated very much in fall-detection.
The proposed subset selection approach is also compared
against random sampling. From each of the activity class,
samples are chosen randomly such that per-class sample size
is same as that of D' obtained from proposed approach.
Experiments are carried out for 10 runs with each run using
a different set of randomly chosen samples. Results reported
in Fig.6 indicate that all the three algorithms K-NN,
decision Tree and Random forest perform better using
proposed training data subset selection as compared to
random sampling.
Fig. 6. Fall detection of different algorithms with training data subset
chosen using proposed approach and random sampling.
V. CONCLUSION
This paper presented an empirical study of fall-detection using
three classification algorithms namely K-NN, Decision-Tree and
Random-forest. An efficient training data subset selection using K-
means clustering is also proposed. Experimental results on Kaggle
fall-detection dataset have indicated that Random-Forest classifier
has shown better performance than K-NN and Decision-Tree
algorithms. It has also been observed that proposed approach has
shown significant reduction in dataset size thus by reducing the
overall runtime of the algorithms. Moreover, the proposed
approach has shown improvement over random sampling in terms
of fall detection rate. As a future work, a mathematical model for
bound on the subset size needed for training will be studied and the
proposed algorithm will be tested with other classifiers.
REFERENCES
[1] Organization, W.H.: Falls (2018), https://www.who.int/news-
room/fact-sheets/detail/falls.
[2] Igual, R., Medrano, C., Plaza, I., “Challenges, issues and trends in fall detection systems,” Biomedical engineering online 12(1), 66 (2013).
[3] Albert, M.V., Kording, K., Herrmann, M., Jayaraman, A., “Fall classification by machine learning using mobile phones,” PloS one 7(5), e36556 (2012).
[4] Cheng, J., Chen, X., Shen, M., “A framework for daily activity monitoring and fall detection based on surface electromyography and accelerometer signals. IEEE journal of biomedical and health informatics 17(1), 38{45 (2012).
[5] Yuwono, M., Moulton, B.D., Su, S.W., Celler, B.G., Nguyen, H.T., “Unsupervised machine-learning method for improving the performance of ambulatory fall-detection systems,” Biomedical engineering online 11(1), 9 (2012).
ISSN No. (Online) - 2368-1209 ISSN No. (Print) - 2691-5944
American Journal of Advanced Computing IEM-ICDC 2020 Special Issue on "Computational Intelligence and Smart Information and Communication Technology" January 2021, Volume 1, Issue 1
4

[6] Zhang, T., Wang, J., Xu, L., Liu, P., “Fall detection by wearable sensor and one-class svm algorithm,” In: Intelligent computing in signal processing and pattern recognition, pp. 858{863. Springer (2006).
[7] Shibuya, N., Nukala, B.T., Rodriguez, A.I., Tsay, J., Nguyen, T.Q., Zupancic, S., Lie, D.Y.C., “A real-time fall detection system using a wearable gait analysis sensor and a support vector machine (svm) classifier,” In: 2015 Eighth International Conference on Mobile Computing and Ubiquitous Networking (ICMU). pp. 66{67 (2015).
[8] Casilari, E., Lora-Rivera, R., Garcia-Lagos, F., “A wearable fall detection system using deep learning,” In: International Conference on Industrial, Engineering and Other Applications of Applied Intelligent Systems. pp. 445{456. Springer (2019).
[9] Deng, Z., Zhu, X., Cheng, D., Zong, M., Zhang, S., “ Efficient knn classification algorithm for big data,” Neurocomputing 195, 143{148 (2016).
[10] Han, J., Pei, J., Kamber, M., “Data mining: concepts and techniques,” Elsevier (2011).
[11] Jothi, R., Mohanty, S.K., Ojha, A., “On careful selection of initial centers for k-means algorithm,” In: Proceedings of 3rd International Conference on Advanced Computing, Networking and Informatics. pp. 435{445. Springer (2016).
[12] http://www.kaggle.com/alexanderguentert/falldetection/
(a)
(b)
(c)
(d)
(e)
Fig.5. Distribution of features across various activities. (a) Sugar level (SL), (b) EEG monitoring rate (c) (EEG), Blood pressure (BP), (d) Heart beat rate
(HR) and (e) Blood circulation
ISSN No. (Online) - 2368-1209 ISSN No. (Print) - 2691-5944
American Journal of Advanced Computing IEM-ICDC 2020 Special Issue on "Computational Intelligence and Smart Information and Communication Technology" January 2021, Volume 1, Issue 1
5

Study of Security and Privacy Challenges and their
solutions in IoT data
Nidhi Malik
Member
ACM
Delhi, India
Saksham Jain
Amity School of Engineering and
Technology
Delhi, India
https://orcid.org/0000-0002-0612-2805
Leena Singh
Amity School of Engineering and
Technology
Delhi, India
Abstract—Internet of Things is the focus of attention these
days. It is an interconnection of devices ranging from
computers to sensors to mechanical machines and practically
any object. Various IoT applications are developed to automate
tasks in the field of engineering, environment, agriculture,
health sector and other sections of society. This empowerment
also presents many challenges that are to be handled in order
to use technology advancements. Since communication between
devices using different platforms happen at all levels, it
becomes very important to secure this data. Huge amount of
data is generated when devices communicate, so this data
needs to be secured. Security and privacy of data has been very
important since the invention of networks and IoT also has
many risks associated with respect to security and privacy of
data. This paper is intended to provide the reader an
understanding of IoT, its use cases, working architecture and
its security threats. The paper gives details about basic security
techniques as well as the latest block chain technology to secure
data.
Keywords—IoT, Security, Privacy, Cryptography, Block
chain
I. INTRODUCTION
Internet of Things (IoT) is an interconnection of devices ranging from digital devices, mechanical machines, things, objects and individuals. Each device has its unique identification assigned to it and they can transmit data over the network [1]. This communication need not require any collaboration between human beings and machines. The term “Internet of Things” was first introduced in 1982 by Kevin Ashton. Fig.1 below shows the evolution of IoT over the years. We can easily observe in our day-to-day life, concept of smart home seemed to be fictional. But it has become a reality now. Smartphones have changed life of all of us. Now, smartphones are AI enabled and have great processing speeds. We see many devices today which perform tasks in synchronized manner with other devices and can be monitored and controlled by us. There seem to be endless possibilities that the evolution of IoT is providing us.
A thing in Internet of things (IoT) can be any device which has capability of computing, has some way to be uniquely identified and can transmit data over the network. These devices have sensors built in them using which they sense the environment, collect data and transfer it over the network. Internet of things gained popularity around the years 2007-2008 and a brief overview of IoT is shown in fig 1. As number of devices are connected over the network, several network characteristics such as how much memory is to be used, how much power could be consumed, how many devices can be handled and robustness of the network are to be taken care of.
Fig. 1 Evolution of Internet of Things [23]
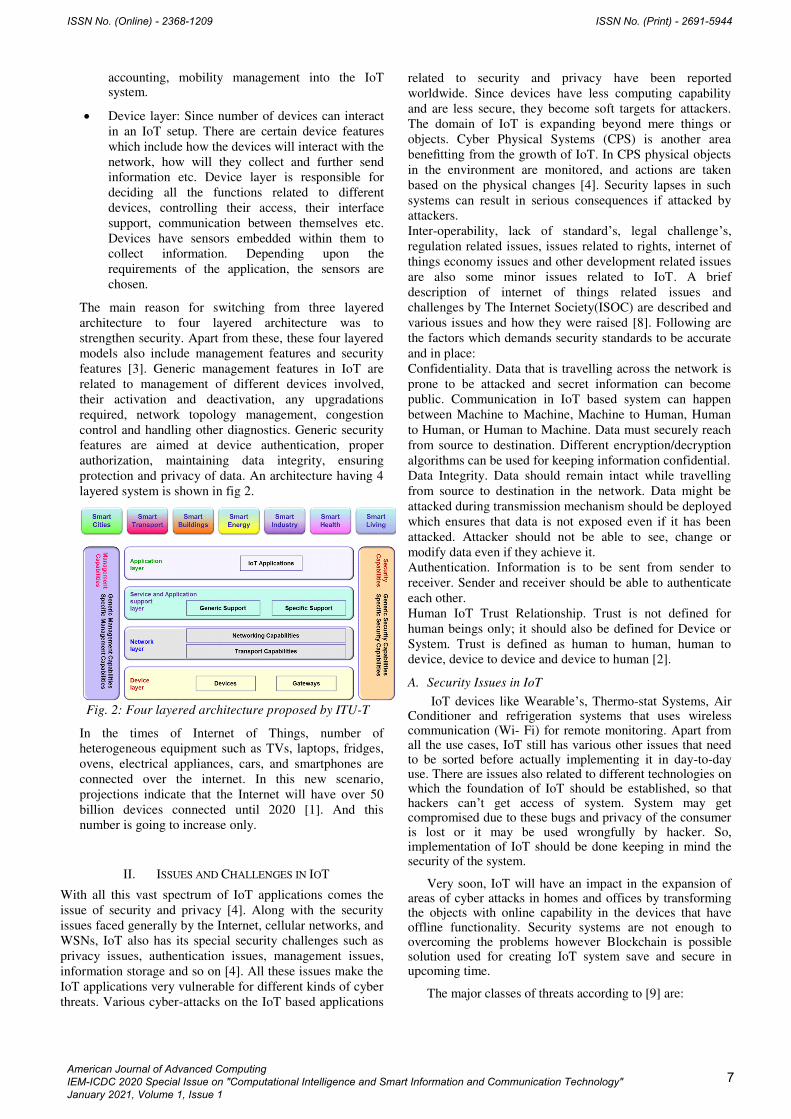
Architecture of IoT:
Initially three-layer architecture of IoT was proposed which was the most basic architecture. With continuous development in the field, this architecture could not fulfill all the requirements of IoT. So, ITU-T (Telecommunication Standardization Sector) proposed a model comprising of four layers [11] as shown in fig. 1. The layers have following responsibilities:
Application layer: This layer is the interface between the end IoT devices and the network. It defines various applications which are using IoT mechanism. For example, we are dealing with any health monitoring or smart home kind of system then job of this layer is to provide services to customers. It also determines set of protocols to be used for passing messages at the application level.
Application support layer: This layer was introduced in the architecture to overcome the security flaws encountered in three-layer architecture. It is responsible for both application specific support and generic support. There are certain requirements which are specific to an application and certain others which impact most of the tasks over the network such as processing capacity, storage related requirements and maintenance [3].
Network layer: This layer is also called as transmission layer. Transmission can be either wired or non-wired. This layer performs the job of controlling network connectivity by performing certain functions which include authentication,
ISSN No. (Online) - 2368-1209 ISSN No. (Print) - 2691-5944
American Journal of Advanced Computing IEM-ICDC 2020 Special Issue on "Computational Intelligence and Smart Information and Communication Technology" January 2021, Volume 1, Issue 1
6
accounting, mobility management into the IoT system.
Device layer: Since number of devices can interact
in an IoT setup. There are certain device features
which include how the devices will interact with the
network, how will they collect and further send
information etc. Device layer is responsible for
deciding all the functions related to different
devices, controlling their access, their interface
support, communication between themselves etc.
Devices have sensors embedded within them to
collect information. Depending upon the
requirements of the application, the sensors are
chosen.
The main reason for switching from three layered
architecture to four layered architecture was to
strengthen security. Apart from these, these four layered
models also include management features and security
features [3]. Generic management features in IoT are
related to management of different devices involved,
their activation and deactivation, any upgradations
required, network topology management, congestion
control and handling other diagnostics. Generic security
features are aimed at device authentication, proper
authorization, maintaining data integrity, ensuring
protection and privacy of data. An architecture having 4
layered system is shown in fig 2.
Fig. 2: Four layered architecture proposed by ITU-T
In the times of Internet of Things, number of
heterogeneous equipment such as TVs, laptops, fridges,
ovens, electrical appliances, cars, and smartphones are
connected over the internet. In this new scenario,
projections indicate that the Internet will have over 50
billion devices connected until 2020 [1]. And this
number is going to increase only.
II. ISSUES AND CHALLENGES IN IOT
With all this vast spectrum of IoT applications comes the
issue of security and privacy [4]. Along with the security
issues faced generally by the Internet, cellular networks, and
WSNs, IoT also has its special security challenges such as
privacy issues, authentication issues, management issues,
information storage and so on [4]. All these issues make the
IoT applications very vulnerable for different kinds of cyber
threats. Various cyber-attacks on the IoT based applications
related to security and privacy have been reported
worldwide. Since devices have less computing capability
and are less secure, they become soft targets for attackers.
The domain of IoT is expanding beyond mere things or
objects. Cyber Physical Systems (CPS) is another area
benefitting from the growth of IoT. In CPS physical objects
in the environment are monitored, and actions are taken
based on the physical changes [4]. Security lapses in such
systems can result in serious consequences if attacked by
attackers.
Inter-operability, lack of standard’s, legal challenge’s,
regulation related issues, issues related to rights, internet of
things economy issues and other development related issues
are also some minor issues related to IoT. A brief
description of internet of things related issues and
challenges by The Internet Society(ISOC) are described and
various issues and how they were raised [8]. Following are
the factors which demands security standards to be accurate
and in place:
Confidentiality. Data that is travelling across the network is
prone to be attacked and secret information can become
public. Communication in IoT based system can happen
between Machine to Machine, Machine to Human, Human
to Human, or Human to Machine. Data must securely reach
from source to destination. Different encryption/decryption
algorithms can be used for keeping information confidential.
Data Integrity. Data should remain intact while travelling
from source to destination in the network. Data might be
attacked during transmission mechanism should be deployed
which ensures that data is not exposed even if it has been
attacked. Attacker should not be able to see, change or
modify data even if they achieve it.
Authentication. Information is to be sent from sender to
receiver. Sender and receiver should be able to authenticate
each other.
Human IoT Trust Relationship. Trust is not defined for
human beings only; it should also be defined for Device or
System. Trust is defined as human to human, human to
device, device to device and device to human [2].
A. Security Issues in IoT
IoT devices like Wearable’s, Thermo-stat Systems, Air Conditioner and refrigeration systems that uses wireless communication (Wi- Fi) for remote monitoring. Apart from all the use cases, IoT still has various other issues that need to be sorted before actually implementing it in day-to-day use. There are issues also related to different technologies on which the foundation of IoT should be established, so that hackers can’t get access of system. System may get compromised due to these bugs and privacy of the consumer is lost or it may be used wrongfully by hacker. So, implementation of IoT should be done keeping in mind the security of the system.
Very soon, IoT will have an impact in the expansion of areas of cyber attacks in homes and offices by transforming the objects with online capability in the devices that have offline functionality. Security systems are not enough to overcoming the problems however Blockchain is possible solution used for creating IoT system save and secure in upcoming time.
The major classes of threats according to [9] are:
ISSN No. (Online) - 2368-1209 ISSN No. (Print) - 2691-5944
American Journal of Advanced Computing IEM-ICDC 2020 Special Issue on "Computational Intelligence and Smart Information and Communication Technology" January 2021, Volume 1, Issue 1
7
Accessibility Threat: The motivation is to prevent the illegitimate user from getting access to other’s data or services.
Anonymity Threat: The aim here is to analyze the anonymous transactions done by the user and other related publically available information in order to find out the real-world identity of the user.
Authentication/ Access control Threat: The aims is gaining authentication as a valid user so as to gain access of data.
a) Attacks that threaten accessibility of IoT devices:
Denial of Service(DOS) Attacks: In this type of attack, the target system is directed with lot of transactions by the attacker so that the system can be indulged with various requests to work upon and therefore break its availability.
Modification Attack: In this type of attack, the adversary tries to change or erase stored data for some particular user or for all the users. In this attack adversary tries to compromise the cloud storage security of the user. However, target system might be able to detect the changes in the storage system by comparing/matching the hash value of data in the cloud with stored hash in its local system.
Dropping Attack: All the received transactions and blocks are dropped once the adversary has established control over a CH(s). This type of attack can get detected because nodes that belong to the constituent clusters would not receive any transactions/services from overlay.
Appending Attack: Multiple Ch(s) that work cooperatively must be controlled by the adversary to launch this attack. For increasing the indirect evidence rating, the malicious CHs sign the multisig transaction along with the fake block to claim that they have verified the block.
b) For breaking anonymity, an adversary may attempt to link together different transactions having different IDs to any other real identity in the network system.
c) Attacking authentication and access control, where the adversary aims to hack into existing devices in the home. There can be other possibility of the adversary trying to add a new device to the smart home in order to get all the details at some later point of time.
The major factors impacting the security of the IoT model is the rapid growing prevalence of intelligence embedded system in virtually all the types of consumer devices and some very crucial applications such as remote monitoring, e- health and the need for reliable security [15] There are many challenges associated with securing the IoT devices in a reliable manner. The factors that affect it are:
IoT/ CPS technology and systems are comparatively new and less used than the traditional IT systems.
IoT/CPS systems are geographically distributed over a wide area, generally in open environment.
IoT/CPS systems are currently deployed singularly across vendor-specific vertical applications, creating fragmented technology and administrative silos.
End to end comprehensive standard of networking or security are not developed, stabilized, adopted, or even implemented; standardization would enable simpler integrated systems (including security).
The addressing models and formats are used in a way which get complex across different applications.
The diverse operating systems of number of devices in an IoT based system have feature sets which affect the functional capabilities of the overall system.
For reducing upgradation and overall cost, generally there are inexpensive and limited functionality machines deployed in IoT based systems. This further limit the use of heavy-duty firewalls.
B. Privacy Issues with IoT
Most of the applications of IoT includes working with confidential/ private data, Let’s say when device is associated to person, in electronic health scenario, problem of data privacy and anonymity are very much needed to be cared off. The important issue here is that the transactions are publicly logged and are available for all to see them. If anyhow the transactions can be linked to their owners or the identity of the owners is disclosed, then the adopted anonymity scheme has failed. In an ideal scenario, it is expected that the publicly available information cannot be used to identify the authenticated users of transactions or address in the network.
Righteousness in unethical use and data storage due to lack of rigorous rule for data collection by the IoT devices is likely to cause promote inappropriate use of data. Due to lack of conservation for the data accumulated by the IoT devices as information, it is likely to be. There are few multi- party models that enables transparency, expression and enforcement. Further, lack of privacy protection model and inability to recognize the expectation of users, there are limited number of resources to develop IoT devices integrated with privacy principles.
III. INCORPORATING BLOCK CHAIN: RECENT TREND
As discussed above, IoT is collection of things and thing can be any object. It need not be necessarily a computer system. From security point of view, decentralization is going to overcome many problems that arise when number of devices rely on a centralized approach.
In recent times, Blockchain technology has been gaining attention in providing IoT solutions. Though, it has been used substantially in the financial domain where the ultimate goal is to secure the money related transactions. But it has shown promising solutions in other domains also. Researchers have been using it in diverse technological areas. It has enabled Internet of Things model to be viewed in different aspects so as to highlight the advantageous
ISSN No. (Online) - 2368-1209 ISSN No. (Print) - 2691-5944
American Journal of Advanced Computing IEM-ICDC 2020 Special Issue on "Computational Intelligence and Smart Information and Communication Technology" January 2021, Volume 1, Issue 1
8

decentralized environment, facilitating interactions, allow coordination between devices in the network and enabling new transaction models [3].
There have been many initiatives by leading companies are leading initiatives to integrate block chain into their production management and supply chains. For example, IBM is using its large cloud infrastructure to provide block chain services to track its products as they move from one stage to another across the supply chain [3].
Several other startups are also promoting blockchain and creating new business model for centralized servers so as to ensure transparency. Several technical and financial companies have formed a consensus to set new standards using which IoT applications will be secured by Blockchain. This group aims at establishing a blockchain protocol to build IoT devices, applications, and networks [5].
IV. ARCHITECTURE OF BLOCKCHAIN
Blockchain: Nakamoto [15] (original Bitcoin developers nickname) introduced Blockchain as a mechanism to ensure auditability, immutability, and non-repudiation to provide security to electronic transactions, serving as a giant distributed ledger. This mechanism is the main innovation introduced by Bitcoin. It represents a way to reach consensus among unreliable participants.[3].
Blockchain technology has 4 underlying pillars, first of them being Consensus, which aims to provide the Proof of Work(PoW) and verifies actions in the network, second is known as a ledger that provides entire details of the transaction within the network, third is Cryptography whose job is to ensure that data in the ledger is encrypted which can be decrypted by authorised users only. Fourth pillar known as smart contract is used for checking the authenticity of the users in the network. Each transaction in the public ledger is verified if majority of consensus from a majority of participant in the blockchain environment, interconnection of ledger. In the blockchain system information can never be erased once verified. The blockchain environment contain verifiable records of each and every transaction ever made in the system.
Blockchain mainly has following 4 components which form its complete infrastructure:
Network of Nodes: All the nodes present in the network are connected with each other and records are kept for each transaction made on the the blockchain network in collaboration. Using different protocols, the authenticity of the transaction can be checked to further eliminate the intricacy of other 3rd party for validating. After completion of transaction, all its history is concatenated in the ledger of previous transactions and the process is called 'mining'. All the other nodes that are present in the system helps in verifying the proof of work as shown in fig 3.
Distributed database system: It is consisting of block of data that had a copy of information in rest of node in the blockchain environment. Every block in the system contain: a timestamp and History of the transactions which is used to tie-up previous blocks in the network as shown in fig [3].
Shared ledger: It is a record of transactions which gets updates after every single transaction. The shared ledger is accessible to everyone which increases transparency of the system.
Cryptography: which predicaments the record of information with a mechanism that can’t be tracked or tempered by unauthorized user.
Fig. 3: Blockchain design structure [22]
Deployment of blockchain is based on 3 types of access:
A. Public: In this type of access, all nodes can send or read transaction and can participate in the consensus process. No special permissions are required in this case. Cryptocurrencies like Etherium as well as Bitcoin fall under this category.
B. Consortium: It comes under partial permission the consensus process allows only the defined nodes to take part into it. The permission for reading or sending might be access-able with some restrictions to a pre-determined number of nodes or may be publicly available.
C. Private: In this type of system, transactions can be written only by the organization to whom the network of blockchain belongs to. Depending upon the requirements, reading permission of the transaction might be restricted or publicly available. This type of system is generally deployed in industrial fields.
Main fundamental functions of blockchain network are:
a) Peer- to- peer messaging
b) Distributed data sharing
c) Autonomous coordination with the device.
An example of blockchain technology can be illustrated using yap payment system [13] where a buyer broadcasts to a network that the seller’s Bitcoin address is the new owner of specific Bitcoin unit. Thus, information is distributed over the network until all nodes are informed about the ownership transfer, detailed architecture of blockchain is shown in fig 3 and brief architecture is shown in fig 4.
ISSN No. (Online) - 2368-1209 ISSN No. (Print) - 2691-5944
American Journal of Advanced Computing IEM-ICDC 2020 Special Issue on "Computational Intelligence and Smart Information and Communication Technology" January 2021, Volume 1, Issue 1
9
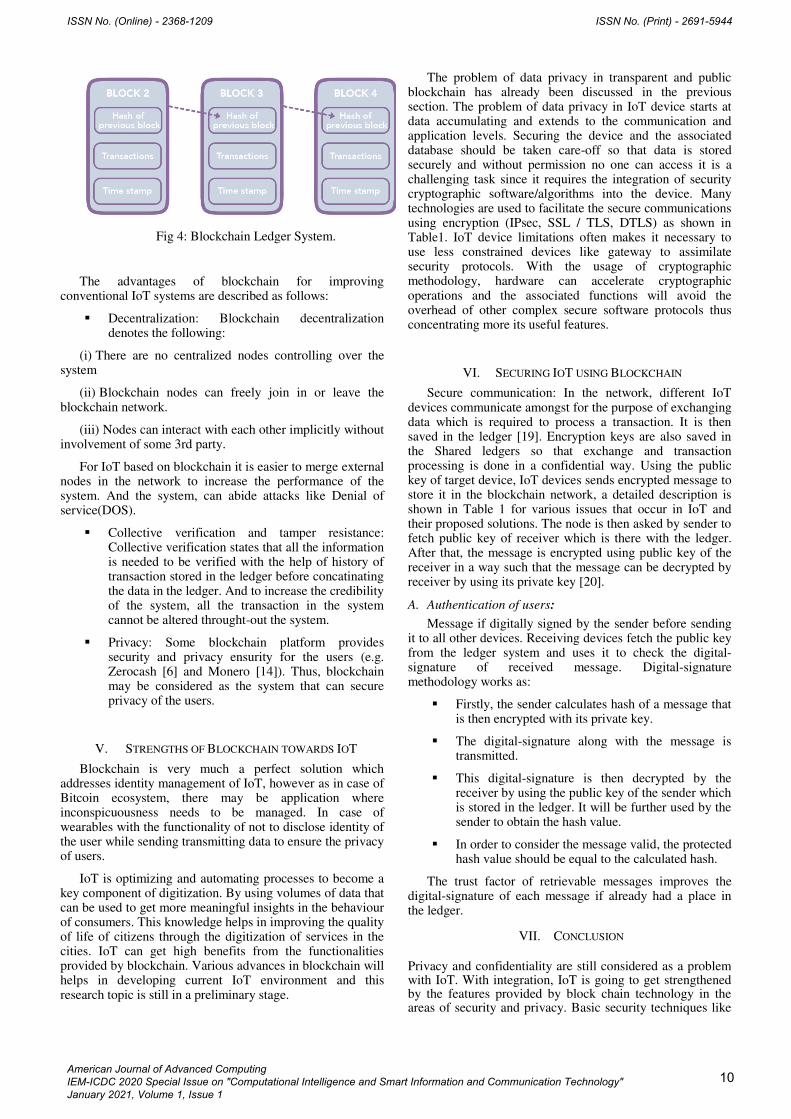
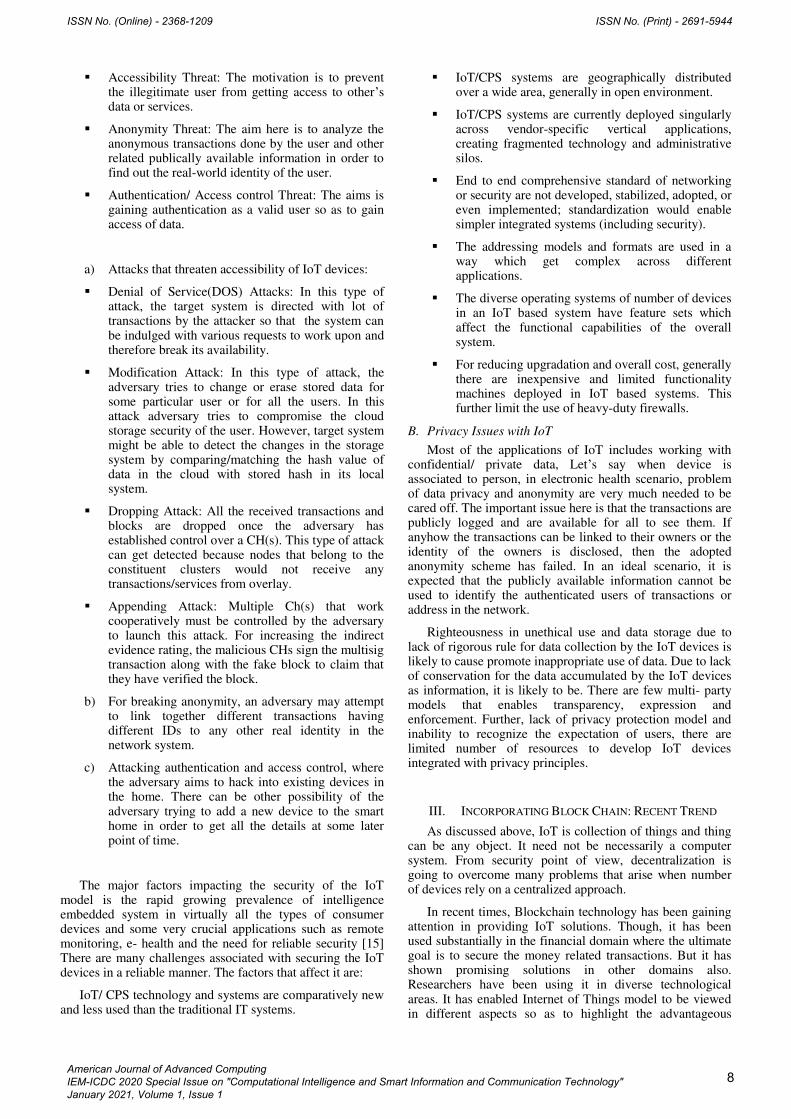
Fig 4: Blockchain Ledger System.
The advantages of blockchain for improving conventional IoT systems are described as follows:
Decentralization: Blockchain decentralization denotes the following:
(i) There are no centralized nodes controlling over the system
(ii) Blockchain nodes can freely join in or leave the blockchain network.
(iii) Nodes can interact with each other implicitly without involvement of some 3rd party.
For IoT based on blockchain it is easier to merge external nodes in the network to increase the performance of the system. And the system, can abide attacks like Denial of service(DOS).
Collective verification and tamper resistance: Collective verification states that all the information is needed to be verified with the help of history of transaction stored in the ledger before concatinating the data in the ledger. And to increase the credibility of the system, all the transaction in the system cannot be altered throught-out the system.
Privacy: Some blockchain platform provides security and privacy ensurity for the users (e.g. Zerocash [6] and Monero [14]). Thus, blockchain may be considered as the system that can secure privacy of the users.
V. STRENGTHS OF BLOCKCHAIN TOWARDS IOT
Blockchain is very much a perfect solution which addresses identity management of IoT, however as in case of Bitcoin ecosystem, there may be application where inconspicuousness needs to be managed. In case of wearables with the functionality of not to disclose identity of the user while sending transmitting data to ensure the privacy of users.
IoT is optimizing and automating processes to become a key component of digitization. By using volumes of data that can be used to get more meaningful insights in the behaviour of consumers. This knowledge helps in improving the quality of life of citizens through the digitization of services in the cities. IoT can get high benefits from the functionalities provided by blockchain. Various advances in blockchain will helps in developing current IoT environment and this research topic is still in a preliminary stage.
The problem of data privacy in transparent and public blockchain has already been discussed in the previous section. The problem of data privacy in IoT device starts at data accumulating and extends to the communication and application levels. Securing the device and the associated database should be taken care-off so that data is stored securely and without permission no one can access it is a challenging task since it requires the integration of security cryptographic software/algorithms into the device. Many technologies are used to facilitate the secure communications using encryption (IPsec, SSL / TLS, DTLS) as shown in Table1. IoT device limitations often makes it necessary to use less constrained devices like gateway to assimilate security protocols. With the usage of cryptographic methodology, hardware can accelerate cryptographic operations and the associated functions will avoid the overhead of other complex secure software protocols thus concentrating more its useful features.
VI. SECURING IOT USING BLOCKCHAIN
Secure communication: In the network, different IoT devices communicate amongst for the purpose of exchanging data which is required to process a transaction. It is then saved in the ledger [19]. Encryption keys are also saved in the Shared ledgers so that exchange and transaction processing is done in a confidential way. Using the public key of target device, IoT devices sends encrypted message to store it in the blockchain network, a detailed description is shown in Table 1 for various issues that occur in IoT and their proposed solutions. The node is then asked by sender to fetch public key of receiver which is there with the ledger. After that, the message is encrypted using public key of the receiver in a way such that the message can be decrypted by receiver by using its private key [20].
A. Authentication of users:
Message if digitally signed by the sender before sending it to all other devices. Receiving devices fetch the public key from the ledger system and uses it to check the digital-signature of received message. Digital-signature methodology works as:
Firstly, the sender calculates hash of a message that is then encrypted with its private key.
The digital-signature along with the message is transmitted.
This digital-signature is then decrypted by the receiver by using the public key of the sender which is stored in the ledger. It will be further used by the sender to obtain the hash value.
In order to consider the message valid, the protected hash value should be equal to the calculated hash.
The trust factor of retrievable messages improves the digital-signature of each message if already had a place in the ledger.
VII. CONCLUSION
Privacy and confidentiality are still considered as a problem with IoT. With integration, IoT is going to get strengthened by the features provided by block chain technology in the areas of security and privacy. Basic security techniques like
ISSN No. (Online) - 2368-1209 ISSN No. (Print) - 2691-5944
American Journal of Advanced Computing IEM-ICDC 2020 Special Issue on "Computational Intelligence and Smart Information and Communication Technology" January 2021, Volume 1, Issue 1
10

steganography and cryptography have also been discussed so as to give the reader overall understanding of data securing techniques. This article emphasizes on the use of block chain technology with IoT to ensure safe and secure transmission of data amongst devices connected in a network. Overview of blockchain technology and security issues faced by IoT environment is discussed as well as the use of block chain-based system as a solution for overcoming various issues.
TABLE I. MAJOR ISSUES AND THEIR SOLUTIONS IN IOT.
Issues Proposed Solutions
High latency, high
band width and
security and privacy
issues [16].
1) A Hybrid distributed architecture for
sustainable smart city network.
2) A proof- of- wok scheme to ensure security
and privacy.
Software and network,
missing connection
with the real world and
Lack of digitization
[17].
1) RFID chip based solution with built in
asymmetric encryption algorithm.
2) Uses advantages of both decentralized
blockchain and Waltonchain implementations.
Decision framework
for using blockchain in
IoT [18].
Questions Answered: 1) Do user actually need
to use blockchain.
2) if yes, which platform is most suitable for
user for comparing existing systems.
Blockchain is costly
and needs high
bandwidth [10].
Proposes new secure, private and light- weight
architecture for IoT to eliminate overhead of
BC retaining benefits of the blockchain
technology.
Access control nature
of blockchain by third
party users [11].
Proposes FairAccess as a new decentralized
pseudonymous and privacy preserving,
authorization management framework.
And Leverages the consistency offered by
blockchain based cryptocurrencies to provide
stronger and transparent access control.
Access control
functionality [21].
Model exploits the immutability feature of
Blockchain to store the whitelist of devices.
The account number in Blockchain solves the
problem of no unique identifier in IoT.
So, no one can alter its contents providing
better authentication and access control.
Security issues of
centralized servers
[12].
1) In BeeKeeper system, servers can process a
user's data by performing homomorphic
computations on the encrypted data without
learning anything from them.
2) Malicious nodes can be scrutinized to
secure computation.
3) No need of large memory and high
computational resources.
REFERENCES
[1] Hegde S. G., Soumyalatha, “Internet of Things (IOT): A study on architectural elements, communication technologies and Applications”, International journal of advanced research in Computer and Communication Engineering, Vol. 5, Issue 9, 2016.
[2] Mustafa G., Ashraf R., Mizra M. A. and Jamil M. A., "A review of data security and cryptographic techniques in lot based devices", ACM ICFNDS’, vol. 18, 2018.
[3] Jesus, Emanuel & Chicarino, Vanessa & Albuquerque, Célio & Rocha, Antônio. (2018). A Survey of How to Use Blockchain to Secure Internet of Things and the Stalker Attack. Security and Communication Networks. 2018. 1-27. 10.1155/2018/9675050.
[4] V. Hassija, V. Chamola, V. Saxena, D. Jain, P. Goyal and B. Sikdar, "A Survey on IoT Security: Application Areas, Security Threats, and Solution Architectures," in IEEE Access, vol. 7, pp. 82721-82743, 2019, doi: 10.1109/ACCESS.2019.2924045.
[5] N. Kshetri, "Can Blockchain Strengthen the Internet of Things?," in IT Professional, vol. 19, no. 4, pp. 68-72, 2017, doi: 10.1109/MITP.2017.3051335.
[6] Sasson E. et al. Zerocash: Decentralized anonymous payments from bitcoin (2014).
[7] Li. S., “The Internet of Things: a survey”, Information Systems Frontiers, Vol. 17 No. 2, pp. 243-259 (2015)
[8] Rose K, The Internet of things: An overview, Internet Society (2015).
[9] Dorri A, Blockchain in Internet of Things: Challenges and Solutions, arXiv- Cornell University (2016).
[10] Dorri, A., LSB: A Lightweight Scalable BlockChain for IoT Security and Privacy. ArXiv, abs/1712.02969 (2017).
[11] Aafaf Q, Towards a Novel Privacy-Preserving Access Control Model Based on Blockchain Technology in IoT. 10.1007/978-3-319-46568-5_53 (2017).
[12] Zhou. L, BeeKeeper: A Blockchain-Based IoT System With Secure Storage and Homomorphic Computation. IEEE Access, 6, 43472-43488 (2017).
[13] Berentsen, A, A Short Introduction to the World of Cryptocurrencies (2018)
[14] https://getmonero.org/
[15] Minoli, D., Blockchain mechanisms for IoT security (2018).
[16] Sharma, P.K., Blockchain based hybrid network architecture for the smart city. Future Generation Comp. Syst., 86, 650-655 (2018).
[17] Bing M, A Solution for Internet of Things based on Blockchain Technology. 112-117. 10.1109/SOLI.2018.8476777 (2018).
[18] Claus P, A Decision Framework for Blockchain Platforms for IoT and Edge Computing. 10.5220/0006688601050113 (2018).
[19] Minoli D, Blockchain mechanism for IoT security (2018).
[20] Singh. M., Blockchain: A game changer for securing IoT data (2018).
[21] Ghadekar P, Secure access control to IoT devices using blockchain, Ijrte, vol-8, issue-2, 3064-3070 (2019).
[22] Salah, Khaled & Khan, Minhaj. (2017). IoT Security: Review, Blockchain Solutions, and Open Challenges. Future Generation Computer Systems. 10.1016/j.future.2017.11.022.
[23] https://www.slideshare.net/ATASlides/iot-and-raspberry-pi-with-live-demo
ISSN No. (Online) - 2368-1209 ISSN No. (Print) - 2691-5944
American Journal of Advanced Computing IEM-ICDC 2020 Special Issue on "Computational Intelligence and Smart Information and Communication Technology" January 2021, Volume 1, Issue 1
11

Computer Vision based Pre-processing System For
Autonomous Vehicles Tarun Tiwari
Dept. of Computer Science and Engineering MVJ College of engineering
Bangalore, India [email protected]
Aparajita Nandi
Dept. of Computer Science and Engineering
MVJ College of engineering
Bangalore, India
Abstract—Autonomous vehicles are considered to be the
future of automobile industry. With improvement in
autonomous vehicle’s efficiency, they can be made much safe
for people to use them. Our aim is to contribute a robust and
realistic approach to improve the data interpretation and
decision making capability of the vehicle. It consists of three
major parts. First part includes pre-processing of raw data
captured by camera for better interpretation and
understanding of surrounding in which the car is being driven.
Second part discusses about path and object detection from the
pre-processed image for making decisions. Third part is
extension of second part which discusses about implementation
of an algorithm simultaneously being applied to calculate the
distance between the objects and cars in real time.
Keywords—Digital Image Processing, Computer Vision,
Deep Learning, Reinforcement Learning, Autonomous vehicles
I. INTRODUCTION
Autonomous vehicles can be defined as a vehicle
capable of sensing its environment and moving safely
without or little input from human. They combine several
sensors to understand their surroundings and act
accordingly. They may reduce car ownership with low-cost
shared-vehicle services moving from one transport job to
the next. For those that choose to still own vehicles, they
may make transportation faster, safer and more reliable.
Current commercially available vehicles offer some
automation, such as self-parking and even limited driving
in some circumstances.
Concept of autonomous vehicles can be traced from
development in automobiles in early 1920’s. But major
development started during 1980’s after development of
modern sensors and growth of wireless technology. After 1
century, even today efficiency of decision making
capability of vehicle is a major issue. As of 2020, we have
1.2 billion vehicles running on road, and have annual death
count of 1.35 million people due to road accidents.
According to Navigant Research report we would have 2
billion vehicles on road by 2035 which can lead to annual
death count to reach 1.8 million by 2035. Driving in such
conditions would be beyond human capabilities, thus we
need to enhance the decision making capability and build a
system for future.
Our aim is to propose a system through this paper that
helps vehicles in better understanding of their surrounding
by a continuous process that includes better pre-processing
of raw data that is used for feature extraction by path and
object detection by digital image processing and computer
vision. Distance approximation algorithm is also implied
parallel to feature extraction on preprocessed images. This
would help in providing better understanding of
surrounding of vehicle and can enhance decision making
capability of system.
The paper is organized as follows: Section II discusses
about the research work in related field; methodology is
explained in Section III; followed by working in Section IV
and results in Section V; Section VII depicts conclusion and
discussions.
II. RELATED WORK
Path and object detection along with distance approximation algorithm are the main objective of this paper. Few of the available research work and literature study were referred to understand the already implemented and proposed systems in autonomous vehicle’s domain.
Burleigh N[1] proposed a system similar to Audi Autonomous Driving Cup and Carolo Cup using deep learning for independently handling lane keeping and traffic sign recognition.
Zanchin[2] through their research discusses about improvement of comfort, safety and performance of autonomous vehicle for potentially reducing traffic and congested traffics. Through their paper they also discuss about sensor fusion for autonomous vehicles
Rajat Kumar Sinha[3] discussed about different deep learning algorithms that are used in solving conventional artificial intelligence problems. It also discusses about various approaches followed by applications like image classification, object detection, image extraction and segmentation in presence of noise.
Locktev [5] proposed an algorithm to estimate distance between objects based on geometric and kinematic parameters. It also discusses the use of methods and procedures of statistical analysis and probabilistic approach.
Xia. W and Li. H [6] proposed a system for autonomous vehicles which works on principles of reinforcement learning, where system learns from experience of professional driver and a Q-learning algorithm with filtered experienced and trained and implemented in the central system.
K. Tanwani [8] through their research explains usage of reinforcement techniques in real world complex situations and how can machine learn and implement how human solve such complex situations.
V. Mnih and K. Kavukcuoglu [9] in their research work discussed about psychological and neuoroscientific perspective of behavior of models, which helps in optimizing their control in real world situations that may be difficult to depict on simulators.
All models and research works were considered and
analyzed while building our system.
ISSN No. (Online) - 2368-1209 ISSN No. (Print) - 2691-5944
American Journal of Advanced Computing IEM-ICDC 2020 Special Issue on "Computational Intelligence and Smart Information and Communication Technology" January 2021, Volume 1, Issue 1
12

III. PROPOSED METHODOLOGY
The autonomous vehicle would have a system with
attached sensors mainly camera towards front, side and top
of the car. In order to increase the efficiency of vehicle, a
separate system is needed that preprocesses the raw input
captured through the camera. We focus on getting raw data
from the camera, this data is then pre-processed using
dilation and erosion techniques for better analysis of raw
data which can be helpful in better interpretation of
surrounding.
The pre-processed images are then used by object and
path detection algorithm for locating path and finding
objects on the roads. Simultaneously along with multiple
object detection, distance between those objects and vehicle
is recorded to analyze approaching and deviating objects
from the vehicle. Distance is calculated by distance
approximation algorithm that works on approximating the
centroid of detected objects and tracing between centroids
of those objects. All these collected information will be
forwarded to centralized system for taking required
decisions.
Fig 1. Block Diagram of Work Cycle
IV. WORKING
Following techniques are used for implementing the
proposed system:
A. Preprocessing
Images of surrounding are captured from camera sensors
and sent to processors for pre-processing. Many a times the
vehicles are been driven in conditions like sunny, cloudy
days or other conditions that would result in colour
contraction among images. This may result in ignorance of
vital information for vehicles. Therefore pre-processing of
images from camera sensor is done before image processing
for better interpretation of information.
Morphological operations like erosions and dilations are
performed depending on requirement. Dilation is done for
increasing the pixel values and erosion is done to decrease
the pixel values from the targeted region of the image. These
techniques are mainly applied on sign boards and objects in
images. Above discussed morphological operations are
performed using computer vision and applying kernel on the
targeted portion. Kernel of odd matrix runs through the
image and depending on timely requirement the changes are
made (the 0,1 pixel of image would be considered as 1 ,if all
values under kernel is 1 in case of erosion and would be
considered as 0,if all values under is 0 in case of dilation).
(a)
(b)
Fig 2. (a) Image of a signboard prior to Image dilation,
(b) Image of a signboard after to Image dilation
In situations when images are captured from
different views, it becomes difficult to interpret, we
apply perspective transformation for targeted areas of
images. In is achieved by computer vision techniques
by which the object traced in targeted area by detecting
and marking of object corners. Object’s distortion is
then changed multiple times and shape with better
understanding than others is selected and then
forwarded for analysis and detection.
(a)
ISSN No. (Online) - 2368-1209 ISSN No. (Print) - 2691-5944
American Journal of Advanced Computing IEM-ICDC 2020 Special Issue on "Computational Intelligence and Smart Information and Communication Technology" January 2021, Volume 1, Issue 1
13

(b)
Fig 3. (a) Image of the signboard before image transformation,
(b) Image of the signboard after the image transformation
B. Path and Object Detection
While driving the autonomous car on the road, the
vehicle may come across situations where an unwanted
or unknown object is on its path. If such situations are
not resolved quickly, it may result in accidents. To tackle
such situations, an Object detection mechanism is
designed such that it detects unwanted objects on the
roads in between the lanes and acts accordingly.
This can be done using the Binocular Vision model
which is based on a 2-CNN model. This imitates the
human eye structure by using the left and the right
cameras as a pair of human eyes collecting images from
two different viewpoints. It simulates the achiasma case,
in which the right and the left images are used to train
two different CNNs without any crossing of the signal
between the two of them. This helps to determine the
position distance and the speed of the object
The mechanism of the autonomous car allows it to
take snapshots of its surroundings through cameras
mounted on the left, right and center of it. If any image
with an anomaly such as presence of a vehicle or person
on the road is captured during a particular instant of
time, which is different from that on which the
Behavioral Cloning CNN has been trained, it is quickly
identified. The cameras capture the same object from
two different viewpoints.
Fig 4. Illustration of the angles used to calculate the value of ’h’
The images are pre-processed and cleaned to enhance
the image for easy processing. The pictures are then fed as
input into the model. The feature outputs from the two
Convolutional Neural Networks are then given as inputs
to the Flattening layer and flattened out.
Following this, the distance between the autonomous car and the object on the road is calculated using the Triangulation formula using the separation between the x coordinates of centroid of object from both the images.
.…….. (1)
The distance of the object from the vehicle is closely monitored. If the object falls in between the lanes on both sides and distance between them seems to be decreasing then an alarm or notification is raised to tackle the same
Fig 5. Flowchart depicting the above methodology
C. Distance Approximation Algorithm
Behavioral cloning is a method, by which a Deep
learning model can capture the sub cognitive skills of
humans, through the training data provided and replicate
the same. The training data consists of the recorded data
while the human subjects performs required action
corresponding to the situation. The dataset used by the
Autonomous car model consists of steering angle,
throttle, reverse, speed as well as the front, left and right
ISSN No. (Online) - 2368-1209 ISSN No. (Print) - 2691-5944
American Journal of Advanced Computing IEM-ICDC 2020 Special Issue on "Computational Intelligence and Smart Information and Communication Technology" January 2021, Volume 1, Issue 1
14

views’ snapshots taken while manually driving the car in
the simulation.
The Steering angle is the behavior that the model needs to learn and predict with the help of the other data from the driving log. It is represented by a normalized value in the range of -1 to 1. Initially, on plotting the histograms for the values of Steering angle against the numbers after adding the pairs of consequent values, we notice a segregation of 0 angle data
(a)
(b)
Fig 6. (a)The dataset before removal of unnecessary
steering angle data, (b) Dataset after cleaning.
A lot of same values in the dataset may lead to the model being biased to that as well as reduce the efficiency of the model. To tackle this, we remove the excess of 0 angle data. All the steering angle values are flipped as well to make sure that the model is not biased towards any specific condition
Fig 7. (a)The Training set and the Validation set
In any machine learning model, it is very important
to pre-process the data by data augmentation and cleaning.
For this, we use various pre-defined classes from the Cv2
library. The data is randomly selected and is resized.
Followed by which Color space conversion from RGB to
YUV is applied allowing reduced bandwidth and thereby
providing a more efficient coding for image processing.
Next, the Gaussian blur function which is a low pass filter
function, is applied on the images to reduce the noise and
detail in the images.
After the images have been corrected, we augment the dataset to increase the diversity of the data by creating variations of the images in the data. Generating more samples from already existing ones can be helpful if we don’t have large enough datasets and also prevents over- fitting. The data hence becomes more diverse. Data augmentation for this model was applied to 50 percent of the data through random selection. This is done using the Affline class from the imgaug library in python. The following changes are made: Changing the scale of the images, panning the images to keep the main subject in focus, Adjusting the brightness and Flipping the images. These are applied to a randomly selected set of images from the provided Training and validation set.
Fig 8. Detailed summary of The Nvidia Model
The deep learning model used is the Nvidia model
which is proven to be one of the best models for behavioral
cloning for Autonomous cars. The input is a 3 channel
image of size 200 by 66. The model is initialized by defining
an object from the Sequential subclass from the ‘models’ class of the keras library which is a deep learning API, while
using a Tensorflow backend. It has 5 convolution layers
with 24, 36, 48, 64 and 64 filters respectively. The filter
sizes in the first three convolutional layers are of 5 by 5 size
while the remaining two are of 3 by 3 size. The stride length
of the kernel is set to be 2 for both vertical and horizontal
traversal for the first three layers only. All of the layers have
ISSN No. (Online) - 2368-1209 ISSN No. (Print) - 2691-5944
American Journal of Advanced Computing IEM-ICDC 2020 Special Issue on "Computational Intelligence and Smart Information and Communication Technology" January 2021, Volume 1, Issue 1
15
the activation function as ‘elu’ which is a modified version
of ‘relu’.
Fig. 9. The ‘elu’ activation function graph
The image pixels are flattened out after dropping 50
percent of the neurons to prevent overfitting. Followed by
which 4 fully connected layers are added having 100, 50, 10
and 1(Output layer) neurons respectively. After every dense
layer 50 percent of neurons are dropped out. Finally, the
model is compiled by using the loss function as ‘mse’ (Mean
Squared Error) and the ‘Adam’ optimizer with a learning
rate of 0.3. A detailed summary of the Nvidia model is
above.
Fig. 10. Evaluation of model performance
The models goes through 30 Epochs with a batch size
of 100 and verbose value of 1. The results of the trained
model performance on the test set is evaluated using the
graph plot.
V. RESULTS
The proposed system was trained and deployed on
simulator. The results of new system was better than older
systems available for simulator. The system was able to
predict sign boards and lanes with better accuracy after
learning from driver’s behavior while driving.
VI. CONCLUSION
We have demonstrated a detail and step-by-step
approach for the analysis system. The proposed method use
pre-trained reinforcement learning based system, object
detection algorithm, and a centralised system to pre-process
input for better understanding of data. Based on the
observations, the proposed methods can take decisions
without human input
This paper can help in reducing road accidents and
provide better experience of driving for driver. There are
certain limitations with the system. Future prospects of our
study include verifying the simulation results and further
tuning them using Robocar (fully functional driving car,
1/10th the size of standard commercial car. The verification
results are expected to demonstrate that learning
autonomous driving in a simulated environment is a step
towards driving on real streets.
REFERENCES
[1] Burleigh, N., King, J., & Braunl, T.(2019). “Deep Learning for Autonomous Driving. 2019 Digital Image Computing: Techniques and Applications” (DICTA).
[2] B. C. Zanchin, R. Adamshuk, M. M. Santos and K. S. Collazos, "On
the instrumentation and classification of autonomous cars," in IEEE Internation Conference on Systems, Man, and Cybernetics (SMC), Banff, AB, Canada, 2017.
[3] R. Sinha, R. Pandey and R. Pattnaik, "Deep Learning For Computer Vision Tasks: A review," in International Conference on Intelligent Computing and Control, Odisha, 2017.
[4] N. Burleigh, "Autonomous Driving on a Model Vehicle: Lane Detection and Control," University of Western Australia, Perth, 2019.
[5] NVIDIA Corporation, "Jetson Nano: Deep Learning Inference Benchmarks," 2019. [Online].
[6] Loktev, D. A., & Loktev, A. A. (2016). Estimation of measurement of distance to the object by analyzing the blur of its image series. 2016 International Siberian Conference on Control and Communications
[7] Xia, W., Li, H., & Li, B. (2016). A Control Strategy of Autonomous Vehicles Based on Deep Reinforcement Learning. 2016 9th International Symposium on Computational Intelligence and Design
(ISCID). [8] P. WawrzyĔSki and A. K. Tanwani, "Autonomous reinforcement
learning with experience replay," Neural Networks, vol. 41, pp. 156- 167, 2013.
[9] V. Mnih, K. Kavukcuoglu, D. Silver, A. A. Rusu, J. Veness, M. G. Bellemare, et al., "Human-level control through deep reinforcement learning," Nature, vol. 518, pp. 529-533, 2015.
[10] V. Mnih, K. Kavukcuoglu, D. Silver, A. Graves, I. Antonoglou, D. Wierstra, et al., "Playing atari with deep reinforcement learning," arXiv preprint arXiv:1312.5602, 2013.
[11] Krizhevsky, I. Sutskever, & G. E. Hinton, (2012). ImageNet Classification with Deep Convolutional Neural Networks. Advances in Neural Information Processing Systems 25 (NIPS 2012). pp. 1106– 1114.
[12] B. Wang, J. w. Li and H. Liu, "A Heuristic Reinforcement Learning for Robot Approaching Objects," 2006 IEEE Conference on
Robotics, Automation and Mechatronics [13] C. C. Pham and J. W. Jeon, “Robust object proposals re-ranking for
object detection in autonomous driving using convolutional neural networks,” Signal Processing: Image Communication, pp. –, 2017
[14] K. Simonyan and A. Zisserman, “Very deep convolutional networks for large-scale image recognition,” arXiv preprint arXiv:1409.1556, 2014
[15] J. Hosang, R. Benenson, P. Dollár, and B. Schiele, “What makes for effective detection proposals?,” IEEE transactions on pattern analysis and machine intelligence, vol. 38, no. 4, pp. 814–830, 2016.
[16] X. Du and K. K. Tan, “Comprehensive and practical vision system for self-driving vehicle lane-level localization,” IEEE transactions on image processing, vol. 25, no. 5, pp. 2075–2088, 2016.
[17] A. Geiger, P. Lenz, and R. Urtasun, “Are we ready for autonomous driving? the kitti vision benchmark suite,” in Conference on Computer Vision and Pattern Recognition (CVPR), 2012
[18] B. Yang, J. Yan, Z. Lei, and S. Z. Li, “Craft objects from images,” in Proceedings of the IEEE Conference on Computer Vision and Pattern Recognition, pp. 6043–6051, 2016.
[19] J. R. Uijlings, K. E. Van De Sande, T. Gevers, and A. W. Smeulders, “Selective search for object recognition,” International journal of computer vision, vol. 104, no. 2, pp. 154–171, 2013.
[20] C. L. Zitnick and P. Dollár, “Edge boxes: Locating object proposals from edges,” in European Conference on Computer Vision, pp. 391– 405, Springer, 2014.
[21] Y. Xiang, W. Choi, Y. Lin, and S. Savarese, “Subcategory-aware convolutional neural networks for object proposals and detection,” arXiv preprint arXiv:1604.04693, 2016.
[22] S. Ren, K. He, R. Girshick, and J. Sun, “Faster r-cnn: Towards realtime object detection with region proposal networks,” in Advances in neural information processing systems, pp. 91–99, 2015.
ISSN No. (Online) - 2368-1209 ISSN No. (Print) - 2691-5944
American Journal of Advanced Computing IEM-ICDC 2020 Special Issue on "Computational Intelligence and Smart Information and Communication Technology" January 2021, Volume 1, Issue 1
16
[23] M. Braun, Q. Rao, Y. Wang, and F. Flohr, “Pose-rcnn: Joint object
detection and pose estimation using 3d object proposals,” in Intelligent Transportation Systems (ITSC), 2016 IEEE 19th International Conference on, pp. 1546–1551, IEEE, 2016.
[24] Z. Cai, Q. Fan, R. S. Feris, and N. Vasconcelos, “A unified multiscale deep convolutional neural network for fast object detection,” in European Conference on Computer Vision, pp. 354–370, Springer, 42016.
[25] F. Yang, W. Choi, and Y. Lin, “Exploit all the layers: Fast and
accurate cnn object detector with scale dependent pooling and cascaded rejection classifiers,” in Proceedings of the IEEE Conference on Computer Vision and Pattern Recognition, pp. 2129–
2137, 2016. [26] T. Kong, A. Yao, Y. Chen, and F. Sun, “Hypernet: towards accurate
region proposal generation and joint object detection,” in Proceedings of the IEEE Conference on Computer Vision and Pattern Recognition, pp. 845–853, 2016.
ISSN No. (Online) - 2368-1209 ISSN No. (Print) - 2691-5944
American Journal of Advanced Computing IEM-ICDC 2020 Special Issue on "Computational Intelligence and Smart Information and Communication Technology" January 2021, Volume 1, Issue 1
17

Rapid Measurement of Physical Quality of Dry
Chili – A Machine Vision Approach
Tamal Dey
Centre for Development of Advanced
Computing, (C-DAC)
Kolkata, India
Amitava Akuli
Centre for Development of Advanced
Computing, (C-DAC)
Kolkata, India
Rishin Banerjee
Centre for Development of Advanced
Computing, (C-DAC)
Kolkata, India
Gopinath Bej
Centre for Development of Advanced
Computing, (C-DAC)
Kolkata, India
Sabyasachi Majumdar
Centre for Development of Advanced
Computing, (C-DAC)
Kolkata, India
Nabarun Bhattacharyya
Centre for Development of Advanced
Computing, (C-DAC)
Kolkata, India
Abhra Pal
Centre for Development of Advanced
Computing, (C-DAC)
Kolkata, India
Tapas Sutradhar
Centre for Development of Advanced
Computing, (C-DAC)
Kolkata, India
Abstract— This paper presents a conveyorized machine
vision system for the rapid quality estimation of dry chili based
on visual appearance like size, shape, color, etc. Dry chili is
extensively used as raw material to make Curry powder,
Masala, seasonings, and pizza toppings. It has got certain
standard characteristics parameters to meet the export quality
like color, length, broken percentage, loose seeds, pods without
stalks, damage and discolored pods, aroma, pungency, etc.
Currently, these features are inspected manually by
individuals by their expert vision. The human inspection
methodology is subjective, non-repeatable, time-consuming,
and error-prone. In this paper, a novel attempt has been taken
to address the above problem by using a conveyorized system
with machine vision technology, backed up by advanced
software algorithms, and an effort has been made to correlate
the results with human perception. The software has been
developed to take color images using a digital camera in real-
time and extraction of the dimensional and color features have
been done through various image processing techniques and
based on the export quality standards, chili quality has been
estimated. Experiments have been conducted with different
varieties of chili like LCA334, TEJA, Bidigi, etc. The accuracy
of the system has been calculated as 96% as validated by
human experts. Moreover, it has been found that manual
inspection takes 15-20 minutes to analyze 1 Kg of chili samples
whereas inspection using the developed system takes less than
five minutes.
Keywords—Chili; Conveyor; Color; machine vision; Image
processing; Quality standard
I. INTRODUCTION
Chili is an annual sub herb belonging to the family
Solanaceae. It is also called as hot pepper, red pepper,
cayenne pepper, capsicum, etc. Most of the cultivated
varieties in India belong to the species Capsicum annum [1].
Dry chili is extensively used as an ingredient in Curry
powder, Seasonings, and pizza toppings. Chili imparts
pungency and color to the dishes. It is an important
ingredient in day-to-day curries, pickles, and chutneys. It is
also a rich source of Vitamin A, C, and E [2] and assists
digestion. It also prevents heart diseases by dilating blood
vessels. Today, India has emerged as a major producer,
consumer, and exporter of this spicy commodity. India is the
largest and biggest exporter of chili in the world with
production capacity about 8 lakh tones of dry chili from an
area of over 9 lakh hectares [1]. Some varieties of chili
samples are famous for red color because of the pigment
capsanthin, others are known for biting pungency attributed
by capsaicin. The export industry needs to evaluate certain
physical quality parameters of chili like color, length,
aroma, pungency, etc. Appearance-based quality parameters
of chili are the length of the chili pod (greater than 5 cm, 3
to 5 cm), broken chili, pod without a stalk, discolored chili,
foreign matter, loose seed, etc. According to the Indian
Export Quality Standard, chili has got certain standard
characteristics parameters to meet the export quality. The
export quality specification of chili is described in Table-1. Quality
Parameter
Specification Specification/
Allowable range
(based on Indian
Export Standard
Color Bright Red -
Pod Length More than 5 cm
less than 5 cms,
allowed up to 5% by
weight
Broken Less than 3 cm Allowed up to 7% by
weight
Pods without
stalks Pod only
Allowed up to 8% by
weight
Foreign matter
Discolored and
damage
Loose seed
Other than chili,
loose stalk
Yellow pod, pale
red
Seeds (White
color)
Allowed up to 2% by
weight
Allowed up to 6% by
weight
Allowed up to 2% by
weight
TABLE I. EXPORT QUALITY SPECIFICATION OF DRY CHILI [9]
Presently, the above said quality parameters are inspected
manually by human experts. About 5 Kg chili sample is
taken from 50 bags (each bag contains 50 Kg) for quality
inspection using standard sampling mechanism. From 5 Kg
of chili sample, only 1 Kg is used for appearance-based
quality inspection. Each chili sample is inspected manually
ISSN No. (Online) - 2368-1209 ISSN No. (Print) - 2691-5944
American Journal of Advanced Computing IEM-ICDC 2020 Special Issue on "Computational Intelligence and Smart Information and Communication Technology" January 2021, Volume 1, Issue 1
18

by the naked eye and classified accordingly. The
involvement of humans in the quality inspection process
makes the quality assessment process subjective, non-
repeatable, and cumbersome due to the pungency property of
chili which creates burning to our eyes. Error due to
subjectivity is influenced by individual experience, sex,
fatigue, biasness to a particular brand, etc. Again visual
inspection of tons of chilies is time-consuming and tedious
also. Husin et al [3] describe a novel method to detect the
chili plant leaf disease using image processing technology.
Dimension based chili sorting using machine vision has been
described in [4]. A machine vision system based on
Hyperspectral imaging and machine learning has been
proposed in [5] to estimate the Aflatoxin detection in chili
pepper. [6] Has proposed a method to classify chili based on
color (either green or red) and dimension (broken or whole)
using image processing and machine learning
methodologies. But none of the above research papers
indicate any non-invasive methodology for chili quality
estimation for the export industry based on digital image
analysis. Also, there does not exist any instrument which can
efficiently assess the quality of chili in a fast and reliable
manner. In this paper, a novel attempt has been taken to
address the above problem, by using a conveyorized system
with machine vision technology, backed up by advanced
image processing algorithms, which leads to a quality
measurement procedure free from human intervention
thereby improving the productivity and accuracy. This paper
describes the experimental hardware setup with a schematic
diagram and image analysis techniques implemented to
assess the appearance-based chili quality parameters. A brief
testing and analysis results have also been described here
with a scope of future improvements.
II. MATERIALS AND METHODS
A. Experimental set-up
The schematic diagram of the system is shown in Fig. 1 and
the developed system is shown in Fig. 2. The system
comprises of three main parts, a conveyor, a sample feeding
cum spreading unit, and a machine vision module connected
with a PC or laptop through USB (universal serial bus). The
attached computer contains the machine vision software
developed in the Visual C++ programming language.
The conveyor comprises a specially designed non-
reflecting, textureless, uniform sky blue colored moving
belt, electro-mechanical set-up for smooth movement of the
belt, and a user-friendly control panel for controlling the
speed of the belt movement.
The sample feeding cum spreading unit comprises a hopper
where the chili sample is fed, a discharge chute where
samples are dropped from the hopper, a vibrator which is
mounted below the chute. The vibratory discharge chute is
used to separate the chili sample such that it appears as non-
connecting and non-overlapping when it passes on the
conveyor belt. The separation is done by using several
specially designed ‘S’ shaped, ‘V’ shaped, and ‘U’ shaped
metal separators mounted on the discharge chute. As the
chili sample passes through the separator, the lump of chili
samples separate from each other and drop on the conveyor
belt separately. A vibrator is used to vibrate the chute from
its bottom to help this separation process. Hopper, chute,
and other parts of the system which come to direct contact
with the sample are made of food-grade steel. A machine
vision module is placed on the conveyor belt such that the
chili sample passes below it when moving on the conveyor
belt. This module comprises of an enclosed cabinet, a digital
camera, and a uniform illumination arrangement. The
camera with illumination arrangement is placed inside the
closed cabinet to avoid the external disturbance due to the
change of ambient lighting condition. The camera is
connected with a computer through a USB interface. When
the chili sample is passed below the module, the camera
captures the images of chili, and the image is analyzed by
the machine vision software and the result is shown to the
user.
Fig. 1. Schematic block diagram of the developed system
B. Image Analysis
Digital Image Processing is one of the emerging areas in
advanced research to extract various important information
and features from the acquired images through some
complex algorithms and techniques. So, digital image
processing can be successfully applied here for quality
estimation of dry chili. The conveyor belt starts rotating by
pressing the start button on the control panel. About 1 Kg of
chili sample is poured into the hopper. The slider at the
bottom of the hopper is adjusted to control the flow of the
chili sample to the vibratory dispensing chute. The digital
camera acquires the image frame continuously with a speed
of 5 frames/ second. As the speed of the conveyor is slow as
compared to the image acquisition speed of the camera, the
camera may take the image of the same object multiple
times and produce an erroneous result during image analysis
due to multiple counting of the same object. To address the
above problem, a methodology has been provided to take
the image of a single object once by partitioning the
conveyor belt in several frames with white-colored strips.
The camera attached to the system continuously feeds the
live video stream of the chili sample (object) passing on the
moving conveyor belt to a computer. The developed
machine vision software analyzes the video streams and
searches those image frames which have two white strips in
predefined positions at the left and right side of the image.
Only those images are sent for further analysis to extract
ISSN No. (Online) - 2368-1209 ISSN No. (Print) - 2691-5944
American Journal of Advanced Computing IEM-ICDC 2020 Special Issue on "Computational Intelligence and Smart Information and Communication Technology" January 2021, Volume 1, Issue 1
19
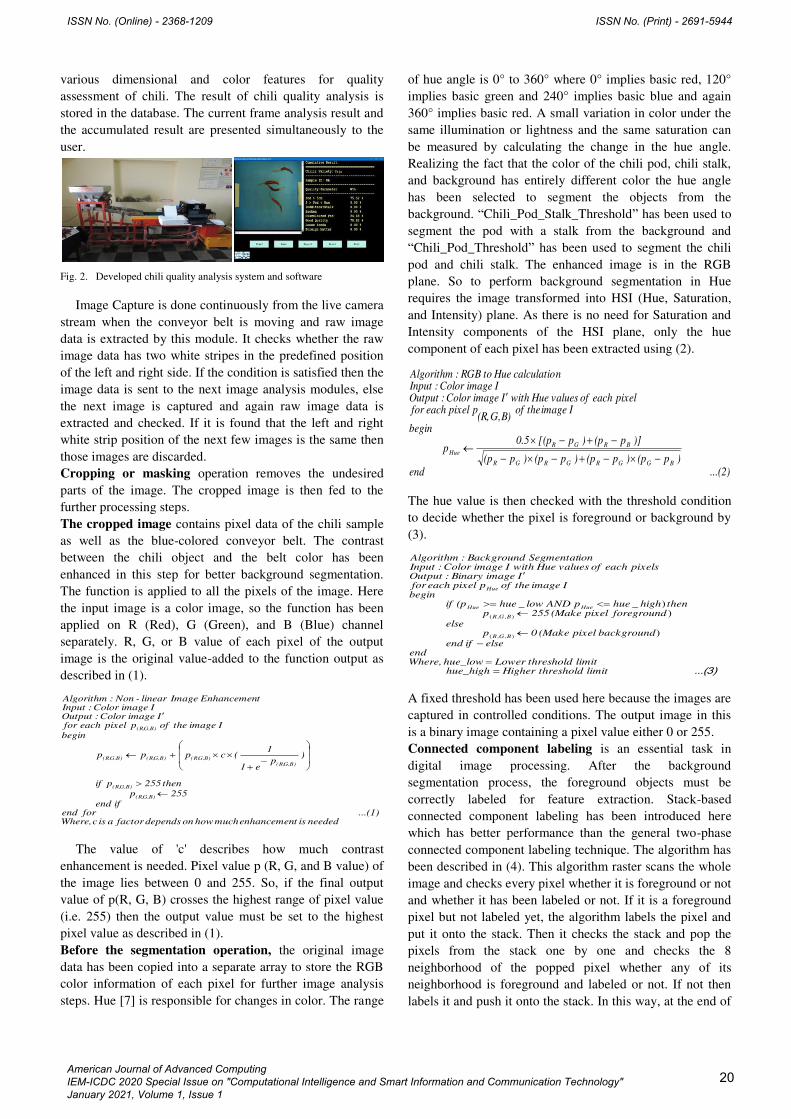
various dimensional and color features for quality
assessment of chili. The result of chili quality analysis is
stored in the database. The current frame analysis result and
the accumulated result are presented simultaneously to the
user.
Fig. 2. Developed chili quality analysis system and software
Image Capture is done continuously from the live camera
stream when the conveyor belt is moving and raw image
data is extracted by this module. It checks whether the raw
image data has two white stripes in the predefined position
of the left and right side. If the condition is satisfied then the
image data is sent to the next image analysis modules, else
the next image is captured and again raw image data is
extracted and checked. If it is found that the left and right
white strip position of the next few images is the same then
those images are discarded.
Cropping or masking operation removes the undesired
parts of the image. The cropped image is then fed to the
further processing steps.
The cropped image contains pixel data of the chili sample
as well as the blue-colored conveyor belt. The contrast
between the chili object and the belt color has been
enhanced in this step for better background segmentation.
The function is applied to all the pixels of the image. Here
the input image is a color image, so the function has been
applied on R (Red), G (Green), and B (Blue) channel
separately. R, G, or B value of each pixel of the output
image is the original value-added to the function output as
described in (1).
The value of 'c' describes how much contrast
enhancement is needed. Pixel value p (R, G, and B value) of
the image lies between 0 and 255. So, if the final output
value of p(R, G, B) crosses the highest range of pixel value
(i.e. 255) then the output value must be set to the highest
pixel value as described in (1).
Before the segmentation operation, the original image
data has been copied into a separate array to store the RGB
color information of each pixel for further image analysis
steps. Hue [7] is responsible for changes in color. The range
of hue angle is 0° to 360° where 0° implies basic red, 120°
implies basic green and 240° implies basic blue and again
360° implies basic red. A small variation in color under the
same illumination or lightness and the same saturation can
be measured by calculating the change in the hue angle.
Realizing the fact that the color of the chili pod, chili stalk,
and background has entirely different color the hue angle
has been selected to segment the objects from the
background. “Chili_Pod_Stalk_Threshold” has been used to
segment the pod with a stalk from the background and
“Chili_Pod_Threshold” has been used to segment the chili
pod and chili stalk. The enhanced image is in the RGB
plane. So to perform background segmentation in Hue
requires the image transformed into HSI (Hue, Saturation,
and Intensity) plane. As there is no need for Saturation and
Intensity components of the HSI plane, only the hue
component of each pixel has been extracted using (2).
The hue value is then checked with the threshold condition
to decide whether the pixel is foreground or background by
(3).
A fixed threshold has been used here because the images are
captured in controlled conditions. The output image in this
is a binary image containing a pixel value either 0 or 255.
Connected component labeling is an essential task in
digital image processing. After the background
segmentation process, the foreground objects must be
correctly labeled for feature extraction. Stack-based
connected component labeling has been introduced here
which has better performance than the general two-phase
connected component labeling technique. The algorithm has
been described in (4). This algorithm raster scans the whole
image and checks every pixel whether it is foreground or not
and whether it has been labeled or not. If it is a foreground
pixel but not labeled yet, the algorithm labels the pixel and
put it onto the stack. Then it checks the stack and pop the
pixels from the stack one by one and checks the 8
neighborhood of the popped pixel whether any of its
neighborhood is foreground and labeled or not. If not then
labels it and push it onto the stack. In this way, at the end of
neededistenhancemenmuchhowondependsfactoraiscWhere,...(1)for end
if end
255p
then255pif
)p
e1
1(cppp
begin
I imagetheofppixeleachfor I image Color :Output
I image Color :InputtEnhancemen Image linear-Non :Algorithm
B)G,(R,
B)G,(R,
B)G,(R,
B)G,(R,B)G,(R,B)G,(R,
B)G,(R,
...(2)end)p(p)p(p)p(p)p(p
)]p(p)p[(p0.5p
begin
I imagetheofB)G,(R,
ppixeleach forpixel each of values Hue withI image Color :Output
I image Color :Inputncalculatio Hue to RGB :Algorithm
BGGRGRGR
BRGR
Hue
...(3)limit threshold Higher hue_highlimit threshold Lower hue_low Where,
endelseifend
background pixel (Make 0p else
foreground pixel (Make 255p thenhighhuep AND lowhue(p if
beginI image the ofppixeleachfor
I imageBinary :Outputpixels each of values Hue withI image Color :Input
ion SegmentatBackground :Algorithm
BGR
BGR
HueHue
Hue
)
))__
),,(
),,(
ISSN No. (Online) - 2368-1209 ISSN No. (Print) - 2691-5944
American Journal of Advanced Computing IEM-ICDC 2020 Special Issue on "Computational Intelligence and Smart Information and Communication Technology" January 2021, Volume 1, Issue 1
20
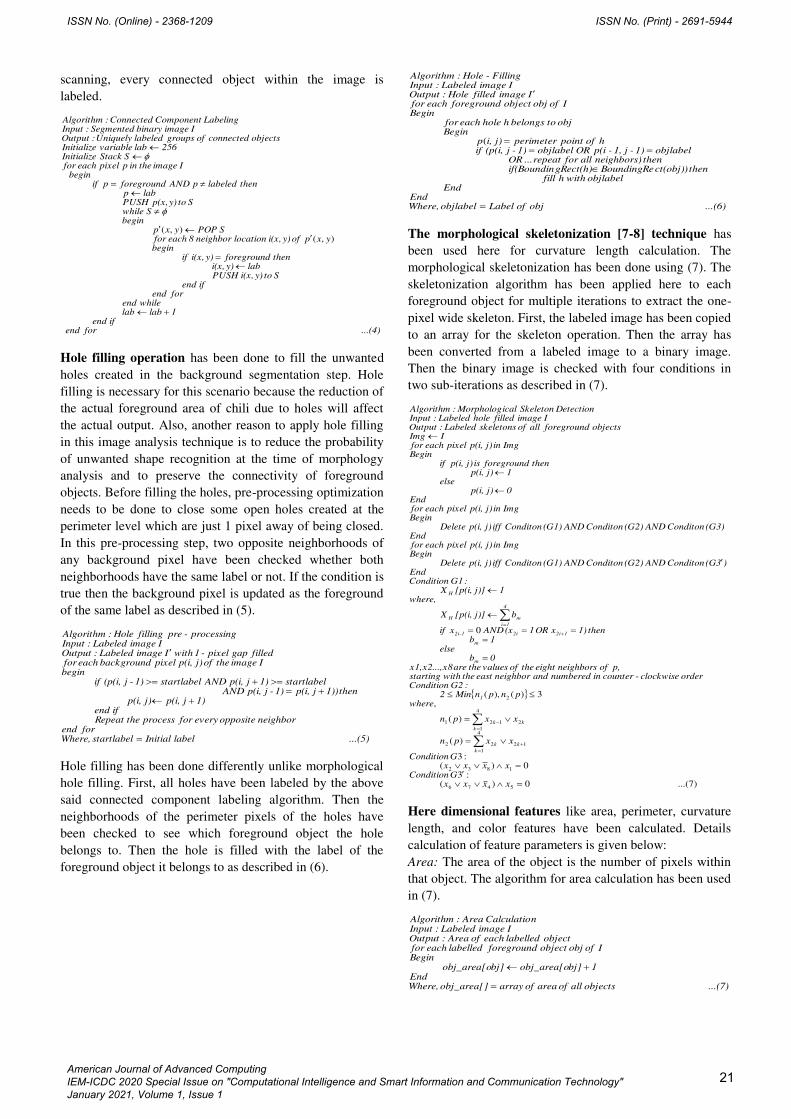
scanning, every connected object within the image is
labeled.
Hole filling operation has been done to fill the unwanted
holes created in the background segmentation step. Hole
filling is necessary for this scenario because the reduction of
the actual foreground area of chili due to holes will affect
the actual output. Also, another reason to apply hole filling
in this image analysis technique is to reduce the probability
of unwanted shape recognition at the time of morphology
analysis and to preserve the connectivity of foreground
objects. Before filling the holes, pre-processing optimization
needs to be done to close some open holes created at the
perimeter level which are just 1 pixel away of being closed.
In this pre-processing step, two opposite neighborhoods of
any background pixel have been checked whether both
neighborhoods have the same label or not. If the condition is
true then the background pixel is updated as the foreground
of the same label as described in (5).
Hole filling has been done differently unlike morphological
hole filling. First, all holes have been labeled by the above
said connected component labeling algorithm. Then the
neighborhoods of the perimeter pixels of the holes have
been checked to see which foreground object the hole
belongs to. Then the hole is filled with the label of the
foreground object it belongs to as described in (6).
The morphological skeletonization [7-8] technique has
been used here for curvature length calculation. The
morphological skeletonization has been done using (7). The
skeletonization algorithm has been applied here to each
foreground object for multiple iterations to extract the one-
pixel wide skeleton. First, the labeled image has been copied
to an array for the skeleton operation. Then the array has
been converted from a labeled image to a binary image.
Then the binary image is checked with four conditions in
two sub-iterations as described in (7).
Here dimensional features like area, perimeter, curvature
length, and color features have been calculated. Details
calculation of feature parameters is given below:
Area: The area of the object is the number of pixels within
that object. The algorithm for area calculation has been used
in (7).
...(4)for endif end
1lablab whileend
for endif end
Sto y)i(x, PUSHlaby)i(x,
then foregroundy)i(x, ifbegin
yxp of y)i(x, location neighbor 8 each for SPOPyxp
begin Swhile
Sto y)p(x, PUSHlabp
then labeled p AND foregroundp ifbegin
I image the in p pixel each for S StackInitialize
256lab variable Initializeobjects connected of groups labeledUniquely :Output
I imagebinary Segmented:InputLabeling Component Connected :Algorithm
),(),(
...(5)label Initialstartlabel Where,for end
neighbor oppositeevery for process the Repeatif end
1)jp(i,j)p(i, then1))jp(i,1)-jp(i, AND
startlabel1)jp(i, AND startlabel1)-j(p(i, ifbegin
I image the of j)p(i,pixel background eachforfilled gap pixel-1 withI image Labeled :Output
I image Labeled :Inputprocessing-pre filling Hole :Algorithm
...(6)obj of Labelobjlabel Where,End
Endobjlabel withh fill
then ct(obj))BoundingRegRect(h)if(Boundin thenneighbors) all forrepeat...OR
objlabel1)-j1,-p(i OR objlabel1)-j(p(i, ifh of point perimeterj)i,p
Beginobj to belongs h hole eachfor
BeginI ofobj object foreground each for
I image filled Hole :OutputI image Labeled :Input
Filling-Hole :Algorithm
(
)7...(0)(:3
0)(:3
)(
)(
,3)(),(
0
5476
1832
4
1
1222
4
1
2121
2
xxxxGCondition
xxxxGCondition
xxpn
xxpn
wherepnpnMin2
:G2 Conditionorder clockwise-counter in numbered and neighbor east the withstarting
p, of neighbors eight the of values the arex8x2...,x1,0b
else1b
then 1)x OR 1(x AND x if
bj)][p(i,X
where,1j)][p(i,X
:G1 ConditionEnd
)3(G Conditon AND (G2) Conditon AND (G1) Conditon iff j)p(i, DeleteBegin
Img in j)p(i, pixel each forEnd
(G3) Conditon AND (G2) Conditon AND (G1) Conditon iff j)p(i, DeleteBegin
Img in j)p(i, pixel each forEnd
0j)p(i,else
1j)p(i,then foreground is j)p(i, if
BeginImg in j)p(i, pixel each for
IImg objects foreground all of skeletonsLabeled :Output
I image filled hole Labeled :InputDetection Skeletonical Morpholog:Algorithm
k
kk
k
kk
1
m
m
12i2i1-2i
4
1i
mH
H
...(7)objectsallofareaofarrayobj_area[] Where,End
1bj]obj_area[obj]obj_area[oBegin
I ofobj object foreground labelled each forobject labelled each of Area :Output
I image Labeled :InputnCalculatio Area :Algorithm
ISSN No. (Online) - 2368-1209 ISSN No. (Print) - 2691-5944
American Journal of Advanced Computing IEM-ICDC 2020 Special Issue on "Computational Intelligence and Smart Information and Communication Technology" January 2021, Volume 1, Issue 1
21
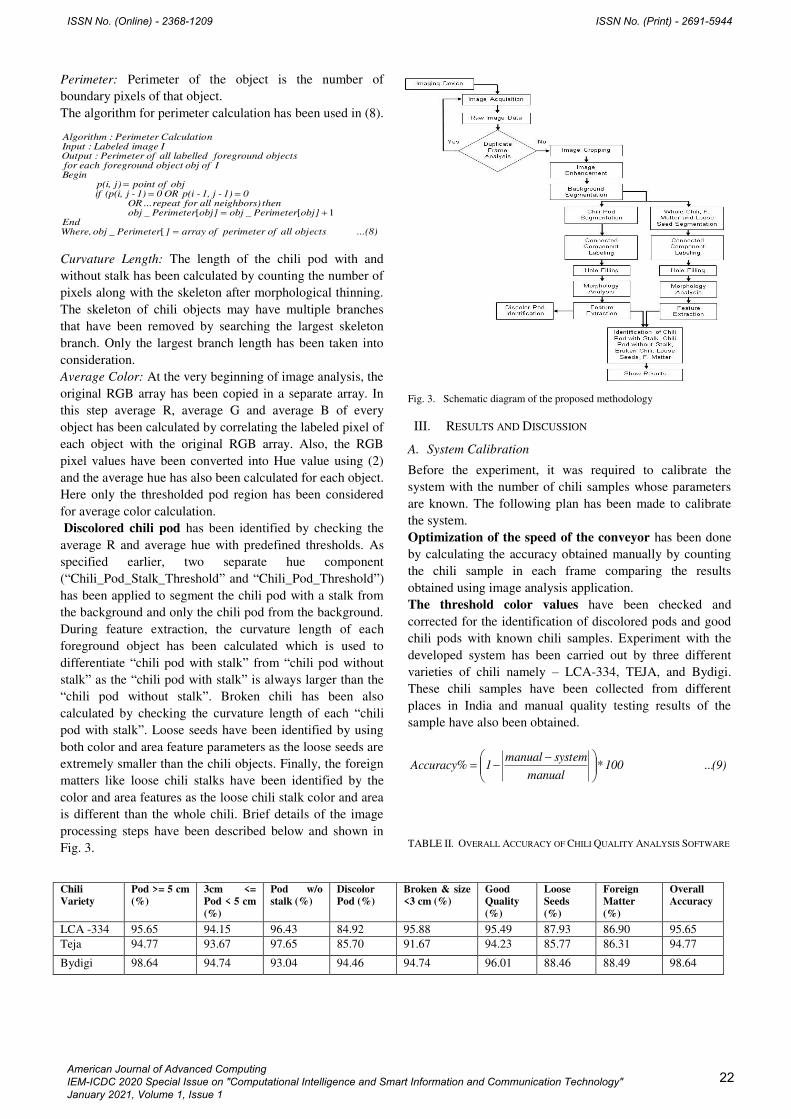
Perimeter: Perimeter of the object is the number of
boundary pixels of that object.
The algorithm for perimeter calculation has been used in (8).
Curvature Length: The length of the chili pod with and
without stalk has been calculated by counting the number of
pixels along with the skeleton after morphological thinning.
The skeleton of chili objects may have multiple branches
that have been removed by searching the largest skeleton
branch. Only the largest branch length has been taken into
consideration.
Average Color: At the very beginning of image analysis, the
original RGB array has been copied in a separate array. In
this step average R, average G and average B of every
object has been calculated by correlating the labeled pixel of
each object with the original RGB array. Also, the RGB
pixel values have been converted into Hue value using (2)
and the average hue has also been calculated for each object.
Here only the thresholded pod region has been considered
for average color calculation.
Discolored chili pod has been identified by checking the
average R and average hue with predefined thresholds. As
specified earlier, two separate hue component
(“Chili_Pod_Stalk_Threshold” and “Chili_Pod_Threshold”)
has been applied to segment the chili pod with a stalk from
the background and only the chili pod from the background.
During feature extraction, the curvature length of each
foreground object has been calculated which is used to
differentiate “chili pod with stalk” from “chili pod without
stalk” as the “chili pod with stalk” is always larger than the
“chili pod without stalk”. Broken chili has been also
calculated by checking the curvature length of each “chili
pod with stalk”. Loose seeds have been identified by using
both color and area feature parameters as the loose seeds are
extremely smaller than the chili objects. Finally, the foreign
matters like loose chili stalks have been identified by the
color and area features as the loose chili stalk color and area
is different than the whole chili. Brief details of the image
processing steps have been described below and shown in
Fig. 3.
Fig. 3. Schematic diagram of the proposed methodology
III. RESULTS AND DISCUSSION
A. System Calibration
Before the experiment, it was required to calibrate the
system with the number of chili samples whose parameters
are known. The following plan has been made to calibrate
the system.
Optimization of the speed of the conveyor has been done
by calculating the accuracy obtained manually by counting
the chili sample in each frame comparing the results
obtained using image analysis application.
The threshold color values have been checked and
corrected for the identification of discolored pods and good
chili pods with known chili samples. Experiment with the
developed system has been carried out by three different
varieties of chili namely – LCA-334, TEJA, and Bydigi.
These chili samples have been collected from different
places in India and manual quality testing results of the
sample have also been obtained.
TABLE II. OVERALL ACCURACY OF CHILI QUALITY ANALYSIS SOFTWARE
...(8)objects all of perimeter ofarray ]erimeterPobj Where,End
obj]Perimeterobjobj]erimeterPobjthenneighbors) all forrepeat...OR
01)-j1,-p(i OR 01)-j(p(i, ifobj of point j)p(i,
BeginI ofobj object foreground each for
objects foreground labelled all of Perimeter :OutputI image Labeled :Input
nCalculatio Perimeter :Algorithm
[_
1[_[_
(9)100*manual
systemmanual1Accuracy% ...
Chili
Variety
Pod >= 5 cm
(%)
3cm <=
Pod < 5 cm
(%)
Pod w/o
stalk (%)
Discolor
Pod (%)
Broken & size
<3 cm (%)
Good
Quality
(%)
Loose
Seeds
(%)
Foreign
Matter
(%)
Overall
Accuracy
LCA -334 95.65 94.15 96.43 84.92 95.88 95.49 87.93 86.90 95.65
Teja 94.77 93.67 97.65 85.70 91.67 94.23 85.77 86.31 94.77
Bydigi 98.64 94.74 93.04 94.46 94.74 96.01 88.46 88.49 98.64
ISSN No. (Online) - 2368-1209 ISSN No. (Print) - 2691-5944
American Journal of Advanced Computing IEM-ICDC 2020 Special Issue on "Computational Intelligence and Smart Information and Communication Technology" January 2021, Volume 1, Issue 1
22

B. Performance testing
Performance testing was conducted with controlled chili
samples by comparing manual counting and system-
generated data. Every single testing has been conducted
with 1 Kg. of the chili sample. All quality parameter like
[Pod >= 5 cm], [3cm <= Pod < 5 cm], [Pod w/o stalk],
[Discolor Pod], [Broken & size <3 cm], [Good Quality],
[Loose Seeds] and [Foreign Matter] have been compared
with the manual results in each testing. The accuracy% of
the system has been calculated by (9) where the deviation
between the manual measurement and system measurement
has been taken into account and the accuracy has been
calculated accordingly and has been shown in Table- 2. The
average accuracy has been found in the tune of 96%. The
overall throughput of the system has also been calculated
during the testing and compared with the current manual
quality analysis process. As shown in Table-3, 1 kg
(Approx. 2000 nos.) of chili can be analyzed using the
developed system in 5 minutes which is quite less than the
manual analysis which takes 15-20 minutes.
TABLE I. PERFORMANCE ANALYSIS
IV. CONCLUSION
The developed instrument will be helpful for the quality
estimation of chili. The instrumental analysis will reduce the
dependency on human perception & reduce the requirement
of expert manpower. It will increase the performance of the
grading operation in terms of accuracy & consistency. Again,
the overall accuracy of 90% is quite encouraging and
establishes that the system can be used successfully in the
quality measurement of red chilies. Finally, the system
would be more realistic if the variety wise sorting would also
be done within the system through some automation.
Currently, the developed system has been successfully
deployed at the Agricultural produce market committee
(APMC), Karnataka, and at a few locations of Agricultural
Market Committee (AMC), Andhra Pradesh.
REFERENCES
[1] Post-Harvest Profile of Chili”, GOVERNMENT OF INDIA,
MINISTRY OF AGRICULTURE,(DEPARTMENT OF AGRICULTURE & COOPERATION),NAGPUR, 2009
[2] Nonnecke, I.L. "Vegetable Production", Van Nostrand Reinhold, NY (1989).
[3] Husin, Z.B.; Shakaff, A.Y.B.M.; Aziz, A.H.B.A.; Farook, R.B.S.M., "Feasibility Study on Plant Chili Disease Detection Using Image Processing Techniques," Intelligent Systems, Modelling and Simulation (ISMS), 2012 Third International Conference on , vol., no., 8-, pp.291- 296, 10 Feb. 2012.
[4] Narendra V G, Hareesh K S, “Prospects of Computer Vision Automated Grading and Sorting Systems in Agricultural and Food Products for Quality Evaluation”, International Journal of Computer Applications, Volume 1 – No. 4, 2010.
[5] Ataş, Musa &Yardımcı, Yasemin&Temizel, Alptekin. (2012). A new approach to aflatoxin detection in chili pepper by machine vision. Computers and Electronics in Agriculture. 87. 129-141. 10.1016/j.compag.2012.06.001.
[6] NafisKhuriyati, Agung Putra Pamungkas ,AnggraitoAgung P, “The Sorting and Grading of Red Chilli Peppers (Capsicum annuum L.) Using Digital Image Processing”, SSRG International Journal of Agriculture & Environmental Science (SSRG-IJAES), Volume 6 Issue 4 – July - Aug 2019.
[7] R C Gonzalez & R E Woods, “Digital Image Processing” Addition- Wesley Publishing Company, 1992.
[8] Kong, T. Yung and Azriel Rosenfeld, Topological Algorithms for Digital Image Processing, Elsevier Science, Inc., 1996.
[9] https://www.ncdex.com/Downloads/ProductNote/Chilli_Teja_PN_17072017.pdf
Performance parameters Values
Chili sample 1 Kg
Quantity Approx. 2200 nos.
Manual Inspection time 15 -20 minutes
Machine inspection time less than 5 minutes
ISSN No. (Online) - 2368-1209 ISSN No. (Print) - 2691-5944
American Journal of Advanced Computing IEM-ICDC 2020 Special Issue on "Computational Intelligence and Smart Information and Communication Technology" January 2021, Volume 1, Issue 1
23
Mobile Application Development for West Bengal
Tourism
Moumita Naskar IT Courseware Engineering
Jadavpur University Kolkata, India
Prof. Matangini Chattopadhyay School of Education Technology
Jadavpur University Kolkata, India
Abstract—Mobile applications are extremely popular
nowadays as people can access it whenever they want.
Smartphone users are increasing worldwide and thus, mobile
application is gaining popularity. On the other hand, tourism is
one of the most important sectors of any country or state’s
economy and one of a very few ways of earning foreign currency.
However, this new era of technology has made everything very
easy including tourism. People can plan and execute their entire
vacation using just their smartphones. In this paper, a mobile
application for West Bengal Tourism is proposed and is
developed for android based mobile phones. This application
will be useful for the users who are willing to visit West Bengal
and therefore need an application that can guide them for
planning and organizing their trip. West Bengal Tourism app
will provide the user all the information that they need for
planning a trip to West Bengal. The key aspect of this app is that
it allows the user to find detailed information for making a trip
to West Bengal (Abstract)
Keywords— Mobile Application, Android Studio, Tourism,
Destination, User Authentication, West Bengal.
I. INTRODUCTION
Tourism is one of the major sources of income for any state and country and thus they take extra measurements for making the tourism more attractive. People nowadays are considering travel for taking a break from their daily hectic schedule. Apart from that there are a lot of people who loves to explore different places, people and their culture, its origin and more. However, sometimes it becomes very complicated to plan the entire trip as most of the people don’t have enough information regarding the place they are visiting as well as the mode of transportation that can be suitable for that trip. In this era of technology, people are very much dependent on their smartphones for every little things of their lives. Therefore, a mobile application dedicated to the tourism of West Bengal can prove to be helpful for people who are deciding to take a vacation there. There are a lot of tourism apps for android phones but this app is particularly dedicated for West Bengal as this state is full of beautiful places for hill station to forests and enriched with various culture and people. It allows the users to create a distinct account for themselves and operate everything from that account. This app also allows the user to find flights, trains and hotels in West Bengal. Admins can handle the database using the same app and are able to make primary changes to both the app and database. Lastly, personal data of both admin and users will be kept in a secure manner in the database.
Rest of the paper is organized as follows. Section 2 contains Related Works which describes other papers on similar mobile applications, already published in various
journals. Section 3 contains system architecture along with the proposed solution as well as the detailed design of the application and database structure. Section 4 contains detailed description of implementation and its result, followed by section 5 which contains conclusions and future works.
II. RELATED WORK
Tobing, Roy Deddy Hasiholan [1] designed and developed an Android based tourism mobile application. The application displays information related to the tourism of Samosir Regency. There are three components for developing the tourism application. This application uses the web services in order to connect the front end of the application with the backend application. JSON format is used for wrapping the messages that are used for communications. Visit Samosir is the front-end application as well as the main function of the application. Taxonomy for mobile application for tourism is used as the design base of the front-end part. This mobile application is suitable for three out of seven categories in the taxonomy classifications.
Alrehili et al. [2] mentioned in their paper that they have designed and developed an application, Taibah Visitor, that will be used as a guiding system for the tourists who will be visiting Al Madinah. They have explained that in traditional system people waste a huge amount of money on the experts to guide them during the tour but this application comes with an easy interface that will help them save both money and time. Therefore, this mobile application will help them to find those places without putting any effort. Taibah Visitor application will help the users to find their desired places in an effective way by using filters based on rating, distance between places and unique features like vegetarian food or places available for disabled people.
Artemenko, Olga, Volodymyr Pasichnyk, and Na-talia Kunanec [3] designed a hybrid recommender system based on e-tourism mobile location and context evaluation. This recommender system recommends the users about three types of places which include predictable points for destination. In this category, users get the closest points to their current location and those locations are subjected to their signification class. Another one is prediction of places that are new as well as of interests of the users. Third one includes a set of various localized routes. Authors have mentioned that if the sensory devices are used from the smartphones of the users then that will be more helpful for the recommendation system to provide better and more information about the present state of the current route of the users. This in turn, helps the application in case of improving the quality of the recommendation that it suggests by combining the contextual
ISSN No. (Online) - 2368-1209 ISSN No. (Print) - 2691-5944
American Journal of Advanced Computing IEM-ICDC 2020 Special Issue on "Computational Intelligence and Smart Information and Communication Technology" January 2021, Volume 1, Issue 1
24

tools of analysis and classical techniques of alternative generations.
Calibo, Iris, Caballero, and Virata [4] have used agile methodology in their project as it is more flexible and anticipate changes in a better way. In their paper they have showed the position of M-Commerce model in the tourism industry and their first motive is to create a relationship between the m-commerce model and socio-economic transformation. They have reached to some conclusions in their paper. First one mentions that business community which are developing must address the socio-economic transformation by strategically embracing the innovation. In this paper, the authors have focused on the development of an m-commerce solution of the tourism business problem and they have successfully met the user’s expectations.
Dwaaraknath, Ashok, Dinesh Kumar, Sahana [5] designed an application for predicting the budget of a tour with the help of mobile computing using the needs in real time location and complete requirements. Default categories are available in the cloud database whereas the guidance of various tourist spots is provided along with multiple information about each and every tourist spot such as map, SOS emergency, location, direction and much more. This application also provides an opportunity for establishing parameters that helps in interpretation of route planner even before route planning. This application also helps in determining the capacity of the users to plan any journey and their awareness regarding the vehicles.
Kontogianni and Aepis [6] in their paper have reviewed a wide range of pre-existing papers from the field of smart tourism, they mentioned in their paper that in order to build a strong foundation and gain further advancement a proper literature survey is necessary as it helps in finding the area and challenges that need further research. They have identified some useful and popular concepts and approaches in the field of smart tourism along with some major challenges in this field. One of such major challenges that they have pointed out is continuously increasing data size. Therefore, the available information is becoming overwhelming. They have identified recommender system, IoT, context awareness, real time, big data and augmented reality as the contributing factors for the field of smart tourism that need more researches.
Naramski and Herman [7] in their paper mentioned that their main objective is to measure the way mobile applications can be developed based on the tourist spots of Upper Silesia region of Poland. There are two industrial sites in that have been inscribed in the list of World Heritage Site’s list by UNESCO. They have focused on 14 mobile application which are capable of finding restaurants, hotels and attractive tourist spots. The entire paper is divided in two sections, where the first one provides a literature review on the usage of digital technology in the field of tourism. Second part is where they have examined the functionality of those existing tourist application for that region and compared the results.
III. DESIGN AND SYSTEM ARCHITECTURE
A. System Architecture
The application is a two-tier system. The first tier includes user devices i.e., smartphones. Those devices can communicate with the second tier with the help of internet. The second tier includes the database system which stores different data and based on the client requests data are fetched
from the database in order to fulfil those recommendation. Firebase, which is a real time database has been used in the development of the proposed tourism app.
B. Proposed App
We have proposed the idea of developing a mobile application that will be helpful for tourism in West Bengal. This application will provide all the information that one will need before making a trip to this state. It will guide them to select the places they want to visit based on the nature and culture of the place. Moreover, this app will provide the user all the information about the transportation that will be useful for them to make this trip happen. As the users will be in West Bengal for a vacation it will be very common for them not to have any idea which mode of transport will be useful for them within the state. Therefore, they can check the buses and trains that are available from the place they are in to the place they want to visit. Based on those information users will be able to make a proper decision.
The key feature of this application that will stand out from other applications include:
• This application will provide the opportunity for secure registration and login to the user, which will keep their information secured in the database.
• Cities and districts are categorized based on the geographical description which will help the user to decide whether they want to visit that place.
• Each and every district of West Bengal is organized along with the information of the tourist spot so that user do not miss out anything.
• It also provides the facility of checking flights from different cities to Kolkata.
C. Detailed Description of West Bengal Tourism App
This West Bengal Tourism App is divided into two modules, one for the users and another for the admin. The users use that application based on their demand whereas the admin will monitor, control and update the databases as well as the entire application based on the requirement. Fig. 1 shows the flowchart of the application that describes the way West Bengal application is working.
1) Admin Module In this West Bengal Tourism app, we have a separate
admin module and users will not have access to it. Admin will get the access of that module by selecting the admin login option where admin can use his login credentials that have been used during the time of registration.
Admin are able to do the following things.
• Register and login to the admin module.
• Add new flight, train and hotel records in the database.
• Delete any records from the database based on the scenario.
• Update any particular information in the database if that is needed.
• Find any record from the database if necessary.
2) User Module
ISSN No. (Online) - 2368-1209 ISSN No. (Print) - 2691-5944
American Journal of Advanced Computing IEM-ICDC 2020 Special Issue on "Computational Intelligence and Smart Information and Communication Technology" January 2021, Volume 1, Issue 1
25

Users will be given the opportunity to register themselves so that they can use this application from their own account and their activities will be separated in their own account from the other users. New users have to register at the beginning so that their login credentials can be stored in the application database. Users who have already registered can use their registered user id that is their email id and password in order to login into their account. After successful login, the user will be able to choose multiple menus form the grid view. They will be able to get the idea of districts that they can visit during that trip and which tourist spots are located in those districts along with the historical and geographical knowledge of that particular district. Moreover, from this application, tourists will get to know about various festivals and culture of West Bengal which are famous worldwide. There are so many tourists who love to visit places and try the local authentic cuisines. Therefore, this app contains a particular activity where name of the authentic Bengali foods will be there along with the images so that tourists will get an idea about the food they should try. They can check flights that are available from different states to Kolkata. They can check trains and their availability from one place to another in West Bengal.
Fig. 1. Flow Chart
D. Database Design
Databases are implemented in Firebase database which is a Realtime database.
• The train database which contains all the train records. It has five field including, atime (arrival time), dtime (Departure time), to, from and price, that is price of the ticket.
• The flight database which contains all the flight records. It has five field including, landtime (landing
time), depart-time (Departure time), to, from and price, that is price of the ticket.
• The hotel database contains all the hotel records. It has four fields including, hotel name(name), location, contact and rate per day (ratepd), that is price of a single for one day.
• The user database contains all the user records. It has four fields including, user name(name), email, contact and password. Email and password will be stored in firebase authentication, which will have the same unique id.
• The admin database contains all the admin records. It has four fields including, admin name (name), email, contact and password. This data will be used for admin login.
• Firebase authentication stores the users’ email and password under the same unique user id so that users can login to their specific account.
• Firebase storage stores all kinds of image that have been used in the application. User folder stores images of user’s profile picture, district folders contain district images, festival folders contain festival images, food folders contain food images.
IV. IMPLEMENTATION AND RESULT
The West Bengal Tourism application is developed to work on Android operating system. It is developed using xml and Java programming language. This application is developed in android studio and installed in mobile phone after building apk. The application is running successfully after installing it in multiple mobiles having android 8 as OS.
Fig. 2 shows the registration activity of the user module of the application. Here a user puts their details and select the register button. When the user presses the register button, at first his/her email id and password will be saved to the firebase authentication which will use this two information in future for authenticate the user while the user signs in to the app. When the email id entered by the users stored in the firebase authentication, a verification mail will be sent to that particular email id to check whether the email id is valid or not. If the user is already registered then user can go to the login activity by clicking the sign in link as shown in Fig. 2.
Fig. 3 shows the login activity where users can provide the email id and password that they have entered while registration. If the password and email id match then the user will be redirected to the home activity.
Fig. 4 shows the home activity of the application which displays a grid view with two columns and multiple rows containing various part of the user module. User can select any of the options and visit the activity dedicated to that functionality.
Fig. 5 shows my profile activity for the users. Here, users can see their details that they have entered during registration. These data that are shown are fetched from the user database. The ‘Email not verified’ part at the top is shown because the user did not verify the email using the link that was sent while registration. Users can click the verify button below and get the verification mail again. Once the user verifies his/her email, these texts and verify button will no longer be visible in my profile activity. Users can click the LOGOUT button
ISSN No. (Online) - 2368-1209 ISSN No. (Print) - 2691-5944
American Journal of Advanced Computing IEM-ICDC 2020 Special Issue on "Computational Intelligence and Smart Information and Communication Technology" January 2021, Volume 1, Issue 1
26

and close their account. They can click the EDIT PROFILE button and go to edit profile activity.
Fig. 6 shows the destination list activity where the users will be redirected after clicking Destinations option from the grid view in the home activity of user module.
Fig. 7 shows the district list activity where the users will be redirected after clicking districts option from the grid view in the home activity of user module. Each of the item in the district list will redirect the users to another activity dedicated to that particular district.
Fig. 8 shows the activity dedicated to the hill station destinations of West Bengal whereas Fig. 9 shows Forest, Fig. 10 Shows Pilgrimage, Fig. 11 shows Historical places and Fig. 12 shows Cultural Hotspot as other destinations.
Fig. 13 shows the Emergency contact options list where users will be redirected when they select emergency contact option from the home activity. When users will select items from the emergency contact list, they will be directed to same activity but the information will change according to the item selected. Fig. 14 shows the activity when item hospital is selected from the emergency contact list. Fig. 15 shows the Culture and Festival activity where users will get information of various festivals that are celebrated in Bengal whereas Fig. 16 will show Food activity where information about various authentic Bengali cuisines are provided.
Fig. 17 shows the activity for Kolkata district. Similar activities are there in the application dedicated to other districts.
Fig. 18 shows the process of entering data. When the record is successfully added to the database, a message of ‘Data inserted’ will be shown in the application. Fig. 19 shows update and delete record activity. As we can see 6500 was inserted as ticket price but admin has changed it to 6300. If Admin clicks the UPDATE button, the ticket price will be changed to 6300 from 6500 and the message will be shown that ‘Flight record updated successfully’ as an indication that the job is done. Fig. 20 shows the activity where admin will be redirected after selecting Read Data Button (Fig. 18). Admin will get all the records in the database in this activity
Fig. 2 Fig. 3 Fig. 4
Fig.5 Fig. 6 Fig. 7
Fig. 8 Fig. 9 Fig. 10
Fig. 11 Fig. 12 Fig. 13
Fig. 14 Fig. 15 Fig. 16
ISSN No. (Online) - 2368-1209 ISSN No. (Print) - 2691-5944
American Journal of Advanced Computing IEM-ICDC 2020 Special Issue on "Computational Intelligence and Smart Information and Communication Technology" January 2021, Volume 1, Issue 1
27
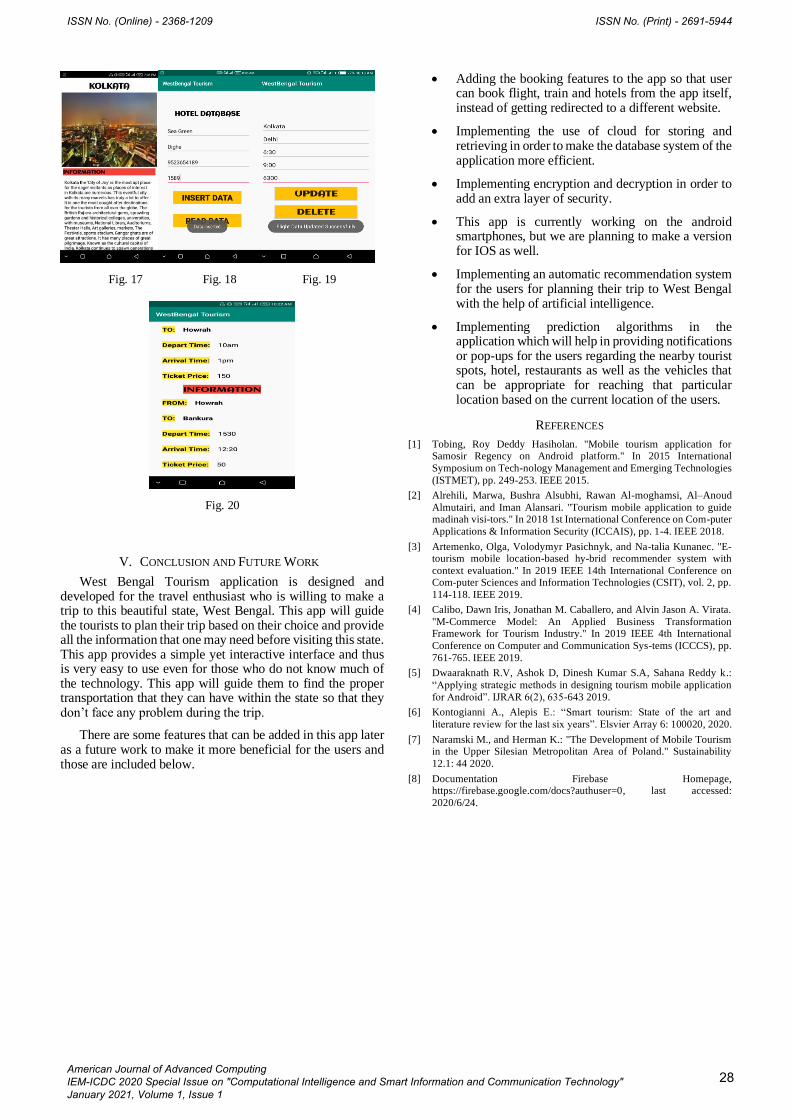
Fig. 17 Fig. 18 Fig. 19
Fig. 20
V. CONCLUSION AND FUTURE WORK
West Bengal Tourism application is designed and developed for the travel enthusiast who is willing to make a trip to this beautiful state, West Bengal. This app will guide the tourists to plan their trip based on their choice and provide all the information that one may need before visiting this state. This app provides a simple yet interactive interface and thus is very easy to use even for those who do not know much of the technology. This app will guide them to find the proper transportation that they can have within the state so that they don’t face any problem during the trip.
There are some features that can be added in this app later as a future work to make it more beneficial for the users and those are included below.
• Adding the booking features to the app so that user can book flight, train and hotels from the app itself, instead of getting redirected to a different website.
• Implementing the use of cloud for storing and retrieving in order to make the database system of the application more efficient.
• Implementing encryption and decryption in order to add an extra layer of security.
• This app is currently working on the android smartphones, but we are planning to make a version for IOS as well.
• Implementing an automatic recommendation system for the users for planning their trip to West Bengal with the help of artificial intelligence.
• Implementing prediction algorithms in the application which will help in providing notifications or pop-ups for the users regarding the nearby tourist spots, hotel, restaurants as well as the vehicles that can be appropriate for reaching that particular location based on the current location of the users.
REFERENCES
[1] Tobing, Roy Deddy Hasiholan. "Mobile tourism application for Samosir Regency on Android platform." In 2015 International
Symposium on Tech-nology Management and Emerging Technologies
(ISTMET), pp. 249-253. IEEE 2015.
[2] Alrehili, Marwa, Bushra Alsubhi, Rawan Al-moghamsi, Al–Anoud
Almutairi, and Iman Alansari. "Tourism mobile application to guide madinah visi-tors." In 2018 1st International Conference on Com-puter
Applications & Information Security (ICCAIS), pp. 1-4. IEEE 2018.
[3] Artemenko, Olga, Volodymyr Pasichnyk, and Na-talia Kunanec. "E-tourism mobile location-based hy-brid recommender system with
context evaluation." In 2019 IEEE 14th International Conference on Com-puter Sciences and Information Technologies (CSIT), vol. 2, pp.
114-118. IEEE 2019.
[4] Calibo, Dawn Iris, Jonathan M. Caballero, and Alvin Jason A. Virata.
"M-Commerce Model: An Applied Business Transformation Framework for Tourism Industry." In 2019 IEEE 4th International
Conference on Computer and Communication Sys-tems (ICCCS), pp.
761-765. IEEE 2019.
[5] Dwaaraknath R.V, Ashok D, Dinesh Kumar S.A, Sahana Reddy k.:
“Applying strategic methods in designing tourism mobile application
for Android”. IJRAR 6(2), 635-643 2019.
[6] Kontogianni A., Alepis E.: “Smart tourism: State of the art and
literature review for the last six years”. Elsvier Array 6: 100020, 2020.
[7] Naramski M., and Herman K.: "The Development of Mobile Tourism in the Upper Silesian Metropolitan Area of Poland." Sustainability
12.1: 44 2020.
[8] Documentation Firebase Homepage, https://firebase.google.com/docs?authuser=0, last accessed:
2020/6/24.
ISSN No. (Online) - 2368-1209 ISSN No. (Print) - 2691-5944
American Journal of Advanced Computing IEM-ICDC 2020 Special Issue on "Computational Intelligence and Smart Information and Communication Technology" January 2021, Volume 1, Issue 1
28

A Review on SQL Injection Attack in Internet of
Things
Sarwath Unnisa
Phd CS , CHRIST (Deemed to be University)
Bangalore, India
Vijayalakshmi A
Assistant Professor, CHRIST (Deemed to be University)
Bangalore, India
Abstract- The term IoT (Internet of things) is not just a mere
technology but has enabled the life of human beings to become
easy as it furnishes their needs and makes their life stress-free.
Hence, IoT has been widely used in home automations,
security, health care and many other aspects of life. Security is
a major concern for IoT as they generate huge amount of data.
There are multitudes of attacks in IoT networks in order to
steal sensitive information. SQL (structured query language)
injection attack is one among them. The core purpose of this
paper is to highlight various attacks in IoT and focus on
different categories of SQL injection attacks and why it is very
necessary to prevent it.
Keywords—SQL injection, IoT application, Types of
SQLIA
I. INTRODUCTION
The idea of IoT was originated by an associate of the
RFID community in 1999 [1]. Considering a world full of
objects that sense, these objects are connected via public
and private networks. These objects have enormous data
which is collected and evaluated. This is called as Internet
of things. IoT is formally defined as a network of physical
objects. Internet has evolved from being a network of
computers to network of devices of every size and type
which constitute vehicles, smart phones, cameras and toys
[1] . IoT is a technology which helps many devices and
objects to connect via internet thereby allowing these
objects to communicate with each other. It enables
connecting users with devices which offer certain service.
The notion here is that the IoT device can communicate
with the network. The main concern is that since these
devices are connected via internet, developing a security
defense is very difficult as they are prone to various
unforeseen threats[2].
Fig. 1: IoT end users and application area based on data [3]
Use cases of Internet of Things are vast as seen in figure
1, as services provided by IoT are available to the
consumer side anywhere, anytime and at anyplace. Its
applications range from transport, logistics, traffic, smart
parking, health sector, entertainment sector, retail sector
etc. Its applications target the policy makers, personal
care, and doctor/care givers[3]. Since the applications are
vast and many clients’ personal data is at risk, any kind of
attack will be of concern.
The various kinds of attacks are physical attack, side
channel attack, cryptanalysis attack, software attack and
network attacks as seen in figure 2.
Physical attacks tamper hardware and require
expensive material to perform the attack and
hence this attack is very difficult. For an instance
such as layout reconstruction, de-packaging of
chips etc.
Side channel attacks come under those attacks
which deals with encrypted data and these are
based on the side channel. Attacks such as timing
attack, environment attack, fault analysis attack
come under this category.
Cryptanalysis attacks occur when an attacker
tries to decode the encryption key and obtain
crucial information such as plain text. Attacks
under this category are cipher text only attack,
known plain text attack, man in the middle attack
etc.
Software attacks are one of the main reasons for
vulnerability in all systems. Such attacks exploit
buffer overflow and use Trojan horse programs,
worms and viruses to insert malicious codes in
system. For example such as jamming attacks in
which many noise packets will be put in the
network.
Network attacks are the last form of attacks
which are the most vulnerable as it effects the
wireless systems. The attacks in this are
categorized into active and passive attacks.
Passive attack means the system will be scanned
to check for open ports and this will be exploited.
Example of passive attack includes
eavesdropping, Traffic analysis, camouflage
adversaries etc.
Examples of active attacks include denial of
service attacks, node subversion, node
malfunction, node capture, node outage, message
corruption, false node, and routing attacks
because of which the data in the system will be
IOT
ANYTIME,
ANYPLACE,
ANYWHERE
Home: Health,
Entertainment,
Security
Transport: Logistics,
Traffic, Parking
Community: Factory,
Retail, Environment
Industrialists,
Personal care,
Policy makers,
Doctor/care
giver.
ISSN No. (Online) - 2368-1209 ISSN No. (Print) - 2691-5944
American Journal of Advanced Computing IEM-ICDC 2020 Special Issue on "Computational Intelligence and Smart Information and Communication Technology" January 2021, Volume 1, Issue 1
29
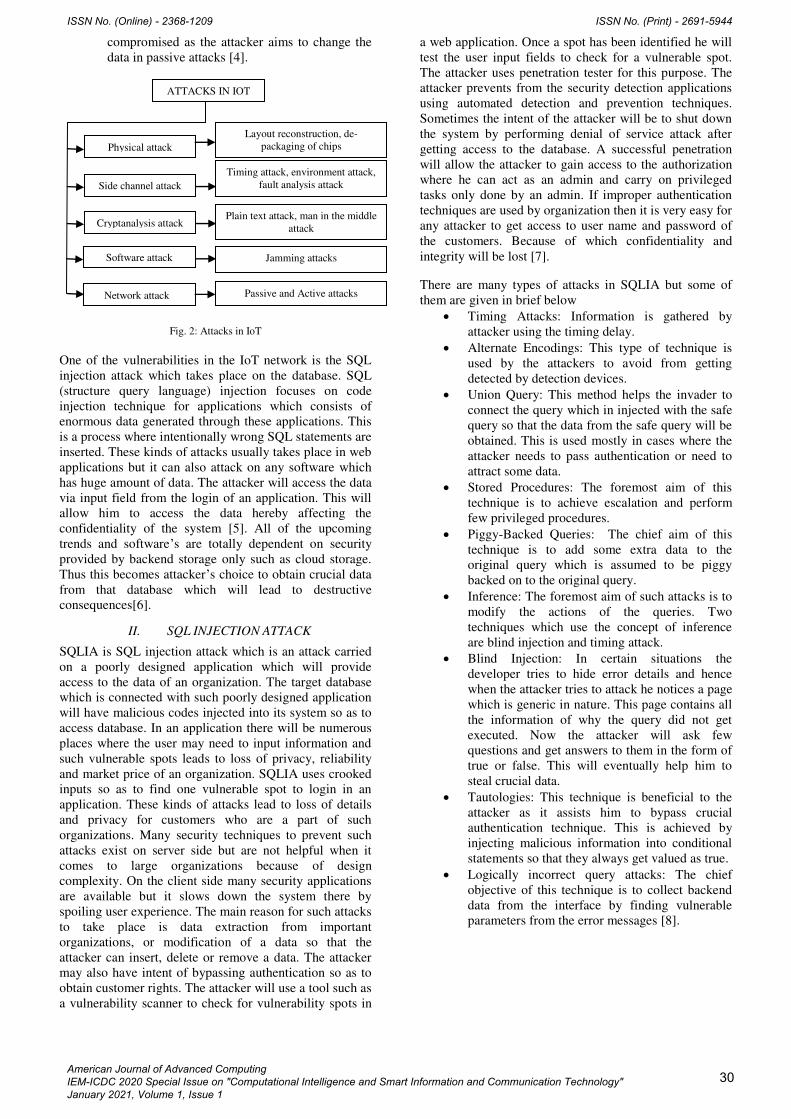
compromised as the attacker aims to change the
data in passive attacks [4].
Fig. 2: Attacks in IoT
One of the vulnerabilities in the IoT network is the SQL
injection attack which takes place on the database. SQL
(structure query language) injection focuses on code
injection technique for applications which consists of
enormous data generated through these applications. This
is a process where intentionally wrong SQL statements are
inserted. These kinds of attacks usually takes place in web
applications but it can also attack on any software which
has huge amount of data. The attacker will access the data
via input field from the login of an application. This will
allow him to access the data hereby affecting the
confidentiality of the system [5]. All of the upcoming
trends and software’s are totally dependent on security
provided by backend storage only such as cloud storage.
Thus this becomes attacker’s choice to obtain crucial data
from that database which will lead to destructive
consequences[6].
II. SQL INJECTION ATTACK
SQLIA is SQL injection attack which is an attack carried
on a poorly designed application which will provide
access to the data of an organization. The target database
which is connected with such poorly designed application
will have malicious codes injected into its system so as to
access database. In an application there will be numerous
places where the user may need to input information and
such vulnerable spots leads to loss of privacy, reliability
and market price of an organization. SQLIA uses crooked
inputs so as to find one vulnerable spot to login in an
application. These kinds of attacks lead to loss of details
and privacy for customers who are a part of such
organizations. Many security techniques to prevent such
attacks exist on server side but are not helpful when it
comes to large organizations because of design
complexity. On the client side many security applications
are available but it slows down the system there by
spoiling user experience. The main reason for such attacks
to take place is data extraction from important
organizations, or modification of a data so that the
attacker can insert, delete or remove a data. The attacker
may also have intent of bypassing authentication so as to
obtain customer rights. The attacker will use a tool such as
a vulnerability scanner to check for vulnerability spots in
a web application. Once a spot has been identified he will
test the user input fields to check for a vulnerable spot.
The attacker uses penetration tester for this purpose. The
attacker prevents from the security detection applications
using automated detection and prevention techniques.
Sometimes the intent of the attacker will be to shut down
the system by performing denial of service attack after
getting access to the database. A successful penetration
will allow the attacker to gain access to the authorization
where he can act as an admin and carry on privileged
tasks only done by an admin. If improper authentication
techniques are used by organization then it is very easy for
any attacker to get access to user name and password of
the customers. Because of which confidentiality and
integrity will be lost [7].
There are many types of attacks in SQLIA but some of
them are given in brief below
Timing Attacks: Information is gathered by
attacker using the timing delay.
Alternate Encodings: This type of technique is
used by the attackers to avoid from getting
detected by detection devices.
Union Query: This method helps the invader to
connect the query which in injected with the safe
query so that the data from the safe query will be
obtained. This is used mostly in cases where the
attacker needs to pass authentication or need to
attract some data.
Stored Procedures: The foremost aim of this
technique is to achieve escalation and perform
few privileged procedures.
Piggy-Backed Queries: The chief aim of this
technique is to add some extra data to the
original query which is assumed to be piggy
backed on to the original query.
Inference: The foremost aim of such attacks is to
modify the actions of the queries. Two
techniques which use the concept of inference
are blind injection and timing attack.
Blind Injection: In certain situations the
developer tries to hide error details and hence
when the attacker tries to attack he notices a page
which is generic in nature. This page contains all
the information of why the query did not get
executed. Now the attacker will ask few
questions and get answers to them in the form of
true or false. This will eventually help him to
steal crucial data.
Tautologies: This technique is beneficial to the
attacker as it assists him to bypass crucial
authentication technique. This is achieved by
injecting malicious information into conditional
statements so that they always get valued as true.
Logically incorrect query attacks: The chief
objective of this technique is to collect backend
data from the interface by finding vulnerable
parameters from the error messages [8].
ATTACKS IN IOT
Side channel attack
Physical attack
Cryptanalysis attack
Software attack
Network attack
Layout reconstruction, de-
packaging of chips
Timing attack, environment attack,
fault analysis attack
Plain text attack, man in the middle
attack
Jamming attacks
Passive and Active attacks
ISSN No. (Online) - 2368-1209 ISSN No. (Print) - 2691-5944
American Journal of Advanced Computing IEM-ICDC 2020 Special Issue on "Computational Intelligence and Smart Information and Communication Technology" January 2021, Volume 1, Issue 1
30

III. TYPES OF SQL INJECTION ATTACKS
A. Tautologies
Any attack which comes under this category will inject
malicious information’s into conditional statements so that
they always are evaluated as true. This is done to bypass
the most important form of security that is authentication
of a user so that the attacker can extract important data of
the respective organization. A very authenticate example
of tautology is bypassing authentication page and fetching
data.
Example: The attacker exploits the WHERE clause. This
conditional query is transformed and all the rows are
accessed by making the query return the rows. For an
instance, select query can be used for this purpose where
the attacker will try to obtain the id, this will be 1 or 1=1
and the passcode will be 1234 or 1=1.
B. Logically incorrect query attacks
The main goal of this intrusion is to get the data from the
back end. Whenever a query won’t be accepted a generic
page which contains the error messages will be generated
so as to help in further debugging process. This will help
the attacker to understand the parameters which are
vulnerable and this in turn helps the attacker to access the
database. The attacker also writes down garbage input or
SQL token so as to create syntax error so that he gets back
details about the name of the column and table details so
he can organize his attack more adequately.
Example: Once the error message is obtained, the attacker
will try to obtain the information of the table name and its
respective fields. By such gathered information attacker
gets more organized attacks. This attack is the basis of all
attacks.
C. Union query
The major objective of this is to masquerade as a user’s
query so that the attacker obtains information from a table
which is not the intended table. By doing this the attacker
will be able to join a safe and a malicious query by using
the word UNION. This is used for bypassing
authentication and to remove some data.
Example: If the attacker wants to obtain the debit card
details of a user he will try to join a safe query such as a
query to obtain the id of a user but also will maliciously
join another query that will give him the debit card details
of the user.
D. Stored procedures
The foremost aim of the stored procedure attack is to
execute special privileged actions which try to perform
SQL queries. Stored procedures are a part of database
where extra abstraction layer is set by the help of the
programmer. Since this part is programmable, this layer is
injectable with attacks. There are many ways of attacks in
stored procedure. Here the unsafe query gets piggy backed
on to original query and when a safe query is executed
subsequently an unsafe query is also executed.
E. Piggy backed queries
This type of attack allows any query to get piggybacked
onto the original query so as to help the attacker to modify
or execute any type of malicious query. This is called as
piggy backing. Therefore this leads to database getting
many SQL queries for execution. These kinds of attacks
are always dependent on databases.
Example: If the attacker wants to drop users from a
particular group he can do so by executing a query with a
malicious code and by using a delimiter. After executing
the first query the database checks for query delimiters “;”
and executes the next query. This would drop the table
users and destroy important information.
F. Inference
The core aim of inference attack is to alter the database
and application behavior. Under this category there are
two attacks which take place and they are blind injection
and timing attack.
Blind injection: This type of attacks happen
when the developer purposely hides the
important details regarding the error messages.
This will further help the invaders to obtain
crucial information which leads to compromise
of data. The attacker makes use of this page and
asks many true or false questions to invade data.
If the application is very secure, the queries
won’t get executed. But in many cases there
won’t be any input validation and hence when
the invader enters the first query he receives an
error message, then he submits the next query
which is true. If he doesn’t get any error while
logging in then he discovers that this is
susceptible to an attack.
Timing attacks: In this attack the invader gathers
data from the database by understanding and
seeing the timing delays in the responses from
the databases. The query which consists if-then
will make the database to run the SQL engine
longer depending on the login which is injected.
This is almost same as blind injection and the
invader will measure the time to check if the
injected statement is true. A term called as
“WAITFOR” which will make the database to
delay is used.
G. Alternate encodings
The core aim of such attacks is to dodge being recognized
by the secure defensive coding and automatic prevention
system. So this kind of attacks helps the attackers to
prevent any detection. This attack combines itself with
additional attack methods. The invaders changes the query
with alternate encodings such as hexadecimal and ASCII.
This will allow them to escape the input filter. This attack
then hides multiple attacks within it[8].
IV. PROCEDURE OF SQL INJECTION ATTACKS
The attacker performs the attack usually in three differret
procedures as seen in figure 3. An attacker first sends the
input to the applicatiton then it checks on the SQL reports
and then refers to the backend database. By doing the
procedures it is able to attack the database and obtain or
delete important data.
The main aim of the attackers is to extract most crucial
data from the organization and modify it. The attacker will
also have an intention to modify the data.
The main reason for such attacks to take place is data
extraction from important organizations, or modification
of a data so that the attacker can insert, delete or remove a
ISSN No. (Online) - 2368-1209 ISSN No. (Print) - 2691-5944
American Journal of Advanced Computing IEM-ICDC 2020 Special Issue on "Computational Intelligence and Smart Information and Communication Technology" January 2021, Volume 1, Issue 1
31

data. The attacker may also have intent of bypassing
authentication so as to obtain customer rights.
The attacker will use a tool such as a vulnerability scanner
to check for vulnerability spots in a web application. Once
a spot has been identified he will test the user input fields
to check for a vulnerable spot. The attacker uses
penetration tester for this purpose. The attacker prevents
from the security detection applications using automated
detection and prevention techniques. Sometimes the intent
of the attacker will be to shut down the system by
performing denial of service attack after getting access to
the database.
A successful penetration will allow the attacker to gain
access to the authorization where he can act as an admin
and carry on privileged tasks only done by an admin. If
improper authentication techniques are used by
organization then it is very easy for any attacker to get
access to user name and password of the customers.
Because of which confidentiality and integrity will be
lost[7].
Fig. 3: Process of SQL injection attack
V. INTENT OF THE ATTACKER
Sometimes the intent of the attacker will be different and
the goal will be quite different for different purposes.
Some of the intents are:
Identifying injectable parameters: Here the
attacker wants to know which application has
vulnerable spots in the input.
Performing database finger printing: Here the
intent of the attacker is to find out what version
and type of database is used by the application as
this can be very unique for different application
and hence this acts as fingerprint.
Determining database schema: In order to obtain
crucial database the attacker will need to obtain
database information such as column name, table
name etc. This information will help the attacker
to obtain access.
Extracting data: This is the most common type of
SQLIA with the intent being to get the crucial
information of the database.
Adding or modifying data: The intent of the
attacker is to change the contents in the database.
Performing denial of service: Here intent of the
attacker is to shut down the system
Evading detection: Here the intent of the attacker
is to avoid getting noticed by the security
systems.
Bypassing authentication: Here the intent of the
attacker is to bypass authentication.
Executing remote commands: Here the intent of
the attacker is to perform some crucial arbitrary
commands.
Performing privilege escalation: Here the
attacker bypasses authentication and performs
few privileged tasks not meant for him[9].
VI. PREVENTION OF SQL INJECTION ATTACK
The main cause for SQL injection attack is inefficient
input validation techniques. So the main aim will be to
strengthen defensive coding practices. Some of the best
practices are
Input type checking: Simply checking the inputs
with numeric and string can prevent SQLIA.
Encoding of inputs: Encoding of Meta characters
will help in preventing attacks.
Positive pattern matching: The developers need
to match good and bad input so that they can
understand the type of attack taking place.
Identification of all input sources: Checking of
all the inputs in the applications needs to be
made mandatory.
Although this is the best way to stabilize the input
defense, still it is not practical to apply and hence
vulnerability spots arise. Therefore future research needs
to focus on precision and effectiveness of these
approaches along with proper defense mechanisms[9].
A. Current techniques for prevention of SQLIA
In order to develop our research technique it is very
important to learn about other methods and they are
Black Box Testing: This uses a web crawler to
identify a vulnerable spot in a web application.
Make attacks on these points and use a monitor
to check what kind of response in obtained when
such attack takes place. Limitation is that it
cannot provide guarantee of completeness[8].
WebSSARI uses static analysis to check taint
flows against preconditions for sensitive
functions. It needs clean input with predefined
filters to work. The limitation of this approach is
adequate preconditions for sensitive functions
cannot be accurately expressed so some filters
may be omitted[8] [10] .
SecuriFly is tool that is implemented for java.
Despite of other tool, chase string instead of
character for taint information and try to sanitize
query strings that have been generated using
tainted input but unfortunately injection in
numeric fields cannot stop by this approach.
Trouble in recognizing all causes of user input is
the main restriction of this approach[8].
Dynamic Analysis: This approach is also known
as post generated approach. Post-generated
technique are beneficial for examination of
dynamic or runtime SQL query, created with user
input statistics by a web application. Detection
methods under this post-generated group
Malicious
code
Application SQL
REPORT DATA
BASE
ISSN No. (Online) - 2368-1209 ISSN No. (Print) - 2691-5944
American Journal of Advanced Computing IEM-ICDC 2020 Special Issue on "Computational Intelligence and Smart Information and Communication Technology" January 2021, Volume 1, Issue 1
32

implements before stationing a query to the
database server[8].
Code Checkers are based on static analysis of
web application that can reduce SQL injection
vulnerabilities and detect type errors. For
instance, JDBC-Checker is a tool used to code
check for statically validating the type rightness
of dynamically-generated SQL queries. This is to
make the SQL query safe[8][10].
Combined Static and Dynamic Analysis:
AMNESIA is technique that combines dynamic
and static for preventing and detecting web
application vulnerabilities at the runtime[8]
[10][11][12].
In SQL Guard and SQL Check queries are
checked at runtime based on a model which is
expressed as a grammar that only accepts legal
queries. SQL Guard will check the query after
and before the user input. In SQL Check, model
is specified by the developer. Both techniques
use secret key[8] [10].
SQL-IDS, a specification based approach to
detect malicious intrusions[8][13].
SQLrand uses a proof of concept proxy server in
between the Web server (client) and SQL server;
they de-randomized queries received from the
client and sent the request to the server. This de-
randomization framework has 2 main
advantages: portability and security [8][14].
SQLIA Prevention Using Stored Procedures:
Stored procedures are subroutines in the database
which the applications can make call to. The
prevention in these stored procedures is applied
by a mixture of static examination and runtime
examination[8][15].
VII. CONCLUSION
There is an exponential increase in interconnection of
heterogeneous smart devices in the IoT ecosystem. IoT is
envisioned as spectacular phenomena where isolated
devices are transformed to communication devices. In this
communicative environment, there are a plethora of
opportunities for stealing sensitive information. Hence it
is very important to prevent the data from leaking as the
user information is very crucial and important. There are
many attacks which take place over internet but one of the
many is SQL injection attack. This paper gives an
overview of SQL injection attack and its types. The
challenges in SQL injection is briefed along with the
countermeasures in prevention of the same.
REFERENCES
[1] S. Keyur, “Internet of Things-IOT : Definition , Characteristics , Architecture , Enabling Technologies , Application & Future Challenges,” vol. 6, no. 5, 2016, doi: 10.4010/2016.1482.
[2] I. C. a Daniele Miorandi a, Sabrina Sicari b, Francesco De Pellegrini a, “Internet of things: vision,applications and research challenge,” Ad Hoc Networks, vol. 10, no. 7, pp. 1497–1516, 2012, doi: 10.1016/j.adhoc.2012.02.016.
[3] G. Jayavardhana, B. Rajkumar, Slaven, and Marimuthu, “Internet of Things (IoT): A Vision, Architectural Elements, and Future Directions,” Futur. Gener. Comput. Syst., vol. Volume 29, no. Issue 7, p. Pages 1645-1660.
[4] G. K. Kumar, A. M. Reddy, and P. Ravi, “A Survey on various IoT Attacks and its Countermeasures,” vol. 5, no. 4, pp. 143–150, 2020.
[5] G. Bianchi, “CODDLE : Code-Injection Detection With Deep Learning,” IEEE Access, vol. 7, pp. 128617–128627, 2019, doi: 10.1109/ACCESS.2019.2939870.
[6] S. O. Uwagbole, W. J. Buchanan, and L. Fan, “An applied pattern-driven corpus to predictive analytics in mitigating SQL injection attack,” Proc. - 2017 7th Int. Conf. Emerg. Secur. Technol. EST 2017, no. September, pp. 12–17, 2017, doi: 10.1109/EST.2017.8090392.
[7] Lawal, A. Bakr, and Ayanloye, “systematic literature review on SQLIA,” Int. J. soft Comput., pp. 26–35, 2016.
[8] B. Shehu and A. Xhuvani, “A Literature Review and Comparative Analyses on SQL Injection : Vulnerabilities , Attacks and their Prevention and Detection Techniques,” vol. 11, no. 4, pp. 28–37, 2014.
[9] W. G. J. Halfond, J. Viegas, and A. Orso, “A Classification of SQL Injection Attacks and Countermeasures,” Prev. Sql Code Inject. By Comb. Static Runtime Anal., p. 53, 2008.
[10] M. A. Kausar, M. Nasar, and A. Moyaid, “SQL injection detection and prevention techniques in ASP.NET web application,” Int. J. Recent Technol. Eng., vol. 8, no. 3, pp. 7759–7766, 2019, doi: 10.35940/ijrte.C6319.098319.
[11] William G.J. Halfond and Alessandro Orso, “Preventing Sql Code Injection By Combining Static and Runtime Analysis,” Distribution, no. May, 2008.
[12] W. G. J. Halfond and A. Orso, “AMNESIA: Analysis and monitoring for NEutralizing SQL-injection attacks,” 20th IEEE/ACM Int. Conf. Autom. Softw. Eng. ASE 2005, pp. 174–183, 2005, doi: 10.1145/1101908.1101935.
[13] I. Jemal, O. Cheikhrouhou, and A. Mahfoudhi, “SQL Injection Attack Detection and Prevention Techniques Classification,” vol. 15, no. 6, pp. 569–580, 2020.
[14] K. I. Takane, S. Tajima, and H. Kouchi, “Structural and expression analysis of uricase mRNA from Lotus japonicus,” Mol. Plant-Microbe Interact., vol. 13, no. 10, pp. 1156–1160, 2000, doi: 10.1094/MPMI.2000.13.10.1156.
[15] K. Wei, M. Muthuprasanna, and S. Kothari, “Preventing SQL injection attacks in stored procedures,” Proc. Aust. Softw. Eng. Conf. ASWEC, vol. 2006, pp. 191–198, 2006, doi: 10.1109/ASWEC.2006.40.
ISSN No. (Online) - 2368-1209 ISSN No. (Print) - 2691-5944
American Journal of Advanced Computing IEM-ICDC 2020 Special Issue on "Computational Intelligence and Smart Information and Communication Technology" January 2021, Volume 1, Issue 1
33
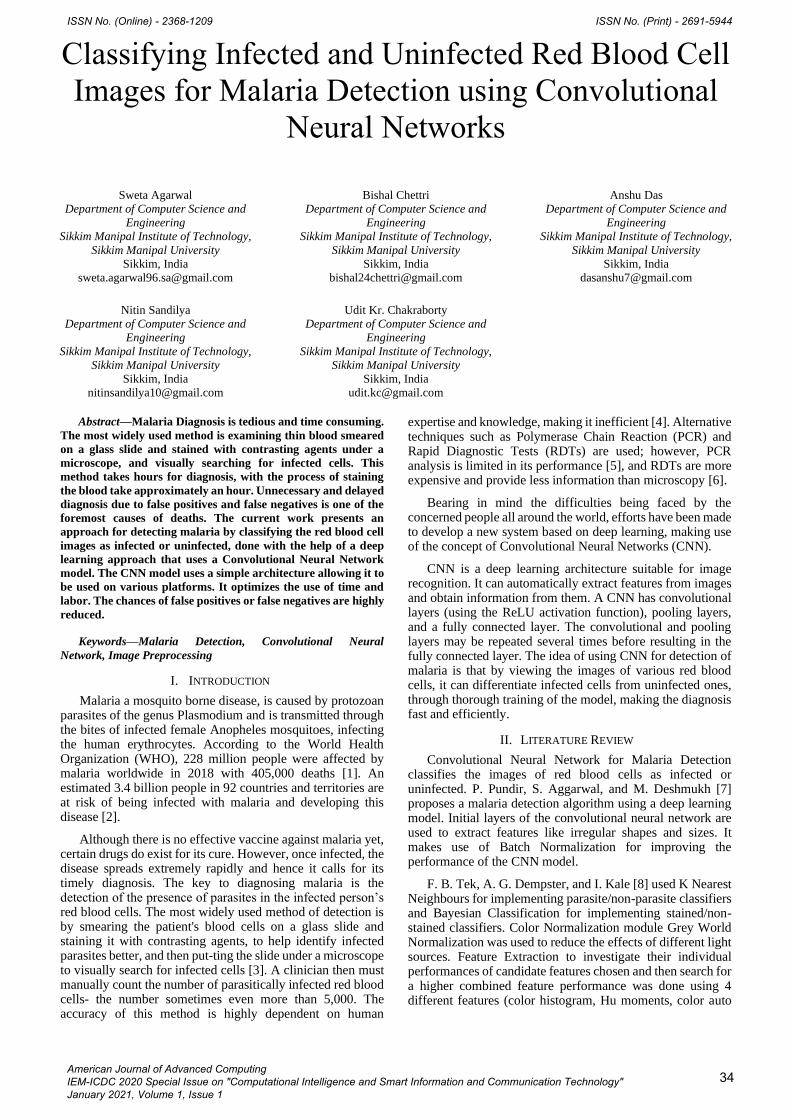
Classifying Infected and Uninfected Red Blood Cell
Images for Malaria Detection using Convolutional
Neural Networks
Sweta Agarwal
Department of Computer Science and
Engineering
Sikkim Manipal Institute of Technology,
Sikkim Manipal University
Sikkim, India
Nitin Sandilya
Department of Computer Science and
Engineering
Sikkim Manipal Institute of Technology,
Sikkim Manipal University
Sikkim, India
Bishal Chettri
Department of Computer Science and
Engineering
Sikkim Manipal Institute of Technology,
Sikkim Manipal University
Sikkim, India
Udit Kr. Chakraborty
Department of Computer Science and
Engineering
Sikkim Manipal Institute of Technology,
Sikkim Manipal University
Sikkim, India
Anshu Das
Department of Computer Science and
Engineering
Sikkim Manipal Institute of Technology,
Sikkim Manipal University
Sikkim, India
Abstract—Malaria Diagnosis is tedious and time consuming.
The most widely used method is examining thin blood smeared
on a glass slide and stained with contrasting agents under a
microscope, and visually searching for infected cells. This
method takes hours for diagnosis, with the process of staining
the blood take approximately an hour. Unnecessary and delayed
diagnosis due to false positives and false negatives is one of the
foremost causes of deaths. The current work presents an
approach for detecting malaria by classifying the red blood cell
images as infected or uninfected, done with the help of a deep
learning approach that uses a Convolutional Neural Network
model. The CNN model uses a simple architecture allowing it to
be used on various platforms. It optimizes the use of time and
labor. The chances of false positives or false negatives are highly
reduced.
Keywords—Malaria Detection, Convolutional Neural
Network, Image Preprocessing
I. INTRODUCTION
Malaria a mosquito borne disease, is caused by protozoan parasites of the genus Plasmodium and is transmitted through the bites of infected female Anopheles mosquitoes, infecting the human erythrocytes. According to the World Health Organization (WHO), 228 million people were affected by malaria worldwide in 2018 with 405,000 deaths [1]. An estimated 3.4 billion people in 92 countries and territories are at risk of being infected with malaria and developing this disease [2].
Although there is no effective vaccine against malaria yet, certain drugs do exist for its cure. However, once infected, the disease spreads extremely rapidly and hence it calls for its timely diagnosis. The key to diagnosing malaria is the detection of the presence of parasites in the infected person’s red blood cells. The most widely used method of detection is by smearing the patient's blood cells on a glass slide and staining it with contrasting agents, to help identify infected parasites better, and then put-ting the slide under a microscope to visually search for infected cells [3]. A clinician then must manually count the number of parasitically infected red blood cells- the number sometimes even more than 5,000. The accuracy of this method is highly dependent on human
expertise and knowledge, making it inefficient [4]. Alternative techniques such as Polymerase Chain Reaction (PCR) and Rapid Diagnostic Tests (RDTs) are used; however, PCR analysis is limited in its performance [5], and RDTs are more expensive and provide less information than microscopy [6].
Bearing in mind the difficulties being faced by the concerned people all around the world, efforts have been made to develop a new system based on deep learning, making use of the concept of Convolutional Neural Networks (CNN).
CNN is a deep learning architecture suitable for image recognition. It can automatically extract features from images and obtain information from them. A CNN has convolutional layers (using the ReLU activation function), pooling layers, and a fully connected layer. The convolutional and pooling layers may be repeated several times before resulting in the fully connected layer. The idea of using CNN for detection of malaria is that by viewing the images of various red blood cells, it can differentiate infected cells from uninfected ones, through thorough training of the model, making the diagnosis fast and efficiently.
II. LITERATURE REVIEW
Convolutional Neural Network for Malaria Detection classifies the images of red blood cells as infected or uninfected. P. Pundir, S. Aggarwal, and M. Deshmukh [7] proposes a malaria detection algorithm using a deep learning model. Initial layers of the convolutional neural network are used to extract features like irregular shapes and sizes. It makes use of Batch Normalization for improving the performance of the CNN model.
F. B. Tek, A. G. Dempster, and I. Kale [8] used K Nearest Neighbours for implementing parasite/non-parasite classifiers and Bayesian Classification for implementing stained/non-stained classifiers. Color Normalization module Grey World Normalization was used to reduce the effects of different light sources. Feature Extraction to investigate their individual performances of candidate features chosen and then search for a higher combined feature performance was done using 4 different features (color histogram, Hu moments, color auto
ISSN No. (Online) - 2368-1209 ISSN No. (Print) - 2691-5944
American Journal of Advanced Computing IEM-ICDC 2020 Special Issue on "Computational Intelligence and Smart Information and Communication Technology" January 2021, Volume 1, Issue 1
34

correlogram (henceforth correlogram), and a relative shape measurement vector).
H. A. Mohammed and I. A. M. Abdelrahman [9] for achieving better outcomes, uses techniques of pre-processing for enhancing the image. Morphological processing identifies and counts the RBCs in the given blood image. An algorithm is developed for the detection of infected and uninfected RBCs. An additional layer of parasite classification is implemented using the Normalized Cross-Correlation function.
Y. Dong, Z. Jiang, H. Shen, W.D. Pan, L.A. Williams, V.V. Reddy, W.H. Benjamin, and A.W. Bryan [10] identifies malaria-infected cell images using deep learning methods. It achieved higher accuracy than the SVM method in D. K. Das, M. Ghosh, M. Pal, A. K. Maiti, and C. Chakraborty [11]. It uses Convolutional Neural Network which automatically extracts multiple layers of features from the input data. The dataset was created by a group of pathologists from the Medical School of the University of Alabama at Birmingham.
A. Vijayalakshmi [12] identify infected falciparum malaria parasites using a novel deep neural network model. Proposes a transfer learning approach by unifying the Visual Geometry Group (VGG) network and Support Vector Machine (SVM). To analyse the performance of VGG19-SVM malaria digital corpus images were used.
Z. Liang, A. Powell, I. Ersoy, M. Poostchi, K. Silamut, K. Palaniappan, P. Guo, M. A. Hossain, A. Sameer, R.J. Maude, and J. X. Huang [13] proposes a machine learning model based on a convolutional neural network (CNN) for classifying cells in thin blood smears on standard micro-scope slides as either infected or uninfected. The performance of the CNN model is affected by both the architecture and the volume of training data.
J. Hung, and A. Carpenter [14] use Faster Region-based Convolutional Neural Network (Faster R-CNN). The model is pre-trained on ImageNet and finely tuned using the dataset. It uses two stages for classification and detection.
Various Deep Learning approaches have been used for implementing models for malaria diagnosis, which minimize the dependency on skilled technicians for the process. The accuracy achieved by the different CNN models is higher than its SVM counterparts. CNN models can be used to extract multiple features from the input image to make a prediction. Here, a CNN model with a single convolutional layer is used, showing that a simple architecture with low computational power can also be used to achieve better performance. Previous works using CNN models employ a more complex structure and use higher computational power.
III. METHODOLOGIES USED
This work aims to detect malaria by classifying the red blood cell images as infected or uninfected. To achieve this, this model uses a Convolutional Neural Network (CNN) as it is capable of studying and analysing images. It is fed with a labelled dataset (images labelled as infected and uninfected) making its learning as supervised. However, the images are initially preprocessed, before feeding them in the model, to enhance certain features facilitating the CNN to analyse the images better.
A. Image Preprocessing
Images in the dataset are refined before using them for the training and testing of models. The cleaning of images (Image preprocessing) includes resizing, generalizing the color space to either RGB (white balancing) or grayscale, labelling the images, and more. It improves the image by reducing unwanted noise leading to the enhancement of essential image features. Image preprocessing [15] helps in achieving better results.
• Resize: Images in a dataset are of varying sizes collected from different sources such as mobile phones, professional cameras, etc. All the images in the dataset are required to be of the same size. Images are resized into a base size, which is set to be used by the model.
• Noise reduction: Noise is an undesired distortion which makes the image appear grainy leading to inaccurate analysis of the image. It can be reduced by blurring of the image which smoothens the image, reducing the effect of noise. Blurring can be done using functions like Gaussian Blur. In this operation, the image is convolved with a Gaussian filter. The Gaussian filter is a low-pass filter that reduces the high-frequency components (noise) of the image [20].
• Segmentation: Identifying regions in an image and labelling them to different classes is called image segmentation [19]. It includes separating different objects in the image with markers, labelling them so that they can be trained accordingly. One way of segmenting an image is to segment it based on its pixel values. This makes use of the fact that there will be a huge difference between the pixel values at the edges of an object and the pixel values of its background pixels. So, in such cases we can set a threshold value, the difference in pixel values falling below the threshold can be segmented accordingly. In case there is one object in front of a single background only one threshold value will work. But in case there are multiple object or overlapping among objects we might need multiple threshold values.
• Morphological operations: Morphology involves image processing operations that process images and makes changes to the shape and structure of the image. In a morphological operation, each pixel in the image is adjusted based on the value of other pixels in its neighborhood. The size and shape of the neighborhood can also be adjusted. There are two types of morphological operations – dilation and erosion. In morphological erosion, the value of the output pixel is the minimum value of all pixels in the neighborhood [21]. Morphological erosion removes grains and small objects so that only substantive objects remain, that is, they help in reducing the noise in the image.
B. Convolutional Neural Network
Convolutional Neural Network (also known as ConvNet or CNN) is most commonly used for the analysing of images and identifying various objects in them. Convolutional Neural Networks can be applied to image processing, natural language pro-cessing, and other kinds of cognitive tasks [16].
Convolutional Neural Networks has an input layer, an output layer, and various hidden layers that are fully
ISSN No. (Online) - 2368-1209 ISSN No. (Print) - 2691-5944
American Journal of Advanced Computing IEM-ICDC 2020 Special Issue on "Computational Intelligence and Smart Information and Communication Technology" January 2021, Volume 1, Issue 1
35
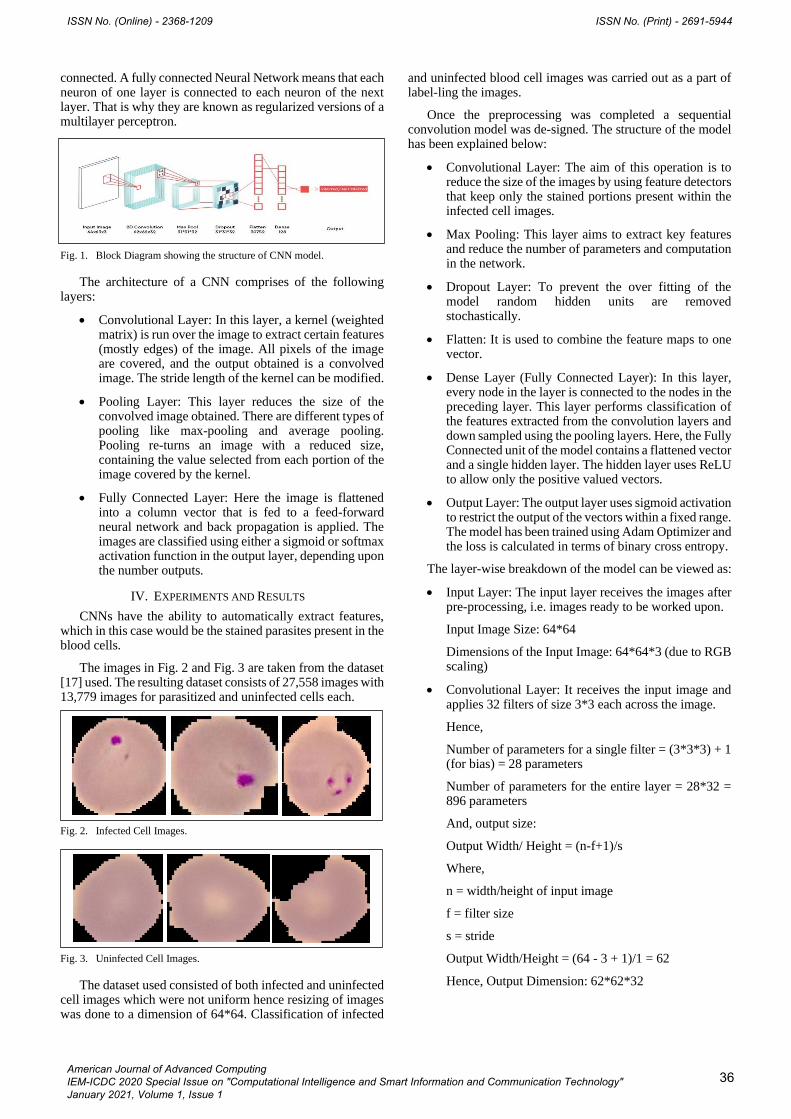
connected. A fully connected Neural Network means that each neuron of one layer is connected to each neuron of the next layer. That is why they are known as regularized versions of a multilayer perceptron.
Fig. 1. Block Diagram showing the structure of CNN model.
The architecture of a CNN comprises of the following layers:
• Convolutional Layer: In this layer, a kernel (weighted matrix) is run over the image to extract certain features (mostly edges) of the image. All pixels of the image are covered, and the output obtained is a convolved image. The stride length of the kernel can be modified.
• Pooling Layer: This layer reduces the size of the convolved image obtained. There are different types of pooling like max-pooling and average pooling. Pooling re-turns an image with a reduced size, containing the value selected from each portion of the image covered by the kernel.
• Fully Connected Layer: Here the image is flattened into a column vector that is fed to a feed-forward neural network and back propagation is applied. The images are classified using either a sigmoid or softmax activation function in the output layer, depending upon the number outputs.
IV. EXPERIMENTS AND RESULTS
CNNs have the ability to automatically extract features, which in this case would be the stained parasites present in the blood cells.
The images in Fig. 2 and Fig. 3 are taken from the dataset [17] used. The resulting dataset consists of 27,558 images with 13,779 images for parasitized and uninfected cells each.
Fig. 2. Infected Cell Images.
Fig. 3. Uninfected Cell Images.
The dataset used consisted of both infected and uninfected cell images which were not uniform hence resizing of images was done to a dimension of 64*64. Classification of infected
and uninfected blood cell images was carried out as a part of label-ling the images.
Once the preprocessing was completed a sequential convolution model was de-signed. The structure of the model has been explained below:
• Convolutional Layer: The aim of this operation is to reduce the size of the images by using feature detectors that keep only the stained portions present within the infected cell images.
• Max Pooling: This layer aims to extract key features and reduce the number of parameters and computation in the network.
• Dropout Layer: To prevent the over fitting of the model random hidden units are removed stochastically.
• Flatten: It is used to combine the feature maps to one vector.
• Dense Layer (Fully Connected Layer): In this layer, every node in the layer is connected to the nodes in the preceding layer. This layer performs classification of the features extracted from the convolution layers and down sampled using the pooling layers. Here, the Fully Connected unit of the model contains a flattened vector and a single hidden layer. The hidden layer uses ReLU to allow only the positive valued vectors.
• Output Layer: The output layer uses sigmoid activation to restrict the output of the vectors within a fixed range. The model has been trained using Adam Optimizer and the loss is calculated in terms of binary cross entropy.
The layer-wise breakdown of the model can be viewed as:
• Input Layer: The input layer receives the images after pre-processing, i.e. images ready to be worked upon.
Input Image Size: 64*64
Dimensions of the Input Image: 64*64*3 (due to RGB scaling)
• Convolutional Layer: It receives the input image and applies 32 filters of size 3*3 each across the image.
Hence,
Number of parameters for a single filter = (3*3*3) + 1 (for bias) = 28 parameters
Number of parameters for the entire layer = 28*32 = 896 parameters
And, output size:
Output Width/ Height = (n-f+1)/s
Where,
n = width/height of input image
f = filter size
s = stride
Output Width/Height = (64 - 3 + 1)/1 = 62
Hence, Output Dimension: 62*62*32
ISSN No. (Online) - 2368-1209 ISSN No. (Print) - 2691-5944
American Journal of Advanced Computing IEM-ICDC 2020 Special Issue on "Computational Intelligence and Smart Information and Communication Technology" January 2021, Volume 1, Issue 1
36

• Max Pooling Layer: The max pooling layer reduces the size of the image by half using 2*2 filters with stride of 2.
Hence, Output Dimension: 31*31*32
Number of parameters= 0 (as all the values in this layer are fixed)
• Dropout Layer: It simply prevents the over fitting of the model by randomly drop-ping certain hidden units.
Output Dimension: 31*31*32
• Dense Layer (Fully Connected Layer): It takes in the input from the dropout layer and flattens the entire matrix into a single dimension.
The FC unit in this model has:
o The flattened vector
o A layer containing 128 units
Hence, flattening the input from the dropout layer, we get:
Number of units (in the flattened vector) = 31*31*32 = 30752
Hence, Number of parameters for the layer (ReLU) = (30752*128) + 128 (bias for each unit) = 3936384
• Output Layer: The output layer contains a single logistic unit activated by a sigmoid function which classifies the input image of blood cell images as Infected/ Not Infected.
Number of parameters for the output layer (Sigmoid) = (128*1) + 1 (bias) = 129
Fig. 4. CNN Model Architecture
The dataset containing 27,558 images was divided into training and testing data with 80 % and 20 % random images
respectively. Hence, the training data had 22046 images and the testing data had 5512 images.
Fig. 5. Training and Validation Accuracy Graph
The model was trained using the training data and validated against the testing data. After the model training was done the classification report was as follows:
• 95.88 % accuracy on training data.
• 94.72 % accuracy on testing data.
Fig. 6. Confusion Matrix Showing testing data classification.
V. DISCUSSION
While it can be confidently stated that malaria detection is now done better using computer aided services rather than a fully human based system, the choice of the best method is still probing researchers. Even with CNN based approaches, there hap-pens to be a few differently designed systems contending for the top spot. The CNN using batch normalization proposed by P. Pundir, S. Aggarwal, and M. Deshmukh [7] returned 96.02% accuracy, while A. Rahman, H. Zunair, M. S.Rahman, J. Q.Yuki, S. Biswas, M. A. Alam, N. B. Alam, and M. R. C. Mahdy [18] experimented with three different architectures. The highest accuracy was seen by TL-VGG16 at 97.77% with 13 convolution layers. Considering only CNN based models, which have been reported to fare better than other classifiers or ensemble-based models, the proposed technique is clean, simple and easy to implement. It does not include expensive pre-processing and is fast and accurate within the competitive range of the other proposed techniques.
ISSN No. (Online) - 2368-1209 ISSN No. (Print) - 2691-5944
American Journal of Advanced Computing IEM-ICDC 2020 Special Issue on "Computational Intelligence and Smart Information and Communication Technology" January 2021, Volume 1, Issue 1
37

The result from the discussed model is 95.88 percent on training data and 94.72 percent on testing data which is right up in comparison with other much well-designed architectures. Furthermore, by using a larger dataset or using better resolution images along with the introduction of hyperparameters one can always fine tune the model for much better results.
TABLE I. COMPARISON OF ACCURACIES OBTAINED FROM DIFFERENT
MODELS.
Accuracy obtained
from CNN using
batch normalization
Accuracy obtained
from TL-VGG16
Accuracy obtained from
discussed model
96.02% 97.77% 95.88% on training data 94.72% on testing data
Fig. 7. Table for Comparison of accuracies obtained from different models.
VI. CONCLUSION
The above use case of classifying infected and uninfected blood cells using CNN is an example of how moderate computing infrastructure can be used to implement models that can reduce the dependency of skilled technicians in the diagnosis of malaria. The model architecture used for classification consists of only a single convolution layer whereas many other models that are used for the same use case use more than one convolution layer. This shows how dynamic the convolution operation is and how by tweaking certain parameters we can achieve near perfect results.
The main objective of this work was to build a lightweight model, which is simple and nimble and generates fairly accurate results. The paper thus far, with the results, proves that the accuracy of results is better than fairly accurate. To that end, the research and experiments have been successful. The accuracy, authors believe can be further improved through training. Tuning hyperparameters in CNN’s also have at times resulted in improved performance, which may be considered as future work.
REFERENCES
[1] WHO Newsroom Malaria Homepage, https://www.who.int/news-room/fact-sheets/detail/malaria.
[2] WHO GHO Malaria Homepage, https://www.who.int/gho/malaria/en/.
[3] K. Mitiku, G. Mengistu, and B. Gelaw, “The reliability of blood film examination for malaria at the peripheral health unit”, Ethiop Journal of Health Development, 17(3), 2003, pp. 197–204.
[4] N. Tangpukdee, C. Duangdee, P. Wilairatana, and S. Krudsood, “Malaria diagnosis: a brief review”, The Korean journal of parasitology, 47(2), 2009, pp. 93-102.
[5] C. M. Hommelsheim, L. Frantzeskakis, M. Huang, and B. Ülker, “PCR amplification of repetitive DNA: a limitation to genome editing
technologies and many other applications”, Scientific Reports 4(1), 2014, pp. 1-13.
[6] C. Wongsrichanalai, M. J. Barcus, S. Muth, A. Sutamihardja, and W. H. Wernsdorfer, “A review of malaria diagnostic tools: microscopy and rapid diagnostic test (RDT)”, The American journal of tropical medicine and hygiene ,77(6_Suppl), 2007, pp. 119-127
[7] P. Pundir, S. Aggarwal, and M. Deshmukh, “Malaria detection using convolutional neural network”, International Conference on Advanced Machine Learning Technologies and Applications, Springer, Singapore, 2020, pp. 187-195
[8] F. B. Tek, A. G. Dempster, and I. Kale, “Malaria parasite detection in peripheral blood images”, BMVA, 2006, pp. 347-356.
[9] H. A. Mohammed, and I. A. M. Abdelrahman, “Detection and classification of malaria in thin blood slide images”, 2017 International Conference on Communication, Control, Computing and Electronics Engineering (ICCCCEE), IEEE, Khartoum, 2017, pp. 1-5.
[10] Y. Dong, Z. Jiang, H. Shen, W. D. Pan, L. A. Williams, V. V. Reddy, W. H. Benjamin, and A. W. Bryan, “Evaluations of deep convolutional neural networks for automatic identification of malaria infected cells”, 2017 IEEE EMBS International Conference on Biomedical & Health Informatics (BHI), IEEE, Orlando, 2017, pp. 101-104.
[11] D. K. Das, M. Ghosh, M. Pal, A. K. Maiti, and C. Chakraborty, “Machine learning approach for automated screening of malaria parasite using light microscopic images”, Journal of Micron, vol. 45, 2013, pp. 97-106.
[12] A. Vijayalakshmi, “Deep learning approach to detect malaria from microscopic images”, Multimedia Tools and Applications, 2019, pp. 1-21.
[13] Z. Liang, A. Powell, I. Ersoy, M. Poostchi, K. Silamut, K. Palaniappan, P. Guo, M. A. Hossain, A. Sameer, R. J. Maude, and J. X. Huang, “CNN based image analysis for malaria diagnosis”, 2016 IEEE International Conference on Bioinformatics and Biomedicine (BIBM), IEEE, Shenzhen, 2016, pp. 493-496.
[14] J. Hung, and A. Carpenter, “Applying faster R-CNN for object detection on malaria images”, Proceedings of the IEEE conference on computer vision and pattern recognition workshops, Honolulu, 2017, pp. 56-61.
[15] Towards Data Science Image Pre-processing Homepage, https://towardsdatascience.com/image-pre-processing-c1aec0be3edf.
[16] I. Goodfellow, Y. Bengio, A. Courville, and Y. Bengio, Deep learning, Vol. 1, no. 2, Cambridge: MIT press, 2016.
[17] NLM Malaria Datasets Homepage, https://lhncbc.nlm.nih.gov/publication/pub9932.
[18] A. Rahman, H. Zunair, M. S. Rahman, J. Q. Yuki, S. Biswas, M. A. Alam, N. B. Alam, and M. R. C. Mahdy, “Improving malaria parasite detection from red blood cell using deep convolutional neural networks”, arXiv preprint arXiv:1907.10418, 2019, pp. 1-33.
[19] R. Kaushik, and S. Kumar, “Image segmentation using convolutional neural network”, Internation Journal of Scientific & Technology Research, Volume 8, Issue 11, November 2019.
[20] Tutorialspoint OpenCV Gaussian Blur Homepage, https://www.tutorialspoint.com/opencv/opencv_gaussian_blur.htm
[21] MathWorks Morphological Operations Homepage, https://in.mathworks.com/help/images/morphological-filtering.html
ISSN No. (Online) - 2368-1209 ISSN No. (Print) - 2691-5944
American Journal of Advanced Computing IEM-ICDC 2020 Special Issue on "Computational Intelligence and Smart Information and Communication Technology" January 2021, Volume 1, Issue 1
38

Prime Generation: Algorithms and Analyses Shreya Guha
Department of Computer Science and Engineering Institute of Engineering and Management
Kolkata, India [email protected]
ORCID: 1*[0000-0001-5644-9091]
Abstract—The paper deals with some well known as well as new prime generation methods. The concepts of RSA cryptosystem, primality testing, and the need for prime number generation methods have been discussed briefly in this literature. In this paper the prime generation algorithms are studied and analysed and various methods of speeding up the process of generation of probable primes are suggested. As one traverses from Algo 1 to Algo 3, making the necessary changes in the conditions as mentioned below in the text, a speedup can be achieved leading to a significant reduction in the computational complexity. In the final algorithm, a random k-bit odd number is chosen which undergoes n iterations of the Miller-Rabin test. If the test fails in any of the rounds, the number is incremented, maintaining the conditions as mentioned in the algorithm, and the process is continued. This method leads to a significant decrease in the computational complexity as discussed in the paper.
Keywords—Cryptosystem, Miller-Rabin test, primes, primality test, prime number generation, probable primes
I INTRODUCTION
Almost all public-key cryptosystems such as RSA, Diffie – Hellman key exchange, and El Gamal signatures make use of large and random prime numbers. Thus fast and efficient generation of prime numbers is a necessity in such cryptosystems. The RSA public-key cryptosystem is one of the first and most popular public-key cryptosystems which was built on the idea of an asymmetric public-private key. The concept of asymmetry arises from the concept of difficulty in the factorization of the product of large prime numbers. The key generation of RSA cryptosystem uses this theory. It chooses two distinct large primes p1 and p2, multiplies them, and then the rest of the algorithm follows. The algorithm has been discussed extensively in [19]. It is often very difficult to retrieve the factors p1 and p2 from the multiplied value, if both p1 and p2 are very large random prime numbers. Thus the generation of large primes becomes a topic of utmost importance. The process of prime number generation using various concepts of primality testing have been discussed extensively in the following sections of the proposed literature.
II PRIMALITY TESTS
Primality testing algorithms help us to determine whether a number is prime or composite. Such algorithms find their applications in cryptography. Primality testing can be both probabilistic as well as deterministic. In this paper, we develop our algorithms based on probabilistic primality testing. Some of the most common probabilistic primality tests include the Fermat primality test, the Solovay-Strassen primality test, and the Miller-Rabin primality test. The Fermat primality test is the simplest amongst the three with Solovay-Strassen and Miller-Rabin being the more sophisticated alternatives. Amongst these, the Miller-Rabin test is the most commonly used one since it can detect strong pseudo-primes, which the Fermat’s test is unable to do, as well as it can determine a prime number more accurately than Solovay-Strassen. The Miller-Rabin algorithm is briefly described below.
Miller-Rabin(n):
1. Choose an odd number n such that 𝑛 ≥ 3. Take an integer variable m and assign n to m.
2. Express n as 𝑛 = (2 ) ∗ 𝑦 + 1 where 𝑥 ≥ 1 and gcd(2, y) = 1.
3. Choose a random integer b such that 𝑏 ∈ [2, 𝑛 −2].
4. 𝑡 ← 𝑏 (𝑚𝑜𝑑𝑛) 5. If 𝑡 ≡ 1(𝑚𝑜𝑑𝑛)
return (“Maybe Prime”) Go to Step 7.
6. for (i ← 0 to x − 1) { if 𝑡 ≡ −1(𝑚𝑜𝑑𝑛) return (“Maybe Prime”).
𝑡 ← 𝑡 (𝑚𝑜𝑑𝑛) return (“Surely Composite”).
7. End In the above algorithm, we input a number n. If the number is detected to be prime the algorithm displays “Maybe Prime” as output, else it displays “Surely Composite” as output. For a more extensive discussion on this material, one can refer to [15] and [17].
III PROBABILISTIC PRIME GENERATION
In the following sections, we will look at some of the probabilistic prime generation methods which will use the Miller-Rabin test for primality. The Miller-Rabin test produces one of the outputs, either “Maybe Prime” or “Surely Composite”.
For any odd composite number, the probability that Miller-Rabin test declares the integer as prime is less than ¼. Using the Miller-Rabin algorithm, we formulate and discuss various algorithms as discussed in the subsequent text.
IV NAIVE PRIME GENERATOR
Say we have set Ok which denotes the set of all odd numbers in the interval [2k-1,2k) where k denotes the bit length of the prime number which is to be generated. To generate a probable prime number we need to choose an element 𝑚 such that 𝑚 ∈ 𝑂 . In the algorithm described below, the element undergoes only one iteration of the Miller-Rabin primality testing algorithm. The Miller-Rabin test displays “Is-composite” as output if the number is detected to be composite, otherwise, it displays “Maybe Prime.” (The Miller-Rabin test is illustrated in Section II).
American Journal of Advanced Computing IEM-ICDC 2020 Special Issue on "Computational Intelligence and Smart Information and Communication Technology" January 2021, Volume 1, Issue 1
ISSN No. (Online) - 2368-1209 ISSN No. (Print) - 2691-5944
39
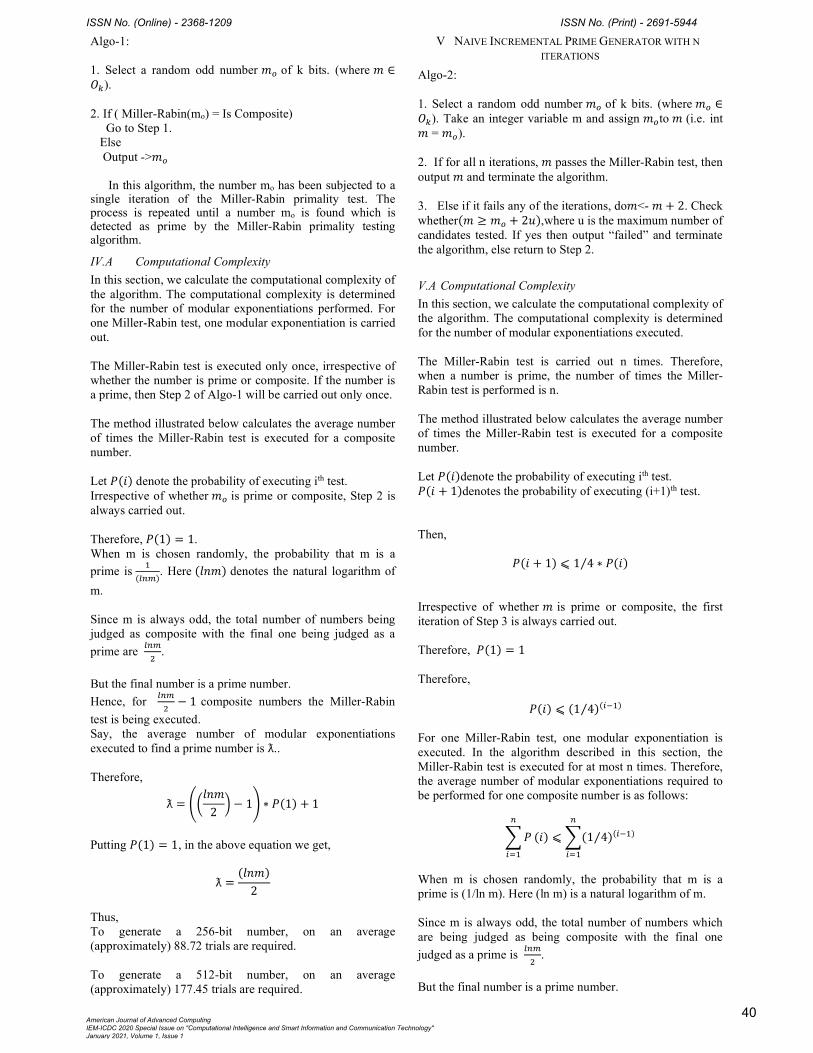
Algo-1: 1. Select a random odd number 𝑚 of k bits. (where 𝑚 ∈𝑂 ). 2. If ( Miller-Rabin(mo) = Is Composite) Go to Step 1. Else Output ->𝑚
In this algorithm, the number mo has been subjected to a single iteration of the Miller-Rabin primality test. The process is repeated until a number mo is found which is detected as prime by the Miller-Rabin primality testing algorithm.
IV.A Computational Complexity
In this section, we calculate the computational complexity of the algorithm. The computational complexity is determined for the number of modular exponentiations performed. For one Miller-Rabin test, one modular exponentiation is carried out. The Miller-Rabin test is executed only once, irrespective of whether the number is prime or composite. If the number is a prime, then Step 2 of Algo-1 will be carried out only once. The method illustrated below calculates the average number of times the Miller-Rabin test is executed for a composite number. Let 𝑃(𝑖) denote the probability of executing ith test. Irrespective of whether 𝑚 is prime or composite, Step 2 is always carried out. Therefore, 𝑃(1) = 1. When m is chosen randomly, the probability that m is a
prime is ( )
. Here (𝑙𝑛𝑚) denotes the natural logarithm of
m. Since m is always odd, the total number of numbers being judged as composite with the final one being judged as a
prime are .
But the final number is a prime number.
Hence, for − 1 composite numbers the Miller-Rabin
test is being executed. Say, the average number of modular exponentiations executed to find a prime number is ƛ.. Therefore,
ƛ =𝑙𝑛𝑚
2− 1 ∗ 𝑃(1) + 1
Putting 𝑃(1) = 1, in the above equation we get,
ƛ =(𝑙𝑛𝑚)
2
Thus, To generate a 256-bit number, on an average (approximately) 88.72 trials are required. To generate a 512-bit number, on an average (approximately) 177.45 trials are required.
V NAIVE INCREMENTAL PRIME GENERATOR WITH N
ITERATIONS
Algo-2: 1. Select a random odd number 𝑚 of k bits. (where 𝑚 ∈𝑂 ). Take an integer variable m and assign 𝑚 to 𝑚 (i.e. int 𝑚 = 𝑚 ). 2. If for all n iterations, 𝑚 passes the Miller-Rabin test, then output 𝑚 and terminate the algorithm. 3. Else if it fails any of the iterations, do𝑚<- 𝑚 + 2. Check whether(𝑚 ≥ 𝑚 + 2𝑢),where u is the maximum number of candidates tested. If yes then output “failed” and terminate the algorithm, else return to Step 2.
V.A Computational Complexity
In this section, we calculate the computational complexity of the algorithm. The computational complexity is determined for the number of modular exponentiations executed. The Miller-Rabin test is carried out n times. Therefore, when a number is prime, the number of times the Miller-Rabin test is performed is n. The method illustrated below calculates the average number of times the Miller-Rabin test is executed for a composite number. Let 𝑃(𝑖)denote the probability of executing ith test. 𝑃(𝑖 + 1)denotes the probability of executing (i+1)th test. Then,
𝑃(𝑖 + 1) ⩽ 1 4⁄ ∗ 𝑃(𝑖) Irrespective of whether 𝑚 is prime or composite, the first iteration of Step 3 is always carried out. Therefore, 𝑃(1) = 1 Therefore,
𝑃(𝑖) ⩽ (1 4⁄ )( ) For one Miller-Rabin test, one modular exponentiation is executed. In the algorithm described in this section, the Miller-Rabin test is executed for at most n times. Therefore, the average number of modular exponentiations required to be performed for one composite number is as follows:
𝑃 (𝑖) ⩽ (1 4⁄ )( )
When m is chosen randomly, the probability that m is a prime is (1/ln m). Here (ln m) is a natural logarithm of m. Since m is always odd, the total number of numbers which are being judged as being composite with the final one
judged as a prime is .
But the final number is a prime number.
American Journal of Advanced Computing IEM-ICDC 2020 Special Issue on "Computational Intelligence and Smart Information and Communication Technology" January 2021, Volume 1, Issue 1
ISSN No. (Online) - 2368-1209 ISSN No. (Print) - 2691-5944
40

Hence, the number of composite numbers for which the
Miller-Rabin test is executed is − 1.
Say, the average number of modular exponentiations executed to find a prime number is ƛ.. Therefore,
ƛ ⩽𝑙𝑛𝑚
2− 1 ∗ (1 4⁄ )( ) + 𝑛
To generate a 256-bit number, if the algorithm undergoes 20 iterations, a maximum of (approximately) 58.48 trials are required. To generate a 512-bit number, if the algorithm undergoes 20 iterations, a maximum of (approximately) 117.63 trials are required.
V.B Error Probability
In this section, we will calculate the error probability of Algo-2. Let B -> Event when Algo-2 displays a composite number as output. Let 𝑝( , , )= Probability (B). Let Ci -> Set of composite numbers amongst the set of odd numbers Ok whose probability of passing the Miller-Rabin test is greater than 1/2i. Let c be some constant. Let s = c log (2k). Then,
𝑝( , , ) ≤ 2( ∗ ) ∗ 0.7 + 𝑃 (𝐶 )2 ( ) ∗ 0.5𝑐𝑘
∗ (𝑐𝑘) where 𝐼 ≥ 3and P(Ci) is the probability of a number being randomly chosen from the set Ci. Also, expressing 𝑝( , , ) as a function of k, satisfies the following condition:
𝑝( , , ) ≤ ℘𝑘 2 √ where ℘ is a constant. The proofs of the above results are illustrated in details in [2]
VI AN IMPROVEMENT OVER “NAIVE INCREMENTAL PRIME
GENERATOR WITH N ITERATIONS”
Algo-3: 1. Define 𝜋 as 𝜋 = 2 ∗ 3 ∗ 5 ∗ 7 ∗ 11 ∗ 13. 2. Select a random odd number 𝑚 of k bits. (where 𝑚 ∈𝑂 ) such that gcd(𝜋, 𝑚 ) = 1. Take an integer variable m and assign 𝑚 it to m (i.e. int m = 𝑚 ). 3. If for all n iterations, m passes the Miller-Rabin test, then output m and terminate the algorithm.
4. Else if it fails any of the iterations, do 𝑚<- 𝑚 + 𝜋. Check whether(𝑚 ≥ 𝑚 + 𝜋𝑢), where u is the maximum number of candidates tested. If yes then output “failed” and terminate the algorithm, else return to Step 2. In Step1 and Step2 we define 𝜋and try to find a number m which is relatively prime to 𝜋 , implying that it is not divisible by any of the factors of 𝜋. As a result, the number of times the primality test is being performed is reduced.
VI.A Computational Complexity
In this section, we calculate the computational complexity of the algorithm. The Miller-Rabin test is executed n times. Therefore, when a number is prime, the number of times the Miller-Rabin test is executed is n. The method illustrated below calculates the average number of times the Miller-Rabin test is carried out for a composite number. Let P (i) denote the probability of executing ith test. P (i+1) denotes the probability of executing (i+1)th test. Then,
𝑃(𝑖 + 1) ⩽ 1 4⁄ ∗ 𝑃(𝑖) Irrespective of whether N is prime or composite, the first iteration of Step 3 is always carried out. Therefore, P (1) = 1 Therefore,
𝑃(𝑖) ⩽ (1 4⁄ )( ) For one Miller-Rabin test, one modular exponentiation is executed. In Algo-3, the Miller-Rabin test is executed at most n times. As a result, the average number of modular exponentiations executed for one composite number is as follows:
𝑃 (𝑖) ⩽ (1 4⁄ )( )
When m is chosen randomly, probability that m is a prime is (1/ln m). Here (ln m) is a natural logarithm of m. Since m is always coprime to 𝜋 , there is a reduction of average number of primality tests performed by a factor of Φ(2*3*5*7*11*13) / 2*3*5*7*11*13 = 192 / 1001. Therefore, The total number of numbers being judged as composite
with the final one being determined as a prime is ∗ 𝑙𝑛𝑚.
But the final number is a prime number. Hence, the number of composite numbers for which the
Miller-Rabin test is executed is ∗ 𝑙𝑛𝑚 − 1.
Say, average number of modular exponentiations executed to find a prime number is ƛ.. Therefore,
ƛ ⩽192
1001∗ 𝑙𝑛𝑚 − 1 ∗ (1 4⁄ )( ) + 𝑛
American Journal of Advanced Computing IEM-ICDC 2020 Special Issue on "Computational Intelligence and Smart Information and Communication Technology" January 2021, Volume 1, Issue 1
ISSN No. (Online) - 2368-1209 ISSN No. (Print) - 2691-5944
41

To generate a 256-bit number, if the algorithm undergoes 20 iterations, a maximum of (approximately) 22.02 trials are required. To generate a 512-bit number, if the algorithm undergoes 20 iterations, a maximum of (approximately) 44.71 trials are required.
VII A TABULAR REPRESENTATION OF NUMERICAL
FINDINGS IN BRIEF
In the preceeding sections of the paper, computational
complexities are calculated for Algo-1, Algo-2 and Algo-3. For Algo-3, there is a notable decrease in the computational complexity over the other algorithms. This is tabulated below for 256-bit and 512-bit numbers.
TABLE I
Number of Computations (approximately)
No. of bits Algo-1 Algo-2 Algo-3
256 88.72 58.48 22.02 512 177.45 117.63 44.71
1 Table 1. Number of computations performed by the algorithms
VIII DISCUSSIONS
The present work, discusses various prime generation algorithms and proposes how some significant changes in the algorithms can lead to a noteworthy change in the computational complexity. The above algorithms clearly illustrate this phenomenon as we implement the naive prime generators in the initial algorithms and execute the concept of incremental search with repeated iterations in addition to the naive prime generators in the later algorithms. Furthermore, Algo-3 leads to a significant reduction of computational complexity over Algo-2. This is also illustrated in TABLE I of Section VII for 256-bit and 512-bit numbers. Thus the value of the final algorithm is established over the previous two.
IX CONCLUSION
In this paper, it is shown that, Algo-3 outperforms all the previous algorithms discussed. There is a significant reduction in the computational complexity of the algorithms as we gradually move from naive prime generator algorithms to later algorithms which execute the basic concept of naive prime generators along with incremental search, where the increment occurs by a certain factor, maintaining the constraints as mentioned in the algorithms, whenever required, for repeated iterations. Thus it is established that to go for the final algorithm as described in Section VI is more lucrative over the simpler alternatives, as our final algorithm has been demonstrated to fare as the most effective strategy for our illustrated numerical situation than the previous ones. Hence the value of the final algorithm is vindicated.
ACKNOWLEDGMENT
Helpful discussions with Prof. Avishek Adhikari of Presidency University, Kolkata are gratefully acknowledged.
REFERENCES 1 Brandt, J., Damgård, I., & Landrock, P. (1991, November). Speeding
up prime number generation. In International Conference on the Theory and Application of Cryptology (pp. 440-449). Springer, Berlin, Heidelberg
2 Brandt, J., & Damgård, I. (1992, August). On generation of probable primes by incremental search. In Annual International Cryptology Conference (pp. 358-370). Springer, Berlin, Heidelberg.
3 Bosma, W., & van der Hulst, M. P. (1989, April). Faster primality testing. In Workshop on the Theory and Application of of Cryptographic Techniques (pp. 652-656). Springer, Berlin, Heidelberg.
4 Brillhart, J., Lehmer, D. H., & Selfridge, J. L. (1975). New primality criteria and factorizations of 2^{?}±1. Mathematics of computation, 29(130), 620-647.
5 Couvreur, C., & Quisquater, J. J. (1982). Introduction to fast generation of large prime numbers. Philips J. Res., 37(5), 231-264.
6 Gallagher, P. X. (1976). On the distribution of primes in short intervals. Mathematika, 23(1), 4-9.
7 Gordon, J. (1984, April). Strong primes are easy to find. In Workshop on the Theory and Application of of Cryptographic Techniques (pp. 216-223). Springer, Berlin, Heidelberg.
8 Futa, Y., Ono, T., & Ohmori, M. (2006). U.S. Patent No. 7,130,422. Washington, DC: U.S. Patent and Trademark Office.
9 Hardy, G. H., & Littlewood, J. E. (1923). Some problems of ‘Partitio numerorum’; III: On the expression of a number as a sum of primes. Acta Mathematica, 44, 1-70.
10 Joye, M., Paillier, P., & Vaudenay, S. (2000, August). Efficient generation of prime numbers. In International Workshop on Cryptographic Hardware and Embedded Systems (pp. 340-354). Springer, Berlin, Heidelberg.
11 Knuth, D. (1981). Seminumerical algorithms. The art of computer programming, 2.
12 Kim, S. H., & Pomerance, C. (1989). The probability that a random probable prime is composite. Mathematics of Computation, 53(188), 721-741.Kim, S. H., & Pomerance, C. (1989). The probability that a random probable prime is composite. Mathematics of Computation, 53(188), 721-741.
13 Menezes, A. J., Katz, J., Van Oorschot, P. C., & Vanstone, S. A. (1996). Handbook of applied cryptography. CRC press.
14 Mihailescu, P. (1994, August). Fast generation of provable primes using search in arithmetic progressions. In Annual International Cryptology Conference (pp. 282-293). Springer, Berlin, Heidelberg.
15 Miller, G. L. (1975, May). Riemann's hypothesis and tests for primality. In Proceedings of the seventh annual ACM symposium on Theory of computing (pp. 234-239).
16 Pocklington, H. C. (1914). The determination of the prime or composite nature of large numbers by Fermat's theorem. Proc. Cambridge Philosophical Society, 1914, 18, 29-30.
17 Rabin, M. O. (1980). Probabilistic algorithm for primality testing. Journal of number theory, 12, 128-138.
18 Riesel, H. (1985). Factorization. In Prime Numbers and Computer Methods for Factorization (pp. 146-222). Birkhäuser, Boston, MA.
19 Rivest, R. L., Shamir, A., & Adleman, L. (1978). A method for obtaining digital signatures and public-key cryptosystems. Communications of the ACM, 21(2), 120-126.
20 Solovay, R., & Strassen, V. (1977). A fast Monte-Carlo test for primality. SIAM journal on Computing, 6(1), 84-85.
American Journal of Advanced Computing IEM-ICDC 2020 Special Issue on "Computational Intelligence and Smart Information and Communication Technology" January 2021, Volume 1, Issue 1
ISSN No. (Online) - 2368-1209 ISSN No. (Print) - 2691-5944
42


