Who’s talking about you? Using Altmetrics in Library Assessment Melanie Cassidy Learning and Curriculum Support Librarian Ali Versluis Research and Scholarship Librarian Melanie Parlette-Stewart Digital Media Librarian University of Guelph
Transcript
Who’s talking about you?
Using Altmetrics in Library AssessmentMelanie Cassidy
“ Altmetrics is the creation and study of new metrics based on the social web for analysing, and informing scholarship.”- altmetrics.org
MPS
● But what is almetrics? “Altmetrics is the creation and study of new metrics based on the social web for analysing, and informing scholarship.” - altmetrics.org
● More than this. What does the literature tell us?
What does the literature
tell us?
Social Media in Academia Variety of tools to compile metrics - like altmetric.com and impact story.
Social ListeningSocial listening is process of tracking conversations around specific topics, keywords, phrases, brands or industries, and leveraging these.
Moving Beyond NotificationsIf you’re only paying attention to notifications, you’re missing a huge group of people that are talking about you.
MPS
● Social media use in academia - social networking (time consuming), social bookmarking and reference management, social data sharing, video, blogging, Twitter, Wikis, social recommending, rating. Lots of other facts - age, rank and status, gender, discipline, language. Variety of tools to compile metrics - like altmetric.com and impact story. Critical issues include data quality (Sugimento) (connection to what we’re going to talk about. This new way of looking at social media and libraries can extend beyond scholarship and into how we understand services and events. We’re going to move beyond research impact.
● Traditional altmetrics looks at Altmetrics is diversified in nature and categorised in five categories i.e. (i) recommended (ii) cited (iii) saved (iv) discussed and (v) viewed. We’re going to share how you can apply similar approaches to service and events (Ashok) - capitalizing on the social listening opportunities. If you’re only paying attention to notifications, you’re missing a huge group of people that are talking about you, your brand and your product. Track overall brand health Create content your audience craves Generate ideas for marketing campaigns Improve your customer experience Drive strategic product
● decisions● Social listening is process of tracking conversations around specific
topics, keywords, phrases, brands or industries, and leveraging your insights to discover opportunities or create content for those audiences. (Sprout Social)
● We need to be able to anticipate change and plan accordingly and will allow us to be empowered (Peacemaker)
● Know where we’re having an impact online allows us to focus on what matters more - for some libraries this means more Instagram and less Pinterest (Peacemaker)
● Ability to use a “content strategy” and focus on planning and management for content and workflows (Peacemaker)
2Searching + Collecting
MPS
How are you currently
using social media?
What can you track?
Consumption⊙ Page views⊙ Unique visitors⊙ Average time
on page⊙ Email opens⊙ Asset
downloads⊙ Form
completions
Retention⊙ Return rate⊙ Bounce Rate⊙ Pages per visit⊙ Follower Count
MPS Source: Beyond ROI: Unlocking the Business Value of Social Media b y Susan Etlnger, Altimeter Group October 2017
Compiling the Data is the
first step.
Using this data to inform to inform actions and strategies.
MPS
Compiling data is the first stepUsing this data to inform to inform actions and strategies “ amplify messaging that’s receiving positive interaction, respond appropriately to anything that’s triggered a negative response, and see trends over time that can keep your future marketing”Listening = Using Altmetrics
● Date● Network● Type of Post● Sentiment (Positive/Negative/Neutral)● Categories● Subcategories● Post Details● Impressions● Comments● Likes● Shares● Clicks● Total Engagement
Identify best performing.Identify trends.MPS https://www.socialmediaexaminer.com/analyze-social-media-with-excel/COOL: https://d2myx53yhj7u4b.cloudfront.net/sites/default/files/IC-SocialMediaReport.xlsx
Melc: I’m going to talk for a minute about analyzing the data, and to do this I want to tell you a bit about how we worked through this process.
Case Study:Take a
Paws
Melc: we worked on this process with an event called Take a Paws.
Take a Paws is an event that happens on the University of Guelph campus, where dogs are brought into the library and students have the opportunity to meet the dogs and pet them and play with them. It’s a great way of reducing stress at a busy time of year. We decided to look at what people were saying about Take a Paws and see if we could learning anything new, or if we could at least confirm what we suspected, which is that people generally really enjoy Take a Paws.
Analyzing the Data
Melc: This is a screenshot of some of the data we collected. For this example we looked at comments and posts that were openly available on Facebook, Twitter, and Instagram.
Analyzing the Data
Melc: We looked at what people were saying in their comments and replies, what kinds of responses they were getting, and tried to determine whether those comments and responses were positive, negative, or neutral. I’ll take you through what’s on the screen here.
Analyzing the Data
Melc: The first column captures what platform we found these comments on, followed by the hierarchy of the post. Facebook and Instagram both allow for two levels of nested responses. We’ve indicated in column two which comments were original posts, which ones were replies to the original post - designated Level 1 replies - and which ones were replies to replies - designated Level 2 Replies. The next column is the content of the post or reply. You’ll notice that some of the comments here simply say name tag/mention - that’s because most social media platforms allow you to tag someone in a post by typing in their name, and that person will get a notification that links to the post. People often use this as a way of drawing a specific person’s attention to something on facebook or twitter, or instigating a conversation.
In the next column we tracked how many likes or favourites a post or reply received, and then how many comments were replying directly to that post or reply. We coded the comments into categories, in this case the extremely broad: Positive, Negative,
and Neutral. For the most part because we were just feeling our way through the process, we kept coding of the statements pretty simple.
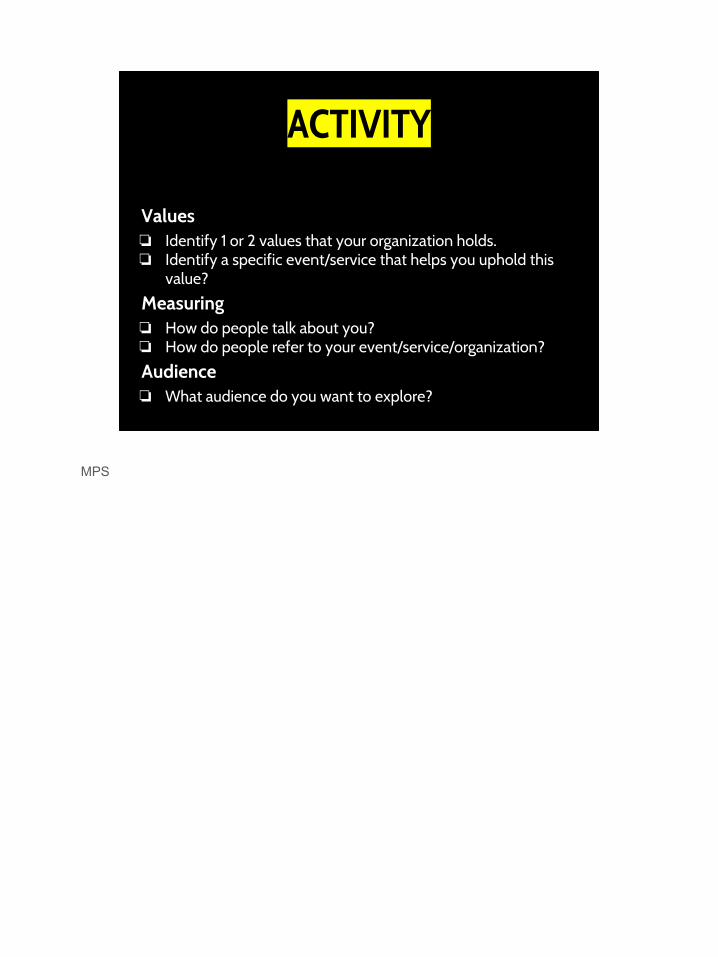
ACTIVITY
Try coding a set of sample data from our project.1. What categories might you create for coding? 2. Are there any comments you do not understand?3. What patterns do you notice in the data?4. What additional information would you collect to help
understand the data?
What did you learn from this experience?
Mel c: Before we talk about what specific things we learned from this experience, we want to get you to try going through the coding process yourself with a sample of our data. There should be some sample data in your handout package, and we’d like you to consider these questions while you’re working on this [read questions aloud]
2-3 minutes for coding2min to debrief
What kinds of things did you learn from that exercise? [prompt with slide questions, if necessary] - (mel c is finding it akward to ask Qs of the audience in sessions so far, might prefer silent reflection)
Acceptable learning outcomes: ● it’s difficult to understand what people mean on social media● how well do we understand our students and the language they speak● you need to know something of pop culture references and how people
communicate on the internet to make sense of these comments● we don’t always have enough data to draw real conclusions
● It is tempting to make assumptions about students/feel overconfident
What did we learn?
Mel c:Here are some of the things we learned from our Take a Paws example.
Assumptions guided decisions.
Mel c:
In some ways what’s more useful is look at where we failed, with regard to coding. In hindsight I think the broad approach we took to coding was a result of some assumptions we made that may or may not have been correct. For example I assumed, based on what I have seen at the Take a Paws events in person, that responses to the event would be overwhelmingly positive, and the data doesn’t support that assumption.
(as you noticed) it’s quite difficult to interpret many of the comments people made. I consider myself to be pretty hip to the way people speak on social media, but the thing about pop culture and internet memes is you don’t always know when you’re missing something. For example, there were a series of facebook comments that I think referenced a comic strip called Dragon Bros but I’m not sure, and if it is a reference I’m not sure how that changes my understanding of the comments, and how that compares to my understanding of the comments if I don’t get the reference.
Finally, when we look at the response rates, we see that 52% of the comments on social media were positive, 4% were negative, and the remaining comments were impossible to interpret or were people tagging other people. If we’re being frank we have to admit that 52% is not an impressive number. Nobody is going to put 52% approval rating on their CV. It’s nice when you flip it and see there’s only a 4% negative response rate, but one conclusion here is that the results are inconclusive. Part of the complexity here is that we don’t really have a benchmark for what good rates of response are, so while the results seem initially inconclusive and ambiguous, we don’t really have a standard for what to expect.
4Sharing, Communicating + Acting
Melc:
Having said all that, we did learn one thing from the data we collected. A pattern among people who commented was that they were hoping to make appointments at the same time as friends, and this wasn’t always possible because appointment slots filled up quickly. I took this information to the group in the library that is responsible for organizing Take a Paws, and have started a conversation around how we might be able to address this issue and possibly make the experience more satisfying for students.
What are you going to do with the data?
Melc:
This goes back to the idea that you should be thinking about what you want to do with what you’ve learned in this process. One of the dangers in situations like these to just begin gathering data, see what people are saying, and go huh okay that’s interesting, and that’s pretty much the end of it. I think it’s reasonable to find that your plan changes once you start gathering data, but it is important and useful to have a plan at the outset.
How will you preserve the data?
Melc:
It’s also important to remember, when thinking about how you can share your data, that preservation will be pretty important here. There are a number of places where you can share and preserve data - an institutional repository, google drive - think about where you are keeping your data, how safe or stable it will be, how easy it is for you to share it, will it still be there in 10 years if you want to find it? Spend some time upfront thinking about how you will share and preserve your data in a way that is safe and useable.
(end of melc)
5Limitations
+Best Practices
Because what would a presentation be without some caveats, we also wanted to talk about some of the limitations with the process as we’ve laid it out.
Limitations + Considerations
lack/complexity/technicality
of the information
You might run into any number of limitations, which could be either related to content, technical issues, or staffing. Maybe noone is talking about you. Maybe the data is too hard to find or understand. While such a barrier may pose some serious challenges, you may find that it reveals something or shifts your thinking. For example, if no one is talking about you, maybe you want to think about why this is the case.
Limitations + Considerations
lack/complexity/technicality
of the information
time
You also want to allow yourself enough time. What does your staffing and workload look like? To do this, will people have to learn to use a new tool or develop a new skill? These things do take time to learn, so depending on both the extent/depth of your intended analysis as well as your current resources, you may find that this isn’t something that you can sustainably explore at this time.
Limitations + Considerations
lack/complexity/technicality
of the information
time ethics
And of course, we have to acknowledge the ethical implications of this exercise. More specifically, what are the ethics of searching for information on platforms that people use in intensely personal ways, that they don’t assume anyone (let alone their local library) is mining? We felt that this was acceptable, given that a) the information was publicly available and b) that we were anonymizing all the data that we collected.
Ultimately, we think analyzing altmetrics in this way is important, because you can usually glean a lot more information from folks when they are around people they trust (friends or colleagues on a social media site) and away from authority figures or folks who are trying to collect data in a more formalized way.
Best Practices
Consider + understand expertise
In terms of best practices, there are a few things to keep in mind.
You’ll want to consider and understand expertise. Do you or your staff have the know-how to run a meaningful analysis of the data? This expertise goes beyond just knowing the tool -- you should understand slang, acronyms, and the way people communicate or share information across the platform. For example, if someone tagged another user and then wrote OMG PUPPIES ARE BAE, would you know what that meant? What is BAE anyway? I’m a person who spends *a lot* of time on the internet, I just found out what bae meant a few months ago. As Melanie mentioned, you may not always be able to read much into comments, but having a firm grasp of the tool, its structure, and the demographics of its users will help. In terms of getting yourself oriented with the tool, we recommend exploring publicly available accounts or pages just to get an idea of how people interact with and use the tool. Resources like urbandictionary.com are also immensely helpful in explaining any acronyms or jargon you might be familiar with.
Best Practices
Workplace dynamics
You’ll also want to think about your institutional politics and work dynamics. This will determine what sorts of opportunities you have to explore and what sort of leeway you have to make good on your findings. You may be hearing or presenting things that your colleagues or management don’t want to hear, so it’s important to have a clear understanding of whose responsibility it will be to conduct this type of assessment and who will ultimately be responsible for making it actionable. Articulating these responsibilities in advance will help you mitigate a headaches later, and will ensure that you’re not wasting time collecting data that you’ll never be able to use.
Best Practices
Reflect, Reflect, Reflect
And lastly, reflect, reflect, reflect! This might seem like an obvious thing, but its importance can’t be overstated. You want to be reflecting throughout the entire process, from the project’s inception to its completion. As the Melanies pointed out, you will of course want to think about what service/event/etc you’re trying to analyze and how to do that, but you’re also going to want to reflect on how the process shook out. What worked or didn’t? How do you personalize this process for your own context?
It’s important to note here that using altmetrics should be part of larger data-collection and assessment strategies, which may include things such as focus groups, questionnaires, and number gathering. Just like a researcher wouldn’t use the amount of times that their research was tweeted or saved as an authoritative indicator of impact (as they will acknowledge things like citation counts and h-index), you should be using altmetric data as one particular tool within a larger data collection and assessment toolkit.
⊙ Sugimoto, C. R., Work, S., Larivière, V., & Haustein, S. (2017). Scholarly use of social media and altmetrics: A review of the literature. Journal of the Association for Information Science and Technology, 68(9), 2037-2062.
⊙ Winn, D., Rivosecchi, M., Bjerke, J., & Groenendyk, M. (2017). MTL 2.0: A Report on the Social Media Usage and User Engagement of the “Big Four” Academic Libraries in Montréal. The Journal of Academic Librarianship.
⊙ Peacemaker, B., Robinson, S., & Hurst, E. J. (2016). Connecting best practices in public relations to social media strategies for academic libraries. College & Undergraduate Libraries, 23(1), 101-108.
⊙ Kumar, A., Choukimath, P. A., Shivarama, J., & Angadi, M. (2016). Altmetrics: The Emerging Alternative Metrics for Web Research Analysis.
⊙ Liu, J., Tu-Keefner, F., Zamir, H., & Hastings, S. K. (2017). Social Media as a Tool Connecting with Library Users in Disasters: A Case Study of the 2015 Catastrophic Flooding in South Carolina. Science & Technology Libraries, 36(3), 274-287.
This presentation uses the following typographies and colors:⊙ Titles: Cabin condensed⊙ Body copy: Cabin
You can download the fonts on this page:https://www.google.com/fonts#UsePlace:use/Collection:Cabin:400,700,400italic,700italic|Cabin+Condensed:400,700
Click on the “arrow button” that appears on the top right
⊙ Black #000000⊙ Yellow #ffff00
You don’t need to keep this slide in your presentation. It’s only here to serve you as a design guide if you need to create new slides or download the fonts to edit the presentation in PowerPoint®