42


10/21/10
1
SAT Initiative: Abraham Lincoln Elementary School (East Chicago, IN)
This document describes the analysis of air monitoring and other data collected under EPA’s
initiative to assess potentially elevated air toxics levels at some of our nation’s schools. The
document has been prepared for technical audiences (e.g., risk assessors, meteorologists) and
their management. It is intended to describe the technical analysis of data collected for this
school in clear, but generally technical, terms. A summary of this analysis is presented on the
page focused on this school on EPA’s website (www.epa.gov/schoolair).
I. Executive Summary
• Air monitoring has been conducted at Abraham Lincoln Elementary School as part of the
EPA initiative to monitor specific air toxics in the outdoor air around priority schools in
22 states and 2 tribal areas.
• This school was selected for monitoring based on information indicating the potential for
elevated ambient concentrations of manganese, lead, arsenic, benzene, and
benzo(a)pyrene in air outside the school. That information included EPA’s 2002
National-Scale Air Toxics Assessment (NATA) for a nearby coke oven and steel facility.
Additionally, the school was ranked in the top 25 on the USA Today list due to 2005
Toxics Release Inventory (TRI) estimates of manganese emissions for the same nearby
facility.
• Air monitoring was performed from August 23, 2009 to December 9, 2009 for the
following pollutants: benzene and other volatile organic compounds (VOCs); arsenic,
manganese, and other metals in particulate matter less than 10 microns (PM10);
benzo(a)pyrene and other polycyclic aromatic hydrocarbons (PAHs); and lead in total
suspended particles (TSP).
• Measured levels of arsenic (PM10), benzene and benzo(a)pyrene and the associated
longer-term concentration estimates are below levels of concern. Additionally, levels of
lead, a pollutant for which there are national standards for ambient air, are below the
level of the national standard for protection of public health.
• Measured levels of manganese (PM10) and the associated longer-term concentration
estimate are slightly elevated, as suggested by the information available prior to
monitoring. The elevated level of manganese (PM10) indicates a potential for concern in
areas closer to the source, particularly as the nearby source operations were depressed
from usual operating conditions during air monitoring. Additional data, particularly at
locations closer to the source, would assist in further characterizing potential exposure in
the area.
• The levels of several monitored pollutants measured in the outdoor air at this school
indicate influence of a nearby source.
• To further investigate manganese concentrations in this community, particularly in areas
of the community closer to the source, EPA recommends additional monitoring for
manganese (PM10) in this area.
10/21/10
2
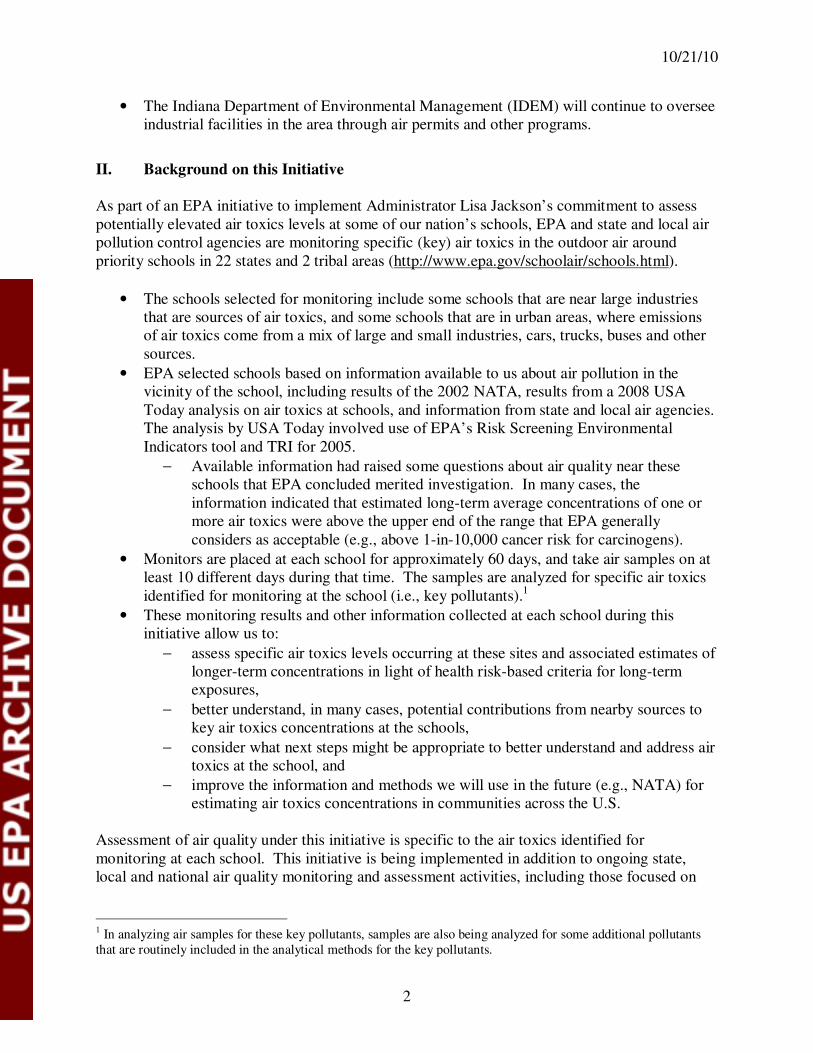
• The Indiana Department of Environmental Management (IDEM) will continue to oversee
industrial facilities in the area through air permits and other programs.
II. Background on this Initiative
As part of an EPA initiative to implement Administrator Lisa Jackson’s commitment to assess
potentially elevated air toxics levels at some of our nation’s schools, EPA and state and local air
pollution control agencies are monitoring specific (key) air toxics in the outdoor air around
priority schools in 22 states and 2 tribal areas (http://www.epa.gov/schoolair/schools.html).
• The schools selected for monitoring include some schools that are near large industries
that are sources of air toxics, and some schools that are in urban areas, where emissions
of air toxics come from a mix of large and small industries, cars, trucks, buses and other
sources.
• EPA selected schools based on information available to us about air pollution in the
vicinity of the school, including results of the 2002 NATA, results from a 2008 USA
Today analysis on air toxics at schools, and information from state and local air agencies.
The analysis by USA Today involved use of EPA’s Risk Screening Environmental
Indicators tool and TRI for 2005.
− Available information had raised some questions about air quality near these
schools that EPA concluded merited investigation. In many cases, the
information indicated that estimated long-term average concentrations of one or
more air toxics were above the upper end of the range that EPA generally
considers as acceptable (e.g., above 1-in-10,000 cancer risk for carcinogens).
• Monitors are placed at each school for approximately 60 days, and take air samples on at
least 10 different days during that time. The samples are analyzed for specific air toxics
identified for monitoring at the school (i.e., key pollutants).1
• These monitoring results and other information collected at each school during this
initiative allow us to:
− assess specific air toxics levels occurring at these sites and associated estimates of
longer-term concentrations in light of health risk-based criteria for long-term
exposures,
− better understand, in many cases, potential contributions from nearby sources to
key air toxics concentrations at the schools,
− consider what next steps might be appropriate to better understand and address air
toxics at the school, and
− improve the information and methods we will use in the future (e.g., NATA) for
estimating air toxics concentrations in communities across the U.S.
Assessment of air quality under this initiative is specific to the air toxics identified for
monitoring at each school. This initiative is being implemented in addition to ongoing state,
local and national air quality monitoring and assessment activities, including those focused on
1 In analyzing air samples for these key pollutants, samples are also being analyzed for some additional pollutants
that are routinely included in the analytical methods for the key pollutants.

10/21/10
3
criteria pollutants (e.g., ozone and particulate matter) or existing, more extensive, air toxics
programs.
Several technical documents prepared for this project provide further details on aspects of
monitoring and data interpretation and are available on the EPA website (e.g.,
www.epa.gov/schoolair/techinfo.html). The full titles of these documents are provided here:
• School Air Toxics Ambient Monitoring Plan
• Quality Assurance Project Plan For the EPA School Air Toxics Monitoring Program
• Schools Air Toxics Monitoring Activity (2009), Uses of Health Effects Information in
Evaluating Sample Results
Information on health effects of air toxics being monitored2 and educational materials describing
risk concepts3 are also available from EPA’s website.
III. Basis for Selecting this School and the Air Monitoring Conducted
This school was selected for monitoring in consultation with the Indiana air agency, the Indiana
Department of Environmental Management (IDEM). We were interested in evaluating the
ambient concentrations of manganese, lead, arsenic, benzene, and benzo(a)pyrene in air outside
the school because of information indicating the potential for elevated levels of these pollutants.
That information included EPA’s 2002 NATA for a nearby coke oven and steel facility.
Additionally, the school was ranked in the top 25 on the USA Today list due to 2005 TRI
estimates of manganese emissions for the same nearby facility.
Monitoring commenced at this school on August 23, 2009 and continued through December 9,
2009. During this period, ten valid VOC samples and ten valid polycyclic aromatic hydrocarbon
samples were collected and analyzed for the key pollutants and other air toxics at this school.
Additionally, eleven valid samples of airborne particles were collected using a PM10 sampler4
and analyzed for arsenic and manganese (two of the key pollutants at this school) and for a small
standardized set of additional metals that are routinely included in the analytical methods for the
key pollutants. Also, ten valid samples of total suspended particles (TSP) were collected and
analyzed for lead.
All VOCs results with the exception of acrolein were evaluated for health concerns. Results of a
recent short-term laboratory study have raised questions about the consistency and reliability of
monitoring results of acrolein. As a result, EPA will not use these acrolein data in evaluating the
potential for health concerns from exposure to air toxics in outdoor air as part of the School Air
Toxics Monitoring project (SAT) (http://www.epa.gov/schoolair/acrolein.html). All sampling
methodologies are described in EPA’s schools air toxics monitoring plan
(http://www.epa.gov/schoolair/techinfo.html).5
2 For example, http://www.epa.gov/schoolair/pollutants.html, http://www.epa.gov/ttn/fera/risk_atoxic.html. 3 For example, http://www.epa.gov/ttn/atw/3_90_022.html, http://www.epa.gov/ttn/atw/3_90_024.html. 4 In general, this sampler collects airborne particles with a diameter of 10 microns or smaller. 5 IDEM staff operated the monitors and sent the sample filters to the analytical laboratory under contract to EPA.

10/21/10
4
IV. Monitoring Results and Analysis
A. Background for the SAT Analysis
The majority of schools being monitored in this initiative were selected based on modeling
analyses that indicated the potential for annual average air concentrations of some specific (key)
hazardous air pollutants (HAPs or air toxics)6 to be of particular concern based on approaches
that are commonly used in the air toxics program for considering potential for long-term risk.
For example, such analyses suggested annual average concentrations of some air toxics were
greater than long-term risk-based concentrations associated with an additional cancer risk greater
than 10-in-10,000 or a hazard index on the order of or above 10. To make projections of air
concentrations, the modeling analyses combined estimates of air toxics emissions from
industrial, motor vehicle and other sources, with past measurements of winds, and other
meteorological factors that can influence air concentrations, from a weather station in the general
area. In some cases, the weather station was very close (within a few miles), but in other cases,
it was much further away (e.g., up to 60 miles), which may contribute to quite different
conditions being modeled than actually exist at the school. The modeling analyses are intended
to be used to prioritize locations for further investigation.
The primary objective of this initiative is to investigate - through monitoring air concentrations
of key air toxics at each school over a 2-3 month period - whether levels measured and
associated longer-term concentration estimates are of a magnitude, in light of health risk-based
criteria, for which follow-up activities may need to be considered. To evaluate the monitoring
results consistent with this objective, we developed health risk-based air concentrations (the
long-term comparison levels summarized in Appendix A) for the monitored air toxics using
established EPA methodology and practices for health risk assessment7 and, in the case of cancer
risk, consistent with the implied level of risk considered in identifying schools for monitoring.
Consistent with the long-term or chronic focus of the modeling analyses, based on which these
schools were selected for monitoring, we have analyzed the full record of concentrations of air
toxics measured at this school, using routine statistical tools, to derive a 95 percent confidence
6 The term hazardous air pollutants (commonly called HAPs or air toxics) refers to pollutants identified in section
112(b) of the Clean Air Act which are the focus of regulatory actions involving stationary sources described by
CAA section 112 and are distinguished from the six pollutants for which criteria and national ambient air quality standards (NAAQS) are developed as described in section 108. One of the criteria pollutants, lead, is also
represented, as lead compounds, on the HAP list. 7 While this EPA initiative will rely on EPA methodology, practices, assessments and risk policy considerations, we
recognize that individual state methods, practices and policies may differ and subsequent analyses of the monitoring
data by state agencies may draw additional or varying conclusions.

10/21/10
5
interval8 for the estimate of the longer-term average concentration of each of these pollutants. In
this project, we are reporting all actual numerical values for pollutant concentrations including
any values below method detection limit (MDL).9 Additionally, a value of 0.0 is used when a
measured pollutant has no value detected (ND). The projected range for the longer-term
concentration estimate for each chemical (most particularly the upper end of the range) is
compared to the long-term comparison levels. These long-term comparison levels
conservatively presume continuous (all-day, all-year) exposure over a lifetime. The analysis of
the air concentrations also includes a consideration of the potential for cumulative multiple
pollutant impacts.10
In general, where the monitoring results indicate estimates of longer-term
average concentrations that are above the comparison levels - i.e., above the cancer-based
comparison levels or notably above the noncancer-based comparison levels - we will consider
the need for follow-up actions such as:
→ Additional monitoring of air concentrations and/or meteorology in the area,
→ Evaluation of potentially contributing sources to help us confirm their emissions and
identify what options (regulatory and otherwise) may be available to us to achieve
emissions reductions, and
→ Evaluation of actions being taken or planned nationally, regionally or locally that
may achieve emission and/or exposure reductions. An example of this would be the
actions taken to address the type of ubiquitous emissions that come from mobile
sources.
We have further analyzed the dataset to describe what it indicates in light of some other criteria
and information commonly used in prioritizing state, local and national air toxics program
activities. State, local and national programs often develop long-term monitoring datasets in
order to better characterize pollutants near particular sources. The 2-3 month dataset developed
under this initiative will be helpful to those programs in setting priorities for longer-term
monitoring projects. The intent of this analysis is to make this 2-3 month monitoring dataset as
useful as possible to state, local and national air toxics programs in their longer-term efforts to
improve air quality nationally. To that end, this analysis:
8 When data are available for only a portion of the period of interest (e.g., samples not collected on every day during
this period), statisticians commonly calculate the 95% confidence interval around the dataset mean (or average) in order to have a conservative idea of how high or low the “true” mean may be. More specifically, this interval is the
range in which the mean for the complete period of interest is expected to fall 95% of the time (95% probability is
commonly used by statisticians). The interval includes an equal amount of quantities above and below the sample
dataset mean. The interval that includes these quantities is calculated using a formula that takes into account the
size of the data set (i.e., the ‘n’) as well as the amount by which the individual data values vary from the dataset
mean (i.e., the “standard deviation”). This calculation yields larger confidence intervals for smaller datasets as well
as ones with more variable data points. For example, a dataset including {1.0, 3.0, and 5.0}, results in a mean of 3.0
and a 95% confidence interval of 3.0 +/- ~5 (or -2.0 to 8.0). For comparison purposes, a dataset including {2.5, 3
and 3.5} results in a mean of 3.0 and a 95% confidence interval of 3.0 +/- ~1.2 (or 1.8 to 4.2). The smaller variation
within the data in the second set of values causes the second confidence interval to be smaller. 9 Method detection limit (MDL) is the minimum concentration of a substance that can be measured and reported
with 99% confidence that the pollutant concentration is greater than zero and is determined from the analysis of a sample in a given matrix containing the pollutant. 10 As this analysis of a 2-3 month monitoring dataset is not intended to be a full risk assessment, consideration of
potential multiple pollutant impacts may differ among sites. For example, in instances where no individual pollutant
appears to be present above its comparison level, we will also check for the presence of multiple pollutants at levels
just below their respective comparison levels (giving a higher priority to such instances).

10/21/10
6
→ Describes the air toxics measurements in terms of potential longer-term
concentrations, and, as available, compares the measurements at this school to
monitoring data from national monitoring programs.
→ Describes the meteorological data by considering conditions on sampling days as
compared to those over all the days within the 2-3 month monitoring period and
what conditions might be expected over the longer-term (as indicated, for example,
by information from a nearby weather station).
→ Describes available information regarding activities and emissions at the nearby
source(s) of interest, such as that obtained from public databases such as TRI and/or
consultation with the local air pollution authority.
B. Chemical Concentrations
We developed two types of long-term health risk-related comparison levels (summarized in
Appendix A below) to address our primary objective. The primary objective is to investigate
through the monitoring data collected for key pollutants at the school, whether pollutant levels
measured and associated longer-term concentration estimates are elevated enough in comparison
with health risk-based criteria to indicate that follow-up activities be considered. These
comparison levels conservatively presume continuous (all-day, all-year) exposure over a
lifetime.
In developing or identifying these comparison levels, we have given priority to use of relevant
and appropriate air standards and EPA risk assessment guidance and precedents.11
These levels
are based upon health effects information, exposure concentrations and risk estimates developed
and assessed by EPA, the U.S. Agency for Toxic Substances and Disease Registry, and the
California EPA. These agencies recognize the need to account for potential differences in
sensitivity or susceptibility of different groups (e.g., asthmatics) or lifestages/ages (e.g., young
children or the elderly) to a particular pollutant’s effects so that the resulting comparison levels
are relevant for these potentially sensitive groups as well as the broader population.
In addition to evaluating individual pollutants with regard to their corresponding comparison
levels, we also considered the potential for cumulative impacts from multiple pollutants in cases
where individual pollutant levels fall below the comparison levels but where multiple pollutant
mean concentrations are within an order of magnitude of their comparison levels.
Using the analysis approach described above, we analyzed the chemical concentration data
(Table 1 and Figures 1a-1e) with regard to the areas of interest identified below.
11 This is described in detail in Schools Air Toxics Monitoring Activity (2009), Uses of Health Effects Information in
Evaluating Sample Results.

10/21/10
7
Manganese, key pollutant:
• Do the monitoring data indicate influence from a nearby source?
→ The monitoring data include several manganese (PM10) concentrations that are higher
than concentrations commonly observed in other locations nationally.12
• Do the monitoring data indicate elevated levels that pose significant long-term health
concerns?
→ The longer-term concentration estimate for manganese is slightly above the long-term
comparison level for continuous, long-term exposures (Table 1).13
� The long-term comparison level is a continuous exposure concentration
(24 hours a day, all year, over a lifetime) associated with little risk of adverse
effect; it is not an exposure concentration at which effects have been observed
or are predicted to occur.14
� As manganese has not been found to be carcinogenic, it has no cancer-based
comparison level.15
→ Additionally, we did not identify any concerns regarding short-term exposures as
each individual measurement is below the individual sample screening level for
12 For example, eight of the concentrations at this site (Table 2) were higher than 75 percent of samples collected at
the National Air Toxics Trends Stations (NATTS) from 2004-2008 (Appendix B). Because these NATTS sites are
generally sited so as to not be influenced by specific nearby sources, EPA is using the 75th percentile point of
concentrations at these sites as a benchmark of indicating potential influence from a source nearby to the school. 13 The upper end of the interval is nearly 1.6 times the mean of the monitoring data and is 23% higher than the long-term noncancer-based comparison level. 14 The comparison level for manganese is based on the RfC. Manganese concentrations at which health effects have
been documented are higher than the RfC (http://www.atsdr.cdc.gov/tfacts151.html,
http://www.epa.gov/ttn/atw/hlthef/manganes.html#conversion) 15 www.epa.gov/iris
Key findings drawn from the information on chemical concentrations and the
considerations discussed below include:
• The air sampling data collected over the 3-month sampling period and the related
longer-term concentration estimates for arsenic, benzene, and benzo(a)pyrene, while
indicating potential influence from a nearby source are below levels of concern for
these pollutants and below the national standard for protection of public health for
lead.
• The air sampling data for manganese indicate influence from a nearby source, and
the related longer-term concentration estimate is slightly above the long-term
comparison level for continuous, long-term exposures. This comparison level is a
continuous exposure concentration associated with little risk of adverse effect; it is
an exposure concentration appreciably below levels at which effects have been
observed. The slightly elevated levels at this location, however, indicate a potential
concern for areas of the community closer to the source.

10/21/10
8
manganese (which is based on consideration of exposure all day, every day over a
period ranging from a couple of weeks to longer for some pollutants).11
Lead (TSP), key pollutant:
• Do the monitoring data indicate influence from a nearby source?
→ The monitoring data collected include some lead (TSP) concentrations that were
higher than other on-site measurements collected during the monitoring period.
• Do the monitoring data indicate elevated levels that pose significant long-term health
concerns?
→ The monitoring levels of lead (TSP) are below the national ambient air quality
standard for protection of public health for lead.
� The estimate of longer-term lead (TSP) concentration (i.e., the upper bound of
the 95 percent confidence interval on the mean of the dataset) is well below
the long-term comparison level (Table 1).16
The comparison level is the level
of the national ambient air quality standard.
→ In summary, the monitoring data do not indicate concentrations above the national
ambient air quality standard for protection of public health.
Arsenic, key pollutant:
• Do the monitoring data indicate influence from a nearby source?
→ The monitoring data include several arsenic (PM10) concentrations that are higher
than concentrations commonly observed in other locations nationally.17
• Do the monitoring data indicate elevated levels that pose significant long-term health
concerns?
→ The monitoring data for arsenic do not indicate levels of significant health concern
for long-term exposures.
� The estimate of longer-term arsenic (PM10) concentration (i.e., the upper
bound of the 95 percent confidence interval on the mean of the dataset) is well
below the long-term comparison levels (Table 1).18
These comparison levels
are based on consideration of continuous exposure concentrations (24 hours a
day, all year, over a lifetime).
� Further, the longer-term concentration estimate is more than tenfold lower
than the cancer-based comparison level, indicating the longer-term estimate is
16 The upper end of the interval is nearly 1.3 times the mean of the monitoring data but less than 8% of the
noncancer-based long-term comparison level. 17 For example, three of the concentrations at this site (Table 2) were higher than 75 percent of samples collected at the National Air Toxics Trends Stations (NATTS) from 2004-2008 (Appendix B). Because the NATTS sites are
generally sited so as not to be influenced by specific nearby sources, EPA is using the 75th percentile point of
concentrations at these sites as a benchmark for indicating potential influence from a source nearby to this school. 18 The upper end of the interval is nearly 1.5 times the mean of the monitoring data, but less than 8% of the
noncancer long-term comparison level.

10/21/10
9
below a continuous (24 hours a day, 7 days a week) lifetime exposure
concentration associated with an upper bound additional lifetime cancer risk
of 1-in-100,000.
→ Additionally, we did not identify any concerns regarding short-term exposures as
each individual measurement is below the individual sample screening level for
arsenic (which is based on consideration of exposure all day, every day over a period
ranging from a couple of weeks to longer for some pollutants).11
→ In summary, none of the individual measurements indicate concentrations of concern
for short-term exposures, and the combined contributions of all individual
measurements in the estimate of longer-term concentration do not indicate a level of
significant concern for long-term exposure.
Benzene, key pollutant:
• Do the monitoring data indicate influence from a nearby source?
→ The monitoring data do not include any benzene concentrations that are higher than
concentrations commonly observed in other locations nationally.19
• Do the monitoring data indicate elevated levels that pose significant long-term health
concerns?
→ The monitoring data for benzene do not indicate levels of significant health concern
for long-term exposures at this location.
� The estimate of longer-term benzene concentration (i.e., the upper bound of
the 95 percent confidence interval on the mean of the dataset) is well below
the long-term comparison levels (Table 1).20
These comparison levels are
based on consideration of continuous exposure concentration (24 hours a day,
all year, over a lifetime).
� Further, the longer-term concentration estimate is more than tenfold lower
than the cancer-based comparison level, indicating the longer-term estimate is
below a continuous (24 hours a day, 7 days a week) lifetime exposure
concentration associated with an upper bound additional lifetime cancer risk
of 1-in-100,000.
→ Additionally, we did not identify any concerns regarding short-term exposures as
each individual measurement is below the individual sample screening level for
benzene (which is based on consideration of exposure all day, every day over a period
ranging from a couple of weeks to longer for some pollutants).11
→ In summary, none of the individual measurements indicate concentrations of concern
for short-term exposures, and the combined contributions of all individual
19 For example, none of the concentrations at this site (Table 2) were higher than 75 percent of samples collected at the National Air Toxics Trends Stations (NATTS) from 2004-2008 (Appendix B). Because these NATTS sites are
generally sited so as to not be influenced by specific nearby sources, EPA is using the 75th percentile point of
concentrations at these sites as a benchmark for indicating potential influence from a source nearby to the school. 20 The upper end of the interval is 1.3 times the mean of the monitoring data but less than 6% of the cancer-based
long-term comparison level.

10/21/10
10
measurements in the estimate of longer-term concentration do not indicate a level of
significant concern for long-term exposure.
Benzo(a)pyrene, key pollutant:
• Do the monitoring data indicate influence from a nearby source?
→ The monitoring data include several benzo(a)pyrene concentrations that are higher
than concentrations commonly observed in other locations nationally.21
• Do the monitoring data indicate elevated levels that pose significant long-term health
concerns?
→ The monitoring data for benzo(a)pyrene do not indicate levels of significant health
concern for long-term exposures at this location.
� The estimate of longer-term benzo(a)pyrene concentration (i.e., the upper
bound of the 95 percent confidence interval on the mean of the dataset) is well
below the long-term comparison level (Table 1).22
This comparison level is a
continuous exposure concentration (24 hours a day, all year, over a lifetime).
� Further, the longer-term concentration estimate is more than 100-fold lower
than the cancer-based comparison level, indicating the longer-term estimate is
below a continuous (24 hours a day, 7 days a week) lifetime exposure
concentration associated with an upper bound additional lifetime cancer risk
of 1 in a million.
→ Additionally, we did not identify any concerns regarding short-term exposures as
each individual measurement is below the individual sample screening level for
benzo(a)pyrene (which is based on consideration of exposure all day, every day over
a period ranging from a couple of weeks to longer for some pollutants).11
→ In summary, none of the individual measurements indicate concentrations of concern
for short-term exposures, and the combined contributions of all individual
measurements in the estimate of longer-term concentration do not indicate a level of
significant concern for long-term exposure.
Other Air Toxics:
• Do the monitoring data indicate elevated levels of any other air toxics (or HAPs) that
pose significant long-term health concerns?
→ The monitoring data show low levels of the other HAPs monitored, with longer-term
concentration estimates for these HAPs below their long-term comparison levels
21 For example, six of the concentrations at this site (Table 2) were higher than 75 percent of samples collected at the
National Air Toxics Trends Stations (NATTS) from 2004-2008 (Appendix B). Because these NATTS sites are generally sited so as to not be influenced by specific nearby sources, EPA is using the 75th percentile point of
concentrations at these sites as a benchmark for indicating potential influence from a source nearby to the school. 22 The upper end of the interval is nearly 1.4 times the mean of the monitoring data but less than 1% of the cancer-
based long-term comparison level.

10/21/10
11
(Appendix C). Additionally each individual measurement for these pollutants is
below the individual sample screening level11
for that pollutant.
Multiple Pollutants:
• Do the data collected for the air toxics monitored indicate the potential for other
monitored pollutants to be present at levels that in combination with the key pollutant
levels indicate an increased potential for cumulative impacts of significant concern (e.g.,
that might warrant further investigation)?
→ The data collected for the key and other air toxics and the associated longer-term
concentration estimates do not pose significant concerns for cumulative health risk
from these pollutants (Appendix C).23
C. Wind and Other Meteorological Data
At each school monitored as part of this initiative, we are collecting meteorological data,
minimally for wind speed and direction, during the sampling period. Additionally, we have
identified the nearest National Weather Service (NWS) station at which a longer record is
available.
In reviewing these data at each school in this initiative, we are considering if these data indicate
that the general pattern of winds on our sampling dates are significantly different from those
occurring across the full sampling period or from those expected over the longer term.
Additionally, we are noting, particularly for school sites where the measured chemical
concentrations show little indication of influence from a nearby source, whether wind conditions
on some portion of the sampling dates were indicative of a potential to capture contributions
from the nearby “key” source in the air sample collected.
The meteorological station at Abraham Lincoln Elementary School collected wind speed and
wind direction measurements beginning on August 11, 2009, continuing through the sampling
period (August 23, 2009-December 9, 2009), and ending on May 13, 2010. As a result, on-site
data for these meteorological parameters are available for all dates of sample collection, and also
for a period before and after the sampling period, producing a continuous record of nine months
of on-site meteorological data. The meteorological data collected on sampling days are
presented in Figures 2a-2e and Table 2.
The nearest NWS station is at Lansing Municipal Airport in Lansing, IL. This station is
approximately 8.3 miles southwest of the school. Measurements taken at that station include
wind, temperature, and precipitation. Wind speed and direction data collected at the Lansing
Municipal Airport NWS station have been summarized in Table 2 and Appendix E.
23 We note that this initiative is focused on investigation for a school-specific set of key pollutants indicated by
previous analyses (and a small set of others for which measurements are obtained in the same analysis). Combined
impacts of pollutants or stressors other than those monitored in this project is a broader area of consideration in other
EPA activities. General information on additional air pollutants is available at
http://www.epa.gov/air/airpollutants.html.

10/21/10
12
• What is the direction of the key source of manganese, lead, arsenic, benzene, and
benzo(a)pyrene emissions in relation to the school location?
→ The nearby industrial facility emitting the key pollutants into the air (described in
section III above) lies less than one mile north of the school.
→ Using the property boundaries of the full facility (in lieu of information regarding the
location of specific sources of emissions at the facility), we have identified an
approximate range of wind directions to use in considering the potential influence of
this facility on air concentrations at the school.
→ This general range of wind directions, from approximately 325 to 56 degrees, is
referred to here as the expected zone of source influence (ZOI).
• On days the air samples were collected, how often did wind come from direction of the
key source?
→ For arsenic and manganese sampling, there were five out of eleven sampling days in
which the on-site wind data had a portion of the winds from the ZOI. For lead and
benzo(a)pyrene sampling, there were four out of ten days in which a portion of the
winds were from the expected ZOI. For benzene sampling, there were three out of
ten days in which a portion of the winds were from the expected ZOI (Figures 2a-2e,
Table 2).
• How do wind patterns on the air monitoring days compare to those across the complete
monitoring period and what might be expected over the longer term at the school
location?
Key findings drawn from this information and the considerations discussed below include:
• Both the sampling results and the on-site wind data indicate that some of the air
samples were collected on days when the nearby key source was contributing to
conditions at the school location.
• The wind patterns at the monitoring site across sampling dates are similar those
observed across the full record of on-site meteorological data, with respect to the
expected zone of source influence.
• Our ability to provide a confident characterization of the wind flow patterns at the
monitoring site over the long-term is somewhat limited. The NWS station at Lansing
Municipal Airport appears to represent the specific wind flow patterns at the school
location.
• Although we lack long-term wind data at the monitoring site, the wind pattern at the
NWS station during the sampling period is similar to the historical long-term wind
flow pattern at that same NWS station. Therefore, the 3-month sampling period may
be representative of year-round wind patterns.

10/21/10
13
→ Wind patterns across the air monitoring days appear similar to those observed over
the record of on-site meteorological data during the sampling period, particularly with
regard to the expected ZOI.
→ We note that wind patterns at the nearest NWS station (at Lansing Municipal Airport)
during the monitoring period are similar to those recorded at the NWS station over
the long-term (2002-2007 period; Appendix E), supporting the idea that regional
meteorological patterns in the area during the monitoring period were consistent with
long-term patterns. There is some uncertainty as to whether the general wind patterns
at the school location for longer periods would be similar to the general wind patterns
at the Lansing Municipal Airport (see below).
• How do wind patterns at the school compare to those at the Lansing Municipal Airport
NWS station, particularly with regard to prevalent wind directions and the direction of
the key source?
→ During the sampling period for which data are available both at the school site and at
the reference NWS station (approximately 3 months), prevalent winds at the school
site are predominantly from the southwest and east-southeast, while those at the NWS
station are from the southwest and northeast. The windroses for the two sites during
the sampling period (Figures 2a-2e and Appendix E) show some similarities in wind
flow patterns.
• Are there other meteorological patterns that may influence the measured concentrations
at the school monitoring site?
→ No, we did not observe other meteorological patterns that may influence the
measured concentrations at the school monitoring site.
V. Key Source Information
• Was the source operating as usual during the monitoring period?
− The nearby source of key pollutants has an operating permit issued by IDEM that
includes operating requirements.24
− Information from the nearby source indicates that the most recent year of typical
production level was 2007, and that the facility was operating at 56 percent of this
level during the monitoring period.
− The most recently available lead emissions data for this source (2008 TRI) are higher
than the 2005 TRI estimate, but lower than the 2002 NATA estimate. Manganese
emissions estimates in the 2006 through 2008 TRI are significantly lower than the
2005 TRI and 2002 NATA estimates. There were no recent emission estimates of
benzene or benzo(a)pyrene for this source since the 2002 NATA, or for arsenic since
the 2005 TRI.
24 Operating permits, which are issued to air pollution sources under the Clean Air Act, are described at:
http://www.epa.gov/air/oaqps/permits.

10/21/10
14
VI. Integrated Summary and Next Steps
A. Summary of Key Findings
1. What are the key HAPs for this school?
→ Benzene, arsenic, manganese, lead, and benzo(a)pyrene are the key HAPs for
this school, identified based on emissions information considered in
identifying the school for monitoring. The ambient air concentrations of
several pollutants indicate contributions from a source in the area.
2. Do the data collected at this school indicate an elevated level of concern, as
implied by information that led to identifying this school for monitoring?
→ The levels measured and associated longer-term concentration estimates are
not as high as suggested by the information available prior to monitoring.
Levels of arsenic (PM10), benzene, and benzo(a)pyrene are below levels of
concern for long-term exposures. Additionally, levels of lead, a pollutant for
which there are national standards for ambient air, are below the level of the
national standard for protection of public health.
→ Measured levels of manganese (PM10) are slightly elevated, as also indicated
by the previously available information. This elevated level of manganese
indicates a potential concern in areas closer to the source, particularly as the
nearby source operations were depressed from usual operating conditions
during air monitoring. Additional data, particularly at locations closer to the
source, would assist in further characterizing potential exposure in the area.
3. Are there indications, e.g., from the meteorological or other data, that the sample
set may not be indicative of longer-term air concentrations? Would we expect
higher (or lower) concentrations at other times of year?
→ The data we have collected appear to reflect air concentrations during the
entire monitoring period, with no indications from the on-site meteorological
data that the sampling day conditions were inconsistent with conditions
overall during this period.
→ Among the data collected for this site, we have none that would indicate
generally higher (or lower) concentrations during other times of year. The
wind flow patterns at the nearest NWS station during the sampling period
appear to be representative of long-term wind flow at that station. The lack
of long-term meteorological data at the school location limits our ability to
confidently predict longer-term wind patterns at the school (which might
provide further evidence relevant to concentrations during other times).
B. Next Steps for Key Pollutants
1. Additional monitoring of manganese (PM10), particularly in one or more locations
closer to the source, during operating conditions that more commonly occur,
would assist in further characterizing potential exposure in the area.

10/21/10
15
2. The Indiana Department of Environmental Management (IDEM) will continue to
oversee industrial facilities in the area through air permits and other programs.
VII. Figures and Tables
A. Tables
1. Abraham Lincoln Elementary School – Key Pollutant Analysis.
2. Abraham Lincoln Elementary School Key Pollutant Concentrations and
Meteorological Data.
B. Figures
1a. Abraham Lincoln Elementary School – Key Pollutant (Manganese (PM10))
Analysis.
1b. Abraham Lincoln Elementary School – Key Pollutant (Lead (TSP)) Analysis.
1c. Abraham Lincoln Elementary School – Key Pollutant (Arsenic (PM10))
Analysis.
1d. Abraham Lincoln Elementary School – Key Pollutant (Benzene) Analysis.
1e. Abraham Lincoln Elementary School – Key Pollutant (Benzo(a)pyrene)
Analysis.
2a. Abraham Lincoln Elementary School (East Chicago, IN) Manganese (PM10)
Concentration and Wind Information.
2b. Abraham Lincoln Elementary School (East Chicago, IN) Lead (TSP)
Concentration and Wind Information.
2c. Abraham Lincoln Elementary School (East Chicago, IN) Arsenic (PM10)
Concentration and Wind Information.
2d. Abraham Lincoln Elementary School (East Chicago, IN) Benzene
Concentration and Wind Information.
2e. Abraham Lincoln Elementary School (East Chicago, IN) Benzo(a)pyrene
Concentration and Wind Information.
VIII. Appendices
A. Summary Description of Long-term Comparison Levels.
B. National Air Toxics Trends Stations Measurements (2004-2008).
C. Analysis of Other (non-key) Air Toxics Monitored at the School and Multiple-
pollutant Considerations.
D. Abraham Lincoln Elementary School Pollutant Concentrations.
E. Windroses for Lansing Municipal Airport NWS Station.
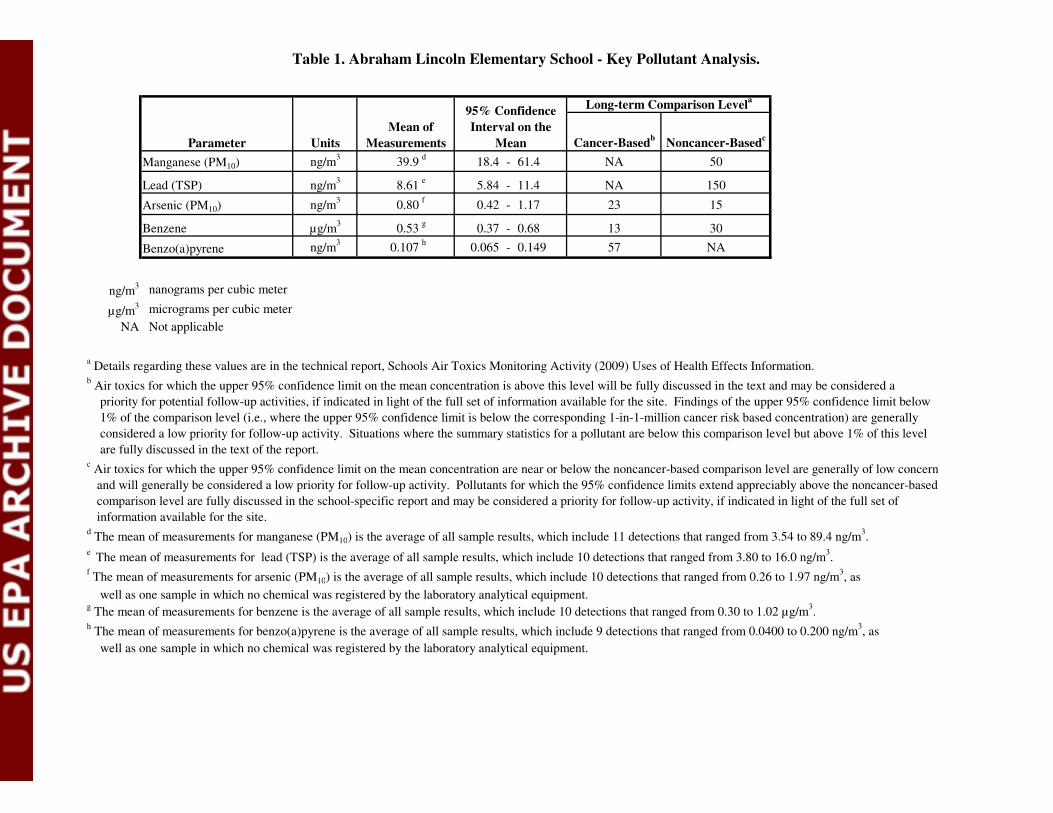
Table 1. Abraham Lincoln Elementary School - Key Pollutant Analysis.
Cancer-Basedb
Noncancer-Basedc
ng/m3
39.9d
18.4 - 61.4 NA 50
ng/m3
8.61e
5.84 - 11.4 NA 150
ng/m3
0.80f
0.42 - 1.17 23 15
µg/m3
0.53g
0.37 - 0.68 13 30
ng/m3
0.107h
0.065 - 0.149 57 NA
ng/m3 nanograms per cubic meter
µg/m3 micrograms per cubic meter
NA Not applicable
a Details regarding these values are in the technical report, Schools Air Toxics Monitoring Activity (2009) Uses of Health Effects Information.
b Air toxics for which the upper 95% confidence limit on the mean concentration is above this level will be fully discussed in the text and may be considered a
priority for potential follow-up activities, if indicated in light of the full set of information available for the site. Findings of the upper 95% confidence limit below
1% of the comparison level (i.e., where the upper 95% confidence limit is below the corresponding 1-in-1-million cancer risk based concentration) are generally
considered a low priority for follow-up activity. Situations where the summary statistics for a pollutant are below this comparison level but above 1% of this level
are fully discussed in the text of the report.c Air toxics for which the upper 95% confidence limit on the mean concentration are near or below the noncancer-based comparison level are generally of low concern
and will generally be considered a low priority for follow-up activity. Pollutants for which the 95% confidence limits extend appreciably above the noncancer-based
comparison level are fully discussed in the school-specific report and may be considered a priority for follow-up activity, if indicated in light of the full set of
information available for the site.d The mean of measurements for manganese (PM10) is the average of all sample results, which include 11 detections that ranged from 3.54 to 89.4 ng/m
3.
e The mean of measurements for lead (TSP) is the average of all sample results, which include 10 detections that ranged from 3.80 to 16.0 ng/m
3.
f The mean of measurements for arsenic (PM10) is the average of all sample results, which include 10 detections that ranged from 0.26 to 1.97 ng/m
3, as
well as one sample in which no chemical was registered by the laboratory analytical equipment.g The mean of measurements for benzene is the average of all sample results, which include 10 detections that ranged from 0.30 to 1.02 µg/m
3.
h The mean of measurements for benzo(a)pyrene is the average of all sample results, which include 9 detections that ranged from 0.0400 to 0.200 ng/m
3, as
well as one sample in which no chemical was registered by the laboratory analytical equipment.
Long-term Comparison Levela
Units
95% Confidence
Interval on the
Mean
Lead (TSP)
Parameter
Manganese (PM10)
Mean of
Measurements
Benzo(a)pyrene
Arsenic (PM10)
Benzene

Figure 1a. Abraham Lincoln Elementary School - Key Pollutant (Manganese (PM10)) Analysis.
a Air toxics for which the upper 95% confidence limit on the mean concentration are near or below the noncancer-based comparison level are generally of low
concern and will generally be considered a low priority for follow-up activity. Pollutants for which the 95% confidence limits extend appreciably above the
noncancer-based comparison level are fully discussed in the school-specific report and may be considered a priority for follow-up activity, if indicated in
light of the full set of information available for the site.
0
50
100
150
200
250
300
350
400
450
500
Co
nce
ntr
ati
on
(n
g/m
3)
Manganese (PM10)
Long-term noncancer-based
comparison levela = 50 ng/m
3Upper 95% Confidence Level on the Mean: 61.4
Lower 95% Confidence Level on the Mean: 18.4
Average: 39.9 ng/m3

Figure 1b. Abraham Lincoln Elementary School - Key Pollutant (Lead (TSP)) Analysis.
a Air toxics for which the upper 95% confidence limit on the mean concentration are near or below the noncancer-based comparison level are generally of low
concern and will generally be considered a low priority for follow-up activity. Pollutants for which the 95% confidence limits extend appreciably above the
noncancer-based comparison level are fully discussed in the school-specific report and may be considered a priority for follow-up activity, if indicated in
light of the full set of information available for the site.b This comparison value for lead is the level of the national ambient air quality standard, which is in terms of a rolling 3-month average level of lead in total suspended
particles.
0
25
50
75
100
125
150
175
Co
nce
ntr
ati
on
(n
g/m
3)
Lead (TSP)
Long-term noncancer-based comparison levela,b
= 150 ng/m3

Figure 1c. Abraham Lincoln Elementary School - Key Pollutant (Arsenic (PM10)) Analysis.
a Air toxics for which the upper 95% confidence limit on the mean concentration is above this cancer-based comparison level will be fully discussed in the text and
may be considered a priority for potential follow-up activities, if indicated in light of the full set of information available for the site. Findings of the upper 95%
confidence limit below 1% of the comparison level (i.e., where the upper 95% confidence limit is below the corresponding 1-in-1-million cancer risk based
concentration) are generally considered a low priority for follow-up activity. Situations where the summary statistics for a pollutant are below this comparison
level but above 1% of this level are fully discussed in the text of the report.b
Air toxics for which the upper 95% confidence limit on the mean concentration are near or below the noncancer-based comparison level are generally of low
concern and will generally be considered a low priority for follow-up activity. Pollutants for which the 95% confidence limits extend appreciably above the
noncancer-based comparison level are fully discussed in the school-specific report and may be considered a priority for follow-up activity, if indicated in
light of the full set of information available for the site.
0
3
6
9
12
15
Co
nce
ntr
ati
on
(n
g/m
3)
Arsenic (PM10)
Long-term noncancer-based comparison levelb = 15 ng/m
3
Long-term cancer-based comparison levela = 23 ng/m
3

Figure 1d. Abraham Lincoln Elementary School - Key Pollutant (Benzene) Analysis.
a Air toxics for which the upper 95% confidence limit on the mean concentration are near or below the noncancer-based comparison level are generally of low
concern and will generally be considered a low priority for follow-up activity. Pollutants for which the 95% confidence limits extend appreciably above the
noncancer-based comparison level are fully discussed in the school-specific report and may be considered a priority for follow-up activity, if indicated in
light of the full set of information available for the site.b Air toxics for which the upper 95% confidence limit on the mean concentration is above this cancer-based comparison level will be fully discussed in the text and
may be considered a priority for potential follow-up activities, if indicated in light of the full set of information available for the site. Findings of the upper 95%
confidence limit below 1% of the comparison level (i.e., where the upper 95% confidence limit is below the corresponding 1-in-1-million cancer risk based
concentration) are generally considered a low priority for follow-up activity. Situations where the summary statistics for a pollutant are below this comparison
level but above 1% of this level are fully discussed in the text of the report.
0
3
6
9
12
15
Co
nce
ntr
ati
on
(µ
g/m
3)
Benzene
Long-term noncancer-based comparison levela = 30 µg/m
3
Long-term cancer-based comparison levelb = 13 µg/m
3

Figure 1e. Abraham Lincoln Elementary School - Key Pollutant (Benzo(a)pyrene) Analysis.
a Air toxics for which the upper 95% confidence limit on the mean concentration is above this cancer-based comparison level will be fully discussed in the text and
may be considered a priority for potential follow-up activities, if indicated in light of the full set of information available for the site. Findings of the upper 95%
confidence limit below 1% of the comparison level (i.e., where the upper 95% confidence limit is below the corresponding 1-in-1-million cancer risk based
concentration) are generally considered a low priority for follow-up activity. Situations where the summary statistics for a pollutant are below this comparison
level but above 1% of this level are fully discussed in the text of the report.
0
12
24
36
48
60
Co
nce
ntr
ati
on
(n
g/m
3)
Benzo(a)pyrene
Long-term cancer-based comparison levela = 57 ng/m
3

Table 2. Abraham Lincoln Elementary School Key Pollutant Concentrations and Meteorological Data.
Units 8/2
3/2
00
9
8/2
9/2
00
9
9/4
/20
09
9/1
0/2
00
9
9/1
6/2
00
9
9/2
2/2
00
9
9/2
8/2
00
9
10
/4/2
00
9
10
/10
/20
09
10
/16
/20
09
10
/22
/20
09
12
/3/2
00
9
12
/9/2
00
9
ng/m3
7.02 7.21 89.4 59.9 59.8 13.0 48.9 3.54 11.5 54.3 84.3 -- --
ng/m3
-- 4.69 11.5 12.5 10.6 8.57 16.0 3.80 6.62 5.26 6.59 -- --
ng/m3
0.5 0.91 1.32 1.97 1.16 0.92 0.27 0.26 0.92 ND 0.55 -- --
µg/m3
-- 0.694 0.355 0.729 0.30 -- 0.352 0.339 1.02 0.495 -- 0.460 0.508
ng/m3
-- 0.0600 0.0400 0.140 0.140 0.200 0.160 0.110 0.130 0.0900 ND -- --
% 20.8 0.0 62.5 0.0 25.0 0.0 0.0 0.0 0.0 29.2 29.2 0.0 0.0
mph 4.1 7.1 3.0 3.2 5.5 4.1 13.6 6.5 6.3 4.7 6.5 11.1 18.6
deg. 1.5 279.6 45.1 97.1 80.6 166.8 270.0 256.8 261.1 304.1 102.8 279.6 242.0
% 20.8 0.0 45.8 12.5 0.0 8.3 0.0 0.0 8.3 0.0 0.0 0.0 0.0
° F 64.5 62.4 65.5 72.0 66.3 68.5 57.1 51.4 40.5 41.5 54.0 34.1 27.5inches 0.00 0.00 0.00 0.00 0.00 0.28 0.00 0.00 0.00 0.04 1.01 0.04 0.21
NWS wind speed and wind direction measurements were subsituted for school-site measurements due to insturment failure.
All precipitation and temperature data were from the Lansing Municipal Airport NWS Station.
-- No sample was conducted for this pollutant on this day or the sample was invalidated.
a Based on count of hours for which vector wind direction is from expected zone of influence.b
Wind direction for each day is represented by values derived by scalar averaging of hourly estimates that were produced (by wind instrumentation's
logger) as unitized vectors (specified as degrees from due north).
Parameter
Daily Average Temperature
Manganese (PM10)
Lead (TSP)
Arsenic (PM10)
Benzene
Benzo(a)pyrene
Daily Precipitation
% Hours w/Wind Direction from Expected ZOIa
Wind Speed (avg. of hourly speeds)
Wind Direction (avg. of unitized vector)b
% of Hours with Speed below 2 knots

Figure 2a. Abraham Lincoln Elementary School (East Chicago, IN) Manganese (PM10) Concentration and Wind Information.
Pollutant: Manganese (PM10)
Timeframe: August 23, 2009 - October 22, 2009
Note
Each circle denotes a 24-hour collection of air for chemical
analysis. The size of the circle indicates the magnitude of the wind
speed for that day (wind data shown in Table 2). The expected zone
of source influence is a rough approximation of the range of
directions from which winds carrying chemicals emitted by the key
source may originate.
Wind Speed: 2.5-5.0 mph
Wind Speed: > 5.0 mph
Expected Zone of Source Influence
KEY
Manganese (PM10) Concentrations vs. Number of Hours
Wind Blows from Expected Zone of Influence
0
20
40
60
80
100
0 2 4 6 8 10 12 14 16 18 20 22 24
# Hours Wind From Expected ZOI
Co
nce
ntr
ati
on
(n
g/m
3)
Abraham Lincoln Elementary School
Composite Hourly Windrose
on Sample Days
(Aug. 23, 2009-Oct. 22, 2009)
Abraham Lincoln Elementary School
Composite Hourly Windrose
Across Sampling Period
(Aug. 23, 2009-Dec. 9, 2009)

Figure 2b. Abraham Lincoln Elementary School (East Chicago, IN) Lead (TSP) Concentration and Wind Information.
Pollutant: Lead (TSP)
Timeframe: August 29, 2009 - October 22, 2009
Note
Each circle denotes a 24-hour collection of air for chemical
analysis. The size of the circle indicates the magnitude of the wind
speed for that day (wind data shown in Table 2). The expected zone
of source influence is a rough approximation of the range of
directions from which winds carrying chemicals emitted by the key
source may originate.
Wind Speed: 2.5-5.0 mph
Wind Speed: > 5.0 mph
Expected Zone of Source Influence
KEY
Lead (TSP) Concentrations vs. Number of Hours Wind
Blows from Expected Zone of Influence
0.0
4.0
8.0
12.0
16.0
20.0
0 2 4 6 8 10 12 14 16 18 20 22 24
# Hours Wind From Expected ZOI
Co
nce
ntr
ati
on
(n
g/m
3)
Abraham Lincoln Elementary School
Composite Hourly Windrose
Across Sampling Period
(Aug. 23, 2009-Dec. 9, 2009)
Abraham Lincoln Elementary School
Composite Hourly Windrose
on Sample Days
(Aug. 29, 2009-Oct. 22, 2009)

Figure 2c. Abraham Lincoln Elementary School (East Chicago, IN) Arsenic (PM10) Concentration and Wind Information.
Pollutant: Arsenic (PM10)
Timeframe: August 23, 2009 - October 22, 2009
Note
Each circle denotes a 24-hour collection of air for chemical
analysis. The size of the circle indicates the magnitude of the wind
speed for that day (wind data shown in Table 2). The expected zone
of source influence is a rough approximation of the range of
directions from which winds carrying chemicals emitted by the key
source may originate.
Wind Speed: 2.5-5.0 mph
Wind Speed: > 5.0 mph
Expected Zone of Source Influence
KEY
Arsenic (PM10) Concentrations vs. Number of Hours
Wind Blows from Expected Zone of Influence
0.0
0.4
0.8
1.2
1.6
2.0
0 2 4 6 8 10 12 14 16 18 20 22 24
# Hours Wind From Expected ZOI
Co
nce
ntr
ati
on
(n
g/m
3)
Abraham Lincoln Elementary School
Composite Hourly Windrose
on Sample Days
(Aug. 23, 2009-Oct. 22,2009)
Abraham Lincoln Elementary School
Composite Hourly Windrose
Across Sampling Period
(Aug. 23, 2009-Dec. 9, 2009)
*
* = two >5.0 mph wind speed observations

Figure 2d. Abraham Lincoln Elementary School (East Chicago, IN) Benzene Concentration and Wind Information.
Pollutant: Benzene
Timeframe: August 29, 2009 - December 9, 2009
Note
Each circle denotes a 24-hour collection of air for chemical
analysis. The size of the circle indicates the magnitude of the wind
speed for that day (wind data shown in Table 2). The expected zone
of source influence is a rough approximation of the range of
directions from which winds carrying chemicals emitted by the key
source may originate.
Expected Zone of Source Influence
KEY
Benzene Concentrations vs. Number of Hours Wind
Blows from Expected Zone of Influence
0.0
0.3
0.6
0.9
1.2
0 2 4 6 8 10 12 14 16 18 20 22 24
# Hours Wind From Expected ZOI
Co
nce
ntr
ati
on
(µ
g/m
3)
Abraham Lincoln Elementary School
Composite Hourly Windrose
on Sample Days
(Aug. 29, 2009-Dec. 9, 2009)
Abraham Lincoln Elementary School
Composite Hourly Windrose
Across Sampling Period
(Aug. 23, 2009- Dec. 9, 2009)
*
* = two >5.0 mph wind speed observations
Wind Speed: 2.5-5.0 mph
Wind Speed: > 5.0 mph
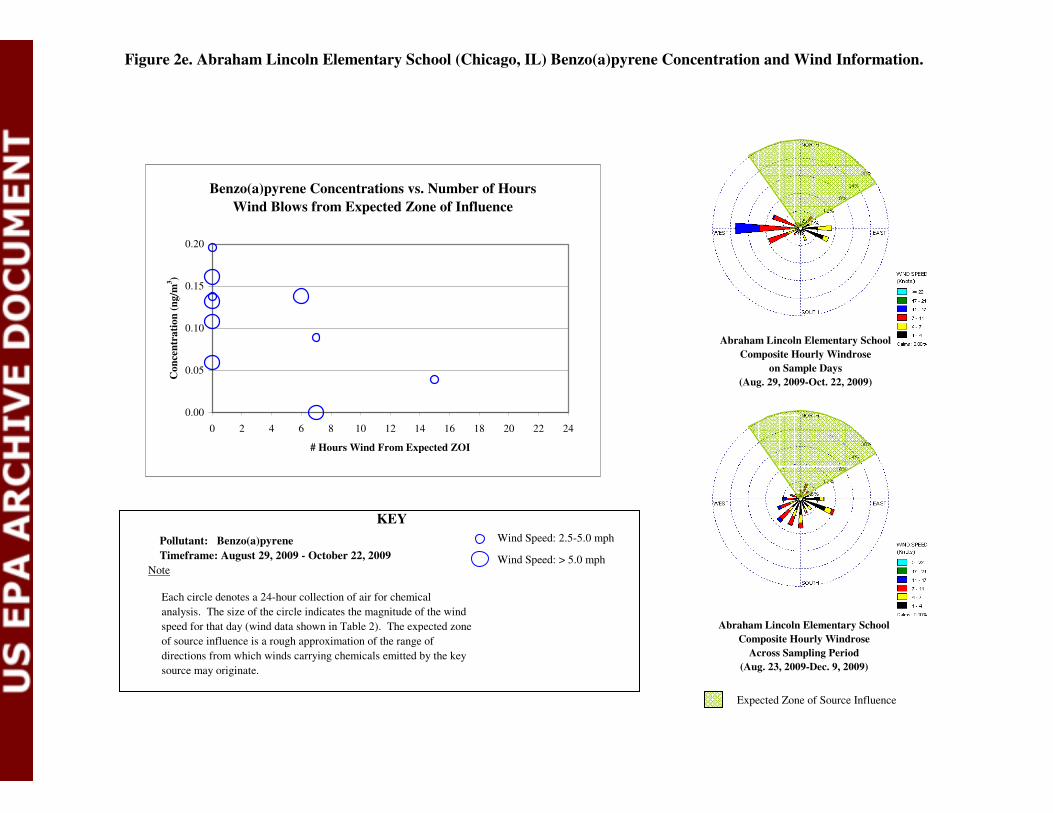
Figure 2e. Abraham Lincoln Elementary School (Chicago, IL) Benzo(a)pyrene Concentration and Wind Information.
Pollutant: Benzo(a)pyrene
Timeframe: August 29, 2009 - October 22, 2009
Note
Each circle denotes a 24-hour collection of air for chemical
analysis. The size of the circle indicates the magnitude of the wind
speed for that day (wind data shown in Table 2). The expected zone
of source influence is a rough approximation of the range of
directions from which winds carrying chemicals emitted by the key
source may originate.
Wind Speed: 2.5-5.0 mph
Wind Speed: > 5.0 mph
Expected Zone of Source Influence
KEY
Benzo(a)pyrene Concentrations vs. Number of Hours
Wind Blows from Expected Zone of Influence
0.00
0.05
0.10
0.15
0.20
0 2 4 6 8 10 12 14 16 18 20 22 24
# Hours Wind From Expected ZOI
Co
nce
ntr
ati
on
(n
g/m
3)
Abraham Lincoln Elementary School
Composite Hourly Windrose
on Sample Days
(Aug. 29, 2009-Oct. 22, 2009)
Abraham Lincoln Elementary School
Composite Hourly Windrose
Across Sampling Period
(Aug. 23, 2009-Dec. 9, 2009)
10/21/10
A-1
Appendix A. Summary Description of Long-term Comparison Levels
In addressing the primary objective identified above, to investigate through the monitoring data
collected for key pollutants at the school whether levels are of a magnitude, in light of health
risk-based criteria, to indicate that follow-up activities be considered, we developed two types of
long-term health risk-related comparison levels. These two types of levels are summarized
below.25
Cancer-based Comparison Levels
− For air toxics where applicable, we developed cancer risk-based comparison
levels to help us consider whether the monitoring data collected at the school
indicate the potential for concentrations to pose incremental cancer risk above
the range that EPA generally considers acceptable in regulatory decision-
making to someone exposed to those concentrations continuously (24 hours a
day, 7 days a week) over an entire lifetime.26
This general range is from 1 to
100 in a million.
− Air toxics with long-term mean concentrations below one one-hundredth of
this comparison level would be below a comparably developed level for 1-in-
a-million risk (which is the lower bound of EPA’s traditional acceptable risk
range). Such pollutants, with long-term mean concentrations below the
Agency’s traditional acceptable risk range, are generally considered to pose
negligible risk.
− Air toxics with long-term mean concentrations above the acceptable risk range
would generally be a priority for follow-up activities. In this evaluation, we
compare the upper 95% confidence limit on the mean concentration to the
comparison level. Pollutants for which this upper limit falls above the
comparison level are fully discussed in the school monitoring report and may
be considered a priority for potential follow-up activities in light of the full set
of information available for that site.
− Situations where the summary statistics for a pollutant are below the cancer-
based comparison level but above 1% of that level are fully discussed in
Appendix C.
25 These comparison levels are described in more detail Schools Air Toxics Monitoring Activity (2009), Uses of
Health Effects Information in Evaluating Sample Results. 26 While no one would be exposed at a school for 24 hours a day, every day for an entire lifetime, we chose this
worst-case exposure period as a simplification for the basis of the comparison level in recognition of other
uncertainties in the analysis. Use of continuous lifetime exposure yields a lower, more conservative, comparison
level than would use of a characterization more specific to the school population (e.g., 5 days a week, 8-10 hours a
day for a limited number of years).

10/21/10
A-2
Noncancer-based Comparison Levels
− To consider concentrations of air toxics other than lead (for which we have a
national ambient air quality standard) with regard to potential for health
effects other than cancer, we derived noncancer-based comparison levels
using EPA chronic reference concentrations (or similar values). A chronic
reference concentration (RfC) is an estimate of a long-term continuous
exposure concentration (24 hours a day, every day) without appreciable risk of
adverse effect over a lifetime.27
This differs from the cancer risk-based
comparison level in that it represents a concentration without appreciable risk
vs a risk-based concentration.
− In using this comparison level in this initiative, the upper end of the 95%
confidence limit on the mean is compared to the comparison level. Air toxics
for which this upper confidence limit is near or below the noncancer-based
comparison level (i.e., those for which longer-term average concentration
estimates are below a long-term health-related reference concentration) are
generally of low concern and will generally be considered a low priority for
follow-up activity. Pollutants for which the 95% confidence limits extend
appreciably above the noncancer-based comparison level are fully discussed
below and may be considered a priority for follow-up activity if indicated in
light of the full set of information available for the pollutant and the site.
− For lead, we set the noncancer-based comparison level equal to the level of
the recently revised national ambient air quality standard (NAAQS). It is
important to note that the NAAQS for lead is a 3-month rolling average of
lead in total suspended particles. Mean levels for the monitoring data
collected in this initiative that indicate the potential for a 3-month average
above the level of the standard will be considered a priority for consideration
of follow-up actions such as siting of a NAAQS monitor in the area.
In developing or identifying these comparison levels, we have given priority to use of relevant
and appropriate air standards and EPA risk assessment guidance and precedents. These levels
are based upon health effects information, exposure concentrations and risk estimates developed
and assessed by EPA, the U.S. Agency for Toxic Substances and Disease Registry, and the
California EPA. These agencies recognize the need to account for potential differences in
sensitivity or susceptibility of different groups (e.g., asthmatics) or lifestages/ages (e.g., young
children or the elderly) to a particular pollutant’s effects so that the resulting comparison levels
are relevant for these potentially sensitive groups as well as the broader population.
27 EPA defines the RfC as “an estimate (with uncertainty spanning perhaps an order of magnitude) of a continuous
inhalation exposure to the human population (including sensitive subgroups) that is likely to be without an
appreciable risk of deleterious effects during a lifetime. It can be derived from a NOAEL, LOAEL, or benchmark
concentration, with uncertainty factors generally applied to reflect limitations of the data used. Generally used in
EPA's noncancer health assessments.” http://www.epa.gov/ncea/iris/help_gloss.htm#r

Appendix B. National Air Toxics Trends Stations Measurements (2004-2008).a
Pollutant Units
# Samples
Analyzed
%
Detections Maximum
Arithmetic
Meanb
Geometric
Mean
5th
Percentile
25th
Percentile
50th
Percentile
75th
Percentile
95th
Percentile
Antimony (PM10) ng/m3
2,372 94% 43.30 1.71 1.21 ND 0.60 1.13 2.17 4.33
Arsenic (PM10) ng/m3
5,076 86% 47.70 0.93 0.70 ND 0.29 0.56 1.02 2.89
Beryllium (PM10) ng/m3
4,771 64% 1.97 0.05 0.02 ND ND <0.01 0.02 0.50
Cadmium (PM10) ng/m3
4,793 85% 15.30 0.27 0.17 ND 0.05 0.13 0.29 0.94
Chromium (PM10) ng/m3
5,094 92% 172.06 2.71 1.66 ND 0.93 1.98 2.85 7.10
Cobalt (PM10) ng/m3
2,614 91% 20.30 0.28 0.18 ND 0.08 0.15 0.27 1.00
Manganese (PM10) ng/m3
4,793 99% 734.00 10.39 5.20 <0.01 2.41 4.49 9.96 33.78
Mercury (PM10) ng/m3
1,167 81% 2.07 0.07 0.04 ND 0.01 0.02 0.06 0.32
Nickel (PM10) ng/m3
4,815 90% 110.10 2.05 1.49 ND 0.74 1.44 2.50 5.74
Selenium (PM10) ng/m3
2,382 96% 13.00 1.10 0.53 <0.01 0.24 0.53 1.07 5.50
Acetonitrile µg/m3
1,804 69% 542.30 3.55 0.72 ND ND 0.27 0.76 8.60
Acrylonitrile µg/m3
3,673 31% 5.51 0.06 0.10 ND ND ND 0.03 0.33
Benzene µg/m3
6,313 94% 10.19 1.03 0.84 ND 0.48 0.80 1.31 2.81
Bromomethane µg/m3
5,376 61% 120.76 0.11 0.05 ND ND 0.03 0.05 0.12
Butadiene, 1,3- µg/m3
6,427 67% 15.55 0.10 0.09 ND ND 0.05 0.13 0.38
Carbon disulfide µg/m3
1,925 91% 46.71 2.32 0.25 ND 0.03 0.09 0.96 12.65
Carbon tetrachloride µg/m3
6,218 86% 1.76 0.52 0.58 ND 0.47 0.57 0.65 0.87
Chloro-1,3-butadiene, 2- µg/m3
2,341 11% 0.17 <0.01 0.03 ND ND ND ND 0.02
Chlorobenzene µg/m3
5,763 30% 1.10 0.02 0.04 ND ND ND 0.01 0.11
Chloroethane µg/m3
4,625 37% 0.58 0.02 0.04 ND ND ND 0.03 0.08
Chloroform µg/m3
6,432 73% 48.05 0.17 0.14 ND ND 0.10 0.17 0.61
Chloromethane µg/m3
5,573 95% 19.70 1.17 1.20 ND 1.03 1.18 1.36 1.68
Chlorotoluene, alpha- µg/m3
3,046 9% 2.49 0.01 0.05 ND ND ND ND 0.05
Dibromoethane, 1,2- µg/m3
5,646 19% 4.15 0.01 0.05 ND ND ND ND 0.05
Dichlorobenzene, p- µg/m3
5,409 60% 13.65 0.19 0.16 ND ND ND 0.18 0.90
Dichloroethane, 1,1- µg/m3
5,670 16% 0.36 0.01 0.02 ND ND ND ND 0.02
Dichloroethylene, 1,1- µg/m3
5,480 19% 0.44 0.01 0.02 ND ND ND ND 0.04
Dichloropropane,1,2- µg/m3
6,225 17% 1.80 0.01 0.03 ND ND ND ND 0.04
Dichloropropylene, Cis -1,3- µg/m3
4,705 18% 0.80 0.01 0.05 ND ND ND ND 0.11
Dichloropropylene, Trans -1,3- µg/m3
4,678 18% 1.13 0.02 0.05 ND ND ND ND 0.11
Ethyl acrylate µg/m3
1,917 1% 0.08 <0.01 0.04 ND ND ND ND ND

Appendix B. National Air Toxics Trends Stations Measurements (2004-2008).a
Pollutant Units
# Samples
Analyzed
%
Detections Maximum
Arithmetic
Meanb
Geometric
Mean
5th
Percentile
25th
Percentile
50th
Percentile
75th
Percentile
95th
Percentile
Ethylbenzene µg/m3
6,120 84% 8.84 0.42 0.32 ND 0.10 0.29 0.53 1.33
Ethylene dichloride µg/m3
6,143 38% 4.49 0.03 0.05 ND ND ND 0.04 0.09
Hexachloro-1,3-butadiene µg/m3
3,727 20% 0.97 0.03 0.10 ND ND ND 0.00b
0.18
Methyl methacrylate µg/m3
1,917 9% 14.05 0.13 0.49 ND ND ND 0.00b
0.53
Methyl tert-butyl ether µg/m3
4,370 41% 20.50 0.28 0.12 ND ND ND 0.04 1.53
Methyl-2-pentanone, 4- µg/m3
2,936 60% 2.95 0.11 0.09 ND ND 0.02 0.12 0.49
Methylene chloride µg/m3
6,206 82% 214.67 0.59 0.34 ND 0.14 0.28 0.49 1.35
Styrene µg/m3
6,080 70% 27.22 0.16 0.11 ND ND 0.05 0.16 0.60
Tetrachloroethane, 1,1,2,2- µg/m3
5,952 20% 2.47 0.02 0.04 ND ND ND ND 0.07
Tetrachloroethylene µg/m3
6,423 71% 42.12 0.28 0.20 ND ND 0.13 0.27 0.88
Toluene µg/m3
5,947 95% 482.53 2.46 1.54 0.01 0.70 1.51 3.05 7.42
Tribromomethane µg/m3
2,946 4% 1.18 0.01 0.16 ND ND ND ND ND
Trichlorobenzene, 1,2,4- µg/m3
4,301 21% 45.27 0.07 0.10 ND ND ND ND 0.16
Trichloroethane, 1,1,1- µg/m3
5,944 73% 3.17 0.09 0.10 ND ND 0.08 0.11 0.20
Trichloroethane,1,1,2- µg/m3
5,210 19% 5.89 0.01 0.04 ND ND ND ND 0.05
Trichloroethylene µg/m3
6,410 46% 6.50 0.05 0.07 ND ND ND 0.05 0.22
Vinyl chloride µg/m3
6,284 18% 1.61 0.01 0.02 ND ND ND ND 0.03
Xylene, m/p- µg/m3
4,260 90% 21.41 1.12 0.71 ND 0.26 0.69 1.43 3.65
Xylene, o- µg/m3
6,108 83% 9.21 0.41 0.30 ND 0.09 0.24 0.52 1.39
Acenaphthene (total tsp & vapor) ng/m3
69 93% 9.48 2.36 1.94 ND 1.24 1.99 3.03 5.10
Acenaphthylene (total tsp & vapor) ng/m3
69 52% 8.41 0.79 0.74 ND ND 0.09 0.80 4.38
Anthracene (total tsp & vapor) ng/m3
1,102 47% 50.20 0.37 0.43 ND ND ND 0.39 1.48
Benzo(a)anthracene (total tsp & vapor) ng/m3
1,122 73% 2.56 0.10 0.07 ND ND 0.04 0.10 0.35
Benzo(a)pyrene (total tsp & vapor) ng/m3
1,111 58% 2.64 0.09 0.09 ND ND 0.03 0.10 0.34
Benzo[B]Fluoranthene ng/m3
1,110 86% 4.63 0.19 0.13 ND 0.04 0.10 0.21 0.67
Benzo[E]Pyrene(Tsp) ng/m3
1,121 72% 2.29 0.11 0.09 ND ND 0.05 0.13 0.38
Benzo[G,H,I]Perylene ng/m3
69 86% 0.75 0.12 0.09 ND 0.04 0.07 0.12 0.46
Benzo[K]Fluoranthene ng/m3
1,122 67% 1.28 0.05 0.05 ND ND 0.02 0.06 0.20
Chrysene (total tsp & vapor) ng/m3
1,117 92% 3.85 0.22 0.15 ND 0.07 0.13 0.25 0.70
Dibenzo[A,H]Anthracene ng/m3
69 4% 0.08 <0.01 0.08 ND ND ND ND ND
Fluoranthene (total tsp & vapor) ng/m3
69 96% 3.04 1.46 1.16 ND 0.96 1.42 1.95 2.86

Appendix B. National Air Toxics Trends Stations Measurements (2004-2008).a
Pollutant Units
# Samples
Analyzed
%
Detections Maximum
Arithmetic
Meanb
Geometric
Mean
5th
Percentile
25th
Percentile
50th
Percentile
75th
Percentile
95th
Percentile
Fluorene, 9-H (total tsp & vapor) ng/m3
1,112 99% 117.00 4.72 3.21 <0.01 1.84 3.00 5.24 13.84
Indeno[1,2,3-Cd]Pyrene ng/m3
69 51% 0.55 0.06 0.08 ND ND 0.02 0.07 0.30
Naphthalene (total tsp & vapor) µg/m3
1,099 100% 0.54 0.08 0.05 <0.01 0.03 0.06 0.10 0.20
Perylene (total tsp & vapor) ng/m3
1,128 18% 0.46 0.01 0.04 ND ND ND ND 0.06
Phenanthrene (total tsp & vapor) ng/m3
1,116 100% 197.00 10.55 6.25 ND 3.37 6.01 12.00 33.23
Pyrene (total tsp & vapor) ng/m3
1,115 99% 58.80 1.37 0.84 <0.01 0.46 0.87 1.54 4.46
Key Pollutant
ND No results of this chemical were registered by the laboratory analytical equipment.
aThe summary statistics in this table represent the range of actual daily HAP measurement values taken at NATTS sites from 2004 through 2008. These data
were extracted from AQS in summer 2008 and 2009. During the time period of interest, there were 28 sites measuring VOCs, carbonyls, metals, and hexavalent
chromium. We note that some sites did not sample for particular pollutant types during the initial year of the NATTS Program, which was 2004. Most of the
monitoring stations in the NATTS network are located such that they are not expected to be impacted by single industrial sources. The concentrations typically
measured at NATTS sites can thus provide a comparison point useful to considering whether concentrations measured at a school are likely to have been
influenced by a significant nearby industrial source, or are more likely to be attributable to emissions from many small sources or to transported pollution from
another area. For example, concentrations at a school above the 75th percentile may suggest that a nearby industrial source is affecting air quality at the school.b
In calculations involving non-detects (ND), a value of zero is used.

10/21/10
C-1
Appendix C. Analysis of Other (non-key) Air Toxics Monitored at the School and
Multiple-pollutant Considerations.
At each school, monitoring has been targeted to get information on a limited set of key
hazardous air pollutants (HAPs).28
These pollutants are the primary focus of the monitoring
activities at a school and a priority for us based on our emissions, modeling and other
information. In analyzing air samples for these key pollutants, we have also obtained results for
some other pollutants that are routinely included with the same test method. Our consideration
of the data collected for these additional HAPs is described in the first section below. In addition
to evaluating monitoring results for individual pollutants, we also considered the potential for
cumulative impacts from multiple pollutants as described in the second section below (See Table
C-1).
Other Air Toxics (HAPs)
• Do the monitoring data indicate elevated levels of any other air toxics or hazardous air
pollutant (HAPs) that pose significant long-term health concerns?
→ Longer-term concentration estimates for the other HAPs monitored are below their
long-term comparison levels.
→ Further, for pollutants with cancer-based comparison levels, longer-term
concentration estimates for all but one of these (chromium) are more than tenfold
lower and all but four (chromium, carbon tetrachloride, naphthalene, and 1,3-
butadiene) are more than 100-fold lower.29
→ Additionally, each individual measurement for these pollutants is below the
individual sample (short-term) screening level developed for considering potential
short-term exposures for that pollutant.30
Additional Information on Four HAPs:
• The first HAP mentioned above is chromium. The comparison values for chromium are
conservatively based on the most toxic form of chromium (hexavalent chromium, Cr+6
),
which is only a fraction of the chromium in the ambient air. Nonetheless, the longer-term
concentration estimate for chromium (PM10) is well below even these very restrictive
comparison values. The mean and 95 percent upper bound on the mean for chromium
(PM10) are approximately 46-53% of the lowest comparison level. As Cr+6
is commonly
28 Section 112(b) of the Clean Air Act identifies 189 hazardous air pollutants, three of which have subsequently been
removed from this list. These pollutants are the focus of regulatory actions involving stationary sources described
by CAA section 112 and are distinguished from the six pollutants for which criteria and national ambient air quality
standards (NAAQS) are developed as described in section 108. One of the criteria pollutants, lead, is also
represented as lead compounds on the HAP list. 29 For pollutants with cancer-based comparison levels, this would indicate longer-term estimates below continuous
(24 hours a day, 7 days a week) lifetime exposure concentrations associated with 10-5 and 10-6 excess cancer risk,
respectively. 30 The individual sample screening levels and their use is summarized on the website and described in detail in
Schools Air Toxics Monitoring Activity (2009), Uses of Health Effects Information in Evaluating Sample Results.

10/21/10
C-2
only a small fraction of chromium (PM10),31
the levels of Cr+6
in these samples would be
expected to be appreciably lower than this. A review of information available at other
sites nationally shows that the mean concentration of chromium PM10 at this site is
between the 75th
and 95th
percentile of samples collected from 2004 to 2008 (the most
recently compiled period) at the NATTS sites (Appendix B).
• The second HAP mentioned above is carbon tetrachloride. The mean and 95 percent
upper bound on the mean for carbon tetrachloride are approximately 5-6% of the lowest
comparison level. A review of information available at other sites nationally shows that
the mean concentration of carbon tetrachloride at this site is between the 75th and 95
th
percentile of samples collected from 2004 to 2008 (the most recently compiled period) at
the NATTS sites (Appendix B). Carbon tetrachloride is found globally as a result of its
significant past uses in refrigerants and propellants for aerosol cans and its chemical
persistence. Virtually all uses have been discontinued. However, it is still measured
throughout the world as a result of its slow rate of degradation in the environment and
global distribution in the atmosphere.
• The third HAP mentioned above is naphthalene. The mean and 95 percent upper bound
on the mean for naphthalene are approximately 4-5% of the lowest comparison level. A
review of information available at other sites nationally shows that the mean
concentration of naphthalene at this site is between the 75th and 95
th percentile of samples
collected from 2004 to 2008 (the most recently compiled period) at the NATTS sites
(Appendix B).
• The fourth HAP mentioned above is 1,3-butadiene. The mean and 95 percent upper
bound on the mean for 1,3-butadiene are approximately 2-3% of the lowest comparison
level. A review of information available at other sites nationally shows that the mean
concentration of 1,3-butadiene at this site is lower than the 50th
percentile of samples
collected from 2004 to 2008 (the most recently compiled period) at the NATTS sites
(Appendix B).
Multiple Pollutants
As described in the main body of the report and background materials, this initiative and the
associated analyses are focused on investigation of key pollutants for each school that were
identified by previous analyses. This focused design does not provide for the consideration of
combined impacts of pollutants or stressors other than those monitored in this project. Broader
analyses and those involving other pollutants may be the focus of other EPA activities.32
In our consideration of the potential for impacts from key pollutants at the monitored schools, we
have also considered the potential for other monitored pollutants to be present at levels that in
combination with the key pollutant levels contribute to an increased potential for cumulative
31 Data in EPA’s Air Quality System for locations that are not near a facility emitting hexavalent chromium indicate
that hexavelent chromium concentrations comprise less than approximately 10% of total chromium concentrations. 32 General information on additional air pollutants is available at http://www.epa.gov/air/airpollutants.html.

10/21/10
C-3
impacts. This was done in cases where estimates of longer-term concentrations for any non-key
HAPs are within an order of magnitude of their comparison levels even if these pollutant levels
fall below the comparison levels. This analysis is summarized below.
• Do the data collected for the air toxics monitored indicate the potential for other
monitored pollutants to be present at levels that in combination with the key pollutant
levels indicate an increased potential for cumulative impacts of significant concern (e.g.,
that might warrant further investigation)?
→ The data collected for the key and other air toxics and the associated longer-term
concentration estimates do not together pose significant concerns for cumulative
health risk from these pollutants.
� In addition to the key pollutant manganese, the only other HAP monitored whose
longer-term concentration estimate is more than ten percent of its lowest
comparison level is chromium (PM10). The lowest comparison level for
chromium is based on carcinogenic risk to the respiratory system posed by the
most toxic form of chromium, hexavalent chromium.33
Additionally, as noted
above, hexavalent chromium is commonly a small fraction of the total chromium
(PM10) reported. Finally, the comparison level for manganese is based on
noncarcinogenic effects to the central nervous system. Taken together, these
considerations reduce concerns for cumulative health risk from these pollutants.
33 The noncancer-based comparison level for chromium is much higher than the cancer-based level and is based on
risk of other effects posed to the respiratory system by hexavalent chromium in particulate form.
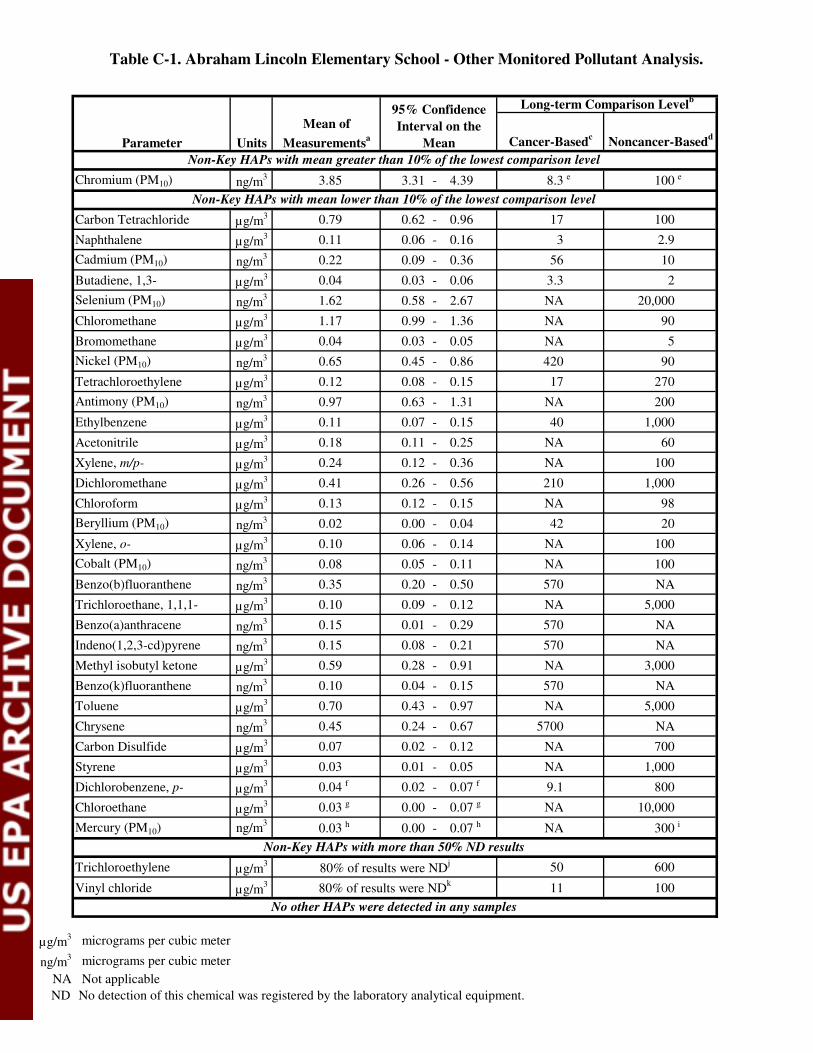
Table C-1. Abraham Lincoln Elementary School - Other Monitored Pollutant Analysis.
Chromium (PM10) ng/m3 3.85 3.31 - 4.39 8.3 e 100 e
Carbon Tetrachloride µg/m3 0.79 0.62 - 0.96 17 100
Naphthalene µg/m3 0.11 0.06 - 0.16 3 2.9
Cadmium (PM10) ng/m3 0.22 0.09 - 0.36 56 10
Butadiene, 1,3- µg/m3 0.04 0.03 - 0.06 3.3 2
Selenium (PM10) ng/m3 1.62 0.58 - 2.67 NA 20,000
Chloromethane µg/m3 1.17 0.99 - 1.36 NA 90
Bromomethane µg/m3 0.04 0.03 - 0.05 NA 5
Nickel (PM10) ng/m3 0.65 0.45 - 0.86 420 90
Tetrachloroethylene µg/m3 0.12 0.08 - 0.15 17 270
Antimony (PM10) ng/m3 0.97 0.63 - 1.31 NA 200
Ethylbenzene µg/m3 0.11 0.07 - 0.15 40 1,000
Acetonitrile µg/m3 0.18 0.11 - 0.25 NA 60
Xylene, m/p- µg/m3 0.24 0.12 - 0.36 NA 100
Dichloromethane µg/m3 0.41 0.26 - 0.56 210 1,000
Chloroform µg/m3 0.13 0.12 - 0.15 NA 98
Beryllium (PM10) ng/m3 0.02 0.00 - 0.04 42 20
Xylene, o- µg/m3 0.10 0.06 - 0.14 NA 100
Cobalt (PM10) ng/m3 0.08 0.05 - 0.11 NA 100
Benzo(b)fluoranthene ng/m3 0.35 0.20 - 0.50 570 NA
Trichloroethane, 1,1,1- µg/m3 0.10 0.09 - 0.12 NA 5,000
Benzo(a)anthracene ng/m3 0.15 0.01 - 0.29 570 NA
Indeno(1,2,3-cd)pyrene ng/m3 0.15 0.08 - 0.21 570 NA
Methyl isobutyl ketone µg/m3 0.59 0.28 - 0.91 NA 3,000
Benzo(k)fluoranthene ng/m3 0.10 0.04 - 0.15 570 NA
Toluene µg/m3 0.70 0.43 - 0.97 NA 5,000
Chrysene ng/m3 0.45 0.24 - 0.67 5700 NA
Carbon Disulfide µg/m3 0.07 0.02 - 0.12 NA 700
Styrene µg/m3 0.03 0.01 - 0.05 NA 1,000
Dichlorobenzene, p- µg/m3 0.04 f 0.02 - 0.07 f 9.1 800
Chloroethane µg/m3 0.03 g 0.00 - 0.07 g NA 10,000
Mercury (PM10) ng/m3
0.03 h 0.00 - 0.07 h NA 300 i
Trichloroethylene µg/m3 50 600
Vinyl chloride µg/m3 11 100
µg/m3 micrograms per cubic meter
ng/m3 micrograms per cubic meter
NA Not applicable
ND No detection of this chemical was registered by the laboratory analytical equipment.
No other HAPs were detected in any samples
Non-Key HAPs with more than 50% ND results
80% of results were NDj
80% of results were NDk
Non-Key HAPs with mean greater than 10% of the lowest comparison level
Non-Key HAPs with mean lower than 10% of the lowest comparison level
UnitsParameter Cancer-Basedc
Noncancer-Basedd
Long-term Comparison Levelb
Mean of
Measurementsa
95% Confidence
Interval on the
Mean
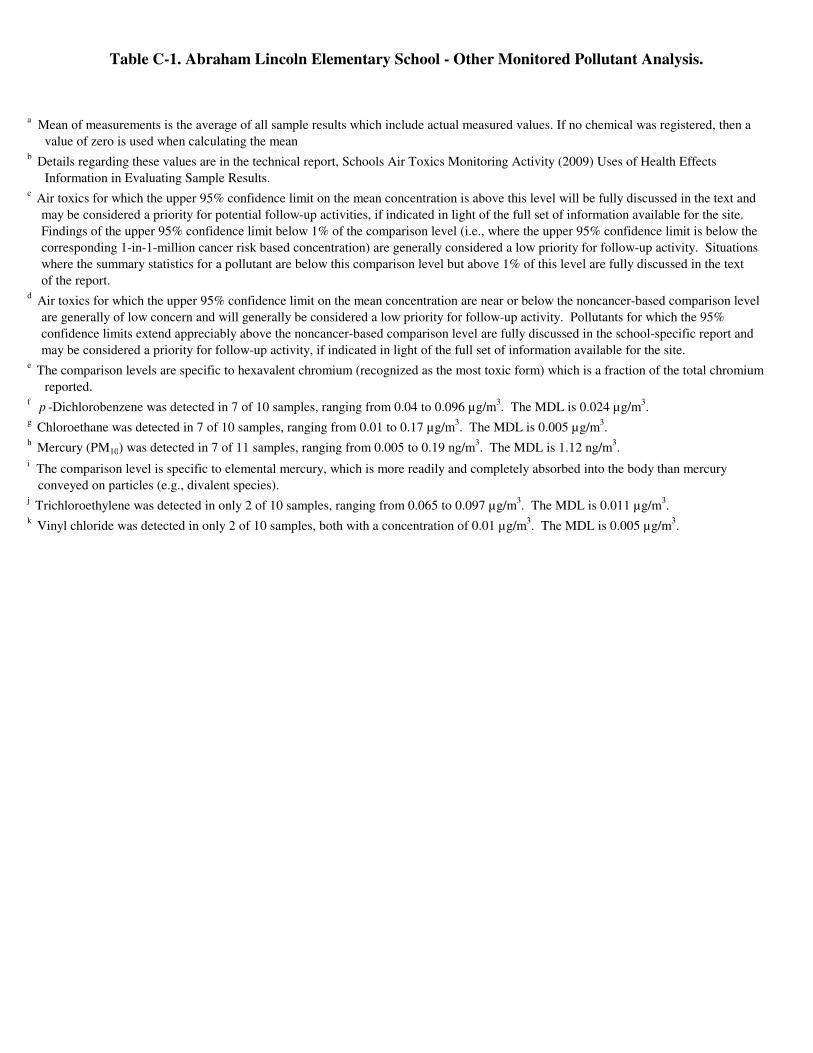
Table C-1. Abraham Lincoln Elementary School - Other Monitored Pollutant Analysis.
a Mean of measurements is the average of all sample results which include actual measured values. If no chemical was registered, then a
value of zero is used when calculating the meanb
Details regarding these values are in the technical report, Schools Air Toxics Monitoring Activity (2009) Uses of Health Effects
Information in Evaluating Sample Results.c Air toxics for which the upper 95% confidence limit on the mean concentration is above this level will be fully discussed in the text and
may be considered a priority for potential follow-up activities, if indicated in light of the full set of information available for the site.
Findings of the upper 95% confidence limit below 1% of the comparison level (i.e., where the upper 95% confidence limit is below the
corresponding 1-in-1-million cancer risk based concentration) are generally considered a low priority for follow-up activity. Situations
where the summary statistics for a pollutant are below this comparison level but above 1% of this level are fully discussed in the text
of the report.d
Air toxics for which the upper 95% confidence limit on the mean concentration are near or below the noncancer-based comparison level
are generally of low concern and will generally be considered a low priority for follow-up activity. Pollutants for which the 95%
confidence limits extend appreciably above the noncancer-based comparison level are fully discussed in the school-specific report and
may be considered a priority for follow-up activity, if indicated in light of the full set of information available for the site.e The comparison levels are specific to hexavalent chromium (recognized as the most toxic form) which is a fraction of the total chromium
reported.f p -Dichlorobenzene was detected in 7 of 10 samples, ranging from 0.04 to 0.096 µg/m
3. The MDL is 0.024 µg/m
3.
g Chloroethane was detected in 7 of 10 samples, ranging from 0.01 to 0.17 µg/m
3. The MDL is 0.005 µg/m
3.
h Mercury (PM10) was detected in 7 of 11 samples, ranging from 0.005 to 0.19 ng/m
3. The MDL is 1.12 ng/m
3.
i The comparison level is specific to elemental mercury, which is more readily and completely absorbed into the body than mercury
conveyed on particles (e.g., divalent species).j Trichloroethylene was detected in only 2 of 10 samples, ranging from 0.065 to 0.097 µg/m
3. The MDL is 0.011 µg/m
3.
k Vinyl chloride was detected in only 2 of 10 samples, both with a concentration of 0.01 µg/m
3. The MDL is 0.005 µg/m
3.

Appendix D. Abraham Lincoln Elementary School Pollutant Concentrations.
Parameter Units 8/2
3/2
00
9
8/2
9/2
00
9
9/4
/20
09
9/1
0/2
00
9
9/1
6/2
00
9
9/2
2/2
00
9
9/2
8/2
00
9
10
/4/2
00
9
10
/10
/20
09
10
/16
/20
09
10
/22
/20
09
12
/3/2
00
9
12
/9/2
00
9
Sample
Screening
Levela
Manganese (PM10) ng/m3
7.02 7.21 89.4 59.9 59.8 13.0 48.9 3.54 11.5 54.3 84.3 -- -- 500
Lead (TSP) ng/m3
-- 4.69 11.5 12.5 10.6 8.57 16.0 3.80 6.62 5.26 6.59 -- -- 150
Arsenic (PM10) ng/m3
0.5 0.91 1.32 1.97 1.16 0.92 0.27 0.26 0.92 ND 0.55 -- -- 150
Benzene µg/m3
-- 0.694 0.355 0.729 0.30 -- 0.352 0.339 1.02 0.495 -- 0.460 0.508 30
Benzo(a)pyrene ng/m3
-- 0.0600 0.0400 0.140 0.140 0.200 0.160 0.110 0.130 0.0900 ND -- -- 6,400
Chromium (PM10) ng/m3
2.81 3.14 4.85 5.10 3.59 3.83 5.05 3.51 3.99 3.45 3.03 -- -- 580b
Carbon Tetrachloride µg/m3
-- 0.787 0.629 0.781 1.35 -- 1.08 0.762 0.59 0.661 -- 0.636 0.655 200
Naphthalene µg/m3
-- 0.0794 0.0802 0.110 0.0900 0.296 0.0470 0.0636 0.139 0.0858 0.0759 -- -- 30
Cadmium (PM10) ng/m3
0.16 0.22 0.26 0.28 0.14 0.17 0.07 0.05 0.17 0.81 0.14 -- -- 30
Butadiene, 1,3- µg/m3
-- 0.060 0.053 0.029 0.01 -- 0.02 0.029 0.075 0.080 -- 0.040 0.049 20
Selenium (PM10) ng/m3
0.21 0.38 2.37 1.92 1.88 1.39 1.09 0.72 0.57 5.89 1.44 -- -- 20,000
Chloromethane µg/m3
-- 1.34 1.17 1.31 1.62 -- 1.29 1.05 0.851 1.37 -- 0.891 0.847 1,000
Bromomethane µg/m3
-- 0.047 0.062 0.058 0.051 -- 0.043 0.043 0.03 0.03 -- ND 0.043 200
Nickel (PM10) ng/m3
0.81 0.4 1.12 0.98 0.64 0.38 1.01 0.26 0.51 0.78 0.31 -- -- 200
Tetrachloroethylene µg/m3
-- 0.14 0.14 0.10 0.05 -- 0.081 0.081 0.20 0.068 -- 0.11 0.20 1,400
Antimony (PM10) ng/m3
0.44 0.82 1.17 1.84 0.60 1.26 0.57 0.61 1.88 0.55 0.91 -- -- 2,000
Ethylbenzene µg/m3
-- 0.14 0.087 0.091 0.048 -- 0.078 0.083 0.26 0.13 -- 0.10 0.091 40,000
Acetonitrile µg/m3
-- 0.296 0.368 0.252 0.225 -- 0.16 0.13 0.066 0.11 -- 0.089 0.10 600
Xylene, m/p- µg/m3
-- 0.36 0.20 0.03 0.10 -- 0.17 0.20 0.64 0.32 -- 0.23 0.15 3,000
Dichloromethane µg/m3
-- 0.824 0.751 0.379 0.389 -- 0.33 0.30 0.379 0.25 -- 0.24 0.25 2,000
Chloroform µg/m3
-- 0.14 0.13 0.17 0.16 -- 0.13 0.14 0.14 0.10 -- 0.11 0.10 500
Beryllium (PM10) ng/m3
0.002 ND 0.09 0.03 0.03 0.02 ND 0.002 0.003 0.003 0.05 -- -- 20
Xylene, o- µg/m3
-- 0.16 0.074 0.087 0.052 -- 0.070 0.078 0.24 0.12 -- 0.078 0.074 9,000
Cobalt (PM10) ng/m3
0.03 0.07 0.16 0.12 0.13 0.05 0.13 0.01 0.07 0.06 0.07 -- -- 100
Benzo(b)fluoranthene ng/m3
-- 0.230 0.120 0.410 0.320 0.870 0.360 0.210 0.440 0.390 0.160 -- -- 64,000
Methyl chloroform µg/m3
-- 0.15 0.098 0.082 0.12 -- 0.13 0.11 0.093 0.082 -- 0.082 0.076 10,000
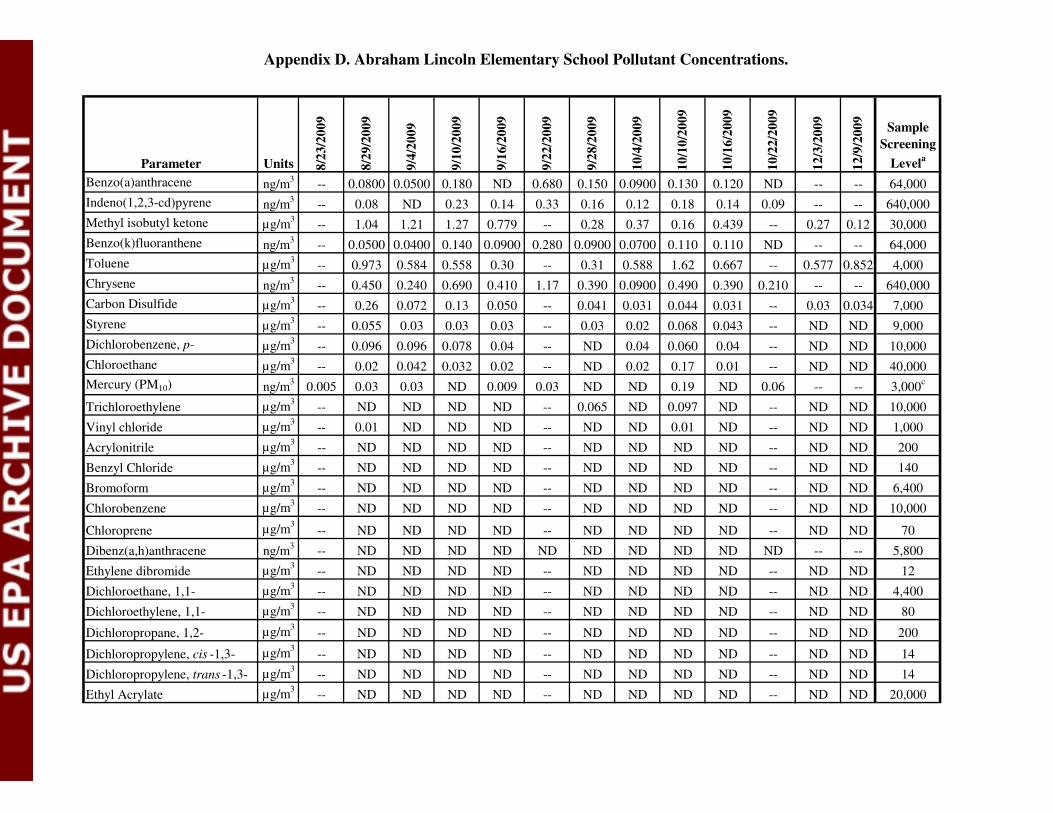
Appendix D. Abraham Lincoln Elementary School Pollutant Concentrations.
Parameter Units 8/2
3/2
00
9
8/2
9/2
00
9
9/4
/20
09
9/1
0/2
00
9
9/1
6/2
00
9
9/2
2/2
00
9
9/2
8/2
00
9
10
/4/2
00
9
10
/10
/20
09
10
/16
/20
09
10
/22
/20
09
12
/3/2
00
9
12
/9/2
00
9
Sample
Screening
Levela
Benzo(a)anthracene ng/m3
-- 0.0800 0.0500 0.180 ND 0.680 0.150 0.0900 0.130 0.120 ND -- -- 64,000
Indeno(1,2,3-cd)pyrene ng/m3
-- 0.08 ND 0.23 0.14 0.33 0.16 0.12 0.18 0.14 0.09 -- -- 640,000
Methyl isobutyl ketone µg/m3
-- 1.04 1.21 1.27 0.779 -- 0.28 0.37 0.16 0.439 -- 0.27 0.12 30,000
Benzo(k)fluoranthene ng/m3
-- 0.0500 0.0400 0.140 0.0900 0.280 0.0900 0.0700 0.110 0.110 ND -- -- 64,000
Toluene µg/m3
-- 0.973 0.584 0.558 0.30 -- 0.31 0.588 1.62 0.667 -- 0.577 0.852 4,000
Chrysene ng/m3
-- 0.450 0.240 0.690 0.410 1.17 0.390 0.0900 0.490 0.390 0.210 -- -- 640,000
Carbon Disulfide µg/m3
-- 0.26 0.072 0.13 0.050 -- 0.041 0.031 0.044 0.031 -- 0.03 0.034 7,000
Styrene µg/m3
-- 0.055 0.03 0.03 0.03 -- 0.03 0.02 0.068 0.043 -- ND ND 9,000
Dichlorobenzene, p- µg/m3
-- 0.096 0.096 0.078 0.04 -- ND 0.04 0.060 0.04 -- ND ND 10,000
Chloroethane µg/m3
-- 0.02 0.042 0.032 0.02 -- ND 0.02 0.17 0.01 -- ND ND 40,000
Mercury (PM10) ng/m3
0.005 0.03 0.03 ND 0.009 0.03 ND ND 0.19 ND 0.06 -- -- 3,000c
Trichloroethylene µg/m3
-- ND ND ND ND -- 0.065 ND 0.097 ND -- ND ND 10,000
Vinyl chloride µg/m3
-- 0.01 ND ND ND -- ND ND 0.01 ND -- ND ND 1,000
Acrylonitrile µg/m3
-- ND ND ND ND -- ND ND ND ND -- ND ND 200
Benzyl Chloride µg/m3
-- ND ND ND ND -- ND ND ND ND -- ND ND 140
Bromoform µg/m3
-- ND ND ND ND -- ND ND ND ND -- ND ND 6,400
Chlorobenzene µg/m3
-- ND ND ND ND -- ND ND ND ND -- ND ND 10,000
Chloroprene µg/m3
-- ND ND ND ND -- ND ND ND ND -- ND ND 70
Dibenz(a,h)anthracene ng/m3
-- ND ND ND ND ND ND ND ND ND ND -- -- 5,800
Ethylene dibromide µg/m3
-- ND ND ND ND -- ND ND ND ND -- ND ND 12
Dichloroethane, 1,1- µg/m3
-- ND ND ND ND -- ND ND ND ND -- ND ND 4,400
Dichloroethylene, 1,1- µg/m3
-- ND ND ND ND -- ND ND ND ND -- ND ND 80
Dichloropropane, 1,2- µg/m3
-- ND ND ND ND -- ND ND ND ND -- ND ND 200
Dichloropropylene, cis -1,3- µg/m3
-- ND ND ND ND -- ND ND ND ND -- ND ND 14
Dichloropropylene, trans -1,3- µg/m3
-- ND ND ND ND -- ND ND ND ND -- ND ND 14
Ethyl Acrylate µg/m3
-- ND ND ND ND -- ND ND ND ND -- ND ND 20,000
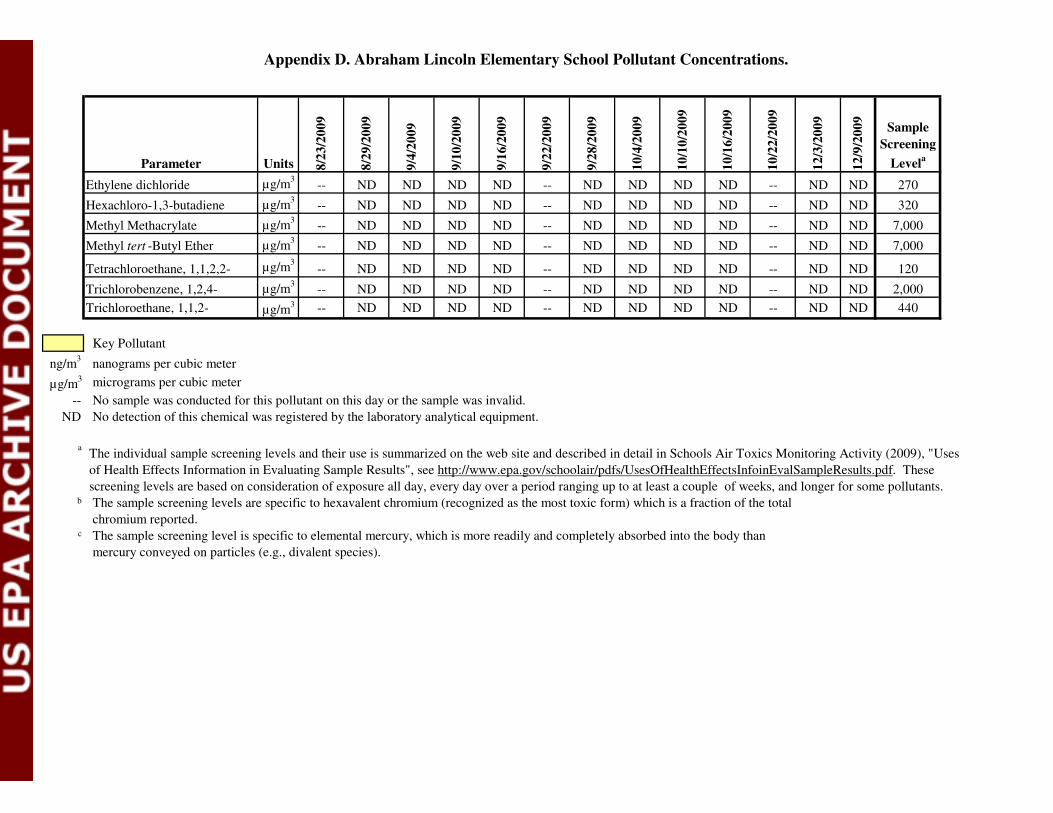
Appendix D. Abraham Lincoln Elementary School Pollutant Concentrations.
Parameter Units 8/2
3/2
00
9
8/2
9/2
00
9
9/4
/20
09
9/1
0/2
00
9
9/1
6/2
00
9
9/2
2/2
00
9
9/2
8/2
00
9
10
/4/2
00
9
10
/10
/20
09
10
/16
/20
09
10
/22
/20
09
12
/3/2
00
9
12
/9/2
00
9
Sample
Screening
Levela
Ethylene dichloride µg/m3
-- ND ND ND ND -- ND ND ND ND -- ND ND 270
Hexachloro-1,3-butadiene µg/m3
-- ND ND ND ND -- ND ND ND ND -- ND ND 320
Methyl Methacrylate µg/m3
-- ND ND ND ND -- ND ND ND ND -- ND ND 7,000
Methyl tert -Butyl Ether µg/m3
-- ND ND ND ND -- ND ND ND ND -- ND ND 7,000
Tetrachloroethane, 1,1,2,2- µg/m3
-- ND ND ND ND -- ND ND ND ND -- ND ND 120
Trichlorobenzene, 1,2,4- µg/m3
-- ND ND ND ND -- ND ND ND ND -- ND ND 2,000
Trichloroethane, 1,1,2- µg/m3 -- ND ND ND ND -- ND ND ND ND -- ND ND 440
Key Pollutant
ng/m3
nanograms per cubic meter
µg/m3 micrograms per cubic meter
-- No sample was conducted for this pollutant on this day or the sample was invalid.
ND No detection of this chemical was registered by the laboratory analytical equipment.
a The individual sample screening levels and their use is summarized on the web site and described in detail in Schools Air Toxics Monitoring Activity (2009), "Uses
of Health Effects Information in Evaluating Sample Results", see http://www.epa.gov/schoolair/pdfs/UsesOfHealthEffectsInfoinEvalSampleResults.pdf. These
screening levels are based on consideration of exposure all day, every day over a period ranging up to at least a couple of weeks, and longer for some pollutants.b The sample screening levels are specific to hexavalent chromium (recognized as the most toxic form) which is a fraction of the total
chromium reported.c The sample screening level is specific to elemental mercury, which is more readily and completely absorbed into the body than
mercury conveyed on particles (e.g., divalent species).

Appendix E. Windroses for Lansing Municipal Airport NWS Station.
1 Lansing Municipal Airport NWS Station (WBAN 04879) is 8.28 miles from Abraham Lincoln Elementary School.
Lansing Municipal Airport NWS
Station
(2002-2007)1
Lansing Municipal Airport NWS
Station
Across Sampling Period
(Aug. 23, 2009-Dec. 9, 2009)1

![Abraham Lincoln - Abraham Lincoln. Quotes, Quips, And Speeches [2009]](https://static.documents.pub/doc/80x56/563db8bb550346aa9a96677a/abraham-lincoln-abraham-lincoln-quotes-quips-and-speeches-2009.jpg)


