148
Investec integrated annual review and summary financial statements 2013

Investec integrated annual review and sum
mary financial statem
ents tw
enty thirteen
Investec integratedannual review and summary financial statements2013Wealth & InvestmentAsset ManagementSpecialist Banking

Corporate information
Investec plc and Investec Limited
Secretary and registered officeInvestec plc
David Miller2 Gresham StreetLondon EC2V 7QPUnited KingdomTelephone (44) 20 7597 4000Facsimile (44) 20 7597 4491
Investec Limited
Benita Coetsee100 Grayston DriveSandown Sandton 2196PO Box 785700 Sandton 2196Telephone (27 11) 286 7000Facsimile (27 11) 291 1806
Internet addresswww.investec.com
Registration numberInvestec plc
Registration number 3633621
Investec Limited
Registration number 1925/002833/06
AuditorsErnst & Young LLPErnst & Young Inc.
Transfer secretaries in the UKComputershare Investor Services PLCThe PavilionsBridgwater RoadBristol BS99 6ZZUnited KingdomTelephone (44) 870 707 1077
For queries regarding information in this document
Investor RelationsTelephone (27 11) 286 7070 (44) 20 7597 5546e-mail: [email protected] address:www.investec.com/en_za/#home/investor_relations.html
Transfer secretaries in South AfricaComputershare Investor Services (Pty) Ltd70 Marshall StreetJohannesburg 2001PO Box 61051Marshalltown 2107Telephone (27 11) 370 5000
DirectorateExecutive directors
Stephen Koseff (chief executive officer)Bernard Kantor (managing director)Glynn R Burger (group risk and finance director)Hendrik J du Toit (chief executive officer, Investec Asset Management)
Non-executive directors
Sir David J Prosser (joint chairman)Fani Titi (joint chairman)Samuel E AbrahamsGeorge FO Alford (senior independent NED)Cheryl A CarolusPerry KO CrosthwaiteOlivia C DicksonBradley FriedDavid Friedland*Haruko Fukuda OBEIan R KantorM Peter MalunganiPeter RS Thomas
* Appointed on 1 March 2013.
For contact details for Investec offices internationally refer to pages 143 and 144.

Investec integrated annual review and summary financial statements 2013 1
The integrated annual review and summary financial statements has been compiled in accordance with the integrated reporting principles contained in the Code of Corporate Practices and Conduct set out in the King Report on Corporate Governance for South Africa (King Code). This report covers all our operations across the various geographies in which we operate and has been structured to provide stakeholders with relevant financial and non-financial information.
The summary financial statements have been approved by the board of directors of the group and were signed on its behalf by the chief executive officer, Mr S Koseff. This document provides a summary of the information contained in Investec’s 2013 integrated annual report (annual report). It is not the group’s statutory accounts and does not contain sufficient information to allow for a complete understanding of the results and state of affairs of the group as would be provided by the full annual report. For further information consult the full annual financial statements, the unqualified auditor’s reports on those financial statements and the directors’ report. The auditors’ reports did not contain a statement under section 237(2) or section 237(3) of the UK Companies Act 2006.
Investec in perspective Highlights 4Abouth the Investec group 10Our strategic focus 12Our operational footprint 14Our operational structure 18Operating financial review 19Financial review 21
Divisional review Group divisional structure 51Asset Management 52Wealth & Investment 54Specialist Banking 56
Risk management and corporate governance Risk management 59Internal audit and compliance 63Corporate governance 65Directorate 68Sustainability 70
Remuneration report Remuneration report 72
Summary annual financial statements Directors’ responsibility statement 97Declaration by the company secretary 97 Directors’ report 98 Schedule A to the directors’ report 101 Independent auditor’s report 104Significant accounting policies 105Income statement 106Statement of comprehensive income 107Balance sheet 108Cash flow statement 109Statement of changes in equity 110Notes to the summary financial statements 114
Shareholder information Shareholder analysis 138Contact details 143
Definitions ibc
1
2
3
45
About this abridged report
Contents
6

Investec integrated annual review and summary financial statements 20132
Get the most out of our report
About our integrated report
The 2013 integrated annual report covers the period 1 April 2012 to 31 March 2013 and provides an overview of the Investec group.
The report covers all our operations across the various geographies in which we operate and has been structured to provide stakeholders with relevant financial and non-financial information.
We value feedback and invite questions and comments on our reporting. To give feedback or request hard copies of our reports, please contact our Investor Relations division.
The 2013 Investec group’s annual report may be viewed on our website: www.investec.com
Cross-referencing tools:
Reporting standard
Denotes our consideration of a reporting standard
Definitions
Refers readers to the definitions on the inside back cover
Website
Indicates that additional information is available on our website: www.investec.com
Audited information
Denotes information in the risk and remuneration reports that form part of the group’s audited annual financial statements
Page references
Refers readers to information elsewhere in this report
Sustainability
Refers readers to further information in our sustainability report available on our website: www.investec.com
For the year ended 31 March 2013, Investec plc and Investec Bank plc were regulated by the UK Financial Services Authority (FSA).However, on 1 April 2013 the FSA was abolished and the majority of its functions transferred to two new regulators: the Financial Conduct Authority (FCA) and the Prudential Regulation Authority (PRA). On the same date, the Bank of England (BoE) took over the FSA's responsibilities for financial market infrastructures and a Financial Policy Committee (FPC) was established on a statutory basis in the UK. Going forward, IBP will be authorised by the PRA and regulated by the FCA and the PRA. Kensington, Investec Wealth & Investment and Investec Asset Management will be authorised and regulated by the FCA. Accordingly, all references to the UK regulator in this annual report are to the FCA and PRA.

Investecin perspective
1

11
Investec integrated annual review and summary financial statements 20134
Investec in persp
ective
Highlights
The South African business reported an increase in operating profit of 13.4% in Rand terms benefiting from growth in revenue and fixed cost containment.
The UK business reported results slightly ahead of the prior year.
The Australian business returned to profitability as a result of a significant decline in impairments.
Overall group results have been negatively impacted by the depreciation of the average Rand: Pounds Sterling exchange rate of approximately 13% over the year.
• TheAssetManagementandWealth&Investmentbusinessesreportedsolidresultsbenefitingfromhigherlevelsofaveragefundsundermanagementandnetinflowsinexcessof£4.9billion
• TheSpecialistBankingbusinessincurredlowerimpairmentsthantheprioryear,whileoperatingprofitbeforeimpairmentsdeclinedmarginally
• Recurringrevenuesasaproportionoftotaloperatingincomeroseto68.6%(2012:67.7%)
• Capitallightbusinessesaccountfor49%ofgroupincome
• Impairmentsonloansandadvancesdecreasedby22.8%withthecreditlosschargeoncoreloansimprovingfrom1.12%at31March2012to0.84%
• Wemaintainedastrongcapitalpositionwithtier1ratiosof11.0%forInvestecplcand10.8%forInvestecLimited
• Liquidityremainsstrongwithcashandnearcashbalancesamountingto£9.8billion(2012:£10.3billion).
Our financial performance
Operating profit* before taxation increased 20.8%(32.5% currency neutral)
2012
£358.6mn2013
£433.2mn
Attributable earnings*^ increased 23.0%(34.8% currency neutral)
2012
£257.6mn2013
£316.7mn
Adjusted earnings per share (EPS)*^ increased 16.4%(27.7% currency neutral)
2012
31.8p2013
37.0p
Dividends per share increased 5.9%(increase of 14.3% in Rands)
2012
17.0p2013
18.0p
The successful strategic alignment of the group towards low capital intensive businesses over the past few years has resulted in a scaleable platform from which the group’s Asset Management and Wealth Management businesses can continue to grow
* Before goodwill, acquired intangibles, non-operating items and after non-controlling interests.
^ After deducting preference dividends.
Note: Amounts represented on a currency neutral basis assume that the closing and average exchange rates of the group’s relevant exchange rates relative to Pounds Sterling remain the same as at 31 March 2013 when compared to 31 March 2012.
11
Investec integrated annual review and summary financial statements 2013 5
Investec in persp
ective
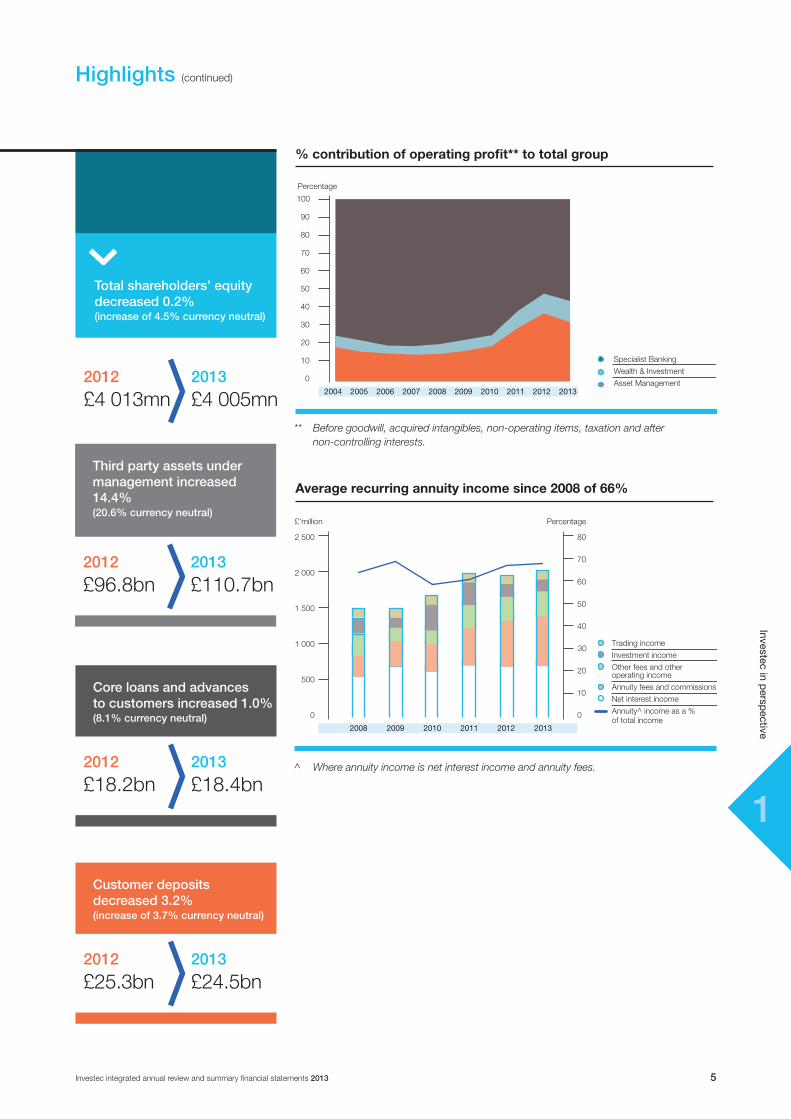
Highlights (continued)
Total shareholders’ equity decreased 0.2%(increase of 4.5% currency neutral)
2012
£4 013mn2013
£4 005mn
Third party assets under management increased 14.4%(20.6% currency neutral)
2012
£96.8bn2013
£110.7bn
Core loans and advances to customers increased 1.0%(8.1% currency neutral)
2012
£18.2bn2013
£18.4bn
Customer deposits decreased 3.2%(increase of 3.7% currency neutral)
2012
£25.3bn2013
£24.5bn
% contribution of operating profit** to total group
Specialist Banking
Wealth & Investment
Asset Management
70
90
100
80
60
50
40
30
20
10
0
2004 2006 2007 2008 2009 2010 2011 2012 20132005
Percentage
** Before goodwill, acquired intangibles, non-operating items, taxation and after non-controlling interests.
Average recurring annuity income since 2008 of 66%
^ Where annuity income is net interest income and annuity fees.
Trading income
Investment income
Other fees and other operating income
Annuity fees and commissions
Net interest income
Annuity^ income as a % of total income
1 000
2 000
2 500
1 500
500
0
2009 2010 2011 2012 20132008
80
0
70
60
40
50
£’million Percentage
30
20
10

11
Investec integrated annual review and summary financial statements 20136
Investec in persp
ective
Continued growth in key earnings drivers…
Highlights (continued)
Other
Wealth & Investment
Asset Management
40
100
120
80
20
0
2004 2009 20122010 2011 2013
£’billion
2006 2007 20082005
Third party assets under management
Core loans and advances to customers
Customer accounts
Loans and advances to customer accounts
10
20
30
15
5
0
2004 2005 2013201220112007
40
80
120
60
20
0
100
£’billion Percentage
2010200920082006
25
Customer accounts (deposits) and loans
Funds under management up 14.4% (20.6% currency neutral)
Customer accounts down 3.2% (up 3.7% currency neutral)
Core loans and advances up 1.0% (up 8.1% currency neutral)
UK and Europe (excluding Kensington) South Africa Australia
Net core loans (RHS) Net defaults as a % of core advances (LHS) Credit loss ratio (LHS)
Percentage
131211100908
0
2.0
6.0
12.0
4.0
10.0
8.0
A$’billion
0
1.0
3.5
0.5
3.0
2.5
Percentage
131211100908
0
1.0
3.0
6.0
2.0
5.0
4.0
£’billion
0
3
6
1
5
4
2
Percentage
131211100908
0
1.0
3.0
6.0
2.0
5.0
4.0
R’billion
0
60
150
30
120
902.0
1.5
Asset quality trends
UK moderate decrease in impairments
South Africa marginal increase in impairments in Rands
Australian credit loss ratio substantially down
Lower impairments…

11
Investec integrated annual review and summary financial statements 2013 7
Investec in persp
ective
Highlights (continued)
Expenses impacted by acquisitionsCost to income: 65.5% from 64.7%
Moderate increase in costs…
Expenses (excluding depreciation)
Operating income
1 000
2 000
2 500
1 500
500
0
2004 2006 2013201220112010
£’million
2009200820072005
Jaws ratio
Asset Management Wealth & Investment Specialist Banking
£’million
131211100908
0
100
300
500
200
400
£’million
131211100908
0
30
60
150
120
90
£’million
131211100908
0
10
30
60
20
50
40
Operating profit* by business
Resulting in increased operating profit from all three of our businesses…
* Before goodwill, acquired intangibles, non-operating items, taxation and after non-controlling interests.
Headcount impacted by acquisitionsTotal permanent employees of 7 575
Headcount* relatively stable
Australia
UK and Other
South Africa and Other
2 000
7 000
8 000
5 000
1 000
0
2008 2009 20122010 2011 2013
3 000
4 000
6 000
Number
* Permanent headcount and includes acquisitions.
10 year CAGR of 15.2%
10 year CAGR of 13.9%

11
Investec integrated annual review and summary financial statements 20138
Investec in persp
ective
Highlights (continued)
Capital adequacy Tier 1
2013: 10.5% (adjusted from 11% as a consequence of Basel III) Target2013: 14% – 17%Target
Achieved capital targets across all geographies
The intimate involvement of senior management ensures stringent management of risk and liquidity
Our policy has always been to hold capital in excess of regulatory requirements and we intend to perpetuate this philosophy
Investec has maintained a strong capital base and has met its targets in this period
A well established liquidity management philosophy remains in place
An increase in customer deposits in all three core geographies in home currencies
Advances as a percentage of customer deposits is at 71.3% (2012: 67.8%)
Liquidity remains strong with cash and near cash balances amounting to £9.8 billion (2012: £10.3 billion).
Sound capital and liquidity principles maintained
Investec Limited capital adequacy ratio
Investec plc capital adequacy ratio
10
20
25
15
5
0
2004 2005 2013200820072006 2009 2010 2011 2012
Basel III*Basel IIBasel I
Percentage
Investec Limited tier 1 capital adequacy ratio
Investec plc tier 1 capital adequacy ratio
6
12
15
9
3
0
2004 2005 2013200820072006 2009 2010 2011 2012
Basel III*Basel IIBasel I
Percentage
Stable capital position…
* In South Africa and Australia.
Continue to focus on:
• Maintainingahighlevelofreadilyavailable,highqualityliquidassets–representing25%to35%ofourliabilitybase
• Diversifyingfundingsources
• Limitingconcentrationrisk
• Reducedrelianceonwholesalefunding.

11
Investec integrated annual review and summary financial statements 2013 9
Investec in persp
ective
Highlights (continued)
The value we’ve added
Contributing to society, macro-economic stability and the environmentFor Investec, sustainability is about building our businesses to ensure we have a positive impact on the economic and social progress of communities and on the environment, while growing and preserving clients and stakeholders’ wealth based on strong relationships of trust.
This commitment to sustainability means integrating social, ethical and environmental considerations into our day-to-day operations. A key element of this is solid corporate governance, that ensures sustainable management with a long-term vision.
The financial strength and resilience of Investec depends on a balanced business model that supports our long term growth vision through varying economic cycles.
Profit
For further information download the sustainability report available on our website.
Value added statement
£’00031 March
2013 31March
2012
NetincomegeneratedInterest receivable 2 131 765 2 299 925Other income 1 300 657 1 243 994Interest payable (1 429 239) (1 600 878)Other operating expenditure and impairments on loans (597 812) (635 456)
1405371 1307585
Distributedasfollows:Employees 692061 622386Salaries, wages and other benefitsGovernment 312568 332057Corporation, deferred payroll and other taxesShareholders 185321 172575Dividends paid to ordinary shareholders 147 660 134 436Dividends paid to preference shareholders 37 661 38 139Retentionforfutureexpansionandgrowth 215421 180567Depreciation 46 372 57 424Retained income for the year 169 049 123 143
1405371 1307585
We invest in the communities in which we operate recognising that education and entrepreneurship are integral to our own long term strategy.
The sustainability of our business depends largely on our people and positioning Investec as an attractive employer in the financial services industry. We focus on building a strong, diverse and capable workforce by providing a workplace that stimulates and rewards distinctive performance.
People
Effective environmental management is an essential part of our embedding front-of-mind consciousness of sustainability into the organisation.
We are increasingly incorporating environmental considerations into our daily business activities and are exploring the many valuable opportunities in cleaner energy sources, energy efficiency and responsible financing.
Planet
Investec in the UK
• Community Impact category of the National Business Charity Awards
• Platinum Award in the Clean City Awards Scheme 2012 for the seventh consecutive year
• Investec Guernsey won the CSR Community Award.
Investec in South Africa
• Voted number one employer among business professionals.
Recognition
£12 million spent on employee training and development
£4.9 million spent on our communities
R3.2 billion committed to renewable energy in SA (to be drawn down over the next two – three years)
Investec conducts its commitment to sustainability through three key focus areas:
11
Investec integrated annual review and summary financial statements 201310
Investec in persp
ective
We strive to be a distinctive specialist bank and asset manager, driven by commitment to our core philosophies and values
About the Investec group
We acquired a banking licence in 1980 and were listed on the Johannesburg Stock Exchange (JSE) Limited South Africa in 1986.
A year later, we concluded a significant empowerment transaction in which our empowerment partners collectively acquired a 25.1% stake in the issued share capital of Investec Limited.
Today, we have an efficient integrated international business platform, offering all our core activities in the UK and South Africa and select activities in Australia.
Investec (comprising Investec plc and Investec Limited) is an international, specialist bank and asset manager.
Founded as a leasing company in Johannesburg
in 1974
In July 2002, we implemented a dual
listed companies (DLC) structure with
linked companies listed in London and
Johannesburg
Since inception, we have expanded
through a combination of substantial organic
growth and a series of strategic acquisitions
Who we are

11
Investec integrated annual review and summary financial statements 2013 11
Investec in persp
ective
Client focus
Moral strength
Risk consciousness
Highest ethical standards
About the Investec group (continued)
Outstanding talent – empowered, enabled and inspired
Meritocracy
Passion, energy, stamina, tenacity
Entrepreneurial spirit
Distinctive offering
Leverage resources
Break china for the client
Respect for others
Embrace diversity
Open and honest dialogue
Unselfish contribution to colleagues, clients and society
Single organisation
Meritocracy
Focused businesses
Differentiated, yet integrated
Material employee ownership
Creating an environment that stimulates extraordinary performance
We value
Our philosophies
We are an international specialist bank and asset manager that provides a diverse range of financial products and services to a niche client base in three principal markets, the UK, South Africa and Australia as well as certain other countries.
What we doInvestec focuses on delivering distinctive profitable solutions for its clients in three core areas of activity namely, Asset Management, Wealth & Investment and Specialist Banking.
Our strategic goals and objectives are based on the aspiration to be recognised as a distinctive specialist bank and asset manager. This distinction is embodied in our entrepreneurial culture, which is balanced by a strong risk management discipline, client-centric approach and an ability to be nimble, flexible and innovative. We do not seek to be all things to all people and aim to build well-defined, value-added businesses focused on serving the needs of select market niches where we can compete effectively.
Distinctive performance
1
2 4
3Cast-iron integrity
Dedicated partnership
11
Investec integrated annual review and summary financial statements 201312
Investec in persp
ective
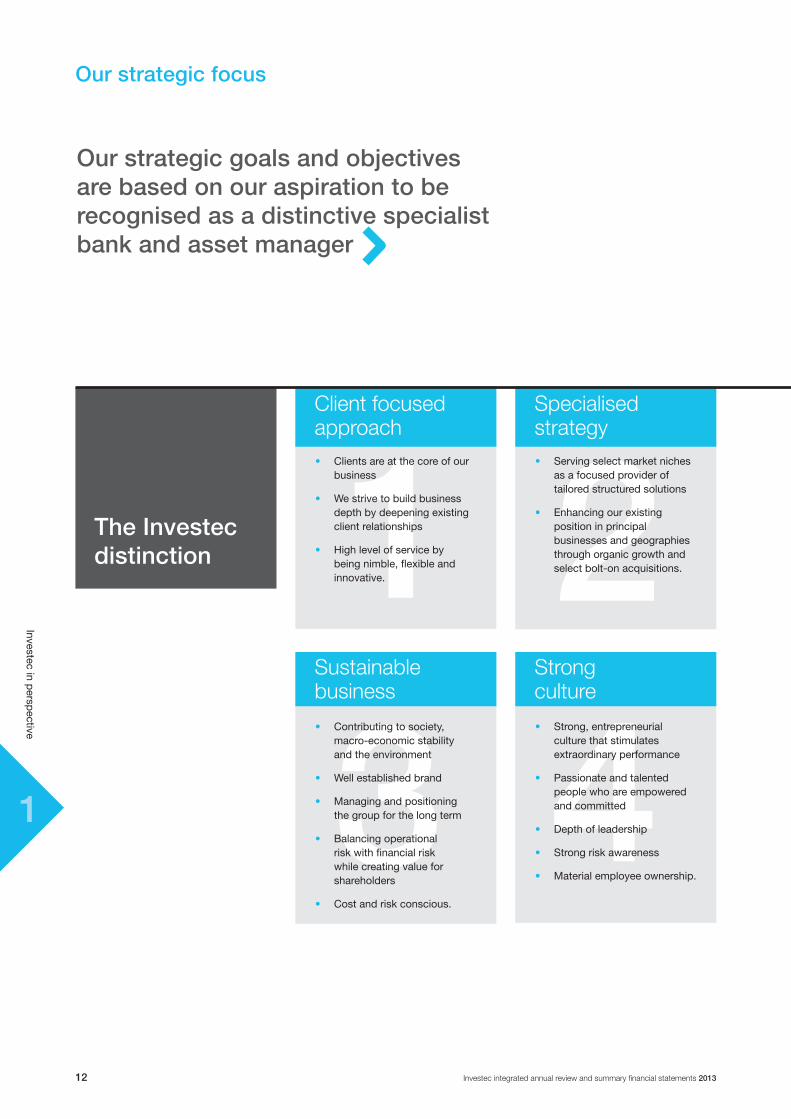
Our strategic focus
Our strategic goals and objectives are based on our aspiration to be recognised as a distinctive specialist bank and asset manager
• Clientsareatthecoreofourbusiness
• Westrivetobuildbusinessdepthbydeepeningexistingclientrelationships
• Highlevelofservicebybeingnimble,flexibleandinnovative.
• Contributingtosociety,macro-economicstabilityandtheenvironment
• Wellestablishedbrand
• Managingandpositioningthegroupforthelongterm
• Balancingoperationalriskwithfinancialriskwhilecreatingvalueforshareholders
• Costandriskconscious.
• Servingselectmarketnichesasafocusedprovideroftailoredstructuredsolutions
• Enhancingourexistingpositioninprincipalbusinessesandgeographiesthroughorganicgrowthandselectbolt-onacquisitions.
• Strong,entrepreneurialculturethatstimulatesextraordinaryperformance
• Passionateandtalentedpeoplewhoareempoweredandcommitted
• Depthofleadership
• Strongriskawareness
• Materialemployeeownership.
Client focused approach
Sustainable business
Specialised strategy
Strong culture
The Investec distinction

11
Investec integrated annual review and summary financial statements 2013 13
Investec in persp
ective
Our strategic focus (continued)
Our diversified and balanced business model supporting long-term strategy
Investment management services
Asset ManagementOperatingcompletelyindependently
Specialist Banking
Corporate/institutional/government
Advisory Transactional bankingLendingTreasury and tradingInvestment activities
Wealth & Investment
Investment management services Independent financial planning advice
Private Client (High net worth/high income)/charities/trusts
We aim to maintain an appropriate balance between revenue earned from operational risk activities and revenue earned from financial risk activities.
This ensures that we are not over reliant on any one part of our businesses to sustain our activities and that we have a large recurring revenue base that enables us to navigate through varying cycles and supports our long-term strategy.
Feesandcommissionincome Typesofincome Netinterest,investment
andtradingincome
Capital light activities
Contribute49%togroupincome
• Assetmanagement• Wealthmanagement• Advisoryservices• Transactionalbankingservices• Propertyfunds
Capital intensive activities
Contribute51%togroupincome
• Lendingportfolios• Investmentportfolios• Tradingincome –clientflows –balancesheetmanagement
Our strategy for the past 20 years has been to build a diversified portfolio of businesses and geographies to support clients through varying markets and economic cycles. Since inception we have expanded through a combination of organic growth and strategic acquisitions.
In order to create a meaningful and balanced portfolio we need proper foundations in place which gain traction over time.
Our current strategy• Maintain momentum in Asset
Management
• Internationalise our Wealth & Investment business
• Simplify the Specialist Banking business model
• Leverage our extensive client base through greater utilisation of our products and services across the group
• Continue to attract new clients, extending the depth and breadth of the franchise.
Broadly defined, we operate across three areas of specialisation focused on well defined target clients:
Our strategy
Our long-term internationalisation strategy• Followourcustomerbase
• Gaindomesticcompetenceandcriticalmassinourchosengeographies
• Facilitatecross-bordertransactionsandflow.
11
Investec integrated annual review and summary financial statements 201314
Investec in persp
ective
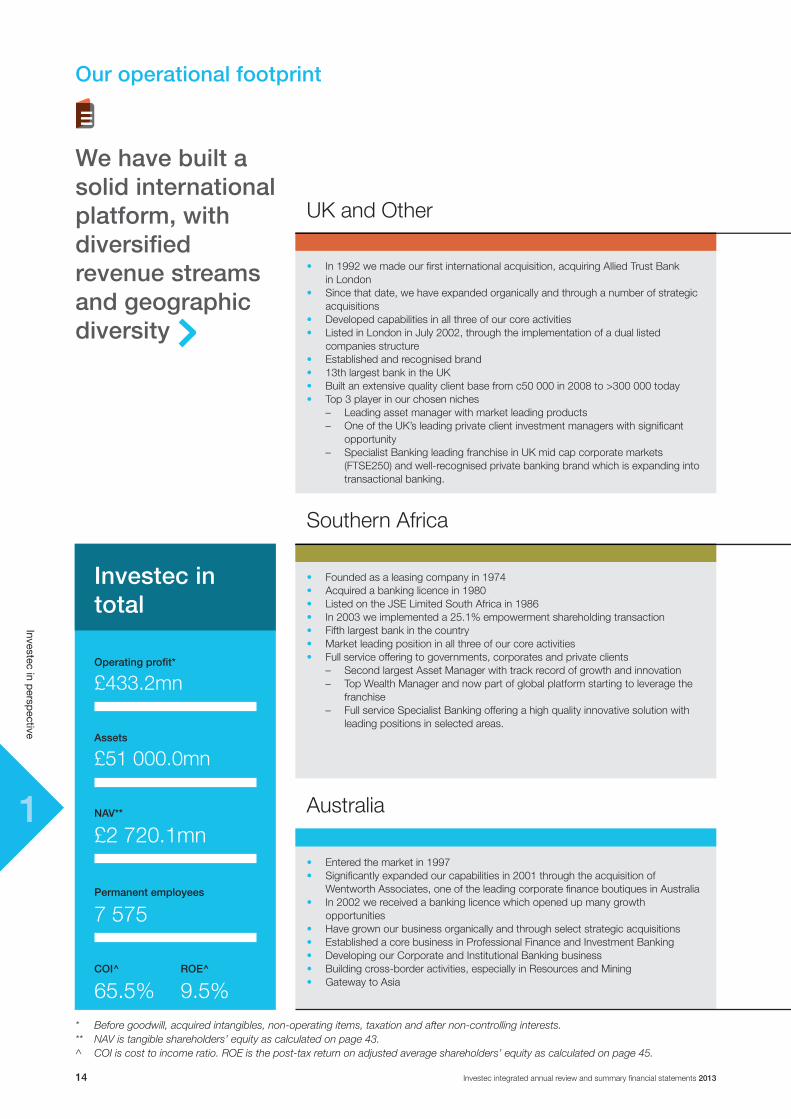
We have built a solid international platform, with diversified revenue streams and geographic diversity
Our operational footprint
Operating profit*
£433.2mn
Assets
£51 000.0mn
NAV**
£2 720.1mn
Permanent employees
7 575
COI^
65.5%ROE^
9.5%
• In 1992 we made our first international acquisition, acquiring Allied Trust Bank in London
• Since that date, we have expanded organically and through a number of strategic acquisitions
• Developed capabilities in all three of our core activities• Listed in London in July 2002, through the implementation of a dual listed
companies structure• Established and recognised brand• 13th largest bank in the UK• Built an extensive quality client base from c50 000 in 2008 to >300 000 today• Top 3 player in our chosen niches – Leading asset manager with market leading products – One of the UK’s leading private client investment managers with significant
opportunity – Specialist Banking leading franchise in UK mid cap corporate markets
(FTSE250) and well-recognised private banking brand which is expanding into transactional banking.
• Founded as a leasing company in 1974• Acquired a banking licence in 1980• Listed on the JSE Limited South Africa in 1986 • In 2003 we implemented a 25.1% empowerment shareholding transaction• Fifth largest bank in the country• Market leading position in all three of our core activities• Full service offering to governments, corporates and private clients – Second largest Asset Manager with track record of growth and innovation – Top Wealth Manager and now part of global platform starting to leverage the
franchise – Full service Specialist Banking offering a high quality innovative solution with
leading positions in selected areas.
• Entered the market in 1997• Significantly expanded our capabilities in 2001 through the acquisition of
Wentworth Associates, one of the leading corporate finance boutiques in Australia • In 2002 we received a banking licence which opened up many growth
opportunities• Have grown our business organically and through select strategic acquisitions• Established a core business in Professional Finance and Investment Banking• Developing our Corporate and Institutional Banking business• Building cross-border activities, especially in Resources and Mining• Gateway to Asia
* Before goodwill, acquired intangibles, non-operating items, taxation and after non-controlling interests.** NAV is tangible shareholders’ equity as calculated on page 43.^ COI is cost to income ratio. ROE is the post-tax return on adjusted average shareholders’ equity as calculated on page 45.
Investec in total
UK and Other
Southern Africa
Australia

11
Investec integrated annual review and summary financial statements 2013 15
Investec in persp
ective
Our operational footprint (continued)
Operatingprofit*
Assets
Assets
NAV**
NAV**
Permanent employees
COI^
ROE^
Total core loans
Total core loans
Total core loans
Total funds under management
Total funds under management
Total funds under management
Total deposit book
Total deposit book
Total deposit book
£66.3bn
£44.1bn
£0.3bn
£10.2bn
£2.2bn
£13.3bn
£1.7bn
33.3%
65.9%
39.4%
54.1%
35.0%
52.2%
44.3%
49.5%
70.0%
56.5%
6.6%
14.9%
Operatingprofit*
Assets
NAV**
Permanent employees
COI^
ROE^
0.8%
6.5%
12.8%
6.2%
84.0%
1.2%
Operating profit* of the Southern African operations decreased 1.4% to £285.4 million, but was up 13.4% in home currency
Operating profit* of the Australian operations £3.4 million (2012: loss of £65.9 million)
Operating profit* of the UK operations increased 6.9% to £144.4 million
£6.0bn£9.6bn
Operatingprofit*
Permanent employees
COI^
ROE^
Actual
As a % of total group
Actual
As a % of total group
Actual
As a % of total group

11
Investec integrated annual review and summary financial statements 201316
Investec in persp
ective
Our operational footprint (continued)
Provides investment management services
Provides a broad range of services:• Advisory • Transactionalbanking • Lending • Treasuryandtrading • Investmentactivities
Provides investment management services and independent financial planning advice
Asset Management
Wealth & Investment
Specialist Banking
* Before goodwill, acquired intangibles, non-operating items, taxation and after non-controlling interests.** NAV is tangible shareholders’ equity as calculated on page 43.^ COI is cost to income ratio. ROE is the pre-tax return on adjusted average shareholders’ equity as calculated on page 46.
1991 Established a platform in South Africa and grown organically.
Today• Independent global
platform with competitive investment performance in chosen specialities
• Institutional focus and global client base
• Funds under management of £69.8 billion
• 1 161 employees.
Looking forward• Continue to grow
business organically
• Focus on increasing funds under management and quality and depth across businesses.
1986 Acquired Metboard in South Africa which did portfolio management.
Today• Consolidated wealth
management offering• Market leader in South
Africa and UK• Superior offering that can
be leveraged with group distribution capabilities
• Funds under management of £40.4 billion
• 1 245 employees.
Looking forward• Opportunity to position
as an international Wealth & Investment business with an integrated offering
• Focus on broadening the client base and markets.
1980 Established banking business enabling Investec to expand into areas of corporate and professional banking.
Today• High quality specialist
banking solution to corporate, institutional, government and private clients with leading positions in selected areas
• 5 169 employees.
Looking forward• Opportunity to be best
service provider across a broad spectrum of products and services
• Focus on leveraging extensive client base.
Our three distinct business activities are focused on well-defined target clients

11
Investec integrated annual review and summary financial statements 2013 17
Investec in persp
ective
Our operational footprint (continued)
Mutual funds
Non-discretionary and other funds under management
Total core loans
Total funds under management
Total funds under management
Segregated mandates
Discretionary funds under management
Total deposit book
£69.8bn
£40.4bn
£28.8bn
£21.4bn
£18.4bn
£41.0bn
£19.0bn
£24.5bn
Operating profit* of Asset Management increased 4.8% to £140.2 million
Operating profit* of Wealth & Investment increased 30.9% to £50.7 million
Operating profit* of Specialist Banking increased 30.1% to £242.3 million
ROE^
COI^
COI^
ROE^
COI^
ROE^
Operatingprofit*
As a % of total group
Actual
Operatingprofit*
Operatingprofit*
32.4%
11.7%
55.9%
Assets
Assets
Assets
1.2%
4.2%
94.6%
NAV**
NAV**
NAV**
1.2%
0.5%
98.3%
Permanent employees
Permanent employees
Permanent employees
15.3%
16.4%
68.3%
65.5%
79.7%
62.8%
95.1%
15.8%
8.0%
11
Investec integrated annual review and summary financial statements 201318
Investec in persp
ective
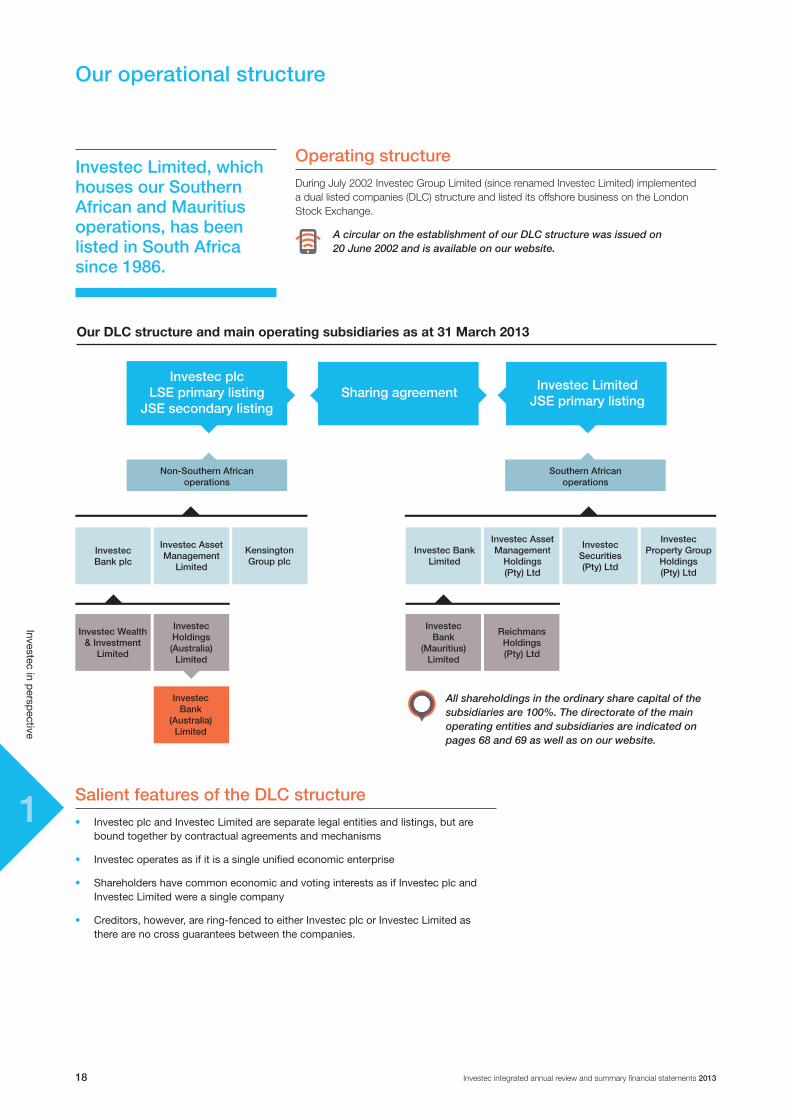
Our operational structure
Operating structureDuring July 2002 Investec Group Limited (since renamed Investec Limited) implemented a dual listed companies (DLC) structure and listed its offshore business on the London Stock Exchange.
A circular on the establishment of our DLC structure was issued on 20 June 2002 and is available on our website.
Investec BankLimited
Investec Asset Management
Holdings (Pty) Ltd
Investec Bank plc
Investec AssetManagement
Limited
KensingtonGroup plc
Investec Securities (Pty) Ltd
Investec Property Group
Holdings (Pty) Ltd
Investec Bank
(Mauritius) Limited
Reichmans Holdings (Pty) Ltd
Investec Wealth & Investment
Limited
Investec Holdings (Australia)
Limited
All shareholdings in the ordinary share capital of the subsidiaries are 100%. The directorate of the main operating entities and subsidiaries are indicated on pages 68 and 69 as well as on our website.
Our DLC structure and main operating subsidiaries as at 31 March 2013
Investec plc LSE primary listing
JSE secondary listing
Non-Southern African operations
Southern African operations
Sharing agreement Investec Limited JSE primary listing
Investec Bank
(Australia) Limited
Salient features of the DLC structure• InvestecplcandInvestecLimitedareseparatelegalentitiesandlistings,butare
boundtogetherbycontractualagreementsandmechanisms
• Investecoperatesasifitisasingleunifiedeconomicenterprise
• ShareholdershavecommoneconomicandvotinginterestsasifInvestecplcandInvestecLimitedwereasinglecompany
• Creditors,however,arering-fencedtoeitherInvestecplcorInvestecLimitedastherearenocrossguaranteesbetweenthecompanies.
Investec Limited, which houses our Southern African and Mauritius operations, has been listed in South Africa since 1986.

11
Investec integrated annual review and summary financial statements 2013 19
Investec in persp
ective
Operating financial review
demand, negatively impacting the currency and economic growth rates.
The South African banking system continues to be highly regarded, maintaining its second ranking in the World Economic Forum’s Global Competiveness Report. South Africa’s credit rating was, however, downgraded as the country’s consolidated deficit widened to around 4.8% of GDP. We were pleased to see the recent adoption of the National Development Plan by government, the effective implementation of which we believe is key to the transformation of South Africa’s economic landscape.
We remain committed to achieving and sustaining an equitable workplace that encourages diversity. Meaningful engagement and consultation took place with employees across the group as part of a process to develop a new Employment Equity Plan, which was submitted to the Department of Labour during the period. Building skills in entrepreneurship and the hard sciences is essential to achieve sustainable transformation. We recently launched an enterprise development programme to back entrepreneurs who manage their own businesses and have potential to grow and create jobs. Recognising that there is a significant shortage of skills in maths and science in South Africa, development of proficiency in these subjects remains a key focus of our corporate social investment programme.
United Kingdom and OtherThe UK economy had another poor year of growth, narrowly missing a ‘triple dip’ recession. Towards the end of the period, the UK was downgraded by credit rating agencies as a result of disappointing short- term growth prospects and the continuation of the deleveraging process.
The Retail Distribution Review became effective in the UK during the period, the full impact of which will take a number of years to materialise. We do not however, envisage this regulation having a material effect on our business model. We maintain an open and compliant relationship with regulators and continue to adjust to the new regulatory environment.
Turning our attention towards the continent, the euro zone endured another year of uncertainty, living in recession throughout the period under review. The Irish economy, however, grew 0.9% and set its sights on recovery as it entered a second year of consecutive growth. Our UK and European activities showed moderate growth with a good performance from our Wealth & Investment business, a stable performance
from our Asset Management business and a subdued performance from our Specialist Bank which continued to be affected by elevated impairments and a higher cost of funds. The marginal cost of funds declined significantly during the latter part of the year which should result in an improvement in our net interest margin in the future.
Optimism that the euro zone crisis is over and that the UK economy is starting to recover is becoming more prevalent. This view is supported by both a recovery in equity markets and a reduction in bond yields in peripheral Europe. This at some point should translate into improved activity levels in the real economy resulting in a more positive environment going forward.
AustraliaThe Australian economy grew at pre-crisis levels in 2012, reaching 3.1% growth for the year. Most of this was realised during the first quarter as growth slowed in subsequent quarters due to lowered expectations on China’s GDP and demand for commodities. This slowdown resulted in the RBA pushing cash rates down to a record low of 3%.
Since 31 March, the economy has continued to struggle with its transition to a ‘post mining investment boom’ world. This has resulted in further interest rate cuts and a weaker Australian Dollar and is expected to have a positive effect on the non-mining economy.
Growth from all three businessesAll three of our core businesses achieved growth for the financial year with Asset Management and Wealth & Investment contributing 44% to group operating profit.
Asset ManagementFor the 2013 financial year, Asset Management increased operating profit by 4.8% to £140.2 million (2012: £133.7 million), benefiting from higher funds under management, net inflows of £4.1 billion and strong growth in performance fees. Total funds under management amounted to £69.8 billion (2012: £61.6 billion). Asset Management has established an international investment platform and a global distribution network with the aim of continuing to drive organic growth by providing a quality service and above benchmark performance to its client base.
During the financial year we announced the sale of a 15% equity stake in the Asset
We are pleased to report improved results for the year ended 31 March 2013. The strategic realignment of the group as a specialist bank and asset manager and the focus of developing capital light revenue streams is paying off. We were satisfied with the progress made in both our Asset Management and Wealth & Investment businesses. Furthermore, substantial progress was made in implementing the One Bank process to create the appropriate base for future growth and development of the Specialist Bank.
Summary of group performanceThe group achieved an increase in adjusted operating profit of 20.8% to £433.2 million (2012: £358.6 million). Adjusted EPS increased 16.4% from 31.8 pence to 37.0 pence. Distributions to shareholders increased from 17 pence to 18 pence resulting in a dividend cover of 2.1 times (2012: 1.9 times).
The Asset Management and Wealth & Investment businesses have benefited from higher levels of average funds under management and net inflows in excess of £4.9 billion. This has resulted in recurring income amounting to 68.6% of total operating income (2012: 67.7%).
Impairments in the Specialist Bank have decreased by 22.8% from the prior year resulting in a strong increase in operating profit. We continue to maintain a sound balance sheet, appropriate capital and a robust liquidity profile.
Overall group results have been negatively impacted by the depreciation of the Rand of approximately 13% against our presentation currency, Pounds Sterling. The latter months of the financial year saw a strong rally in equity markets which was overshadowed by difficult conditions on the ground and low levels of corporate activity. Interest rates remained at historically low economic levels in all three geographies in which we operate, as monetary policy remained accommodative.
Operating environment across our key geographies
South AfricaThe South African economy had its challenges as strong equity returns were annulled by labour unrest and weak global

11
Investec integrated annual review and summary financial statements 201320
Investec in persp
ective
Operating financial review (continued)
Management business to top management personnel, with the option to acquire an additional 5%. The transaction is designed to ensure continuity and to retain and incentivise the senior management team that has been so instrumental in the success of the business to date. We believe that institutional clients are attracted to asset management companies that have significant operational independence and alignment of incentive structures to long-term performance.
Wealth & InvestmentFrom a macro-economic perspective, Wealth & Investment has benefited from a rise in equity markets supported by a rotation from bonds into equities. Operating profit increased by 30.9% to £50.7 million (2012: £38.7 million) benefiting from higher average funds under management and net inflows of £0.8 billion. Total funds under management have grown to £40.4 billion (2012: £34.8 billion).
The UK business is in a consolidation phase as Williams de Broë was migrated onto the group’s platforms in August 2012 and the business was rebranded as Investec Wealth & Investment. Costs relating to integration are reflected in the group’s 2013 results, but are largely non-repeatable as the business sets to improve operating margins over the next few years. The South African business saw an increase in the conversion of non-discretionary to discretionary client mandates, resulting in strong growth in discretionary funds under management.
Wealth & Investment continues to drive the internationalisation of its client offering, leverage off the group’s banking client base as well as broaden the understanding of all services available behind the Investec brand.
Specialist BankingFor the 2013 financial year, the Specialist Banking business increased operating profit 30.1% to £242.3 million (2012: £186.2 million).
In South Africa, the division reported an increase in net interest due to higher
lending and fixed income balances, whilst investment income was bolstered from a solid performance from the private equity and investment property portfolios. Net fees and commissions and trading income from customer flow were negatively impacted by lower activity in the Corporate and Institutional Banking businesses.
The UK benefited from an increase in net fees and commissions in the Corporate Advisory business. Levels of transactional activity within the Private Banking and Corporate and Institutional Banking businesses were mixed, but with a promising pipeline developing. The principal investment portfolios performed well and the division recorded good growth in its professional and specialised lending and asset finance portfolios. The bank looks to reduce excess liquidity and to gain market share in niches where we believe we can compete effectively.
Over the past year, our Australian business returned to profitability. A stable operating environment allowed for solid revenues in our Corporate Advisory and Corporate Lending businesses, as well as consistent activity in our Private Banking business. Going forward, our key focus will be to reshape the business to achieve strategic alignment with the broader group and to generate appropriate returns for shareholders.
Building for the long term
Investec believes that in order to grow and prosper in years to come we need to contribute positively towards our communities, our staff and the economy. We continue to invest in education and entrepreneurship as well as in numerous training and development programmes for our employees. We are dedicated to preserving our natural environment, to reducing our carbon footprint and to playing a broader role in the support and upliftment of the societies in which we operate.
Tribute to our peopleSome of our key differentiators are our service levels and steadfast relationships with clients. These aspects of our company are a direct result of the dedication and hard work of our employees, whom we would like to thank for contributing to an improved set of annual results.
We would like to bid farewell to the head of our Australian business, David Clark, who has helped to successfully rebuild and rebrand Investec in Australia. We would also like to thank Sam Abrahams for his dedicated 15 years of service to Investec as a non-executive and eight years as the chairman of the group’s audit committees. We would further like to welcome David Friedland to our board of non-executive directors and to his new role as chairman of the group’s audit committees.
The past couple of years have been very testing for the financial services industry. Investec has successfully navigated the storm with the confidence of its investors and clients. We thank you for your unwavering support.
OutlookWe have continued to improve efficiencies, streamline our processes, eliminate duplication and build scale. Our focus is to fully leverage the strength of the franchise and to continue deepening our core business activities, while ensuring that each division and geography makes a notable contribution to the group performance.
Although global markets remain challenging, the recent improvement in equity markets bodes well for our business. With the rebalancing of the group between capital light and capital intensive activities, we believe that we have the right mix of businesses and revenue streams to capture the benefits of a sustained market upturn and to drive longer-term performance.
(References to ‘operating profit’ in the text above relates to operating profit before taxation, goodwill, acquired intangibles, non-operating items and after non-controlling interests.)
On behalf of the boards of Investec plc and Investec Limited
SirDavidJProsser FaniTiti StephenKoseff BernardKantorJoint chairman Joint chairman Chief executive officer Managing director
11
Investec integrated annual review and summary financial statements 2013 21
Investec in persp
ective
Financial review
IntroductionInvestec operates under a DLC structure with primary listings of Investec plc on the London Stock Exchange and Investec Limited on the JSE Limited.
In terms of the contracts constituting the DLC structure, Investec plc and Investec Limited effectively form a single economic enterprise in which the economic and voting rights of ordinary shareholders of the companies are maintained in equilibrium relative to each other. The directors of the two companies consider that for financial reporting purposes, the fairest presentation is achieved by combining the results and financial position of both companies.
Accordingly, the year-end results for Investec plc and Investec Limited present the results and financial position of the combined DLC group under International Financial Reporting Standards (IFRS), denominated in Pounds Sterling.
All references in this document to Investec or the group relate to the combined DLC group comprising Investec plc and Investec Limited.
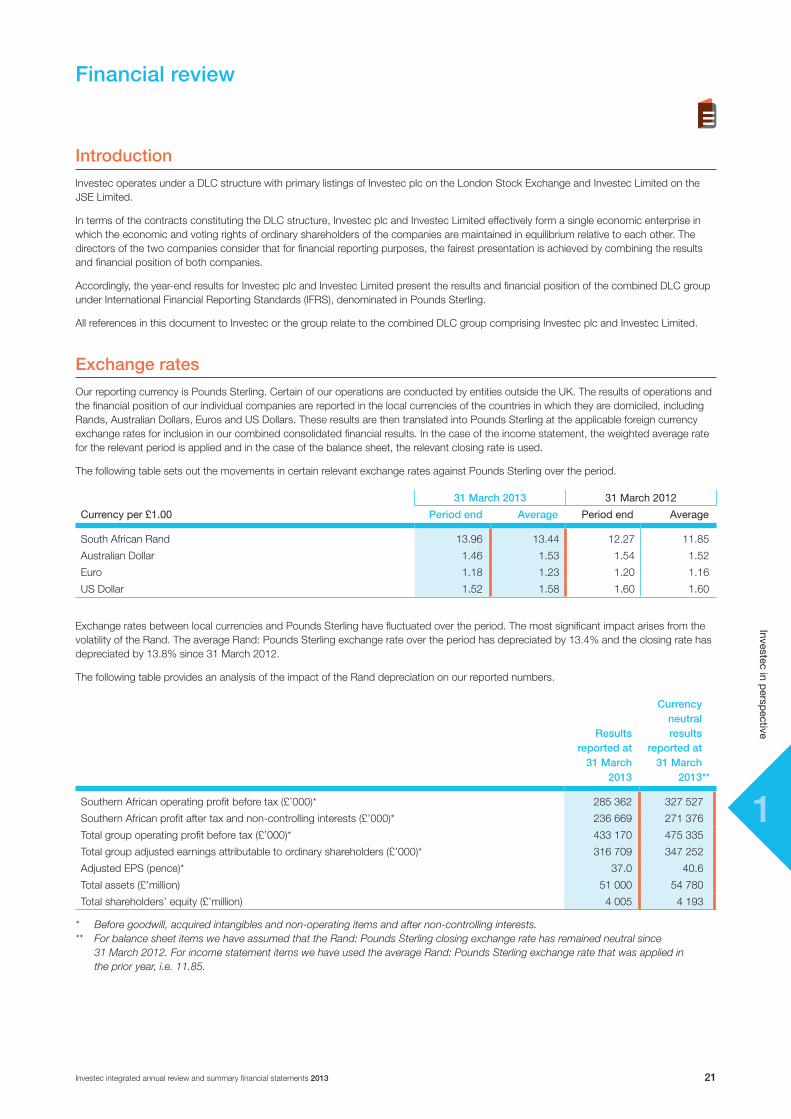
Exchange ratesOur reporting currency is Pounds Sterling. Certain of our operations are conducted by entities outside the UK. The results of operations and the financial position of our individual companies are reported in the local currencies of the countries in which they are domiciled, including Rands, Australian Dollars, Euros and US Dollars. These results are then translated into Pounds Sterling at the applicable foreign currency exchange rates for inclusion in our combined consolidated financial results. In the case of the income statement, the weighted average rate for the relevant period is applied and in the case of the balance sheet, the relevant closing rate is used.
The following table sets out the movements in certain relevant exchange rates against Pounds Sterling over the period.
31 March 2013 31March2012
Currencyper£1.00 Period end Average Periodend Average
South African Rand 13.96 13.44 12.27 11.85
Australian Dollar 1.46 1.53 1.54 1.52
Euro 1.18 1.23 1.20 1.16
US Dollar 1.52 1.58 1.60 1.60
Exchange rates between local currencies and Pounds Sterling have fluctuated over the period. The most significant impact arises from the volatility of the Rand. The average Rand: Pounds Sterling exchange rate over the period has depreciated by 13.4% and the closing rate has depreciated by 13.8% since 31 March 2012.
The following table provides an analysis of the impact of the Rand depreciation on our reported numbers.
Results reported at
31 March 2013
Currency neutralresults
reported at31 March
2013**
Southern African operating profit before tax (£’000)* 285 362 327 527
Southern African profit after tax and non-controlling interests (£’000)* 236 669 271 376
Total group operating profit before tax (£’000)* 433 170 475 335
Total group adjusted earnings attributable to ordinary shareholders (£’000)* 316 709 347 252
Adjusted EPS (pence)* 37.0 40.6
Total assets (£’million) 51 000 54 780
Total shareholders’ equity (£’million) 4 005 4 193
* Before goodwill, acquired intangibles and non-operating items and after non-controlling interests.** For balance sheet items we have assumed that the Rand: Pounds Sterling closing exchange rate has remained neutral since
31 March 2012. For income statement items we have used the average Rand: Pounds Sterling exchange rate that was applied in the prior year, i.e. 11.85.

11
Investec integrated annual review and summary financial statements 201322
Investec in persp
ective
Financial review (continued)
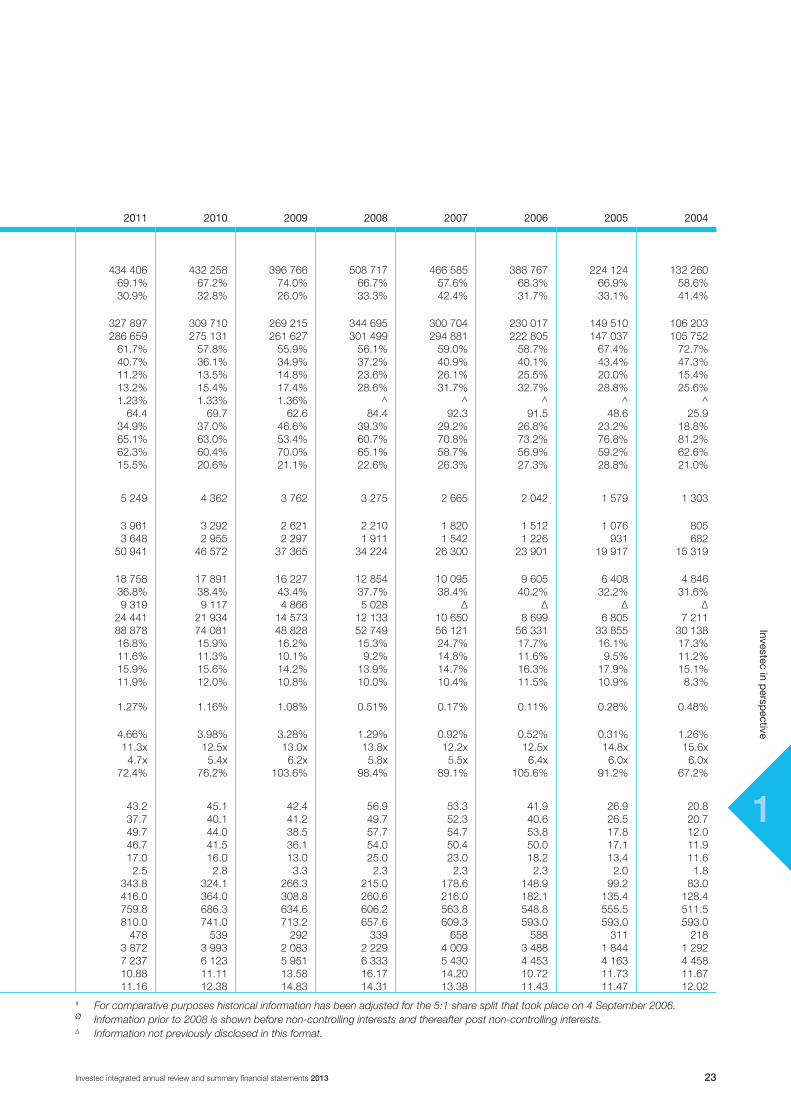
Ten year review
Salient features*
Fortheyearended31March** 2013 2012%change
2013vs2012 2011 2010 2009 2008 2007 2006 2005 2004
IncomestatementandselectedreturnsOperating profit before goodwill, acquired intangibles, non-operating items and taxation (£’000)ø 433 170 358 625 20.8% 434 406 432 258 396 766 508 717 466 585 388 767 224 124 132 260Operating profit: Southern Africa (% of total)ø 65.9% 80.7% 69.1% 67.2% 74.0% 66.7% 57.6% 68.3% 66.9% 58.6% Operating profit: UK, Europe, Australia and Other (% of total)ø 34.1% 19.3% 30.9% 32.8% 26.0% 33.3% 42.4% 31.7% 33.1% 41.4% Adjusted earnings attributable to ordinary shareholders before goodwill, acquired intangibles and non-operating items (£’000) 316 709 257 579 23.0% 327 897 309 710 269 215 344 695 300 704 230 017 149 510 106 203Headline earnings (£’000) 272 626 217 253 25.5% 286 659 275 131 261 627 301 499 294 881 222 805 147 037 105 752Cost to income ratio 65.5% 64.7% 61.7% 57.8% 55.9% 56.1% 59.0% 58.7% 67.4% 72.7% Staff compensation to operating income ratio 43.7% 43.0% 40.7% 36.1% 34.9% 37.2% 40.9% 40.1% 43.4% 47.3% Return on average adjusted shareholders’ equity (post-tax) 9.5% 7.8% 11.2% 13.5% 14.8% 23.6% 26.1% 25.5% 20.0% 15.4% Return on average adjusted tangible shareholders’ equity (post-tax) 11.7% 9.6% 13.2% 15.4% 17.4% 28.6% 31.7% 32.7% 28.8% 25.6%Return on average risk-weighted assets 1.09% 0.91% 1.23% 1.33% 1.36% ^ ^ ^ ^ ^Operating profit per employee (£’000) 54.4 47.8 13.8% 64.4 69.7 62.6 84.4 92.3 91.5 48.6 25.9Net interest income as a % of operating income 35.0% 36.2% 34.9% 37.0% 46.6% 39.3% 29.2% 26.8% 23.2% 18.8% Non-interest income as a % of operating income 65.0% 63.8% 65.1% 63.0% 53.4% 60.7% 70.8% 73.2% 76.8% 81.2% Recurring income as a % of total operating income 68.6% 67.7% 62.3% 60.4% 70.0% 65.1% 58.7% 56.9% 59.2% 62.6%Effective operational tax rate 18.1% 18.1% 15.5% 20.6% 21.1% 22.6% 26.3% 27.3% 28.8% 21.0%
BalancesheetTotal capital resources (including subordinated liabilities) (£’million) 5 756 5 505 4.6% 5 249 4 362 3 762 3 275 2 665 2 042 1 579 1 303Total shareholders’ equity (including preference shares and non-controlling interests) (£’million) 4 005 4 013 (0.2%) 3 961 3 292 2 621 2 210 1 820 1 512 1 076 805Shareholders’ equity (excluding non-controlling interests) (£’million) 3 725 3 716 0.2% 3 648 2 955 2 297 1 911 1 542 1 226 931 682 Total assets (£’million) 51 000 51 550 (1.1%) 50 941 46 572 37 365 34 224 26 300 23 901 19 917 15 319Net core loans and advances to customers (including own originated securitised assets) (£’million) 18 415 18 226 1.0% 18 758 17 891 16 227 12 854 10 095 9 605 6 408 4 846Net core loans and advances to customers as a % of total assets 36.1% 35.4% 36.8% 38.4% 43.4% 37.7% 38.4% 40.2% 32.2% 31.6% Cash and near cash balances (£’million) 9 828 10 251 (4.1%) 9 319 9 117 4 866 5 028 ∆ ∆ ∆ ∆ Customer accounts (deposits) (£’million) 24 532 25 344 (3.2%) 24 441 21 934 14 573 12 133 10 650 8 699 6 805 7 211 Third party assets under management (£’million) 110 678 96 776 14.4% 88 878 74 081 48 828 52 749 56 121 56 331 33 855 30 138Capital adequacy ratio: Investec plcº 16.9% 17.5% 16.8% 15.9% 16.2% 15.3% 24.7% 17.7% 16.1% 17.3% Capital adequacy tier 1 ratio: Investec plc 11.0% 11.6% 11.6% 11.3% 10.1% 9.2% 14.8% 11.6% 9.5% 11.2%Capital adequacy ratio: Investec Limitedº 15.5% 16.1% 15.9% 15.6% 14.2% 13.9% 14.7% 16.3% 17.9% 15.1%Capital adequacy tier 1 ratio: Investec Limited 10.8% 11.6% 11.9% 12.0% 10.8% 10.0% 10.4% 11.5% 10.9% 8.3%Credit loss ratio (core income statement impairment change as a % of average gross core loans and advances) 0.84% 1.12% 1.27% 1.16% 1.08% 0.51% 0.17% 0.11% 0.28% 0.48%Defaults (net of impairments and before collateral) as a % of net core loans and advances to customers 2.73% 3.31% 4.66% 3.98% 3.28% 1.29% 0.92% 0.52% 0.31% 1.26%Gearing/leverage ratio (assets excluding assurance assets to total equity) 11.2x 11.3x 11.3x 12.5x 13.0x 13.8x 12.2x 12.5x 14.8x 15.6xCore loans to equity ratio 4.6x 4.5x 4.7x 5.4x 6.2x 5.8x 5.5x 6.4x 6.0x 6.0xLoans and advances to customers: customer deposits 71.3% 67.8% 72.4% 76.2% 103.6% 98.4% 89.1% 105.6% 91.2% 67.2%
SalientfinancialfeaturesandkeystatisticsAdjusted earnings per share (pence)# 37.0 31.8 16.4% 43.2 45.1 42.4 56.9 53.3 41.9 26.9 20.8Headline earnings per share (pence)# 31.9 26.8 19.0% 37.7 40.1 41.2 49.7 52.3 40.6 26.5 20.7Basic earnings per share (pence)# 32.5 25.7 26.5% 49.7 44.0 38.5 57.7 54.7 53.8 17.8 12.0Diluted earnings per share (pence)# 30.6 24.3 25.9% 46.7 41.5 36.1 54.0 50.4 50.0 17.1 11.9Dividends per share (pence)# 18.0 17.0 5.9% 17.0 16.0 13.0 25.0 23.0 18.2 13.4 11.6Dividend cover (times) 2.1 1.9 10.5% 2.5 2.8 3.3 2.3 2.3 2.3 2.0 1.8Net tangible asset value per share (pence)# 391.5 392.0 (0.1%) 343.8 324.1 266.3 215.0 178.6 148.9 99.2 83.0Net asset value per share# 318.2 317.0 0.4% 416.0 364.0 308.8 260.6 216.0 182.1 135.4 128.4Weighted number of ordinary shares in issue (million)# 856.0 809.6 5.7% 759.8 686.3 634.6 606.2 563.8 548.8 555.5 511.5Total number of shares in issue (million)# 884.8 874.0 1.2% 810.0 741.0 713.2 657.6 609.3 593.0 593.0 593.0Closing share price (pence)# 459 382 20.2% 478 539 292 339 658 588 311 218Market capitalisation (£’million) 4 061 3 340 21.6% 3 872 3 993 2 083 2 229 4 009 3 488 1 844 1 292Number of employees in the group (including temps and contractors) 8 151 7 781 4.8% 7 237 6 123 5 951 6 333 5 430 4 453 4 163 4 458Closing ZAR:£ exchange rate 13.96 12.27 13.8% 10.88 11.11 13.58 16.17 14.20 10.72 11.73 11.67Average ZAR:£ exchange rate 13.44 11.85 13.4% 11.16 12.38 14.83 14.31 13.38 11.43 11.47 12.02
* Refer to definitions on the inside back cover.** The numbers prior to 2005 are reported in terms of UK GAAP, and thereafter in terms of IFRS.^ Calculation not comparable.º Information prior to 2008 is in terms of Basel information for Investec Limited, for 2013 is in terms of Basel III.
11
Investec integrated annual review and summary financial statements 2013 23
Investec in persp
ective
Ten year review
Salient features*
Fortheyearended31March** 2013 2012%change
2013vs2012 2011 2010 2009 2008 2007 2006 2005 2004
IncomestatementandselectedreturnsOperating profit before goodwill, acquired intangibles, non-operating items and taxation (£’000)ø 433 170 358 625 20.8% 434 406 432 258 396 766 508 717 466 585 388 767 224 124 132 260Operating profit: Southern Africa (% of total)ø 65.9% 80.7% 69.1% 67.2% 74.0% 66.7% 57.6% 68.3% 66.9% 58.6% Operating profit: UK, Europe, Australia and Other (% of total)ø 34.1% 19.3% 30.9% 32.8% 26.0% 33.3% 42.4% 31.7% 33.1% 41.4% Adjusted earnings attributable to ordinary shareholders before goodwill, acquired intangibles and non-operating items (£’000) 316 709 257 579 23.0% 327 897 309 710 269 215 344 695 300 704 230 017 149 510 106 203Headline earnings (£’000) 272 626 217 253 25.5% 286 659 275 131 261 627 301 499 294 881 222 805 147 037 105 752Cost to income ratio 65.5% 64.7% 61.7% 57.8% 55.9% 56.1% 59.0% 58.7% 67.4% 72.7% Staff compensation to operating income ratio 43.7% 43.0% 40.7% 36.1% 34.9% 37.2% 40.9% 40.1% 43.4% 47.3% Return on average adjusted shareholders’ equity (post-tax) 9.5% 7.8% 11.2% 13.5% 14.8% 23.6% 26.1% 25.5% 20.0% 15.4% Return on average adjusted tangible shareholders’ equity (post-tax) 11.7% 9.6% 13.2% 15.4% 17.4% 28.6% 31.7% 32.7% 28.8% 25.6%Return on average risk-weighted assets 1.09% 0.91% 1.23% 1.33% 1.36% ^ ^ ^ ^ ^Operating profit per employee (£’000) 54.4 47.8 13.8% 64.4 69.7 62.6 84.4 92.3 91.5 48.6 25.9Net interest income as a % of operating income 35.0% 36.2% 34.9% 37.0% 46.6% 39.3% 29.2% 26.8% 23.2% 18.8% Non-interest income as a % of operating income 65.0% 63.8% 65.1% 63.0% 53.4% 60.7% 70.8% 73.2% 76.8% 81.2% Recurring income as a % of total operating income 68.6% 67.7% 62.3% 60.4% 70.0% 65.1% 58.7% 56.9% 59.2% 62.6%Effective operational tax rate 18.1% 18.1% 15.5% 20.6% 21.1% 22.6% 26.3% 27.3% 28.8% 21.0%
BalancesheetTotal capital resources (including subordinated liabilities) (£’million) 5 756 5 505 4.6% 5 249 4 362 3 762 3 275 2 665 2 042 1 579 1 303Total shareholders’ equity (including preference shares and non-controlling interests) (£’million) 4 005 4 013 (0.2%) 3 961 3 292 2 621 2 210 1 820 1 512 1 076 805Shareholders’ equity (excluding non-controlling interests) (£’million) 3 725 3 716 0.2% 3 648 2 955 2 297 1 911 1 542 1 226 931 682 Total assets (£’million) 51 000 51 550 (1.1%) 50 941 46 572 37 365 34 224 26 300 23 901 19 917 15 319Net core loans and advances to customers (including own originated securitised assets) (£’million) 18 415 18 226 1.0% 18 758 17 891 16 227 12 854 10 095 9 605 6 408 4 846Net core loans and advances to customers as a % of total assets 36.1% 35.4% 36.8% 38.4% 43.4% 37.7% 38.4% 40.2% 32.2% 31.6% Cash and near cash balances (£’million) 9 828 10 251 (4.1%) 9 319 9 117 4 866 5 028 ∆ ∆ ∆ ∆ Customer accounts (deposits) (£’million) 24 532 25 344 (3.2%) 24 441 21 934 14 573 12 133 10 650 8 699 6 805 7 211 Third party assets under management (£’million) 110 678 96 776 14.4% 88 878 74 081 48 828 52 749 56 121 56 331 33 855 30 138Capital adequacy ratio: Investec plcº 16.9% 17.5% 16.8% 15.9% 16.2% 15.3% 24.7% 17.7% 16.1% 17.3% Capital adequacy tier 1 ratio: Investec plc 11.0% 11.6% 11.6% 11.3% 10.1% 9.2% 14.8% 11.6% 9.5% 11.2%Capital adequacy ratio: Investec Limitedº 15.5% 16.1% 15.9% 15.6% 14.2% 13.9% 14.7% 16.3% 17.9% 15.1%Capital adequacy tier 1 ratio: Investec Limited 10.8% 11.6% 11.9% 12.0% 10.8% 10.0% 10.4% 11.5% 10.9% 8.3%Credit loss ratio (core income statement impairment change as a % of average gross core loans and advances) 0.84% 1.12% 1.27% 1.16% 1.08% 0.51% 0.17% 0.11% 0.28% 0.48%Defaults (net of impairments and before collateral) as a % of net core loans and advances to customers 2.73% 3.31% 4.66% 3.98% 3.28% 1.29% 0.92% 0.52% 0.31% 1.26%Gearing/leverage ratio (assets excluding assurance assets to total equity) 11.2x 11.3x 11.3x 12.5x 13.0x 13.8x 12.2x 12.5x 14.8x 15.6xCore loans to equity ratio 4.6x 4.5x 4.7x 5.4x 6.2x 5.8x 5.5x 6.4x 6.0x 6.0xLoans and advances to customers: customer deposits 71.3% 67.8% 72.4% 76.2% 103.6% 98.4% 89.1% 105.6% 91.2% 67.2%
SalientfinancialfeaturesandkeystatisticsAdjusted earnings per share (pence)# 37.0 31.8 16.4% 43.2 45.1 42.4 56.9 53.3 41.9 26.9 20.8Headline earnings per share (pence)# 31.9 26.8 19.0% 37.7 40.1 41.2 49.7 52.3 40.6 26.5 20.7Basic earnings per share (pence)# 32.5 25.7 26.5% 49.7 44.0 38.5 57.7 54.7 53.8 17.8 12.0Diluted earnings per share (pence)# 30.6 24.3 25.9% 46.7 41.5 36.1 54.0 50.4 50.0 17.1 11.9Dividends per share (pence)# 18.0 17.0 5.9% 17.0 16.0 13.0 25.0 23.0 18.2 13.4 11.6Dividend cover (times) 2.1 1.9 10.5% 2.5 2.8 3.3 2.3 2.3 2.3 2.0 1.8Net tangible asset value per share (pence)# 391.5 392.0 (0.1%) 343.8 324.1 266.3 215.0 178.6 148.9 99.2 83.0Net asset value per share# 318.2 317.0 0.4% 416.0 364.0 308.8 260.6 216.0 182.1 135.4 128.4Weighted number of ordinary shares in issue (million)# 856.0 809.6 5.7% 759.8 686.3 634.6 606.2 563.8 548.8 555.5 511.5Total number of shares in issue (million)# 884.8 874.0 1.2% 810.0 741.0 713.2 657.6 609.3 593.0 593.0 593.0Closing share price (pence)# 459 382 20.2% 478 539 292 339 658 588 311 218Market capitalisation (£’million) 4 061 3 340 21.6% 3 872 3 993 2 083 2 229 4 009 3 488 1 844 1 292Number of employees in the group (including temps and contractors) 8 151 7 781 4.8% 7 237 6 123 5 951 6 333 5 430 4 453 4 163 4 458Closing ZAR:£ exchange rate 13.96 12.27 13.8% 10.88 11.11 13.58 16.17 14.20 10.72 11.73 11.67Average ZAR:£ exchange rate 13.44 11.85 13.4% 11.16 12.38 14.83 14.31 13.38 11.43 11.47 12.02
# For comparative purposes historical information has been adjusted for the 5:1 share split that took place on 4 September 2006.ø Information prior to 2008 is shown before non-controlling interests and thereafter post non-controlling interests.∆ Information not previously disclosed in this format.

11
Investec integrated annual review and summary financial statements 201324
Investec in persp
ective
Financial review (continued)
Track record
0
20
10
30
40
50
60
pence
37.0
04 05 06 07 08 09 10 11 12 13
Adjusted earnings per share*
Note:Results are shown for the year ended 31 March, unless otherwise stated. Prior to 2005 the numbers are reported in terms of UK GAAP and thereafter in terms of IFRS.
Up 16.4% to 37.0 pence
0
100
50
200
250
300
350
£’million
316.7
04 05 06 07 08 09 10 11 12 13
150
* Historical EPS numbers have been adjusted for the 5:1 share split that took place on 4 September 2006.
Adjusted earnings attributable to ordinary shareholders before goodwill, acquired intangibles and non-operating items
Up 23.0% to £316.7 million
Up 14.4% to £110.7 billion since 31 March 2012 – an increase of 20.6% on a currency neutral basis* *Net inflows of £4.9 billion
0
40
20
60
80
120
£’billion
110.7
04 05 06 07 08 09 10 11 12 13
100
Third party assets under management
Core loans: up 1.0% to £18.4 billion since 31 March 2012 – an increase of 8.1% on a currency neutral basis**Deposits: down 3.2% to £24.5 billion since 31 March 2012– an increase of 3.7% on a currency neutral basis**
0
15
10
20
25
30
£’billion
24.5
04 05 06 07 08 09 10 11 12 13
5
Core loans Customer deposits
18.4
** Currency neutral basis: calculation assumes that the closing exchange rates of the group’s relevant exchange rates, as reflected on page 21, remain the same as at 31 March 2013 when compared to 31 March 2012.
Core loans and customer deposits

11
Investec integrated annual review and summary financial statements 2013 25
Investec in persp
ective
Financial review (continued)
0
10
5
15
20
25
30
Percentage
9.5
04 05 06 07 08 09 10 11 12 13
We have set the following target over the medium to long term:Group ROE: 12% to 16% over a rolling five-year period in Pounds Sterling
Target
Target Target
We have set the following target over the medium to long term:Group COI ratio: less than 65% in Pounds Sterling
Target
Financial objectives
ROE*
* ROE is post-tax return on adjusted average shareholders’ equity as calculated on page 44.
0
30
20
40
50
60
pence
18.0
04 05 06 07 08 09 10 11 12 13
10
EPS** DPS
37.0
** Adjusted EPS before goodwill, acquired intangibles and non-operating items as defined on the inside back cover. The numbers have been adjusted for the 5:1 share split that took place on 4 September 2006.
Adjusted earnings per share (EPS) and dividends per share (DPS)
In the medium to long term, we aim to achieve adjusted EPS growth of 10% in excess of UK inflation (in Pounds Sterling). We continually strive to build and maintain a sustainable business model. We intend to maintain a dividend cover of between 1.7 to 3.5 times based on earnings per share as defined above, denominated in Pounds Sterling.
We intend to maintain a sufficient level of capital to satisfy regulatory requirements, as well as take advantage of opportunities that may arise in the financial services industry focusing on increasing our return on equity in the medium to long term. We target a capital adequacy ratio range of between 14% and 17% on a consolidated basis for Investec plc and Investec Limited and we target a minimum tier 1 ratio of 10.5% (adjusted from 11% as a consequence of Basel III).
0
30
20
40
50
80
Percentage
65.5
04 05 06 07 08 09 10 11 12 13
10
SC COI
70
60
COI target (below 65%)
43.7
Cost to income ratio (COI) and staff compensation to operating income ratio (SC)
0
1 000
2 000
3 000
4 000
5 000
£’000
4 005
04 05 06 07 08 09 10 11 12 13
Percentage
0
5
15
20
30
25
10
Investec Limited CAR*** Investec plc CAR*** Total shareholders’ equity
*** Capital adequacy figures prior to 2008 are disclosed under Basel I and thereafter under Basel II for Investec plc and at 31 March 2013 under Basel III for Investec Limited.
Note:The numbers shown in the financial objectives graphs on pages 24 and 25 are for the years ended 31 March, unless otherwise stated. The numbers prior to 2005 are reported in terms of UK GAAP.
Total shareholders’ equity and capital adequacy ratios (CAR)

11
Investec integrated annual review and summary financial statements 201326
Investec in persp
ective
Financial review (continued)
South Africa’s economy has essentially doubled in real terms, generating substantial upward social mobility, with most now experiencing a significantly higher standard of living.
Indeed, the direct, positive correlation between economic freedom and wealth creation, economic growth, poverty reduction, higher levels of investment and greater equality generated economic growth of 3.2% a year since 1994, compared to only 1.6% per annum in the final eighteen years of apartheid.
Real after-tax income has risen to an average of R24 761 per person, from 1994’s R17 320, effectively doubling real tax revenues and affording the considerable expansion of the social welfare net, including the provision of free basic services and direct monetary transfers to the poor. The state provision of basic services has been extensive; 63% to 94% of households now live with sanitation, in formal homes with electricity and access to clean water respectively (in 1994 access to these respective services ranged from 50% to 64%).
While it is impossible to sustainably eradicate the legacy of apartheid in a comparatively short space of time (without state penury), government’s service delivery has been negatively impacted by high costs (due in part to inefficiencies, wastage and corruption) which has contributed to both higher budget deficits and borrowing requirements. In combination with the recent violent strikes, that cut economic
growth and widened the balance of payments deficit, Moody’s, Standard and Poor’s and Fitch downgraded South Africa’s long-term foreign currency credit rating. The chance of further downgrades has been lowered by the marked lessening in disruptive strike action and recent moderation in projected real government expenditure, as well as maintaining the forecast period during which planned fiscal consolidation is reached.
South Africa’s private sector continues to be highly ranked in the World Economic Forum’s Global Competitiveness Survey, retaining first place for the third year in a row for both the regulation of the country’s securities exchange (JSE) and strength of auditing and reporting standards. South Africa retains its second place in terms of soundness of banks (for the second year) and is now placed first on the efficacy of its corporate boards. However, government provision of healthcare, education and safety and security is ranked amongst the worst in the world, while the level of co-operation between labour and corporates is ranked the lowest in the one hundred and forty-four World Economic Forum’s country survey.
Consequently the recent National Development Plan, an economic framework for South Africa until 2030, focuses on addressing these problems, along with unemployment rate, poverty and inequality, by professionalising the civil service, improving the quality of healthcare and education, increasing exports and support for small businesses and so promoting higher incomes via productivity growth.
The need for strong leadership and effective government is also clearly recognised by the ruling party, with additional aims of improving investment and innovation levels, efficient and competitive infrastructure and a labour market that is more responsive to economic opportunity.
An overview of the operating environment impacting our business
South Africa
Our views
South Africa has seen many considerable successes in the past two decades on the significant rise in economic freedom resulting from the abolition of apartheid. As the entire population obtained the right to self determination, from where to live, work and invest, to what to consume, trade and own (including land), economic freedom and hence growth improved substantially.
Economic growth 2011/12
Economic growth 2012/13
2.2% 2.5%
Real income per capita has risen
2012
R36 9032013
R37 476

11
Investec integrated annual review and summary financial statements 2013 27
Investec in persp
ective
Financial review (continued)
Over the 2012/13 financial year, UK economic growth remained lacklustre.
Seeking to support the UK economy onto a firmer footing, but stopping short of a sustained push for a stronger recovery because of above target inflation, the UK Monetary Policy Committee kept policy expansionary during the period.
The bank rate remained at a record low of 0.5% whilst the Bank of England, at the end of the period, had bought around £375 billion of assets via its Quantitive Easing (QE) programme, having upped that total by £50 billion during the course of the year.
The bank also launched the Funding for Lending Scheme in August 2012 in an effort to boost overall and small business focused lending; material results have yet to be seen, though it is still relatively early days.
The UK was stripped of its AAA long-term sovereign credit rating during the financial year with Moody’s cutting its rating with a one notch downgrade to Aa1, with a stable outlook, in February 2013.
In March 2013, Fitch put the UK on ratings watch negative (downgrading it to AA+ in April). As the review period closed, Standard and Poor’s had a negative outlook on the UK’s rating. However, there was not a long lasting market reaction to the news of these downgrades with confidence aided by the Chancellor sticking rigidly to his goals of fiscal consolidation and a broad plan for achieving this, albeit with success in the headline fiscal metrics so far limited.
United Kingdom
Our views
The Australian economy expanded by 3.1% in 2012, up from its 2.6% 2011 growth rate and in line with the average growth rate for the pre-2008 crisis decade.
Growth started 2012 robustly, but softened to stand at a quarterly pace of 0.6% in each of the second, third and fourth quarters of 2012, as China and the global economy more broadly lost growth momentum.
Furthermore, a squeeze on domestic expenditure through the fiscal consolidation programme also took its toll on the pace of Australian output expansion. Fears that the mining peak had now been passed as Chinese growth appeared to be moving onto a lower long-term track, pushed the Reserve Bank of Australia (RBA) into easing policy four times during the financial year, taking the RBA’s cash rate down to a new record low of 3.00%, some 125 basis points lower than its position at the start of that period.
Australia
Our views
Whilst a ‘triple dip’ recession during this period seemed to have been avoided, at the end of the financial year UK output still stood 2.6% below its pre-crisis peak, some five years after the initial move into recession.
Economic growth 2011/12
Economic growth 2012/13
0.3% 0.2%
Real income per capita has risen
2012
£24 0312013
£24 373
Economic growth 2011/12
Economic growth 2012/13
2.6% 3.1%
Real income per capita has risen
2012
A$63 7442013
A$65 612

11
Investec integrated annual review and summary financial statements 201328
Investec in persp
ective
Financial review (continued)
An overview of the operating environment impacting our business (continued)
The Euro crisis rumbled on through the financial year. From a relatively calm spring, once Greece’s debt restructuring had been dealt with in March 2012, market turmoil built through the summer. Peripheral government bonds came under pressure, with Spain and Italy both looking increasingly vulnerable to a bailout as their respective government bond yields tracked higher as sentiment soured once again. European Central Bank (ECB) President Mario Draghi sought to reinstall a state of calm to markets by saying he would do whatever it took to save the Euro whilst unveiling the ECB’s new rescue backstop, Outright Monetary Transactions (OMT). Under the OMT the ECB offered the reassurance that it would purchase short-term government bonds, acting as a backstop, subject to conditions being satisfied by the country requesting assistance. The promise of the OMT backstop was enough, without its deployment, to help to bring down peripheral bond yields significantly and calm Euro crisis strains. However, tensions over Greece resurfaced in the autumn, related to whether the Troika would be able to sign off on a revised bailout and release further urgently needed aid cash because of significant slippage in Greece’s reform and fiscal objectives. Greece was eventually granted the aid cash, as it signed up to a refreshed reform programme and tensions subsequently calmed. But almost as soon as Greek fears had been addressed, Cyprus came into focus as the next problem. Cyprus eventually ended up the recipient of a full bailout agreement in March 2013, but not before faith in the rescue backstops had been thoroughly shaken with uninsured depositors and senior bondholders both initially put in line for losses as part of the Cypriot agreement. Hence, whilst the Euro survived another turbulent year, 2012/13 closed on a sour note with questions being asked about the robustness of the backstop and rescue mechanisms in place to cope with further rounds of turmoil. The macro-economy of the Euro area did not fare any better, re-entering recession from Q2 2012 with that weakness having persisted into the first quarter of 2013 too.
Euro zone
The US economy expanded by 2.2% over 2012 and made a respectable start to 2013 recording growth of 2.5% on an annualised seasonally adjusted basis in Q1.
The payroll tax hike which came into effect in January 2013 and the sequester spending cuts which took effect in March 2013, both look set to slow growth sharply in the second quarter.
This improvement in the economic backdrop has also helped to support a modest recovery in the US job market with the unemployment rate having slid close to 7.5%. Broader measures of the US’s recovery position have also built over the past year. The pace of loans to the commercial and industrial sector continued to grow at a rapid pace, helping to build the US’s industrial recovery. In the housing sector, activity levels climbed sharply over the past year with the price recovery building too, helping to lift consumer sentiment with it.
Despite this improving picture, the US recovery still has some way to go; hence the Federal Reserve loosened policy over the past year. The Fed’s policy package included the announcement of the second ‘Operation Twist’ phase in June 2012, followed by ‘QE3’ through which, by the start of 2013, the Federal Reserve was purchasing a total of U$85 billion of Mortgage Backed Securities and longer-term Treasury securities per month. Those purchases were still ongoing at the end of the financial year, as the US central bank sought to maintain accommodation in the face of the fiscal squeeze from the payroll tax hike and as the squeeze of the sequester loomed.
United States
Our views
The steady US recovery over the three years since 2010 meant that at the end of the 2012/13 financial year, US GDP stood 3.3% up on its 2008 pre-crisis peak level.
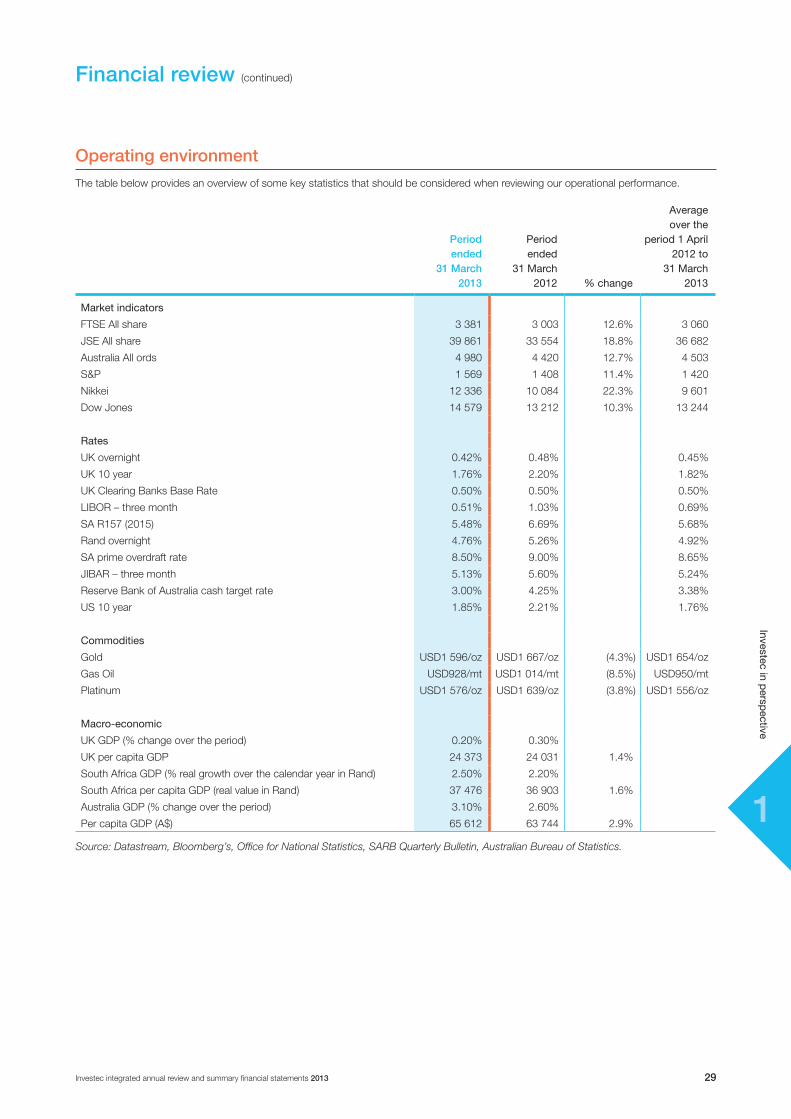
11
Investec integrated annual review and summary financial statements 2013 29
Investec in persp
ective
Financial review (continued)
Operating environmentThe table below provides an overview of some key statistics that should be considered when reviewing our operational performance.
Periodended
31 March2013
Periodended
31March2012 %change
Averageoverthe
period1April2012to
31March2013
Marketindicators
FTSE All share 3 381 3 003 12.6% 3 060
JSE All share 39 861 33 554 18.8% 36 682
Australia All ords 4 980 4 420 12.7% 4 503
S&P 1 569 1 408 11.4% 1 420
Nikkei 12 336 10 084 22.3% 9 601
Dow Jones 14 579 13 212 10.3% 13 244
Rates
UK overnight 0.42% 0.48% 0.45%
UK 10 year 1.76% 2.20% 1.82%
UK Clearing Banks Base Rate 0.50% 0.50% 0.50%
LIBOR – three month 0.51% 1.03% 0.69%
SA R157 (2015) 5.48% 6.69% 5.68%
Rand overnight 4.76% 5.26% 4.92%
SA prime overdraft rate 8.50% 9.00% 8.65%
JIBAR – three month 5.13% 5.60% 5.24%
Reserve Bank of Australia cash target rate 3.00% 4.25% 3.38%
US 10 year 1.85% 2.21% 1.76%
Commodities
Gold USD1 596/oz USD1 667/oz (4.3%) USD1 654/oz
Gas Oil USD928/mt USD1 014/mt (8.5%) USD950/mt
Platinum USD1 576/oz USD1 639/oz (3.8%) USD1 556/oz
Macro-economic
UK GDP (% change over the period) 0.20% 0.30%
UK per capita GDP 24 373 24 031 1.4%
South Africa GDP (% real growth over the calendar year in Rand) 2.50% 2.20%
South Africa per capita GDP (real value in Rand) 37 476 36 903 1.6%
Australia GDP (% change over the period) 3.10% 2.60%
Per capita GDP (A$) 65 612 63 744 2.9%
Source: Datastream, Bloomberg’s, Office for National Statistics, SARB Quarterly Bulletin, Australian Bureau of Statistics.
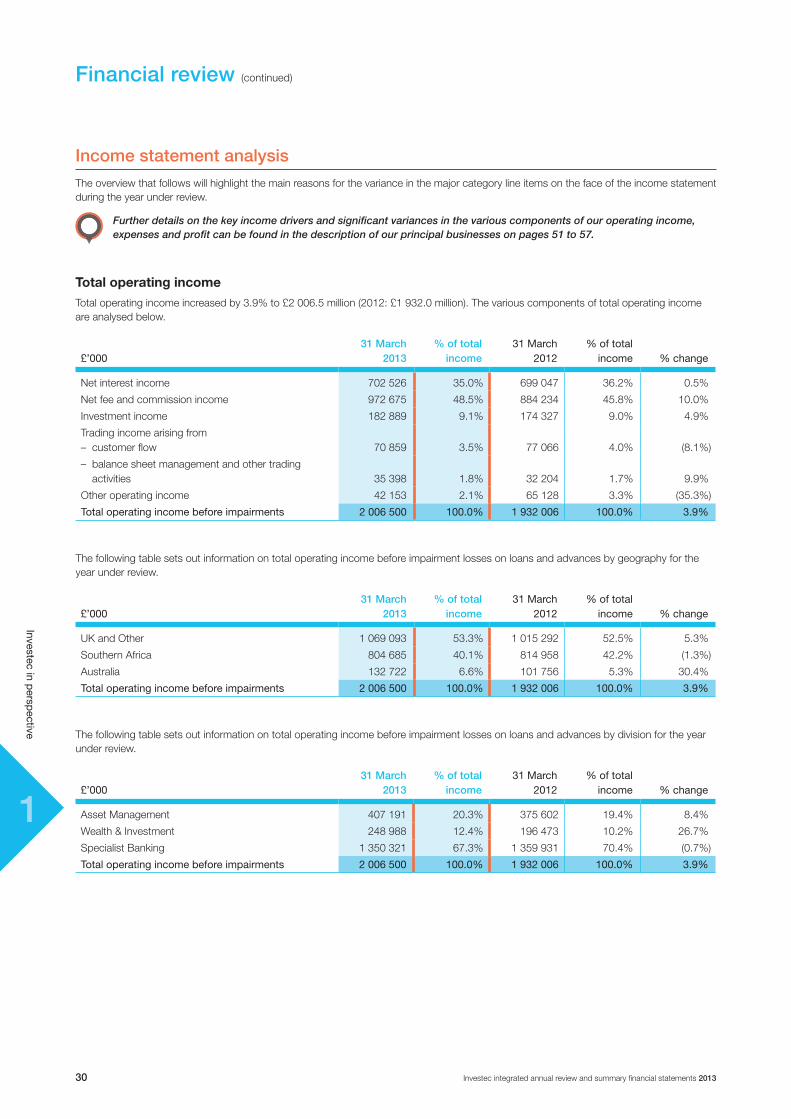
11
Investec integrated annual review and summary financial statements 201330
Investec in persp
ective
Financial review (continued)
Income statement analysisThe overview that follows will highlight the main reasons for the variance in the major category line items on the face of the income statement during the year under review.
Further details on the key income drivers and significant variances in the various components of our operating income, expenses and profit can be found in the description of our principal businesses on pages 51 to 57.
Total operating incomeTotal operating income increased by 3.9% to £2 006.5 million (2012: £1 932.0 million). The various components of total operating income are analysed below.
£’00031 March
2013% of total
income31March
2012%oftotalincome %change
Net interest income 702 526 35.0% 699 047 36.2% 0.5%
Net fee and commission income 972 675 48.5% 884 234 45.8% 10.0%
Investment income 182 889 9.1% 174 327 9.0% 4.9%
Trading income arising from – customer flow 70 859 3.5% 77 066 4.0% (8.1%)
– balance sheet management and other trading activities 35 398 1.8% 32 204 1.7% 9.9%
Other operating income 42 153 2.1% 65 128 3.3% (35.3%)
Totaloperatingincomebeforeimpairments 2 006 500 100.0% 1 932 006 100.0% 3.9%
The following table sets out information on total operating income before impairment losses on loans and advances by geography for the year under review.
£’00031 March
2013% of total
income31March
2012%oftotalincome %change
UK and Other 1 069 093 53.3% 1 015 292 52.5% 5.3%
Southern Africa 804 685 40.1% 814 958 42.2% (1.3%)
Australia 132 722 6.6% 101 756 5.3% 30.4%
Totaloperatingincomebeforeimpairments 2 006 500 100.0% 1 932 006 100.0% 3.9%
The following table sets out information on total operating income before impairment losses on loans and advances by division for the year under review.
£’00031 March
2013% of total
income31March
2012%oftotalincome %change
Asset Management 407 191 20.3% 375 602 19.4% 8.4%
Wealth & Investment 248 988 12.4% 196 473 10.2% 26.7%
Specialist Banking 1 350 321 67.3% 1 359 931 70.4% (0.7%)
Totaloperatingincomebeforeimpairments 2 006 500 100.0% 1 932 006 100.0% 3.9%

11
Investec integrated annual review and summary financial statements 2013 31
Investec in persp
ective
Financial review (continued)
Net interest incomeNet interest income increased by 0.5% to £702.5 million (2012: £699.0 million) due to growth in the lending and fixed income portfolios. This was offset by less interest earned on the legacy portfolios which are running down, higher subordinated debt costs and a lower return on the group’s liquid asset and cash portfolio.
£’00031 March
201331March
2012 Variance %change
Asset Management 4 501 5 163 (662) (12.8%)Wealth & Investment 9 049 10 083 (1 034) (10.3%)Specialist Banking 688 976 683 801 5 175 0.8%Netinterestincome 702 526 699 047 3 479 0.5%
A further analysis of interest received and interest paid is provided in the tables below.
UKandOther SouthernAfrica Australia Total group
Fortheyearended31March2013£’000 Notes
Balancesheetvalue
Interestreceived
Balancesheetvalue
Interestreceived
Balancesheetvalue
Interestreceived
Balance sheet value
Interest received
Cash, near cash and bank debt and sovereign debt securities 1 5 318 479 47 639 7 622 170 315 841 707 398 16 076 13 648 047 379 556 Core loans and advances 2 6 045 063 357 343 10 164 864 853 372 2 205 046 180 301 18 414 973 1 391 016
Private client 3 024 629 162 618 6 900 949 557 108 1 402 295 112 566 11 327 873 832 292 Corporate, institutional and other clients 3 020 434 194 725 3 263 915 296 264 802 751 67 735 7 087 100 558 724
Other debt securities and other loans and advances 1 958 072 144 138 594 817 18 425 22 506 18 205 2 575 395 180 768 Other interest earning assets 3 2 769 126 160 682 113 466 19 743 – – 2 882 592 180 425 Totalinterestearningassets 16 090 740 709 802 18 495 317 1 207 381 2 934 950 214 582 37 521 007 2 131 765
Notes:1. Comprises (as per the balance sheet) cash and balances at central banks; loans and advances to banks; non-sovereign and non-bank cash
placements; reverse repurchase agreements and cash collateral on securities borrowed; sovereign debt securities; bank debt securities.2. Comprises (as per the balance sheet) loans and advances to customers; own originated loans and advances to customers securitised.3. Comprises (as per the balance sheet) other securitised assets.
a Net interest income 35.0%
b Net fee and commission income 48.5%
c Investment income 9.1%
d Trading income arising from customer flow 3.5%
e Trading income arising from balance sheet management and other trading activities 1.8%
f Other operating income 2.1%
31 March 2013£2 006.5 million total operating income before impairment losses on loans and advances
c
b
d e f
a Net interest income 36.2%
b Net fee and commission income 45.8%
c Investment income 9.0%
d Trading income arising from customer flow 4.0%
e Trading income arising from balance sheet management and other trading activities 1.7%
f Other operating income 3.3%
31 March 2012£1 932.0 million total operating income before impairment losses on loans and advances
c
b
d e f
a
36.2%
a
35.0%
% of total operating income before impairment losses on loans and advances
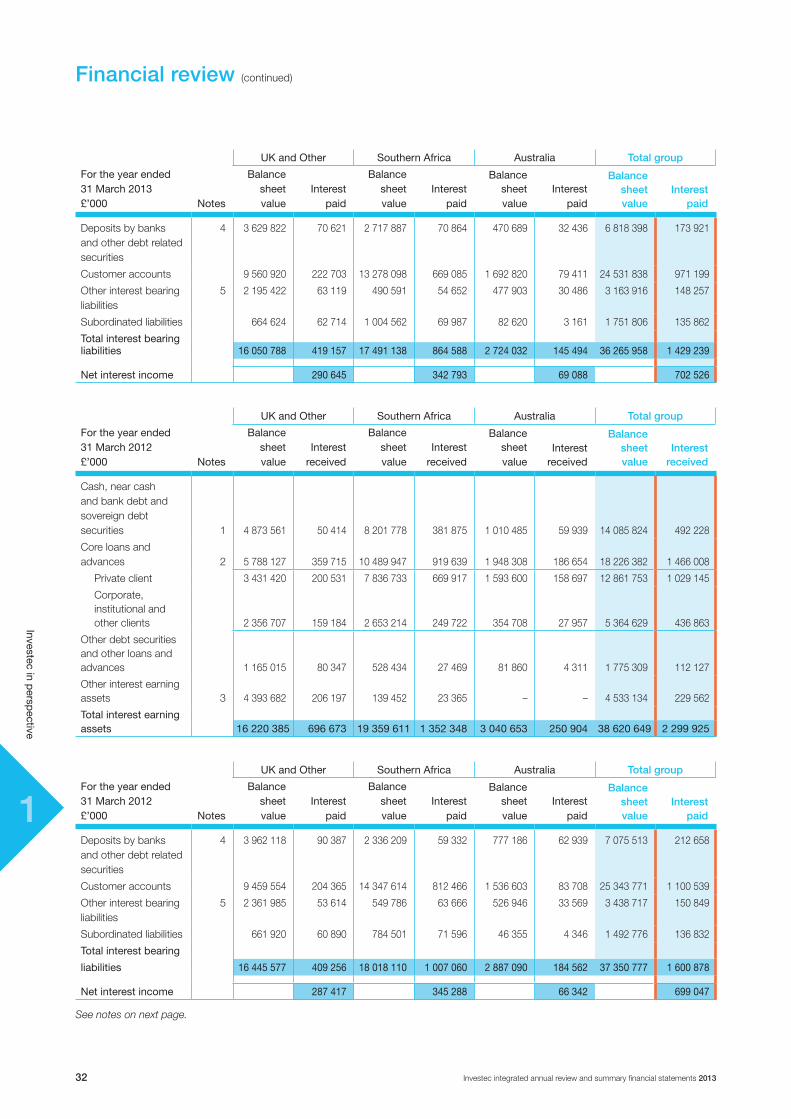
11
Investec integrated annual review and summary financial statements 201332
Investec in persp
ective
Financial review (continued)
UKandOther SouthernAfrica Australia Total group
Fortheyearended31March2013£’000 Notes
Balancesheetvalue
Interestpaid
Balancesheetvalue
Interestpaid
Balancesheetvalue
Interestpaid
Balance sheet value
Interest paid
Deposits by banks and other debt related securities
4 3 629 822 70 621 2 717 887 70 864 470 689 32 436 6 818 398 173 921
Customer accounts 9 560 920 222 703 13 278 098 669 085 1 692 820 79 411 24 531 838 971 199
Other interest bearing liabilities
5 2 195 422 63 119 490 591 54 652 477 903 30 486 3 163 916 148 257
Subordinated liabilities 664 624 62 714 1 004 562 69 987 82 620 3 161 1 751 806 135 862
Totalinterestbearingliabilities 16 050 788 419 157 17 491 138 864 588 2 724 032 145 494 36 265 958 1 429 239
Netinterestincome 290 645 342 793 69 088 702 526
UKandOther SouthernAfrica Australia Total group
Fortheyearended31March2012£’000 Notes
Balancesheetvalue
Interestreceived
Balancesheetvalue
Interestreceived
Balancesheetvalue
Interestreceived
Balance sheet value
Interest received
Cash, near cash and bank debt and sovereign debt securities 1 4 873 561 50 414 8 201 778 381 875 1 010 485 59 939 14 085 824 492 228
Core loans and advances 2 5 788 127 359 715 10 489 947 919 639 1 948 308 186 654 18 226 382 1 466 008
Private client 3 431 420 200 531 7 836 733 669 917 1 593 600 158 697 12 861 753 1 029 145
Corporate, institutional and other clients 2 356 707 159 184 2 653 214 249 722 354 708 27 957 5 364 629 436 863
Other debt securities and other loans and advances 1 165 015 80 347 528 434 27 469 81 860 4 311 1 775 309 112 127
Other interest earning assets 3 4 393 682 206 197 139 452 23 365 – – 4 533 134 229 562
Totalinterestearningassets 16220385 696673 19359611 1352348 3040653 250904 38620649 2299925
UKandOther SouthernAfrica Australia Total group
Fortheyearended31March2012£’000 Notes
Balancesheetvalue
Interestpaid
Balancesheetvalue
Interestpaid
Balancesheetvalue
Interestpaid
Balance sheet value
Interest paid
Deposits by banks and other debt related securities
4 3 962 118 90 387 2 336 209 59 332 777 186 62 939 7 075 513 212 658
Customer accounts 9 459 554 204 365 14 347 614 812 466 1 536 603 83 708 25 343 771 1 100 539
Other interest bearing liabilities
5 2 361 985 53 614 549 786 63 666 526 946 33 569 3 438 717 150 849
Subordinated liabilities 661 920 60 890 784 501 71 596 46 355 4 346 1 492 776 136 832
Totalinterestbearing
liabilities 16445577 409256 18018110 1007060 2887090 184562 37350777 1600878
Netinterestincome 287417 345288 66342 699047
See notes on next page.

11
Investec integrated annual review and summary financial statements 2013 33
Investec in persp
ective
Notes:1. Comprises (as per the balance sheet) cash and balances at central banks; loans and advances to banks; non-sovereign and non-bank cash
placements; reverse repurchase agreements and cash collateral on securities borrowed; sovereign debt securities; bank debt securities.2. Comprises (as per the balance sheet) loans and advances to customers; own originated loans and advances to customers securitised.3. Comprises (as per the balance sheet) other securitised assets.4. Comprises (as per the balance sheet) deposits by banks; debt securities in issue; reverse repurchase agreements and cash collateral on
securities lent.5. Comprises (as per the balance sheet) liabilities arising on securitisation of own originated assets; liabilities arising on securitisation.
Net fee and commission incomeNet fee and commission income increased by 10.0% to £972.7 million (2012: £884.2 million). The group benefited from higher average funds under management, solid net inflows and the acquisitions of Evolution Group plc and the NCB Group. The Specialist Banking business recorded an increase in net fees and commissions largely due to a good performance by the Corporate Advisory, Aviation Finance and Transactional Banking divisions. The Corporate and Institutional Banking and Prime Broking businesses recorded lower levels of activity.
£’00031 March
201331March
2012 Variance %change
Asset Management 393 116 367 856 25 260 6.9%
Wealth & Investment 237 560 186 181 51 379 27.6%
Specialist Banking 341 999 330 197 11 802 3.6%
Netfeeandcommissionincome 972 675 884 234 88 441 10.0%
Further information on net fees by type of fee and geography is provided in the tables below.
Fortheyearended31March2013£’000
UKandOther
SouthernAfrica Australia
Total group
Fund management fees/fees for assets under management 458 321 201 181 3 972 663 474
Private client transactional fees 83 926 62 610 9 579 156 115
Corporate and institutional transactional and advisory services 159 373 92 709 45 880 297 962
Fee and commission income 701 620 356 500 59 431 1 117 551
Fee and commission expense (127 170) (13 180) (4 526) (144 876)
Netfeeandcommissionincome 574 450 343 320 54 905 972 675
Annuity fees (net of fees payable) 392 722 254 456 26 137 673 315
Deal fees 181 728 88 864 28 768 299 360
Fortheyearended31March2012£’000
UKandOther
SouthernAfrica Australia
Total group
Fund management fees/fees for assets under management 404 327 188 953 5 674 598 954
Private client transactional fees 62 486 65 295 9 251 137 032
Corporate and institutional transactional and advisory services 138 312 115 550 23 531 277 393
Fee and commission income 605 125 369 798 38 456 1 013 379
Fee and commission expense (114 808) (10 962) (3 375) (129 145)
Netfeeandcommissionincome 490317 358836 35081 884234
Annuity fees (net of fees payable) 339 849 255 826 14 115 609 790
Deal fees 150 468 103 010 20 966 274 444
Financial review (continued)
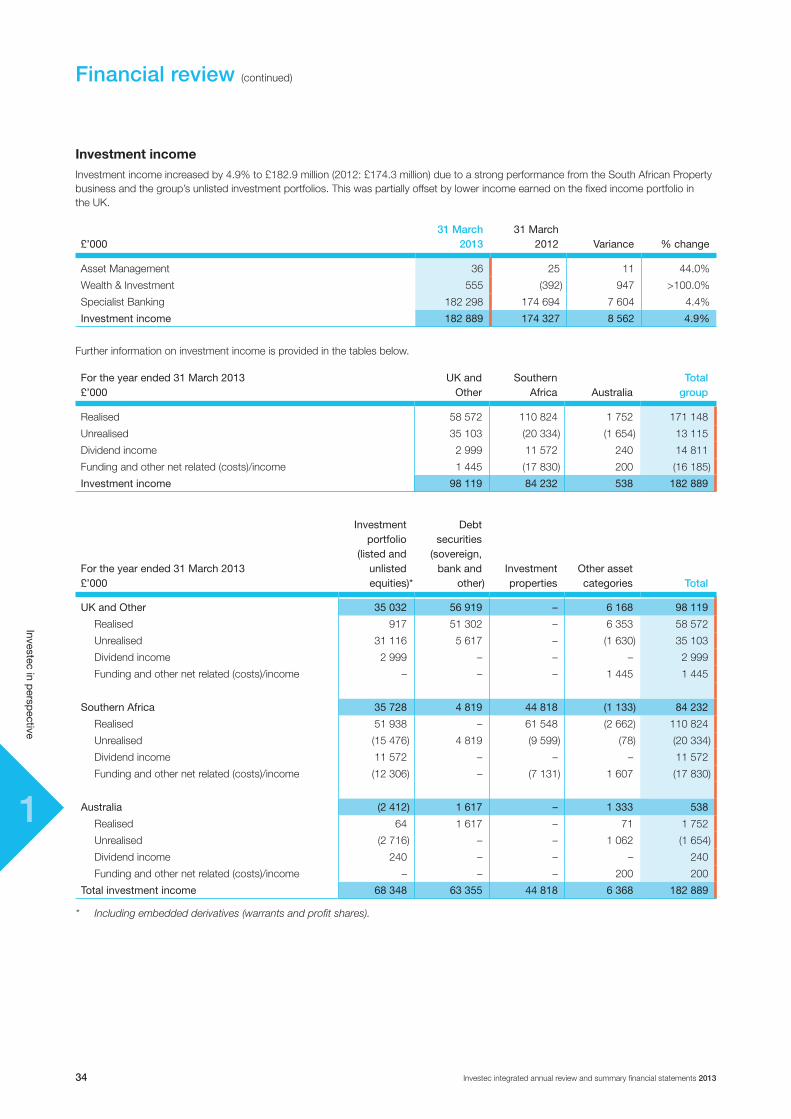
11
Investec integrated annual review and summary financial statements 201334
Investec in persp
ective
Financial review (continued)
Investment incomeInvestment income increased by 4.9% to £182.9 million (2012: £174.3 million) due to a strong performance from the South African Property business and the group’s unlisted investment portfolios. This was partially offset by lower income earned on the fixed income portfolio in the UK.
£’00031 March
201331March
2012 Variance %change
Asset Management 36 25 11 44.0%
Wealth & Investment 555 (392) 947 >100.0%
Specialist Banking 182 298 174 694 7 604 4.4%
Investmentincome 182 889 174 327 8 562 4.9%
Further information on investment income is provided in the tables below.
Fortheyearended31March2013£’000
UKandOther
SouthernAfrica Australia
Total group
Realised 58 572 110 824 1 752 171 148
Unrealised 35 103 (20 334) (1 654) 13 115
Dividend income 2 999 11 572 240 14 811
Funding and other net related (costs)/income 1 445 (17 830) 200 (16 185)
Investmentincome 98 119 84 232 538 182 889
Fortheyearended31March2013£’000
Investmentportfolio
(listedandunlistedequities)*
Debtsecurities
(sovereign,bankand
other)Investmentproperties
Otherassetcategories Total
UKandOther 35 032 56 919 – 6 168 98 119
Realised 917 51 302 – 6 353 58 572
Unrealised 31 116 5 617 – (1 630) 35 103
Dividend income 2 999 – – – 2 999
Funding and other net related (costs)/income – – – 1 445 1 445
SouthernAfrica 35 728 4 819 44 818 (1 133) 84 232
Realised 51 938 – 61 548 (2 662) 110 824
Unrealised (15 476) 4 819 (9 599) (78) (20 334)
Dividend income 11 572 – – – 11 572
Funding and other net related (costs)/income (12 306) – (7 131) 1 607 (17 830)
Australia (2 412) 1 617 – 1 333 538
Realised 64 1 617 – 71 1 752
Unrealised (2 716) – – 1 062 (1 654)
Dividend income 240 – – – 240
Funding and other net related (costs)/income – – – 200 200
Totalinvestmentincome 68348 63355 44818 6368 182889
* Including embedded derivatives (warrants and profit shares).
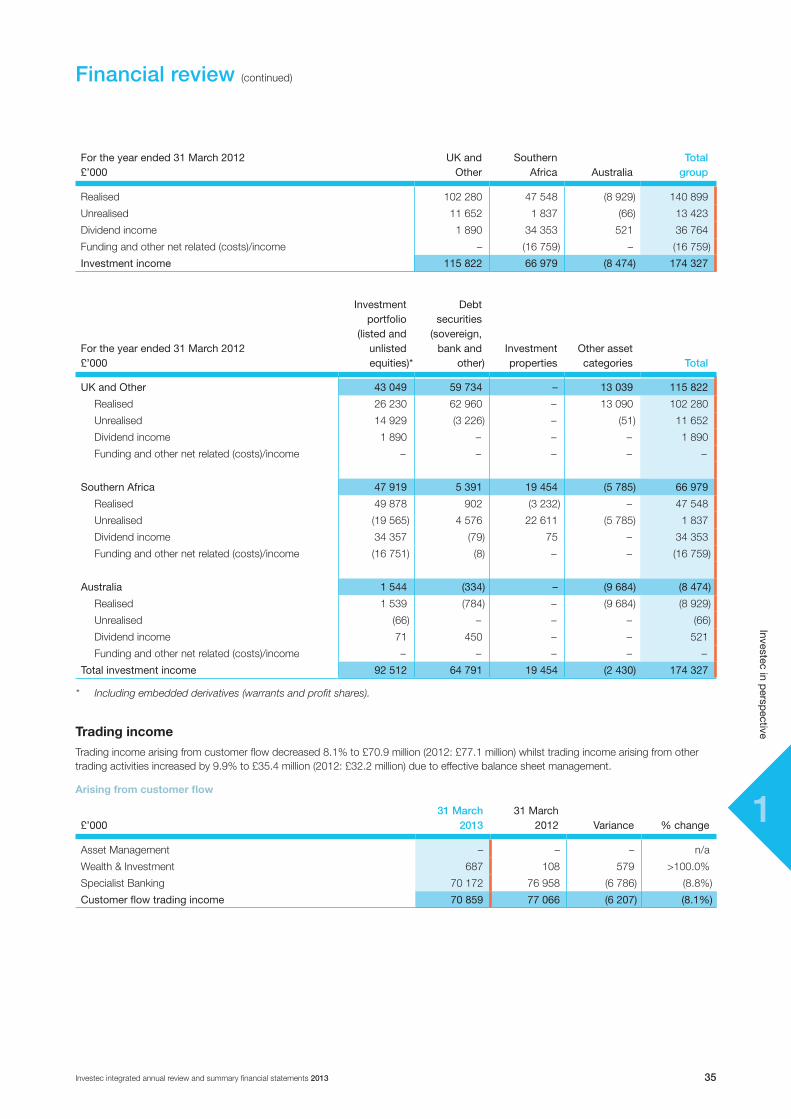
11
Investec integrated annual review and summary financial statements 2013 35
Investec in persp
ective
Fortheyearended31March2012£’000
UKandOther
SouthernAfrica Australia
Total group
Realised 102 280 47 548 (8 929) 140 899
Unrealised 11 652 1 837 (66) 13 423
Dividend income 1 890 34 353 521 36 764
Funding and other net related (costs)/income – (16 759) – (16 759)
Investmentincome 115822 66979 (8474) 174327
Fortheyearended31March2012£’000
Investmentportfolio
(listedandunlistedequities)*
Debtsecurities
(sovereign,bankand
other)Investmentproperties
Otherassetcategories Total
UKandOther 43049 59734 – 13039 115822
Realised 26 230 62 960 – 13 090 102 280
Unrealised 14 929 (3 226) – (51) 11 652
Dividend income 1 890 – – – 1 890
Funding and other net related (costs)/income – – – – –
SouthernAfrica 47919 5391 19454 (5785) 66979
Realised 49 878 902 (3 232) – 47 548
Unrealised (19 565) 4 576 22 611 (5 785) 1 837
Dividend income 34 357 (79) 75 – 34 353
Funding and other net related (costs)/income (16 751) (8) – – (16 759)
Australia 1544 (334) – (9684) (8474)
Realised 1 539 (784) – (9 684) (8 929)
Unrealised (66) – – – (66)
Dividend income 71 450 – – 521
Funding and other net related (costs)/income – – – – –
Totalinvestmentincome 92512 64791 19454 (2430) 174327
* Including embedded derivatives (warrants and profit shares).
Trading incomeTrading income arising from customer flow decreased 8.1% to £70.9 million (2012: £77.1 million) whilst trading income arising from other trading activities increased by 9.9% to £35.4 million (2012: £32.2 million) due to effective balance sheet management.
Arising from customer flow
£’00031 March
201331March
2012 Variance %change
Asset Management – – – n/a
Wealth & Investment 687 108 579 >100.0%
Specialist Banking 70 172 76 958 (6 786) (8.8%)
Customerflowtradingincome 70 859 77 066 (6 207) (8.1%)
Financial review (continued)

11
Investec integrated annual review and summary financial statements 201336
Investec in persp
ective
Financial review (continued)
Arising from balance sheet management and other trading activities
£’00031 March
201331March
2012 Variance %change
Asset Management (45) 380 (425) n/a
Wealth & Investment 360 97 263 >100.0%
Specialist Banking 35 083 31 727 3 356 10.6%
Incomearisingfrombalancesheetmanagementandother
tradingactivities 35 398 32 204 3 194 9.9%
Other operating incomeOther operating income includes associate income, assurance income and income earned on an operating lease portfolio acquired.
Impairment losses on loans and advancesImpairments on loans and advances decreased from £325.1 million to £251.0 million. The UK reported a moderate decrease whilst impairments in Australia were £50 million lower than the prior year. The South African business reported a marginal increase in impairments in Rands.
Since 31 March 2012 the level of defaults has improved with the percentage of default loans (net of impairments but before taking collateral into account) to core loans and advances amounting to 2.73% (2012: 3.31%). The ratio of collateral to default loans (net of impairments) remains satisfactory at 1.26 times (2012: 1.39 times). The credit loss charge as a percentage of average gross core loans and advances has improved from 1.12% at 31 March 2012 to 0.84%.
£’00031 March
201331March
2012 Variance %change
UK and Other (171 187) (187 920) 16 733 (8.9%)
Southern Africa (61 976) (69 326) 7 350 (10.6%)
Australia (17 849) (67 872) 50 023 (73.7%)
Totalimpairmentlossesonloansandadvances (251 012) (325 118) 74 106 (22.8%)
Impairmentlossesonloansandadvancesinhomecurrency
Southern Africa (R’mn) (833) (824) 9 (1.1%)
Australia (A$’mn) (27.3) (106.1) (78.8) (74.3%)
Operating costs and depreciationThe ratio of total operating costs to total operating income amounted to 65.5% (2012: 64.7%).
Total operating expenses grew by 5.9% to £1 302.9 million (2012: £1 230.6 million) as a result of the acquisitions of the Evolution Group plc, the NCB Group and Alliance Equipment Finance.

11
Investec integrated annual review and summary financial statements 2013 37
Investec in persp
ective
£’00031 March
2013% of total expenses
31March2012
%oftotalexpenses %change
Staff costs (877 237) 66.5% (831 076) 66.0% 5.6%
– fixed (602 780) 45.7% (575 962) 45.7% 4.7%
– variable (274 457) 20.8% (255 114) 20.3% 7.6%
Business expenses (201 017) 15.2% (190 512) 15.1% 5.5%
Premises expenses (excluding depreciation) (73 643) 5.6% (73 243) 5.8% 0.5%
Equipment expenses (excluding depreciation) (65 092) 5.0% (52 833) 4.2% 23.2%
Marketing expenses (55 641) 4.2% (54 210) 4.3% 2.6%
Depreciation and impairment of property, plant, equipment and software (30 299) 2.3% (28 754) 2.3% 5.4%
Total operating expenses (1 302 929) 98.8% (1 230 628) 97.7% 5.9%
Depreciation on operating leased assets (16 072) 1.2% (28 670) 2.3% (43.9%)
Totalexpenses (1 319 001) 100.0% (1 259 298) 100.0% 4.7%
The following table sets out certain information on total expenses by geography for the year under review.
£’00031 March
2013% of total expenses
31March2012
%oftotalexpenses %change
UK and Other (753 102) 57.0% (700 320) 55.6% 7.5%
Southern Africa (454 427) 34.5% (459 213) 36.5% (1.0%)
Australia (111 472) 8.5% (99 765) 7.9% 11.7%
Totalexpenses (1 319 001) 100.0% (1 259 298) 100.0% 4.7%
The following table sets out certain information on total expenses by division for the year under review.
£’00031 March
2013% of total expenses
31March2012
%oftotalexpenses %change
Asset Management (266 784) 20.2% (241 529) 19.2% 10.5%
Wealth & Investment (198 321) 15.1% (157 799) 12.5% 25.7%
Specialist Banking (853 896) 64.7% (859 970) 68.3% (0.7%)
Totalexpenses (1 319 001) 100.0% (1 259 298) 100.0% 4.7%
Financial review (continued)
a Staff costs 66.5%
b Business expenses 15.2%
c Premises expenses 5.6%
d Equipment expenses 5.0%
e Marketing expenses 4.2%
f Depreciation 2.3%
g Depreciation on operating leased assets 1.2%
31 March 2013£1 319 million total expenses
c
b
a
66.5%
de f g
a Staff costs 66.0%
b Business expenses 15.1%
c Premises expenses 5.8%
d Equipment expenses 4.2%
e Marketing expenses 4.3%
f Depreciation 2.3%
g Depreciation on operating leased assets 2.3%
31 March 2012£1 259 million total expenses
c
b
a
66.0%
de f g
% of total expenses

11
Investec integrated annual review and summary financial statements 201338
Investec in persp
ective
Financial review (continued)
Key income drivers in our core businesses The information below reflects our key income drivers in our core businesses.
Asset Management
Globalbusiness(inPounds)31 March
201331March
201231March
201131March
201031March
200931March
2008
Operating margin 34.5% 35.7% 37.0% 33.4% 33.5% 35.1%
Net inflows in funds under management as a % of opening funds under management 6.7% 8.8% 16.0% 16.2% 2.6% 2.1%
Average income yield earned on funds under management^ 0.62% 0.62% 0.66% 0.67% 0.70% 0.74%
Wealth & Investment
31 March2013
31March2012
31March2011
31March2010
31March2009
31March2008
Globalbusiness(inPounds)
Operating margin 20.3% 19.7% 25.9% n/a* n/a* n/a*
Net organic growth in funds under management as a % of opening funds under management 2.0% (5.3%) 6.2% n/a* n/a* n/a*
Average income yield earned on funds under management^ 0.66% 0.61% 0.55% n/a* n/a* n/a*
UKandOther^^(inPounds)
Operating margin 17.3% 16.3% 24.5% n/a* n/a* n/a*
Net organic growth in funds under management as a % of opening funds under management 1.3% (7.4%) 3.5% n/a* n/a* n/a*
Average income yield earned on funds under management^ 0.86% 0.80% 0.68% n/a* n/a* n/a*
SouthAfrica(inRands)
Operating margin 31.3% 28.5% 28.9% 35.5% 35.3% 40.2%
Net organic growth in discretionary funds under management as a % of opening discretionary funds under management 13.9% 8.7% 6.0% 3.4% (4.2%) 10.1%
Average income yield earned on funds under management^** 0.37% 0.39% 0.41% 0.41% 0.41% 0.41%
* Prior to 25 June 2010, Rensburg Sheppards plc was an associate of Investec and not a 100% owned subsidiary.** A large portion of the funds under management are discretionary funds.^ The average income yield on funds under management represents the total operating income for the period as a percentage of the
average of opening and closing funds under management. This calculation does not take into account the impact of market movements throughout the period on funds under management or the timing of acquisitions and disposals during the respective periods.
^^ Other comprises European Wealth Management, which prior to 1 July 2010 was part of the Private Bank, and NCB, which was acquired on 12 June 2012.

11
Investec integrated annual review and summary financial statements 2013 39
Investec in persp
ective
Financial review (continued)
Specialist Banking
31 March2013
31March2012
31March2011
31March2010
31March2009
31March2008
Globalbusiness(inPounds)
Cost to income ratio 62.8% 62.4% 60.1% 56.4% 54.5% 54.9%
ROE post-tax^ 6.6% 5.1% 8.2% 11.4% 13.4% 22.2%
Growth in net core loans 1.0% (2.8%) 4.8% 10.3% 26.2% 27.3%
Growth in risk-weighted assets 6.0% 0.6% 14.1% 16.4% 15.9% n/a
Credit loss ratio on core loans 0.84% 1.12% 1.27% 1.16% 1.08% 0.51%
UKandOther(inPounds)
Cost to income ratio 65.0% 63.7% 63.2% 61.3% 60.0% 64.0%
ROE post-tax^ 2.7% 2.5% 3.3% 8.2% 7.1% 13.3%
Growth in net core loans 3.4% 3.8% 2.6% (8.8%) 10.3% 36.3%
Growth in risk-weighted assets 8.1% 4.6% 9.6% 5.3% 3.8% n/a
Credit loss ratio on core loans 1.26% 1.22% 2.50% 1.85% 1.55% 0.46%
SouthernAfrica(inRands)
Cost to income ratio 55.5% 55.2% 54.7% 49.8% 48.5% 47.6%
ROE post-tax^ 10.0% 9.6% 10.7% 13.8% 18.2% 24.8%
Growth in net core loans 10.2% 6.6% 0.3% 1.9% 14.1% 33.5%
Growth in risk-weighted assets 16.5% 11.9% 13.8% 3.6% 11.1% n/a
Credit loss ratio on core loans 0.61% 0.65% 0.71% 0.68% 0.69% 0.48%
Australia(inAustralianDollars)
Cost to income ratio 83.4% 96.9% 69.7% 61.9% 63.1% 59.4%
ROE post-tax^ 1.1% (10.8%) 1.6% 3.6% 0.6% 12.0%
Growth in net core loans 7.1% (9.3%) 9.4% 3.4% 13.4% 60.9%
Growth in risk-weighted assets 14.7% (11.9%) 16.9% (4.3%) 2.9% n/a
Credit loss ratio on core loans 0.85% 3.13% 1.53% 1.70% 2.23% 0.98%
^ Divisional ROEs are reported on a pre-tax basis. For the purpose of this calculation we have applied the group's effective tax rate to derive post-tax numbers.
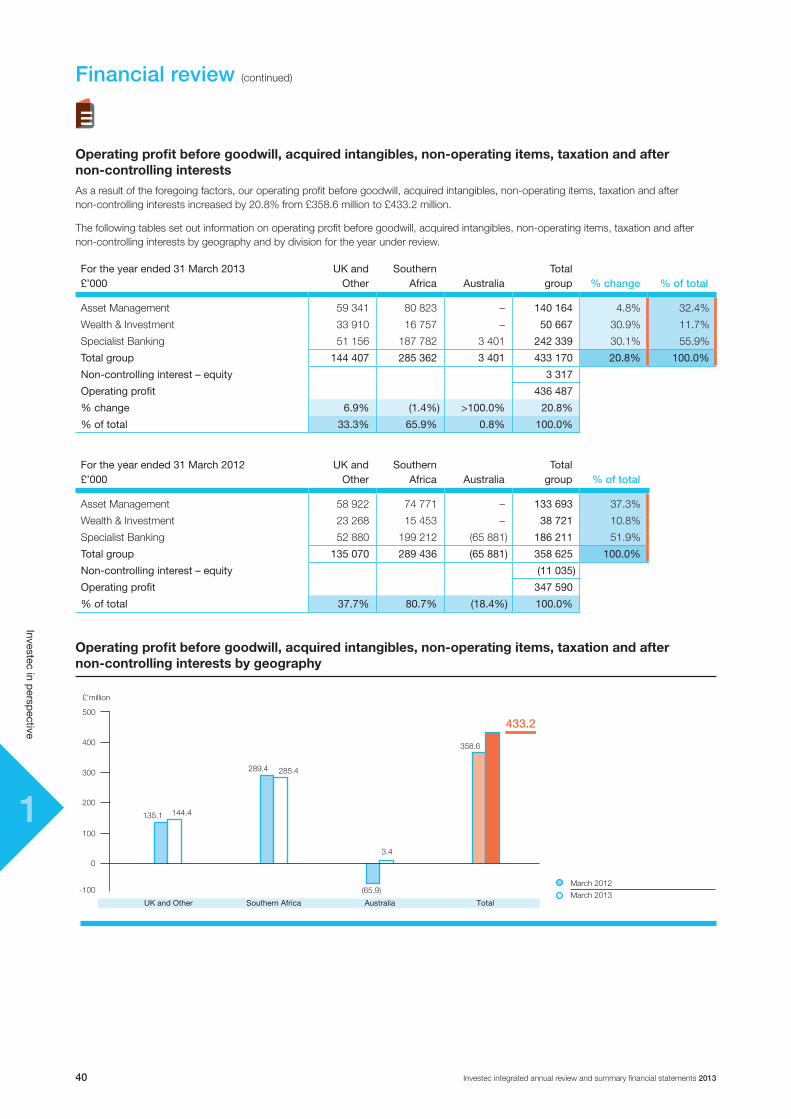
11
Investec integrated annual review and summary financial statements 201340
Investec in persp
ective
Financial review (continued)
Operating profit before goodwill, acquired intangibles, non-operating items, taxation and after non-controlling interestsAs a result of the foregoing factors, our operating profit before goodwill, acquired intangibles, non-operating items, taxation and after non-controlling interests increased by 20.8% from £358.6 million to £433.2 million.
The following tables set out information on operating profit before goodwill, acquired intangibles, non-operating items, taxation and after non-controlling interests by geography and by division for the year under review.
Fortheyearended31March2013£’000
UKandOther
SouthernAfrica Australia
Totalgroup % change % of total
Asset Management 59 341 80 823 – 140164 4.8% 32.4%
Wealth & Investment 33 910 16 757 – 50667 30.9% 11.7%
Specialist Banking 51 156 187 782 3 401 242339 30.1% 55.9%
Totalgroup 144407 285362 3401 433170 20.8% 100.0%
Non-controllinginterest–equity 3317
Operatingprofit 436487
%change 6.9% (1.4%) >100.0% 20.8%
%oftotal 33.3% 65.9% 0.8% 100.0%
Fortheyearended31March2012£’000
UKandOther
SouthernAfrica Australia
Totalgroup % of total
Asset Management 58 922 74 771 – 133693 37.3%
Wealth & Investment 23 268 15 453 – 38721 10.8%
Specialist Banking 52 880 199 212 (65 881) 186211 51.9%
Totalgroup 135070 289436 (65881) 358625 100.0%
Non-controllinginterest–equity (11035)
Operatingprofit 347590
%oftotal 37.7% 80.7% (18.4%) 100.0%
135.1
March 2012
March 2013 -100
100
0
200
300
400
500
£’million
433.2
Southern AfricaUK and Other TotalAustralia
144.4
289.4 285.4
(65.9)
3.4
358.6
Operating profit before goodwill, acquired intangibles, non-operating items, taxation and after non-controlling interests by geography
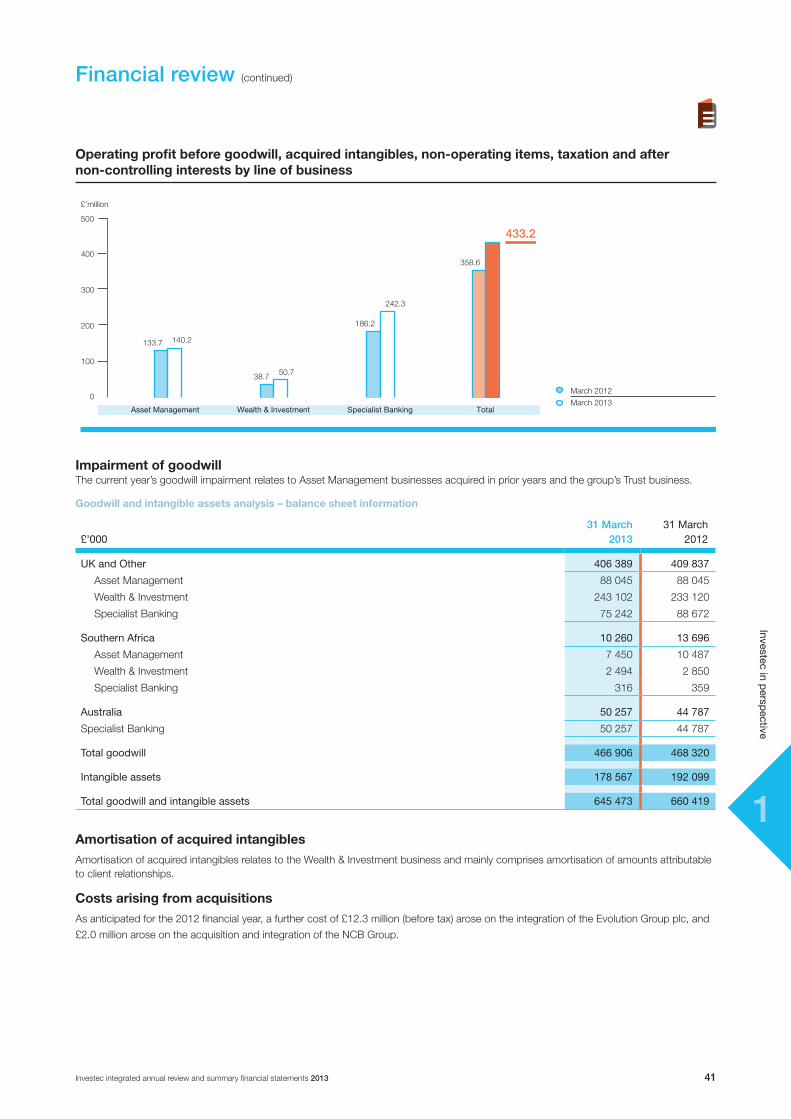
11
Investec integrated annual review and summary financial statements 2013 41
Investec in persp
ective
Impairment of goodwillThe current year’s goodwill impairment relates to Asset Management businesses acquired in prior years and the group’s Trust business.
Goodwill and intangible assets analysis – balance sheet information
£’00031 March
201331March
2012
UKandOther 406 389 409 837
Asset Management 88 045 88 045
Wealth & Investment 243 102 233 120
Specialist Banking 75 242 88 672
SouthernAfrica 10 260 13 696
Asset Management 7 450 10 487
Wealth & Investment 2 494 2 850
Specialist Banking 316 359
Australia 50 257 44 787
Specialist Banking 50 257 44 787
Totalgoodwill 466 906 468 320
Intangibleassets 178 567 192 099
Totalgoodwillandintangibleassets 645 473 660 419
Amortisation of acquired intangiblesAmortisation of acquired intangibles relates to the Wealth & Investment business and mainly comprises amortisation of amounts attributable to client relationships.
Costs arising from acquisitions As anticipated for the 2012 financial year, a further cost of £12.3 million (before tax) arose on the integration of the Evolution Group plc, and
£2.0 million arose on the acquisition and integration of the NCB Group.
133.7
March 2012
March 2013 0
100
200
300
400
500
£’million
433.2
Wealth & InvestmentAsset Management TotalSpecialist Banking
140.2
38.7 50.7
358.6
186.2
242.3
Operating profit before goodwill, acquired intangibles, non-operating items, taxation and after non-controlling interests by line of business
Financial review (continued)
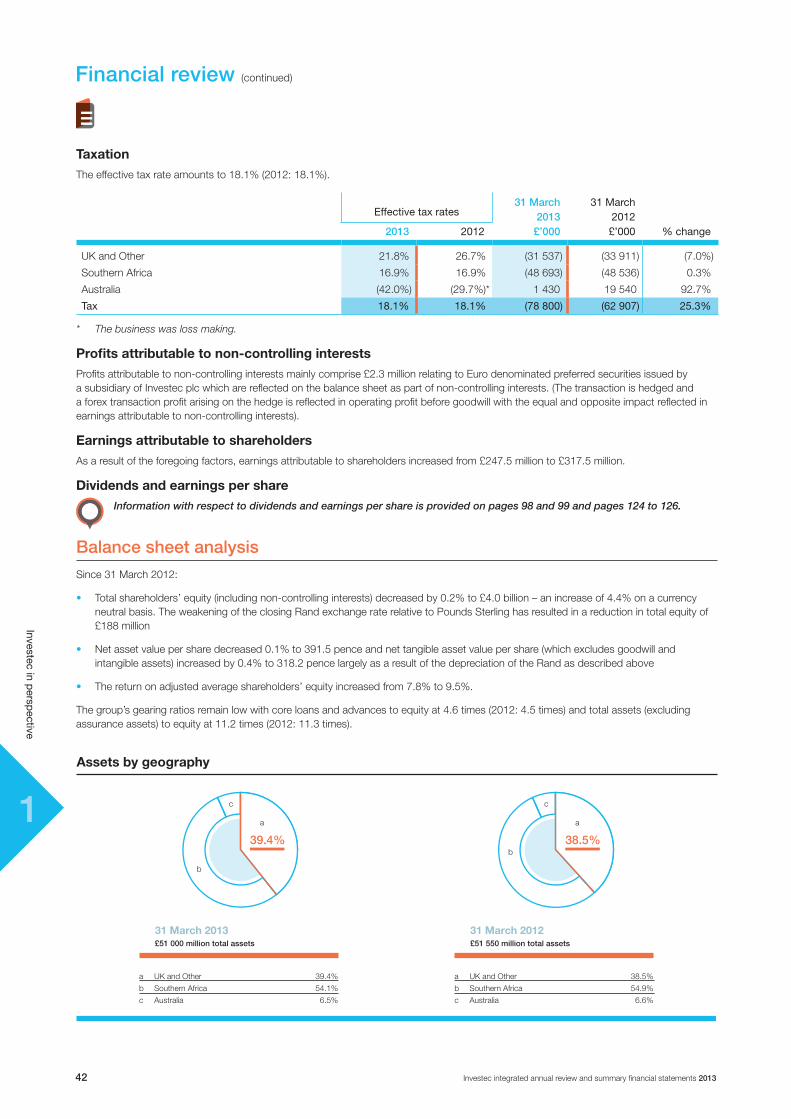
11
Investec integrated annual review and summary financial statements 201342
Investec in persp
ective
Financial review (continued)
TaxationThe effective tax rate amounts to 18.1% (2012: 18.1%).
Effectivetaxrates31 March
2013£’000
31March2012£’000 %change2013 2012
UK and Other 21.8% 26.7% (31 537) (33 911) (7.0%)
Southern Africa 16.9% 16.9% (48 693) (48 536) 0.3%
Australia (42.0%) (29.7%)* 1 430 19 540 92.7%
Tax 18.1% 18.1% (78800) (62907) 25.3%
* The business was loss making.
Profits attributable to non-controlling interestsProfits attributable to non-controlling interests mainly comprise £2.3 million relating to Euro denominated preferred securities issued by a subsidiary of Investec plc which are reflected on the balance sheet as part of non-controlling interests. (The transaction is hedged and a forex transaction profit arising on the hedge is reflected in operating profit before goodwill with the equal and opposite impact reflected in earnings attributable to non-controlling interests).
Earnings attributable to shareholdersAs a result of the foregoing factors, earnings attributable to shareholders increased from £247.5 million to £317.5 million.
Dividends and earnings per share
Information with respect to dividends and earnings per share is provided on pages 98 and 99 and pages 124 to 126.
Balance sheet analysisSince 31 March 2012:
• Total shareholders’ equity (including non-controlling interests) decreased by 0.2% to £4.0 billion – an increase of 4.4% on a currency neutral basis. The weakening of the closing Rand exchange rate relative to Pounds Sterling has resulted in a reduction in total equity of £188 million
• Net asset value per share decreased 0.1% to 391.5 pence and net tangible asset value per share (which excludes goodwill and intangible assets) increased by 0.4% to 318.2 pence largely as a result of the depreciation of the Rand as described above
• The return on adjusted average shareholders’ equity increased from 7.8% to 9.5%.
The group’s gearing ratios remain low with core loans and advances to equity at 4.6 times (2012: 4.5 times) and total assets (excluding assurance assets) to equity at 11.2 times (2012: 11.3 times).
31 March 2013
a UK and Other 39.4%
b Southern Africa 54.1%
c Australia 6.5%
c
b
£51 000 million total assets
a
39.4%
31 March 2012
a UK and Other 38.5%
b Southern Africa 54.9%
c Australia 6.6%
c
b
£51 550 million total assets
a
38.5%
Assets by geography
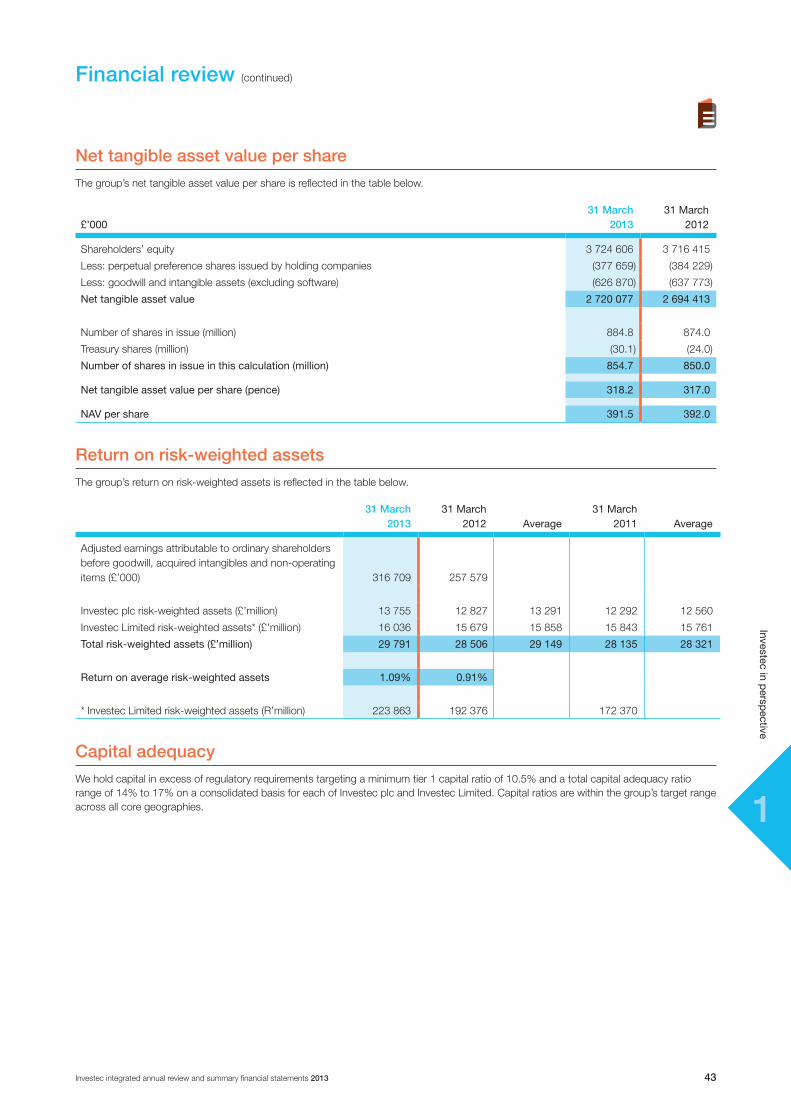
11
Investec integrated annual review and summary financial statements 2013 43
Investec in persp
ective
Financial review (continued)
Net tangible asset value per share The group’s net tangible asset value per share is reflected in the table below.
£’00031 March
201331March
2012
Shareholders’ equity 3 724 606 3 716 415
Less: perpetual preference shares issued by holding companies (377 659) (384 229)
Less: goodwill and intangible assets (excluding software) (626 870) (637 773)
Nettangibleassetvalue 2 720077 2 694 413
Number of shares in issue (million) 884.8 874.0
Treasury shares (million) (30.1) (24.0)
Numberofsharesinissueinthiscalculation(million) 854.7 850.0
Nettangibleassetvaluepershare(pence) 318.2 317.0
NAVpershare 391.5 392.0
Return on risk-weighted assets The group’s return on risk-weighted assets is reflected in the table below.
31 March2013
31March2012 Average
31March2011 Average
Adjusted earnings attributable to ordinary shareholders before goodwill, acquired intangibles and non-operating items (£’000) 316 709 257 579
Investec plc risk-weighted assets (£’million) 13 755 12 827 13 291 12 292 12 560
Investec Limited risk-weighted assets* (£’million) 16 036 15 679 15 858 15 843 15 761
Totalrisk-weightedassets(£’million) 29 791 28 506 29 149 28 135 28 321
Returnonaveragerisk-weightedassets 1.09% 0.91%
* Investec Limited risk-weighted assets (R’million) 223 863 192 376 172 370
Capital adequacyWe hold capital in excess of regulatory requirements targeting a minimum tier 1 capital ratio of 10.5% and a total capital adequacy ratio range of 14% to 17% on a consolidated basis for each of Investec plc and Investec Limited. Capital ratios are within the group’s target range across all core geographies.

11
Investec integrated annual review and summary financial statements 201344
Investec in persp
ective
Financial review (continued)
ROE by country and business
Return on capital by segment Methodology based on segmental information after reallocation of:
• a notional return on capital (net of the cost of subordinated debt) which is managed and borne in the centre from ‘Other Activities in the Specialist Bank’ to the business segments based on their total capital utilisation.
£’00031 March
201331March
2012 Average31March
2011 Average
Calculationofaverageshareholders’equity
Ordinary shareholders’ equity 3 346 947 3 332 186 3 339 566 3 253 213 3 292 700
Goodwill and intangible assets (excluding software) (626 870) (637 773) (632 322) (564 726) (601 250)
Adjustedtangibleshareholders’equity 2 720 077 2 694 413 2 707 244 2 688 487 2 691 450
£’00031 March
201331March
2012
Operating profit before goodwill, acquired intangibles, non-operating items and taxation 436 487 347 590
Non-controlling interests (3 317) 11 035
Accrued preference dividends, adjusted for currency hedge (37 661) (38 139)
Operatingprofit 395 509 320 486
Tax on ordinary activities (78 800) (62 907)
Adjustedearningsattributabletoordinaryshareholdersbeforegoodwill,acquiredintangiblesandnon-operatingitems 316 709 257 579
Pre-tax return on average ordinary shareholders’ equity 11.8% 9.7%
Post-tax return on average ordinary shareholders’ equity 9.5% 7.8%
Pre-tax return on average tangible ordinary shareholders’ equity 14.6% 11.9%
Post-tax return on average tangible ordinary shareholders’ equity 11.7% 9.6%

11
Investec integrated annual review and summary financial statements 2013 45
Investec in persp
ective
Financial review (continued)
ROE by geography
£’000UKandOther
SouthernAfrica Australia
Total group
Operating profit before goodwill, acquired intangibles, non-operating items and taxation 144 804 288 282 3 401 436 487
Tax on ordinary activities (31 537) (48 693) 1 430 (78 800)
Non-controlling interests (397) (2 920) – (3 317)
Accrued preference dividends, adjusted for currency hedge (13 868) (23 793) – (37 661)
Adjustedearningsattributabletoordinaryshareholdersbeforegoodwill,acquiredintangiblesandnon-operatingitems–31March2013 99 002 212 876 4 831 316 709
Adjusted earnings attributable to ordinary shareholders before goodwill, acquired intangibles and non-operating items – 31 March 2012 87 165 216 755 (46 341) 257 579
Ordinaryshareholders’equity–31March2013 1 500 600 1 429 376 416 971 3 346 947
Goodwill and intangible assets (excluding software) (549 581) (10 260) (67 029) (626 870)
Tangibleordinaryshareholders’equity–31March2013 951 019 1 419 116 349 942 2 720 077
Ordinaryshareholders’equity–31March2012 1 515 289 1 429 170 387 727 3 332 186
Goodwill and intangible assets (excluding software) (562 675) (13 697) (61 401) (637 773)
Tangibleordinaryshareholders’equity–31March2012 952 614 1 415 473 326 326 2 694 413
Averageordinaryshareholders’equity–31March2013 1 507 945 1 429 272 402 349 3 339 566
Average ordinary shareholders’ equity – 31 March 2012 1 424 375 1 450 951 417 374 3 292 700
Averagetangibleshareholders’equity–31March2013 951 817 1 417 293 338 134 2 707 244
Average tangible shareholders’ equity– 31 March 2012 892 745 1 434 775 363 930 2 691 450
Post-taxreturnonaverageordinaryshareholders’equity–31March2013 6.6% 14.9% 1.2% 9.5%
Post-tax return on average ordinary shareholders’ equity – 31 March 2012 6.1% 14.9% (11.1%) 7.8%
Post-taxreturnonaveragetangibleshareholders’equity
–31March2013 10.4% 15.0% 1.4% 11.7%
Post-tax return on average tangible shareholders’ equity – 31 March 2012 9.8% 15.1% (12.7%) 9.6%
Pre-taxreturnonaverageordinaryshareholders’equity
–31March2013 8.7% 18.3% 0.8% 11.8%
Pre-tax return on average ordinary shareholders’ equity – 31 March 2012 8.4% 18.3% (15.8%) 9.7%
Pre-taxreturnonaveragetangibleshareholders’equity
–31March2013 13.7% 18.5% 1.0% 14.6%
Pre-tax return on average tangible shareholders’ equity – 31 March 2012 13.4% 18.5% (18.1%) 11.9%
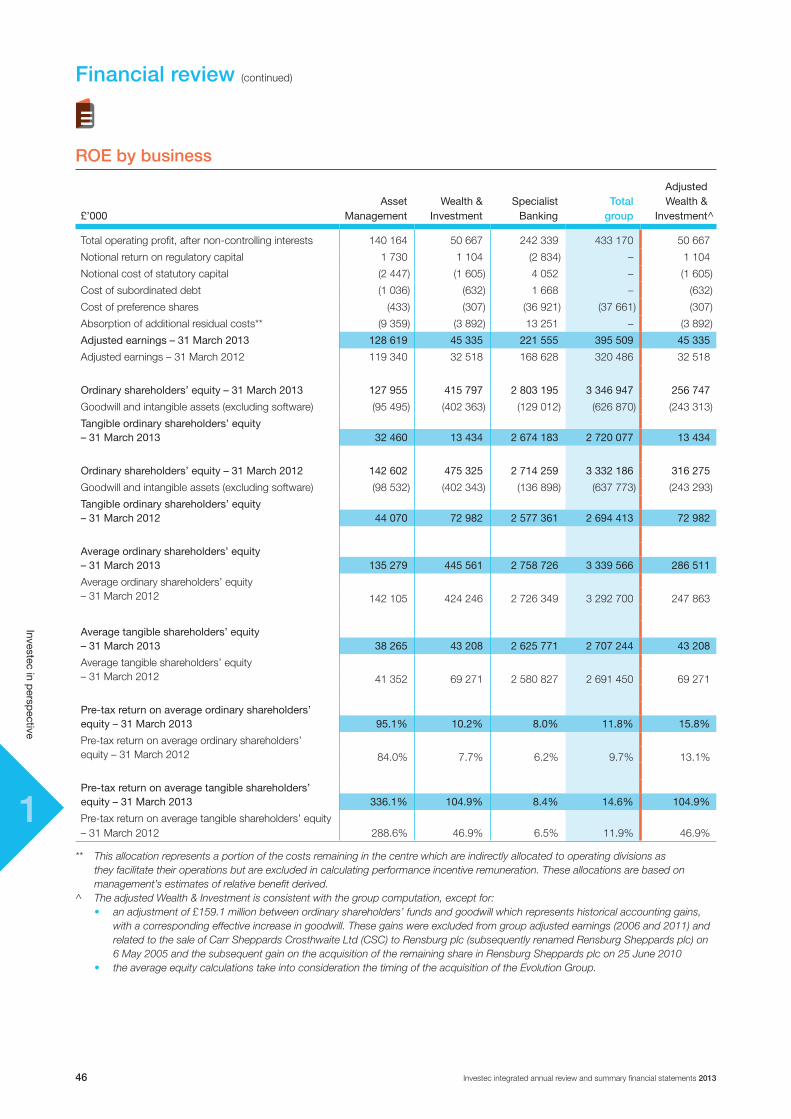
11
Investec integrated annual review and summary financial statements 201346
Investec in persp
ective
ROE by business
£’000Asset
ManagementWealth&
InvestmentSpecialistBanking
Total group
AdjustedWealth&
Investment^
Total operating profit, after non-controlling interests 140 164 50 667 242 339 433 170 50 667
Notional return on regulatory capital 1 730 1 104 (2 834) – 1 104
Notional cost of statutory capital (2 447) (1 605) 4 052 – (1 605)
Cost of subordinated debt (1 036) (632) 1 668 – (632)
Cost of preference shares (433) (307) (36 921) (37 661) (307)
Absorption of additional residual costs** (9 359) (3 892) 13 251 – (3 892)
Adjustedearnings–31March2013 128 619 45 335 221 555 395 509 45 335
Adjusted earnings – 31 March 2012 119 340 32 518 168 628 320 486 32 518
Ordinaryshareholders’equity–31March2013 127 955 415 797 2 803 195 3 346 947 256 747
Goodwill and intangible assets (excluding software) (95 495) (402 363) (129 012) (626 870) (243 313)
Tangibleordinaryshareholders’equity–31March2013 32 460 13 434 2 674 183 2 720 077 13 434
Ordinaryshareholders’equity–31March2012 142602 475325 2714259 3332186 316 275
Goodwill and intangible assets (excluding software) (98 532) (402 343) (136 898) (637 773) (243 293)
Tangibleordinaryshareholders’equity–31March2012 44 070 72 982 2 577 361 2 694 413 72 982
Averageordinaryshareholders’equity–31March2013 135 279 445 561 2 758 726 3 339 566 286 511
Average ordinary shareholders’ equity – 31 March 2012 142 105 424 246 2 726 349 3 292 700 247 863
Averagetangibleshareholders’equity–31March2013 38 265 43 208 2 625 771 2 707 244 43 208
Average tangible shareholders’ equity – 31 March 2012 41 352 69 271 2 580 827 2 691 450 69 271
Pre-taxreturnonaverageordinaryshareholders’equity–31March2013 95.1% 10.2% 8.0% 11.8% 15.8%
Pre-tax return on average ordinary shareholders’ equity – 31 March 2012 84.0% 7.7% 6.2% 9.7% 13.1%
Pre-taxreturnonaveragetangibleshareholders’equity–31March2013 336.1% 104.9% 8.4% 14.6% 104.9%
Pre-tax return on average tangible shareholders’ equity – 31 March 2012 288.6% 46.9% 6.5% 11.9% 46.9%
** This allocation represents a portion of the costs remaining in the centre which are indirectly allocated to operating divisions as they facilitate their operations but are excluded in calculating performance incentive remuneration. These allocations are based on management’s estimates of relative benefit derived.
^ The adjusted Wealth & Investment is consistent with the group computation, except for: • an adjustment of £159.1 million between ordinary shareholders’ funds and goodwill which represents historical accounting gains,
with a corresponding effective increase in goodwill. These gains were excluded from group adjusted earnings (2006 and 2011) and related to the sale of Carr Sheppards Crosthwaite Ltd (CSC) to Rensburg plc (subsequently renamed Rensburg Sheppards plc) on 6 May 2005 and the subsequent gain on the acquisition of the remaining share in Rensburg Sheppards plc on 25 June 2010
• the average equity calculations take into consideration the timing of the acquisition of the Evolution Group.
Financial review (continued)

11
Investec integrated annual review and summary financial statements 2013 47
Investec in persp
ective
Financial review (continued)
Total third party assets under management
£’million31 March
201331March
2012
InvestecAssetManagement 69822 61555
UK and Other 41 569 36 154
Southern Africa 28 253 25 401
Wealth&Investment 40350 34771
UK and Other 24 733 20 969
Southern Africa 15 617 13 802
PropertyActivities 320 230
Southern Africa 185 81
Australia 135 149
Australiaotherfunds 186 220
Total 110678 96776
A further analysis of third party assets under management
At31March2013£’million
UKandOther
SouthernAfrica Australia Total
InvestecAssetManagement 41569 28253 – 69822
Mutual Funds 17 004 11 847 – 28 851
Segregated Mandates 24 565 16 406 – 40 971
Wealth&Investment 24733 15617 – 40350
Discretionary 16 381 2 604 – 18 985
Non-discretionary 7 079 13 013 – 20 092
Other 1 273 – – 1 273
PropertyActivities – 185 135 320
Australiaotherfunds – – 186 186
Totalthirdpartyassetsundermanagement 66302 44055 321 110678
At31March2012£’million
UKandOther
SouthernAfrica Australia Total
InvestecAssetManagement 36154 25401 – 61555
Mutual Funds 17 490 9 683 – 27 173
Segregated Mandates 18 664 15 718 – 34 382
Wealth&Investment 20969 13802 – 34771
Discretionary 14 187 2 185 – 16 372
Non-discretionary 5 316 11 617 – 16 933
Other 1 466 – – 1 466
PropertyActivities – 81 149 230
Australiaotherfunds – – 220 220
Totalthirdpartyassetsundermanagement 57123 39284 369 96776

11
Investec integrated annual review and summary financial statements 201348
Investec in persp
ective
Operating profit (before goodwill, acquired intangibles, non-operating items, taxation and after non-controlling interests) per employee
BydivisionAsset
ManagementWealth&
InvestmentSpecialistBanking
Totalgroup
Numberofemployees–31March2013 1 268 1 332 5 551 8 151
Number of employees – 31 March 2012 1 173 1 319 5 289 7 781
Number of employees – 31 March 2011 1 071 976 5 190 7 237
Averageemployees–yearto31March2013 1 220 1 326 5 420 7 966
Average employees – year to 31 March 2012 1 122 1 148 5 240 7 510
Operatingprofit–yearto31March2013(£’000) 140 164 50 667 242 339 433 170
Operating profit – year to 31 March 2012 (£’000) 133 693 38 721 186 211 358 625
Operatingprofitperemployee^–31March2013(£’000) 114.9 38.2 44.7 54.4
Operating profit per employee^ – 31 March 2012 (£’000) 119.2 33.7 35.5 47.8
BygeographyUKandOther
SouthernAfrica Australia
Totalgroup
Numberofemployees–31March2013 3 495 4 168 488 8 151
Number of employees – 31 March 2012 3 289 4 068 424 7 781
Number of employees – 31 March 2011 2 709 4 101 427 7 237
Averageemployees–yearto31March2013 3 392 4 118 456 7 966
Average employees – year to 31 March 2012 2 999 4 085 426 7 510
Operatingprofit–yearto31March2013(£’000) 144 407 285 362 3 401 433 170
Operating profit/(loss) – year to 31 March 2012 (£’000) 135 070 289 436 (65 881) 358 625
Operatingprofitperemployee^–31March2013(£’000) 42.6 69.3 7.5 54.4
Operating profit/(loss) per employee^ – 31 March 2012 (£’000) 45.0 70.9 (154.7) 47.8
^ Based on average number of employees over the year.
Financial review (continued)

11
Investec integrated annual review and summary financial statements 2013 49
Investec in persp
ective
Financial review (continued)
Number of employees
Bydivision–permanentemployees31 March
201331March
2012
AssetManagement
UK and Other 383 359
Southern Africa 778 728
Total 1 161 1 087
Wealth&Investment
UK and Other 973 1021
Southern Africa 272 239
Total 1 245 1 260
SpecialistBanking
UK and Other 1 982 1 821
Southern Africa 2 698 2 694
Australia 470 407
USA 19 17
Total 5 169 4 939
Totalnumberofpermanentemployees 7 575 7 286
Bygeography31 March
201331March
201231March
201131March
201031March
200931March
200831March
2007
UK and Other 3 338 3 181 2 606 1 763 1 706 1 812 1 294
Southern Africa 3 748 3 661 3 680 3 542 3 541 3 666 3 476
Australia 470 411 401 356 354 424 235
USA 19 33 29 23 22 12 5
Temporary employees and contractors 576 495 521 439 328 419 420
Totalnumberof
employees 8 151 7781 7237 6123 5951 6333 5 430

2
Divisional review
2
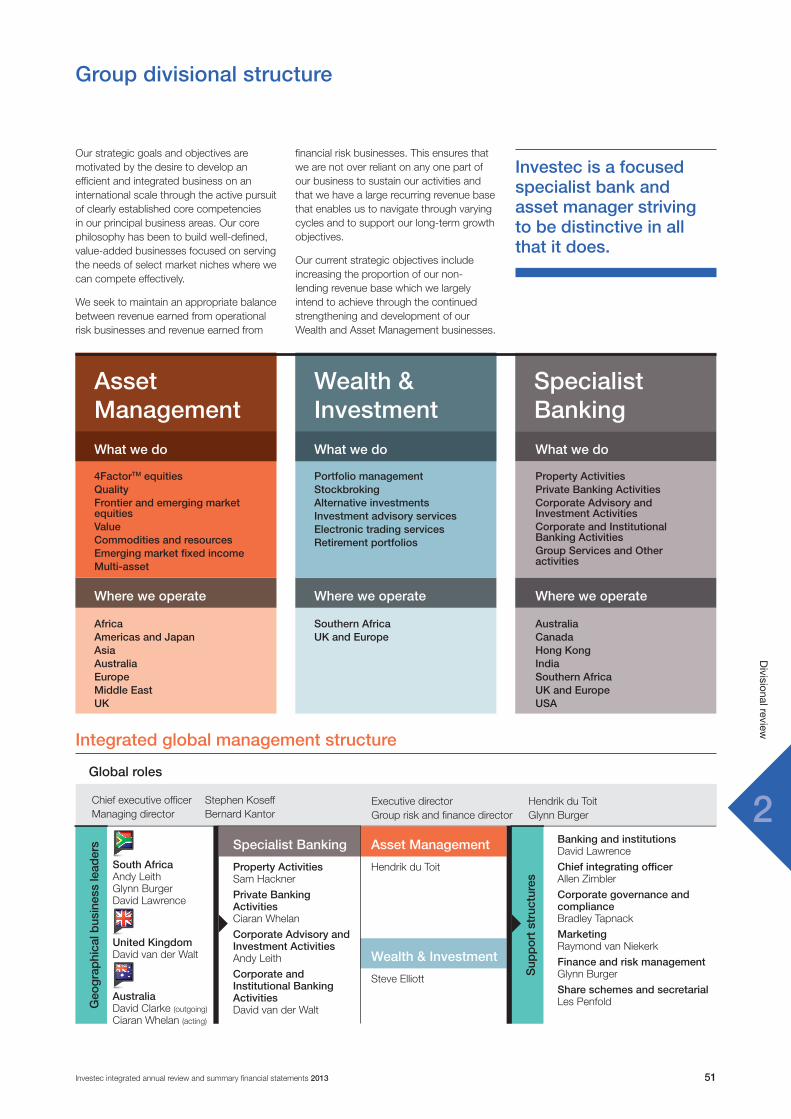
2
51Investec integrated annual review and summary financial statements 2013
Divisional review
Chief executive officer Stephen Koseff Managing director Bernard Kantor
AfricaAmericas and JapanAsia AustraliaEuropeMiddle EastUK
Where we operate
Southern AfricaUK and Europe
Where we operate
4FactorTM equitiesQualityFrontier and emerging market equitiesValueCommodities and resourcesEmerging market fixed incomeMulti-asset
AustraliaCanadaHong KongIndia Southern AfricaUK and EuropeUSA
Group divisional structure
Asset Management
Wealth & Investment
Specialist Banking
What we do
Where we operate
Our strategic goals and objectives are motivated by the desire to develop an efficient and integrated business on an international scale through the active pursuit of clearly established core competencies in our principal business areas. Our core philosophy has been to build well-defined, value-added businesses focused on serving the needs of select market niches where we can compete effectively.
We seek to maintain an appropriate balance between revenue earned from operational risk businesses and revenue earned from
financial risk businesses. This ensures that we are not over reliant on any one part of our business to sustain our activities and that we have a large recurring revenue base that enables us to navigate through varying cycles and to support our long-term growth objectives.
Our current strategic objectives include increasing the proportion of our non-lending revenue base which we largely intend to achieve through the continued strengthening and development of our Wealth and Asset Management businesses.
Investec is a focused specialist bank and asset manager striving to be distinctive in all that it does.
Portfolio managementStockbrokingAlternative investmentsInvestment advisory servicesElectronic trading servicesRetirement portfolios
Property ActivitiesPrivate Banking ActivitiesCorporate Advisory and Investment ActivitiesCorporate and Institutional Banking ActivitiesGroup Services and Other activities
What we do What we do
Integrated global management structure
Global roles
Executive director Hendrik du Toit Group risk and finance director Glynn Burger
Banking and institutions David Lawrence
Chief integrating officer Allen Zimbler
Corporate governance and compliance Bradley Tapnack
Marketing Raymond van Niekerk
Finance and risk management Glynn Burger
Share schemes and secretarial Les Penfold
South Africa Andy Leith Glynn Burger David Lawrence
United Kingdom David van der Walt
Australia David Clarke (outgoing)
Ciaran Whelan (acting)
Specialist Banking
Property Activities Sam Hackner
Private Banking Activities Ciaran Whelan
Corporate Advisory and Investment Activities Andy Leith
Corporate and Institutional Banking Activities David van der Walt
Asset Management
Hendrik du Toit
Wealth & Investment
Steve Elliott
Sup
por
t st
ruct
ures
Geo
grap
hica
l bus
ines
s le
ader
s
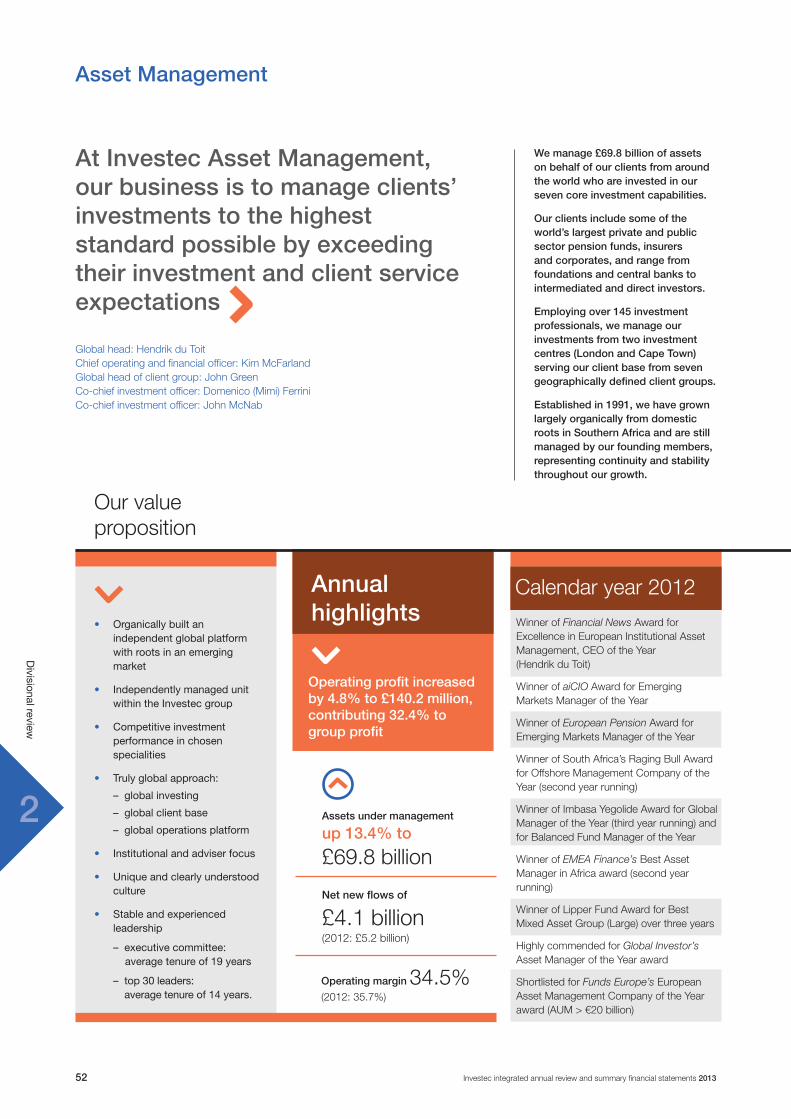
22
Investec integrated annual review and summary financial statements 201352
Divisional review
Asset Management
Annual highlights
Operating profit increased by 4.8% to £140.2 million, contributing 32.4% to group profit
Net new flows of
£4.1 billion(2012: £5.2 billion)
Our value proposition
• Organicallybuiltanindependentglobalplatformwithrootsinanemergingmarket
• IndependentlymanagedunitwithintheInvestecgroup
• Competitiveinvestmentperformanceinchosenspecialities
• Trulyglobalapproach:
–globalinvesting
–globalclientbase
–globaloperationsplatform
• Institutionalandadviserfocus
• Uniqueandclearlyunderstoodculture
• Stableandexperiencedleadership
–executivecommittee:averagetenureof19years
–top30leaders:averagetenureof14years.
We manage £69.8 billion of assets on behalf of our clients from around the world who are invested in our seven core investment capabilities.
Our clients include some of the world’s largest private and public sector pension funds, insurers and corporates, and range from foundations and central banks to intermediated and direct investors.
Employing over 145 investment professionals, we manage our investments from two investment centres (London and Cape Town) serving our client base from seven geographically defined client groups.
Established in 1991, we have grown largely organically from domestic roots in Southern Africa and are still managed by our founding members, representing continuity and stability throughout our growth.
At Investec Asset Management, our business is to manage clients’ investments to the highest standard possible by exceeding their investment and client service expectations
Global head: Hendrik du ToitChief operating and financial officer: Kim McFarlandGlobal head of client group: John GreenCo-chief investment officer: Domenico (Mimi) FerriniCo-chief investment officer: John McNab
Operating margin 34.5% (2012: 35.7%)
Assets under management
up 13.4% to
£69.8 billion
Calendar year 2012
Winner of Financial News Award for Excellence in European Institutional Asset Management, CEO of the Year (Hendrik du Toit)
Winner of aiCIO Award for Emerging Markets Manager of the Year
Winner of European Pension Award for Emerging Markets Manager of the Year
Winner of South Africa’s Raging Bull Award for Offshore Management Company of the Year (second year running)
Winner of Imbasa Yegolide Award for Global Manager of the Year (third year running) and for Balanced Fund Manager of the Year
Winner of EMEA Finance’s Best Asset Manager in Africa award (second year running)
Winner of Lipper Fund Award for Best Mixed Asset Group (Large) over three years
Highly commended for Global Investor’s Asset Manager of the Year award
Shortlisted for Funds Europe’s European Asset Management Company of the Year award (AUM > €20 billion)

22
53Investec integrated annual review and summary financial statements 2013
Divisional review
Asset Management (continued)
20132013
£1 331 million£1 331 million
2012
£1 060 million£1 060 million£1 060 million£1 060 million
£1 173 million £1 173 million
£2 862 million
2013
£1 095 million£1 095 million
2012
£527 million£527 million£527 million
20132013
£540 million£540 million
20122012
£721 million£721 million
201320122012
Net flows by geography
Financial year to March 2012 and March 2013.
Where we operate
Americas and Japan
Europe and Middle East
Africa
Asia Pacific
Including UK
Including Australia
™
Europeclient group
Asia client group
Afr
ica
clie
ntgro
upMulti-asset
Qua
lity
Value
market equities
andresources
equities
fixed
inco
me
Co
mm
odities
Frontier & emerging
Emer
ging
m
arket 4Factor
UK client group
Amer
icas
and
Japa
ncl
ient
gro
up
Australia client group
Mid
dle
East client group
Global investmentinfrastructure
Capabilities and organisational structure
Investment performance
All of our investment capabilities are managed with the simple aim of delivering performance which meets or exceeds our clients’ expectations around specific strict risk parameters.
We measure our investment performance relative to peer group and against benchmark over one, three, five and 10 year periods and since inception. Our long-term track record remains competitive.

22
Investec integrated annual review and summary financial statements 201354
Divisional review
Wealth & Investment
Annual highlights
Operating profit up 30.9% to £50.7 million, contributing 11.7% to group profit
Operating margin 20.3% (2012: 19.7%)
Net new flows of £0.8 billion
15.8%
ROE (pre-tax)(2012: 13.1%)
Assets under management
up 16.0% to
£40.4 billion
104.9%
tangible ROE (pre-tax)(2012: 46.9%)
Our value proposition
• InvestecWealth&Investmenthasbeenbuiltviaacquisitionofbusinessesandorganicgrowthoveralongperiodoftime
• WellestablishedplatformsintheUK,SouthAfricaandSwitzerland.ThenewGuernseybusinessisexpectedtobefullyoperationalduringthesecondhalfof2013
• Focusisoninternationalisingthebusiness,developmentofonlinecapabilitiesandorganicgrowthinourkeymarkets
• c.100000clients.
Today the business specialises in wealth management, portfolio management, private office and stockbroking services for individuals, families, trusts and charities. Formed through the alliance of Investec Private Client Securities, Investec Private Bank’s Wealth Management division and the acquisition of Rensburg Sheppards and Williams de Broë in the UK, we are one of the UK’s leading private client investment managers and the largest in South Africa.
Investec Wealth & Investment offers its clients comfort in its scale, international reach and depth of investment processes. Investec Wealth & Investment is one of the UK’s leading private client investment managers and the largest in South Africa Global head: Steve ElliottUK head: Jonathan Wragg Switzerland head: Peter GygerSouth Africa head: Henry Blumenthal NCB Wealth Management head: Greg Dilger
Further detail on the Wealth & Investment management structure is available on our website.
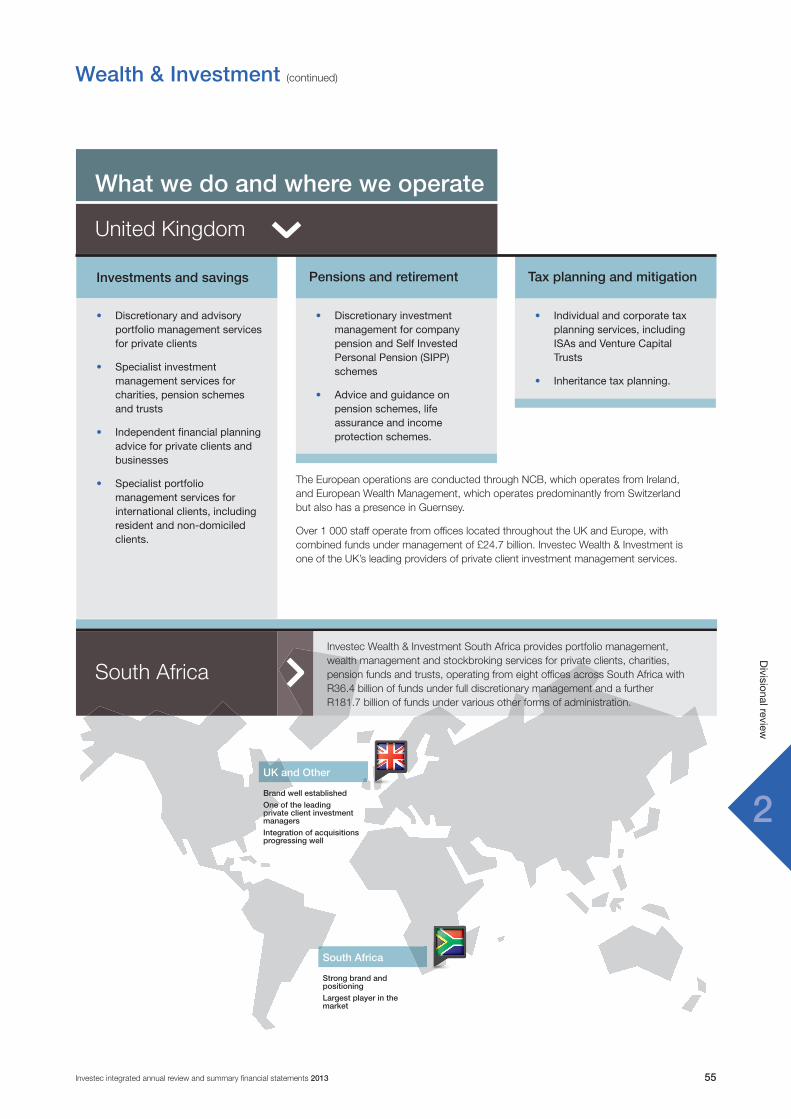
22
55Investec integrated annual review and summary financial statements 2013
Divisional review
Wealth & Investment (continued)
What we do and where we operate
United Kingdom
South Africa
Tax planning and mitigationPensions and retirement
• Discretionaryandadvisoryportfoliomanagementservicesforprivateclients
• Specialistinvestmentmanagementservicesforcharities,pensionschemesandtrusts
• Independentfinancialplanningadviceforprivateclientsandbusinesses
• Specialistportfoliomanagementservicesforinternationalclients,includingresidentandnon-domiciledclients.
Investments and savings
• Individualandcorporatetaxplanningservices,includingISAsandVentureCapitalTrusts
• Inheritancetaxplanning.
• DiscretionaryinvestmentmanagementforcompanypensionandSelfInvestedPersonalPension(SIPP)schemes
• Adviceandguidanceonpensionschemes,lifeassuranceandincomeprotectionschemes.
The European operations are conducted through NCB, which operates from Ireland, and European Wealth Management, which operates predominantly from Switzerland but also has a presence in Guernsey.
Over 1 000 staff operate from offices located throughout the UK and Europe, with combined funds under management of £24.7 billion. Investec Wealth & Investment is one of the UK’s leading providers of private client investment management services.
UK and Other
Brand well established
One of the leading private client investment managers
Integration of acquisitions progressing well
South Africa
Strong brand and positioning
Largest player in the market
Investec Wealth & Investment South Africa provides portfolio management, wealth management and stockbroking services for private clients, charities, pension funds and trusts, operating from eight offices across South Africa with R36.4 billion of funds under full discretionary management and a further R181.7 billion of funds under various other forms of administration.
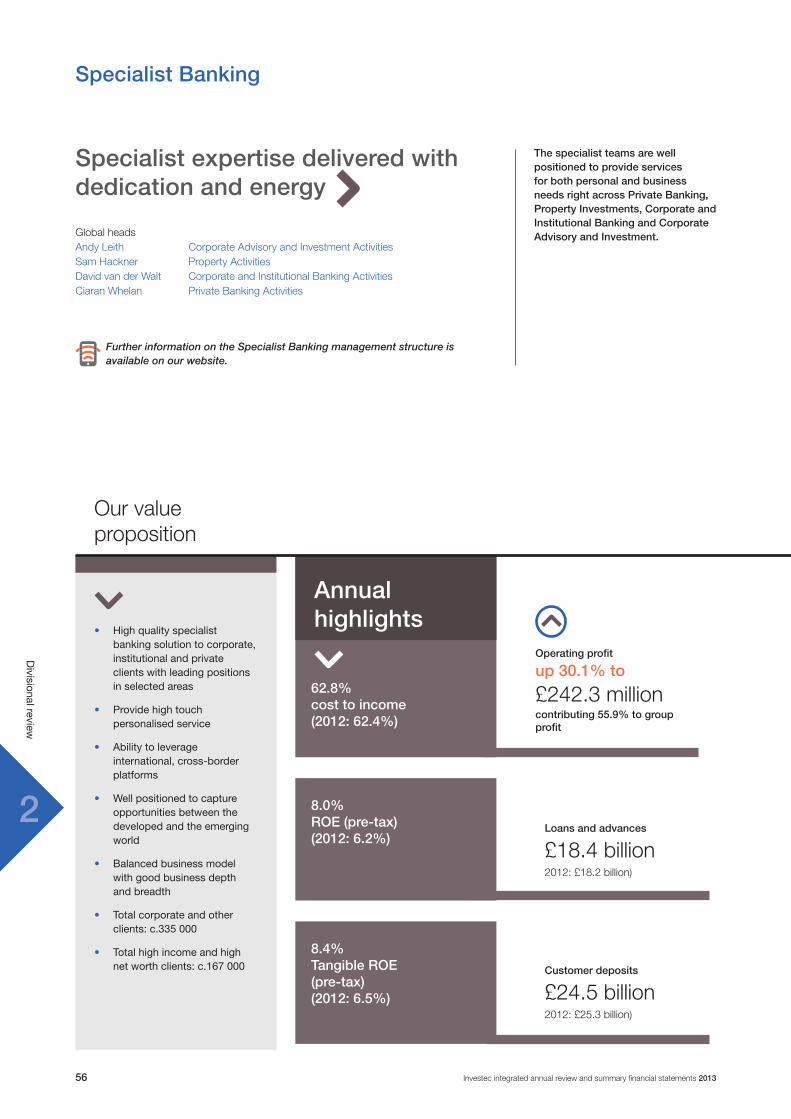
22
Investec integrated annual review and summary financial statements 201356
Divisional review
Specialist Banking
Annual highlights
62.8% cost to income (2012: 62.4%)
8.0% ROE (pre-tax) (2012: 6.2%)
8.4% Tangible ROE(pre-tax)(2012: 6.5%)
Our value proposition
• Highqualityspecialistbankingsolutiontocorporate,institutionalandprivateclientswithleadingpositionsinselectedareas
• Providehightouchpersonalisedservice
• Abilitytoleverageinternational,cross-borderplatforms
• Wellpositionedtocaptureopportunitiesbetweenthedevelopedandtheemergingworld
• Balancedbusinessmodelwithgoodbusinessdepthandbreadth
• Totalcorporateandotherclients:c.335000
• Totalhighincomeandhighnetworthclients:c.167000
The specialist teams are well positioned to provide services for both personal and business needs right across Private Banking, Property Investments, Corporate and Institutional Banking and Corporate Advisory and Investment.
Specialist expertise delivered with dedication and energy
Global heads Andy Leith Corporate Advisory and Investment ActivitiesSam Hackner Property ActivitiesDavid van der Walt Corporate and Institutional Banking ActivitiesCiaran Whelan Private Banking Activities
Loans and advances
£18.4 billion2012: £18.2 billion)
Operating profit
up 30.1% to
£242.3 millioncontributing 55.9% to group profit
Customer deposits
£24.5 billion2012: £25.3 billion)
Further information on the Specialist Banking management structure is available on our website.

22
57Investec integrated annual review and summary financial statements 2013
Divisional review
Specialist Banking (continued)
What we do
Where we operate
Transactional banking
Lending
Deposits
Investments
Australia
Southern Africa
UK and Europe
Corporates/government/institutional clients
Integrated systems and infrastructure
High income and high net worth private clients
Advisory
Institutional, research, sales and trading
Principal investments
Property activities
Australia
Hong Kong
India
Southern Africa
UK and Europe
USA
Treasury and trading services
Specialised finance
Debt Capital Markets
Australia
Canada
India
Southern Africa
UK and Europe
Corporate Advisory and Investment Activities
Corporate and Institutional Banking Activities
Private Banking Activities
Canada and USA
Distribution platform
Growing advisory and PFI capabilities
UK and Other
13th largest bank
Built an extensive quality client base from c.50.000 in 2008 to >c.223 000 today
Sustainable business on the back of client flow
Leading franchise in UK mid cap corporate market (FTSE 250) and well-recognised private banking brand which is expanding into transactional banking
South Africa
Fifth largest bank
Full service specialist banking offering a high quality innovative solution with leading positions in selected areas
Total corporate and private clients c.225 000
India
Established a presence in 2010
Facilitates the link between India, UK and South Africa
Australia
Established a core business in Professional Finance and Investment Banking
Developing our Corporate and Institutional Banking business
Building cross-border activities, especially in Resources and Mining
Gateway to Asia
Total corporate and private clients c.53 000
Established in 1997
One of the leading international banks in Mauritius
Hong Kong
Benefiting from a well diversified investment portfolio
Acquired Access Capital in June 2011 creating a link between China, UK and South Africa
Global resources platform established
Institutional equities team acquired and trading capability established
Mauritius

3
Risk management and corporate governance
3

3
59Investec integrated annual review and summary financial statements 2013
Risk m
anagement and
corporate governance
Risk management
Overview of disclosure requirements
Risk disclosures provided in line with the requirements of International Financial Reporting Standard 7 Financial Instruments: Disclosures (IFRS 7) and disclosures on capital required by International Accounting Standard 1 Presentation of Financial Statements (IAS 1) are included within this section of the annual report.
Further details provided within the financial statements can be found in the Investec group’s 2013 annual report.
All sections, paragraphs, tables and graphs on which an audit opinion is expressed on are marked as audited.
The majority of the group’s Pillar III risk disclosures as required in terms of Regulation 43 of the regulations relating to banks in South Africa and BIPRU 11 pertaining to banks in the UK are also included in this section of the annual report.
Information provided in this section of the annual report is prepared on an Investec DLC consolidated basis (i.e. incorporating the results of Investec plc and Investec Limited), unless otherwise stated. The group also publishes Pillar III and other risk information for its ‘silo’ entity holding companies and its significant banking subsidiaries. This information is contained in the respective annual financial statements for those respective entities.
Philosophy and approach to risk management
Our comprehensive risk management process involves identifying, quantifying, managing and mitigating the risks associated with each of our businesses.
Risk awareness, control and compliance are embedded in all our day-to-day activities.
Group Risk Management monitors, manages and reports on our risks to ensure it is within the stated risk appetite as mandated by the board of directors through the board risk and capital committee. Business units are ultimately responsible for risks that arise.
We monitor and control risk exposure through Credit, Market, Liquidity, Operational and Legal Risk Reporting
Group Risk Management objectives are to:
• Bethecustodianofourriskmanagementculture
• Ensurethebusinessoperateswithintheboardstatedriskappetite
• Supportthelong-termsustainabilityofthegroupbyprovidinganestablished,independentframeworkforidentifying,evaluating,monitoringandmitigatingrisk
• Set,approveandmonitoradherencetoriskparametersandlimitsacrossthegroupandensuretheyareimplementedandadheredtoconsistently
• Aggregateandmonitorourexposureacrossriskclasses
• Coordinateriskmanagementactivitiesacrosstheorganisation,coveringalllegalentitiesandjurisdictions
• Givetheboardsreasonableassurancethattherisksweareexposedtoareidentifiedand,tothebestextentpossible,managedandcontrolled
• Runappropriateriskcommittees,asmandatedbytheboard.
teams. This approach is core to assuming a tolerable risk and reward profile, helping us to pursue controlled growth across our business.
Group Risk Management operates within an integrated geographical and divisional structure, in line with our management approach, ensuring that the appropriate processes are used to address all risks across the group. Group Risk Management has specialist divisions in the UK, South Africa and Australia and smaller risk divisions in other regions to promote sound risk management practices.
Group Risk Management divisions with international responsibility are locally responsive yet globally aware. This helps to ensure that all initiatives and businesses operate within our defined risk parameters and objectives. Group Risk Management continually seeks new ways to enhance its techniques.
This section provides a summary of our risk management philosophy, practices and key developments for the year ended 31 March 2013. A more detailed review is provided in the Investec group’s 2013 annual report.
Overall group summary of the year in review from a risk perspective
This section should be read in conjunction with, and against the background provided in, the overview of the operating environment section on pages 26 to 29.
Investec has continued to maintain a sound balance sheet with low leverage, and a diversified business model. This has been supported by the following key operating fundamentals:
• Intimate involvement of executive management ensuring stringent management of risk, liquidity and capital
• Strong risk and capital management culture embedded into our day-to-day activities and values. We seek to achieve an appropriate balance between risk and reward in our business, taking cognisance of all stakeholders’ interests
• Reward programmes that align directors’ and employees’ interests with those of stakeholders, ensuring

33
Investec integrated annual review and summary financial statements 201360
Risk m
anagement and
corporate governance
that these programmes promote effective risk management. Annual bonuses are closely linked to business performance, determined largely by realised economic value-added profit performance against pre-determined targets above a risk and capital weighted return. This model has been consistently applied within the group in excess of ten years
• Credit and counterparty exposures to a select target market; our risk appetite continues to favour lower risk, income-based lending, with credit risk taken over a short to medium term. Exposure is taken against defined target clients displaying sound financial strength and integrity, a core competency and an established track record. Impairments on loans and advances decreased from £325.1 million to £251.0 million. The UK reported a moderate decrease whilst impairments in Australia were £50 million lower than the prior year. The South African business reported a marginal increase in impairments in Rand. Since 31 March 2012 the level of defaults has improved with the percentage of default loans (net of impairments but before taking collateral into account) to core loans and advances amounting to 2.73% (2012: 3.31%). The ratio of collateral to default loans (net of impairments) remains satisfactory at 1.26 times (2012: 1.37 times). The credit loss charge as a percentage of average gross core loans and advances has improved from 1.12% at 31 March 2012 to 0.84%
• Limited exposure to structured credit investments; representing approximately 1.5% of total assets
• Limited private client and corporate client exposures to peripheral Europe amounting to approximately 0.7% of total assets. In addition the group has certain branch related and subsidiary activities in Ireland, with total assets representing 2% of group assets
• A low leverage (gearing) ratio of 11.2 times
• A low level of net assets and liabilities exposed to the volatility of IFRS fair value accounting; with level 3 assets amounting to 2.0% of total assets
• Low equity and investment risk exposure with total investments comprising 3.7% of total assets
• Modest proprietary market risk within our trading portfolio. Value at risk and stress testing scenarios remain at prudent levels
• Potential losses that could arise in our trading book portfolio when stress tested under extreme market conditions (i.e. per extreme value theory) amount to less than 0.3% of total operating income
• A high level of readily available, high quality liquid assets; cash and near cash of £9.8 billion, representing 32.9% of our liability base. We continue to maintain a low reliance on interbank wholesale funding to fund core lending asset growth
• Continued increase in retail customer deposits and a growing retail franchise
• Healthy capital ratios; we have always held capital well in excess of regulatory requirements and we intend to perpetuate this philosophy. We continue to meet our capital targets
• Geographical and operational diversity with a high level of recurring income which continues to support sustainability of operating profit.
Geographic summary of the year in review from a risk perspectiveDetailed information on key developments during the financial year in review is provided in the sections that follow:
UK and Other
Credit risk
Against a difficult economic background we continued to rebalance our lending portfolios in line with our risk appetite statement and focussing on a reduction in property/real estate as a proportion of our loan exposures. Non-property collateralised lending as a percentage of gross credit exposures has increased. Core loans and advances increased by 4.4% from £5.8 billion at 31 March 2012 to £6.0 billion at 31 March 2013. Default loans (net of impairments) have decreased from 4.92% as at March 2012 to 4.34% of core loans and advances. The credit loss ratio is at 1.26%.
Traded market risk
Despite the difficult environment in the UK, there has been continued growth in client activity across the interest rate and foreign
exchange corporate sales desk although other trading opportunities were limited. The structured equity desk’s retail product sales have remained strong and they continue to develop their product range. Equity market making has expanded its coverage of stocks.
Balance sheet risk
The bank entered the year with a healthy surplus liquidity position, which increased during the year mainly due to retail deposits. This was managed down over the course of the year, returning to a similar surplus as at the beginning of the year. Throughout the first portion of the year, retail one year and two year fixed rate products continued to attract significant deposit inflows. As liquidity grew, rates were reduced to stem excessive inflows. Furthermore, the bank entered the wholesale markets with a three year £178 million syndicated bank club loan in June 2012 and a £200 million UK residential mortgage securitisation in September 2012. Cash and near cash balances as at 31 March 2013 amounted to £3.9 billion (2012: £3.6 billion) with total customer deposits increasing by 1.1% during the year to £9.6 billion. The bank in the UK currently comfortably meets its regulatory liquidity requirements and will progress to implement the forthcoming liquidity proposals included in the CRD IV (Basel III) package. The bank is currently shadowing and comfortably meeting the draft Liquidity Coverage and Net Stable Funding ratios. We will continue to monitor these rules until final implementation.
Southern Africa
Credit risk
Core loans and advances grew by 10.2% to R141.9 billion with commercial real estate investments and residential owner occupied portfolios representing the majority of the growth for the financial year in review. There has been continuing adherence to lower loan to value lending and greater competitive pressure on margins. Default loans (net of impairments) as a percentage of core loans and advances improved from 2.73% to 1.89% with an improvement in both lending collateralised by property and the private client portfolio as certain problem loans have been settled or some written off.
The corporate client portfolio had a small number of defaulted counterparties where the decision was made to write off the exposures in the financial year in review due
Risk management (continued)

33
61Investec integrated annual review and summary financial statements 2013
Risk m
anagement and
corporate governance
Risk management (continued)
to low probability of recovery. The credit loss ratio improved to 0.61% from 0.65%.
Traded market risk
Market conditions have remained difficult for traders as client flow has not improved significantly. While equity markets have trended up this has been on low volumes and volatility has remained low all year. Forex and interest rate markets have seen more volatility though this has been mainly on the back of international market drivers. The impact of the Basel regulations has caused the cost of capital in the trading area to increase at least three fold, this has adding to the constraints on traders’ level of risk taking.
Balance sheet risk
Investec’s balance sheet was well positioned for the 50bps rate cut that took place in July 2012 and the net contribution to income was significantly positive. Investec continued to build its structural liquidity cash resources over the course of the year as part of our drive to improve the Basel III Liquidity Coverage Ratio to be implemented from 2015. The bank continued to benefit from a growing retail franchise with total customer deposits increasing by 5.2% from 1 April 2012 to R185.3 billion at 31 March 2013. Cash and near cash balances increased by 5.6% from 1 April 2012 to R73.0 billion at 31 March 2013. Our liquidity was further boosted by several successful medium-term senior and subordinated notes issues totalling R11.8 billion. Syndicated loan deals raised about US$335 million three-year funds. Investec also issued its first EMTN and raised US$300 million for five years. Further welcome news was the announcement of the softening of some of the Basel III guidelines on liquidity risk in the last quarter and this has placed Investec in a very favourable position to meet the new criteria with less of a negative impact on margins.
Australia
Credit risk
Core loans and advances increased by 10.0% from A$3.0 billion at 31 March 2012 to A$3.3 billion at 31 March 2013. Default loans (net of impairments) increased marginally from 1.70% to 2.13% of core loans and advances, with the credit loss ratio improving significantly from 3.13% to 0.85%. Our Professional Finance business continues to show consistent growth to become the largest segment of the Investec Australia loan book, and has maintained historically low levels of arrears and defaults.
Traded market risk
Australian trading activity remains modest, with limited appetite for traded market risk exposures. Client activity is higher than in previous years on the back of improved deal activity, but remains somewhat sporadic.
Balance sheet risk
Investec Australia maintained a strong liquidity position well in excess of regulatory and internal policy requirements throughout the year, with average cash and near cash balances amounting to A$1.2 billion. Total customer deposits increased by 4.3% from 1 April 2012 to A$2.5 billion at 31 March 2013, which included an active diversification strategy across funding channels. In respect of liquidity, the Australian Prudential Regulatory Authority (APRA) is still formulating a response to recent proposed changes to the Liquidity Coverage Ratio measure recently recommended by the Basel Committee on Banking Supervision (BCBS). The bank in Australia remains committed to implementing the BCBS guidelines for liquidity risk measurement.
Investec Australia maintained a strong liquidity position well in excess of regulatory and internal policy requirements throughout the year.

33
Investec integrated annual review and summary financial statements 201362
Risk m
anagement and
corporate governance
Risk management (continued)
Salient featuresA summary of key risk indicators is provided in the table below.
Yearto31March
UKandOther SouthernAfrica Australia Investecgroup
2013£
2012£
2013R
2012R
2013A$
2012A$
2013£
2012£
Net core loans and advances (million) 6 045 5 788 141 863 128 747 3 304 3 005 18 415 18 226
Gross defaults as a % of gross core loans and advances 7.04% 7.35% 2.82% 3.71% 2.91% 2.31% 4.24% 4.73%
Defaults (net of impairments) as a % of net core loans and advances 4.34% 4.92% 1.89% 2.73% 2.13% 1.70% 2.73% 3.31%
Net defaults (after collateral and impairments) as a % of net core loans and advances – – – – – – – –
Credit loss ratio* 1.26% 1.22% 0.61% 0.65% 0.85% 3.13% 0.84% 1.12%
Structured credit investments as a % of total assets 2.44% 2.85% 1.24% 0.80% 0.46% 1.55% 1.72% 1.65%
Banking book investment and equity risk exposures as a % of total assets 2.52% 2.03% 4.96% 4.89% 2.56% 1.65% 3.65% 3.39%
Traded market risk: one-day value at risk (million) 0.7 0.6 7.2 4.2 – – n/a n/a
Cash and near cash (million) 3 930 3 565 72 974 69 077 978 1 555 9 828 10 251
Customer accounts (deposits) (million) 9 561 9 459 185 311 176 094 2 472 2 370 24 532 25 344
Core loans to equity ratio 3.7x^ 3.5x^ 5.8x 5.8x 5.4x 5.0x 4.6x 4.5x
Total gearing/leverage ratio** 10.7x^ 10.8x^ 12.2x 12.2x 7.8x 8.7x 11.2x 11.3x
Core loans (excluding own originated assets which have been securitised) to customer deposits 68.9%^ 65.4%^ 73.2% 69.6% 104.7% 92.0% 71.3% 67.8%
Capital adequacy ratio 16.9%^ 17.5%^ 15.5% 16.1% 15.8% 17.5% n/a n/a
Tier 1 ratio 11.0%^ 11.6%^ 10.8% 11.6% 11.8% 14.6% n/a n/a
* Income statement impairment charge on core loans as a percentage of average advances.** Total assets excluding assurance assets to total equity.^ Ratios are reflected at an Investec plc level (including Australia).• Certain information is denoted as n/a as these statistics are not applicable at a consolidated group level and are best reflected per
banking entity or jurisdiction in line with regulatory and other requirements.

33
63Investec integrated annual review and summary financial statements 2013
Risk m
anagement and
corporate governance
Internal audit and compliance
Internal audit
Internal Audit provides objective and independent assurance, via the group audit committees, to management and the board of Investec about risk management, control and governance processes and systems.
Compliance
In keeping with our core values, Investec endeavours to comply with the highest professional standards of integrity and behaviour, always keeping the interests of our customers and shareholders at the forefront of the corporate agenda. We also seek to bring high standards of compliance practice to all our jurisdictions in order to build trust and promote the quality of service to our colleagues and clients.
Compliance risk is the risk that Investec fails to comply with the letter and spirit of statutes, regulations, supervisory requirements and industry codes of conduct which apply to our businesses. At Investec we manage compliance risk through internal policies and processes, which include legal, regulatory and operational requirements relevant to the business. Those responsible for compliance work closely with the business and operational units to ensure consistent management of compliance risk. They also provide regular training and advice on emerging policy issues to ensure that all employees are familiar with their regulatory obligations.
UK and Europe – year in reviewWe have seen a continued effort by the UK and European supervisory authorities to enhance stability and resilience in the banking and advice sector by focusing on structural reforms and macro-prudential regulation; specifically in relation to capital, resolution, liquidity and market infrastructure.
Structural banking reform
On 4 February 2013, the UK Government introduced the Financial Services (Banking Reform) Bill to the House of Commons. The Bill would give the UK authorities the powers to implement the key recommendations of the Independent Commission on Banking (ICB) on banking reform, which include:
• Retailring-fence:this involves the fencing of the UK and European Economic Area (EEA) retail banking
activities of a UK bank in a legally distinct, operationally separate and economically independent entity within the same group
• Highercapitalandlossabsorbencyrequirements:the increase of the loss-absorbing capacity of ring-fenced banks
• Depositorprotection:the Bill gives depositors protection under the Financial Services Compensation Scheme preference if a bank enters insolvency.
The Bill contains a de minimis exemption from the requirement to ring-fence, which is expected to be relevant to all but the largest deposit takers. It is expected that Investec will fall within this de minimis exemption and will therefore be out of scope from the ring-fencing requirement.
Reforms of the UK regulatory framework
In the last year the UK financial regulator has been working towards implementing the legislative split into twin regulators. As of 1 April 2013 the FSA will be split into two organisations focusing on primarily prudential and conduct matters separately. The Prudential Regulatory Authority (PRA) will prudentially supervise large banks and insurance firms, whilst the Financial Conduct Authority (FCA) will supervise all firms on conduct matters. The FCA will also be prudentially responsible for some smaller firms. Each regulator has set out their agenda for future regulatory activities and they have revealed a number of new supervisory tools that will enable them to regulate firms with the intention of pursuing market integrity and good consumer outcomes. Investec continues to monitor the changes to the regulatory landscape and to adapt to the shift in supervisory priorities.
Retail Distribution Review/Mortgage Market Review
On 31 December 2012 the FSA embedded the proposals on the Retail Distribution Review (RDR), which aim to improve the quality of service provided to clients in the advice sector. By imposing minimum qualification standards for advisers; requiring firms to have more transparent charging practices; and disclosing more clearly the parameters within which advice is provided i.e. independent or restricted, the UK Regulator hopes to rebuild trust in the IFA and investment management community as well as improve outcomes
for retail clients. Whilst impact on Investec Bank plc has been limited, RDR is relevant to Investec Wealth & Investment. This is particularly regarding charging structures and the qualifications advisers have had to attain to continue to provide advice. Investec Wealth & Investment has implemented RDR and is continuing to monitor its impact on the business and client outcomes.
The Mortgage Market Review is the mortgage market equivalent of the RDR, focusing on outcomes for clients in the mortgage space. Investec is continuing to track the proposals through the consultation process and is working towards embedding necessary changes by April 2014.
South Africa – year in reviewFollowing from National Treasury’s publication of the Red Book (which includes South Africa’s regulatory response to the global financial crisis) and various G20 commitments, we have been subject to an unprecedented volume of regulatory activity (new or enhanced regulation and policies, and extensively enhanced reporting), in both the prudential and market areas, such as: Basel III, Solvency and Asset Management, Financial Markets Act, hedge funds, collective investment schemes, and the National Credit Act.
With the ‘Twin Peaks’ model of regulation having been identified as the most appropriate model going forward with separate regulators being responsible for prudential and market conduct regulation across industries, a variety of South African legislation needs to be amended to ensure each regulator has the appropriate authority and scope to enable adequate regulation. To initiate this process the Financial Services Board (FSB) has published ‘The Roadmap: Treating Customers Fairly (TCF)’ which sets out their programme and intended timelines for market conduct regulation. The six principles set out by the FSB mirror the equivalent principles published by the UK Regulators. A further development, in February 2013, was the publication of the document Implementing a Twin Peaks Model of Financial Regulation in South Africa. The document outlines National Treasury's proposals for the splitting of regulatory functions between a prudential and market conduct regulator, and the functions of a systemic regulator.
Investec is participating in both the TCF and Twin Peaks industry work-streams.

33
Investec integrated annual review and summary financial statements 201364
Risk m
anagement and
corporate governance
Consumer protection
Consumer protection regulation remains a key focus into 2013 with additional emphasis on aligning existing processes with the TCF Roadmap published by the FSB.
As required by FAIS, the fit and proper status of representatives and key individuals of all licensed Investec financial services providers (FSPs) is monitored on an ongoing basis and the requisite reports are made to the FSB.
The National Credit Regulator (NCR) commissioned a review of the National Credit Act (NCA) policy, in anticipation of amendments to the NCA. The University of Pretoria undertook the review, and Investec participated in the workshops held with the Banking Association of South Africa (BASA). The NCR will present the results of the review to Parliament early this year, and it is anticipated that they will commence with amendments thereafter.
The most recent draft of the Protection of Personal Information Bill (POPI) was debated at the Technical Working Committee during March 2012. Once enacted POPI will have a material impact on all aspects of Investec’s business that concern the processing of personal information in respect of Investec’s clients and employees, as well as information relating to the Investec group and subsidiaries.
Anti-money laundering and terror financing
The Anti-Money Laundering (AML) supervisory landscape has been amended. The Financial Intelligence Centre (FIC), who historically filled the role as both compliance supervisor on AML matters as well as the designated country Financial Intelligence Unit (FIU), has assumed the responsibility of compliance supervisor only on matters relating to the requirement to register as an accountable institution with the FIC as well as reporting of suspicious transaction reports, counter-terrorist financing reports and cash threshold reports.
An accountable institution’s primary supervisor assumes the responsibility of supervising compliance on all other AML matters.
Australia – year in reviewReform within the Australian regulatory framework
Consistent with many other financial centres, the velocity of regulatory change
in the Australian banking and financial services sector has remained relatively high and the regulatory environment is becoming increasingly complex. A notable change is the increasing prevalence of real-time impacts of US and European regulatory reforms on the Australian market. Notable examples of these include the US Dodd-Frank Act and Foreign Account Tax Compliance Acts.
Consumer protection
Australian Securities and Investments Commission (ASIC), the Australian regulator responsible for consumer protection in relation to credit and financial products, identifies confident and informed investors and financial consumers as one of their three key priorities and it continues to attract significant resource contributions.
During the course of the year ASIC created or refreshed regulatory guidance on a number of consumer-related topics, including marketing and advertising; training for representatives who provide advice to retail clients; and market integrity rules. Although guidance is generally not prescriptive, it is indicative of the regulator’s expectations and often provides a best practice standard that requires consideration by all licensed firms.
Legislation and regulations to effect the Australian government’s ‘Future of Financial Advice Reform’ have been published and come into effect on 1 July 2013. The reforms, which modify the operation of current legislation, prohibits conflicted remuneration in the retail advice sector, creates a requirement for advisers to act in the best interests of clients and aims to improve transparency of fees.
Anti-money laundering and counter-terrorism financing
During the year, the Australian Government introduced an amended funding model for Australia's AML/CTF regulator, Australian Transaction Reports and Analysis Centre (AUSTRAC), which includes a supervisory levy for reporting entities.
Investec Australia has updated triggers on transaction reporting and implemented new external monitoring arrangements with the introduction of transaction banking through the launch of a credit card product.
Internal audit and compliance (continued)

33
65Investec integrated annual review and summary financial statements 2013
Risk m
anagement and
corporate governance
Corporate governance report
Introduction
Sound corporate governance is implicit in our values, culture, processes, functions and organisational structure. Structures are designed to ensure that our values remain embedded in all businesses and processes. We continually refine these structures and a written statement of values serves as our code of ethics.
This section provides a summary of our coporate governance philosophy practices and key developments for the year ended 31 March 2013. A more detailed review is provided in the Investec group’s 2013 annual report.
Board statement
The board, management and employees of Investec are committed to complying with the disclosure and transparency rules and listing rules of the United Kingdom Listing Authority (UKLA), the JSE Limited (JSE) listings requirements, regulatory requirements in the countries in which we operate, the
UK Corporate Governance Code 2010 (the Code) and the King Code of Governance Principles for South Africa (King III). Therefore all stakeholders are assured that we are being managed ethically and in compliance with the latest legislation, regulations and best practices.
Governance requirements
UK Corporate Governance Code (2010)The board is of the opinion that, based on the practices disclosed throughout this report, which were in operation during the year under review, the group has complied with the relevant provisions set out in the UK Corporate Governance Code (the Code), save that:
• Bradley Fried, who is not considered to be independent as he was employed as Investec Bank plc CEO during the five years prior to appointment as a director, was appointed as a member of the
Governance framework
Compliance
Internalaudit
Global credit committeeGlobal market risk forum
Group asset and liability committeesGroup operational risk committees
Global IT steering committeeGlobal compliance forum
Audit and compliance implementation forums
Global forums/
committees
Deal forum/new product
forum
Audit sub-committees
DLC capital committee
Group legal risk forums
Executive risk review
forum
Group investment committee
DLC social and ethics committee
DLC board risk and capital committee
Audit committeesDLC nominations
and directors’ affairs committee
DLC remuneration committee
Investec plc and Investec Limited board of directors
Stakeholders (employees, shareholders, government, regulatory bodies, clients, suppliers, communities)
DLC remuneration committee on 3 April 2013. Given the increasing complexity of remuneration policy and its application to the group, Bradley’s knowledge and experience of the group is deemed to be beneficial to the workings of this committee and is believed to be in the best interests of shareholders
• Fani Titi, on his appointment as joint chairman in November 2011, was not considered independent at the time in view of his previous connection with Tiso Group Limited. Tiso had a material relationship with Investec Limited arising from the empowerment transaction concluded in 2003 as in light of South Africa’s Financial Sector Charter. Fani resigned as board member and chairman of Tiso during March 2008 and as the UK Corporate Governance Code requires a five year break in the relationship, going forward Fani will be regarded as independent.

33
Investec integrated annual review and summary financial statements 201366
Risk m
anagement and
corporate governance
Corporate governance report (continued)
King III
The board is of the opinion that, based on the practices disclosed throughout this report, which were in operation during the year under review, Investec has applied the King III principles.
For a complete list of all principles and a reference to demonstrate how Investec has applied these principles, please refer to our website.
Financial reporting and going concern
The directors are required to confirm that they are satisfied that the group, as well as Investec plc and Investec Limited individually, have adequate resources to continue in business for the foreseeable
future. The assumptions underlying the going concern statement are discussed at the time of the approval of the annual financial statements by the board and these include:
• Budgeting and forecasts
• Profitability
• Capital
• Liquidity.
In addition, the directors are responsible for monitoring and reviewing the preparation, integrity and reliability of the Investec plc and Investec Limited combined and consolidated financial statements, accounting policies and the information contained in the annual report.
In undertaking this responsibility, the directors are supported by an ongoing process for identifying, evaluating and managing the significant risks Investec faces in preparing the financial and other information contained in this annual report. This process was in place for the year under review and up to the date of approval of the annual report and financial statements.
The process is implemented by management and independently monitored for effectiveness by the audit, risk and other sub-committees of the board
The significant risks we continue to face include risks flowing from the instability in the global financial market and the
global economic environment that could affect Investec’s businesses, earnings and financial condition.
Our financial statements are prepared on a going concern basis, taking into consideration:
• The group’s strategy and prevailing market conditions and business environment
• Nature and complexity of our business
• Risks we assume, and their management and mitigation
• Key business and control processes in operation
• Credit rating and access to capital
• Needs of all our stakeholders
• Operational soundness
• Accounting policies adopted
• Corporate governance practices
• Desire to provide relevant and clear disclosures
• Operation of board committee support structures.
The board is of the opinion, based on its knowledge of the group, key processes in operation and specific enquiries, that there are adequate resources to support the group as a going concern for the foreseeable future.
Furthermore, the board is of the opinion that the group’s risk management processes and the systems of internal control are effective.
Board of directors
In terms of DLC arrangements, the boards of Investec plc and Investec Limited are identical and the group is managed as a unified economic enterprise. The board seeks to exercise leadership, integrity and judgement in pursuit of strategic goals and objectives, to achieve long-term sustainability, growth and prosperity. The board is accountable for the performance and affairs of Investec. It provides leadership for the group within a framework of prudent and effective controls which allows risks to be assessed and managed.
The board has adopted a board charter, which provides a framework of how the
boards operate as well as the type of decisions to be taken by the board and which decisions should be delegated to management.
The Investec board:
• Approves the group’s strategy
• Ensures that the group complies with the applicable laws and regulations and considers adherence to non-binding rules and standards
• Is responsible for the governance of risk, including that of information technology (IT)
• Acts as a focal point for, and the custodian of corporate governance
• Provides effective leadership on an ethical foundation
• Ensures the group is, and is seen to be, a responsible corporate citizen.
The board meets its objectives by reviewing and guiding corporate strategy, setting the group’s values and standards, promoting high standards of corporate governance, approving key policies and objectives, ensuring that obligations to its shareholders and other stakeholders are understood and met, understanding the key risks, determining our risk tolerance and approving and reviewing the processes in operation to mitigate risk from materialising, including the approval of the terms of reference of key supporting board committees.
Certain matters are specifically reserved for the board. To achieve its objectives, the board may delegate certain of its duties and functions to various board committees, group forums or the chief executive officer, without abdicating its own responsibilities:
• The board has formally defined and documented, by way of terms of reference, the authority it has delegated to the various board committees and group forums
• In fulfilling its responsibilities, the board is supported by management in implementing the plans and strategies approved by the board.
Furthermore, directly or through its sub-committees, the Investec board:
• Assesses the quantitative and qualitative aspects of Investec’s performance through a comprehensive system of financial and non-financial monitoring
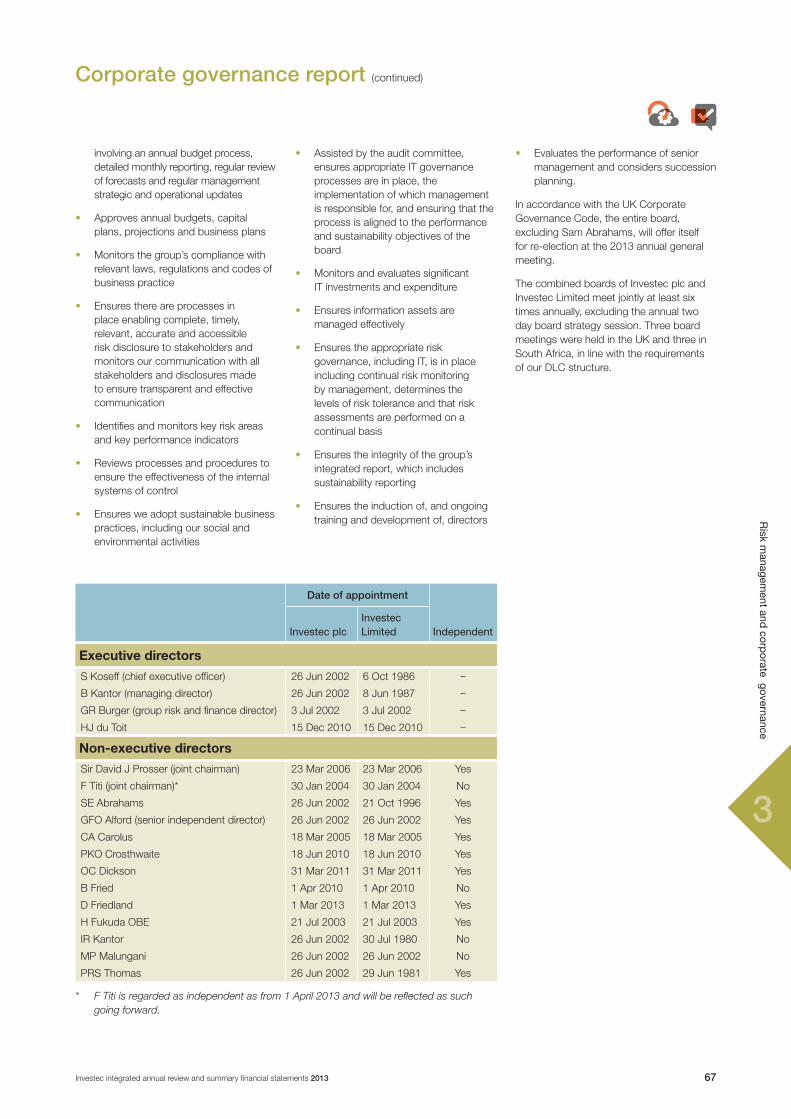
33
67Investec integrated annual review and summary financial statements 2013
Risk m
anagement and
corporate governance
Corporate governance report (continued)
involving an annual budget process, detailed monthly reporting, regular review of forecasts and regular management strategic and operational updates
• Approves annual budgets, capital plans, projections and business plans
• Monitors the group’s compliance with relevant laws, regulations and codes of business practice
• Ensures there are processes in place enabling complete, timely, relevant, accurate and accessible risk disclosure to stakeholders and monitors our communication with all stakeholders and disclosures made to ensure transparent and effective communication
• Identifies and monitors key risk areas and key performance indicators
• Reviews processes and procedures to ensure the effectiveness of the internal systems of control
• Ensures we adopt sustainable business practices, including our social and environmental activities
• Assisted by the audit committee, ensures appropriate IT governance processes are in place, the implementation of which management is responsible for, and ensuring that the process is aligned to the performance and sustainability objectives of the board
• Monitors and evaluates significant IT investments and expenditure
• Ensures information assets are managed effectively
• Ensures the appropriate risk governance, including IT, is in place including continual risk monitoring by management, determines the levels of risk tolerance and that risk assessments are performed on a continual basis
• Ensures the integrity of the group’s integrated report, which includes sustainability reporting
• Ensures the induction of, and ongoing training and development of, directors
• Evaluates the performance of senior management and considers succession planning.
In accordance with the UK Corporate Governance Code, the entire board, excluding Sam Abrahams, will offer itself for re-election at the 2013 annual general meeting.
The combined boards of Investec plc and Investec Limited meet jointly at least six times annually, excluding the annual two day board strategy session. Three board meetings were held in the UK and three in South Africa, in line with the requirements of our DLC structure.
Date of appointment
InvestecplcInvestecLimited Independent
Executive directors
S Koseff (chief executive officer) 26 Jun 2002 6 Oct 1986 –
B Kantor (managing director) 26 Jun 2002 8 Jun 1987 –
GR Burger (group risk and finance director) 3 Jul 2002 3 Jul 2002 –
HJ du Toit 15 Dec 2010 15 Dec 2010 –
Non-executive directors
Sir David J Prosser (joint chairman) 23 Mar 2006 23 Mar 2006 Yes
F Titi (joint chairman)* 30 Jan 2004 30 Jan 2004 No
SE Abrahams 26 Jun 2002 21 Oct 1996 Yes
GFO Alford (senior independent director) 26 Jun 2002 26 Jun 2002 Yes
CA Carolus 18 Mar 2005 18 Mar 2005 Yes
PKO Crosthwaite 18 Jun 2010 18 Jun 2010 Yes
OC Dickson 31 Mar 2011 31 Mar 2011 Yes
B Fried 1 Apr 2010 1 Apr 2010 No
D Friedland 1 Mar 2013 1 Mar 2013 Yes
H Fukuda OBE 21 Jul 2003 21 Jul 2003 Yes
IR Kantor 26 Jun 2002 30 Jul 1980 No
MP Malungani 26 Jun 2002 26 Jun 2002 No
PRS Thomas 26 Jun 2002 29 Jun 1981 Yes
* F Titi is regarded as independent as from 1 April 2013 and will be reflected as such going forward.

33
Investec integrated annual review and summary financial statements 201368
Risk m
anagement and
corporate governance
Directorate Investec plc and Investec Limited
Executive directors (details as at the date of this report)
Stephen Koseff (61)Chief executive officerBCom, CA(SA), H Dip BDP, MBA
Investeccommittees: DLC board risk and capital, DLC capital, DLC social and ethics and global credit
Appointed to the board in October 1986
Stephen joined Investec in 1980. He has had diverse experience within Investec as chief accounting officer and general manager of banking, treasury and merchant banking.
Currentdirectorships: The Bidvest Group Limited and a number of Investec subsidiaries.
Bernard Kantor (63)Managing directorCTA
Investeccommittees: DLC board risk and capital, DLC capital, DLC social and ethics and global credit
Appointed to the board in June 1987
Bernard joined Investec in 1980. He has had varied experience within Investec as a manager of the Trading division, marketing manager and chief operating officer.
Currentdirectorships: Phumelela Gaming and Leisure Limited and a number of Investec subsidiaries.
Glynn R Burger (56)Group risk and finance directorBAcc, CA(SA), H Dip BDP, MBL
Investeccommittees: DLC board risk and capital, DLC capital and global credit
Appointed to the board in July 2002
Glynn joined Investec in 1980. His positions within Investec have included chief accounting officer, group risk manager and joint managing director for South Africa.
Currentdirectorships: Investec Bank Limited and a number of Investec subsidiaries.
Hendrik du Toit (51)Investec Asset Management chief executive officerBCom Law, BCom (Hons) (cum laude), MCom (cum laude), MPhil (Cambridge)
Appointed to the board in December 2010
After lecturing economics at the University of Stellenbosch, Hendrik joined the Investment division of Old Mutual from where he moved to Investec in 1991 as portfolio manager and later chief executive officer of Investec Asset Management.
Currentdirectorships: Investment Management Association, Investec Asset Management Holdings (Pty) Ltd and Investec Asset Management Limited as well as their subsidiaries.
Non-executive directors (details as at the date of this report)
Sir David J Prosser* (69)Joint chairmanBSc (Hons), FIA
Investeccommittees: DLC remuneration, DLC nominations and directors’ affairs and DLC board risk and capital
Appointed to the board in March 2006
Sir David was previously chief executive of Legal & General Group PLC, joining Legal and General in 1988 as group director (investments) becoming deputy chief executive in January 1991 and group chief executive in September 1991. Sir David was previously chairman of the Financial Services Skills Council.
Currentdirectorships: Investec Bank plc (chairman), Pippbrook Limited, Epsom Downs Racecourse Limited and The Royal Automobile Club Limited.
Fani Titi* (50)Joint chairmanBSc (Hons), MA, MBA
Investeccommittees: DLC board risk and capital, DLC nominations and directors’ affairs and DLC social and ethics
Appointed to the board in January 2004
Fani is chairman of Investec Bank Limited and former chairman of Tiso Group Limited.
Currentdirectorships: Investec Bank Limited (Chairman), Tsiya Group (Pty) Ltd and a number of its investee companies, Investec Employee Benefits Limited and Investec Asset Management Holdings (Pty) Ltd, Kumba Iron Ore Limited (chairman), MTN Group Limited
Samuel E Abrahams (74)FCA, CA(SA)
Investeccommittees: DLC audit, Investec plc audit, Investec Limited group audit, DLC nominations and directors’ affairs, DLC board risk and capital and DLC capital and global credit
Appointed to the board in October 1996
Sam is a former international partner and South African managing partner of Arthur Andersen.
Currentdirectorships: Investec Bank Limited, The Foschini Group Limited and a number of Investec subsidiaries.
George FO Alford (64)Senior independent directorBSc (Econ), FCIS, FIPD, MSI
Investeccommittees: DLC audit, Investec plc audit, Investec Limited group audit and DLC nominations and directors’ affairs
Appointed to the board in June 2002
George is a former head of private banking and personnel at Kleinwort Benson Group and was a senior adviser to the UK Financial Services Authority. He is former chairman and now director on the Advisory Board of London Metropolitan Business School and chair of the Foundation Trust Financing Facility of the Department of Health
Currentdirectorships: Investec Bank plc
Cheryl A Carolus (54)BA (Law), BEd, Honorary doctorate in Law
Investeccommittees: DLC social and ethics
Appointed to the board in March 2005
Cheryl acted as the South African high commissioner to London between 1998 and 2001 and was chief executive officer of South African Tourism.
Currentdirectorships: De Beers Consolidated Mines Limited, Gold Fields Limited, Mercedes-Benz South Africa (Pty) Ltd, WWF South Africa and International, The IQ Business (Pty) Ltd, Ponahalo Capital (Pty) Ltd, Investec Asset Management Holdings (Pty) Ltd, executive chairperson of Peotona Group Holdings (Pty) Ltd and director of a number of the Peotona group companies. * Joint chairmen with effect from 17 November 2011.

33
69Investec integrated annual review and summary financial statements 2013
Risk m
anagement and
corporate governance
Perry KO Crosthwaite (64)MA (Hons) in modern languages
Investeccommittees: DLC remuneration
Appointed to the board in June 2010
Perry is a former chairman of Investec Investment Banking Securities Limited and director of Investec Bank plc.
Currentdirectorships: Investec Bank plc, Jupiter Green Investment Trust, Melrose plc, Neontar Limited, Investec Securities Holdings Ireland Limited and Investec Capital and Investments (Ireland) Limited.
Olivia C Dickson (52)MA (Oxon), MSc (Lon), CDipAF
Investeccommittees: DLC audit, Investec plc audit, Investec Limited group audit and DLC remuneration
Appointed to the board in March 2011
Olivia is a non-executive director and chair of the risk committee of Canada Life Limited. She is also a non-executive director, member of the codes and standards committee and chair of the Actuarial Council of the Financial Reporting Council, and a member of the Financial Services Authority’s regulatory decisions committee.
Olivia was previously, among other positions, Senior Adviser to the Financial Services Authority, a managing director of JP Morgan and a non-executive director and chair of the audit committee of the London International Financial Futures Exchange.
Currentdirectorships: Canada Life Limited, Canada Life Group (UK) Limited, Canada Life Asset Management Limited, Invista Real Estate Investment Management Holdings plc, Invista Real Estate Investment Management Limited.
Bradley Fried (47)BCom, CA(SA), MBA
Investeccommittees: DLC board risk and capital
Appointed to the board in April 2010
Bradley joined Investec in 1999 and has held the positions of joint head of investment banking and chief executive of Investec Bank plc. He is the chief executive in residence at Judge business school.
Currentdirectorships: Investec Wealth & Investment Limited, Grovepoint Capital LLP and non-executive director of the Court of Bank of England.
David Friedland (59)BCom, CA(SA)
Investeccommittees: Investec Limited group audit, DLC audit, Investec plc audit, DLC board risk and capital, DLC capital, DLC remuneration and global credit
Appointed to the board in March 2013
David is a former partner of both Arthur Andersen and KPMG where he also served as Head of Audit and Risk in KPMG, Cape Town Office.
Currentdirectorships:Investec Bank Limited and Investec Bank plc.
Haruko Fukuda OBE (66)MA (Cantab), DSc
Investeccommittees: DLC board risk and capital
Appointed to the board in July 2003
Haruko was previously chief executive officer of the World Gold Council, and senior adviser at Lazard. She is former vice chairman of Nikko Europ plc and a partner of James Capel & Co and a former director of AB Volvo and of Foreign and Colonial Investment Trust plc.
Currentdirectorships:Director of Aberdeen Asian Smaller Companies Investment Trust PLC. She is an adviser to Metro AG.
Ian R Kantor (66)BSc (Eng), MBA
Appointed to the board in July 1980
Currentdirectorships: Insinger de Beaufort Holdings SA (in which Investec Limited indirectly holds an 8.6% interest), Investec Bank plc, Bank Insinger de Beaufort NV where he is chairman of the management board.
M Peter Malungani (55)BCom, MAP, LDP
Investeccommittees: DLC board risk and capital
Appointed to the board in June 2002
Peter is chairman and founder of Peu Group (Pty) Ltd, chairman of the deals and acquisitions committee and a member of the social and ethics committee of Pretoria Portland Cement Limited
Currentdirectorships:Phumelela Gaming and Leisure Limited (Chairman), Investec Bank Limited, Investec Asset Management Holdings (Pty) Ltd, Pretoria Portland Cement Ltd, Peu Group (Pty) Ltd and a number of Peu subsidiaries.
Peter RS Thomas (68)CA(SA)
Investeccommittees: DLC audit, Investec plc audit, Investec Limited group audit, DLC board risk and capital, DLC nominations and directors’ affairs, DLC social and ethics and global creditAppointed to the board in June 1981
Peter was the former managing director of The Unisec Group Limited.
Currentdirectorships:Investec Bank Limited, various Investec companies, JCI Limited and various unlisted companies.
Details of the board members of our major subsidiaries are available on our website.
Directorate Investec plc and Investec Limited (continued)

3
Investec integrated annual review and summary financial statements 201370
Risk m
anagement and
corporate governance
Sustainability
Just as relevant as our business accomplishments is the manner in which we conduct ourselves in attaining them. Our sustainability goals reflect our culture of continuous advancement and reaffirm our belief that sustainability in its broadest sense is about managing and positioning the group for the long term. Investec’s sustainability philosophy is based on the recognition that we are a specialist bank and asset manager driven by our commitment to our culture and values.
Our philosophy seeks to align the interests of shareholders and stakeholders over time, and provides the individual business units and regions with a basis from which to determine their own approach. The group’s philosophy is not intended to be mutually exclusive, nor exhaustive, but allows us to concentrate, for now, on key focus areas. Deliberately not driven on a top-down basis, the executive maintains responsibility for oversight, direction, coordination and integration of our sustainability efforts while the individual business units provide the principal drivers behind our activities, in a manner that best makes sense to each.
Sustainability at InvestecInvestec’s sustainability focus encompasses endurance and the interdependence of the three key areas of profit, people and planet.
During the period under review, a variety of engagements took place across the group on sustainability issues including presentations on climate change issues, changes in local environmental laws and discussions around materiality. A sustainability management system was designed and implemented to ensure consistent, comprehensive carbon information is captured. We are now in a position to start setting measurable targets.
Investec maintained its inclusion in the JSE SRI Index, the FTSE4Good Index, the Dow Jones Sustainability Index and the Carbon Disclosure Project.
Sustainability at Investec
Financial strength and resilience (of the business and the economy)• Balanced and resilient
business model
Risk management and compliance• Strong risk
consciousness• Responsible
banking practices• Responsible lending
and investing
Governance • Strong culture and
values to underpin our processes, functions and structures
Internal employees:• Strong, diverse and
capable workforce• Provide a progressive
work environment
Engage | Develop | Retain
External CSI initiatives:• Education
• Entrepreneurship• Environment
Internal• Reduce operational impacts
External• Embed environmental
considerations into business activities
Profit
Planet Energy | Water | Waste
People
Asset Management
Wealth & Investment
Specialist Banking
Guided by our purpose to create sustained long-term wealth, we seek to be a positive influence in all our core businesses and in each of the societies in which we operate.
We do this by empowering communities through entrepreneurship and education and leveraging the value in our diversity. We recognise the challenges that climate change presents to the global economy and we will consider supporting any meaningful activity that either reduces the negative impact on, or prolongs the life of, our planet.
Our sustainability philosophy
Sustainability at Investec is about:• Managingandpositioningthe
groupforthelongterm
• BuildingasustainablebusinessmodelthatallowsInvestectomakeavaluablecontributiontosociety,tomacro-economicstabilityandtoourenvironment
• Developingastrong,diverseandcapableworkforce
• Growingandpreservingclients’andstakeholders’wealthbasedonstrongrelationshipsoftrust.
Sustainable business practices…

3
Remunerationreport
4

44
Investec integrated annual review and summary financial statements 201372
Rem
uneration report
Remuneration report
Statement from the acting chair of the board remuneration committee
Key messagesMy predecessor and the joint chairmen met with shareholders last year to discuss remuneration arrangements for Investec's executive directors. Our shareholders told us that they wanted to see more transparency in remuneration arrangements at Investec and a clear link between pay and performance. Since then we have worked with our advisers and the executive directors at Investec to meet shareholders’ requirements. We believe that we have developed a comprehensive and credible response to shareholders’ concerns and following a period of shareholder consultation the final incentive scheme proposals and proposed long-term incentive awards will be set out in a separate shareholder circular on remuneration together with a resolution seeking shareholders’ approval of a new Investec plc Executive Incentive Plan. The resolution will be considered at a general meeting to be held on 8 August 2013 following the Investec annual general meeting.
New regulation in the UK which will flow later this year from the Capital Requirements Directive IV (CRD IV) in relation to variable pay is likely to further constrain the remuneration committee's options for creating remuneration arrangements which properly balance the interests of all stakeholders. Requirements likely to follow from the Department for Business Innovation and Skills (BIS) in relation to disclosure requirements for directors’ pay and new voting arrangements, including binding votes on remuneration policy, will most likely cause us to engage more with shareholders on remuneration matters. Addressing both issues, which is likely to require re-working of our remuneration arrangements for all UK Prudential Regulatory Authority (PRA) Code staff, including executive directors, and re-working of our remuneration reports, as well as re-thinking our approach to engaging with shareholders, all in the same reporting period is likely to prove challenging.
Executive director remuneration arrangementsIncentiveschemes: In designing short- and long-term incentive schemes for the chief
The remuneration report was prepared by the remuneration committee and approved by the board.
executive, managing director and group risk and finance director, we have: identified financial and non-financial performance measures which reflect the interests of all stakeholders; established weightings for the different measures which correspond with their importance to short- and long-term performance; set an overall quantum of reward which reflects our South African as well as our non-South African operations; and framed the schemes so as to get the right balance between a formulaic and a discretionary approach.
We have thought carefully about the effect of our incentives on motivation and behaviours not only for Investec’s current senior management but also for the next generation. We are proposing to move to a more prescriptive and formulaic basis for determining variable remuneration, closely linking remuneration with performance, albeit with a significant element of overarching discretion. Regulatory rules which require deferral of variable remuneration, with a portion being deferred in shares, and arrangements for clawback all add to the complexity. Full details will be set out in the shareholder circular on remuneration.
Proposedawards:All long-term incentive awards granted to the chief executive, managing director and group risk and finance director have lapsed unvested. We were unable to make an award last year under the old Share Matching Plan as the performance conditions attached to that plan were no longer acceptable to the UK regulator. As a consequence, these executive directors currently have no interest in any long-term incentive schemes. This lack of alignment with shareholders’ long-term interests is a matter of concern which the remuneration committee and board consider should be rectified.
It is intended that share awards will be made to executive directors at the discretion of the committee, on an annual basis. Further details will be contained in the shareholder circular on remuneration accompanying the notice of general meeting. As mentioned above, the committee was not able to make any long-term awards last year. The last time that any awards were made was in 2010. These awards have lapsed having failed to meet the performance conditions set for them on grant. If approved at the extraordinary general meeting, awards under the 2013 long-term incentive plan will vest in 2017 and annually thereafter but only if performance conditions have been met.

44
73Investec integrated annual review and summary financial statements 2013
Rem
uneration report
Remuneration report (continued)
Salariesandbenefits:We are proposing no changes to the salary and benefits of the chief executive officer, managing director and the chief executive officer of Investec Asset Management all of whose salaries are based in Pounds Sterling. The group risk and finance director, whose salary is based in Rand, received an inflationary salary adjustment.
Review of the 2013 financial yearKey points to note for the period under review include:
• Groupperformance:
– Operating profit before goodwill, acquired intangibles, non-operating items and after non-controlling interests increased 20.8% to £433.2 million
– Adjusted earnings per share increased 16.4% to 37 pence
– Dividends per share increased 5.9% to 18 pence
– Return on equity increased to 9.5% (2012: 7.8%)
– Recurring income as a % of total operating income increased to 68.6% (2012: 67.7%)
– Return on average risk weighted assets increased to 1.09% (2012: 0.91%)
– Core capital and liquidity ratios remain sound
– Our total shareholder return was 24.6% for Investec plc in Pounds Sterling and 41.2% for Investec Limited in Rand. This compares to a return of 29.7% for the FTSE 350 General Finance Index. Since listing on the London Stock Exchange in 2002, Investec plc has outperformed the FTSE 350 General Finance Index
Refer to graph on page 85.
• AssetManagementperformance:
– Operating profit before goodwill, acquired intangibles, non-operating items and after non-controlling interests increased 4.8% to £140.2 million, contributing 32.4% to group profit
– Assets under management increased 13.4% to £69.8 billion with net new flows of £4.1 billion.
• Total staff compensation ratios are as follows:
– T otal for the group: 43.7% (2012: 43.0%)
– Asset Management: 46.1% (2012: 45.9%)
– Wealth & Investment: 55.6% (2012: 57.2%)
– Specialist Banking: 40.8% (2012: 40.2%)
• Annualbonusforexecutivedirectors:In light of the positive financial performance of the group in 2013 and after consideration of progress across a range of non-financial measures, the remuneration committee approved an annual bonus of £1.5 million for each of Stephen Koseff, Bernard Kantor and Glynn Burger and £4.4 million for Hendrik du Toit. A total of £3.1 million is to be received up front in cash and £5.8 million deferred.
• Non-executivedirectors: The board approved a modest increase in fees for the forthcoming year, roughly in line with inflation.
• Remunerationgovernance: After nine years of service as chair of the remuneration committee, George Alford stepped down at year end and I was appointed acting chair of the remuneration committee. Shortly thereafter, Bradley Fried was appointed to serve on the remuneration committee. Bradley is not an independent director because he served as the chief executive officer of Investec Bank plc for a period to March 2010. We consider that Bradley’s knowledge and experience of the group is deemed to be beneficial to the workings of this committee and is believed to be in the best interests of shareholders. During the year PricewaterhouseCoopers were additionally appointed as advisers to the company in relation to the executive directors’ incentive schemes and more recently the implications of CRD IV. New Bridge Street continue to advise the remuneration committee.
Agenda for the 2014 financial year
ImpactofEuropeandirectives: Investec will be impacted by the changing regulatory requirements in the UK and the Specialist
Bank will need to meet the challenges imposed by CRD IV when it is finalised. The PRA is expected to publish a consultation paper on implementation shortly. It is widely expected that these regulations will limit the quantum of variable remuneration (including the value of long-term incentive awards) to ‘one times’ the level of fixed remuneration, or ‘two times’ fixed remuneration if shareholders pass a resolution approving this. These changes are expected to be effective some time in 2014, possibly as early as 1 January.
We will be asking shareholders to support the proposed arrangements for the group’s 2014 financial year which is likely to be the last year in which these proposals are acceptable under UK regulations. We are following regulatory and market developments closely and expect to have to again consult with shareholders in early 2014 on amended remuneration arrangements for the group’s 2015 financial year. Unfortunately, it appears that we may be forced to increase the fixed pay element of compensation in order to be able to comply with the new regulations. We will take advice and work with senior executives to do this in a way which best serves the interests of the group and all its stakeholders.
We will also need to work through the implications of the Undertakings for the Collective Investment of Transferable Securities Directive V (UCITS)V and, to a lesser extent, Alternative Investment Fund Managers Directive (AIFMD) for Investec Asset Management and approve changes to IAM’s remuneration policy where necessary.
Remunerationreporting:In the UK, the BIS has been consulting on significant changes to the way directors’ remuneration is disclosed in this report and how shareholders are to be able to exert greater influence over the decisions taken in listed UK companies. We have been monitoring these developments and have adopted a number of the new rules in this report, a year before they are required to be complied with. The greatest changes will, however, be seen in next year’s report.
Remunerationpolicy:As reported last year, there were certain contractual arrangements among the firms that we acquired in 2011 which fell below best practice and are outside our preferred conditions of employment. We have received assurances that these will be phased out in the coming financial year.

44
Investec integrated annual review and summary financial statements 201374
Rem
uneration report
Remuneration report (continued)
Remuneration philosophy, principles and policy
Remuneration philosophyOur philosophy, which remains unchanged from prior years, is to employ the highest calibre individuals, who are characterised by integrity, intellect and innovation and who adhere and subscribe to our culture, values and philosophies. We strive to inspire entrepreneurship by providing a working environment that stimulates extraordinary performance, so that executive directors and employees may be positive contributors to our clients, their communities and the group.
We reward executive directors and employees for their contribution through:
• An annual gross remuneration package (base salary and benefits) providing an industry competitive package
• A variable short-term incentive related to performance (annual bonus)
• A long-term incentive plan (share awards) providing long-term equity participation.
We consider the aggregate of the above as the overall remuneration package designed to attract, retain, incentivise and drive the behaviour of our employees over the short, medium and longer term in a risk conscious manner. Overall, rewards are considered as important as our core values of work content (greater responsibility, variety of work and high level of challenge) and work affiliation (entrepreneurial feel to the company and unique culture) in the attraction, retention and motivation of employees.
We have a strong entrepreneurial, merit- and values-based culture, characterised by passion, energy and stamina. The ability to live and perpetuate our culture and values in the pursuit of excellence in a regulated industry and within an effective risk management environment is considered paramount in determining overall reward levels.
The type of people the organisation attracts, and the culture and environment within which they work, remain crucial in determining our success and long-term progress. Our reward programmes are clear and transparent, designed and administered to align directors’ and
employees’ interests with those of all stakeholders and ensure the group’s short-, medium- and long-term success.
In summary, we recognise that financial institutions have to distribute the return from their enterprises between the suppliers of capital and labour and the societies in which they do business, the latter through taxation and corporate social responsibility activities. Our group-wide remuneration philosophy seeks to maintain an appropriate balance between the interests of these stakeholders, and is closely aligned to our culture and values which include risk consciousness, meritocracy, material employee ownership and an unselfish contribution to colleagues, clients and society.
A value added statement is included on page 9.
Remuneration principlesRemuneration policies, procedures and practices, collectively referred to as the ‘remuneration policy’ are designed, in normal market conditions, to:
• Be in line with the business strategy, objectives, values and long-term interests of the Investec group
• Be consistent with, and promote, sound and effective risk management, and not encourage risk taking that exceeds the level of tolerated risk of the Investec group
• Ensure that payment of variable remuneration does not limit the Investec group’s ability to maintain or strengthen its capital base
• Target gross remuneration (base salary and benefits including pension) at median market levels to contain fixed costs
• Ensure that variable remuneration is largely economic value added (EVA)-based and underpinned by our pre-determined risk appetite and capital allocation
• Facilitate alignment with shareholders through deferral of a portion of short-term incentives into shares and long-term incentive share awards
• Target total compensation (base salary, benefits and incentives) to the relevant competitive market at upper quartile levels for superior performance.
Given our stance on the fixed cost component of remuneration, our
ConclusionThe board and remuneration committee are grateful to George Alford for his careful and skillful discharge of his onerous responsibilities over a long period which saw tremendous growth in Investec's business in both scale and complexity and during which the regulatory environment in which the remuneration committee operated became considerably more demanding – a trend which looks set to continue.
The executive director incentive scheme proposals are the subject of shareholder consultation and will be set out in a separate circular and I will not attempt to summarise those proposals here. Suffice to say that I trust that stakeholders will acknowledge the considerable effort which has been expended this year to respond to feedback from shareholders and design incentive schemes for our executive directors which are transparent and which fully reflect and balance the different interests of all our stakeholders.
The committee unanimously recommends that you vote to approve this report at the 2013 annual general meeting.
Signed on behalf of the board
OliviaCDicksonActing chairRemuneration committee
11 June 2013
44
75Investec integrated annual review and summary financial statements 2013
Rem
uneration report
Remuneration report (continued)
commitment to inspiring an entrepreneurial culture, and our risk-adjusted return on capital approach to EVA, we do not apply an upper limit on variable rewards.
The fixed cost component of remuneration is, however, designed to be sufficient so that employees do not become dependent on their variable compensation as we are contractually (and do not consider ourselves morally) bound to make variable remuneration awards.
In addition, we operate a fully flexible incentive policy and are not contractually bound to make incentive awards. Investec has the ability to pay no annual bonuses and make no long-term incentive awards should the performance of the group or individual employees require this.
We do not pay remuneration through vehicles that facilitate avoidance of applicable laws and regulations.
Furthermore, employees must undertake not to use any personal hedging strategies or remuneration or liability-related contracts of insurance to undermine the risk alignment effects embedded in their remuneration arrangements. Group Compliance maintains arrangements designed to ensure that employees comply with this policy.
No individual is involved in the determination of his/her own remuneration rewards and specific internal controls and processes are in place to prevent conflicts of interest between Investec and its clients from occurring and posing a risk to the group on prudential grounds.
Remuneration policyAll remuneration payable (salary, benefits and incentives) is assessed at a group, business unit and individual level. This framework seeks to balance both financial and non-financial measures of performance to ensure that the appropriate factors are considered prior to making awards, and that the appropriate mix of cash and share-based awards are made.
Determination of remuneration levels
Qualitative and quantitative considerations form an integral part of the determination of overall levels of remuneration and total compensation for each individual.
Factors considered for overall levels of remuneration at the level of the group include:
• Financial measures of performance
– Risk-adjusted EVA model
– Affordability
• Non-financial measures of performance of:
– Market context
– Specific input from the group risk and compliance functions.
Factors considered to determine total compensation for each individual include:
• Financial measures of performance
– Achievement of individual targets and objectives
– Scope of responsibility and individual contributions
• Non-financial measures of performance
– Alignment and adherence to our culture and values
– The level of cooperation and collaboration fostered
– Development of self and others
– Attitude displayed towards risk consciousness and effective risk management
– Adherence to internal controls procedures
– Compliance with the group’s regulatory requirements and relevant policies and procedures, including treating customers fairly
– The ability to grow and develop markets and client relationships
– Multi-year contribution to performance and brand building
– Long-term sustained performance
– Specific input from the group risk and compliance functions
– Attitude and contribution to sustainability principles and initiatives.
Remuneration levels are targeted to be commercially competitive, on the following basis:
• The most relevant competitive reference points for remuneration levels are based on the scope of responsibility and individual contributions made
• The committee recognises that we operate an international business and compete with both local and international competitors in each of our markets
• Appropriate benchmark, industry and comparable organisations’ remuneration practices are reviewed regularly
• For executive directors, the remuneration committee benchmarks
against a bespoke peer group comprising: Aberdeen Asset Management, ABSA Group, Alliance Bernstein, Close Brothers Group, FirstRand, Invesco, Jefferies, Julius Baer, Macquarie Group, Man Group, Nedbank Group, Rathbone Brothers, Schroders, Standard Bank Group and Tullett Prebon
• For employees, combinations of firms from the JSE Financial 15 and the FTSE350 General Finance sector have offered the most appropriate benchmarks
• In order to avoid disproportionate packages across areas of the group and between executives, adjustments may be made at any extremes to ensure broad internal consistency. Adjustments may also be made to the competitive positioning of pay components for individuals, in cases where a higher level of investment is needed in order to build or grow or sustain either a business unit or our capability in a geography.
The following section outlines our remuneration policy in more detail for each element of total compensation as it applies to employees. Our remuneration arrangements for executive directors are currently the subject of a consultation with shareholders and will be the subject of a separate shareholder circular.
Gross remuneration: base salary and benefitsSalaries and benefits are reviewed annually and reflect the relative skills and experience of, and contribution made by, the individual. It is the group’s policy to seek to set base salaries and benefits (together known as gross remuneration) at median market levels when compared like for like with peer group companies.
The Human Resources division provides guidelines to business units on recommended salary levels for all employees within the organisation to facilitate the review. These guidelines include a strategic message on how to set salary levels that will aid Investec in meeting its objectives while remaining true to corporate values and incorporate guidance on increasing levels to take account of the change in the cost of living over the year to ensure that salary levels always allow employees to afford a reasonable standard
44
Investec integrated annual review and summary financial statements 201376
Rem
uneration report
Remuneration report (continued)
of living and do not encourage a reliance on variable remuneration.
Advisers are often engaged by either the Human Resources division or the business units to obtain general benchmark information or to benchmark specific positions to ensure that gross remuneration levels are market-driven and competitive so that levels of remuneration do not inhibit our ability to recruit the people we need to develop our business.
Benefits are targeted at competitive levels and are delivered through flexible and tailored packages. Benefits include pension schemes; life, disability and personal accident insurance; medical cover; and other benefits, as dictated by competitive local market practices. Only salaries, not annual bonuses, are pensionable.
Variable short-term incentive: annual bonusAll employees are eligible to be considered for a discretionary annual bonus, subject inter alia to the factors set out above in the section dealing with the determination of remuneration levels. The structure of short- term incentives varies between employees of our three operating divisions; Asset Management, Wealth & Investment and the Specialist Bank. This reflects differing regulatory requirements on the different legal entities and also differing competitive pressures in each distinct market.
Specialist Banking: variable short-term incentivesRisk-weighted returns form basis for variable remuneration levels
Group Risk Management is independent from the business units and monitors, manages and reports on the group’s risk to ensure it is within the stated risk appetite as mandated by the board of directors through the board risk and capital committee (BRCC). The group monitors and controls risk exposure through credit, market, liquidity, operational and legal risk divisions/forums/committees.
Risk consciousness and management is embedded in the organisational culture from the initiation of transactional activity through to the monitoring of adherence to mandates and limits and throughout everything we do.
The BRCC (comprising both executive and non-executive directors) meets six times
per annum and sets the overall risk appetite for the Investec group and determines the categories of risk, the specific types of risks and the extent of such risks which the group should undertake, as well as the mitigation of risks and overall capital management and allocation process. Senior members of the group’s risk management teams who provide information for the meeting packs and present and contribute to the committee’s discussions, attend these meetings.
The capital committee is a sub-committee of the BRCC and provides detailed input into the group’s identification, quantification and measurement of its capital requirements taking into account the capital requirements of the banking regulators. It determines the amount of internal capital that the group should hold and its minimum liquidity requirements taking into account all the associated risks plus a buffer for any future or unidentified risks. This measure of internal capital forms part of the basis for determining the variable remuneration pools of the various operating business units (as discussed above).
The executive risk review forum (ERRF), comprising members of the executive and the heads of the various risk functions, meets weekly. Its responsibilities include approving limits and mandates, ensuring these are adhered to and that agreed recommendations to mitigate risk are implemented.
The group’s central credit and risk forums provide transaction approval independent of the business unit on a deal-by-deal basis and the riskiness of business undertaken is therefore evaluated and approved at initiation of the business through deal forum, investment committee and ERRF and is reviewed and ratified at ERRF on a regular basis. These central forums provide a level of risk management by ensuring that risk appetite and various limits are being adhered to and that an appropriate interest rate and by implication, risk premium is built into every approved transaction. The approval of transactions by these independent central forums thus ensures that every transaction undertaken by the group results in a contribution to profit that has already been subject to some risk adjustment.
Our EVA model as described in detail below is principally applied to realised profits against pre-determined targets above risk and capital weighted returns. In terms of the EVA structure, capital is allocated based on risk and therefore the higher the risk, the
higher the capital allocation and the higher the hurdle return rate required. This model ensures that risk and capital management are embedded in key processes at both a group and transaction level which form the basis of the group's performance related variable remuneration model thus balancing the interests of all stakeholders.
Further, both the risk and compliance functions are also embedded in the operating business units and are subject to review by the internal audit and compliance monitoring teams. The risk and compliance functions also provide, on an exception only basis, information relating to the behaviour of individuals and business areas if there has been evidence of non-compliance or behaviour which gives rise to concerns regarding the riskiness of business undertaken.
EVA model: allocation of performance related bonus pool
Our business strategy and associated risk appetite, together with effective capital utilisation, underpin the EVA annual bonus allocation model.
Business units share in the annual bonus pool to the extent that they have generated a realised return on their allocated risk-adjusted capital base in excess of their target return on equity. Many of the potential future risks that the firm may face are avoided through ensuring that the bonus pools are based on actual realised risk-adjusted profits.
The bonus pools for non-operating business units (central services and head office functions) are generated by a levy payable by each operating business on its operating profit. This bonus pool may, in some years, be supplemented by a discretionary allocation as determined by the chief executive officer and managing director, and agreed by the remuneration committee.
Our EVA model has been consistently applied for a period in excess of 10 years and encompasses the following elements:
• The profitability of each operating business unit is determined as if they are a stand-alone business. Gross revenue is determined based on the activity of the business, with arm’s length pricing applicable to inter-segment activity. Profits are determined as follows:
– Realised gross revenue (net margin and other income)
– Less: Funding costs

44
77Investec integrated annual review and summary financial statements 2013
Rem
uneration report
Remuneration report (continued)
– Less: Impairments for bad debts
– Add back: Debt coupon or preference share dividends paid out of the business (where applicable)
– Less: Direct operating costs (personnel, systems, etc)
– Less: Group allocated costs and residual charges (certain independent group functions are provided on a centralised basis, with an allocation model applied to charge out costs incurred to business units. Costs allocated are based on the full operational costs for the particular central service area, inclusive of the variable remuneration cost of the central service. Allocation methodologies generally use cost drivers as the basis of allocation)
– Less: Profits earned on retained earnings and statutory held capital
– Add: Notional profit paid by centre on internal allocated capital
– Equals: net profits
• Capital allocated is a function of both regulatory and internal capital requirements, the risk assumed within the business and our overall business strategy
• The group has always held capital in excess of minimum regulatory requirements, and this principle is perpetuated in our internal capital allocation process. This process ensures that risk and capital discipline is embedded at the level of deal initiation and incorporates independent approval (outside of the business unit) of transactions by the various risk and credit committees
• Internal capital comprises the regulatory capital requirement taking into account a number of specified risks plus a capital buffer which caters, inter alia, for any unspecified or future risks not specifically identified in the capital planning process. The Investec group then ensures that it actually holds capital in excess of this level of internal capital
• Internal capital is allocated to each business unit via a comprehensive analysis of the risks inherent within that business and an assessment of the costs of those risks
• Hurdle rates or targeted returns are determined for each business unit
based on the weighted average cost of capital (plus a buffer for trading businesses to take into account additional risks not identified in the capital allocation process) applied to internal capital
• Targeted returns differ by business unit reflecting the competitive economics and shareholder expectation for the specific area of the business, and are set with reference to the degree of risk and the competitive benchmarks for each product line
• In essence varying levels of return are required for each business unit reflecting the state of market maturity, country of operation, risk, capital invested (capital intensive businesses) or expected expense base (fee-based businesses)
• Growth in profitability over time will result in an increasing bonus pool, as long as it is not achieved at the expense of capital efficiency
• Target returns must be reflective of the inherent risk assumed in the business. Thus, an increase in absolute profitability does not automatically result in an increase in the annual bonus pool. This approach allows us to embed risk and capital discipline in our business processes. These targets are subject to annual review
• The group’s credit and risk forums provide transaction approval independent of the business unit on a deal-by-deal basis adding a level of risk consciousness to the predetermined (and risk-adjusted) capital allocation and required hurdle rates and thus ensure that each transaction generates a return that is commensurate with its associated risk profile.
In terms of our EVA process, if business and individual performance goals are exceeded, the variable element of the total remuneration package is likely to be substantially higher than the relevant target benchmark. This ensures that overall remuneration levels have the potential to be positioned at the upper quartile level for superior performance, in line with our overarching remuneration policy.
In circumstances where an operating business unit does not have an EVA pool (e.g. when it incurs a loss or when it is a start-up), the chief executive officer and managing director may consider
a discretionary allocation to allow for a modest bonus for those staff who were expected to contribute to the longer-term interests of that business unit or the group, despite the lack of EVA profits in the short term, e.g. control functions, support staff and key business staff.
It should be noted the salaries and proposed bonuses for employees responsible for risk, internal audit and compliance are not based on a formulaic approach and are independent of any revenues or profits generated by the business units where they work. The level of rewards for these employees are assessed against the overall financial performance of the group; objectives based on their function; and compliance with the various non-financial aspects referred to above.
Key elements of the bonus allocation process are set out below:
• A fixed pre-determined percentage of any return in excess of the EVA hurdle accrues to the business units’ EVA pool
• A portion of the total EVA pool is allocated towards the bonus pool for central service and head office employees
• These bonus pools are reviewed regularly by the appropriate management and non-executive committees to ensure that awards are only paid when it is appropriate to do so, considering firm-wide performance against non-financial risk (both current and future) and compliance-based objectives and in order to ensure that the payment of such discretionary bonuses does not inhibit the group’s ability to maintain/raise its capital levels. All users of capital operate within a strict philosophical framework that requires a balancing of risk and reward and that is designed to encourage behaviour in the interests of all stakeholders as opposed to just employees
• The EVA pools are calculated centrally by the group’s finance function and subject to audit as part of the year-end audit process
• Once the annual audit is complete, line managers in each business unit will make discretionary bonus recommendations for each team member taking into consideration qualitative and quantitative criteria (as mentioned above)
44
Investec integrated annual review and summary financial statements 201378
Rem
uneration report
Remuneration report (continued)
• Bonus recommendations are then subject to an extensive geographic review involving Human Resources, local management and local remuneration committees
• Thereafter, these recommendations are subject to a global review by executive management, before the remuneration committee review and approval process.
The group remuneration committee specifically reviews and approves the individual remuneration packages of the executive directors, persons discharging managerial responsibilities, and PRA Code staff. The committee also reviews the salaries and performance bonuses awarded to a number of other senior and higher paid employees across the group. In addition, the committee specifically reviews and approves the salaries and performance bonuses awarded to each employee within the internal audit, compliance and risk functions, both in the business units and in the central functions, ensuring that such packages are competitive and are determined independently of the other business areas. In making these decisions the committee relies on a combination of external advice and supporting information prepared internally by the group.
Deferral of annual bonus awards – non-UK PRA Code staff within the Specialist Bank
All annual bonus awards exceeding a pre-determined hurdle level are subject to 60% deferral in respect of that portion that exceeds the hurdle level. The entire deferred amount is awarded in the form of forfeitable share awards vesting in three equal tranches at the end of 12 months, 24 months and 36 months. Where shares are being awarded to employees as part of the deferral of performance bonus awards, these are referred to as EVA shares. These awards are made in terms of our existing long-term incentive plans (refer below). The entire amount of the annual bonus that is not deferred is payable up front in cash.
Deferral of annual bonus awards – UK PRA Code staff within the Specialist Bank
• Individual awards to PRA Code staff are determined based on EVA pools in the same manner as is applicable to all staff (as set out above), and subject to the group remuneration policy and governance processes (also set out above)
• Annual bonus awards to directors of the UK Specialist Bank (excluding executive directors who are employees of a separately regulated firm) and all annual bonus awards where total variable remuneration exceeds £500 000 are subject to 60% deferral
• All other annual bonus awards to PRA Code staff are subject to 40% deferral
• The 40% not deferred in the former instance or the 60% not deferred in the latter instance will be awarded as to 50% in cash and 50% in EVA forfeitable shares (up-front EVA forfeitable shares)
• The up-front EVA forfeitable shares will vest immediately but will only be released after a period of six months, which we consider to be an appropriate retention period
• Discretionary bonuses for PRA Code staff who are not exempted by the de minimis rates are subject to 40% deferral (60% if total variable remuneration exceeds £500 000) after taking into account the value of LTIPs granted to each staff member in the applicable financial year and which are included in deferred variable remuneration. The deferred portion of discretionary awards to PRA Code staff will, at the election of the staff member, be made either entirely in the form of EVA forfeitable shares, or 50% in EVA forfeitable shares and 50% in cash
• All deferrals in the form of EVA forfeitable shares (being either 50% or 100% of such deferral) vest in equal amounts at the end of 12 months, 24 months and 36 months and are then subject to an appropriate period of retention, being six months.
Investec Asset Management: variable short-term incentivesInvestec Asset Management (IAM) recognises Investec’s obligation to ensure that all businesses within the group satisfy their obligations under the PRA Remuneration Code. The IAM remuneration committee is responsible for considering, agreeing and overseeing all elements of remuneration and the overall remuneration philosophy, principles and policy of IAM.
IAM operates the following annual bonus schemes which may result in annual payments to employees:
• Annual Discretionary Cash Bonus Scheme (all employees of IAM are
currently eligible to be considered for a cash bonus payment under this scheme)
• Deferred Bonus Plan (participation in this scheme is determined on an annual basis at the discretion of IAM based on the roles of individual employees).
The percentage of profit allocated to the variable remuneration pool has been agreed (at a fixed participation rate) and approved by both the DLC and IAM remuneration committees. The same fixed participation rate has been applied consistently for many years. This structure has been a key contributor to the long-term success of IAM and encourages the staff to behave like owners. We believe in aligning the long-term interests of clients, shareholders and staff.
Individual annual bonus awards are approved by the IAM remuneration committee and reviewed by the DLC remuneration committee annually.
Annual Discretionary Cash Bonus Scheme (ADCBS)
Awards under the ADCBS are payable entirely in cash. The purpose of the cash bonus is to reward behaviour and effort against objectives and values, and retain key employees. The cash bonus pool determination is based on the profitability of IAM only. In principle, there would be no cash bonus payments should IAM be loss making (although this would be reviewed where it was considered that bonus payments were necessary in order to retain staff and protect the business in the long term even if the business had been loss making in the short term).
Management information is provided to the IAM remuneration committee to ensure that IAM’s financial results are put into the context of the risk appetite of the business and the IAM remuneration committee is able to risk-adjust the cash bonus pool should they believe this is required given the risk taken and the overall financial results.
Deferred Bonus Plan (DBOP)
As noted above, participation in the DBOP is determined on an annual basis at the discretion of IAM based on the roles of individual employees. The purpose of the DBOP is both to retain key employees and to provide better alignment of the interests with clients and to manage potential, currently unknown future risks.
The conditions for participation in the DBOP are approved by the IAM remuneration

44
79Investec integrated annual review and summary financial statements 2013
Rem
uneration report
Remuneration report (continued)
committee annually, based on the remuneration requirements in the year being considered. This will take into consideration local market remuneration practices and relevant and required regulations.
The DBOP awards are made in the form of investments into various funds managed by IAM and with specific allocations for the portfolio managers into their own funds. The deferral period is just over three years and awards are only paid out under specific listed conditions. The award does not accrue to the employee until the end of the deferral period and as such both the asset and liability remain on the balance sheet of IAM until that time. Employees forfeit their allocations if they resign or their employment terminates (other than at the discretion of IAM for redundancy, retirement, death or disability) prior to the vesting date.
Payments can only be made to participants prior to a scheduled vesting date with the consent of the IAM executive committee and ultimately by the IAM remuneration committee.
IAM’s governance processes, operating within the context of the broader Investec group’s processes, ensure robust oversight of reward and effective management of any potential conflicts of interest whilst reflecting the need to link remuneration decisions with IAM’s risk appetite.
The head of the IAM risk committee assesses the risk appetite, risk tolerance level and risk management for IAM and feeds her views into the remuneration decision making process, including sending a risk report to the IAM remuneration committee for consideration when making remuneration decisions.
In addition, IAM Human Resources and Compliance are responsible for ensuring that the IAM remuneration committee takes into consideration financial and non-financial criteria, risk and compliance reports, and any other relevant information in making decisions around remuneration.
The primary determinant of the variable compensation pool available for distribution is IAM’s own annual profit. There is an annual budget against which the business is measured.
The variable compensation pool is allocated to business divisions and then to individuals based on divisional performance and the individual’s performance. This ensures that staff are rewarded appropriately for meeting
their objectives and keeping within the values of the business.
The oversight of conflicts of interest and the link between risk and reward is achieved through a combination of effective remuneration components, designed to incorporate risk and of the dual operation of the DLC remuneration committee and IAM remuneration committee in ensuring appropriate and, where necessary, independent oversight of both remuneration policy and outcomes.
Investec Wealth & Investment other than in South Africa: variable short-term incentivesInvestec Wealth & Investment (IW&I) recognises Investec’s obligation to ensure that all businesses within the group satisfy their obligations under the PRA Remuneration Code. IW&I recognises that the policy, procedures and practices it has adopted should not conflict with the group’s obligations under the PRA Remuneration Code. The IW&I remuneration committee is responsible for considering, agreeing and overseeing all elements of remuneration and the overall remuneration philosophy and policy of IW&I within the context of the Investec group’s agreed remuneration philosophy and policy.
IW&I operates the following variable performance bonus schemes which may result in annual payments to employees:
• Discretionary Incentive Scheme (relating to staff in client facing roles and administration staff who support them directly)
• Discretionary Bonus Scheme (relating to staff in non-client facing support functions)
• Additional New Business Incentive Scheme (relating to staff primarily in client facing roles who are direct generators of income).
Awards under each of the three schemes above are payable entirely in cash and do not attract employer pension contributions. In the case of the Discretionary Incentive Scheme and the Discretionary Bonus Scheme, the award may be paid directly to the individual (subject to the deduction of PAYE and NIC) or, at IW&I’s discretion, as an additional pension contribution.
All employees are eligible to be considered for an annual discretionary award under
one of the above schemes. Awards relate to financial years ending 31 March each year. An interim payment on account of the annual award is considered at the half-year stage.
Value adjustments that are considered appropriate as a result of an individual’s level of non-financial performance being below that expected by the business are made entirely to the discretionary incentive scheme or discretionary bonus scheme award of the employee concerned.
Where an IW&I executive director undertakes a role that is primarily client facing in a specific business unit, that director may also be eligible to participate in the incentive schemes of the relevant business unit. Such schemes comprise two elements:
• The first element is a bonus pool which is calculated based on a formula that is directly related to the profitability of the business unit. The entire bonus pool, which is not subject to an upper limit, is distributed to the employees of the business unit on a discretionary basis. A proportion of the annual discretionary bonus payable to such executive directors may be awarded as a pension contribution, at the discretion of the committee
• The second element rewards participating employees on an individual basis for new business that is gained and then retained for a period of three years following the end of the year in which the new business is gained. The amount payable is based on a formula which is directly related to the income generated as a result of the new business and is not subject to an upper limit. All awards under this scheme are cash awards. This latter scheme represents a long-term incentive scheme in accordance with the regulations and amounts earned and paid under this scheme are separately disclosed in the financial statements of IW&I.
Investec Wealth & Investment: South Africa variable short-term incentives
As there are no overriding regulatory requirements applicable to the business, the policies applicable to the Specialist Bank are applied to this business unit as set out on pages 76 to 78.

44
Investec integrated annual review and summary financial statements 201380
Rem
uneration report
Remuneration report (continued)
Other information on deferred awards and clawback provisions within the group Employees who leave the employment of Investec prior to vesting of these deferred awards will lose their EVA forfeitable shares other than as a result of retirement, subject to the group’s normal good leaver provisions and approval process in exceptional cases.
The deferred share awards are subject to clawback of unpaid EVA. The assessment of whether any clawback should be made to an individual’s unvested award will be undertaken within the following framework:
• Where there is reasonable evidence of employee misbehaviour
• Where the firm or operating business unit suffers a material downturn in its financial performance
• Where the firm or business unit suffers a material failure of risk management.
In these cases, management and the remuneration committee will take into account the following factors in determining the extent (if any) to which the quantum of deferred awards should be subject to clawback:
• The extent to which the individual had control over the outcome
• Failure of internal control systems
• The impact of the risk profile of the relevant member of the group or business unit
• Any violation of the group’s culture and values
• The long-term impact of the outcome on the group or relevant business unit
• External factors including market conditions
• Any other relevant factors.
Specifically for EVA share awards, where profits used to determine the original EVA bonus are materially reduced after the bonus determination, the awards will be recalculated for such reduction and consideration given to clawback (if any) to the extent that the prior period’s EVA pool is reduced and the extent to which it affected each employee.
Long-term incentive: share awardsWe have a number of share option and long-term share incentive plans that are designed to align the interests of employees with those of shareholders and long-term organisational interests, and to build material share ownership over the long term through share awards. These share option and incentive plans are also used in appropriate circumstances as a retention mechanism for key talent.
Awards are made in the form of nil cost options other than for countries where the taxation of such awards is penal. In these cases awards are made in the form of forfeitable shares, conditional awards or market strike options.
In principle all employees are eligible for long-term incentives. Awards are considered by the remuneration committee and made only in the 42-day period following the release of our interim or final financial results in accordance with the Association of British Insurers (ABI) guidelines. These awards comprise three elements, namely:
• ‘New starter’ awards are made based on a de facto non-discretionary basis using an allocation table linked to salary levels
• ‘General allocation’ awards are also de facto non-discretionary awards of the same quantum as new starter awards and are made to employees who have not had any other share award in a three year period
• ‘Top up’ awards are made at the discretion of line management primarily to ensure multi-year performance and long-term value generation.
All proposed long-term incentive awards (LTIPs) are recommended by business unit management, approved by the staff share executive committee and then the remuneration committee before being awarded. Awards of Investec plc LTIPs are made to employees of Investec plc and awards of Investec Limited LTIPs for employees of Investec Limited. AT IAM, LTIP awards are only generally considered for employees who do not participate in the DBOP.
LTIP awards for non-PRA Code Staff are subject to 75% vesting at the end of four years and the final 25% at the end of the fifth year, which we believe is appropriate for our business requirements. LTIP awards to PRA Code Staff are subject to 75% vesting at the end of three and a half years and the final 25% at the end of four and a half years, and are then subject to a six-month retention period. The awards are forfeited on termination, but ‘good leaver’ discretion is applied in exceptional circumstances.
Retention is addressed through the long-term nature of awards granted which provides an element of ‘lock-in’ for employees throughout the vesting period and allows for multi-year contribution to performance and brand building.
Investec's share option and long-term incentive plans are summarised below and include: our current long-term incentive plans and several plans that are no longer used (including those relevant to executive directors), or which were introduced prior to the implementation of the DLC structure. Some of these plans still have outstanding awards.
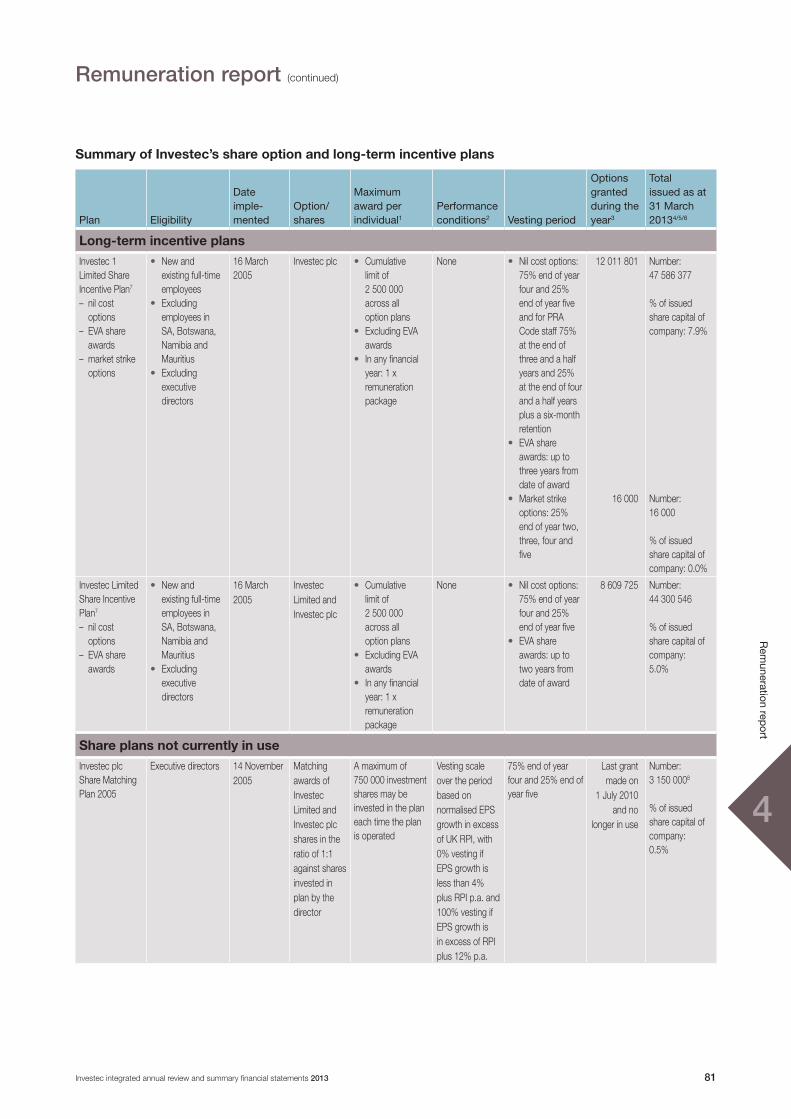
44
81Investec integrated annual review and summary financial statements 2013
Rem
uneration report
Remuneration report (continued)
Summary of Investec’s share option and long-term incentive plans
Plan Eligibility
Dateimple-mented
Option/shares
Maximumawardperindividual1
Performanceconditions2 Vestingperiod
Optionsgrantedduringtheyear3
Totalissuedasat31March20134/5/6
Long-term incentive plansInvestec 1 Limited Share Incentive Plan7 – nil cost
options– EVA share
awards– market strike
options
• New and existing full-time employees
• Excluding employees in SA, Botswana, Namibia and Mauritius
• Excluding executive directors
16 March2005
Investec plc • Cumulative limit of 2 500 000 across all option plans
• Excluding EVA awards
• In any financial year: 1 x remuneration package
None • Nil cost options: 75% end of year four and 25% end of year five and for PRA Code staff 75% at the end of three and a half years and 25% at the end of four and a half years plus a six-month retention
• EVA share awards: up to three years from date of award
• Market strike options: 25% end of year two, three, four and five
12 011 801
16 000
Number: 47 586 377
% of issued share capital of company: 7.9%
Number:16 000
% of issued share capital of company: 0.0%
Investec Limited Share Incentive Plan7 – nil cost
options– EVA share
awards
• New and existing full-time employees in SA, Botswana, Namibia and Mauritius
• Excluding executive directors
16 March2005
Investec Limited and Investec plc
• Cumulative limit of 2 500 000 across all option plans
• Excluding EVA awards
• In any financial year: 1 x remuneration package
None • Nil cost options: 75% end of year four and 25% end of year five
• EVA share awards: up to two years from date of award
8 609 725 Number: 44 300 546
% of issued share capital of company: 5.0%
Share plans not currently in useInvestec plc Share Matching Plan 2005
Executive directors 14 November 2005
Matching awards of Investec Limited and Investec plc shares in the ratio of 1:1 against shares invested in plan by the director
A maximum of 750 000 investment shares may be invested in the plan each time the plan is operated
Vesting scale over the period based on normalised EPS growth in excess of UK RPI, with 0% vesting if EPS growth is less than 4% plus RPI p.a. and 100% vesting if EPS growth is in excess of RPI plus 12% p.a.
75% end of year four and 25% end of year five
Last grant made on
1 July 2010 and no
longer in use
Number: 3 150 0008
% of issued share capital of company: 0.5%
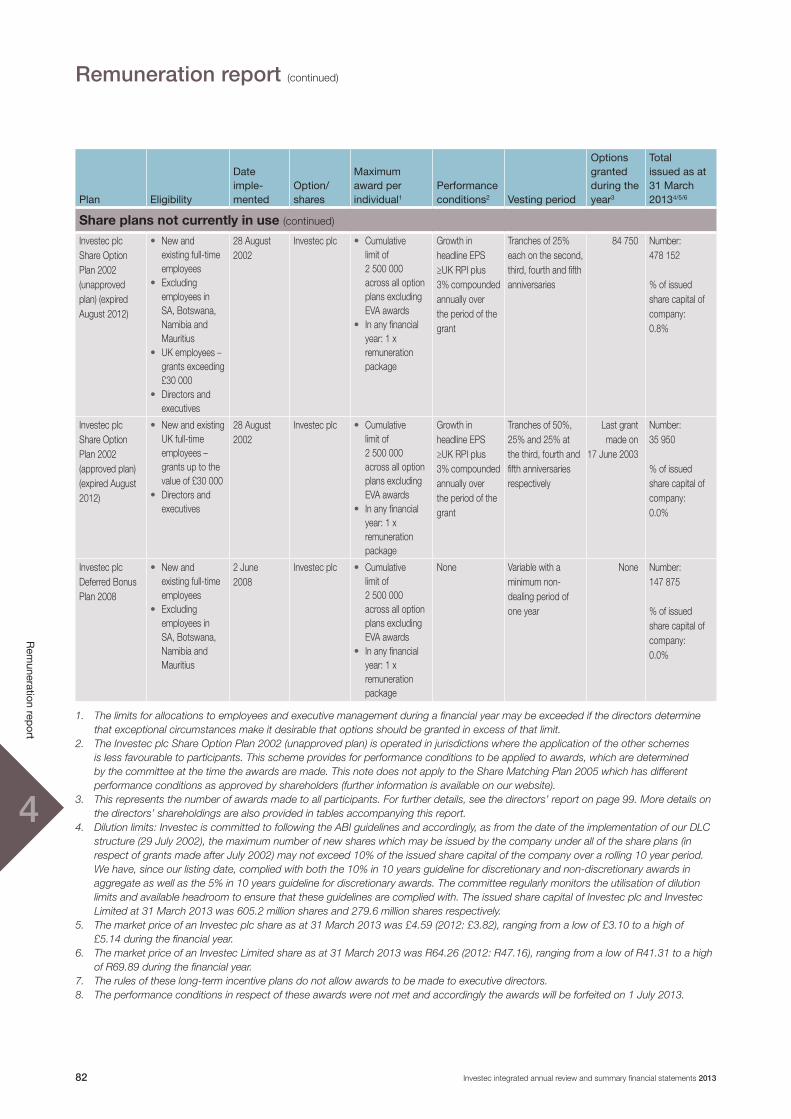
44
Investec integrated annual review and summary financial statements 201382
Rem
uneration report
Remuneration report (continued)
Plan Eligibility
Dateimple-mented
Option/shares
Maximumawardperindividual1
Performanceconditions2 Vestingperiod
Optionsgrantedduringtheyear3
Totalissuedasat31March20134/5/6
Share plans not currently in use (continued)
Investec plc Share Option Plan 2002 (unapproved plan) (expired August 2012)
• New and existing full-time employees
• Excluding employees in SA, Botswana, Namibia and Mauritius
• UK employees – grants exceeding £30 000
• Directors and executives
28 August 2002
Investec plc • Cumulative limit of 2 500 000 across all option plans excluding EVA awards
• In any financial year: 1 x remuneration package
Growth in headline EPS ≥UK RPI plus 3% compounded annually over the period of the grant
Tranches of 25% each on the second, third, fourth and fifth anniversaries
84 750 Number:478 152
% of issued share capital of company: 0.8%
Investec plc Share Option Plan 2002 (approved plan)(expired August 2012)
• New and existing UK full-time employees – grants up to the value of £30 000
• Directors and executives
28 August 2002
Investec plc • Cumulative limit of 2 500 000 across all option plans excluding EVA awards
• In any financial year: 1 x remuneration package
Growth in headline EPS ≥UK RPI plus 3% compounded annually over the period of the grant
Tranches of 50%, 25% and 25% at the third, fourth and fifth anniversaries respectively
Last grant made on
17 June 2003
Number: 35 950
% of issued share capital of company: 0.0%
Investec plc Deferred Bonus Plan 2008
• New and existing full-time employees
• Excluding employees in SA, Botswana, Namibia and Mauritius
2 June 2008
Investec plc • Cumulative limit of 2 500 000 across all option plans excluding EVA awards
• In any financial year: 1 x remuneration package
None Variable with a minimum non- dealing period of one year
None Number: 147 875
% of issued share capital of company: 0.0%
1. The limits for allocations to employees and executive management during a financial year may be exceeded if the directors determine that exceptional circumstances make it desirable that options should be granted in excess of that limit.
2. The Investec plc Share Option Plan 2002 (unapproved plan) is operated in jurisdictions where the application of the other schemes is less favourable to participants. This scheme provides for performance conditions to be applied to awards, which are determined by the committee at the time the awards are made. This note does not apply to the Share Matching Plan 2005 which has different performance conditions as approved by shareholders (further information is available on our website).
3. This represents the number of awards made to all participants. For further details, see the directors’ report on page 99. More details on the directors’ shareholdings are also provided in tables accompanying this report.
4. Dilution limits: Investec is committed to following the ABI guidelines and accordingly, as from the date of the implementation of our DLC structure (29 July 2002), the maximum number of new shares which may be issued by the company under all of the share plans (in respect of grants made after July 2002) may not exceed 10% of the issued share capital of the company over a rolling 10 year period. We have, since our listing date, complied with both the 10% in 10 years guideline for discretionary and non-discretionary awards in aggregate as well as the 5% in 10 years guideline for discretionary awards. The committee regularly monitors the utilisation of dilution limits and available headroom to ensure that these guidelines are complied with. The issued share capital of Investec plc and Investec Limited at 31 March 2013 was 605.2 million shares and 279.6 million shares respectively.
5. The market price of an Investec plc share as at 31 March 2013 was £4.59 (2012: £3.82), ranging from a low of £3.10 to a high of £5.14 during the financial year.
6. The market price of an Investec Limited share as at 31 March 2013 was R64.26 (2012: R47.16), ranging from a low of R41.31 to a high of R69.89 during the financial year.
7. The rules of these long-term incentive plans do not allow awards to be made to executive directors. 8. The performance conditions in respect of these awards were not met and accordingly the awards will be forfeited on 1 July 2013.

44
83Investec integrated annual review and summary financial statements 2013
Rem
uneration report
Remuneration report (continued)
Other remuneration structures
Guaranteed variable remuneration
Guaranteed variable remuneration comprises all forms of remuneration whose value can be determined prior to award. This includes, but is not limited to sign-on, buy-out and guarantee awards. Guaranteed variable awards will not be awarded, paid or provided to any individual within the Investec plc group unless they are:
• Exceptional
• In the context of hiring new staff
• Limited to the first year of service.
The remuneration committee at least annually reviews guaranteed variable remuneration payments and the number of guarantees awarded to ensure that they are only granted in exceptional circumstances.
Retention awards
Investec only pays retention awards to serving staff in exceptional circumstances. In all such cases, Human Resources shall review proposed payments to ensure that they are in line with this policy and any other relevant regulation. Additionally for PRA Code staff, the remuneration committee shall review all proposed awards. Circumstances where Investec plc will consider paying a retention award are in the case of a major restructuring of the company or any subsidiary or one of its business units (for instance in the start-up of a new business line, or the closure of a business line), where the retention of individuals is essential to the completion of the task. A valid business case for the retention of the individual must be presented in order for a retention award to be approved and the PRA should be notified prior to the retention award being made to PRA Code staff, and should consider seeking guidance on the appropriateness of retention awards for certain individuals.
Severance awards
Severance payments by Investec plc or one of its subsidiary companies for the early termination of a contract are at executive management’s absolute discretion and must reflect performance achieved over time and be designed in a way that does not reward failure. Severance payments for PRA Code staff individuals shall be subject to approval by the DLC remuneration committee.
Discretionary extended pension benefits policyAll proposed extended pension payments made to employees upon reaching retirement should be reviewed by the remuneration committee for alignment with appropriate laws, policy and regulation.
Non-executive directors’ remunerationThe board agrees and determines the fees of non-executive directors and the fees are reviewed annually. The board’s policy is that fees should reflect individual responsibilities and membership of board committees. The increase in non-executive directors’ fees for the forthcoming year reflects current market conditions (with the focus on controlling fixed remuneration) and additional time commitment required. Their fee structure covers the dual roles that the directors perform for the UK listed Investec plc and the South African listed Investec Limited boards. The fee structure for non-executive directors for the 2013 and 2014 financial years is shown below:
Non-executivedirectors’remuneration2013financial
year
Asapprovedbytheboardforthe
2014financialyear
Chairman’s total fee £250 000 per year £255 000 per year
Basic non-executive director fee £65 000 per year £67 000 per year
Senior independent director £5 000 per year £5 500 per year
Chairman of the DLC audit committee £55 000 per year £57 000 per year
Chairman of the DLC remuneration committee £37 000 per year £38 000 per year
Member of the DLC audit committee £16 000 per year £16 500 per year
Member of the DLC remuneration committee £14 500 per year £15 000 per year
Member of DLC nominations and directors’ affairs committee £10 500 per year £11 000 per year
Member of the board risk and capital committee £13 000 per year £13 500 per year
Board member in attendance of the board risk and capital committee £10 500 per year £11 000 per year
IBL board member in attendance of the board risk and capital committee R125 000 per year R130 000 per year
Member of the Investec Bank plc board £11 500 per year £12 000 per year
Member of the Investec Bank Limited board R250 000 per year R260 000 per year
Member of the Investec Limited audit committee who is not a DLC audit committee member R120 000 per year R125 000 per year
IBL board member in attendance at the DLC nominations and directors’ affairs committee R68 000 per year R70 000 per year
Fees are also payable for any additional time committed to the group including attendance at certain other meetings.
There is no requirement for non-executive directors to hold shares in a group company. The group has left this choice to the discretion of each non-executive director.

44
Investec integrated annual review and summary financial statements 201384
Rem
uneration report
Remuneration report (continued)
Governance
Compliance and governance statementThe remuneration report complies with the provisions of the UK Corporate Governance Code 2012, section 420 of the UK Companies Act 2006, the UK Financial Conduct Authority listing rules, the PRA Remuneration Code, the South African King III Code of Corporate Practice and Conduct, the South African Companies Act 2008 and the JSE Limited listing requirements.
Scope of our remuneration policyThe Investec group aims to apply remuneration policies to executive directors and employees that are largely consistent across the group, but recognises that certain parts of the group are governed by local regulations that may contain more onerous requirements in certain respects. In those cases, the higher requirements are applied to that part of the group. This is relevant to Investec plc and its subsidiary companies that are subject to the PRA Remuneration Code (as a level 2 organisation as defined therein), and in particular in relation to PRA Code staff. Additionally, where any aspect of our remuneration policy contravenes local laws or regulations, the local laws or regulations shall prevail.
We believe that our remuneration policy is consistent with and complies with the principles and rules of the PRA Remuneration Code in respect of Investec plc and its subsidiary companies. We also believe that this policy is consistent with and complies with the substance of the Financial Stability Board’s Principles for Sound Compensation Practices.
The following Investec plc group entities are separately regulated by the PRA and as such maintain their own remuneration policies separate from the Investec group policy and in line with such entity’s own risk profile and business activities:
• Investec Asset Management Limited
• Investec Wealth & Investment Limited
• Investec Bank plc
• Hargreave Hale Limited.
Under the PRA Remuneration Code, Investec Bank plc is the only group entity which is classified as being level 2. It should
• Review and approve, within the terms of the agreed policy, the total individual remuneration packages of executive directors and executive management including, where appropriate, bonuses, incentive payments and share scheme awards
• Review and approve, within the terms of the agreed policy, the total individual remuneration packages of members of the internal audit, risk and compliance functions
• Oversee any major changes in our employee benefit structures
• Ensure that the comments, recommendations and rules within the UK and South Africa pertaining to remuneration are respected.
The committee is authorised by the board to seek any information it requires from any employee in order to perform its duties.
The committee’s terms of reference are subject to annual review and are available on our website.
Meetings The remuneration committee met 13 times during the financial year. An attendance schedule is provided in the Investec group’s 2013 annual report.
The company secretary of Investec plc acts as the secretary. Executive directors do not attend meetings of the committee, unless invited or required to do so by the chairman of the committee. The chairman of the committee reports on the activities of the committee at each meeting of the full board.
Advisers to the committee and the companyWhere appropriate, the committee has access to independent executive remuneration consultants. The selection of the advisers is at the discretion of the committee chairman, and Investec funds any expenses relating to their appointment.
During the financial year, the committee continued to use the services of its advisers, New Bridge Street, which among other things specifically reviewed and provided information on executive share incentive schemes, industry consultation papers, regulations and developments with respect to remuneration practices and our alignment to them. In addition, they continued to review and provide information
be noted that our Asset Management and Wealth Management businesses have been classified as level 3 entities under the proportionality rules of the PRA Remuneration Code.
Composition and role of the committee
George Alford, after having served on the board and the committee for over nine years, resigned from the committee on 31 March 2013. Olivia Dickson, who has served on the committee for two years, has assumed responsibility as acting chair of the committee for a period of six months. Bradley Fried was appointed as a member of the committee effective from 3 April 2013. Fani Titi attends the meetings as a permanent invitee.
Three of the current members of the committee are deemed to be independent as discussed on page 67.
Members of the committee are also members of the group’s board risk and capital committee and/or audit committee, thus bringing risk and control mechanisms into their deliberations.
The committee’s principal responsibilities and objectives are to:
• Determine, develop and agree with the board, the framework or broad policy for the remuneration of executive directors and executive management (comprising individuals discharging managerial responsibilities, who are the global heads of our core areas of activity and are members of our global operations forum)
• Commission and consider the results of an annual central and internal review of policy implementation
• Ensure that qualified and experienced management and executives are provided with appropriate incentives to encourage enhanced performance and are, in a fair and responsible manner, rewarded for their contribution to the success of the group and alignment with the corporate objectives and business strategy
• Review and approve the design of, and determine targets and objectives for any performance related pay schemes operated by the group and approve the aggregate annual payouts under such schemes

44
85Investec integrated annual review and summary financial statements 2013
Rem
uneration report
Remuneration report (continued)
on appropriate benchmarks, industry and comparable organisations’ remuneration practices. Their recommendations are valued in the ongoing review of our remuneration practices. New Bridge Street is a signatory to the UK Remuneration Consultants Group’s Code of Conduct and does not conduct any material work for the company other than for the committee and is part of Aon plc. The company also retained the services of PricewaterhouseCoopers to assist with the development of executive director incentive arrangements and the implications of various regulatory developments including the CRD IV.
Furthermore, we have used the services of Linklaters, who have advised this year mainly on the creation of a new share plan (Executive Incentive Plan 2013), a number of issues pertaining to our existing incentive plans and aspects of the implementation of the PRA Remuneration Code. Linklaters is one of Investec plc’s legal advisers.
Certain specialist divisions within the group, for example, Human Resources and the Staff Shares Schemes division, provide supporting information and documentation relating to matters that are presented to the committee. This includes, for example, comparative data and motivations for proposed salary, bonus and share awards. The variable remuneration pools are determined by our finance teams taking into account risk-adjusted capital requirements and after eliminating unrealised gains. The employees within these specialist divisions, which provide support to the committee, are not board directors and are not appointed by the committee.
Service contracts and terms of employment
Each executive director is entitled to receive annually gross remuneration comprising a salary and other benefits and is also eligible for an annual bonus, the amount of which will be determined by the remuneration committee. Furthermore, the executive directors may elect to sacrifice a portion of their annual gross remuneration to receive company benefits such as a travel allowance and medical aid.
The full costs of these benefits are deducted from their gross remuneration with the residual then being in effect their basic salary.
Further information is provided on pages 86 and 87.
inclusion based on its market capitalisation at that date. We have included the total shareholder return of that index for illustrative purposes.
The graph below shows the cumulative shareholder return for a holding of our shares (in black) in Pounds Sterling on the LSE, compared with the average total shareholder return of other members of the FTSE 350 General Finance Index and the FTSE 100 Index. It shows that, at 31 March 2013, a hypothetical £100 invested in Investec plc at 31 March 2008 would have generated a total return of £68 compared with a return of £19 if invested in the FTSE 350 General Finance Index and a return of £36 if invested in the FTSE 100 Index. Investec plc has therefore outperformed the FTSE 350 General Finance Index and the FTSE 100 Index over the period.
During the period from 1 April 2012 to 31 March 2013, the return to shareholders of Investec plc (measured in Pounds Sterling) and Investec Limited (measured in Rands) was 24.6% and 41.2%, respectively. This compares to a 29.7% for the FTSE 350 General Finance Index and a return of 13.4% for the FTSE 100 Index.
The market price of our shares on the LSE was £4.59 as at 31 March 2013, ranging from a low of £3.10 to a high of £5.14 during the financial year. Furthermore, the market price of our shares on the JSE Limited was R64.26 as at 31 March 2013, ranging from a low of R41.31 to a high of R69.89 during the financial year.
Executive directors are permitted to accept outside appointments on external boards or committees provided these are not deemed to interfere with the business of the company. Any fees earned by executives in this regard are forfeited to Investec.
Performance graph: total shareholder return
We have implemented a DLC structure, in terms of which we have primary listings in London and Johannesburg. The listing on the London Stock Exchange (LSE) took place on 29 July 2002. We have been listed in South Africa since 1986.
Schedule 8 of the UK Large and Medium-sized Companies and Groups (Accounts and Report) Regulations 2008 requires this report to include a performance graph of Investec plc’s total shareholder return (TSR) performance against that of a broad market index. We found it difficult to locate an appropriate group of companies to benchmark ourselves against because of our specialist activities. A number of companies within the FTSE 350 General Finance Index conduct similar activities to us, although they do not necessarily have the same geographical profile. Nevertheless, to date this has been the most appropriate index against which to measure our performance on the LSE. Towards the end of our 2010 financial year, Investec plc was included as a new entrant into the FTSE 100 Index. Investec plc however, exited this index during December 2011 as it did not qualify for re-
Investec plc (LSE listing) total shareholder return
Total shareholder return of the FTSE350 General Finance index
Total shareholder return of the FTSE100 index
50
200
150
25
0
2008 20122010 2011 2013
100
125
175
2009
Reb
ased
to
100
(val
ue £
)
176
54
108
161
116
168
245 136
118100
92
119
92
7281
100100100
Total shareholder return
Source: Datastream.

44
Investec integrated annual review and summary financial statements 201386
Rem
uneration report
Remuneration report (continued)
Audited information
Directors’ annual remuneration The following table shows a breakdown of the annual remuneration (excluding equity awards) of directors for the year ended 31 March 2013:
Name
Salaries,directors'
feesandotherremuneration
2013£
Totalotherbenefits
20133
£
Grossremuneration
20131/2
£
Annualbonus–cashcomponent
20134
Annualbonus–deferred
component20134
£
Totalremuneration
2013£
Totalremuneration
20125
£
Executivedirectors
S Koseff (chief executive officer)5
– cash component 360 041 89 959 450 000 300 000 – 750 000 450 000 – deferred component – – – – 1 200 000 1 200 000 –
1950000 450 000B Kantor (managing director)5
– cash component 419 196 30 804 450 000 300 000 – 750 000 450 000 – deferred component – – – – 1 200 000 1 200 000 –
1950000 450 000GR Burger (group risk and finance director)5
– cash component 307 294 51 688 358 982 300 000 – 658 982 370 681 – deferred component – – – – 1 200 000 1 200 000 –
1858982 370 681HJ du Toit7
– cash component 391 378 59 535 450 913 2 180 000 – 2 630 913 441 678
– deferred component – – – – 2 180 000 2 180 000 4 327 500
4810913 4 769 178
TotalinPoundsSterling 1 477 909 231 986 1 709 895 3080000 5780000 10569895 6 039 859
Non-executivedirectors
Sir D Prosser (joint chairman) 250 000 – 250 000 – – 250 000 176 832
F Titi (joint chairman) 250 000 – 250 000 – – 250 000 218 548
SE Abrahams 285 563 – 285 563 – – 285 563 283 972
GFO Alford 168 408 – 168 408 – – 168 408 148 000
CA Carolus 70 431 – 70 431 – – 70 431 67 705
PKO Crosthwaite 143 998 – 143 998 – – 143 998 86 500
OC Dickson 95 000 – 95 000 – – 95 000 90 500
B Fried 148 000 – 148 000 – – 148 000 145 500
D Friedland8 8 094 – 8 094 – – 8 094 –
H Fukuda OBE 79 259 – 79 259 – – 79 259 72 000
IR Kantor 76 500 – 76 500 – – 76 500 73 000
MP Malungani 102 029 – 102 029 – – 102 029 99 767
PRS Thomas 205 276 – 205 276 – – 205 276 208 445
TotalinPoundsSterling 1882558 – 1882558 – – 1882558 1670769
TotalinPoundsSterling 3360467 231 986 3592453 3080000 5780000 12452453 7710628
1. Gross remuneration comprises base salary and other benefits (see points 2 and 3 below).2. Gross remuneration of S Koseff and B Kantor remained the same as the prior year and HJ du Toit’s gross remuneration increased by
2.1%. The gross remuneration of GR Burger is determined in Rands and converted into Pounds Sterling. In Rand terms GR Burger’s gross remuneration increased by 5.1% from R3 550 000 in March 2012 to R3 733 333 in March 2013. Gross remuneration increases for other employees across the group have generally been in the range of 5% to 10%.
3. The executive directors receive other benefits which may include pension schemes; life, disability and personal accident insurance; and medical cover, on similar terms to other senior executives.
4. Determination of bonuses are explained on pages 76 to 78 and as discussed on page 78 a portion of bonuses are paid in cash and a portion is deferred as required in terms of the PRA Code. In 2012 S Koseff, B Kantor and GR Burger waived their bonuses.
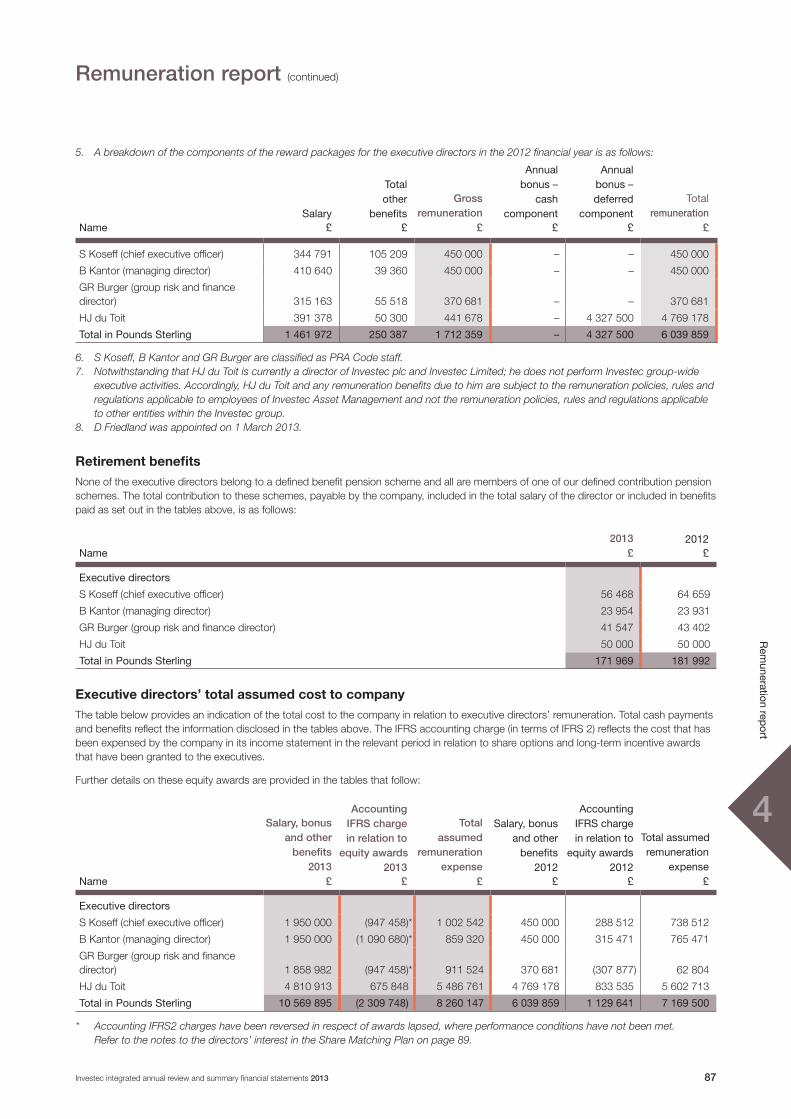
44
87Investec integrated annual review and summary financial statements 2013
Rem
uneration report
Remuneration report (continued)
5. A breakdown of the components of the reward packages for the executive directors in the 2012 financial year is as follows:
NameSalary
£
Totalother
benefits £
Gross remuneration
£
Annualbonus–
cashcomponent
£
Annualbonus–deferred
component£
Totalremuneration
£
S Koseff (chief executive officer) 344 791 105 209 450 000 – – 450 000
B Kantor (managing director) 410 640 39 360 450 000 – – 450 000
GR Burger (group risk and finance director) 315 163 55 518 370 681 – – 370 681
HJ du Toit 391 378 50 300 441 678 – 4 327 500 4 769 178
TotalinPoundsSterling 1 461 972 250 387 1 712 359 – 4 327 500 6 039 859
6. S Koseff, B Kantor and GR Burger are classified as PRA Code staff.7. Notwithstanding that HJ du Toit is currently a director of Investec plc and Investec Limited; he does not perform Investec group-wide
executive activities. Accordingly, HJ du Toit and any remuneration benefits due to him are subject to the remuneration policies, rules and regulations applicable to employees of Investec Asset Management and not the remuneration policies, rules and regulations applicable to other entities within the Investec group.
8. D Friedland was appointed on 1 March 2013.
Retirement benefitsNone of the executive directors belong to a defined benefit pension scheme and all are members of one of our defined contribution pension schemes. The total contribution to these schemes, payable by the company, included in the total salary of the director or included in benefits paid as set out in the tables above, is as follows:
Name2013
£2012
£
Executivedirectors
S Koseff (chief executive officer) 56 468 64 659
B Kantor (managing director) 23 954 23 931
GR Burger (group risk and finance director) 41 547 43 402
HJ du Toit 50 000 50 000
TotalinPoundsSterling 171 969 181 992
Executive directors’ total assumed cost to companyThe table below provides an indication of the total cost to the company in relation to executive directors’ remuneration. Total cash payments and benefits reflect the information disclosed in the tables above. The IFRS accounting charge (in terms of IFRS 2) reflects the cost that has been expensed by the company in its income statement in the relevant period in relation to share options and long-term incentive awards that have been granted to the executives.
Further details on these equity awards are provided in the tables that follow:
Name
Salary, bonusand other
benefits2013
£
AccountingIFRS chargein relation to
equity awards 2013
£
Total assumed
remunerationexpense
£
Salary,bonusandotherbenefits
2012£
AccountingIFRSchargeinrelationto
equityawards2012
£
Totalassumedremuneration
expense£
Executivedirectors
S Koseff (chief executive officer) 1 950 000 (947 458)* 1 002 542 450 000 288 512 738 512
B Kantor (managing director) 1 950 000 (1 090 680)* 859 320 450 000 315 471 765 471
GR Burger (group risk and finance director) 1 858 982 (947 458)* 911 524 370 681 (307 877) 62 804
HJ du Toit 4 810 913 675 848 5 486 761 4 769 178 833 535 5 602 713
TotalinPoundsSterling 10569895 (2 309 748) 8260147 6 039 859 1 129 641 7 169 500
* Accounting IFRS2 charges have been reversed in respect of awards lapsed, where performance conditions have not been met. Refer to the notes to the directors’ interest in the Share Matching Plan on page 89.

44
Investec integrated annual review and summary financial statements 201388
Rem
uneration report
Remuneration report (continued)
Directors’ shareholdings, options and long-term incentive awardsThe company’s register of directors’ interests contains full details of directors’ shareholdings, options and long-term incentive awards. The tables that follow provide information on the directors’ shareholdings, options and long-term incentive awards for the year ended 31 March 2013.
Directors’ shareholdings in Investec plc and Investec Limited shares as at 31 March 2013
Beneficialandnon-beneficialinterest
%ofsharesinissue1
Beneficialandnon-beneficialinterest
%ofsharesinissue1Investecplc1 InvestecLimited1
Name1April
201231 March
201331March
20131April
201231 March
201331March
2013
Executivedirectors
S Koseff 4 839 133 4 589 355 0.8% 1 809 330 1 809 399 0.6%
B Kantor 63 980 57 980 – 3 801 000 4 201 000 1.5%
GR Burger 2 402 135 2 402 135 0.4% 1 037 076 737 076 0.3%
HJ du Toit – – – 604 740 604 740 0.2%
Totalnumber 7 305 248 7 049470 1.2% 7 252 146 7 352 215 2.6%
Non-executivedirectors
Sir D J Prosser (joint chairman) 10 000 10 000 – – – –
F Titi (joint chairman) – – – – – –
SE Abrahams – – – – – –
GFO Alford 10 000 10 000 – – – –
CA Carolus – – – – – –
PKO Crosthwaite 132 908 132 908 – – – –
OC Dickson – – – – – –
B Fried – – – 300 000 300 000 0.1%
D Friedland2 – – – – – –
H Fukuda OBE 5 000 5 000 – – – –
IR Kantor 3 509 545 3 509 545 0.6% 325 325 –
MP Malungani – – – – – –
PRS Thomas 195 800 195 800 – 500 500 –
Totalnumber 3 863 253 3 863 253 0.6% 300 825 300 825 0.1%
Totalnumber 11 168 501 10 912 723 1.8% 7 552 971 7 653040 2.7%
1. The number of shares in issue and share prices for Investec plc and Investec Limited over the period is provided on page 82.2. D Friedland was appointed on 1 March 2013.
Directors’ interest in preference shares as at 31 March 2013
Investecplc InvestecLimited InvestecBankLimited
Name1April
201231 March
20131April
201231 March
20131April
201231 March
2013
Executivedirectors
S Koseff 101 198 101 198 3 000 3 000 4 000 4 000
• The market price of an Investec plc preference share as at 31 March 2013 was R56.00 (2012: R45.00)• The market price of an Investec Limited preference share as at 31 March 2013 was R85.10 (2012: R93.41)• The market price of an Investec Bank Limited preference share as at 31 March 2013 was R91.90 (2012: R98.25).

44
89Investec integrated annual review and summary financial statements 2013
Rem
uneration report
Remuneration report (continued)
Directors’ interest in options as at 31 March 2013Investec plc shares
The directors do not have any interest in options over Investec plc shares.
Investec Limited shares
The directors do not have any interest in options over Investec Limited shares.
Directors’ interest in long-term incentive plans as at 31 March 2013
NameDateofgrant
Exerciseprice
Number ofInvestec
plc sharesat 1 April
2012
Exercisedduring
theyear
Optionsgranted/lapsedduring
theyear
Balanceat
31 March2013
Marketpriceatdateof
exercise
Grossgains
madeondateof
exercisePeriodexercisable
HJ du Toit 25 June 2007 Nil 93 750 (93 750) – – £3.65 £342 637
25 June 2009 Nil 250 000 – – 250 000 – – 75% is exercisable on 25 June 2013and 25% on 25 June 2014
1 July 2010 Nil 750 000 – – 750 000 – – 75% is exercisable on 1 July 2014and 25% on 1 July 2015
The group has made awards in respect of nil cost options in the capital of Investec plc for nil consideration pursuant to the Long-Term Incentive Plan (LTIP).The awards are in accordance with the determination of the remuneration committee and with the rules of the LTIP. These awards were made prior to HJ du Toit becoming an executive director. HJ du Toit exercised his options and sold 93 750 Investec plc shares on 25 June 2012, when the share price was £3.65 per share.
Directors’ interest in the Share Matching Plan 2005 as at 31 March 2013
NameDateofgrant
Exerciseprice
Number ofInvestec
plc sharesat 1 April
2012
Exercisedduring
theyear
Optionsgranted/lapsedduring
theyear
Balanceat
31 March2013
Marketpriceatdateof
exercise
Grossgainsmadeondateof
exercisePeriodexercisable
S Koseff 25 June 2009 Nil 300 000 (300 000) – The entire award was forfeited on 25 June 2012^
1 July 2010 Nil 750 000 – – 750 000* The entire award will be forfeited on 1 July 2013
B Kantor 25 June 2009 Nil 300 000 (300 000) – The entire award was forfeited on 25 June 2012^
1 July 2010 Nil 750 000 – – 750 000* The entire award will be forfeited on 1 July 2013
GR Burger 25 June 2009 Nil 300 000 (300 000) – The entire award was forfeited on 25 June 2012^
1 July 2010 Nil 750 000 – – 750 000* The entire award will be forfeited on 1 July 2013
^ The performance conditions in respect of the awards made on 25 June 2009 were not met and accordingly the awards were forfeited on 25 June 2012.
* The performance conditions in respect of the awards made on 1 July 2010 were not met and accordingly the awards will be forfeited on 1 July 2013.
This plan was approved by shareholders at an extraordinary general meeting held on 14 November 2005. Further details on the plan are available on our website.
No additional matching awards were made during the year.
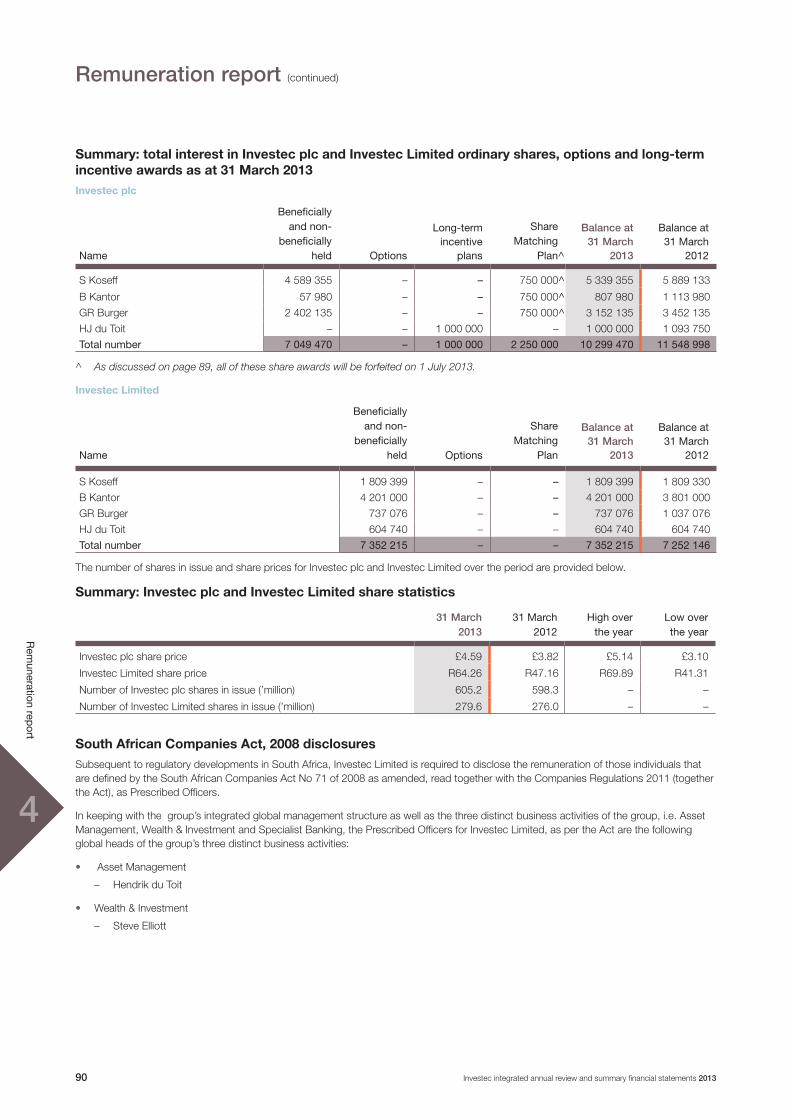
44
Investec integrated annual review and summary financial statements 201390
Rem
uneration report
Remuneration report (continued)
Summary: total interest in Investec plc and Investec Limited ordinary shares, options and long-term incentive awards as at 31 March 2013Investec plc
Name
Beneficiallyandnon-
beneficiallyheld Options
Long-termincentive
plans
ShareMatching
Plan^
Balance at 31 March
2013
Balanceat31March
2012
S Koseff 4 589 355 – – 750 000^ 5 339 355 5 889 133
B Kantor 57 980 – – 750 000^ 807 980 1 113 980
GR Burger 2 402 135 – – 750 000^ 3 152 135 3 452 135
HJ du Toit – – 1 000 000 – 1 000 000 1 093 750
Totalnumber 7 049470 – 1000000 2 250 000 10 299470 11 548 998
^ As discussed on page 89, all of these share awards will be forfeited on 1 July 2013.
Investec Limited
Name
Beneficiallyandnon-
beneficiallyheld Options
ShareMatching
Plan
Balance at 31 March
2013
Balanceat31March
2012
S Koseff 1 809 399 – – 1 809 399 1 809 330
B Kantor 4 201 000 – – 4 201 000 3 801 000
GR Burger 737 076 – – 737 076 1 037 076
HJ du Toit 604 740 – – 604 740 604 740
Totalnumber 7 352 215 – – 7 352 215 7 252 146
The number of shares in issue and share prices for Investec plc and Investec Limited over the period are provided below.
Summary: Investec plc and Investec Limited share statistics
31 March2013
31March2012
Highovertheyear
Lowovertheyear
Investec plc share price £4.59 £3.82 £5.14 £3.10
Investec Limited share price R64.26 R47.16 R69.89 R41.31
Number of Investec plc shares in issue (’million) 605.2 598.3 – –
Number of Investec Limited shares in issue (’million) 279.6 276.0 – –
South African Companies Act, 2008 disclosuresSubsequent to regulatory developments in South Africa, Investec Limited is required to disclose the remuneration of those individuals that are defined by the South African Companies Act No 71 of 2008 as amended, read together with the Companies Regulations 2011 (together the Act), as Prescribed Officers.
In keeping with the group’s integrated global management structure as well as the three distinct business activities of the group, i.e. Asset Management, Wealth & Investment and Specialist Banking, the Prescribed Officers for Investec Limited, as per the Act are the following global heads of the group’s three distinct business activities:
• Asset Management
– Hendrik du Toit
• Wealth & Investment
– Steve Elliott
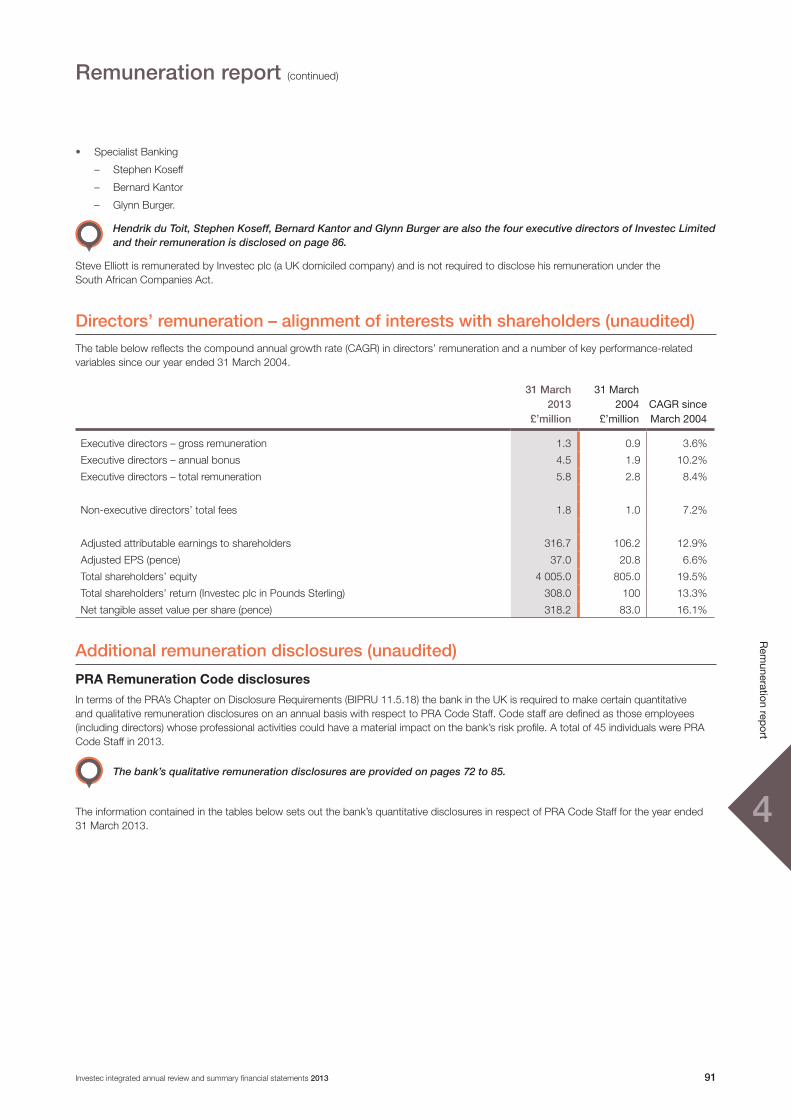
44
91Investec integrated annual review and summary financial statements 2013
Rem
uneration report
Remuneration report (continued)
• Specialist Banking
– Stephen Koseff
– Bernard Kantor
– Glynn Burger.
Hendrik du Toit, Stephen Koseff, Bernard Kantor and Glynn Burger are also the four executive directors of Investec Limited and their remuneration is disclosed on page 86.
Steve Elliott is remunerated by Investec plc (a UK domiciled company) and is not required to disclose his remuneration under the South African Companies Act.
Directors’ remuneration – alignment of interests with shareholders (unaudited)The table below reflects the compound annual growth rate (CAGR) in directors’ remuneration and a number of key performance-related variables since our year ended 31 March 2004.
31 March2013
£’million
31March2004
£’millionCAGRsinceMarch2004
Executive directors – gross remuneration 1.3 0.9 3.6%
Executive directors – annual bonus 4.5 1.9 10.2%
Executive directors – total remuneration 5.8 2.8 8.4%
Non-executive directors’ total fees 1.8 1.0 7.2%
Adjusted attributable earnings to shareholders 316.7 106.2 12.9%
Adjusted EPS (pence) 37.0 20.8 6.6%
Total shareholders’ equity 4 005.0 805.0 19.5%
Total shareholders’ return (Investec plc in Pounds Sterling) 308.0 100 13.3%
Net tangible asset value per share (pence) 318.2 83.0 16.1%
Additional remuneration disclosures (unaudited)
PRA Remuneration Code disclosuresIn terms of the PRA’s Chapter on Disclosure Requirements (BIPRU 11.5.18) the bank in the UK is required to make certain quantitative and qualitative remuneration disclosures on an annual basis with respect to PRA Code Staff. Code staff are defined as those employees (including directors) whose professional activities could have a material impact on the bank’s risk profile. A total of 45 individuals were PRA Code Staff in 2013.
The bank’s qualitative remuneration disclosures are provided on pages 72 to 85.
The information contained in the tables below sets out the bank’s quantitative disclosures in respect of PRA Code Staff for the year ended 31 March 2013.

44
Investec integrated annual review and summary financial statements 201392
Rem
uneration report
Remuneration report (continued)
Aggregate remuneration by remuneration type
£’millionSenior
managementOther
Codestaff Total
Fixedremuneration 4.2 5.6 9.8
Variableremuneration*
– Cash 2.1 2.7 4.8
– Deferred cash 1.9 1.9 3.8
– Deferred shares 4.4 7.4 11.8
– Deferred shares – long-term incentive awards 3.3 1.0 4.3
Other
– Options – long-term incentive awards made in current year** 0.3 0.1 0.4
– Options – long-term incentive awards made in prior years** 1.8 (1.7) 0.1
Totalaggregateremunerationanddeferredincentives 18.0 17.0 35.0
* Total number of employees receiving variable remuneration was 33. ** Information based on the IFRS 2 accounting charge that has been expensed by the company in its income statement during the
financial year.
Additional disclosure on deferred variable remuneration
£’millionSenior
managementOther
Codestaff Total
Deferred unvested remuneration outstanding at the beginning of the year 20.0 12.7 32.7
Deferred unvested remuneration adjustment – employees no longer Code staff (6.8) (2.6) (9.4)
Deferred remuneration awarded in year 9.6 10.3 19.9
Deferred remuneration reduced in year through performance adjustments – – –
Deferred remuneration vested in year (4.6) (2.1) (6.7)
Deferredunvestedremunerationoutstandingattheendoftheyear 18.2 18.3 36.5
£’millionSenior
managementOther
Codestaff Total
Deferredunvestedremunerationoutstandingattheendoftheyear
– Equity 13.7 10.9 24.6
– Cash 2.9 3.7 6.6
– Other 1.6 3.7 5.3
18.2 18.3 36.5
£’millionSenior
managementOther
Codestaff Total
Deferredremunerationvestedinyear– For awards made in 2012 financial year – – –– For awards made in 2011 financial year (4.6) (2.1) (6.7)– For awards made in 2010 financial year – – –
(4.6) (2.1) (6.7)

44
93Investec integrated annual review and summary financial statements 2013
Rem
uneration report
Remuneration report (continued)
Other remuneration disclosures
Seniormanagement
OtherCodestaff Total
Sign-onpaymentsMade during the year (£’million) 0.1 – 0.1Number of beneficiaries 1 – 1
SeverancepaymentsMade during the year (£’million) – – –Number of beneficiaries – – –
GuaranteedbonusesMade during the year (£’million) – – –Number of beneficiaries – – –
Pillar III remuneration disclosuresThe bank in South Africa is required to make certain quantitative and qualitative remuneration disclosures on an annual basis in terms of the South African Reserve Bank’s Basel Pillar III Disclosure requirements.
The bank’s qualitative remuneration disclosures are provided on pages 72 to 85.
The information contained in the tables below sets out the bank’s quantitative disclosures for the year ended 31 March 2013.
Aggregate remuneration by remuneration type
R’millionSenior
management^Risk
takers^
Financialandriskcontrol
staff^ Total
Fixedremuneration 49.6 60.8 8.7 119.1
Variableremuneration*– Cash 101.6 57.3 54.0 212.9– Deferred shares 104.3 46.5 1.8 152.6– Deferred shares – long-term incentive awards 41.9 10.5 27.2 79.6
Other– Options – long-term incentive awards made in current year** 2.6 1.5 1.8 5.9– Options – long-term incentive awards made in prior years** 48.9 20.6 15.7 85.2Totalaggregateremunerationanddeferredincentives^^ 348.9 197.2 109.2 655.3
* Total number of employees receiving variable remuneration was 323. ** Information based on the IFRS 2 accounting charge that has been expensed by the company in its income statement during the
financial year.^ Senior management: all members of our South African general management forum, excluding executive directors. Risk takers: includes anyone (not categorised above) who is deemed to be responsible for a division/function (e.g. lending, balance
sheet management, advisory and transactional banking activities) which could be incurring risk on behalf of the bank. Financial and risk control staff: includes everyone in central Group Finance and central Group Risk as well as employees responsible for
risk and finance functions within the operating business units.^^ All employees are subject to clawback provisions as discussed on page 80. No remuneration was reduced for ex post implicit
adjustments during the year.

44
Investec integrated annual review and summary financial statements 201394
Rem
uneration report
Remuneration report (continued)
Additional disclosure on deferred variable remuneration
R’millionSenior
management^Risk
takers^
Financialandriskcontrol
staff^ Total
Deferred unvested remuneration outstanding at the beginning of the year 208.3 60.8 8.7 277.8
Deferred unvested remuneration adjustment – employees that are no longer employed by the bank (3.7) – – (3.7)
Deferred remuneration awarded in year 146.2 57.0 29.0 232.2
Deferred remuneration reduced in year through performance adjustments – – – –
Deferred remuneration vested in year – – – –
Deferredunvestedremunerationoutstandingattheendoftheyear^^ 350.8 117.8 37.7 506.3
^^ All employees are subject to clawback provisions as discussed on page 80. No remuneration was reduced for ex post implicit adjustments during the year.
R’millionSenior
management^Risk
takers^
Financialandriskcontrol
staff^ Total
Deferredunvestedremunerationoutstandingattheendoftheyear
– Equity 283.7 94.6 8.9 387.2
– Cash – – – –
– Other – – – –
283.7 94.6 8.9 387.2
R’millionSenior
management^Risk
takers^
Financialandriskcontrol
staff^ Total
Deferredremunerationvestedinyear
– For awards made in 2012 financial year – – – –
– For awards made in 2011 financial year (70.4) (12.7) (1.6) (84.7)
– For awards made in 2010 financial year – – – –
(70.4) (12.7) (1.6) (84.7)
^ Senior management: all members of our South African general management forum, excluding executive directors. Risk takers: includes anyone (not categorised above) who is deemed to be responsible for a division/function (e.g. lending, balance
sheet management, advisory and transactional banking activities) which could be incurring risk on behalf of the bank. Financial and risk control staff: includes everyone in central Group Finance and central Group Risk as well as employees responsible for
risk and finance functions within the operating business units.
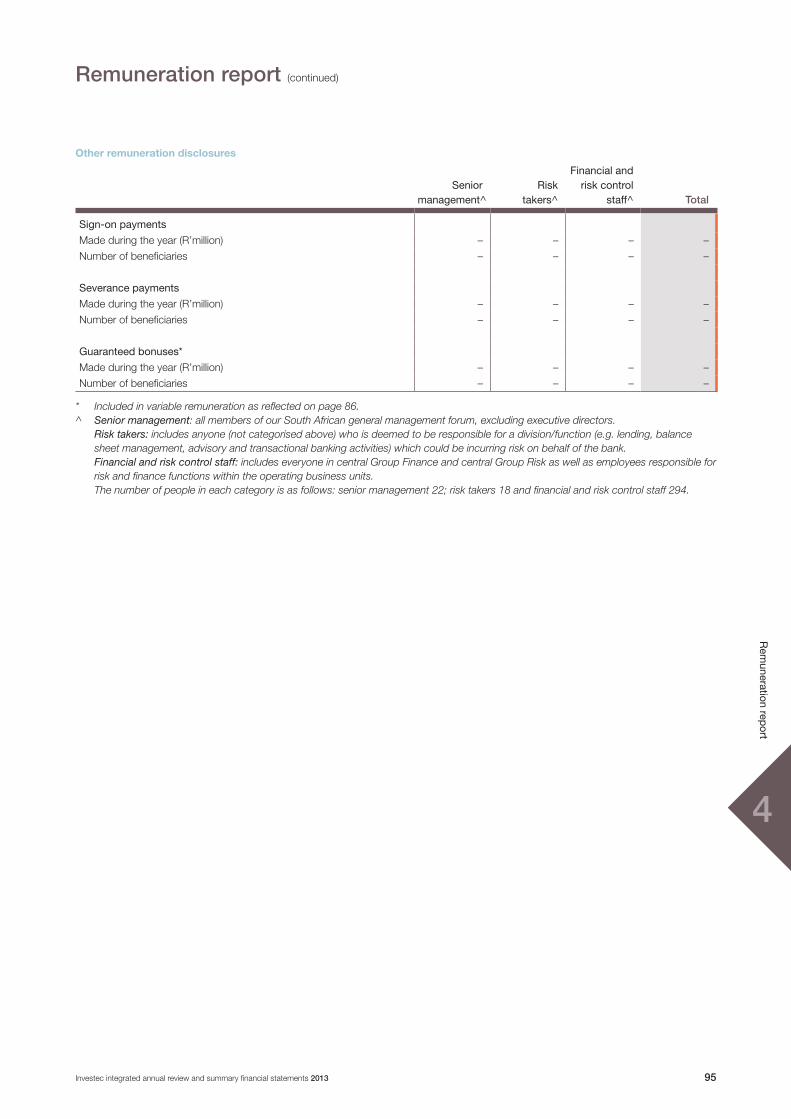
44
95Investec integrated annual review and summary financial statements 2013
Rem
uneration report
Remuneration report (continued)
Other remuneration disclosures
Seniormanagement^
Risktakers^
Financialandriskcontrol
staff^ Total
Sign-onpayments
Made during the year (R’million) – – – –
Number of beneficiaries – – – –
Severancepayments
Made during the year (R’million) – – – –
Number of beneficiaries – – – –
Guaranteedbonuses*
Made during the year (R’million) – – – –
Number of beneficiaries – – – –
* Included in variable remuneration as reflected on page 86.^ Senior management: all members of our South African general management forum, excluding executive directors. Risk takers: includes anyone (not categorised above) who is deemed to be responsible for a division/function (e.g. lending, balance
sheet management, advisory and transactional banking activities) which could be incurring risk on behalf of the bank. Financial and risk control staff: includes everyone in central Group Finance and central Group Risk as well as employees responsible for
risk and finance functions within the operating business units. The number of people in each category is as follows: senior management 22; risk takers 18 and financial and risk control staff 294.

5
Summary financialstatements
5

5
97Investec integrated annual review and summary financial statements 2013
Sum
mary financial statem
ents
Directors’ responsibility statement
The following statement, which should be read in conjunction with the auditors’ reports set out on page 104, is made with a view to distinguishing for stakeholders the respective responsibilities of the directors and of the auditors in relation to the combined consolidated financial statements.
The directors are responsible for the preparation, integrity and objectivity of the combined consolidated financial statements that fairly present the state of affairs of the group at the end of the financial year and the net income and cash flows for the year, and other information contained in this report.
To enable the directors to meet these responsibilities:
• The board and management set standards and management implements systems of internal controls and accounting and information systems aimed at providing reasonable assurance that assets are safeguarded and the risk of fraud, error or loss is reduced in a cost effective manner. These controls, contained in established policies and procedures, include the proper delegation of responsibilities and authorities within a clearly defined framework, effective accounting procedures and adequate segregation of duties
• The group’s internal audit function, which operates unimpeded and independently from operational management, and has unrestricted access to the group audit committee, appraises and, when necessary, recommends improvements in the system of internal controls and accounting practices, based on audit plans that take cognisance of the relative
degrees of risk of each function or aspect of the business
• The group audit committee, together with Internal Audit, plays an integral role in matters relating to financial and internal control, accounting policies, reporting and disclosure.
To the best of our knowledge and belief, based on the above, the directors are satisfied that no material breakdown in the operation of the system of internal control and procedures has occurred during the year under review.
The group consistently adopts appropriate and recognised accounting policies and these are supported by reasonable judgements and estimates on a consistent basis and provides additional disclosures when compliance with the specific requirements in International Financial Reporting Standards (IFRS) are insufficient to enable users to understand the impact of particular transactions, other events and conditions on the group’s financial position and financial performance.
The financial statements of the companies and the group have been prepared in accordance with the respective Companies Acts of the United Kingdom and South Africa and comply with IFRS and Article 4 of the IAS regulation and comply with UK GAAP in respect of Investec plc parent company accounts.
The directors are of the opinion, based on their knowledge of the companies, key processes in operation and specific enquiries, that adequate resources exist to support the companies on a going concern basis over the next year. These financial
statements have been prepared on that basis.
It is the responsibility of the independent auditors to report on the combined consolidated financial statements. Their reports to the members of the companies are set out on page 104. As far as the directors are aware, there is no relevant audit information of which the companies’ auditors are unaware. All relevant audit information has been provided to the companies’ auditors.
Approval of financial statements
The directors’ report and the financial statements of the companies and the group, which appear on pages 98 to 100 and pages 106 to 136, were approved by the board of directors on 11 June 2013.
The directors are responsible for the maintenance and integrity of the corporate and financial information included on the companies’ website. Legislation in the United Kingdom governing the preparation and dissemination of the financial statements may differ from legislation in other jurisdictions.
Signed on behalf of the board
StephenKoseff BernardKantorChief executive officer Managing director
13 June 2013
Declaration by the company secretary
In terms of section 88(2)(e) of the South African Companies Act No 71 of 2008, as amended (the Act), I hereby certify that, to the best of my knowledge and belief, Investec Limited has lodged with the Companies and Intellectual Property Commission, for the financial year ended 31 March 2013, all such returns and notices as are required in terms of the Act and that all such returns and notices are true, correct and up to date.
BenitaCoetseeCompany secretary, Investec Limited
13 June 2013

55
Investec integrated annual review and summary financial statements 201398
Sum
mary financial statem
ents
Directors’ report
Extended business reviewWe are an international specialist bank and asset manager that provides a diverse range of financial products and services to a niche client base in three principal markets, the United Kingdom, South Africa and Australia as well as certain other countries. Investec focuses on delivering distinctive profitable solutions for its clients in three core areas of activity namely, Asset Management, Wealth & Investment and Specialist Banking.
The operating financial review on pages 19 and 20 provides an overview of our strategic position, performance during the financial year and outlook for the business.
It should be read in conjunction with the sections on pages 21 to 95 which elaborate on the aspects highlighted in this review.
The directors’ report deals with the requirements of the combined consolidated Investec group, comprising the legal entities Investec plc and Investec Limited.
Authorised and issued share capitalInvestec plc and Investec LimitedDetails of the share capital are set out in note 43 to the financial statements.
Investec plc
During the year, the following shares were issued:
• 6 857 159 ordinary shares on 14 June 2012 at 329.00 pence per share
• 3 618 943 special converting shares on 14 June 2012 at par.
Investec Limited
During the year, the following shares were issued:
• 3 494 641 non-redeemable, non-cumulative, non-participating preference shares on 25 April 2012 at R86.90 (R0.01 par and premium of R86.89 per share)
• 3 618 943 ordinary shares on 14 June 2012 at R43.78 (R0.0002 par and premium of R42.7798 per share)
• 6 857 159 special convertible redeemable preference shares on 14 June 2012 of R0.0002 each at par.
As at 31 March 2013, Investec Limited held 19.7 million shares in treasury (2012: 16.6 million). Investec plc held 10.3 million shares in treasury (2012: 7.2 million). The maximum number of shares held in treasury by Investec Limited during the period under review was £19.7 million.
Financial resultsThe combined results of Investec plc and Investec Limited are set out in the financial statements and accompanying notes for the year ended 31 March 2013. The preparation of these combined results was supervised by the group risk and finance director, Glynn Burger.
Ordinary dividendsInvestec plcAn interim dividend was declared to shareholders as follows:
• 8.0 pence per ordinary share to non-South African resident shareholders (2012: 8.0 pence) registered on 14 December 2012
• To South African resident shareholders registered on 14 December 2012, a dividend paid by Investec Limited on the SA DAS share, equivalent to 7.0 pence (2012: 8.0 pence) per ordinary share and 1.0 pence (2012: 2.0 pence) per ordinary share paid by Investec plc.
The dividends were paid on 28 December 2012.
The directors have proposed a final dividend to shareholders registered on 2 August 2013, which is subject to the approval of the members of Investec plc at the annual general meeting which is scheduled to take place on 8 August 2013 and, if approved, will be paid on 12 August 2013 as follows:
• 10 pence per ordinary share to non-South African resident shareholders (2012: 9.0 pence) registered on 2 August 2013
• To South African resident shareholders registered on 2 August 2013, through a dividend paid by Investec Limited on the SA DAS share, of 8 pence per ordinary share and 2 pence per ordinary share paid by Investec plc. Shareholders in Investec plc will receive
a distribution of 10 pence (2012: 9.0 pence) per ordinary share.
Investec LimitedAn interim dividend of 112.0 cents per ordinary share (2012: 103.0 cents) was declared to shareholders registered on 14 December 2012 and was paid on 28 December 2012.
The directors have proposed a final dividend of 144 cents per ordinary share (2012: 121.0 cents) to shareholders registered on 2 August 2013 to be paid on 12 August 2013. The final dividend is subject to the approval of members of Investec Limited at the annual general meeting scheduled for 8 August 2013.
Preference dividendsInvestec plcNon-redeemable, non-cumulative, non-participating preference shares
Preference dividend number 13 for the period 1 April 2012 to 30 September 2012, amounting to 7.521 pence per share, was declared to members holding preference shares registered on 7 December 2012 and was paid on 18 December 2012.
Preference dividend number 14 for the period 1 October 2012 to 31 March 2013, amounting to 7.47945 pence per share, was declared to members holding preference shares registered on 14 June 2013 and will be paid on 25 June 2013.
Rand denominated non-redeemable, non-cumulative, non-participating preference shares
Preference dividend number 3 for the period 1 April 2012 to 30 September 2012, amounting to 419.17123 cents per share, was declared to members holding Rand denominated non-redeemable, non-cumulative, non-participating preference shares registered on 7 December 2012 and was paid on 18 December 2012.
Preference dividend number 4 for the period 1 October 2012 to 31 March 2013, amounting to 402.64384 cents per share, was declared to members holding preference shares registered on 14 June 2013 and will be paid on 25 June 2013.
Preferred securities
The sixth annual distribution, fixed at 7.075 per cent, on the €200 million fixed/floating rate, guaranteed, non-voting, non-cumulative perpetual preferred callable securities issued by Investec Tier 1 (UK) LP on 24 June 2005, is due and will be paid on 24 June 2013.

55
99Investec integrated annual review and summary financial statements 2013
Sum
mary financial statem
ents
Directors’ report (continued)
Investec LimitedNon-redeemable, non-cumulative, non-participating preference shares
Preference dividend number 16 for the period 1 April 2012 to 30 September 2012, amounting to 343.14681 cents per share, was declared to members holding preference shares registered on 7 December 2012 and was paid on 18 December 2012.
Preference dividend number 17 for the period 1 October 2012 to 31 March 2013, amounting to 329.61696 cents per share, was declared to members holding preference shares registered on 14 June 2013 and will be paid on 25 June 2013.
Redeemable cumulative preference shares
Dividends amounting to R24 152 712 were paid on the redeemable cumulative preference shares.
Directors and secretaries
Details of directors and secretaries of Investec plc and Investec Limited are reflected on pages 68 and 69
In accordance with the UK Corporate Governance Code, the entire board will offer itself for re-election at the 2013 annual general meeting, other than SE Abrahams who will not offer himself for re-election.
D Friedland was appointed to the board on 1 March 2013.
Directors and their interests
Directors’ shareholdings and options to acquire shares are set out on pages 88 to 91.
The register of directors’ interests contains full details of directors’ shareholdings and options to acquire shares.
Corporate governance
The group’s corporate governance board statement and governance framework are set out on pages 65 to 67.
Share incentive trusts
Details regarding options granted during the year are set out on pages 122 and 123.
Audit committeeThe audit committee comprising non-executive directors meets regularly with senior management, the external auditors, Operational Risk, Internal Audit, Compliance and the Finance division, to consider the nature and scope of the audit reviews and the effectiveness of our risk and control systems.
Further details on the role and responsibility of the audit committee can be found in the Investec group’s 2013 annual report.
AuditorsErnst & Young LLP have indicated their willingness to continue in office as auditors of Investec plc and Ernst & Young Inc. and KPMG Inc. have indicated their willingness to continue in office as joint auditors of Investec Limited.
A resolution to re-appoint them as auditors will be proposed at the next annual general meeting scheduled to take place on 8 August 2013.
Contracts
Refer to page 85 for details of contracts with directors.
Subsidiary and associated companies
Details of principal subsidiary and associated companies can be found in the Investec group’s 2013 annual report.
Major shareholders
The largest shareholders of Investec plc and Investec Limited are reflected on page 139.
Special resolutionsInvestec plcAt the annual general meeting held on 2 August 2012, special resolutions were passed in terms of which:
• A renewable authority was granted to Investec plc to acquire its own shares in terms of section 701 of the UK Companies Act, 2006.
Investec LimitedAt the annual general meeting held on 2 August 2012, the following special resolutions were passed in terms of which:
• A renewable authority was granted to Investec Limited and any of its subsidiaries to acquire its own ordinary and non-redeemable, non-cumulative, non-participating preference shares in terms of the provisions of the South African Companies Act No 71 of 2008
• A renewable authority was granted to Investec Limited to provide financial assistance in order to comply with the provisions of sections 44 and 45 of the South African Companies Act No 71 of 2008
• A renewable authority was granted to Investec Limited to approve directors’ remuneration in order to comply with the provisions of sections 65(11)(h), 66(8) and 66(9) of the South African Companies Act No 71 of 2008
• Article 152 of the existing Memorandum of Incorporation of Investec Limited was amended by the deletion of certain paragraphs and the replacement thereof by new paragraphs
• The abrogation of the existing Memorandum of Incorporation of Investec Limited in its entirety and the replacement thereof with a new Memorandum of Incorporation.
Accounting policies and disclosureAccounting policies are set having regard to commercial practice and comply with applicable United Kingdom and South African law and International Financial Reporting Standards.
The parent company accounts of Investec plc continue to be drawn up under UK
55
Investec integrated annual review and summary financial statements 2013100
Sum
mary financial statem
ents
Directors’ report (continued)
Generally Accepted Accounting Practice (UK GAAP).
The accounting policies adopted in this abridged report are consistent with the Investec group’s 2013 annual report.
Financial instrumentsDetailed information on the group’s risk management process and policy can be found in the risk management can be found in the Investec group’s 2013 annual report.
Information on the group’s hedge accounting policy and the use of derivatives and hedges can be found in the Investec group’s 2013 annual report.
Creditor payment policyThe group’s standard practice is to agree the terms of payment with suppliers at the time of contract and make payments within the agreed credit terms, subject to satisfactory performance.
EmployeesOur policy is to recruit and promote on the basis of aptitude and ability, without discrimination of any kind. Applications for employment by disabled people are always considered bearing in mind the qualifications and abilities of the applicants. In the event of employees becoming disabled, every effort is made to ensure their continued employment. Our policy is to adopt an open management style, thereby encouraging informal consultation at all levels about aspects of our operations, and motivating staff involvement in our performance by means of employee share schemes.
We are committed to ensuring the health, safety and welfare of our employees and to providing and maintaining safe working
conditions. We have health and safety policies in all regions of operation that cover all legislated requirements and additional benefits are provided for staff where possible. We constantly seek to improve both policies and the execution of health and safety standards in all our offices. This takes the form of staff education, regular fire drills and maintenance of an open door policy with regard to dialogue on the issue. Where appropriate the appointment of individuals responsible for various areas of health and safety is made.
Further information is provided in the Investec group’s 2013 annual report.
DonationsDuring the year, Investec plc made donations for charitable purposes, totalling £3.1 million and Investec Limited made donations for charitable purposes, totalling R70.6 million.
Further information is provided in the Investec group’s 2013 annual report.
EnvironmentWe are committed to pursuing sound environmental policies in all aspects of our business and seek to encourage and promote good environmental practice among our employees and within the community in which we operate.
Further information is provided in the Investec group’s 2013 annual report.
Going concern
Refer to page 66 for the directors’ statement in relation to going concern.
Post-balance sheet events
Investec Asset Management senior management to acquire 15% shareholding in Investec Asset ManagementAs announced on 14 March 2013, the boards of directors of Investec have reached an agreement with Forty Two Point Two (NewCo) and the senior management team of Investec Asset Management Limited and Investec Asset Management Holdings (Pty) Ltd (together Investec Asset Management) to acquire an initial 15% shareholding (the Interest) in Investec Asset Management for £180 million in cash. NewCo has also been granted an option (the Option) to acquire up to a further 5% of Investec Asset Management equity over the next seven years (together with the Interest, the ‘Transaction’). The Participants, led by Investec Asset Management chief executive officer, Hendrik du Toit, comprise 40 senior management and employees of Investec Asset Management. The option for NewCo to acquire up to a further 5% of Investec Asset Management equity over the next seven years will provide an opportunity for wider participation amongst Investec Asset Management employees. The Transaction is conditional upon, among other things, the approval of shareholders of Investec plc and Investec Limited at general meetings to be convened for that purpose as well as certain regulatory approvals. Subject to the conditions being met, completion of the Transaction is expected to take place in the third quarter of 2013.
Additional information for shareholders
Schedule A to the directors’ report is a summary of certain provisions of Investec plc’s current Articles of Association and applicable English law concerning companies (the UK Companies Act 2006).
On behalf of the boards of Investec plc and Investec Limited
SirDavidJProsser FaniTiti StephenKoseffJoint chairman Joint chairman Chief executive officer
13 June 2013
55
101Investec integrated annual review and summary financial statements 2013
Sum
mary financial statem
ents
Schedule A to the directors’ report
Additional information for shareholdersSet out below is a summary of certain provisions of Investec plc’s current Articles of Association (the Articles) and applicable English law concerning companies (the UK Companies Act 2006). This is a summary only and the relevant provisions of the Articles or the Companies Act 2006 should be consulted if further information is required.
Share capitalThe issued share capital of Investec plc at 31 March 2013 consists of 605 196 771 ordinary shares of £0.0002 each, 15 081 149 non-redeemable, non-cumulative, non-participating preference shares of £0.01 each, 2 275 940 ZAR non-redeemable, non-cumulative, non-participating preference shares of R0.001 each, 279 639 164 special converting shares of £0.0002 each, the special voting share of £0.001, the UK DAN share of £0.001 and the UK DAS share of £0.001 (each class as defined in the Articles).
Purchase of own sharesSubject to the provisions of the Articles, the Companies Act 2006, the uncertificated securities regulations 2001 and every other statute for the time being in force concerning companies and affecting Investec plc, the approval of shareholders as provided in the Investec plc Articles, and without prejudice to any relevant special rights attached to any class of shares, Investec plc may purchase, or may enter into a contract under which it will or may purchase, any of its own shares of any class, including without limitation any redeemable shares, in any way and at any price (whether at par or above or below par).
Dividends and distributionsSubject to the provisions of the Companies Act 2006, Investec plc may by ordinary resolution from time to time declare dividends not exceeding the amount recommended by the board. The board may pay interim dividends whenever
the financial position of Investec plc, in the opinion of the board, justifies such payment.
The board may withhold payment of all or any part of any dividends or other monies payable in respect of Investec plc’s shares from a person with a 0.25% or more interest in nominal value of the issued shares if such a person has been served with a notice after failure to provide Investec plc with information concerning interests in those shares required to be provided under the Companies Act 2006.
Voting rights
Subject to any special rights or restrictions attaching to any class of shares, at a general meeting, every member present in person has, upon a show of hands, one vote and on a poll every member who is present in person or by proxy has one vote for each share. In the case of joint holders of a share the vote of the senior who tenders a vote whether in person or by proxy shall be accepted to the exclusion of the votes of the other joint holders and for this purpose seniority shall be determined by the order in which the names stand in the register of members in respect of the share. Under the Companies Act 2006 members are entitled to appoint a proxy, who need not be a member of Investec plc, to exercise all or any of their rights to attend and vote on their behalf at a general meeting or class meeting. A member may appoint more than one proxy in relation to a general meeting or class meeting provided that each proxy is appointed to exercise the rights attached to a different share or shares held by that member. A member that is a corporation may appoint an individual to act on its behalf at a general meeting or class meeting as a corporate representative. The person so authorised shall be entitled to exercise the same powers on behalf of such corporation as the corporation could exercise if it were an individual member of Investec plc.
Restrictions on voting
No member shall be entitled to vote either in person or by proxy at any general meeting or class meeting in respect of any shares held by him if any call or other sum then payable by him in respect of that share remains unpaid. In addition no member shall be entitled to vote if he has been
served with a notice after failure to provide Investec plc with information concerning interests in those shares required to be provided under the Companies Act.
Deadlines for exercising voting rightsVotes are exercisable at a general meeting of Investec plc in respect of which the business being voted upon is being heard. Votes may be exercised in person, by proxy, or in relation to corporate members, by corporate representatives. The Articles provide a deadline for submission of proxy forms of not less than 48 hours before the time appointed for the holding of the meeting or adjourned meeting.
Variation of rightsSubject to the Companies Act 2006, the Articles specify that rights attached to any class of shares may be varied with the written consent of the holders of not less than three-fourths in nominal value of the issued shares of that class, or with the sanction of an extraordinary resolution passed at a separate general meeting of the holders of those shares. At every such separate general meeting the quorum shall be two persons or, if there is only one holder, that holder at least holding or representing by proxy at least one-third in nominal value of the issued shares of the class (calculated excluding any shares held as treasury shares). The rights conferred upon the holders of any shares shall not, unless otherwise expressly provided in the rights attaching to those shares, be deemed to be varied by the creation or issue of further shares ranking pari passu with them.
Where, under the company’s share incentive plan, participants are the beneficial owners of the shares, but not the registered owners, the participants are not entitled to exercise any voting rights until the shares are released to the participants. Under the company’s employee trust, the trustee does not vote in respect of unallocated shares.
Transfer of sharesAll transfers of shares may be effected by transfer in writing in any usual or common form or in any other form acceptable to the directors. The instrument of transfer shall be

55
Investec integrated annual review and summary financial statements 2013102
Sum
mary financial statem
ents
Schedule A to the directors’ report (continued)
signed by or on behalf of the transferor and (except in the case of fully paid shares) by or on behalf of the transferee. Transfers of shares which are in uncertificated form are effected by means of the CREST system.
The directors may, in the case of shares in certificated form, in their absolute discretion and without assigning any reason, refuse to register any transfer of shares (not being fully paid shares) provided that such discretion may not be exercised in such a way as to prevent dealings in the shares of that class from taking place on an open and proper basis. The directors may also refuse to register an allotment or transfer of shares (whether fully paid or not) in favour of more than four persons jointly. If the directors refuse to register an allotment or transfer they shall within two months after the date on which the letter of allotment or transfer was lodged with Investec plc send to the allottee or transferee a notice of the refusal.
The directors may decline to recognise any instrument of transfer unless the instrument of transfer is in respect of only one class of share and when submitted for registration is accompanied by the relevant share certificates and such other evidence as the directors may reasonably require.
Subject to the Companies Act and regulations and applicable CREST rules, the directors may determine that any class of shares may be held in uncertificated form and that title to such shares may be transferred by means of the CREST system or that shares of any class should cease to be so held and transferred.
A number of the company’s employee share plans include restrictions on transfer of shares while the shares are subject to the plans, in particular, the share incentive plan.
plc preference shares
The following are the rights and privileges which attach to the plc preference shares:
• To receive a non-cumulative preferential dividend out of the profits of Investec plc in priority to the plc ordinary shares but pari passu with the perpetual preference shares, on such dates in respect of such periods and on such other terms and conditions as may be determined by the directors prior to the allotment thereof
• The plc preference shares will rank as regards participation in profits pari
passu inter se and with the most senior ranking preference shares of Investec plc in issue (if any) from time to time and with the perpetual preference shares
• On a return of capital, whether or not on a winding up (but not on a redemption or purchase of any shares by Investec plc) or otherwise, the plc preference shares will rank, pari passu inter se and with the most senior ranking preference shares of Investec plc in issue (if any) from time to time and with any other shares of Investec plc that are expressed to rank pari passu therewith as regards participation in the capital, and otherwise in priority to any other class of shares of Investec plc
• Investec plc may, at its option, redeem all or any of the plc preference shares for the time being issued and outstanding on the first call date or any dividend payment date thereafter
• Holders of plc preference shares will not be entitled to attend and vote at general meetings of Investec plc. Holders will be entitled to attend and vote at a class meeting of holders of plc preference shares.
Non-redeemable, non-cumulative, non-participating preference shares
The following are the rights and privileges which attach to the perpetual preference shares:
• Each perpetual preference share will rank as regards dividends and a repayment of capital on the winding-up of Investec plc prior to the ordinary shares, the plc special converting shares, the UK DAN share, the UK DAS share, but pari passu with the plc preference shares. The perpetual preference shares shall confer on the holders, on a per perpetual preference shares and equal basis, the right on a return of capital on the winding-up of Investec plc of an amount equal to the aggregate of the nominal value and premiums in respect of perpetual preference shares issued divided by the number of perpetual preference shares in issue
• Each perpetual preference share may confer upon the holder thereof the right to receive out of the profits of Investec plc which it shall determine to distribute, in priority to the ordinary shares, the plc special converting shares, the UK DAN share and the UK DAS share, but pari passu with the plc preference shares, the preference dividend calculated in accordance with the Articles
• The holders of the perpetual preference shares shall be entitled to receive notice of and be present but not to vote, either in person or by proxy, at any meeting of Investec plc, by virtue of or in respect of the perpetual preference shares, unless either or both of the following circumstances prevail as at the date of the meeting:
– The preference dividend or any part thereof remains in arrears and unpaid as determined in accordance with Article 150.2(e)(ii) after six months from the due date thereof; and
– A resolution of Investec plc is proposed which resolution directly affects the rights attached to the perpetual preference shares or the interests of the holders thereof, or a resolution of Investec plc is proposed to wind up or in relation to the winding-up of Investec plc or for the reduction of its capital, in which event the preference shareholders shall be entitled to vote only on such resolution.
Rand denominated non-redeemable, non-cumulative, non-participating perpetual preference shares (the ZAR perpetual preference shares)Investec plc has 2 275 940 ZAR preference shares in issue. The ZAR perpetual preference shares are subject to substantially similar terms and conditions as the existing Sterling perpetual preference shares, as outlined above, save that they are denominated in South African Rand.
55
103Investec integrated annual review and summary financial statements 2013
Sum
mary financial statem
ents
Schedule A to the directors’ report (continued)
Shares required for the DLC structure
Investec SSC (UK) Limited, a UK trust company, specially formed for the purpose of the DLC structure, holds the plc special voting share, the plc special converting shares, the UK DAN share and the UK DAS share. These shares can only be transferred to another UK trust company, in limited circumstances.
The plc special voting shares are specially created shares so that shareholders of both Investec plc and Investec Limited effectively vote together as a single decision making body on matters affecting shareholders of both companies in similar ways, as set out in the Articles.
Prior to a change of control, approval of termination of the sharing agreement (which regulates the DLC), liquidation or insolvency of Investec plc, the plc special converting shares have no voting rights except in relation to a resolution proposing the (i) variation of the rights attaching to the shares or (ii) winding-up, and they have no rights to dividends. The special converting shares are held on trust for the Investec Limited ordinary shareholders. Investec plc and Investec Limited have established dividend access trust arrangements as part of the DLC.
Investec plc has issued two dividend access shares, the UK DAS share and UK DAN share which enables Investec plc to pay dividends to the shareholders of Investec Limited. This facility may be used by the board to address imbalances in the distributable reserves of Investec plc and Investec Limited and/or to address the
effects of South African exchange controls and/or if they otherwise consider it necessary or desirable.
Appointment and replacement of directors
Directors shall be no less than four and no more than 20 in number. A director is not required to hold any shares of Investec plc by way of qualification. Investec plc may by special resolution increase or reduce the maximum or minimum number of directors.
In accordance with the Articles of Association, one-third of the directors are required to retire by rotation. Furthermore, all those directors serving for longer than nine years are required to stand for annual re-election. In accordance with the UK Corporate Governance Code (the Code) all members of the board offer themselves for annual re-election.
Investec plc may by ordinary resolution in accordance with the relevant provisions of the Articles appoint any person to be a director (so long as the total number of directors does not exceed the limit prescribed in the Articles). Any such director shall hold office only until the next annual general meeting and shall then be eligible for re-election.
Powers of directors
Subject to the Articles, the Companies Act 2006, the CREST regulations and every other statute for the time being in force concerning companies and affecting Investec plc, and any directions given by
ordinary or special resolution, the business of Investec plc will be managed by the board who may exercise all the powers of Investec plc.
The board may exercise all the powers of Investec plc to borrow money and to mortgage or charge any of its undertaking, property, assets and uncalled capital and to issue debentures and other securities, whether outright or as collateral security for any debt, liability or obligation of Investec plc or of any third party.
Significant agreements: change of control
The Articles of Association of both Investec plc and the Memorandum of Incorporation of Investec Limited ensure that a person cannot make an offer for one company without having made an equivalent offer to the shareholders of both companies on equivalent terms.
Pursuant to the terms of the agreements establishing the DLC structure, if either Investec plc or Investec Limited serves written notice on the other at any time after either party becomes a subsidiary of the other party or after both Investec plc and Investec Limited become subsidiaries of a third party the agreements establishing the DLC structure will terminate.
All of Investec plc’s share plans contain provisions relating to a change of control. Outstanding awards and options would normally vest and become exercisable on a change of control and, where applicable, subject to the satisfaction of any performance conditions at that time.

55
Investec integrated annual review and summary financial statements 2013104
Sum
mary financial statem
ents
Independent auditor’s report
We have examined the summary financial statement for the year ended 31 March 2013 which comprises the combined consolidated Income statement, the combined consolidated statement of comprehensive Income, the combined consolidated balance sheet, the combined consolidated cash flow statement, the consolidated statement of changes in equity, the accounting policies set out on page 105 and the related notes.
This statement is made solely to the company’s members, as a body, in accordance with Section 428(4) of the Companies Act 2006. Our audit work has been undertaken so that we might state to the company’s members those matters we are required to state to them in an auditor’s statement and for no other purpose. To the fullest extent permitted by law, we do not accept or assume responsibility to anyone other than the company and the company’s members as a body, for our audit work, for this statement, or for the opinions we have formed.
Respective responsibilities of the directors and the auditorThe directors are responsible for preparing the summarised annual report in accordance with applicable United Kingdom law.
Our responsibility is to report to you our opinion on the consistency of the summary financial statement within the summarised annual report with the full annual financial statements, the directors’ remuneration report and the directors’ report, and its compliance with the relevant requirements of section 428 of the Companies Act 2006 and the regulations made thereunder.
We also read the other information contained in the summarised annual report and consider the implications for our report if we become aware of any apparent misstatements or material inconsistencies with the summary financial statement.
The other information comprises only the divisional review and risk management and governance.
We conducted our work in accordance with Bulletin 2008/3 issued by the Auditing Practices Board. Our report on the company’s full annual financial statements describes the basis of our opinion on those financial statements, the directors’ remuneration report, and the directors’ report.
Opinion
In our opinion the summary financial statement is consistent with the full annual financial statements, the directors’ report and the directors’ remuneration report of Investec plc for the year ended 31 March 2013 and complies with the applicable requirements of section 428 of the Companies Act 2006, and the regulations made thereunder.
We have not considered the effects of any events between the date on which we signed our report on the full annual financial statements dated 11 June 2013 and the date of this statement.
Ernst&YoungLLPStatutory auditor
London13 June 2013
Directors’ statement
The auditor has issued unqualified reports on the full annual financial statements, the auditable part of the directors’ remuneration report and on the consistency of the directors’ report with those annual financial statements. Their report on the full annual financial statements and the auditable part of the directors' remuneration report contained no statement under sections 498(2) or 498(3) of the Companies Act 2006.

55
105Investec integrated annual review and summary financial statements 2013
Sum
mary financial statem
ents
Investec plc and Investec Limited – significant accounting policies
Basis of presentation The group financial statements are prepared in accordance with International Financial Reporting Standards (IFRS), as adopted by the European Union (EU) which comply with IFRSs as issued by the International Accounting Standards Board (IASB) and the presentation requirements of IAS 34. At 31 March 2013, IFRS as endorsed by the EU are identical to current IFRS applicable to the group.
The group financial statements have been prepared on a historical cost basis, except for investment properties, available-for-sale investments, derivative financial instruments, financial assets and financial liabilities held at fair value through profit or loss or subject to hedge accounting, liabilities for cash-settled share-based payments and pension fund surpluses and deficits that have been measured at fair value.
Restatements and presentation of information The group reclassified warehoused assets and liabilities into other loans and advances and deposits by banks respectively.
This change arises from simplifying the face of the balance sheet with the relevant information more appropriately disclosed. The impact on the prior year’s balance sheet is detailed in note 57.
Basis of consolidation
Investec consists of two separate legal entities, being Investec plc and Investec Limited, that operate under a dual listed
company (DLC) structure. The effect of the DLC structure is that Investec plc and its subsidiaries and Investec Limited and its subsidiaries operate together as a single economic entity, with neither assuming a dominant role and accordingly are reported as a single reporting entity under IFRS.
All subsidiaries and special purpose entities (SPEs) in which the group holds more than one half of the voting rights or which it has the ability to control (either directly or in substance) are consolidated from the effective dates of acquisition (that is from when control exists) up to the effective dates of loss of control, except entities which are classified as non-current assets held-for-sale. Subsidiaries classified as non-current assets held-for-sale are consolidated in one income statement line item as discontinued operations.
Investec sponsors the formation of SPEs for a variety of reasons. SPEs are consolidated when the substance of the relationship between the group and the SPE indicates that the SPE is controlled by the group. Investec performs a re-assessment of consolidation whenever there is a change in the substance of the relationship between Investec and an SPE. Investec also holds investments, for example private equity investments, which give rise to significant, but not majority, voting rights. Assessing these voting rights and whether Investec controls these entities requires judgement that affects the date at which subsidiaries are consolidated or deconsolidated.
Entities, other than subsidiary undertakings, in which the group exercises significant influence over operating and financial policies, are treated as interests in associated undertakings. In the group accounts, interests in associated undertakings are accounted for using the equity method from the date that
significant influence commences until the date that significant influence ceases. In circumstances where interests in associated undertakings or joint venture holdings arise in which the group has no strategic intention, these investments are classified as ‘venture capital’ holdings and are designated as held at fair value through profit or loss.
For equity accounted associates, the combined consolidated financial statements include the attributable share of the results and reserves of associated undertakings. The group’s interests in associated undertakings are included in the consolidated balance sheet at cost plus the post-acquisition changes in the group’s share of the net assets of the associate. The consolidated balance sheet reflects the associated undertakings net of accumulated impairment losses.
All intergroup balances, transactions and unrealised gains and losses within the group that do not reflect an impairment to the asset, are eliminated in full regarding subsidiaries and to the extent of the interest in an associate.
Audit conclusionThese abridged financial statements have been extracted from the audited financial statements on which Ernst & Young LLP and Ernst & Young Inc. have issued an unmodified audit report. The auditor’s report on the annual combined consollidated and seperate financial statements is available for inspection at the companies registered office.

55
Investec integrated annual review and summary financial statements 2013106
Sum
mary financial statem
ents
Combined consolidated income statement
Fortheyearto31March£’000 2013 2012
Interest income 2 131 765 2 299 925
Interest expense (1 429 239) (1 600 878)
Netinterestincome 702526 699047
Fee and commission income 1 117 551 1 013 379
Fee and commission expense (144 876) (129 145)
Investment income 182 889 174 327
Trading income arising from
– customer flow 70 859 77 066
– balance sheet management and other trading activities 35 398 32 204
Other operating income 42 153 65 128
Totaloperatingincomebeforeimpairmentlossesonloansandadvances 2006500 1932006
Impairment losses on loans and advances (251 012) (325 118)
Operatingincome 1755488 1606888
Operating costs (1 302 929) (1 230 628)
Depreciation on operating leased assets (16 072) (28 670)
Operatingprofitbeforegoodwillandacquiredintangibles 436487 347590
Impairment of goodwill (15 175) (24 366)
Amortisation of acquired intangibles (13 313) (9 530)
Cost arising from integration of acquired subsidiaries (13 119) (17 117)
Operatingprofit 394880 296577
Non-operational costs arising from acquisition of subsidiary (1 249) (5 342)
Profitbeforetaxation 393631 291235
Taxation on operating profit before goodwill (78 800) (62 907)
Taxation on acquired intangibles and acquisition/disposal/integration of subsidiaries 5 977 8 164
Profitaftertaxation 320808 236492
Operating (income)/losses attributable to non-controlling interests (3 317) 11 035
Earningsattributabletoshareholders 317491 247527
Earningspershare(pence)
– Basic 32.5 25.7
– Diluted 30.6 24.3

55
107Investec integrated annual review and summary financial statements 2013
Sum
mary financial statem
ents
Combined consolidated statement of comprehensive income
Fortheyearto31March£’000 2013 2012
Profit after taxation 320 808 236 492
Other comprehensive income/(loss):
Fair value movements on cash flow hedges taken directly to other comprehensive income (17 144) (34 691)
Gains on realisation of available-for-sale assets recycled through the income statement (1 713) (12 891)
Fair value movements on available-for-sale assets taken directly to other comprehensive income 4 387 (312)
Foreign currency adjustments on translating foreign operations (181 135) (196 351)
Pension fund actuarial (losses)/gains (6 195) 282
Totalcomprehensiveincome/(loss) 119008 (7471)
Total comprehensive loss attributable to non-controlling interests (15 815) (21 798)
Total comprehensive income/(loss) attributable to ordinary shareholders 95 719 (24 979)
Total comprehensive income attributable to perpetual preferred securities 39 104 39 306
Totalcomprehensiveincome/(loss) 119008 (7471)

55
Investec integrated annual review and summary financial statements 2013108
Sum
mary financial statem
ents
Combined consolidated balance sheet
At31March£’000 2013 2012*
Assets Cash and balances at central banks 1 782 447 2 593 851 Loans and advances to banks 3 129 646 2 725 347 Non-sovereign and non-bank cash placements 420 960 642 480 Reverse repurchase agreements and cash collateral on securities borrowed 2 358 672 975 992 Sovereign debt securities 4 077 217 4 067 093 Bank debt securities 1 879 105 3 081 061 Other debt securities 457 652 377 832 Derivative financial instruments 1 982 571 1 913 650 Securities arising from trading activities 931 603 640 146 Investment portfolio 960 364 890 702 Loans and advances to customers 17 484 524 17 192 208 Own originated loans and advances to customers securitised 930 449 1 034 174 Other loans and advances 2 117 743 2 829 189 Other securitised assets 2 882 592 3 101 422 Interests in associated undertakings 27 950 27 506 Deferred taxation assets 165 457 150 381 Other assets 1 960 438 1 802 121 Property and equipment 126 538 171 685 Investment properties 451 975 407 295 Goodwill 466 906 468 320 Intangible assets 178 567 192 099 44 773 376 45 284 554 Other financial instruments at fair value through profit or loss in respect of liabilities to customers 6 226 142 6 265 846 50999518 51550400
Liabilities Deposits by banks 2 976 464 2 967 428 Derivative financial instruments 1 443 325 1 421 130 Other trading liabilities 851 939 612 884 Repurchase agreements and cash collateral on securities lent 1 940 158 1 864 137 Customer accounts (deposits) 24 531 838 25 343 771 Debt securities in issue 1 901 776 2 243 948 Liabilities arising on securitisation of own originated loans and advances 926 335 1 036 674 Liabilities arising on securitisation of other assets 2 237 581 2 402 043 Current taxation liabilities 210 475 209 609 Deferred taxation liabilities 109 628 102 478 Other liabilities 1 887 402 1 575 154 39 016 921 39 779 256 Liabilities to customers under investment contracts 6 224 062 6 263 913 Insurance liabilities, including unit-linked liabilities 2 080 1 933 45 243 063 46 045 102 Subordinated liabilities 1 751 806 1 492 776 46994869 47537878
Equity Ordinary share capital 223 221 Perpetual preference share capital 153 153 Share premium 2 494 618 2 457 019 Treasury shares (89 545) (72 820)Other reserves (93 082) 82 327 Retained income 1 412 239 1 249 515 Shareholders’ equity excluding non-controlling interests 3 724 606 3 716 415 Non-controlling interests 280 043 296 107 – Perpetual preferred securities issued by subsidiaries 279 041 291 769 – Non-controlling interests in partially held subsidiaries 1 002 4 338
Totalequity 4004649 4012522
Totalliabilitiesandequity 50999518 51550400
* As restated in the Investec group’s 2013 annual report.

55
109Investec integrated annual review and summary financial statements 2013
Sum
mary financial statem
ents
Combined consolidated cash flow statement
Fortheyearto31March£’000 2013 2012
Profit before taxation adjusted for non-cash items 779 740 776 138
Taxation paid (61 469) (117 759)
Increase in operating assets (4 108 809) (2 538 282)
Increase in operating liabilities 1 985 688 3 393 045
Netcash(outflow)/inflowfromoperatingactivities (1404850) 1513142
Cash (outflow)/inflow on acquisition of group subsidiaries (20 834) 55 685
Net acquisition from non-controlling interest (3 594) –
Cash inflow/(outflow) on net disposal/(acquisition) of associates 3 323 (3 736)
Cash flow on acquisition of property, equipment and intangible assets (45 346) (84 744)
Cash flow on disposal of property, equipment and intangible assets 44 193 72 355
Netcash(outflow)/inflowfrominvestingactivities (22258) 39560
Dividends paid to ordinary shareholders (147 660) (134 436)
Dividends paid to other equity holders (39 334) (39 696)
Proceeds on issue of shares, net of related costs 34 685 43 215
Proceeds on issue of perpetual preference shares 24 263 20 638
Proceeds on the net sale of treasury shares, net of related costs (58 395) (75 431)
Proceeds on issue of other equity instruments* – 72
Proceeds from subordinated debt raised 494 829 321 068
Repayment of subordinated debt (120 494) (29 751)
Netcashinflowfromfinancingactivities 187894 105679
Effectsofexchangeratesoncashandcashequivalents (142019) (102563)
Net(decrease)/increaseincashandcashequivalents (1381233) 1555818
Cash and cash equivalents at the beginning of the year 4 942 806 3 386 988
Cashandcashequivalentsattheendoftheyear 3561573 4942806
Cashandcashequivalentsisdefinedasincluding:
Cash and balances at central banks 1 782 447 2 593 851
On demand loans and advances to banks 1 358 166 1 706 475
Non-sovereign and non-bank cash placements 420 960 642 480
Cashandcashequivalentsattheendoftheyear 3561573 4942806
* Includes equity instruments issued by subsidiaries.
Cash and cash equivalents are defined as including cash and balances at central banks, on demand loans and advances to banks and non-sovereign and non-bank cash placements (all of which have a maturity profile of less than three months).
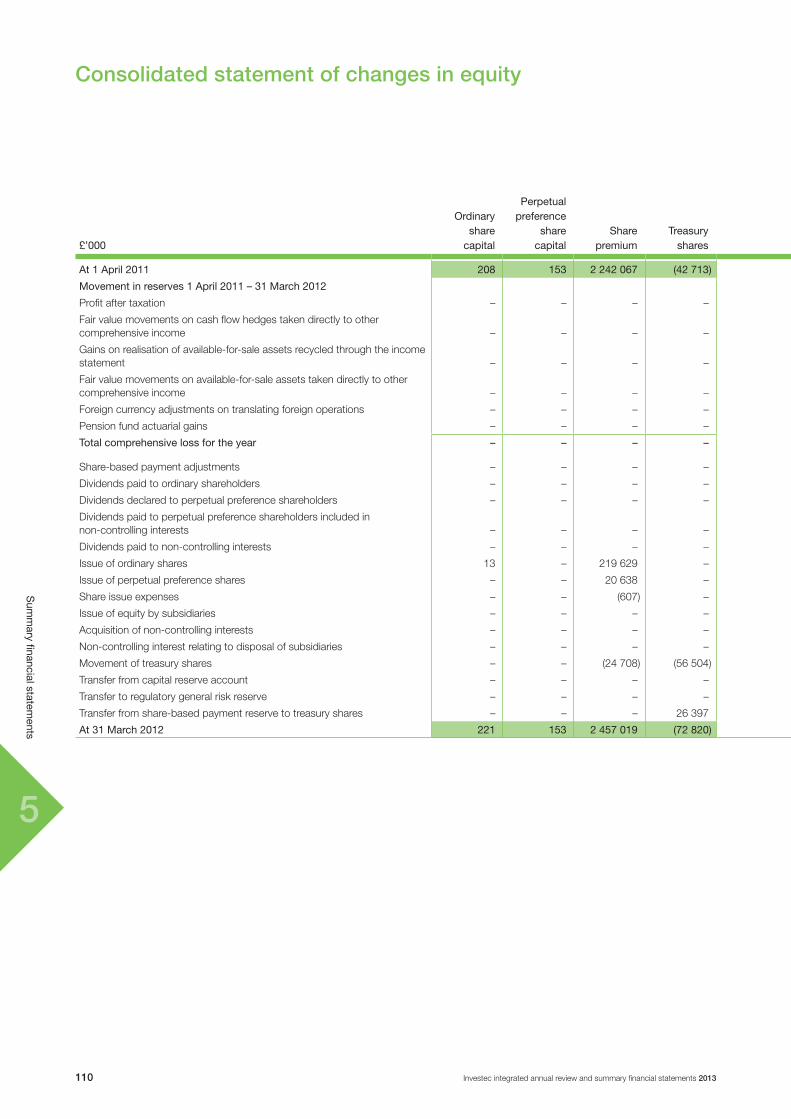
55
Investec integrated annual review and summary financial statements 2013110
Sum
mary financial statem
ents
Consolidated statement of changes in equity
£’000
Ordinarysharecapital
Perpetualpreference
sharecapital
Sharepremium
Treasuryshares
Otherreserves
Retainedincome
Share-holders’
equity excluding
non-controlling
interests
Non-controllinginterests
Total equity
Capitalreserve
account
Available-for-salereserve
Regulatorygeneralrisk
reserve
Cashflowhedgereserve
Foreigncurrencyreserves
At1April2011 208 153 2242067 (42713) 11289 21866 34447 3517 244759 1131980 3647573 313529 3961102
Movementinreserves1April2011–31March2012
Profit after taxation – – – – – – – – – 247 527 247 527 (11 035) 236 492
Fair value movements on cash flow hedges taken directly to other comprehensive income – – – – – – – (34 691) – – (34 691) – (34 691)
Gains on realisation of available-for-sale assets recycled through the income statement – – – – – (12 891) – – – – (12 891) – (12 891)
Fair value movements on available-for-sale assets taken directly to other comprehensive income – – – – – (312) – – – – (312) – (312)
Foreign currency adjustments on translating foreign operations – – – – (26) 450 111 (458) (185 636) (29) (185 588) (10 763) (196 351)
Pension fund actuarial gains – – – – – – – – – 282 282 – 282
Totalcomprehensivelossfortheyear – – – – (26) (12753) 111 (35149) (185636) 247780 14327 (21798) (7471)
Share-based payment adjustments – – – – – – – – – 69 796 69 796 – 69 796
Dividends paid to ordinary shareholders – – – – – – – – – (134 436) (134 436) – (134 436)
Dividends declared to perpetual preference shareholders – – – – – – – – – (39 306) (39 306) 21 367 (17 939)
Dividends paid to perpetual preference shareholders included in non-controlling interests – – – – – – – – – – – (21 367) (21 367)
Dividends paid to non-controlling interests – – – – – – – – – – – (390) (390)
Issue of ordinary shares 13 – 219 629 – – – – – – – 219 642 – 219 642
Issue of perpetual preference shares – – 20 638 – – – – – – – 20 638 – 20 638
Share issue expenses – – (607) – – – – – – – (607) – (607)
Issue of equity by subsidiaries – – – – – – – – – – – 72 72
Acquisition of non-controlling interests – – – – – – – – – – – (483) (483)
Non-controlling interest relating to disposal of subsidiaries – – – – – – – – – – – 5 177 5 177
Movement of treasury shares – – (24 708) (56 504) – – – – – – (81 212) – (81 212)
Transfer from capital reserve account – – – – (136) – – – – 136 – – –
Transfer to regulatory general risk reserve – – – – – – 38 – – (38) – – –
Transfer from share-based payment reserve to treasury shares – – – 26 397 – – – – – (26 397) – – –
At31March2012 221 153 2457019 (72820) 11127 9113 34596 (31632) 59123 1249515 3716415 296107 4012522

55
111Investec integrated annual review and summary financial statements 2013
Sum
mary financial statem
ents
£’000
Ordinarysharecapital
Perpetualpreference
sharecapital
Sharepremium
Treasuryshares
Otherreserves
Retainedincome
Share-holders’
equity excluding
non-controlling
interests
Non-controllinginterests
Total equity
Capitalreserve
account
Available-for-salereserve
Regulatorygeneralrisk
reserve
Cashflowhedgereserve
Foreigncurrencyreserves
At1April2011 208 153 2242067 (42713) 11289 21866 34447 3517 244759 1131980 3647573 313529 3961102
Movementinreserves1April2011–31March2012
Profit after taxation – – – – – – – – – 247 527 247 527 (11 035) 236 492
Fair value movements on cash flow hedges taken directly to other comprehensive income – – – – – – – (34 691) – – (34 691) – (34 691)
Gains on realisation of available-for-sale assets recycled through the income statement – – – – – (12 891) – – – – (12 891) – (12 891)
Fair value movements on available-for-sale assets taken directly to other comprehensive income – – – – – (312) – – – – (312) – (312)
Foreign currency adjustments on translating foreign operations – – – – (26) 450 111 (458) (185 636) (29) (185 588) (10 763) (196 351)
Pension fund actuarial gains – – – – – – – – – 282 282 – 282
Totalcomprehensivelossfortheyear – – – – (26) (12753) 111 (35149) (185636) 247780 14327 (21798) (7471)
Share-based payment adjustments – – – – – – – – – 69 796 69 796 – 69 796
Dividends paid to ordinary shareholders – – – – – – – – – (134 436) (134 436) – (134 436)
Dividends declared to perpetual preference shareholders – – – – – – – – – (39 306) (39 306) 21 367 (17 939)
Dividends paid to perpetual preference shareholders included in non-controlling interests – – – – – – – – – – – (21 367) (21 367)
Dividends paid to non-controlling interests – – – – – – – – – – – (390) (390)
Issue of ordinary shares 13 – 219 629 – – – – – – – 219 642 – 219 642
Issue of perpetual preference shares – – 20 638 – – – – – – – 20 638 – 20 638
Share issue expenses – – (607) – – – – – – – (607) – (607)
Issue of equity by subsidiaries – – – – – – – – – – – 72 72
Acquisition of non-controlling interests – – – – – – – – – – – (483) (483)
Non-controlling interest relating to disposal of subsidiaries – – – – – – – – – – – 5 177 5 177
Movement of treasury shares – – (24 708) (56 504) – – – – – – (81 212) – (81 212)
Transfer from capital reserve account – – – – (136) – – – – 136 – – –
Transfer to regulatory general risk reserve – – – – – – 38 – – (38) – – –
Transfer from share-based payment reserve to treasury shares – – – 26 397 – – – – – (26 397) – – –
At31March2012 221 153 2457019 (72820) 11127 9113 34596 (31632) 59123 1249515 3716415 296107 4012522

55
Investec integrated annual review and summary financial statements 2013112
Sum
mary financial statem
ents
Consolidated statement of changes in equity (continued)
£’000
Ordinarysharecapital
Perpetualpreference
sharecapital
Sharepremium
Treasuryshares
Otherreserves
Retainedincome
Share-holders’
equity excluding
non-controlling
interests
Non-controllinginterests
Total equity
Capitalreserve
account
Available-for-salereserve
Regulatorygeneralrisk
reserve
Cashflowhedgereserve
Foreigncurrencyreserves
At31March2012 221 153 2457019 (72820) 11127 9113 34596 (31632) 59123 1249515 3716415 296107 4012522
Movementinreserves1April2012–31March2013
Profit after taxation – – – – – – – – – 317 491 317 491 3 317 320 808
Fair value movements on cash flow hedges taken directly to other comprehensive income – – – – – – – (17 144) – – (17 144) – (17 144)
Gains on realisation of available-for-sale assets recycled through the income statement – – – – – (1 713) – – – – (1 713) – (1 713)
Fair value movements on available-for-sale assets taken directly to other comprehensive income – – – – – 4 387 – – – – 4 387 – 4 387
Foreign currency adjustments on translating foreign operations – – – – – (1 033) 849 392 (162 865) 654 (162 003) (19 132) (181 135)
Pension fund actuarial losses – – – – – – – – – (6 195) (6 195) – (6 195)
Totalcomprehensiveincomefortheyear – – – – – 1641 849 (16752) (162865) 311950 134823 (15815) 119008
Share-based payment adjustments – – – – – – – – – 63 154 63 154 – 63 154
Dividends paid to ordinary shareholders – – – – – – – – – (147 660) (147 660) – (147 660)
Dividends declared to perpetual preference shareholders – – – – – – – – – (39 104) (39 104) 19 435 (19 669)
Dividends paid to perpetual preference shareholders included in non-controlling interests – – – – – – – – – – – (19 435) (19 435)
Dividends paid to non-controlling interests – – – – – – – – – – – (230) (230)
Issue of ordinary shares 2 – 34 683 – – – – – – – 34 685 – 34 685
Issue of perpetual preference shares – – 24 263 – – – – – – – 24 263 – 24 263
Acquisition of non-controlling interests – – – – – – – – – (3 575) (3 575) (239) (3 814)
Non-controlling interest relating to disposal of subsidiaries – – – – – – – – – – – 220 220
Movement of treasury shares – – (21 347) (37 048) – – – – – – (58 395) – (58 395)
Transfer from capital reserve account – – – – (159) – – – – 159 – – –
Transfer to regulatory general risk reserve – – – – – – 1 877 – – (1 877) – – –
Transfer from share-based payment reserve to treasury shares – – – 20 323 – – – – – (20 323) – – –
At31March2013 223 153 2494618 (89545) 10968 10754 37322 (48384) (103742) 1412239 3724606 280043 4004649

55
113Investec integrated annual review and summary financial statements 2013
Sum
mary financial statem
ents
£’000
Ordinarysharecapital
Perpetualpreference
sharecapital
Sharepremium
Treasuryshares
Otherreserves
Retainedincome
Share-holders’
equity excluding
non-controlling
interests
Non-controllinginterests
Total equity
Capitalreserve
account
Available-for-salereserve
Regulatorygeneralrisk
reserve
Cashflowhedgereserve
Foreigncurrencyreserves
At31March2012 221 153 2457019 (72820) 11127 9113 34596 (31632) 59123 1249515 3716415 296107 4012522
Movementinreserves1April2012–31March2013
Profit after taxation – – – – – – – – – 317 491 317 491 3 317 320 808
Fair value movements on cash flow hedges taken directly to other comprehensive income – – – – – – – (17 144) – – (17 144) – (17 144)
Gains on realisation of available-for-sale assets recycled through the income statement – – – – – (1 713) – – – – (1 713) – (1 713)
Fair value movements on available-for-sale assets taken directly to other comprehensive income – – – – – 4 387 – – – – 4 387 – 4 387
Foreign currency adjustments on translating foreign operations – – – – – (1 033) 849 392 (162 865) 654 (162 003) (19 132) (181 135)
Pension fund actuarial losses – – – – – – – – – (6 195) (6 195) – (6 195)
Totalcomprehensiveincomefortheyear – – – – – 1641 849 (16752) (162865) 311950 134823 (15815) 119008
Share-based payment adjustments – – – – – – – – – 63 154 63 154 – 63 154
Dividends paid to ordinary shareholders – – – – – – – – – (147 660) (147 660) – (147 660)
Dividends declared to perpetual preference shareholders – – – – – – – – – (39 104) (39 104) 19 435 (19 669)
Dividends paid to perpetual preference shareholders included in non-controlling interests – – – – – – – – – – – (19 435) (19 435)
Dividends paid to non-controlling interests – – – – – – – – – – – (230) (230)
Issue of ordinary shares 2 – 34 683 – – – – – – – 34 685 – 34 685
Issue of perpetual preference shares – – 24 263 – – – – – – – 24 263 – 24 263
Acquisition of non-controlling interests – – – – – – – – – (3 575) (3 575) (239) (3 814)
Non-controlling interest relating to disposal of subsidiaries – – – – – – – – – – – 220 220
Movement of treasury shares – – (21 347) (37 048) – – – – – – (58 395) – (58 395)
Transfer from capital reserve account – – – – (159) – – – – 159 – – –
Transfer to regulatory general risk reserve – – – – – – 1 877 – – (1 877) – – –
Transfer from share-based payment reserve to treasury shares – – – 20 323 – – – – – (20 323) – – –
At31March2013 223 153 2494618 (89545) 10968 10754 37322 (48384) (103742) 1412239 3724606 280043 4004649

55
Investec integrated annual review and summary financial statements 2013114
Sum
mary financial statem
ents
Notes to the summary financial statements
Fortheyearto31March£’000
AssetManagement
Wealth&Investment
SpecialistBanking
Total group
Combined consolidated segmental analysis2013
Segmentalbusinessanalysis–incomestatement
Net interest income 4 501 9 049 688 976 702 526
Fee and commission income 485 783 250 315 381 453 1 117 551
Fee and commission expense (92 667) (12 755) (39 454) (144 876)
Investment income 36 555 182 298 182 889
Trading income arising from
– customer flow – 687 70 172 70 859
– balance sheet management and other trading activities (45) 360 35 083 35 398
Other operating income 9 583 777 31 793 42 153
Totaloperatingincomebeforeimpairmentlossesonloansandadvances 407191 248988 1350321 2006500
Impairment losses on loans and advances – – (251 012) (251 012)
Operatingincome 407191 248988 1099309 1755488
Operating costs (266 784) (198 321) (837 824) (1 302 929)
Depreciation on operating leased assets – – (16 072) (16 072)
Operatingprofitbeforegoodwillandacquiredintangibles 140407 50667 245413 436487
Operating income attributable to non-controlling interests (243) – (3 074) (3 317)
Operatingprofitbeforegoodwill,acquiredintangibles
andafternon-controllinginterests 140164 50667 242339 433170
Selectedreturnsandkeystatistics
ROE (pre-tax) 95.1% 15.8% 8.0% 11.9%
Return on tangible equity (pre-tax) 336.1% 104.9% 8.4% 14.6%
Cost to income ratio 65.5% 79.7% 62.8% 65.5%
Staff compensation to operating income 46.1% 55.6% 40.8% 43.7%
Operating profit per employee (£’000) 114.9 38.2 44.7 54.4
Total assets (£’million) 627 2 156 48 217 51 000

55
115Investec integrated annual review and summary financial statements 2013
Sum
mary financial statem
ents
Notes to the summary financial statements (continued)
Fortheyearto31March£’000
AssetManagement
Wealth&Investment
SpecialistBanking
Totalgroup
Combined consolidated segmental analysis (continued)
2012
Segmentalbusinessanalysis–incomestatement
Net interest income 5 163 10 083 683 801 699 047
Fee and commission income 454 762 197 535 361 082 1 013 379
Fee and commission expense (86 906) (11 354) (30 885) (129 145)
Investment income 25 (392) 174 694 174 327
Trading income arising from
– customer flow – 108 76 958 77 066
– balance sheet management and other trading activities 380 97 31 727 32 204
Other operating income 2 178 396 62 554 65 128
Totaloperatingincomebeforeimpairmentlossesonloansandadvances 375602 196473 1359931 1932006
Impairment losses on loans and advances – – (325 118) (325 118)
Operatingincome 375602 196473 1034813 1606888
Operating costs (241 529) (157 799) (831 300) (1 230 628)
Depreciation on operating leased assets – – (28 670) (28 670)
Operatingprofitbeforegoodwillandacquiredintangibles 134073 38674 174843 347590
Operating (income)/losses attributable to non-controlling interests (380) 47 11 368 11 035
Operatingprofitbeforegoodwill,acquiredintangibles
andafternon-controllinginterests 133693 38721 186211 358625
Selectedreturnsandkeystatistics
ROE (pre-tax) 84.0% 13.1% 6.2% 9.7%
Return on tangible equity (pre-tax) 288.6% 46.9% 6.5% 11.8%
Cost to income ratio 64.3% 80.3% 62.4% 64.7%
Staff compensation to operating income 45.9% 57.2% 40.2% 43.0%
Operating profit per employee (£’000) 119.2 33.7 35.5 47.8
Total assets (£’million) 539 796 50 215 51 550

55
Investec integrated annual review and summary financial statements 2013116
Sum
mary financial statem
ents
Notes to the summary financial statements (continued)
Fortheyearto31March£’000
UKandOther
SouthernAfrica Australia
Total group
Combined consolidated segmental analysis (continued)
2013
Segmentalgeographicanalysis–incomestatement
Net interest income 290 645 342 793 69 088 702 526
Fee and commission income 701 620 356 500 59 431 1 117 551
Fee and commission expense (127 170) (13 180) (4 526) (144 876)
Investment income 98 119 84 232 538 182 889
Trading income arising from
– customer flow 51 158 12 755 6 946 70 859
– balance sheet management and other trading activities 19 939 16 023 (564) 35 398
Other operating income 34 782 5 562 1 809 42 153
Totaloperatingincomebeforeimpairmentlossesonloansandadvances 1069093 804685 132722 2006500
Impairment losses on loans and advances (171 187) (61 976) (17 849) (251 012)
Operatingincome 897906 742709 114873 1755488
Operating costs (737 030) (454 427) (111 472) (1 302 929)
Depreciation on operating leased assets (16 072) – – (16 072)
Operatingprofitbeforegoodwillandacquiredintangibles 144804 288282 3401 436487
Operating income attributable to non-controlling interests (397) (2 920) – (3 317)
Operatingprofitbeforegoodwill,acquiredintangiblesandafternon-controllinginterests 144407 285362 3401 433170
Impairment of goodwill (13 402) (1 773) – (15 175)
Amortisation of acquired intangibles (13 313) – – (13 313)
Costs arising from integration of acquired subsidiaries (13 119) – – (13 119)
Non-operational costs arising from acquisition of subsidiary (1 249) – – (1 249)
Earningsattributabletoshareholdersbeforetaxation 103324 283589 3401 390314
Taxation on operating profit before goodwill (31 537) (48 693) 1 430 (78 800)
Taxation on acquired intangibles and acquisition/disposal/ integration of subsidiaries 5 977 – – 5 977
Earningsattributabletoshareholders 77764 234896 4831 317491
Selectedreturnsandkeystatistics
ROE (post-tax) 6.6% 14.9% 1.2% 9.5%
Return on tangible equity (post-tax) 10.4% 15.0% 1.4% 11.7%
Cost to income ratio 70.0% 56.5% 84.0% 65.5%
Staff compensation to operating income 47.2% 36.9% 56.5% 43.7%
Operating profit per employee (£’000) 42.6 69.3 7.5 54.4
Effective operational tax rate 21.8% 16.9% (42.0%) 18.1%
Total assets (£’million) 20 179 27 575 3 246 51 000
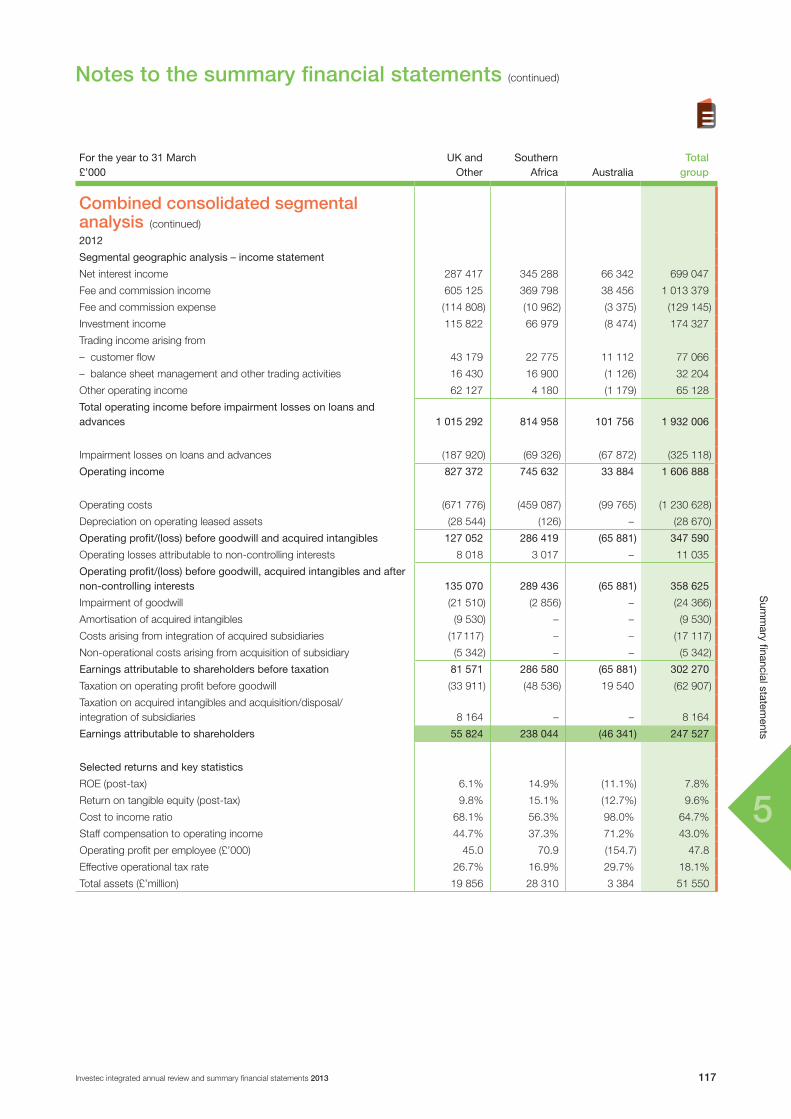
55
117Investec integrated annual review and summary financial statements 2013
Sum
mary financial statem
ents
Notes to the summary financial statements (continued)
Fortheyearto31March£’000
UKandOther
SouthernAfrica Australia
Total group
Combined consolidated segmental analysis (continued)
2012
Segmentalgeographicanalysis–incomestatement
Net interest income 287 417 345 288 66 342 699 047
Fee and commission income 605 125 369 798 38 456 1 013 379
Fee and commission expense (114 808) (10 962) (3 375) (129 145)
Investment income 115 822 66 979 (8 474) 174 327
Trading income arising from
– customer flow 43 179 22 775 11 112 77 066
– balance sheet management and other trading activities 16 430 16 900 (1 126) 32 204
Other operating income 62 127 4 180 (1 179) 65 128
Totaloperatingincomebeforeimpairmentlossesonloansandadvances 1015292 814958 101756 1932006
Impairment losses on loans and advances (187 920) (69 326) (67 872) (325 118)
Operatingincome 827372 745632 33884 1606888
Operating costs (671 776) (459 087) (99 765) (1 230 628)
Depreciation on operating leased assets (28 544) (126) – (28 670)
Operatingprofit/(loss)beforegoodwillandacquiredintangibles 127052 286419 (65881) 347590
Operating losses attributable to non-controlling interests 8 018 3 017 – 11 035
Operatingprofit/(loss)beforegoodwill,acquiredintangiblesandafternon-controllinginterests 135070 289436 (65881) 358625
Impairment of goodwill (21 510) (2 856) – (24 366)
Amortisation of acquired intangibles (9 530) – – (9 530)
Costs arising from integration of acquired subsidiaries (17 117) – – (17 117)
Non-operational costs arising from acquisition of subsidiary (5 342) – – (5 342)
Earningsattributabletoshareholdersbeforetaxation 81571 286580 (65881) 302270
Taxation on operating profit before goodwill (33 911) (48 536) 19 540 (62 907)
Taxation on acquired intangibles and acquisition/disposal/integration of subsidiaries 8 164 – – 8 164
Earningsattributabletoshareholders 55824 238044 (46341) 247527
Selectedreturnsandkeystatistics
ROE (post-tax) 6.1% 14.9% (11.1%) 7.8%
Return on tangible equity (post-tax) 9.8% 15.1% (12.7%) 9.6%
Cost to income ratio 68.1% 56.3% 98.0% 64.7%
Staff compensation to operating income 44.7% 37.3% 71.2% 43.0%
Operating profit per employee (£’000) 45.0 70.9 (154.7) 47.8
Effective operational tax rate 26.7% 16.9% 29.7% 18.1%
Total assets (£’million) 19 856 28 310 3 384 51 550

55
Investec integrated annual review and summary financial statements 2013118
Sum
mary financial statem
ents
Notes to the summary financial statements (continued)
At31March£’000
UKandOther
SouthernAfrica Australia
Total group
Combined consolidated segmental analysis (continued)
2013
Segmentalgeographicanalysis–balancesheetassetsandliabilities
Assets
Cash and balances at central banks 1 228 390 406 777 147 280 1 782 447
Loans and advances to banks 1 226 201 1 818 269 85 176 3 129 646
Non-sovereign and non-bank cash placements – 420 960 – 420 960
Reverse repurchase agreements and cash collateral on securities borrowed 1 223 251 1 135 421 – 2 358 672
Sovereign debt securities 1 365 464 2 416 839 294 914 4 077 217
Bank debt securities 275 173 1 423 904 180 028 1 879 105
Other debt securities 176 440 258 706 22 506 457 652
Derivative financial instruments 1 037 004 870 899 74 668 1 982 571
Securities arising from trading activities 665 494 257 840 8 269 931 603
Investment portfolio 377 094 571 740 11 530 960 364
Loans and advances to customers 6 045 063 9 725 609 1 713 852 17 484 524
Own originated loans and advances to customers securitised – 439 255 491 194 930 449
Other loans and advances 1 781 632 336 111 – 2 117 743
Other securitised assets 2 769 126 113 466 – 2 882 592
Interests in associated undertakings 20 828 3 243 3 879 27 950
Deferred taxation assets 78 490 38 635 48 332 165 457
Other assets 1 256 193 607 728 96 517 1 960 438
Property and equipment 70 619 46 108 9 811 126 538
Investment properties 11 500 440 475 – 451 975
Goodwill 406 389 10 260 50 257 466 906
Intangible assets 164 330 6 436 7 801 178 567
20178681 21348681 3246014 44773376
Other financial instruments at fair value through profit or loss in respect of liabilities to customers – 6 226 142 – 6 226 142
20178681 27574823 3246014 50999518
Liabilities
Deposits by banks 1 696 682 1 279 782 – 2 976 464
Derivative financial instruments 723 236 661 888 58 201 1 443 325
Other trading liabilities 372 762 479 177 – 851 939
Repurchase agreements and cash collateral on securities lent 942 396 997 762 – 1 940 158
Customer accounts (deposits) 9 560 920 13 278 098 1 692 820 24 531 838
Debt securities in issue 990 744 440 343 470 689 1 901 776
Liabilities arising on securitisation of own originated loans and advances 77 448 355 477 903 926 335
Liabilities arising on securitisation of other assets 2 195 345 42 236 – 2 237 581
Current taxation liabilities 87 470 123 005 – 210 475
Deferred taxation liabilities 77 851 31 777 – 109 628
Other liabilities 1 311 425 520 977 55 000 1 887 402
17958908 18303400 2754613 39016921
Liabilities to customers under investment contracts – 6 224 062 – 6 224 062
Insurance liabilities, including unit-linked liabilities – 2 080 – 2 080
17958908 24529542 2754613 45243063
Subordinated liabilities 664 624 1 004 562 82 620 1 751 806
18623532 25534104 2837233 46994869

55
119Investec integrated annual review and summary financial statements 2013
Sum
mary financial statem
ents
Notes to the summary financial statements (continued)
At31March£’000
UKandOther
SouthernAfrica Australia
Total group
Combined consolidated segmental analysis (continued)
2012
Segmentalgeographicanalysis–balancesheetassetsandliabilities
Assets
Cash and balances at central banks 1 655 824 758 002 180 025 2 593 851
Loans and advances to banks 985 727 1 671 153 68 467 2 725 347
Non-sovereign and non-bank cash placements – 642 480 – 642 480
Reverse repurchase agreements and cash collateral on securities borrowed 522 180 453 812 – 975 992
Sovereign debt securities 1 415 447 2 419 822 231 824 4 067 093
Bank debt securities 294 383 2 256 509 530 169 3 081 061
Other debt securities 100 219 195 753 81 860 377 832
Derivative financial instruments 916 994 862 887 133 769 1 913 650
Securities arising from trading activities 365 686 267 576 6 884 640 146
Investment portfolio 308 027 570 590 12 085 890 702
Loans and advances to customers 5 788 127 9 990 781 1 413 300 17 192 208
Own originated loans and advances to customers securitised – 499 166 535 008 1 034 174
Other loans and advances 2 496 508 332 681 – 2 829 189
Other securitised assets 2 961 970 139 452 – 3 101 422
Interests in associated undertakings 19 231 3 076 5 199 27 506
Deferred taxation assets 75 175 30 691 44 515 150 381
Other assets 1 234 108 488 561 79 452 1 802 121
Property and equipment 117 718 44 188 9 779 171 685
Investment properties 11 500 395 795 – 407 295
Goodwill 409 837 13 696 44 787 468 320
Intangible assets 176 988 7 902 7 209 192 099
19855649 22044573 3384332 45284554
Other financial instruments at fair value through profit or loss in respect of liabilities to customers – 6 265 846 – 6 265 846
19855649 28310419 3384332 51550400
Liabilities
Deposits by banks 1 832 180 1 135 248 – 2 967 428
Derivative financial instruments 635 996 698 243 86 891 1 421 130
Other trading liabilities 271 627 341 257 – 612 884
Repurchase agreements and cash collateral on securities lent 1 020 670 843 467 – 1 864 137
Customer accounts (deposits) 9 459 554 14 347 614 1 536 603 25 343 771
Debt securities in issue 1 109 268 357 494 777 186 2 243 948
Liabilities arising on securitisation of own originated loans and advances – 509 728 526 946 1 036 674
Liabilities arising on securitisation of other assets 2 361 986 40 057 – 2 402 043
Current taxation liabilities 77 188 132 421 – 209 609
Deferred taxation liabilities 76 489 25 989 – 102 478
Other liabilities 1 108 343 430 194 36 617 1 575 154
17953301 18861712 2964243 39779256
Liabilities to customers under investment contracts – 6 263 913 – 6 263 913
Insurance liabilities, including unit-linked liabilities – 1 933 – 1 933
17953301 25127558 2964243 46045102
Subordinated liabilities 661 920 784 501 46 355 1 492 776
18615221 25912059 3010598 47537878

55
Investec integrated annual review and summary financial statements 2013120
Sum
mary financial statem
ents
Notes to the summary financial statements (continued)
AssetManagement Wealth&Investment SpecialistBanking Total
group Fortheyearto31March£’000
UKandOther
SouthernAfrica Total
UKandOther
SouthernAfrica Total
UKandOther
SouthernAfrica Australia Total
Combined consolidated segmental analysis(continued)
Segmentalbusinessandgeographicanalysis–incomestatement
2013
Net interest income 492 4 009 4 501 10 293 (1 244) 9 049 279 860 340 028 69 088 688 976 702 526
Fee and commission income 309 933 175 850 485 783 195 275 55 040 250 315 196 412 125 610 59 431 381 453 1 117 551
Fee and commission expense (92 667) – (92 667) (11 772) (983) (12 755) (22 731) (12 197) (4 526) (39 454) (144 876)
Investment income – 36 36 555 – 555 97 564 84 196 538 182 298 182 889
Trading income arising from
– customer flow – – – 361 326 687 50 797 12 429 6 946 70 172 70 859
– balance sheet management and other trading activities (199) 154 (45) 4 356 360 20 134 15 513 (564) 35 083 35 398
Other operating income 4 476 5 107 9 583 775 2 777 29 531 453 1 809 31 793 42 153
Totaloperatingincomebeforeimpairmentlossesonloansandadvances 222035 185156 407191 195491 53497 248988 651567 566032 132722 1350321 2006500
Impairment losses on loans and advances – – – – – – (171 187) (61 976) (17 849) (251 012) (251 012)
Operatingincome 222035 185156 407191 195491 53497 248988 480380 504056 114873 1099309 1755488
Operating costs (162 694) (104 090) (266 784) (161 581) (36 740) (198 321) (412 755) (313 597) (111 472) (837 824) (1 302 929)
Depreciation on operating leased assets – – – – – – (16 072) – – (16 072) (16 072)
Operatingprofitbeforegoodwillandacquiredintangibles 59341 81066 140407 33910 16757 50667 51553 190459 3401 245413 436487
Operating income attributable to non-controlling interests – (243) (243) – – – (397) (2 677) – (3 074) (3 317)
Operatingprofitbeforegoodwill,acquiredintangiblesandafter
non-controllinginterests 59341 80823 140164 33910 16757 50667 51156 187782 3401 242339 433170
Selectedreturnsandkeystatistics
Cost to income ratio 73.3% 56.2% 65.5% 82.7% 68.7% 79.7% 65.0% 55.4% 84.0% 62.8% 65.5%
Staff compensation to operating income 53.7% 37.0% 46.1% 58.2% 45.8% 55.6% 41.8% 36.1% 56.5% 40.8% 43.7%
2012
Net interest income 652 4 511 5 163 8 648 1 435 10 083 278 117 339 342 66 342 683 801 699 047
Fee and commission income 288 580 166 182 454 762 142 360 55 175 197 535 174 185 148 441 38 456 361 082 1 013 379
Fee and commission expense (86 906) – (86 906) (8 182) (3 172) (11 354) (19 720) (7 790) (3 375) (30 885) (129 145)
Investment income – 25 25 (392) – (392) 116 214 66 954 (8 474) 174 694 174 327
Trading income arising from
– customer flow – – – (386) 494 108 43 565 22 281 11 112 76 958 77 066
– balance sheet management and other trading activities 61 319 380 (7) 104 97 16 376 16 477 (1 126) 31 727 32 204
Other operating income (309) 2 487 2 178 406 (10) 396 62 030 1 703 (1 179) 62 554 65 128
Totaloperatingincomebeforeimpairmentlossesonloansandadvances 202078 173524 375602 142447 54026 196473 670767 587408 101756 1359931 1932006
Impairment losses on loans and advances – – – – – – (187 920) (69 326) (67 872) (325 118) (325 118)
Operatingincome 202078 173524 375602 142447 54026 196473 482847 518082 33884 1034813 1606888
Operating costs (143 156) (98 373) (241 529) (119 226) (38 573) (157 799) (409 394) (322 141) (99 765) (831 300) (1 230 628)
Depreciation on operating leased assets – – – – – – (28 544) (126) – (28 670) (28 670)
Operatingprofitbeforegoodwillandacquiredintangibles 58922 75151 134073 23221 15453 38674 44909 195815 (65881) 174843 347590
Operating losses/(income)attributable to non-controlling interests – (380) (380) 47 – 47 7 971 3 397 – 11 368 11 035
Operatingprofitbeforegoodwill,acquiredintangiblesandafter
non-controllinginterests 58922 74771 133693 23268 15453 38721 52880 199212 (65881) 186211 358625
Selectedreturnsandkeystatistics
Cost to income ratio 70.8% 56.7% 64.3% 83.7% 71.4% 80.3% 63.7% 54.9% 98.0% 62.4% 64.7%
Staff compensation to operating income 53.6% 36.9% 45.9% 60.6% 48.3% 57.2% 38.7% 36.5% 71.2% 40.2% 43.0%

55
121Investec integrated annual review and summary financial statements 2013
Sum
mary financial statem
ents
AssetManagement Wealth&Investment SpecialistBanking Total
group Fortheyearto31March£’000
UKandOther
SouthernAfrica Total
UKandOther
SouthernAfrica Total
UKandOther
SouthernAfrica Australia Total
Combined consolidated segmental analysis(continued)
Segmentalbusinessandgeographicanalysis–incomestatement
2013
Net interest income 492 4 009 4 501 10 293 (1 244) 9 049 279 860 340 028 69 088 688 976 702 526
Fee and commission income 309 933 175 850 485 783 195 275 55 040 250 315 196 412 125 610 59 431 381 453 1 117 551
Fee and commission expense (92 667) – (92 667) (11 772) (983) (12 755) (22 731) (12 197) (4 526) (39 454) (144 876)
Investment income – 36 36 555 – 555 97 564 84 196 538 182 298 182 889
Trading income arising from
– customer flow – – – 361 326 687 50 797 12 429 6 946 70 172 70 859
– balance sheet management and other trading activities (199) 154 (45) 4 356 360 20 134 15 513 (564) 35 083 35 398
Other operating income 4 476 5 107 9 583 775 2 777 29 531 453 1 809 31 793 42 153
Totaloperatingincomebeforeimpairmentlossesonloansandadvances 222035 185156 407191 195491 53497 248988 651567 566032 132722 1350321 2006500
Impairment losses on loans and advances – – – – – – (171 187) (61 976) (17 849) (251 012) (251 012)
Operatingincome 222035 185156 407191 195491 53497 248988 480380 504056 114873 1099309 1755488
Operating costs (162 694) (104 090) (266 784) (161 581) (36 740) (198 321) (412 755) (313 597) (111 472) (837 824) (1 302 929)
Depreciation on operating leased assets – – – – – – (16 072) – – (16 072) (16 072)
Operatingprofitbeforegoodwillandacquiredintangibles 59341 81066 140407 33910 16757 50667 51553 190459 3401 245413 436487
Operating income attributable to non-controlling interests – (243) (243) – – – (397) (2 677) – (3 074) (3 317)
Operatingprofitbeforegoodwill,acquiredintangiblesandafter
non-controllinginterests 59341 80823 140164 33910 16757 50667 51156 187782 3401 242339 433170
Selectedreturnsandkeystatistics
Cost to income ratio 73.3% 56.2% 65.5% 82.7% 68.7% 79.7% 65.0% 55.4% 84.0% 62.8% 65.5%
Staff compensation to operating income 53.7% 37.0% 46.1% 58.2% 45.8% 55.6% 41.8% 36.1% 56.5% 40.8% 43.7%
2012
Net interest income 652 4 511 5 163 8 648 1 435 10 083 278 117 339 342 66 342 683 801 699 047
Fee and commission income 288 580 166 182 454 762 142 360 55 175 197 535 174 185 148 441 38 456 361 082 1 013 379
Fee and commission expense (86 906) – (86 906) (8 182) (3 172) (11 354) (19 720) (7 790) (3 375) (30 885) (129 145)
Investment income – 25 25 (392) – (392) 116 214 66 954 (8 474) 174 694 174 327
Trading income arising from
– customer flow – – – (386) 494 108 43 565 22 281 11 112 76 958 77 066
– balance sheet management and other trading activities 61 319 380 (7) 104 97 16 376 16 477 (1 126) 31 727 32 204
Other operating income (309) 2 487 2 178 406 (10) 396 62 030 1 703 (1 179) 62 554 65 128
Totaloperatingincomebeforeimpairmentlossesonloansandadvances 202078 173524 375602 142447 54026 196473 670767 587408 101756 1359931 1932006
Impairment losses on loans and advances – – – – – – (187 920) (69 326) (67 872) (325 118) (325 118)
Operatingincome 202078 173524 375602 142447 54026 196473 482847 518082 33884 1034813 1606888
Operating costs (143 156) (98 373) (241 529) (119 226) (38 573) (157 799) (409 394) (322 141) (99 765) (831 300) (1 230 628)
Depreciation on operating leased assets – – – – – – (28 544) (126) – (28 670) (28 670)
Operatingprofitbeforegoodwillandacquiredintangibles 58922 75151 134073 23221 15453 38674 44909 195815 (65881) 174843 347590
Operating losses/(income)attributable to non-controlling interests – (380) (380) 47 – 47 7 971 3 397 – 11 368 11 035
Operatingprofitbeforegoodwill,acquiredintangiblesandafter
non-controllinginterests 58922 74771 133693 23268 15453 38721 52880 199212 (65881) 186211 358625
Selectedreturnsandkeystatistics
Cost to income ratio 70.8% 56.7% 64.3% 83.7% 71.4% 80.3% 63.7% 54.9% 98.0% 62.4% 64.7%
Staff compensation to operating income 53.6% 36.9% 45.9% 60.6% 48.3% 57.2% 38.7% 36.5% 71.2% 40.2% 43.0%
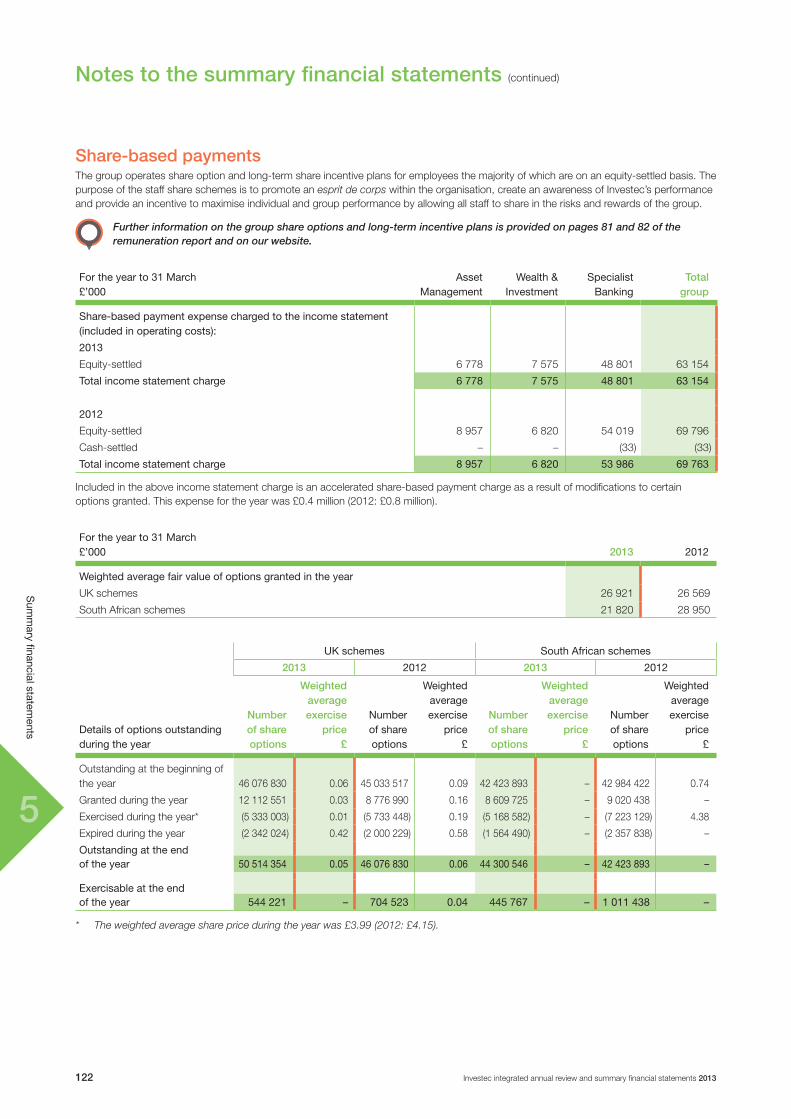
55
Investec integrated annual review and summary financial statements 2013122
Sum
mary financial statem
ents
Notes to the summary financial statements (continued)
Share-based payments The group operates share option and long-term share incentive plans for employees the majority of which are on an equity-settled basis. The purpose of the staff share schemes is to promote an esprit de corps within the organisation, create an awareness of Investec’s performance and provide an incentive to maximise individual and group performance by allowing all staff to share in the risks and rewards of the group.
Further information on the group share options and long-term incentive plans is provided on pages 81 and 82 of the remuneration report and on our website.
Fortheyearto31March£’000
AssetManagement
Wealth&Investment
SpecialistBanking
Total group
Share-basedpaymentexpensechargedtotheincomestatement(includedinoperatingcosts):
2013
Equity-settled 6 778 7 575 48 801 63 154
Totalincomestatementcharge 6778 7575 48801 63154
2012
Equity-settled 8 957 6 820 54 019 69 796
Cash-settled – – (33) (33)
Totalincomestatementcharge 8957 6820 53986 69763
Included in the above income statement charge is an accelerated share-based payment charge as a result of modifications to certain options granted. This expense for the year was £0.4 million (2012: £0.8 million).
Fortheyearto31March£’000 2013 2012
Weightedaveragefairvalueofoptionsgrantedintheyear
UK schemes 26 921 26 569
South African schemes 21 820 28 950
UKschemes SouthAfricanschemes
2013 2012 2013 2012
Detailsofoptionsoutstandingduringtheyear
Number of share options
Weighted average exercise
price£
Numberofshareoptions
Weightedaverageexercise
price£
Number of share options
Weighted average exercise
price£
Numberofshareoptions
Weightedaverageexercise
price£
Outstanding at the beginning of the year 46 076 830 0.06 45 033 517 0.09 42 423 893 – 42 984 422 0.74
Granted during the year 12 112 551 0.03 8 776 990 0.16 8 609 725 – 9 020 438 –
Exercised during the year* (5 333 003) 0.01 (5 733 448) 0.19 (5 168 582) – (7 223 129) 4.38
Expired during the year (2 342 024) 0.42 (2 000 229) 0.58 (1 564 490) – (2 357 838) –
Outstandingattheendoftheyear 50514354 0.05 46076830 0.06 44300546 – 42423893 –
Exercisableattheendoftheyear 544221 – 704523 0.04 445767 – 1011438 –
* The weighted average share price during the year was £3.99 (2012: £4.15).
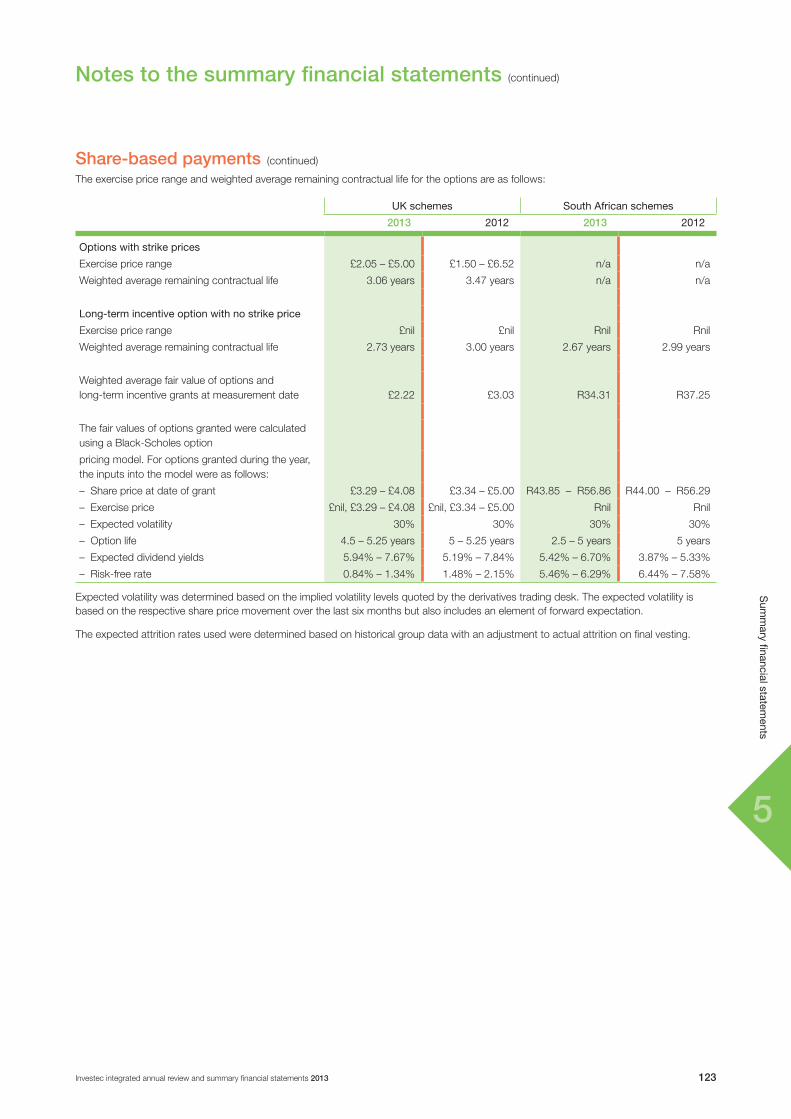
55
123Investec integrated annual review and summary financial statements 2013
Sum
mary financial statem
ents
Notes to the summary financial statements (continued)
Share-based payments (continued)
The exercise price range and weighted average remaining contractual life for the options are as follows:
UKschemes SouthAfricanschemes
2013 2012 2013 2012
Optionswithstrikeprices
Exercise price range £2.05 – £5.00 £1.50 – £6.52 n/a n/a
Weighted average remaining contractual life 3.06 years 3.47 years n/a n/a
Long-termincentiveoptionwithnostrikeprice
Exercise price range £nil £nil Rnil Rnil
Weighted average remaining contractual life 2.73 years 3.00 years 2.67 years 2.99 years
Weighted average fair value of options and long-term incentive grants at measurement date £2.22 £3.03 R34.31 R37.25
The fair values of options granted were calculated using a Black-Scholes option
pricing model. For options granted during the year, the inputs into the model were as follows:
– Share price at date of grant £3.29 – £4.08 £3.34 – £5.00 R43.85 – R56.86 R44.00 – R56.29
– Exercise price £nil, £3.29 – £4.08 £nil, £3.34 – £5.00 Rnil Rnil
– Expected volatility 30% 30% 30% 30%
– Option life 4.5 – 5.25 years 5 – 5.25 years 2.5 – 5 years 5 years
– Expected dividend yields 5.94% – 7.67% 5.19% – 7.84% 5.42% – 6.70% 3.87% – 5.33%
– Risk-free rate 0.84% – 1.34% 1.48% – 2.15% 5.46% – 6.29% 6.44% – 7.58%
Expected volatility was determined based on the implied volatility levels quoted by the derivatives trading desk. The expected volatility is based on the respective share price movement over the last six months but also includes an element of forward expectation.
The expected attrition rates used were determined based on historical group data with an adjustment to actual attrition on final vesting.

55
Investec integrated annual review and summary financial statements 2013124
Sum
mary financial statem
ents
Notes to the summary financial statements (continued)
Fortheyearto31March 2013 2012
Earnings per share
Earnings£’000 £’000
Earnings attributable to shareholders 317 491 247 527
Preference dividends paid (39 104) (39 306)
Earningsanddilutedearningsattributabletoordinaryshareholders 278387 208221
Weightednumberofsharesinissue
Weighted total average number of shares in issue during the year 882 683 311 831 688 923
Weighted average number of treasury shares (26 726 003) (22 133 785)
Weighted average number of shares in issue during the year 855957308 809555138
Weighted average number of shares resulting from future dilutive potential shares 53 589 518 46 272 969
Adjustedweightednumberofsharespotentiallyinissue 909546826 855828107
Earningspershare–pence 32.5 25.7
Basic earnings per share is calculated by dividing the earnings attributable to the ordinary shareholders in Investec plc and Investec Limited by the weighted average number of ordinary shares in issue during the year.
Dilutedearningspershare–pence 30.6 24.3
Diluted earnings per share is calculated by dividing the earnings attributable to the ordinary shareholders of Investec plc and Investec Limited, adjusted for the effects of dilutive ordinary potential shares, by the weighted average number of shares in issue during the year plus the weighted average number of ordinary shares that would be issued on conversion of the dilutive ordinary potential shares during the year.
Adjustedearningspershare–pence 37.0 31.8
Adjusted earnings per share is calculated by dividing the earnings before deducting goodwill impairment and non-operating items attributable to the ordinary shareholders, after taking into account earnings attributable to perpetual preference shareholders, by the weighted average number of ordinary shares in issue during the year.
£’000 £’000
Earnings attributable to shareholders 317 491 247 527
Impairment of goodwill 15 175 24 366
Amortisation of acquired intangibles, net of taxation 9 852 7 052
Costs arising from acquisition of subsidiary (including integration costs), net of taxation 11 852 16 773
Preference dividends paid (39 104) (39 306)
Additional losses/(earnings) attributable to other equity holders* 109 (557)
Currency hedge attributable to perpetual equity instruments* 1 334 1 724
Adjustedearningsattributabletoordinaryshareholdersbeforegoodwill,acquiredintangiblesandnon-operatingitems 316709 257579
* In accordance with IFRS, dividends attributable to equity holders are accounted for when a constructive liability arises i.e. on declaration by the board of directors and approval by the shareholders where required. Investec is of the view that EPS is best reflected by adjusting for earnings that are attributed to equity instruments (other than ordinary shares) on an accrual basis and therefore adjusts the paid dividend on such instruments to accrued in arriving at adjusted EPS.
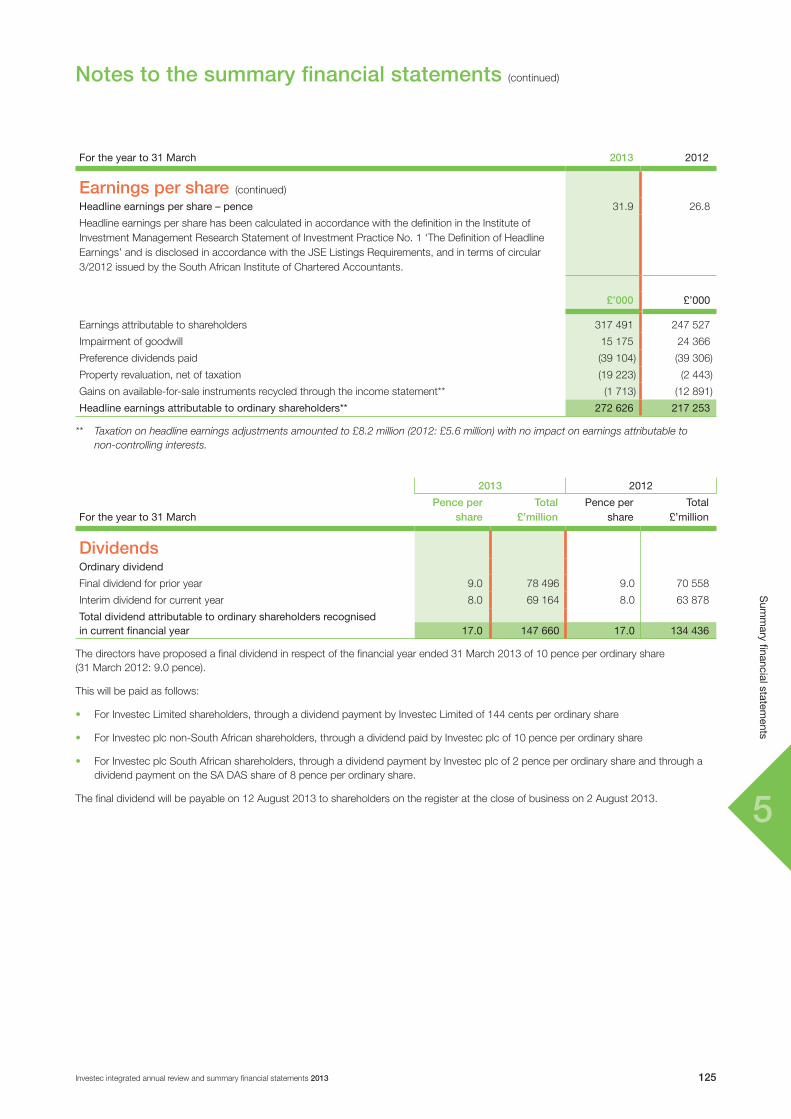
55
125Investec integrated annual review and summary financial statements 2013
Sum
mary financial statem
ents
Notes to the summary financial statements (continued)
Fortheyearto31March 2013 2012
Earnings per share (continued)
Headlineearningspershare–pence 31.9 26.8
Headline earnings per share has been calculated in accordance with the definition in the Institute of Investment Management Research Statement of Investment Practice No. 1 ‘The Definition of Headline Earnings’ and is disclosed in accordance with the JSE Listings Requirements, and in terms of circular 3/2012 issued by the South African Institute of Chartered Accountants.
£’000 £’000
Earnings attributable to shareholders 317 491 247 527
Impairment of goodwill 15 175 24 366
Preference dividends paid (39 104) (39 306)
Property revaluation, net of taxation (19 223) (2 443)
Gains on available-for-sale instruments recycled through the income statement** (1 713) (12 891)
Headlineearningsattributabletoordinaryshareholders** 272626 217253
** Taxation on headline earnings adjustments amounted to £8.2 million (2012: £5.6 million) with no impact on earnings attributable to non-controlling interests.
2013 2012
Fortheyearto31MarchPence per
shareTotal
£’millionPenceper
shareTotal
£’million
DividendsOrdinarydividend
Final dividend for prior year 9.0 78 496 9.0 70 558
Interim dividend for current year 8.0 69 164 8.0 63 878
Totaldividendattributabletoordinaryshareholdersrecognisedincurrentfinancialyear 17.0 147660 17.0 134436
The directors have proposed a final dividend in respect of the financial year ended 31 March 2013 of 10 pence per ordinary share (31 March 2012: 9.0 pence).
This will be paid as follows:
• For Investec Limited shareholders, through a dividend payment by Investec Limited of 144 cents per ordinary share
• For Investec plc non-South African shareholders, through a dividend paid by Investec plc of 10 pence per ordinary share
• For Investec plc South African shareholders, through a dividend payment by Investec plc of 2 pence per ordinary share and through a dividend payment on the SA DAS share of 8 pence per ordinary share.
The final dividend will be payable on 12 August 2013 to shareholders on the register at the close of business on 2 August 2013.
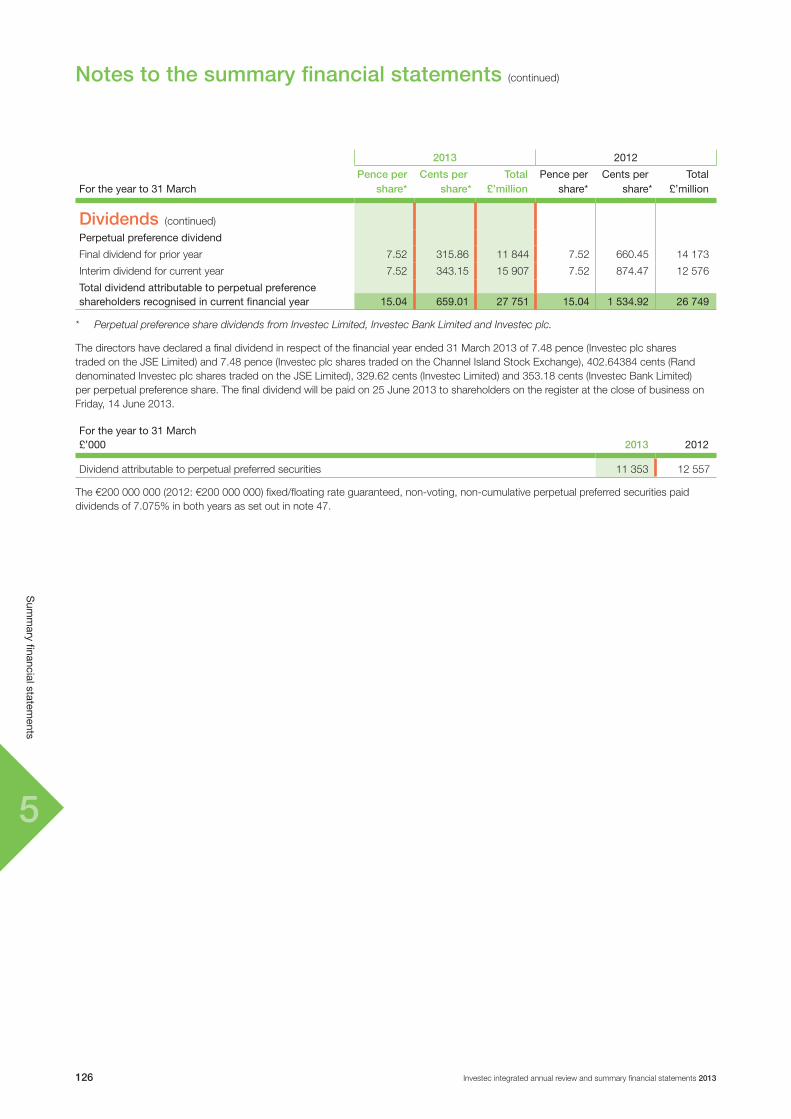
55
Investec integrated annual review and summary financial statements 2013126
Sum
mary financial statem
ents
Notes to the summary financial statements (continued)
2013 2012
Fortheyearto31MarchPence per
share* Cents per
share* Total
£’millionPenceper
share*Centsper
share*Total
£’million
Dividends (continued)
Perpetualpreferencedividend
Final dividend for prior year 7.52 315.86 11 844 7.52 660.45 14 173
Interim dividend for current year 7.52 343.15 15 907 7.52 874.47 12 576
Totaldividendattributabletoperpetualpreferenceshareholdersrecognisedincurrentfinancialyear 15.04 659.01 27751 15.04 1534.92 26749
* Perpetual preference share dividends from Investec Limited, Investec Bank Limited and Investec plc.
The directors have declared a final dividend in respect of the financial year ended 31 March 2013 of 7.48 pence (Investec plc shares traded on the JSE Limited) and 7.48 pence (Investec plc shares traded on the Channel Island Stock Exchange), 402.64384 cents (Rand denominated Investec plc shares traded on the JSE Limited), 329.62 cents (Investec Limited) and 353.18 cents (Investec Bank Limited) per perpetual preference share. The final dividend will be paid on 25 June 2013 to shareholders on the register at the close of business on Friday, 14 June 2013.
Fortheyearto31March£’000 2013 2012
Dividend attributable to perpetual preferred securities 11 353 12 557
The €200 000 000 (2012: €200 000 000) fixed/floating rate guaranteed, non-voting, non-cumulative perpetual preferred securities paid dividends of 7.075% in both years as set out in note 47.

55
127Investec integrated annual review and summary financial statements 2013
Sum
mary financial statem
ents
Notes to the summary financial statements (continued)
At31March 2013 2012
Ordinary share capitalInvestecplc
Issued, allotted and fully paid
Numberofordinaryshares Number Number
At beginning of year 598 339 612 537 176 089
Issued during the year 6 857 159 61 163 523
Atendofyear 605196771 598339612
Nominalvalueofordinaryshares £’000 £’000
At beginning of year 120 108
Issued during the year 1 12
Atendofyear 121 120
Numberofspecialconvertingshares Number Number
At beginning of year 276 020 221 272 836 668
Issued during the year 3 618 943 3 183 553
Atendofyear 279639164 276020221
Nominalvalueofspecialconvertingshares £’000 £’000
At beginning of year 55 54
Issued during the year 1 1
Atendofyear 56 55
NumberofUKDANshares Number Number
At beginning and end of year 1 1
NominalvalueofUKDANshare £’000 £’000
At beginning and end of year * *
NumberofUKDASshares Number Number
At beginning and end of year 1 1
* Less than £1 000.

55
Investec integrated annual review and summary financial statements 2013128
Sum
mary financial statem
ents
Notes to the summary financial statements (continued)
At31March 2013 2012
Ordinary share capital (continued)
NominalvalueofUKDASshare £’000 £’000
At beginning and end of year * *
Numberofspecialvotingshares Number Number
At beginning and end of year 1 1
Nominalvalueofspecialvotingshare £’000 £’000
At beginning and end of year * *
InvestecLimited
Authorised
The authorised share capital of Investec Limited is R1 268 002 (2012: R1 268 002), comprising 450 000 000 (2012: 450 000 000) ordinary shares of R0.0002 each, 40 000 000 (2012: 40 000 000) Class ‘A’ variable rate compulsorily convertible non-cumulative preference shares of R0.0002 each, 50 000 (2012: 50 000) variable rate cumulative redeemable preference shares of R0.60 each, 100 000 000 (2012: 100 000 000) non-redeemable non-cumulative non-participating preference shares of R0.01 each, 1 (2012: 1) Dividend Access (South African Resident) redeemable preference share of R1, 1 (2012: 1) Dividend Access (Non-South African Resident) redeemable preference share of R1, 700 000 000 (2012: 700 000 000) special convertible redeemable preference shares of R0.0002 each (special converting shares).
Issued,allottedandfullypaid
Numberofordinaryshares Number Number
At beginning of year 276 020 221 272 836 668
Issued during the year 3 618 943 3 183 553
Atendofyear 279639164 276020221
Nominalvalueofordinaryshares £’000 £'000
At beginning of year 46 46
Issued during the year * *
Atendofyear 46 46
Numberofspecialconvertingshares Number Number
At beginning of year 598 339 612 537 176 089
Issued during the year 6 857 159 61 163 523
Atendofyear 605196771 598339612
Nominalvalueofspecialconvertingshares £’000 £'000
At beginning of year 5 5
Issued during the year * *
Atendofyear 5 5
NumberofSADANshares Number Number
At beginning and end of year 1 1
NominalvalueofSADANshare £’000 £'000
At beginning and end of year * *
* Less than £1 000.

55
129Investec integrated annual review and summary financial statements 2013
Sum
mary financial statem
ents
Notes to the summary financial statements (continued)
At31March 2013 2012
Ordinary share capital (continued)
NumberofSADASshares Number Number
At beginning and end of year 1 1
NominalvalueofSADASshare £’000 £'000
At beginning and end of year * *
Nominal value of issued, allotted and fully paid called up share capital
of Investec plc and Investec Limited
Total called up share capital 228 226
Less: held by Investec Limited (2) (2)
Less: held by Investec plc (3) (3)
Totalcalledupsharecapital 223 221
* Less than £1 000.
The Investec Limited shares were issued in South African Rand. The amounts recorded above were calculated by reference to historic Pounds Sterling/Rand exchange rates.
In terms of the DLC structure shareholders have common economic and voting rights as if Investec Limited and Investec plc were a single company. These include equivalent dividends on a per share basis, joint electorate and class right variations. The UK DAS share, UK DAN share, SA DAS share, the SA DAN share and the special converting shares have been issued to achieve this.
The unissued shares are under the control of the directors until the next annual general meeting.
Staff share scheme The group operates a share option and a long-term incentive scheme for employees.
The number of ordinary shares conditionally allocated to employees is disclosed on pages 122 and 123.
Movements in the number of share options issued to (each option is in respect of one share) employees are as follows:
Fortheyearto31MarchNumber
2013Number
2012
Opening balance 88 500 723 88 017 939
Issued during the year 20 722 276 17 797 428
Exercised (10 501 585) (12 956 577)
Lapsed (3 906 514) (4 358 067)
Closingbalance 94814900 88500723
The purpose of the staff share scheme is to promote an esprit de corps within the organisation, create an awareness of Investec’s performance and provide an incentive to maximise individual and group performance by allowing all staff to share in the risks and rewards of the group.
The group makes awards available to staff members via the underlying share trusts. The particular instrument used varies from time to time depending on taxation legislation and factors affecting the group structure. Nevertheless, whatever the instrument chosen, its underlying value depends solely on the performance of the group’s share price.
At present, the practice of the group is to give all permanent staff members a share allocation based on their annual package after completing six months of employment. In line with the objective of providing a long-term incentive for staff, these share awards vest over periods varying from four to five years.
After the initial allocation referred to above, additional allocations are made to staff members at the discretion of group management and depending on the individual performance and contribution made by the respective staff members.

55
Investec integrated annual review and summary financial statements 2013130
Sum
mary financial statem
ents
Fair value hierarchy IFRS 7 requires that an entity disclose for each class of financial instruments measured at fair value, the level in the fair value hierarchy into which the fair value measurements are categorised in their entirety. The fair value hierarchy reflects the significance of the inputs used in making fair value measurements. The level in the fair value hierarchy within which the fair value measurement is categorised in its entirety shall be determined on the basis of the lowest level input that is significant to the fair value measurement in its entirety.
The fair value hierarchy has the following levels:
Level1 – quoted (unadjusted) prices in active markets for identical assets or liabilities
Level2 – inputs other than quoted prices included within level 1 that are observable for the asset or liability, either directly (i.e. as prices) or indirectly (i.e. derived from prices)
Level3 – inputs for the asset or liability that are not based on observable market data (unobservable inputs)
Assets and liabilities related to the long-term assurance business attributable to policyholders have been excluded from the analysis as the change in fair value of related assets is attributable to policyholders. These are all level 1 assets.
Total instruments at fair value
Valuationtechniqueapplied
At31March£’000 Level1 Level2 Level3
Fair value hierarchy (continued)
2013
Assets
Loans and advances to banks 165 460 108 954 56 506 –
Reverse repurchase agreements and cash collateral on securities borrowed 694 180 – 694 180 –
Sovereign debt securities 3 844 313 3 549 398 294 915 –
Bank debt securities 935 019 152 401 782 618 –
Other debt securities 388 859 260 439 86 174 42 246
Derivative financial instruments 1 982 571 254 376 1 660 434 67 761
Securities arising from trading activities 931 603 909 608 21 995 –
Investment portfolio 960 364 92 843 634 178 233 343
Loans and advances to customers 1 147 003 – 1 082 723 64 280
Other loans and advances 4 612 – – 4 612
Other securitised assets 531 447 – 30 955 500 492
Other assets 479 709 477 789 1 133 787
12065140 5805808 5345811 913521
Liabilities
Deposits by banks 330 – 330 –
Derivative financial instruments 1 443 325 205 935 1 234 105 3 285
Other trading liabilities 851 939 851 939 – –
Repurchase agreements and cash collateral on securities lent 508 326 – 508 326 –
Customer accounts (deposits) 449 375 – 449 375 –
Debt securities in issue 187 645 – 187 645 –
Liabilities arising on securitisation of other assets 427 280 42 126 – 385 154
Other liabilities 534 930 496 993 35 571 2 366
Subordinated liabilities 140 366 – 140 366 –
4543516 1596993 2555718 390805
Notes to the summary financial statements (continued)

55
131Investec integrated annual review and summary financial statements 2013
Sum
mary financial statem
ents
Total instruments at fair value
Valuationtechniqueapplied
At31March£’000 Level1 Level2 Level3
Fair value hierarchy (continued)
2012
Assets
Loans and advances to banks 176 320 114 247 62 073 –
Reverse repurchase agreements and cash collateral on securities borrowed 718 811 264 412 454 399 –
Sovereign debt securities 3 646 322 3 344 496 301 826 –
Bank debt securities 1 856 243 247 736 1 608 507 –
Other debt securities 275 607 47 394 167 757 60 456
Derivative financial instruments 1 913 650 203 938 1 678 746 30 966
Securities arising from trading activities 640 146 577 326 62 820 –
Investment portfolio 890 702 155 241 600 429 135 032
Loans and advances to customers 1 225 243 – 1 224 655 588
Other loans and advances 175 523 – – 175 523
Other securitised assets 92 900 7 630 27 331 57 939
Other assets 546 687 546 359 328 –
12158154 5508779 6188871 460504
Liabilities
Derivative financial instruments 1 421 130 258 239 1 162 891 –
Other trading liabilities 612 884 612 884 – –
Repurchase agreements and cash collateral on securities lent 582 682 582 682 – –
Customer accounts (deposits) 549 814 – 549 814 –
Liabilities arising on securitisation of other assets 40 057 – 40 057 –
Other liabilities 605 940 521 381 84 559 –
3812507 1975186 1837321 –
Transfers between level 1 and level 2 In line with market practice, repurchase agreements have been moved from level 1 to level 2. There is no change to the level of observability, however these are based on principal to principal pricing rather than quoted market prices.
There were no transfers between level 1 and level 2 for the year ended 31 March 2012.
Notes to the summary financial statements (continued)

55
Investec integrated annual review and summary financial statements 2013132
Sum
mary financial statem
ents
Fortheyearto31March£’000
Total level 3
financial instruments
Fairvaluemovements
throughincome
statement
Fairvaluemovements
throughcompre-hensiveincome
Fair value hierarchy (continued)
The following table shows a reconciliation from the opening balances to the closing balances for fair value measurements in level 3 of the fair value hierarchy:
Balance as at 1 April 2011 426 992 358 973 68 019Total gains or losses (31 300) (30 053) (1 247)
In the income statement (31 235) (30 053) (1 182)In the statement of comprehensive income (65) – (65)
Purchases 158 932 157 008 1 924Sales (52 507) (43 231) (9 276)Issues (4 842) (4 842) –Settlements (16 933) (16 933) –Transfers into level 3 26 715 26 715 –Transfers out of level 3 (46 503) – (46 503)Foreign exchange adjustments (50) 208 (258)Balanceasat31March2012 460504 447845 12659 Total gains or losses 59 628 62 136 (2 508)
In the income statement 61 225 62 136 (911)In the statement of comprehensive income (1 597) – (1 597)
Purchases 113 486 62 967 50 519Sales (59 261) (24 794) (34 467)Issues (677) (677) –Settlements (2 780) (2 780) –Transfers into level 3 131 865 131 289 576Transfers out of level 3 (185 576) (185 036) (540)Foreign exchange adjustments 5 527 2 842 2 685
Balanceasat31March2013 522716 493792 28924
The following table quantifies the gains or losses included in the income statement recognised on level 3 financial instruments:
Fortheyearto31March£’000 2013 2012
Totalgainsorlossesincludedintheincomestatementfortheyear
Net interest (expense)/income (1 251) 4 921Fee and commission income 5 196 1 628Investment income 56 811 (46 685)Trading income arising from customer flow 618 1 161Trading income arising from balance sheet management and other trading activities (952) 7 740Other operating income 803 –
61225 (31235)
For the year ended 31 March 2013, instruments to the value of £185.6 million were transferred from level 3 into level 2. The valuation methodologies were reviewed and observable inputs are used to determine the fair value.
There were transfers from level 2 to the level 3 category to the value of £131.9 million because the underlying circumstances of the instrument changed and as a result, the significant valuation inputs became unobservable in the market.
For the year ended 31 March 2012, instruments were transferred out of level 3 to level 2 due to improved levels of observable inputs for valuation of these instruments. Instruments were transferred into level 3 when significant inputs to model valuations were no longer observable.
Notes to the summary financial statements (continued)

55
133Investec integrated annual review and summary financial statements 2013
Sum
mary financial statem
ents
Fair value hierarchy (continued)
Sensitivity of fair values to reasonably possible alternative assumptions by level 3 instrument type The fair value of financial instruments in level 3 are measured using valuation techniques that incorporate assumptions that are not evidenced by prices from observable market data. The following table shows the sensitivity of these fair values to reasonably possible alternative assumptions, determined at a transactional level:
At31March£’000
Reflectedinincomestatement
Reflectedinothercomprehensiveincome
Favourablechanges
Unfavourablechanges
Favourablechanges
Unfavourablechanges
2013
Assets
Other debt securities 1 459 901 – –
Derivative financial instruments 47 115 2 080 – –
Investment portfolio 37 859 13 946 7 011 2 887
Loans and advances to customers 948 9 351 – –
Other securitised assets 17 552 10 883 – –
Other assets 60 84 – –
104993 37245 7011 2887
Liabilities
Derivative financial instruments 2 236 1 089 – –
Liabilities arising on securitisation of other assets (4 145) (2 643) – –
Other liabilities 1 525 1 904 – –
(384) 350 – –
2012
Assets
Other debt securities 2 041 2 138 2 306 2 467
Derivative financial instruments 59 859 1 397 – –
Investment portfolio 62 111 23 562 1 569 1 659
Loans and advances to customers 1 211 294 – –
Other loans and advances 3 953 1 024 – –
Other securitised assets 23 703 13 811 – –
152878 42226 3875 4126
The above variations have been determined with reference to the key unobservable inputs which mainly relate to future cash flows and discount rates applied.
Derivative financial instruments The group enters into various contracts for derivatives both as principal for trading purposes and as customer for hedging foreign exchange and interest rate exposures. These include financial futures, options, swaps and forward rate agreements. The risks associated with derivative instruments are monitored in the same manner as for the underlying instruments. Risks are also measured across the product range in order to take into account possible correlations.
In the tables that follow notional principal amounts indicate the volume of business outstanding at the balance sheet date and do not represent amounts at risk. The fair value of a derivative financial instrument represents the positive or negative cash flows which would have occurred had the rights and obligations arising from that instrument been closed out by the group in an orderly market transaction at balance sheet date.
Notes to the summary financial statements (continued)

55
Investec integrated annual review and summary financial statements 2013134
Sum
mary financial statem
ents
2013 2012
At31March£’000
Notional principal amounts
Positive fair value
Negative fair value
Notionalprincipalamounts^
Positivefairvalue
Negativefairvalue
Derivative financial instruments (continued)
Foreignexchangederivatives
Forward foreign exchange contracts 5 299 453 41 169 49 553 4 173 890 37 974 30 185
Currency swaps 15 988 729 435 079 204 355 16 562 689 525 138 102 809
OTC options bought and sold 2 733 914 23 028 20 985 2 808 808 27 513 26 799
Other foreign exchange contracts 1 186 678 5 335 8 410 698 924 1 551 3 178
OTC derivatives 25208774 504611 283303 24 244 311 592176 162971
Interestratederivatives
Caps and floors 1 315 416 7 357 5 027 1 714 685 6 031 7 216
Swaps 47 275 885 709 056 572 563 44 263 444 729 741 738 917
Forward rate agreements 49 602 413 22 314 23 568 2 132 646 20 248 13 523
OTC options bought and sold 234 305 1 748 2 036 1 033 809 3 217 2 757
Other interest rate contracts 726 684 15 913 10 461 801 827 1 099 208
OTC derivatives 99 154 703 756 388 613 655 49 946 411 760 336 762 621
Exchange traded futures 48 681 – 233 – – 494
99203384 756388 613888 49 946 411 760336 763115
Equityandstockindexderivatives
OTC options bought and sold 4 303 452 195 739 100 536 3 084 355 113 547 74 258
Equity swaps and forwards 452 667 2 432 12 423 61 928 683 1 096
OTC derivatives 4 756 119 198 171 112 959 3 146 283 114 230 75 354
Exchange traded futures 2 731 330 71 047 4 683 2 881 208 20 943 26 210
Exchange traded options 9 492 913 147 437 171 468 10 369 891 154 615 211 481
Warrants 380 893 34 50 515 139 488 2 245 –
17361255 416689 339625 16 536 870 292033 313045
Commodityderivatives
OTC options bought and sold 77 173 4 131 19 387 23 413 1 485 101
Commodity swaps and forwards 672 564 186 311 183 395 864 046 186 313 177 701
OTCderivatives 749737 190442 202782 887 459 187798 177802
Creditderivatives
Credit linked notes 46 646 502 – – 2 –
Credit swaps 218 203 8 863 3 727 343 230 13 873 4 197
264849 9365 3727 343 230 13875 4197
Embeddedderivatives* 105076 – 67432 –
Derivativesperbalancesheet 1982571 1443325 1913650 1421130
^ For certain derivative products the method of calculation of the notional principal amount has been changed during the year. Prior year values have been adjusted to aid comparison.
* Mainly includes profit shares received as part of lending transactions.
Notes to the summary financial statements (continued)

55
135Investec integrated annual review and summary financial statements 2013
Sum
mary financial statem
ents
At31March£’000 2013 2012
Debt securities in issue
Bondsandmedium-termnotesrepayable*:
Less than three months 34 526 224 361
Three months to one year 107 785 56 098
One to five years 22 506 123 156
Greater than five years 5 638 –
170455 403615
Otherunlisteddebtsecuritiesinissuerepayable*:
Less than three months 191 577 419 672
Three months to one year 197 361 223 449
One to five years 1 027 780 1 134 329
Greater than five years 314 603 62 883
1731321 1840333
1901776 2243948
* The 2012 disclosures have been restated to correctly reflect the split between bonds and medium-term notes repayable (reflected as £nil in the 2012 financial statements) and other unlisted debt securities in issue (reflected as £2 243.948 million in the 2012 financial statements). The total debt securities in issue were unchanged.
Fortheyearto31March£’000 2013 2012
Related party transactionsTransactions,arrangementsandagreementsinvolvingdirectorsandothers:
Particulars of transactions, arrangements and agreements entered into by the group with directors and connected persons and companies controlled by them, and with officers of the company, were as follows:
Directors,keymanagementandconnectedpersonsandcompaniescontrolledbythemLoansAt beginning of year 34 092 21 451Increase in loans 20 497 26 110Repayment of loans (11 126) (13 469) Atendofyear 43 463 34 092 GuaranteesAt beginning of year 367 –Additional guarantees granted 5 552 367Guarantees cancelled (1 162) –Atendofyear 4 757 367 DepositsAt beginning of year (46 657) (49 606) Increase in deposits (33 041) (24 615) Decrease in deposits 26 154 27 564Atendofyear (53544) (46657)
The above transactions were made in the ordinary course of business and on substantially the same terms, including interest rates and security, as for comparable transactions with persons of a similar standing or where applicable, with other employees. The transactions did not involve more than the normal risk of repayment. None of these loans have been impaired.
Notes to the summary financial statements (continued)
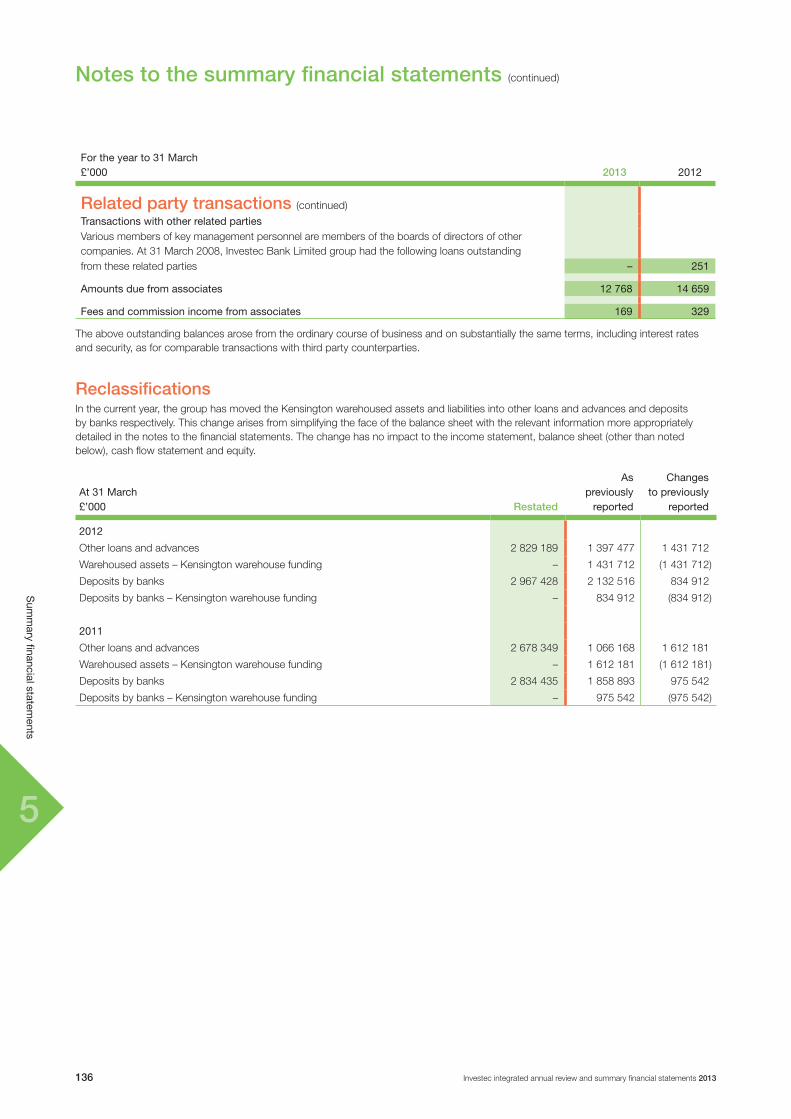
5
Investec integrated annual review and summary financial statements 2013136
Sum
mary financial statem
ents
Fortheyearto31March£’000 2013 2012
Related party transactions (continued)
TransactionswithotherrelatedpartiesVarious members of key management personnel are members of the boards of directors of other companies. At 31 March 2008, Investec Bank Limited group had the following loans outstandingfrom these related parties – 251
Amountsduefromassociates 12768 14659
Feesandcommissionincomefromassociates 169 329
The above outstanding balances arose from the ordinary course of business and on substantially the same terms, including interest rates and security, as for comparable transactions with third party counterparties.
Reclassifications In the current year, the group has moved the Kensington warehoused assets and liabilities into other loans and advances and deposits by banks respectively. This change arises from simplifying the face of the balance sheet with the relevant information more appropriately detailed in the notes to the financial statements. The change has no impact to the income statement, balance sheet (other than noted below), cash flow statement and equity.
At31March£’000 Restated
Aspreviouslyreported
Changestopreviously
reported
2012
Other loans and advances 2 829 189 1 397 477 1 431 712
Warehoused assets – Kensington warehouse funding – 1 431 712 (1 431 712)
Deposits by banks 2 967 428 2 132 516 834 912
Deposits by banks – Kensington warehouse funding – 834 912 (834 912)
2011
Other loans and advances 2 678 349 1 066 168 1 612 181
Warehoused assets – Kensington warehouse funding – 1 612 181 (1 612 181)
Deposits by banks 2 834 435 1 858 893 975 542
Deposits by banks – Kensington warehouse funding – 975 542 (975 542)
Notes to the summary financial statements (continued)

5
Shareholderinformation
6

66
Investec integrated annual review and summary financial statements 2013138
Sharehold
er information
Shareholder analysis
Investec ordinary sharesAs at 31 March 2013 Investec plc and Investec Limited had 605.2 million and 279.6 million ordinary shares in issue respectively.
Spread of ordinary shareholders as at 31 March 2013Investec plc ordinary shares in issue
Numberofshareholders Holdings
%oftotalshareholders
Numberofsharesinissue
%ofissuedsharecapital
13 527 1 to 500 51.3% 2 340 881 0.4%
4 513 500 – 1 000 17.1% 3 524 226 0.6%
5 464 1 001 – 5 000 20.7% 12 504 667 2.1%
982 5 001 – 10 000 3.7% 7 200 240 1.2%
1 038 10 001 – 50 000 3.9% 24 580 738 4.1%
282 50 001 – 100 000 1.1% 20 101 295 3.3%
584 100 001 and over 2.2% 534 944 724 88.3%
26 390 100.0% 605 196 771 100.0%
Investec Limited ordinary shares in issue
Numberofshareholders Holdings
%oftotalshareholders
Numberofsharesinissue
%ofissuedsharecapital
3 237 1 to 500 38.9% 746 986 0.3%
1 597 500 – 1 000 19.2% 1 256 147 0.4%
2 018 1 001 – 5 000 24.3% 4 712 812 1.7%
452 5 001 – 10 000 5.4% 3 341 441 1.2%
595 10 001 – 50 000 7.1% 14 263 855 5.1%
150 50 001 – 100 000 1.8% 10 924 095 3.9%
276 100 001 and over 3.3% 244 393 828 87.4%
8 325 100.0% 279 639 164 100.0%
Shareholder classification as at 31 March 2013
Investecplcnumberofshares
%holding
InvestecLimitednumberofshares
%holding
Public* 592 664 903 97.9% 252 271 108 90.2%
Non-public 12 531 868 2.1% 27 368 056 9.8%
Non-executive directors of Investec plc/Investec Limited 3 863 253 0.6% 300 825 0.1%
Executive directors of Investec plc/Investec Limited 7 049 470 1.2% 7 352 215 2.6%
Investec staff share schemes 1 619 145 0.3% 19 715 016 7.1%
Total 605196771 100.0% 279639164 100.0%
* As per the JSE Listings Requirements.

66
139Investec integrated annual review and summary financial statements 2013
Sharehold
er information
Shareholder analysis (continued)
Largest ordinary shareholders as at 31 March 2013In accordance with the terms provided for in Section 793 of the UK Companies Act 2006 and Section 140A of the South African Companies Act, 1973, the group has conducted investigations into the registered holders of its ordinary shares (including nominee and asset management companies) and the results are as disclosed below.
Investec plc
ShareholderanalysisbymanagergroupNumber of
shares %holding
1 Public Investment Corporation (ZA) 84 633 690 14.0%
2 Allan Gray (ZA) 52 346 104 8.6%
3 Coronation Fund Managers (ZA) 45 808 337 7.6%
4 Old Mutual (ZA) 30 972 966 5.1%
5 BlackRock Inc (US & UK) 24 348 318 4.0%
6 Sanlam Group (ZA) 22 277 772 3.7%
7 Legal & General Investment Management (UK) 18 112 607 3.0%
8 Norges Bank Investment Management (Oslo) 17 452 039 2.9%
9 Prudential Group (ZA) 17 337 742 2.9%
10 State Street Corporation (US and UK) 12 247 325 2.0%
325 536 900 53.8%
The top 10 shareholders account for 53.8% of the total shareholding in Investec plc. This information is based on a threshold of 20 000 shares. Some major fund managers hold additional shares below this, which may cause the above figures to be marginally understated.
Investec Limited
ShareholderanalysisbymanagergroupNumber of
shares %holding
1 Public Investment Corporation (ZA) 35 395 139 12.7%
2 Investec Staff Share Schemes (ZA and UK) 19 715 016 7.1%
3 Old Mutual (ZA) 16 914 448 6.0%
4 Sanlam Group (ZA) 16 366 989 5.9%
5 Allan Gray (ZA) 16 362 919 5.9%
6 BlackRock Inc (US & UK) 12 785 777 4.6%
7 Entrepreneurial Development Trust (ZA)* 11 630 621 4.2%
8 Dimensional Fund Advisers (UK) 9 047 465 3.2%
9 Coronation Fund Managers (ZA) 7 514 791 2.7%
10 Vanguard Group (US) 7 381 064 2.6%
153 114 229 54.9%
The top 10 shareholders account for 54.9% of the total shareholding in Investec Limited. This information is based on a threshold of 20 000 shares. Some major fund managers hold additional shares below this, which may cause the above figures to be marginally understated.
* In November 2003, Investec Limited implemented an empowerment transaction in which empowerment partners and an employee share scheme acquired 25.1% of the equity shareholding in Investec Limited.

66
Investec integrated annual review and summary financial statements 2013140
Sharehold
er information
Shareholder analysis (continued)
Share statistics
Investec plc
Fortheperiodended31 March
201331March
201231March
201131March
201031March
200931March
200831March
2007
Closing market price per share (Pounds)
– year-end 4.59 3.82 4.78 5.39 2.92 3.39 6.58
– highest 5.14 5.22 5.50 5.62 4.21 7.65 6.76
– lowest 3.10 3.18 4.29 2.87 1.69 2.94 4.95
Number of ordinary shares in issue (million)1 605.2 598.3 537.2 471.1 444.9 423.3 381.6
Market capitalisation (£’million)1 2 778 2 286 2 568 2 539 1 299 1 435 2 511
Daily average volume of shares traded (’000) 1 305 1 683 1 634 1 933 2 604 3 926 2 832
Price earnings ratio2 12.4 12.0 11.1 12.0 6.9 6.0 12.4
Dividend cover (times)2 2.1 1.9 2.5 2.8 3.3 2.3 2.3
Dividend yield (%)2 3.9 4.5 3.6 3.0 4.5 7.4 3.5
Earnings yield (%)2 8.1 8.3 9.0 8.4 14.5 16.7 8.1
Investec Limited
Fortheperiodended31 March
201331March
201231March
201131March
201031March
200931March
200831March
2007
Closing market price per share (Rands)
– year-end 64.26 47.16 52.80 62.49 38.86 57.43 93.3
– highest 69.89 57.36 65.50 65.40 63.19 104.4 94.6
– lowest 41.31 42.00 49.49 37.51 27.20 50.90 59.06
Number of ordinary shares in issue (million)1 279.6 276.0 272.8 269.8 268.4 234.3 227.7
Market capitalisation (R’million)3 56 857 41 232 42 768 46 299 27 715 37 766 56 848
Market capitalisation (£’million)3 4 061 3 340 3 872 3 993 2 083 2 229 4 009
Daily average volumes of share traded (’000) 980 1 033 794 1 068 1 168 841 620
1 The LSE only include the shares in issue for Investec plc, i.e. 605.2 million, in calculating market capitalisation, as Investec Limited is not incorporated in the UK.
2 Calculations are based on the group’s consolidated earnings per share before goodwill, acquired intangibles and non-operating items; and dividends per share as prepared in accordance with IFRS and denominated in Pounds Sterling.
3 The JSE Limited have agreed to use the total number of shares in issue for the combined group, comprising Investec plc and Investec Limited, in calculating i.e. a total of 884.8 million shares in issue.
Investec plc
a South Africa 60.6%
b UK 23.1%
c USA and Canada 6.7%
d Rest of Europe 5.1%
e Other countries and unknown 4.5%
cd
b
e
Investec Limited
a South Africa 64.0%
b UK 7.3%
c USA and Canada 15.5%
d Rest of Europe 2.6%
e Other countries and unknown 10.6%
c
d
b
e
a
60.6%
a
64.0%
Geographical holding by beneficial ordinary share owner as at 31 March 2013
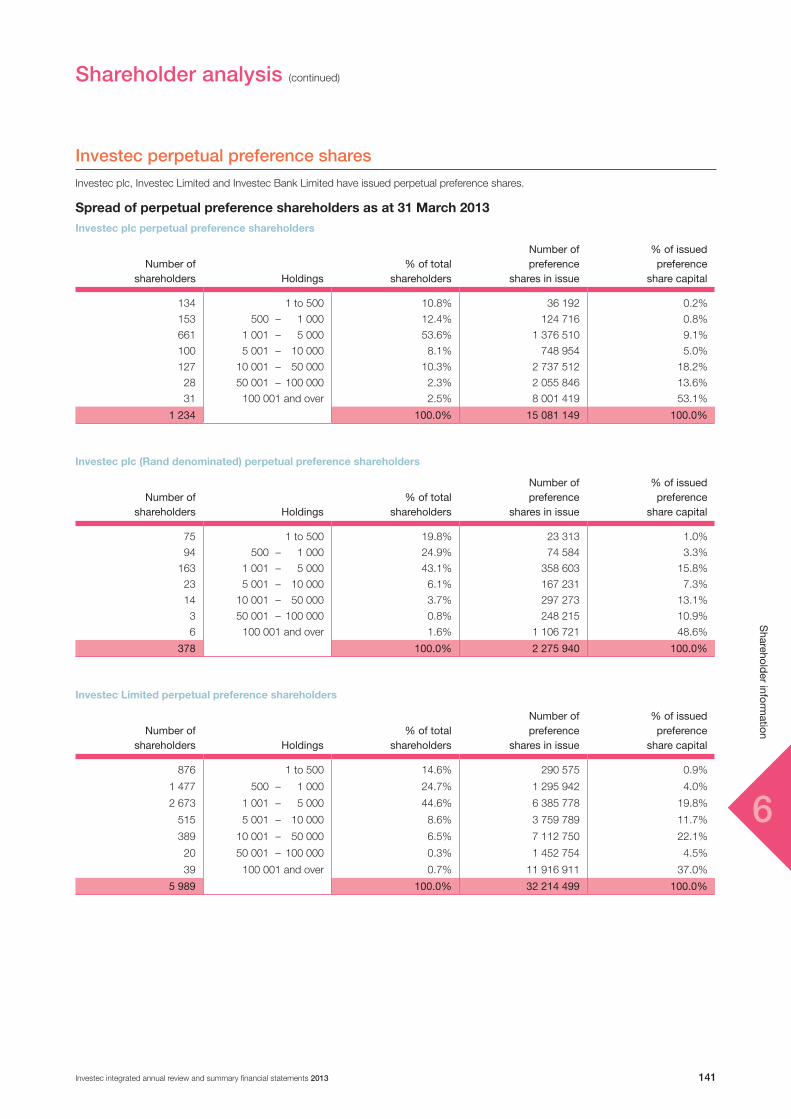
66
141Investec integrated annual review and summary financial statements 2013
Sharehold
er information
Shareholder analysis (continued)
Investec perpetual preference sharesInvestec plc, Investec Limited and Investec Bank Limited have issued perpetual preference shares.
Spread of perpetual preference shareholders as at 31 March 2013Investec plc perpetual preference shareholders
Numberofshareholders Holdings
%oftotalshareholders
Numberofpreference
sharesinissue
%ofissuedpreference
sharecapital
134 1 to 500 10.8% 36 192 0.2%
153 500 – 1 000 12.4% 124 716 0.8%
661 1 001 – 5 000 53.6% 1 376 510 9.1%
100 5 001 – 10 000 8.1% 748 954 5.0%
127 10 001 – 50 000 10.3% 2 737 512 18.2%
28 50 001 – 100 000 2.3% 2 055 846 13.6%
31 100 001 and over 2.5% 8 001 419 53.1%
1 234 100.0% 15 081 149 100.0%
Investec plc (Rand denominated) perpetual preference shareholders
Numberofshareholders Holdings
%oftotalshareholders
Numberofpreference
sharesinissue
%ofissuedpreference
sharecapital
75 1 to 500 19.8% 23 313 1.0%
94 500 – 1 000 24.9% 74 584 3.3%
163 1 001 – 5 000 43.1% 358 603 15.8%
23 5 001 – 10 000 6.1% 167 231 7.3%
14 10 001 – 50 000 3.7% 297 273 13.1%
3 50 001 – 100 000 0.8% 248 215 10.9%
6 100 001 and over 1.6% 1 106 721 48.6%
378 100.0% 2 275 940 100.0%
Investec Limited perpetual preference shareholders
Numberofshareholders Holdings
%oftotalshareholders
Numberofpreference
sharesinissue
%ofissuedpreference
sharecapital
876 1 to 500 14.6% 290 575 0.9%
1 477 500 – 1 000 24.7% 1 295 942 4.0%
2 673 1 001 – 5 000 44.6% 6 385 778 19.8%
515 5 001 – 10 000 8.6% 3 759 789 11.7%
389 10 001 – 50 000 6.5% 7 112 750 22.1%
20 50 001 – 100 000 0.3% 1 452 754 4.5%
39 100 001 and over 0.7% 11 916 911 37.0%
5 989 100.0% 32 214 499 100.0%

66
Investec integrated annual review and summary financial statements 2013142
Sharehold
er information
Shareholder analysis (continued)
Investec Bank Limited perpetual preference shareholders
Numberofshareholders Holdings
%oftotalshareholders
Numberofpreference
sharesinissue
%ofissuedpreference
sharecapital
911 1 to 500 20.5% 277 732 1.7%
1 337 500 – 1 000 29.9% 1 189 787 7.7%
1 719 1 001 – 5 000 38.5% 4 167 382 27.0%
277 5 001 – 10 000 6.2% 2 048 625 13.3%
189 10 001 – 50 000 4.2% 3 687 023 23.9%
15 50 001 – 100 000 0.3% 1 117 670 7.2%
19 100 001 and over 0.4% 2 959 411 19.2%
4 467 100.0% 15 447 630 100.0%
Largest perpetual preference shareholders as at 31 March 2013Shareholders holding beneficial interests in excess of 5% of the issued preference shares are as follows:
Investec plc
Chase Nominees Limited (Artemis) 10.6%
Investec plc (Rand denominated)
NES Investments (Pty) Ltd 5.3%Liberty Active Investment 6.5%Regent Insurance Company Limited 6.6%TE Return FNB Pension Fund 7.9%Cadiz Absolute Yield Fund 17.6%
There were no shareholders holding beneficial interests in excess of 5% of the issued preference shares in Investec Limited and Investec Bank Limited, as at 31 March 2013.

66
143Investec integrated annual review and summary financial statements 2013
Sharehold
er information
Contact details
Australia, AdelaideSuite 5 121-129 Hutt Street SA 5000 Adelaide AustraliaTelephone (61) 8 8203 9100 Facsimile (61) 8 8227 0066e-mail [email protected]
Australia, BrisbaneLevel 8 Riverside Centre 123 Eagle Street Brisbane QLD 4001 AustraliaTelephone (61) 7 3018 8100 Facsimile (61) 7 3018 8108e-mail [email protected]
Australia, MelbourneLevel 49 120 Collins Street MelbourneVIC 3000 AustraliaTelephone (61) 3 8660 1000 Facsimile (61) 3 8660 1010e-mail [email protected]
Australia, PerthUnit 30/31 22 Railway Road Subiaco PerthWA 6008 AustraliaTelephone (61) 8 9214 4500 Facsimile (61) 8 9214 4545e-mail [email protected]
Australia, SydneyLevel 23 The Chifley Tower 2 Chifley SquarePhillip Street Sydney GPO Box 2539 NSW 2000 AustraliaTelephone (61) 2 9293 2000Facsimile (61) 2 9293 2002e-mail [email protected]
Botswana, GaboronePlot 64511 Unit 5Fairgrounds GaboroneTelephone (267) 318 0112Facsimile (267) 318 0114e-mail [email protected]
Canada, Toronto66 Wellington Street West Suite 2701PO Box 307 Toronto-Dominion CentreToronto Ontario M5K 1K2Telephone (1 416) 687 2400 Facsimile (1 416) 364 3434
Channel Islands, St HelierOne The Esplanade St HelierJersey JE2 3QA Channel IslandsTelephone (44) 1534 512 512 Facsimile (44) 1534 512 513e-mail [email protected]
Channel Islands, St Peter PortLa Vieille Cour La Plaiderie St Peter Port Guernsey GY11WR Channel IslandsTelephone (44) 1481 723 506 Facsimile (44) 1481 741 147e-mail [email protected]
Hong KongSuite 3609 36/F Two International Finance Centre8 Finance StreetCentral Hong KongTelephone (852) 3187 5000 Facsimile (852) 2524 3360e-mail [email protected]
Suites 2604-06 Tower 2 The GatewayHarbour City Tsimshatsui KowloonHong KongTelephone (852) 2861 6888 Facsimile (852) 2861 6861
India, MumbaiTrade Centre 310-311 Bandra Kurla Complex ( BKC ) Bandra East Mumbai400051 IndiaTelephone (91) 226 136 7400
Ireland, DublinThe Harcourt BuildingHarcourt StreetDublin 2 IrelandTelephone (353) 1 421 0000 Facsimile (353) 1 421 0500e-mail [email protected]
Mauritius, Ebéne Cyber CityLevel 8C Cyber Tower IIEbéne Cyber CityTelephone (230) 403 0400Facsimile (230) 403 0498e-mail [email protected]
Mauritius, Port Louis6th Floor Dias Pier BuildingLe Caudan Waterfront CaudanPort LouisTelephone (230) 207 4000Facsimile (230) 207 4002e-mail [email protected]
Namibia, WindhoekOffice 1 Ground floor Heritage Square Building100 Robert Mugabe Avenue WindhoekTelephone (264 61) 389 500Facsimile (264 61) 249 689e-mail [email protected]
South Africa, Cape Town36 Hans Strijdom Avenue Foreshore Cape Town 8001PO Box 1826 Cape Town 8000Telephone (27 21) 416 1000Facsimile (27 21) 416 1001
South Africa, Durban5 Richefond Circle Ridgeside Office ParkUmhlanga Durban 4319PO Box 25278 Gateway Durban 4321Telephone (27 31) 575 4000Facsimile (27 865) 009 901
South Africa, East London1st floor Pilot Mill House The QuarrySelbourne East London 5247PO Box 19484 Tacoma 5214Telephone (27 43) 709 5700Facsimile (27 43) 721 0664
South Africa, Johannesburg100 Grayston Drive Sandown Sandton 2196PO Box 785700 Sandton 2146Telephone (27 11) 286 7000Facsimile (27 11) 286 7777e-mail, South African offices
• Recruitment queries: [email protected]
• Client queries
– Asset management: [email protected]
– Institutional Securities: [email protected]
– Private Client Securities: [email protected]
– Property Group: [email protected]
– Private Bank: [email protected]
– Capital Markets: [email protected]
South Africa, KnysnaTH24/TH25 Long Street Ext Thesen Harbour Town Knysna 6571Telephone (27 44) 302 1800Facsimile (27 44) 382 4954
South Africa, Mbombela (formerly Nelspruit)2nd floor 2 McAdam StreetCnr McAdam and Rothery Streets Mbombela 1200PO Box 19428 The Village 1218Telephone (27 13) 756 0900Facsimile 086 743 0911

6
Investec integrated annual review and summary financial statements 2013144
Sharehold
er information
Contact details (continued)
South Africa, PietermaritzburgAcacia House Redlands Estate 1 George MacFarlane Lane Pietermaritzburg 3201PO Box 594 Pietermaritzburg 3200Telephone (27 33) 264 5800Facsimile (27 33) 342 1561
South Africa, Port Elizabeth6th floor Fairview Office Park 66 Ring Road Greenacres Port Elizabeth 6045PO Box 27416 Greenacres 6057Telephone (27 41) 396 6700Facsimile (27 41) 363 1667
South Africa, PretoriaCnr Atterbury and Klarinet Streets Menlo Park Pretoria 0081PO Box 35209 Menlo Park 0102Telephone (27 12) 427 8300Facsimile (27 12) 427 8310
South Africa, StellenboschBlock D De Wagen Road Office Park Stellentia Street Stellenbosch 7600PO Box 516 Stellenbosch 7599Telephone (27 21) 809 0700Facsimile (27 21) 809 0730
Switzerland, Geneva3 Place des BerguesGeneva 1201 SwitzerlandTelephone (41) 22 807 2000Facsimile (41) 22 807 2005e-mail [email protected]
Switzerland, ZurichLoewenstrasse 29Zurich CH-8001 SwitzerlandTelephone (41 44) 226 1000Facsimile (41 44 ) 226 1010e-mail [email protected]
United Kingdom, AbingdonWindrush Court Blacklands WayAbingdon OxonOX14 1SY UKTelephone (44 1235) 555 577Facsimile (44 1235) 555 577e-mail [email protected]
United Kingdom, London2 Gresham Street LondonEC2V 7QP UKTelephone (44 207) 597 4000Facsimile (44 207) 597 4070
100 Wood Street LondonEC2V 7AN UKTelephone (44 207) 597 1234Facsimile (44 207) 597 4070
United Kingdom, Manchester3 Hardman Street SpinningfieldsManchester M3 3HF UKTelephone (44 161) 832 6868Facsimile (44 161) 832 1233
United States, New York666 Fifth Avenue 15th Floor New YorkNY 10103 USATelephone (212) 259 5610Facsimile (917) 206 5103
TaiwanUnit B 20F Taipei 101 Tower7 Xin Yi Rd Sec 5 Taipei 110 TaiwanTelephone (886 2) 8101 0800Facsimile (886 2) 8101 0900
Investec Asset Management Connecticut1055 Washington BoulevardStanford Connecticut 06901Telephone (1 203) 324 0010Facsimile (1 203) 324 0023

6
Definitions
Adjusted shareholders’ equityRefer to calculation on page 44
Cost to income ratio Operating costs divided by operating income (net of depreciation on leased assets). Depreciation on operating leased assets has been netted off against operating income
Dividend coverAdjusted earnings per ordinary share before goodwill and non-operating items divided by dividends per ordinary share
Effective operational tax rateTax on profit on ordinary activities (excluding non-operating items) divided by operating profit (excluding profit from associates)
Market capitalisationTotal number of shares in issue (including Investec plc and Investec Limited) multiplied by the closing share price of Investec plc on the London Stock Exchange
Net tangible asset value per share Refer to calculation on page 43
Non-operating items Reflects profits and/or losses on termination or disposal of group operations and acquisitions made
Operating profit Operating income less administrative expenses, impairments for bad and doubtful debts and depreciation of tangible fixed assets. This amount is before goodwill, acquired intangibles and non-operating items
Operating profit per employeeRefer to calculation on page 48
Recurring income Net interest income plus net annuity fees and commissions expressed as a percentage of total operating income
Return on average adjusted shareholders’ equity Refer to calculation on page 44
Return on average adjusted tangible shareholders’ equity Refer to calculation on page 44
Return on risk-weighted assets Adjusted earnings divided by average risk-weighted assets
Staff compensation to operating income ratio All employee related costs expressed as a percentage of operating income
Third party assets under administration Includes third party assets under administration managed by the Wealth & Investment, Asset Management and Property businesses
Total capital resourcesIncludes shareholders’ equity, subordinated liabilities and non-controlling interests
Total equity Total shareholders’ equity including non-controlling interests

volume two
two
Investec risk and basel pillar three disclosures report twenty thirteen
Wealth & InvestmentAsset ManagementSpecialist Banking


