AN ABSTRACT OF THE THESIS OF
Jack Wayne Lentsch for the M. S. in Radiological Physics (Name) (Degree) (Major)
Date thesis is presented August 16, 1966
Title ABSORBED DOSE FROM X RAYS IN SOFT TISSUE
ADJACENT TO BONE MEASURED BY INDUCED
CONDUCTIVITY IN POLYETHYLENE FILMS
Abstract approved (Major professor)
The X -ray dose absorbed in soft tissue located near plane
bone interfaces and in parallel -slab bone cavities was measured
experimentally with a polyethylene -film dosimeter.
The dose absorbed in soft tissue adjacent to plane bone inter-
faces was measured by placing a 12.7 micron film of polyethylene,
upon which were deposited graphite electrodes, in contact with
bone - equivalent disks of Shonka plastic. The dose was measured
both as a function of X -ray quality and distance of the tissue -
equivalent polyethylene away from the bone interface. The dose
in finite soft tissue layers next to bone was also measured as a
function of X -ray quality. The results indicated that the soft tissue
dose in finite layers next to the bone was greater than that remote
from the bone. At the lower effective X -ray energies the dose very
close to the bone was considerably higher than for the higher
effective X -ray energies. At higher effective X -ray energies, how-
ever, the increased dose effect extended to a greater depth in the
soft tissue. At effective energies greater than 177 keV electronic
equilibrium was obtained, and the dose was the same for the adja-
cent and distant soft tissue.
Comparisons were made of the experimentally measured
doses in soft tissue near plane bone interfaces with calculated doses
for monoenergetic photons. It was observed that at effective X -ray
energies below approximately 60 keV the experimental results gave
higher dose values than the theoretical values. However, at higher
effective X -ray energies there was good agreement between the
experimental and theoretical results. It was concluded that X -ray
spectral considerations were mainly responsible for the deviations
at lower effective energies. The results of this study indicated that
when one wishes to calculate the dose absorbed in soft tissue adja-
cent to plane bone interfaces at low effective X -ray energies, the
theory cannot be relied upon and experimentally determined doses
such as those shown herein should be used instead.
The X -ray dose in soft tissue elements interposed between
parallel slabs of bone was measured in the same manner as the
dose in soft tissue adjacent to plane bone interfaces. However, due
to experimental difficulties in simulating this bone -tissue orientation,
it was not possible to make reasonable dose measurements.
ABSORBED DOSE FROM X RAYS IN SOFT TISSUE ADJACENT TO BONE MEASURED BY INDUCED
CONDUCTIVITY IN POLYETHYLENE FILMS
by
JACK WAYNE LENTSCH
A THESIS
submitted to
OREGON STATE UNIVERSITY
in partial fulfillment of the requirements for the
degree of
MASTER OF SCIENCE
June 1967
APPROVED:
Professor of Radiological Physics In Charge of Major
Head of Departm f General, Science
Dean of Graduate School
Date thesis is presented August 16, 1966
Typed by Kay Smith
t .
ACKNOWLEDGMENT
The author wishes to express his appreciation to Dr. Roland
Finston for proposing this study and for his guidance during much of
the course of the work.
I would like to acknowledge Dr. E. Dale Trout and Dr. Robert
Elder for advice which they willingly gave and for their critical re-
views of the study.
I am greatly indebted to Dr. John F. Fowler, Postgraduate
Medical School, London, for communicating with me personally on
various problems which were encountered.
Special thanks to my wife, Cheryl, for her patience and moral
support.
TABLE OF CONTENTS
Page
INTRODUCTION 1
HISTORICAL REVIEW AND THEORETICAL CONSIDERATIONS 5
Energy Absorption from X Rays 5
Dose in Soft Tissue Near Bone 9
Methods of Calculating Dose in Soft Tissue Near Bone 10
Methods of Measuring Dose in Soft Tissue Near Bone 19
MATERIALS AND METHODS 25
The Polyethylene -Film Dosimeter 25 Theory 25 Construction 27 Operating Characteristics 32
Dose Measurements 40 Dose Measurements in Soft Tissue
Adjacent to Plane Bone Interfaces 41 Dose Measurements in Soft Tissue
Within Parallel -Slab Bone Cavities 46 X -Ray Production, Measurement, and Energy
Specification 49
EXPERIMENTAL RESULTS 52
Results of Dose Measurements in Soft Tissue Near Plane Bone Interfaces 52
Results of Dose Measurements in Soft Tissue Contained Within Parallel -Slab Bone Cavities 62
COMPARISON OF EXPERIMENTAL RESULTS WITH THEORY 64
DISCUSSION OF RESULTS 70
SUMMARY AND CONCLUSIONS 76
BIBLIOGRAPHY 78
e
LIST OF FIGURES
Figure Page
1 Diagram of polyethylene -film dosimeter showing film, electrodes, and lead -in strips. 28
2 Diagram of circuit used to measure the radiation induced conductivity of polyethylene. 31
3 Apparatus for holding polyethylene -film dosimeter. 33
4 Complete apparatus shown housed in lead shielded Faraday cage. 34
Relationship between induced current in poly- ethylene and time during which X rays are off and on. 37
6 Induced current in polyethylene as a function of X -ray exposure and X -ray energy. 38
Apparatus used to simulate plane bone -soft tissue interfaces. 42
8 Diagram showing dimensions of the components of the simulated plane bone -soft tissue interface. 44
9 Apparatus used to simulate a parallel -slab soft tissue cavity in bone. 47
10 Increased X -ray doses in soft tissue adjacent to plane, semi - infinite slabs of bone - -300 kVp X -ray unit. 55
11 Increased X -ray doses in soft tissue adjacent to plane, semi - infinite slabs of bone - -300 kVp X -ray unit.
12 Increased X -ray doses in soft tissue adjacent to plane, semi- infinite slabs of bone --100 kVp X -ray unit.
56
57
5
7
Figure Page
13 Increased X -ray doses in soft tissue layers of finite dimensions located adjacent to plane, semi - infinite slabs of bone shown as a function of effec- tive photon energy --100 kVp X -ray unit, dotted curves; and 300 kVp X -ray unit, solid curves. 59
14 Increased X -ray doses in soft tissue adjacent to plane, semi - infinite slabs of bone. Comparison of results obtained with 300 kVp X -ray unit, solid curves, with Howarth (1965) data, dotted curves. 66
15 Increased X -ray doses in soft tissue adjacent to plane, semi - infinite slabs of bone. Comparison of results obtained with 100 kVp X -ray unit, solid curves, with Howarth (1965) data, dotted curves.
16 Increased X -ray dose in a 13.2 micron soft tissue layer located adjacent to a plane, semi - infinite slab of bone, as a function of effective X -ray energy. Comparison of results obtained with both the 100 kVp and 300 kVp X -ray units with theoretical data of Howarth (1965).
67
69
LIST OF TABLES
Table Page
1
2
3
4
Increased X -ray doses in soft tissue adjacent to plane, semi - infinite slabs of bone - -300 kVp X -ray unit.
Increased X -ray doses in soft tissue adjacent to plane, semi - infinite slabs of bone --100 kVp X -ray unit.
Increased X -ray doses in soft tissue layers of finite dimensions located adjacent to plane, semi - infinite slabs of bone - -300 kVp X -ray unit.
Increased X -ray doses in soft tissue layers of finite dimensions located adjacent to plane, semi- infinite slabs of bone --100 kVp X -ray unit.
5 Increased X -ray dose in a 12.7 micron soft tissue layer interposed between two parallel, semi- infinite slabs of bone - -300 kVp X -ray unit.
53
54
60
61
63
ABSORBED DOSE FROM X. RAYS IN SOFT TISSUE ADJACENT TO BONE MEASURED BY INDUCED
CONDUCTIVITY IN POLYETHYLENE FILMS
INTRODUCTION
It is relatively easy to calculate or measure the dose from
X rays in a soft tissue element where conditions of electronic equilib-
rium exist; i. e. , in a soft tissue element surrounded by a semi -
infinite volume of soft tissue. Similarly, the dose in an element of
bone can be calculated where electronic equilibrium exists. How-
ever, if an element of soft tissue lying very near a slab of bone or
inside a bone cavity of finite size is considered, then the problem
of calculating the dose in this soft tissue element becomes quite
difficult. In these latter cases the secondary electron fluxes which
originate in both materials due to interaction with the primary photon
radiation must be evaluated. By considering where these electrons
originate, the manner in which they lose their energy, and the loca-
tions where their energy is deposited, the dose can be calculated.
Due to the complexity of these calculations certain simplifying
assumptions must be made which may decrease the accuracy of
the final results. In such cases it is desirable to measure the doses
and compare these results with the calculated values. It was with
this objective in mind that this research project was performed.
X -rays were chosen as the form of ionizing radiation to be
employed because the majority of the calculations that have been
made on dose near bone have been carried out using X rays. Hence,
comparisons with theory are possible. Many measurements of X-
ray dose in soft tissue near bone have been made by other investiga-
tors. However, more data at different X -ray qualities and different
bone -soft tissue orientations are needed to support theoretical com-
putations, and to provide additional data for clinical application.
One problem in comparing these experimental results with theory
is that most of the available calculations have assumed a mono-
energetic photon beam. Those calculations that have given consid-
eration to X -ray spectra are both limited in number and accuracy
by the complexity of correcting for the distribution of X -ray spectra.
For X rays produced by voltages of 100 to 300 kVp the general
effect on the dose to a soft tissue element near bone is to increase
the energy absorption to a value higher than would be expected in
similar soft tissue remote from bone. This effect is attributed to
the different attenuation coefficients of bone and soft tissue in the
photoelectric interaction energy range. In the Compton interaction
energy range the attenuation coefficients of bone and soft tissue are
very similar and little effect is noticed, thus permitting one to
1 Throughout this paper the term kVp will be used to denote the tube potential at which the X rays are generated. The term ke V will be used consistently to indicate the effective photon energy of an X -ray spectra, unless it is otherwise specified as meaning a monoenergetic photon beam.
2
calculate the soft tissue dose or bone dose irrespective of their
relative orientations. It is, therefore, the photoelectric process
which gives rise to the increased dose phenomena.
This increased soft tissue dose is of importance since it is in
the region within bone that the marrow cells of the hematopoetic
system are found. The marrow cells are one of the most radiation
sensitive cell types in the body. Since these cells play an important
role in the synthesis of many elements of the blood it is desirable to
know as accurately as possible how much energy they absorb during
X- irradiation. The increased dose to the bone cells which are the
living elements found within the cavities and canals of the inorganic
bone matrix is also an important consideration. Damage to these
cells may result in improper bone growth, repair, or maintenance
processes. It is well known that excessive localized doses of X rays
result in decreased bone density, bone malformation and osteogenic
sarcomas. These effects are attributed to death or inactivation of
the osteocytes, osteoblasts, and osteoclasts either from the direct
action of the energy absorption or the indirect action of necrosis
resulting from collapse of the Haver sian canals and other canals
and canalicules located in bone (McLean and Budy, 1964).
The increased absorption in soft tissue is limited spatially
over a distance equal to the maximum range of electrons which have
originated in the nearby bone. To measure the effect and describe
3
it physically an instrument capable of measuring dose must be used
having a detecting volume considerably less than the range of the
photoelectrons which are produced. A polyethylene -film dosimeter,
similar to one used by Fowler (1957),was constructed which per-
mitted measurements within the spatial limitation. The electrical
conductivity of polyethylene changes in a manner which is dependent
on the amount of energy deposited in it by the radiation. It is avail-
able in films down to thicknesses of ten microns. Using this dosim-
eter and simulating different bone -soft tissue orientations, soft
tissue doses can be measured as a function of distance from bone
and X -ray quality.
4
5
HISTORICAL REVIEW AND THEORETICAL CONSIDERATIONS
The problem of calculating or measuring the energy absorbed
in soft tissue elements located within or adjacent to bone is one that
has been the subject of thought and investigation by a number of
workers (Aspin and Johns, 1963; Charlton and Cormack, 1962;
Ellis, 1966; Epp, Woodard and Weiss, 1959; Fowler, 1957; Howarth,
1965; Spiers, 1949, 1951; Wingate, Gross and Failla, 1962). Semi -
rigorous solutions and precise experimental measurements, how-
ever, have only been made in the past few years. Due to the com-
plex nature of the calculations, and the inherent difficulties involved
in experimental measurements, even these more recent results are
not as exact as would be desired.
To introduce this subject, consideration will first be given to
a description of the phenomena which give rise to the absorption of
energy from a beam of X rays. The factors influencing this energy
absorption will also be briefly described. With this background,
the theory of bone dosimetry and the events leading to our present
state of knowledge of this subject will be considered.
Energy Absorption from X Rays
X rays may deposit energy in the matter with which they
interact by either photoelectric absorption, Compton scattering,
6
or pair production. The properties of the matter with which they
interact and the energy which they possess determine to what degree
these three processes will occur.
The pair production process was not a significant mechanism
of energy absorption in this study since the X rays used were of
energy less than 1. 022 MVp.
In the photoelectric process a photon of energy less than
approximately 100 keV may eject an orbital electron from an atom
and in so doing the photon ceases to exist. It is, however, physical-
ly impossible for the electron to absorb all of the energy of the pho-
ton if momentum is to be conserved. Consequently the nucleus, or
atom, must recoil for conservation of both energy and momentum
in the process. The probability of photoelectric absorption by a
particular atomic electron increases with decreasing photon energy
since for low energy photons the electron is relatively more tightly
bound to the nucleus and it is easier for the nucleus to recoil to
conserve momentum. Similarly, electrons are more tightly bound
to high atomic number nuclei than to nuclei of low atomic number.
The probability of photoelectric absorption, therefore, increases
with increasing atomic number of the matter with which they interact.
The probability of this process occurring is usually expressed as
the photoelectric cross- section, T. The theory of quantum electro-
dynamics predicts the proportionality between the photoelectric
-
cross - section T, the X -ray energy E, and the atomic number Z to
be:
5/E3. 5 (Eisberg, 1964).
7
In the Compton scattering process, photons of energy greater
than approximately 100 ke V will suffer scattering collisions with
atomic electrons which may be considered unbound to nuclei because
of the relatively high photon energy. As a result of such collisions
the photons transfer part of their energy to these electrons and are
themselves degraded in energy. They do not completely disappear
as in the photoelectric process. The probability of Compton scatter-
ing occurring is expressed as the Compton cross - section. This
cross- section depends only on the electron content of the material
with which the photons are interacting. Over a wide range of mate-
rials the number of electrons contained per unit mass remains
fairly constant, and the Compton cross - section varies little for
different materials. The well -known Klein- Nishina relations pre-
dict a slight dependence of the Compton cross - sections on photon
energy in the energy range from 0.1 to 1. 0 Me V. This is but a
slight dependence as shown in Whyte ` (19 59) and is considered in-
significant in this study.
The high energy electrons which originate from the photo-
electric and Compton interactions are responsible for transferring
the energy of the X rays to the medium with which they are
T a
interacting. These electrons cause further ionization and excitation
of atoms by coulombic interactions. By considering the X -ray
intensity incident on a small volume of the medium, the cross -
sections for attenuation of these X rays, and the energy necessary
to form an ion pair in the medium, the energy absorbed in the vol-
ume can be calculated if conditions of electronic equilibrium exist.
For electronic equilibrium to exist in a small volume of some
material, this volume must be farther than the maximum range of
the secondary electrons originating in the material away from all
boundaries with different materials. If this condition is met then
the ionization occurring in this volume may be considered as due only
to those electrons which have originated within it. Since the density
of ionization is known, direct conversion to energy absorbed in the
material is possible.
If the volume of material in which the dose is to be calculated
is within range of the electrons originating in a different material
then electronic equilibrium does not necessarily exist in the defined
volume. There may be more, or less, secondary electrons being
scattered into the defined volume than are being scattered out.
Therefore, the ionization within the volume cannot be considered
as being due only to the secondary electrons which were produced
in it from attenuation of the X rays. Since the density of ionization
is not directly known, the energy absorbed in the material cannot
8
be calculated as easily as when electronic equilibrium exists.
It is this case of nonelectronic equilibrium that is of concern
in determining the dose from X rays in soft tissue adjacent to a
bone interface or within a bone cavity.
Dose in Soft Tissue Near Bone
Since the effective atomic number of bone, 13.8, is consider-
ably higher than that of soft tissue, 7. 40, the photoelectric cross-
section for bone will be higher than that for soft tissue. Consequent-
ly, X rays with energies in the photoelectric range will be attenuated
to a higher degree in bone than in soft tissue and the secondary elec-
tron flux arising in bone will exceed that arising in soft tissue. This
results in bone absorbing considerably more energy at electronic
equilibrium than soft tissue.
As the X -ray energy is increased, Compton scattering becomes
the predominant attenuation mechanism. As previously mentioned,
the Compton cross - sections are similar for materials of varying
atomic number due to their similar atomic electron densities. Pho-
tons of energy greater than 100 keV and less than 1.022 MeV will,
therefore, be attenuated about equally in both bone and soft tissue
and the secondary electron fluxes arising in either bone or soft
tissue will be approximately the same. The dose in either bone or
soft tissue from X rays of effective energies greater than 100 keV
9
10
and less than 1. 022 MeV will, therefore, be approximately the
same.
If a layer of soft tissue lying near bone irradiated with X rays
of energy less than 100 keV is considered, it is apparent that con-
ditions of electronic equilibrium will not exist in it if it is located
within a distance equal to or less than the maximum ranges of those
electrons originating in the bone, or soft tissue. By calculating the
number of electrons that arise in the bone and surrounding soft
tissue, their energy and their ranges, the dose in the layer of soft
tissue can be calculated if one knows the relative position of the
tissue to the bone. A knowledge of the electron stopping powers of
the bone and soft tissue is also necessary since the ranges of elec-
trons in bone and soft tissue differ.
Methods of Calculating Dose in Soft Tissue Near Bone
The results of several investigations carried out during the
1930's have verified that different tissues of the body absorb energy
from X rays in differing amounts depending on their chemical com-
position and densities. The expression relating the chemical com-
position and effective atomic number on which the photoelectric
attenuation coefficient depends was derived by Mayneord (1937) and
later experimentally verified by Spiers (1946) who measured the
dose in materials of varying composition at different X -ray energies.
11
Spiers (1946) determined the effective atomic number of bone to be
13.8 and that of soft tissue to be 7. 4. Using these values he deter-
mined that for 40 keV X rays the energy absorbed in bone is six
times greater than that absorbed in soft tissue. Realizing that
there is soft tissue contained in bone, Spiers (1949) became con-
cerned with how this higher energy absorption in bone might possibly
affect the dose in this soft tissue. If the soft tissue is located in
bone cavities of dimensions approximately one to two microns in
diameter, then the energy which it absorbs is shown by the Bragg -
Gray principle to be approximately the same as the energy absorbed
in the bone surrounding the cavity. There is a slight reduction in
the soft tissue dose since the electron stopping power is less for
soft tissue than for bone. Though the soft tissue contained in bone
is usually not found in cavities of such small dimensions, there is
a good possibility that it may lie sufficiently close to the bone that
the energy absorbed in it will be considerably higher than the energy
absorbed in that soft tissue which is remote from bone. Spiers (1949)
was the first investigator to derive relations for the energy absorp-
tion in soft tissue lying near or within bone. Specifically, Spiers
(1949) considered soft tissue interposed between parallel, semi -
infinite slabs of bone, and soft tissue adjacent to plane bone inter-
faces. The parallel -slab cavity simulates the Haversian systems
contained in bone, the cavities in which the osteocytes are found,
12
and the lamellar marrow layers found in trabecular bone. The
plane interface simulates the endosteal and periosteal layers of
bone cells and some types of trabecular bone.
To determine the energy absorbed in soft tissue at these two
locations, Spiers (1949) made several assumptions to simplify the
calculations. It was assumed that electrons are emitted isotropi-
cally from X -ray attenuation, and that these electrons travel in
straight lines with constant specific ionization along their tracks.
Also, the ranges of the electrons were taken to be 70 percent of
their full rectified ranges. This assumption is in accordance with
the theory of Lea (1962). A single energy was taken for the photo-
electrons ejected from the K- shell, and a mean energy was taken
for the spectra of Compton recoil electrons.
The energy absorbed in soft tissue located near bone was cal-
culated by summing the contributions of electrons arising in both
the bone and soft tissue to the ionization at the desired location in
the soft tissue. These calculations were carried out for a variety
of monoenergetic X -ray beams and the results plotted as ions /µ3/
Roentgen versus distance of the soft tissue from the cavity wall, or
distance away from the plane bone interface. For low energy X rays,
less than approximately 60 keV, the energy absorbed in soft tissue
very close to plane bone interfaces and cavity walls is quite high,
approaching the high equilibrium dose absorbed in bone. This
13
increased dose falls off rapidly at greater depths in the soft tissue
due to the limited range of the photoelectrons which are produced
by low energy photons. For higher energy X rays photoelectric
absorption diminishes and Compton scattering predominates. Since
bone and soft tissue absorb approximately the same dose in the
Compton energy region, the increased dose effect in soft tissue
very close to bone is not as great. The few photoelectrons that
are scattered into the soft tissue from bone do not have such limited
ranges, and even though the increased dose to soft tissue is not as
great, it extends farther into the soft tissue layer.
Spiers (1949) averaged the dose to soft tissue layers of varying
thickness and plotted these results as soft tissue dose versus effec-
tive X -ray energy. The soft tissue dose was greatest for the small-
est cavities and thinnest layers of soft tissue next to bone, and was
maximized for X -ray exposures between 40 and 60 keV.
Munson (1950) corrected Spiers' (1949) calculations for a
minor error in his approximation of an electron flux. Spiers (1950)
acknowledged this correction but showed it to have little effect on
his original results.
Wilson (1950) calculated the energy absorbed from X rays at
the walls and in the center of the soft -tissue -filled, cylindrical
Haversian canals. Since bone necrosis is a result of the collapse
of the lumen of the Haversian canals, the energy absorbed in the
14
canal walls is of considerable importance. Wilson (1950), like
Spiers (1949), assumed the range of electrons to be 70 percent of
their full rectified range. By determining the volume of bone from
which electrons could arise and reach either the wall or center of
the canal, the increased dose to the soft tissue contained at these
locations was estimated. This "contributing volume" method was
a rough approximation to the actual increased dose effect. The
results compare qualitatively with those of Spiers (1949) but are
somewhat lower because this method underestimates the depth in
soft tissue to which electrons arising in bone may contribute their
energy. It was concluded from the results that since tumors are
usually composed of soft tissue, in order to give the maximum dose
to the tumor and minimum dose to the Haversian canals, one should
employ therapeutic X rays of as high energy as possible.
In a continuation of his earlier work, Spiers (19 51) presented
tentative figures for the permissible dose in Roentgens to bone as
a percentage of that which could be administered to soft tissue under
similar treatment conditions. It was shown that for monoenergetic
X rays of 50 keV energy the permissible exposure to bone is only
35 percent of that exposure which could be administered to soft
tissue remote from bone. For 200 keV X rays the exposure has
increased to 90 percent of the soft tissue exposure. The higher
the X -ray energy, therefore, the larger the permissible exposure
15
to bone becomes. This is in agreement with those conclusions
drawn by Wilson (1950). The results presented by Spiers (1951) are
reproduced in the International Commission on Radiological Units
and Measurements Report 10d (1963).
Spiers and Woodard (1953) found it necessary to extend the
earlier calculations to include X -ray spectra in order to quantitate
the results of a biological experiment on the energy absorbed in
living mouse bone with theory. The energy spectra of 100, 185,
and 1000 kVp X -ray beams were determined by Greening's method
(1947), and from these the spectra of electrons which arise in bone
were calculated. By summing the contributions of these electrons,
the doses in different soft tissues contained within bone were deter-
mined. Spiers and Woodard (1953) reported that for the 1000 kVp
radiation there was little increased dose to the soft tissue within
bone. However, the 100 and 185 kVp radiations increased the dose
to these tissues considerably over the dose to soft tissue remote
from bone.
Another extension of the Spiers (1949) method of calculating
dose in soft tissue near bone was made by Epp, Woodard, and
Weiss (1959) who were interested in comparing the Relative Biologi-
cal Effects of 250 kVp X rays and Cobalt 60 gamma rays on the bone
marrow of the mouse. Adjusted values for the X -ray spectra as
recommended by Spiers and Woodard (1953) were used. Unlike
16
Spiers and Woodard (1953), however, Epp, Woodard, and Weiss
(1959) did not assume that the bone lying adjacent to soft tissue was
necessarily of equilibrium thickness. This is actually the case in
some trabecular bone types where very thin layers of bone and bone
marrow are interleaved in a network. Using a physical model of
mouse bone, the dose in various types of marrow cavities was
determined and averaged to give the average dose absorbed by the
mouse bone marrow during whole body irradiation. For the 250 kVp
X rays the average dose to the marrow was 0.986 rads per Roentgen,
while for the Cobalt 60 gamma rays the average dose was 0.94 rads
per Roentgen. Had the marrow been remote from bone the doses
would have been 0.967 and 0.980 rads per Roentgen respectively
(Hine and Brownell, 1964). Thus the dose in marrow from 250 kVp
X rays is slightly increased over the remote soft tissue value. It
was pointed out by Epp, Woodard, and Weiss (1959) that this slight
increase is somewhat misleading, since it is an average value. The
marrow lying next to bone actually receives a much higher dose than
this, but is reduced when an average effect over the total volume of
marrow is computed. Therefore, many more marrow cells may
be killed or inactivated in certain areas near bone than in other
areas where the marrow may be some distance away from bone.
Charlton and Cormack (1962) revised Spiers' (1949) method
of calculation to take into account the variation of electron Linear
17
Energy Transfer (LET) with energy. Monoenergetic X rays were
considered to simplify the calculations. Doses in soft tissue near
plane bone interfaces, in parallel -slab bone cavities, and in cylindri-
cal bone cavities were determined. This was the first attempt to cal-
culate the dose distribution across a cylindrical cavity since the
previous calculations by Wilson (1950) had determined the dose only
at the center or at the wall of the cylindrical cavity. It was shown
that the dose to soft tissue elements contained in cylindrical bone
cavities is generally higher than the dose to layers of soft tissue
interposed between two bone slabs. Because more accurate X -ray
attenuation coefficients were employed in these calculations, com-
parison with Spiers' (1949) results are not too meaningful. How-
ever, Charlton and Cormack' s (19 62) results are quite similar to
Spiers' (1949) results for both the plane interface and parallel -slab
geometries, being slightly higher at X -ray energies below 60 keV.
Aspin and Johns (1963) also calculated the absorbed dose in
soft tissue -filled cylindrical cavities within bone. They did not
consider the variation of electron LET with energy, though their
method extended the theory to include actual spectra rather than
monoenergetic X rays. These calculations were made to obtain
theoretical results which could be compared with measurements of
the cylindrical soft tissue cavity dose that were made concurrently.
A method of determining the dose in the bone marrow of
18
humans was given by Spiers (1963). Using a cadaver, the dimensions
of the marrow interspaces in different types of trabecular bone were
determined. Using the method of Charlton and Cormack (1962) the
average marrow dose in the four major red marrow sites of the
body were then determined. The results are presented in such a
manner that if the depth dose in Roentgens to the marrow site being
irradiated and the incident X -ray energy are known, then the dose
factor in rads per Roentgen can be read directly from a graph. This
is a very convenient method of determining bone marrow doses in
both X -ray diagnosis and X -ray therapy.
Recently, Charlton and Cormack's (1962) calculations have
been extended by Howarth (1965) to include the dose absorbed by
spherical soft tissue cavities in bone. Account was taken of the
variation of electron LET with energy. Rather than assume a mean
energy for the Compton recoil electrons, their continuous energy
spectra were used. Dose contributions from Auger electrons were
considered and determined to have the effect of considerably increas-
ing the dose to soft tissue lying very near to bone. Accurate tables
of the geometrical functions and physical parameters necessary for
calculating the dose in soft tissue at any point close to a plane,
cylindrical, or spherical bone interface were presented. These
tables and functions were obtained by evaluating numerical integrals
for the different bone -soft tissue orientations. Though no attempt
19
was made to apply these calculations to X -ray spectra rather than
monoenergetic beams of X rays, it was noted that by programming
the required energy spectra into a computer along with the data
which were presented, it is possible to extend the theory to X -ray
spectra.
A review of some of the methods of calculating X -ray dose in
soft tissue near or within bone is given by Spiers (1966). Compari-
sons of the results obtained by using these different methods are
also presented. Spiers (1966) concluded that even though the re-
sults are not perfectly compatible, there is sufficient agreement
with available experimental data to increase the acceptability of
the theory.
Methods of Measuring Dose in Soft Tissue Near Bone
Attempts to measure the X -ray dose in soft tissue near bone
began several years before the development of Spier& (1949) theory.
Stenstrom and Marvin (1946) used a combination of carbon -walled
and bone -walled air ionization chambers to measure the dose in
soft tissue within bone cavities of ten microns radius, this being
the thickness of soft tissue which is the mass equivalent of the air
that was used to fill the chamber. The ratio of the response of the
bone chamber to that of the carbon chamber varied over the energy
range from 30 keV to 200 ke V in a manner closely following the
20
ratio of the dose calculated by Spiers (1949) in a tissue slab ten
microns thick interposed between two bone slabs to the dose to
similar tissue remote from bone. The maximum response ratio
was 3.9 at an effective X -ray energy of 50 keV. This ratio is
slightly less than the ratio calculated by Spiers (1949). Deviations
from theory can be attributed to the non tissue -equivalence of both
carbon and air. The electron stopping power of air is also different
from soft tissue.
Spiers and Woodard (1953) made quantitative comparisons
between the biochemical changes produced in bone by exposure to
X rays of three differing qualities and the absorption of energy in
bone which is expected from theoretical considerations. The alka-
line phosphatase activity of living mouse bone was used as an index
of radiation damage since this enzyme plays an essential role in
bone metabolism and can be measured quantitatively. The average
depressions of the phosphatase activity produced by 100 kVp and
185 kVp X rays were respectively 1.35 and 1.36 times greater than
the average depression produced by the same exposure. to 1000 kVp
X rays. By considering the spatial distribution of phosphatase
activity in and near bone, the average distance of the phosphatase
producing cells from the bone was determined to be approximately
30 microns. With this distribution the doses from the 100 and 185
kVp radiations were calculated to be 1. 2 to 1.3 times higher than
21
the dose from the 1000 kVp radiation. The Spiers method (1949) of
dose calculation was used. This report which is based upon a bio-
logical indicator of radiation damage, rather than physical measure-
ments, further supports the results previously discussed.
Fowler (1957) measured the dose from X rays in soft tissue
adjacent to plane bone interfaces using a polyethylene -film dosimeter.
Earlier work by Fowler and Farmer (19 53, 19 54, 19 55, 19 56) had
confirmed that the electrical conductivity induced in polyethylene
upon irradiation is related to the energy absorbed in it by a known
power law. Since polyethylene is nearly soft tissue - equivalent,
direct measurements of the dose in soft tissue were possible. By
placing the thin film of polyethylene next to bone, which was simu-
lated by Pyrex glass, the dose in soft tissue near bone was deter-
mined. The film was then placed next to soft tissue, simulated by
polystyrene, to determine the equilibrium soft tissue dose. By
taking the ratio of these two doses the increased dose in soft tissue
near bone was determined for different quality X -ray beams. Since
fairly thick graphite electrodes were deposited on the polyethylene
to measure the induced current, it was not possible to get closer
than 10 -15 microns away from the bone interface. Therefore, the
greatest increased dose effect near the interface could not be ob-
served. Exact quantitative agreement with Spier& calculations
(1949) was not possible. However, there was general qualitative
22
agreement for effective X -ray energies greater than 50 keV. Fow-
ler's (1957) results were high at low effective energies. This was
attributed to the use of a spectrum of X -ray photons rather than a
monoenergetic beam, as was assumed in Spiers' (1949) calculations.
Those calculations made later by Spiers and Woodard (1953) which
took into account the spectra of X rays are in closer agreement at
the lower energies.
The first experimenters to perform precision measurements
of the dose in soft tissue at plane bone interfaces and in parallel-
slab bone cavities were Wingate, Gross, and Failla (1962). The
measurements were made using a parallel -plate ionization chamber
(extrapolation chamber) which was designed to measure X -ray dose
in either bone or soft tissue. This was accomplished by employing
electrodes of either bone-equivalent or soft tissue- equivalent plas-
tics with soft tissue- equivalent or bone - equivalent gas contained
between them. By measuring the ionization in this gas for different
electrode spacings, the dose distributions across bone -soft tissue
interfaces were determined with high precision. Measurements of
the dose at distances approaching one micron from the bone inter-
faces could be made since the density of the gas was low due to
reduced pressure, thus simulating very thin layers of either soft
tissue or bone. The average dose to the soft tissue contained in
very small parallel -slab bone cavities was also determined with
23
precision. Unlike the experiments mentioned previously, this ex-
periment measured the absolute dose in soft tissue near bone. This
meant that virtually all sources of experimental error had to be
eliminated. Comparison with the calculations of Spiers (1949) was
very good with most of the deviations arising from X -ray spectral
considerations.
Aspin and Johns (1963) measured the X -ray dose in soft tissue
contained in small cylindrical cavities within bone. A soft tissue -
equivalent suspension of T4 Bacteriophage was employed as a bio-
logical dosimeter. By placing these cells in "bone- equivalent"
Pyrex glass capillary tubes and determining their survival rates
upon X- irradiation, the dose in the soft tissue cavity was determined.
Measurements were made of this dose both as functions of X -ray
energy and bone cavity radius. Comparisons of these experimental
results with calculations which were also made in this same paper
indicate agreement with theory is quantitative if statistical analyses
of the measurements are made. It is to be noted that the actual
X -ray spectra employed in the measurements were used in making
the calculations.
Another measurement of the dose in soft tissue cavities within
bone was performed recently by Ellis (1966). Pyrex sintered glass
filters filled with aqueous ferrous sulfate were used to simulate soft
tissue cavities within trabecular bone, aqueous ferrous sulfate
24
resembling soft tissue and Pyrex glass resembling bone. The dose
in the ferrous sulfate solution upon X- irradiation was determined
by a standard colorimetry method of chemical analysis. The ratio
of the dose to the ferrous sulfate within the pores of the glass
filters to the dose in free ferrous sulfate solution was taken to be
a measure of the increased dose to soft tissue within cylindrical
bone cavities. Comparison with theory was complicated by the fact
that the pores of the glass filters used were of uneven dimensions.
Thus, average pore sizes had to be used. The results were compati-
ble with both Spier s' (1949) and Charlton and Cormack's (19 6 2)
theories at effective X -ray energies above 50 keV, but were not in
agreement at lower energies.
25
MATERIALS AND METHODS
In this investigation the increased dose in soft tissue adjacent
to plane bone interfaces and in parallel -slab bone cavities during X-
irradiation was measured. The materials employed consisted of
a polyethylene -film dosimeter and an apparatus designed to simu-
late the soft tissue contained at these two locations. The properties
of the X rays employed in the measurements will be briefly described
since consistent specification of X -ray quality was necessary to
correlate the different results obtained.
The Polyethylene -Film Dosimeter
Theory
It has been verified by Fowler and Farmer (1953, 1954, 1955,
1956), Fowler (1957, 1959), Armistead, Pennock, and Mead (1949),
and Mayburg and Lawrence (19 52) that the electrical conductivity
of dielectric materials is increased upon exposure to X- irradiation.
These investigators were primarily concerned with examining di-
electric materials suitable for use in radiological instruments. It
was found in the course of their work that the magnitudes of the
conductivity changes were directly related to the amount of energy
deposited in the dielectric material by the radiation. This relation
e
26
can be stated as:
where k is the electrical conductivity, D is the absorbed dose rate,
and m is a constant whose value depends on the dielectric material
being used.
Fowler (1957), realizing that these conductivity changes were
a good indication of the amount of energy absorbed in the dielectric
material, designed a device capable of measuring dose rate by
applying a potential difference across a thin film of polyethylene
and measuring the current flow through it during X- irradiation.
This electrical current, which is directly proportional to the con-
ductivity change, was then related to the dose rate by the proportion-
ality shown previously.
Fowler (1957) chose polyethylene as the dielectric material
because the currents measured during irradiation were consider-
ably larger than the associated dark currents (thermal noise, cos-
mic rays, etc. ). Polyethylene is approximately soft tissue- equiva-
lent with an effective atomic number of 5. 44 (the effective atomic
number of soft tissue is usually taken to be 7. 40). This indicates
that the photoelectric X -ray attenuation coefficients of polyethylene
are similar but not identical to those of soft tissue. The stopping
powers of polyethylene and soft tissue are the same (Whyte, 1959),
however, and these materials are of approximately the same mass
k a Dm
27
density. These factors indicated to Fowler (1957) that the dose in
polyethylene can be used as a measure of the dose in soft tissue.
Fowler (1957) presented a detailed description of the poly-
ethylene-film dosimeter and its operating characteristics. Fowler
(1959) also gave a thorough theoretical treatment of the radiation
induced conductivity phenomena.
Construction
The polyethylene -film dosimeter employed in these measure-
ments consisted of a film of polyethylene 1 2.7 microns thick, upon
which were deposited two graphite electrodes (Figure 1). The
polyethylene film was obtained from British Visqueen Ltd. 2 and
was specified to be free of impurities and additives that are some-
times contained in polyethylene. The thickness of the polyethylene
film was determined by making weight- density measurements and
computing the thicknesses of several films of known area. The
uncertainty in the determined 12.7 micron thickness was ±1. 0
micron for five different samples. Care was exercised in the
handling of the film since stretching it considerably altered its
dimensions.
The polyethylene film was rinsed in ethanol to remove surface
2 British Visqueen Limited. Six Hills Way, Stevange, Hertford- shire, England.
to amplifiers
Upper graphite electrode
coaxial cable
Polyethylene film
511
Graphite
Top view
28
84 volts
i Lower
i
-4 84 volts O
Cu Foil coaxial cable graphite electrode
to amplifier s
Polyethylene Graphite film
Bottom view
Figure 1. Diagram of polyethylene -film dosimeter showing film, electrodes, and lead -in strips.
i
y
o
29
contamination which could affect its electrical properties. Imme-
diately after cleansing, the graphite electrodes were painted onto
the film, as shown in Figure 1, with a clean sable -hair artists brush.
Acheson Colloids. Dag Dispersion 1543 which is an aromatic suspen-
sion of graphite was used. Since this suspension was quite viscous,
it was diluted with ethanol to enable electrodes of the necessary
dimensions to be deposited on the film. This thinner mixture flowed
freely and deposited coherent layers of graphite, ensuring good elec-
trical continuity and eliminating regions of high resistance. The
upper voltage electrode was 4. 5 centimeters in diameter and the
lower collecting electrode 1.0 centimeter in diameter. The thick-
ness of these electrodes was determined by weight- density measure-
ments. A reproducible electrode thickness of O. 5 ± 0.2 microns was
normally obtained.
The sensitive area of the film where the change in the conduc-
tivity was measured is that area between the two electrodes which is
defined by the smaller collecting electrode. The X -ray beam was
collimated with lead slits and projected onto this sensitive area.
Since the measurements made were all relative, rather than absolute,
it was concluded that there was little need for having a well- defined
sensitive area such as is usually provided by guard -ring arrangements.
3 Acheson Colloids Company. Port Huron, Michigan.
30
However, a somewhat inefficient guard -ring was provided for this
purpose and will be explained later.
The electrodes deposited on the polyethylene film were con-
nected into the measuring circuit, Figure 2, by means of graphite
lead -in strips which were painted directly onto the film. These
graphite strips made contact with strips of copper foil which were
secured to the film with epoxy. cement and plastic tape. Solder
connections at the ends of the copper strips made contact with the
voltage side and collecting side of the measuring circuit.
The measuring circuit was a current loop containing a voltage
source and a Victoreen Hi -Meg resistor. The voltage was supplied
by two 42 volt mercury cells chosen for long -time stability. The
current through the polyethylene film flowed through the Hi -Meg
resistor and the resulting potential drop was fed into a preamplifier
containing a vibrating -reed capacitor where it was changed to an
alternating signal. This signal was further amplified by the main
amplifier and read out on a meter calibrated in amperes. The pre-
amplifier, Hi -Meg resistors, and main amplifier were incorporated
in a Victoreen Model 475 vibrating -reed electrometer which was
capable of measuring currents as low as 10 -15 with high precision.
Since currents of less than 10-12 amperes were measured,
provision had to be made to shield all of the collecting circuit com-
ponents against electrostatic noise pickup and also against air
31
Q
Lead collimators
X Rays
Graphite voltage electrode
VP/MN/NM/MA viii//Min
Graphite collecting electrode
Polyethylene film
Coaxial cable
84 volts
High -Meg R
Pre -Amp
Amp
Figure 2. Diagram of circuit used to measure the radiation induced conductivity of polyethylene. Guard circuits are denoted by dotted lines.
I
L
32
ionization produced by the X rays. The circuits depicting these
guard arrangements are shown in Figuré 2. Short, coaxial
leads were employed to minimize air ionization and noise pickup as
much as possible. The use of a low voltage (84 volts) reduced the
strength of collecting fields. Grounded sheets of either copper or
graphite- coated polyethylene provided guards against a collecting
field existing between the collecting electrode and voltage electrode
lead -in strips. These are shown in Figure 3. The lower sheet of
copper can also be considered as a field shaping electrode (guard -
ring) which serves to define the sensitive collecting area of the
polyethylene film, as previously mentioned.
Figure 3 shows the apparatus used to hold the polyethylene
film in place. This holder was made of Plexiglass to provide addi-
tional insulation.
The electrometer was connected to the preamplifier with 20
feet of coaxial cable provided with the electrometer. This enabled
remote readings to be made without personnel exposure to radiation.
All of the other components were housed in a lead - shielded, grounded
Faraday cage made of lead, aluminum foil, and plywood (Figure 4).
Operating Characteristics
Before conductivity measurements were made using the poly-
ethylene -film dosimeter, calculations were carried out to determine
grounded
to ground - Ç
Slots for coaxial connection
Plexiglas s
Copper foil
to ground
Graphite-coated polyethylene
Polyethylene film Polyethylene / (dosimeter)
insulator
Plexiglas s Frame
A-Copper foil
Figure 3. Apparatus for holding polyethylene -film dosimeter. Guard electrodes are shown.
/' / .
/
/ /
/ /
s------/---c)
to amplifier
Pre Amp
Batteries
Figure 4. Complete apparatus shown housed in lead shielded Faraday cage.
1/8" Lead (grounded)
Q Collimator
\ ")
-
35
the magnitude of the leakage current due to the natural conductivity
of polyethylene. This was calculated with the formula:
I = E = E R pL/A
where E is the applied potential, L is the film thickness, A is the
sensitive area between the graphite electrodes, p is the resistivity
of polyethylene, and I is the electrical current. The following values
were used:
E = 84 volts
L = 1.4x10®3 cm
A = 0. 8 cm2
p = 1017 ohm -cm (manufacturers' specification)
Using these values the leakage current was computed to be 5 x 10° 13
amperes. This value was in satisfactory agreement with the meas-
ured leakage current which was observed to be between 10 -12 and
10 13 amperes. However, the measured value is dependent upon
temperature, film tension, humidity, and equipment construction.
Since the experimental and theoretical current values were in reason-
able agreement, it was assumed that the conductivity of the film was
being measured rather than other sources of leakage.
The polyethylene -film dosimeter was irradiated with 75 kVp
X rays to measure the magnitudes of the induced currents4 and the
4 The current flow due to the radiation induced conductivity of the polyethylene will be hereinafter referred to as the induced current.
36
response time of the system. The results are shown in Figure 5,
and indicate that the induced current reached an equilibrium value
approximately eight to ten minutes after the X rays were turned on.
When the X rays were turned off the current decreased rapidly at
first, and then decayed away exponentially as predicted by Fowler's
theory (1959). It was concluded from these results that to make the
required measurements, the X rays should be left on for at least
ten minutes for consistent measurements. The time lapse between
successive exposures had little effect on the equilibrium induced
current values. It was observed that increased exposure rates
accelerated the approach to equilibrium, but the current decay after
exposure was not as rapid. The results shown in Figure 5 correspond
to an exposure rate of ten Roentgens per minute.
The results shown in Figure 5 indicated that the induced cur-
rent at ten Roentgens per minute was significantly greater than the
leakage current for satisfactory measurements to be made. At
higher exposure rates the induced currents were increased by fac-
tors of 10 to 100 over the leakage current.
To determine the relationship between the dose rate in the
polyethylene and the induced current, the induced current was
measured as a function of exposure rate. The results of these ex-
periments are shown in Figure 6. The exposure rate is directly
proportional to the absorbed dose rate and can be used as a measure
1,4
1.2
0. 2
X-Raye on
37
X -Rays off o off on
i I I l i
5 10 15 20 25 Time, minutes
Figure 5. Relationship between induced current in poly- ethylene and time during which X rays are off and on. Exposure rate of 10 Roentgen /min.
N 1.0 --.I O v-I
0. 4
ác1.8 E m
á m
0.6
v
50
200 kVp
38
300 kVp
140 kVp
100 kVp
75 kVp
10 Exposure rate, R/minute
50
Figure 6. Induced current in polyethylene as a function of X -ray exposure and X -ray energy.
I I I I I I i ( I I I I I 1 1
5
10
m U y
39
of the absorbed dose rate in the polyethylene. Since the log -log
plot of exposure rate versus induced current was linear, it was
verified that the results obeyed the relationship:
i a k a D m
where i is the induced current, k is the induced conductivity, and
D is the absorbed dose rate. The slope of the line, m, was found
to vary slightly with X -ray energy. The values of m that were deter-
mined are listed below for the respective X -ray energies:
kVp
75 1.00 100 1.00 140 0.97 200 0.93 300 0.96
Fowler and Farmer (1956) found the value of m for polyethylene to
be 0. 80, which is lower than these values. This discrepancy may
be attributable to a variety of different experimental methods and
materials than those used by Fowler and Farmer (1956), The use
of lower exposure rates in this study than those used by Fowler and
Farmer (1956) may also affect the measurements.
Since the value of m was not constant over the X -ray energy
range employed, it was necessary to compute doses from induced
currents by using the value of m corresponding to the X -ray energy
used.
Errors introduced in the measurements by air ionization were
m
40
determined by shielding the sensitive area of the polyethylene -film
dosimeter with a disk of lead 0. 5 inches thick. The current meas-
ured upon X- irradiation was increased eight to ten percent over the
leakage current. The current measured with the lead disk removed
was 1300 -1400 percent greater than the leakage current. It was
concluded that air ionization was negligible, and the guard electrodes
were functioning in accordance with the design criteria.
A neon lamp was placed next to the apparatus to determine if
electrostatic noise was being picked up in the measuring circuit.
Measurements of the leakage current with the lamp both off and on
were identical. This proved noise pickup from external sources to
be negligible and showed that the grounded Faraday cage was func-
tioning properly.
The results of these preliminary check -out procedures indi-
cated that the polyethylene -film dosimeter was operating in an
acceptable manner for the determination of dose rates in soft tissue.
The only corrections necessary were those related to X -ray energy.
Dose Measurements
To measure the dose in soft tissue near bone with the poly-
ethylene-film dosimeter it was necessary to employ an apparatus
capable of simulating both soft tissue adjacent to plane bone inter-
faces and soft tissue contained in parallel -slab bone cavities. The
41
methods of measuring the soft tissue dose in these two locations
differed somewhat and will, therefore, be presented separately.
Dose Measurements in Soft Tissue Adjacent to Plane Bone Interfaces
The increased dose to soft tissue adjacent to a plane, semi -
infinite slab of bone was measured both as a function of depth into
the soft tissue and X -ray quality. The apparatus employed in these
measurements is shown in Figure 7.
A disk of bone - equivalent plastic, O. 50 centimeters thick and
4. 5 centimeters in diameter, was used to simulate a slab of bone.
This plastic was supplied by Dr. Francis Shonka of St. Procopius
College, Lisle, Illinois and is specified by Shonka, Rose, and Failla
(1958) to have the same chemical composition as human bone. Plas-
tic material having the same composition as soft tissue was also
supplied by Dr. Shonka but was employed in the cavity measurements
only.
Disks of polyethylene were used throughout to simulate soft
tissue since the dosimeter employed was made of polyethylene. Con-
sistent use of this material avoided disturbance of the secondary
electron fluxes. The small amount of graphite deposited on both
sides of the polyethylene -film dosimeter was assumed to have a
negligible effect on these electron fluxes since its atomic number
Graphite (grounded)
Polyethylene insulator
X Rays
to electrometer input
Graphite electrodes
Plastic bone disk
Polyethylene disk f 1)
Polyethylene film (dosimeter)
Polyethylene disk (2)
Plexiglass holder
Grounded copper foil
Figure 7. Apparatus used to simulate plane bone -soft tissue interfaces. Guard electrodes are also shown.
84 volts -f- fue-
AV A
111
A
43
of 6. 0 is not considerably different than the effective atomic number
of polyethylene.
The distance from the bone interface to the polyethylene dosim-
eter was determined by the thickness of the disk of polyethylene (1),
shown in Figure 7, between the dosimeter and the bone disk. Vary-
ing the thickness of this disk varied the distance of the dosimeter
from the bone interface. To obtain absorbed doses in soft tissue
directly adjacent to bone, the disk of polyethylene (1) was completely
removed.
The depth into the soft tissue at which the measured dose was
considered to occur was calculated using the following relationship:
d = x + y + z/2 microns
where x is the variable thickness of polyethylene disk (1), y is the
upper graphite electrode thickness of O. 5 microns, z is the thickness
of the polyethylene dosimeter determined to be 12.7 microns, and
d is the distance from the bone interface to the midpoint of the
polyethylene -film dosimeter. Figure 8 shows this relationship
schematically.
Dose measurements were made by assembling the apparatus
as shown in Figure 7 with the desired thickness of polyethylene
disk (1). Polyethylene disk (2), shown in Figure 7, was made 200
microns thick to simulate an infinite layer of soft tissue behind the
dosimeter. The mechanical currents resulting from disturbance
5000µ I d
O. 5µA2. 7µ 200µ
Bone Polyethylene Polyethylene Polyethylene disk
Figure
disk (1) film (dosim- eter)
Upper graphite voltage electrode
Lower graphite collecting electrode
Diagram showing dimensions of the components of the simulated plane bone -soft tissue interface.
44
O. 5µ (
a < >I< i
A
disk (2)
8.
.. X
45
of the polyethylene dosimeter were allowed to subside for a period
of approximately ten minutes. X- irradiation was begun and after
ten minutes of continuous exposure the current due to the induced
conductivity in the polyethylene was measured.
The relative energy absorption in soft tissue near plane bone
interfaces was measured rather than the dose in rads to this soft
tissue. This eliminated the necessity of calibrating the polyethylene
dosimeter to read dose directly. The relative energy absorption was
determined by first making polyethylene disk (1) of equilibrium thick-
ness; i. e. , of thickness greater than the maximum range of photo-
electrons originating in bone. A thickness of 84 microns was suffi-
cient for this purpose based upon the ranges of the maximum energy
photoelectrons quoted in Lea (1962). The current, i , induced in o
the polyethylene film with this polyethylene disk in place was then
taken to be related to the equilibrium dose rate in tissue, Do. o
By
then varying the thickness of polyethylene disk (1) from 0 to 84 mi-
crons, the induced currents, i, in the polyethylene film at distances
closer to the bone were determined. By taking the ratio of i to i 0
the increased induced currents in the polyethylene at these distances
were determined. The values of i/i were converted to increased o
doses by the relationship: 1
D = i m D (i o o
46
where m is the constant determined earlier and D/D o
is the increased
dose in soft tissue near bone. D/D 0
is equal to unity for soft tissue
remote from bone.
Dose Measurements in Soft Tissue Within Parallel -Slab Bone Cavities
The increased energy absorption in a layer of soft tissue inter-
posed between two parallel, semi- infinite slabs of bone was meas-
ured as a function of X -ray quality. A soft tissue layer 12.7 microns
in width was employed to simulate the Haversian canals found in bone
which range in diameter from 10 to 100 microns. A 12.7 micron
cavity was chosen since the dose to small cavities is greatest and
is, therefore, of the most concern.
The apparatus employed in these measurements was similar
to the apparatus used for measuring the dose in soft tissue adjacent
to plane bone interfaces. A few of the components were changed,
to better simulate a bone cavity. The apparatus is shown in Figure
9. A hole, 4. 5 centimeters in diameter, was drilled in the Plexi-
glass dosimeter holder to enable a bone- equivalent plastic disk and
soft tissue- equivalent plastic disk of Shonkars material to be inserted
beneath the polyethylene film. A soft tissue disk and bone disk were
also placed above the film. The bone disks were both 4. 5 centi-
meters in diameter and 0. 50 centimeters thick, while the soft tissue
Graphite (grounded)
Polyethylene insulator
84 volts WILIMISILVMNVMw1WWW
?T777771íß
- - - -- to electrometer
input
Plexiglass holder
i , , 1 /
` / / / / ,
Graphite electrodes
Polyethylene insulator
Plastic tissue disk
Plastic bone disk
Polyethylene film (dosimeter)
Plastic bone disk
Plastic tissue disk Copper foil (grounded)
Figure 9. Apparatus used to simulate a parallel -slab soft tissue cavity in bone. Guard electrodes are also shown.
__v `m F
48
disks were both 4. 5 centimeters in diameter and 0.20 centimeters
thick.
Since the bone and soft tissue disks contained graphite and
were conducting, it was necessary to enlarge the lower graphite
collecting electrode to 4. 5 centimeters in diameter, thus making
it the same size as the upper graphite voltage electrode. The X -ray
beam was not recollimated and the area of the polyethylene film upon
which the X rays impinged remained the same as before. Air
ionization might have become a problem had the X -ray beam been
enlarged to the size of the graphite electrodes.
By arranging the soft tissue disks and bone disks as shown
in Figure 9, a small soft tissue element interposed between two
semi - infinite slabs of bone was simulated. The width of this soft
tissue element was equal to the width of the polyethylene film and
graphite electrodes. By measuring the current, i, induced in the
polyethylene during irradiation, a measure of the dose rate, D,
in a soft tissue cavity within bone was obtained.
By then rearranging the bone disks and soft tissue disks so
that the soft tissue disks were adjacent to the upper and lower
graphite electrodes, a true soft tissue orientation was simulated.
This was possible due to the fact that the soft tissue disks were of
equilibrium thickness. The current induced upon X- irradiation,
was taken to be a measure of the equilibrium soft tissue dose, D o
io,
49
By taking the ratio of i to io and converting to DID., as pre-
viously done for the plane bone interface measurements, the in-
creased dose in the small soft tissue cavity was obtained.
There were certain problems associated with switching the
bone and soft tissue disks to obtain the respective D and Do values.
Physical re- orientation can cause changes in geometry and differing
film tensions. Since the objective was to measure D/D o
as a func-
tion of X -ray energy for a constant soft tissue cavity thickness,
this problem was solved by first making measurements of D with
the bone disks adjacent to the polyethylene film for the range of
X -ray energies studied. The cavity geometry was then changed so
the tissue disks were adjacent to the polyethylene film, and measure-
ments of Do were made for the same range of X -ray energies.
Theory predicts that the D/D 0
value for high energy X rays, approxi-
mately 300 kVp, is equal to unity. The D/D 0
values at lower ener-
gies were normalized by dividing by the 300 kVp D/D 0
value. Errors
were reduced by making only one change in the geometry and re-
maining errors were cancelled by the normalizing process.
X -Ray Production, Measurement, and Energy Specification
To provide useful data for clinical dosimetry, two X -ray
machines used for X -ray therapy were employed in this investigation.
The machines used were a General Electric Maxitron 300, which is
50
a 300 kVp beryllium window unit operated at 100 -300 kVp, and a
General Electric Maximar 100, which is a 100 kVp beryllium window
unit operated at 50 -100 kVp.
For purposes of comparison with theory, it was necessary to
specify an effective energy which roughly described each of the
different X -ray spectra used in the measurements. This was cal-
culated using the relationship:
0.693 HVL
where HVL (half -value- layer) is the thickness of absorber which
reduces the intensity of the X -ray beam to one half, and µ a
is the
linear X -ray absorption coefficient which depends on the X -ray
energy. The effective energy, E, was then taken from tables by
Grodstein (1957) which present a
as a function of X -ray energy.
Though this method of calculation is strictly applicable only to
monoenergetic photons, it is the only method available for specify-
ing the effective energy of an X -ray spectrum (Johns, 1961).
The half - value -layers of the X -ray spectra obtained with the
300 kVp X -ray unit were dialed on the control panel and the kVp
and beam filtrations were set automatically. Reference to data for
the 100 kVp X -ray unit gave the half -value- layers as a function of
kVp and beam filtration which were adjusted manually.
A Victoreen Radocon, Model 575, employing a medium energy
Fla(E) =
µa
51
chamber (30 -400 keV) was used to measure the exposure rate re-
sponse of the polyethylene dosimeter at the different X -ray energies.
No attempt was made to correct the low energy measurements since
the measurements were relative.
To ensure constant exposure conditions while using the 300
kVp X -ray unit, an ionization chamber permanently mounted in the
X -ray beam was used for monitoring purposes. No such arrange-
ment was available on the 100 kVp X -ray unit so the exposure was
checked periodically for constancy using the Radocon.
52
EXPERIMENTAL RESULTS
Results of Dose Measurements in Soft Tissue Near Plane Bone Interfaces
The increased dose, D/D , in soft tissue adjacent to a plane
bone interface was measured as a function of depth in the soft tissue
and X -ray quality. The experimental results are presented in tabu-
lar form, Tables 1 and 2, and graphical form, Figures 10, 11, and
12. The graphical results are most useful for comparisons with
theory since trends in deviations can be readily seen and interpreted.
The tables show the experimental uncertainties in the measured
values. The measured values shown are the mean of four individual
determinations and the uncertainties are average deviations from
these means.
The results obtained with the 100 kVp X -ray unit and the 300
kVp X -ray unit are presented separately since the spectral distribu-
tions obtained with these two units differed. Measurements were
made using X -ray qualities which are commonly employed in X -ray
therapy.
The results presented in Figures 10, 11, and 12, and Tables
1 and 2 are descriptive of the increased dose effect in soft tissue
near bone. In clinical dosimetry, however, it is desirable to know
the increased dose in finite layers of soft tissue rather than the dose
Table 1. Increased X -ray doses in soft tissue adjacent to plane, semi- infinite slabs of bone- -300 kVp X -ray unit,
X-Ray kVp 100 100 100 140 140 200 300
Quality HVL 0,25 mm Al 0,5 mm Al 1,0 mm Al 3,0 mm Al 0,5 mm Cu 1,0 mm Cu 4,0 mm Cu
(14,4 ikeV) (17,7 keV) (22,2 keV) (32.6 keV) (62 keV) (83 keV) (177 keV)
Distance from Interface to
Tissue Element D
o
D
D o
D
D D o
D
- o
D
D o
D
D o
D o
6.9 2.09*. 06 2.26±. 03 2. 27±. 06 2. 12±. 04 1, 74±. 01. 1.46±. 05 - 1.00±, 01
19.6 1.29±. 01 - -- - - - 1. 39±, 01 1.45±. 01 1.39*. 01 1.25±. 01 1.00±. 01
26. 0 1.09±. 02 1.11*, 03 1.22±. 02 1.26±. 04 1.19±. 02 1. 00±. 01
32.3 1.00±. 01 -- Mir MID -- 1.02±. 02 1,16±, 01 1,16±. 01 1.12+. 01 1.00±. 02
45.0 1.00±. 01 --ea--- 1 , 00t. 01 1. 00t. 01 1.04±. 02 1.02±. 01 1,00±. 01
57.7 1.00±. 01 1.00±. 01 1,00±, 01 1.00±. 01 1.01±. 01 1.01±, 01 1.00±. 01
83.0 1.00*. 01 1.00±. 01 1.00*. 01 1.00±. 01 1.00±. 01 1.00±, 01 1.00±. 01
D D . . ....
Table 2. Increased X -ray doses in soft tissue adjacent to plane, semi - infinite slabs of bone --100 kVp X -ray unit.
X-ray quality
50 kVp 0.75 mm Al HVL
(20.2 keV)
75 kVp 1. 85 mm Al HVL
(27. 6 keV)
100 kVp 2.95 mm Al HVL
(32. 5 keV) Distance from
interface to tissue element
D D
o
D D
o
D D
o
6.9 1.39 ±.05 2.05±.14 2.24±.05
19. 6 1 . 01 ± 01 1.24 ± . 07 1, 37 ±, 06
26.0 1,03±.02 1,16±,06 1.24±.03
32.3 0.95±.03 1,05±.02 1,16±.03
45. 0 1. 00 ± . 01 0.99 ± . 06 1. 08 ± . 03
57.7 ----- -- 1, 02 ± . 04 1. 05 ± . 03
83.0 0.96±.04 0.99±,02
.
-
2. 2
2.0
1.8
1. 6
AiA
1.4
1.2
1.0
o 300 kVp 4,OmmCuHVL
v 200 kVp 1.0 mm Cu HVL
140 kVp 0.5mmCuHVL
o o
55
10 20 30 40 Distance from bone interface, microns
Figure 10. Increased X -ray doses in soft tissue adjacent to plane, semi - infinite slabs of bone - -300 kVp X -ray unit.
50
0
1 I I I I
2.2
2.0
1.8
1.6 o
AIA
1.4
1.2
1.0
140 kVp 3.0 mm Al HVL
100 kVp 1.0 mm Al l-IV L
100 kVp 0.25 mm Al HVL
56
10 20 30 40 Distance from bone interface, microns
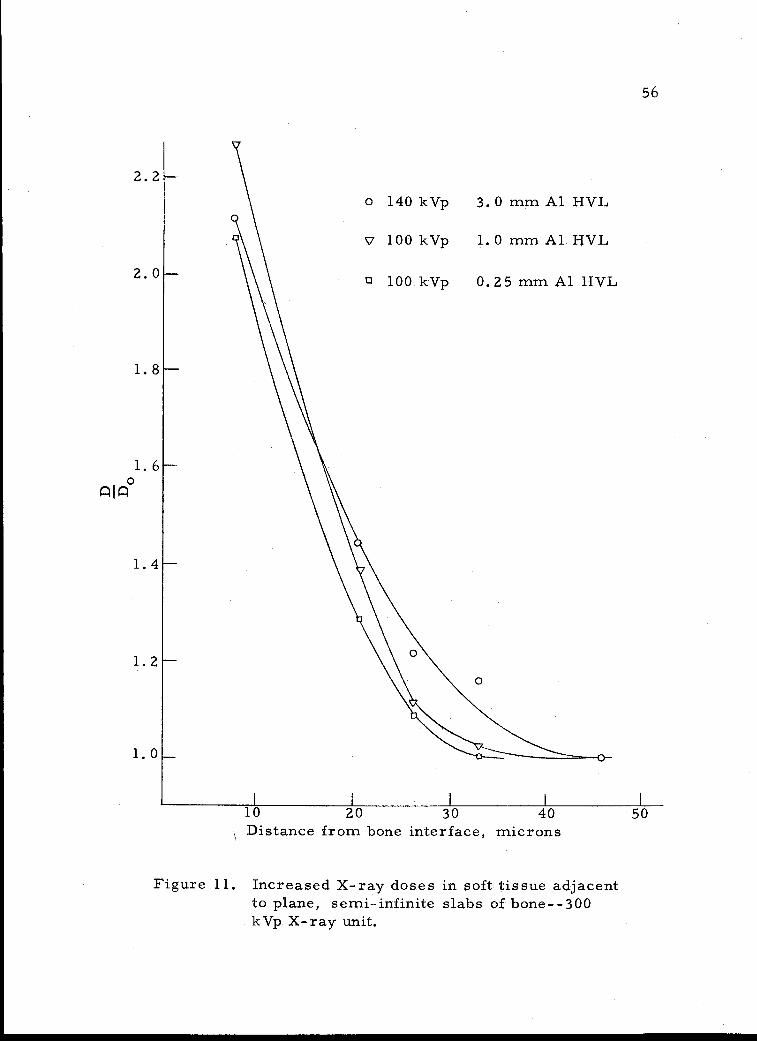
Figure 11. Increased X -ray doses in soft tissue adjacent to plane, semi- infinite slabs of bone --300 kVp X -ray unit.
50
o
0
o
1 I I I I
2.2
2.0
1.8
1.4
1.2
1.0
57
o 100 kVp 2.95 mm Al HVL
7 75 kVp 1.85 mm Al HVL
c 50 kVp 0.75 mm Al HVL
10 20 30 40 Distance from bone interface, microns
Figure 12. Increased X -ray doses in soft tissue adjacent to plane, semi- infinite slabs of bone- -100 kVp X -ray unit.
50
qiÁ 1. 6
0
I L I
58
at various depths in this soft tissue. The increased dose in finite
soft tissue layers was easily determined since the polyethylene
dosimeter integrated the dose over its finite thickness of 12.7 mi-
crons. By using polyethylene disks (1), shown in Figure 7, that
were 0, 12.7, and 25.4 microns thick, and measuring . the dose at
each of these three positions, it was possible to average the meas-
ured doses and calculate the dose to soft tissue layers of 13. 2, 25.9,
and 38. 6 micron thicknesses located adjacent to bone. 5 The results
of these measurements and calculations are shown in Figure 13 and
Tables 3 and 4. The results obtained with the 300 kVp X -ray unit
and 100 kVp X -ray unit are presented separately.
To calculate the dose in the soft tissue of interest, the dimen-
sions of the soft tissue and its position relative to bone must be
determined. Knowing the X -ray quality, the increased dose factor,
D/D 0
, is taken from Table 3 or Table 4. This value is then multi -
plied by the equilibrium dose, Do, to the soft tissue to obtain the
corrected dose, D. If the thickness of the soft tissue layer is not
found . in either Table 3 or 4, or if it is not located directly adjacent
5 More precisely, these doses apply to 12. 7, 25. 4, and 38,1 micron soft tissue layers located 0. 5 microns away from bone. For simplicity of presentation, the 0. 5 micron graphite electrode thickness was added to each layer of soft tissue in which the dose was actually measured. Errors introduced by doing this are negligible compared to experimental uncertainties since 0. 5
microns is a small percentage of the actual soft tissue layer thickness.
.
2.4
2.2
2.0
1.8
o 13.2 µ soft tissue layer
V 25.9 i soft tissue layer
0 38.6 µ soft tissue layer
59
1.4
1.2
20 40 60 80 Effective photon energy, keV
Figure 13. Increased X -ray doses in soft tissue layers of finite dimensions located adjacent to plane, semi - infinite slabs of bone shown as a function of effective photon energy --100 kVp X -ray unit, dotted curves; and 300 kVp X -ray unit, solid curves.
100 l 1 I 1 l
qiq°l. 6
Table 3. Increased X -ray doses in soft tissue layers of finite dimensions located adjacent to plane, semi - infinite slabs of bone --300 kVp X -ray unit.
X -ray quality
kVp HVL
100 0.25 mm Al
100 0. 5 mm Al
100 1,0 mm Al
140 3.0 mm Al
140 0.5 mm Al
200 1.0 mm Al
300 4.0 mm Al
D/D
Effective photon energy (ke V)
o 13.2 µ soft
tissue layer adjacent to
bone
25.9 p. soft tissue layer adjacent to
bone
38. 6 µ soft tissue layer adjacent to
bone
14.4 2.09 ±,06 1,69 1.46 ±.05 17,7 2.26 ± .03
22.2 2.27 ± , 06 1 , 83 ± . 05 1, 56 ±. 05
32.6 2.12±,04 1,78±,05 1.58±.05
62 1,74±.01 1,57±.01 1,43±..02
83 1 , 46 ± . 05 1 , 36 ± . 05 1, 28 ±. 05
177 1,00t.,01 1.00±,01 1,00±.01
Table 4. Increased X -ray doses in soft tissue layers of finite dimensions located adjacent to plane, semi - infinite slabs of bone- -100 kVp X -ray unit.
D/D o
X -ray quality
Effective photon energy (Ise V)
13. 21.1 soit tissue layer adjacent to
bone
25.9 µ soft tissue layer adjacent to
bone
38. 6 µ soft tissue layer adjacent to
bone
50 kVp 0.75 mm Al HVL
75 kVp 1.85 mm Al HVL
100 kVp 2.95 mm Al HVL
20. 2
27.6
32. 5
1.39± 0.05
2.05 + 0. 14
2.24± 0.05
1.20 ± O. 05
1. 64 ± 0.15
1. 81 ± 0. 09
1..12 ± 0.05
1.45* 0.13
1. 59 ± 0.09
62
to bone, the increased dose factor may be found by graphical inte-
gration of the appropriate area under the curves of Figures 10, 11,
or 12.
Results of Dose Measurements in Soft Tissue Contained Within Parallel -Slab Bone Cavities
Due to experimental difficulties which will be described later,
it was not possible to measure the dose in soft tissue contained in
parallel -slab bone cavities. The results of these measurements
shown in Table V indicate a marked discrepancy with theory. For
example, these results show that there is a decreased dose in soft
tissue cavities for certain of the lower X -ray energies. Even where
there is an increased dose effect, it is smaller than predicted by
theory. A much larger increased dose effect would be expected in
soft tissue within bone cavities than in soft tissue adjacent to plane
bone interfaces.
In Table V are shown the results of measurements made using
the 300 kVp X -ray unit. Measurements made using the 100 kVp
X -ray unit were equally incompatible and for this reason are not
presented.
Table 5. Increased X -ray dose in a 12.7 micron soft tissue layer interposed between two parallel, semi - infinite slabs of bone - -300 kVp X -ray unit.
6 7 Effective Db /Dt D /Do
X -ray X -ray quality energy Run 1 Run 2 Run 1 Run 2
63
100 kVp .25 mm Al HVL
100 kVp 1.0 mm Al HVL
140 kVp 3.0 mm Al HVL
140 kVp . 50 mm Cu HVL
200 kVp 1.0 mm Cu HVL
200 kVp 1.5 mm Cu HVL
300 kVp 2.0 mm Cu HVL
14.4 ke V 1.43 1.86 0,86 0.81
22. 2 ke V 1.20 1.93 0.72 0.84
32.6 keV 1.52 2.19 0.92 0.95
62.0 ke V 1.70 2. 52 1.02 1.10
82.7 keV 1.70 2.41 1.02 1.05
99.3 ke V 1.79 2.46 1.08 1.07
113 key 1.66 2.30 1.00 1.00
6 Db represents the dose measured with bone disks adjacent to the polyethylene film. Dt represents the dose measured with tissue disks adjacent to the polyethylene film.
7 D /Do is obtained by normalizing the Db /Dt values such that Db /Dt for the 300 kVp--2.0 mm Cu HVL measurement is unity.
64
COMPARISON OF EXPERIMENTAL RESULTS WITH THEORY
To confirm the validity of the doses which were measured in
this experiment, comparison was made with the doses expected from
theoretical considerations. Though various investigators have used
different methods to calculate these doses, the calculations are
essentially the same. Howarth's calculations (1965) were adapted
for this investigation. This investigator used the least number of
assumptions and the predicted doses should be more exact. The
main disadvantage of the Howarth theory (1965) is that the calcula-
tions are feasible only if monoenergetic X- rays are assumed. To
take the spectral distributions into account a computer is required,
and an elaborate analysis program must be used.
Comparisons between the experimental results and Howarth
theory (1965) will be made only for the plane interface situation.
Incompatible results were obtained in the parallel -slab cavity
measurements, and comparisons with the theory were not possible.
Though Howarth's theory (1965) is quite complex, the use of
simplified equations and accurate tables which were provided simpli-
fied the calculations for the increased dose in soft tissue adjacent
to plane bone interfaces. By determining the maximum energy, T,
of the photoelectrons produced by the monoenergetic X -ray beam
of interest, the effective range of the electrons, R , could be 0
65
calculated using the formula:
R = A T 75
0
where A is a constant given by Howarth (1965). Dividing the depth
into the soft tissue at which the increased dose was to be calculated
by R 0
gave a number determining a geometrical factor, tabulated
by Howarth (1965), for computing the increased dose at that depth.
The increased dose at both the interface, D 0
(0), and at different
depths in the soft tissue, D /Do(x), were then calculated using the
equations:
D(x) = 1 + k,T
o
D
-Do
1+ k,T GT(0) + 0. 5 ka
where GT is the geometrical factor for the photoelectrons, k
a parameter associated with the photoelectric X -ray attenuation
coefficient, and k is a parameter associated with the production of a
Auger electrons. The values of k and ka were tabulated ift Howarth
(1965) as a function of X -ray energy. These calculations were car-
ried out for monoenergetic X -ray beams of approximately the same
energy as the effective energies of the X -ray spectra employed in
this experiment.
Comparisons of the results of these calculations with several of
the experimentally measured values are shown in Figures 14 and 15.
GT
=
is
(0)
.
2. 2
2.0
1.8
1.6 o
AIA
66
y 100 kVp .25 mm Al HVL (14.4 keV)
o 140 kVp .50 mm Cu HVL (62.0 keV)
200 kVp 1.0 mm Cu HVL (82.7 ke V)
Howarth (60 keV)
\ \
\ . \ \
1.4
\
1.2 Howarth (80 keV) \ \ ',--Howarth (20 keV)
1.0
10 20 30 40 Distance from bone interface, microns
Figure 14. Increased X -ray doses in soft tissue adjacent to plane, semi - infinite slabs of bone. Comparison of results obtained with 300 kVp X -ray unit, solid curves, with Howarth (1965) data, dotted curves.
50
\ I \
H \
\ \
\ \
\
I
NN
-
1- -----
a
1
I\
1
I \
I
\ )
\
I
)
\
1
67
y 100 kVp 2.95 mm Al HVL (32. 5keV)
75 kVp 1.85 mm Al HVL (27.6 keV)
Howarth (40 keV)
10 20
Howarth (SO keV)
30 40 50 Distance from bone interface, microns
Figure 15. Increased X -ray doses in soft tissue adjacent to plane, semi - infinite slabs of bone. Comparison of results obtained with 100 kVp X -ray unit, solid curves, with Howarth (1965) data, dotted curves.
2.2
2.0
1.8
o
1.4
1.2
1.0
I I
I1I
11
68
Only a few of the experimental results are used for comparative
purposes to avoid complication of these diagrams. The results
using the 300 kVp X -ray unit are shown in Figure 14 and the results
using the 100 kVp X -ray unit are shown in Figure 15. The experi-
mental results which are shown were selected in order that com-
parisons at both high and low X -ray energies could be made.
Comparisons are also made of the Howarth calculations (1965)
with the results which were presented in Tables 3 and 4, and Figure
13. This comparison is shown in Figure 16 for the 13.2 micron
tissue layer only. To obtain the desired theoretical values it was
necessary to graphically integrate the results of Howarth (1965),
such as are shown in Figures 14 and 15, for a range of different
monoenergetic photon beams. In performing these integrations it
was necessary to subtract the increased doses occurring in the
area adjacent to the bone interface where the graphite electrode of
the polyethylene dosimeter was located, since the dose was not
measured at this location.
Figure 16 shows comparisons between theoretical and experi-
mental doses for a 13.2 micron soft tissue layer only. Comparisons
between experiment and theory for soft tissue layers of different
dimensions showed the same general trends.
2.4
2.2
2.0
1.8
1.6 ASÁ
1.4
1.2
69
Results obtained with 300 kVp X -ray unit Results obtained with 100 kVp X -ray unit - -- - Howarth data
20 40 .0 80 100 Effective photon energy, keV
Figure 16. Increased X -ray dose in a 13.2 micron soft tissue layer located adjacent to a plane, semi - infinite slab of bone, as a function of effective X -ray energy. Comparison of results obtained with both the 100 kVp and 300 kVp X -ray units with theoretical data of Howarth (1965).
70
DISCUSSION OF RESULTS
Examination of the comparisons shown in the preceding section
would lead to the conclusion that experiment and theory are not in
good agreement. However, X -ray spectra of broad energy distribu-
tions were employed in this study and the results compared in Fig-
ures 14, 15, and 16 will not be in close agreement with theory which
is based upon a monoenergetic radiation source. One of the main
purposes of this experiment was to see what effect the spectra of
X -ray energies does have on the dose in soft tissue near bone.
As can be seen from Figures 14 and 15, the experimentally
determined dose distribution in soft tissue adjacent to a plane bone
interface has the same general shape as the theoretical dose distri-
bution. Relations between the experimental values are similar to
relations between the theoretical values, but the experimental values
differ considerably in magnitude from theory. Also, the results
obtained with the 300 kVp X -ray unit differ from the results ob-
tained with the 100 kVp X -ray unit. In order to validate the experi-
mental results it is necessary to give plausible explanations for
these differences.
The differences in magnitudes between the theoretical and
experimental results is attributable to two major factors, the
X -ray spectra and the nontissue- equivalence of polyethylene in the
71
photoelectric energy region.
In an X -ray spectrum there are photons of both higher and
lower energies than the effective energy upon which the comparisons
are based. The lower energy photons will considerably increase the
dose at points in soft tissue close to the bone interface, while the
higher energy photons will extend the increased dose effect further
into the soft tissue layer. This is what was observed experimentally
in Figures 14 and 15. Using a lightly filtered 100 kVp X -ray beam
with an effective energy of 14 keV, both of the above effects are
important, since most of the X rays are being attenuated by the
photoelectric process. For a heavily filtered 200 kVp X -ray beam
with an effective energy of 83 keV the photons with energy greater
than 100 keV will have little effect on the increased dose since they
are attenuated predominantly by the Compton process. There will
be few low energy photons since heavy filtration is employed, and
the dose in soft tissue very close to bone will not be appreciably
increased above what would be expected for the 83 keV photons. In
the latter case the effective energy is a good indication of the energy
of the photons which are increasing the dose in the soft tissue, and
comparison between experiment and theory should be good. Exami-
nation of the experimental results confirms this hypothesis.
It would have been desirable to have used heavier beam filtra-
tion to produce X -ray spectra of narrower energy distribution.
72
However, X -ray outputs were too low at high filtration for accurate
measurements to be made.
Discrepancies between experiment and theory also arise from
the nontissue- equivalence of polyethylene. The increased dose in
polyethylene would be expected to be greater than that in soft tissue
since there will be a greater difference between the equilibrium doses
in bone and polyethylene than bone and soft tissue. This expected
deviation is shown by the experimental results.
Differences in the results obtained with the 300 kVp X -ray
unit and 100 kVp X -ray unit are attributed to the different spectral
distributions produced by these units.
In Figure 16 it can be seen that measurements made at high
effective energies on the 300 kVp X -ray unit and low effective ener-
gies on the 100 kVp X -ray unit are in reasonable agreement with
theory. This seems to indicate that spectral considerations account
for the major discrepancy between experiment and theory.
In the preceding paragraphs the terms discrepancy, difference,
and deviation should not be construed as meaning experimental errors
and uncertainties. Rather, they refer only to discrepancies between
the experimental results and the theoretical results of Howarth (1965).
The magnitudes of the experimental uncertainties were always suffi-
ciently small to ensure differentiation between the different experi-
mental results which were obtained.
73
Experimental errors were kept to a minimum in this experi-
ment by making relative measurements only, rather than absolute
measurements. So long as determinations of the dose distributions
next to a bone interface were carried out under identical experi-
mental and environmental conditions, most of the experimental
errors were assured of cancelling. Four individual determinations
of these dose distributions were made for each X -ray quality on dif-
ferent days to determine the uncertainties. The types of errors
which will not cancel are those due to environment such as tempera-
ture or humidity changes during the individual runs. Errors in the
determination of the constant m in the formula relating induced cur-
rent and absorbed dose rate could introduce further uncertainty.
Since incompatible results were obtained for the dose measure-
ments in soft tissue cavities within bone, it is necessary to define
what was at fault if the previous results for the plane bone -soft
tissue interface are to remain valid. The most plausible explana-
tion for the results can be attributed to the nature of the polyethylene
dosimeter used in the measurements. Unlike the dosimeter used in
the plane interface measurements, the lower graphite collecting
electrode was the same size as the upper graphite voltage electrode.
Thus the area of the film defined by these electrodes was larger and
the leakage currents measured without X- irradiation were approxi-
mately an order of magnitude larger. Since the X -ray beam was
74
not recollimated, its projected area on the sensitive area of the
film was the same as for the plane interface measurements. As a
result the current induced by X rays was not sufficiently greater than
the leakage current to enable accurate measurements to be made.
Air ionization was also greater with the larger collecting electrode.
Another problem encountered in the cavity measurements was
attributable to the soft tissue disks and bone disks which were used.
Though a wide variety of these disks were available in different
thicknesses, the only ones which could be used were those with the
dimensions mentioned earlier. The thinner disks were badly warped
resulting in undesirable air gaps. The amount of both bone and soft
tissue plastic interposed in the X -ray beam was, therefore, greater
than desirable and considerable X -ray attenuation resulted. This
reduced the induced currents, and introduced uncertainty in defining
the effective energy of the radiation reaching the material surround-
ing the cavity. This problem did not present itself in the interface
measurements since only a bone disk was interposed in the X -ray
beam.
The above explanations for the poor cavity results are but
hypotheses, and there is no direct experimental evidence that they
are the sources of error. However, these two factors were the only
experimental conditions which were different from the plane interface
75
measurements, and since reasonable results were obtained for the
plane interface it is reasonable to assume the poor results to be
due to these factors.
76
SUMMARY AND CONCLUSIONS
In this investigation a polyethylene dosimeter in conjunction
with an apparatus for simulating soft tissue at locations near bone
was used to measure the increased X -ray dose in soft tissue near
bone. Both plane bone -soft tissue interfaces and parallel -slab bone -
soft tissue cavities were considered, and the dose in the soft tissue
at each of these locations measured.
Specifically, the increased dose in soft tissue adjacent to
plane, semi- infinite slabs of bone was measured as a function of
depth in the soft tissue and effective X -ray energy. The increased
dose in soft tissue layers of finite dimensions located adjacent to
bone was measured as a function of X -ray energy. It was found
that agreement between experiment and the theory of Howarth (1965)
was generally qualitative, with the magnitudes of the experimental
doses being considerably higher than predicted by Howarth (1965).
This difference was attributed to X -ray spectra and the nontissue-
equivalence of polyethylene. From these results it can be concluded
that the increased dose in soft tissue near plane bone interfaces is
greater than predicted by theory when X -ray spectra are considered,
especially for broad X -ray spectra specified by low effective ener-
gies.
An attempt was made to measure the increased dose in soft
77
tissue elements between two parallel, semi - infinite slabs of bone.
However, these measurements could not be made due to experi-
mental difficulties. The theoretical values for the dose in the
Haversian canals, canalicules, or lacunae found within the inorganic
matrix of bone requires further support due to the incomplete experi-
mental results currently available.
The data presented in this investigation further confirm the
theoretical calculations of the X -ray dose in soft tissue near bone.
X -ray spectra as compared with monoenergetic radiation sources
were shown to have a considerable effect on the derived doses, and
should be considered when the theoretical calculation method is
used.
78
BIBLIOGRAPHY
Armistead, F. C. , J. C. Pennock and L. W. Mead. 1949. Con- ductivity changes in dielectrics during 2.5 MeV X- radiation. Physical Review 76:860.
Aspin, N. and H. E. Johns. 1963. The absorbed dose in cylindrical cavities within irradiated bone. British Journal of Radiology 36:350-362.
Charlton, D. E. and D. V. Cormack. 1962. Energy dissipation in finite cavities, Radiation Research 17:34 -49.
Eisberg, Robert Martin. 1964. Fundamentals of modern physics. New York, Wiley. 729 p.
Ellis, R. E. 1966. Some experiments relating to dose in a model of trabecular bone. British Journal of Radiology 39:211 -215.
Epp, E. R. , H. Q. Woodard and H. Weiss. 1959. Energy absorp- tion by the bone marrow of the mouse receiving whole -body irradiation with 250 kV X rays or Cobalt -60 gamma rays. Radiation Research 11 :184 -197.
Fowler, John F. 1957. Absorbed dose near bone: a conductivity method of measurement. British Journal of Radiology 30: 361 -366.
Fowler, John F. 1959. Radiation induced conductivity in the solid state, and some applications. Physics in Medicine and Biology 3:395 -410.
Fowler, John F, and F. T. Farmer. 1953. Effect of temperature on the conductivity induced in insulators by X rays. Nature 171:1020 -1021.
Fowler, John F. and F. T. Farmer. 1954. Conductivity induced in insulating materials by X rays. Nature 173:316 -317.
Fowler, John F. and F. T. Farmer. 1955. Conductivity induced in unplasticized Perspex by X rays. Nature 175:516 -517.
Fowler, John F. and F. T. Farmer. 1956. Insulators for radiologi- cal instruments. British Journal of Radiology 29:118-119.
79
Greening, J. R. 1947. Determination of X -ray energy distributions by absorption method. British Journal of Radiology 20:71 -78.
Grodstein (White), G. R. 1957. X -ray attenuation coefficients from 10 keV to 100 MeV. Washington. 54 p. (National Bureau of Standards. Circular no. 583)
Hine, Gerald J. and Gordon L. Brownell (eds.) 1964. Radiation dosimetry. 4th ed. New York, Academic Press. 932 p.
Howarth, J. L. 1965. Calculation of the absorbed dose in soft - tissue cavities in bone irradiated by X rays. Radiation Re- search 24:158 -183.
International Commission on Radiological Units and Measurements. 1963. Clinical dosimetry; Recommendations of the Commission )1962) ICRU Report 10d. Washington. 61 p. (U. S. National Bureau of Standards. Handbook no. 87)
Johns, Harold Elford. 1964. The physics of radiology. Rev. 2d. ed. Springfield, Ill., Charles C. Thomas. 767 p.
Lea, D. E. 1962. Actions of radiations on living cells. 2d ed. New York, Cambridge University Press. 416 p.
McLean, Franklin C. and Ann M. Budy. 1964. Radiation, isotopes, and bone. New York, Academic Press. 215 p.
Mayburg, S. and W. L. Lawrence. 1952. The conductivity change in polyethylene during gamma -irradiation. Journal of Applied Physics 23:1006 -1011.
Mayneord, W. V. 1937. Significance of the Roentgen. Acta of the International Union Against Cancer 2:271 -281.
Munson, R. J. 1950. A note on the paper by F. W. Spiers (British Journal of Radiology 22:521. 1949) entitled "The influence of energy absorption and electron range on dosage in irradiated bone ". British Journal of Radiology 23:505.
Shonka, F. R. , J. E. Rose and G. Failla. 1958. Conducting plastic equivalent to tissue, air and polystyrene. In: Health and Safety: Dosimetry and Standards; Proceeding of the Second United Nations International Conference on the Peaceful Uses of Atomic Energy, September, 1958. Vol. 21. Geneva, United Nations. p. 184.
80
Spiers, F. W. 1946. Effective atomic number and energy absorp- tion in tissues. British Journal of Radiology 19 :52 -63.
Spiers, F. W. 1949. The influence of energy absorption and elec- tron range on dosage in irradiated bone. British Journal of Radiology 22:521 -533.
Spiers, F. W. 1950. Calculations of ionization near bone surfaces. British Journal of Radiology 23:743.
Spiers, F. W. 1951. Dosage in irradiated soft tissue and bone. British Journal of Radiology 24:365 -369.
Spiers, F. W. 1963. Interim report on the determination of dose to bone marrow from radiological procedures. British Journal of Radiology 36:238 -240.
Spiers, F. W. 1966. A review of the theoretical and experimental methods of determining radiation dose in bone. British Journal of Radiology 39:216 -221.
Spiers, F. W. and H. Q. Woodard. 1953. The effect of X rays of different qualities on the alkaline phosphatase of living mouse bone. British Journal of Radiology 26:38 -46.
Stenstrom, K. W. and J. F. Marvin. 1946. Ionization measure- ments with bone chambers and their application to radiation therapy. American Journal of Roentgenology 56:759 -770.
Whyte, G. N. 1959. Principles of radiation dosimetry. New York, Wiley. 124 p.
Wilson, C. W. 1950. Dosage of high voltage radiation within bone and its possible significance for radiation therapy. British Journal of Radiology 23 :92 -100.
Wingate, Catharine L. , W. Gross and G. Failla. 1962. Experi- mental determination of absorbed dose from X rays near the interface of soft tissue and other material. Radiology 79: 984-1000.