1 ABSORPTION COOLING FOR DIFFUSION DRIVEN DESALINATION PROCESS By UDAY KIRAN MAHAKALI A THESIS PRESENTED TO THE GRADUATE SCHOOL OF THE UNIVERSITY OF FLORIDA IN PARTIAL FULFILLMENT OF THE REQUIREMENTS FOR THE DEGREE OF MASTER OF SCIENCE UNIVERSITY OF FLORIDA 2011
Transcript
1
ABSORPTION COOLING FOR DIFFUSION DRIVEN DESALINATION PROCESS
By
UDAY KIRAN MAHAKALI
A THESIS PRESENTED TO THE GRADUATE SCHOOL OF THE UNIVERSITY OF FLORIDA IN PARTIAL FULFILLMENT OF THE
2.1 Description of Conventional DDD Plant ............................................................ 19 2.2 Diffusion Desalination Process with Ammonia Absorption System ................... 22
2.2.1 Requirement of Ammonia Absorption System ......................................... 22
2.2.2 Description of DDD Plant with Ammonia Absorption System .................. 23
3 REFRIGERATION SYSTEM ................................................................................... 25
4-1 Differential control volume for liquid/gas heat and mass transfer within diffusion tower. ................................................................................................... 34
4-2 Differential control volume for liquid/gas heat and mass transfer within counter current condenser .................................................................................. 35
5-1 Diffusion tower exit air temperature variation with air to feed water mass flow ratio .................................................................................................................... 43
5-2 Diffusion tower exit feed water temperature variation with air to feed water mass flow ratio. ................................................................................................... 43
5-3 Diffusion tower exit humidity ratio variation with air to feed water mass flow ratio. ................................................................................................................... 44
5-4 Condenser tower exit air temperature variation with fresh water feed to air mass flow ratio. ................................................................................................... 48
5-5 Condenser tower exit fresh water temperature variation with fresh water feed to air mass flow ratio. .......................................................................................... 50
5-6 Condenser tower exit humidity ratio variation with fresh water feed to air mass flow ratio. ................................................................................................... 51
5-7 Fresh water production variation with fresh water feed to air mass flow ratio. .... 53
5-8 Percentage increase in fresh water production variation with fresh water feed to air mass flow ratio. .......................................................................................... 55
6-1 Variation of fresh water produced with . ............................................................ 60
6-2 Variation of required area for diffusion and condenser towers with . ................ 62
The fraction of exhaust air going into refrigeration system
Height of packing material m
10
Greek letters
Dynamic Viscosity Pa-s
Density kg/m3
Critical surface tension of the packed bed N/m
Liquid surface tension N/m
Humidity ratio
Relative Humidity
Subscripts
Air
Absorber
Ammonia absorption Refrigeration
Cooling fresh water
Condenser
Cooling load
Diffusion driven desalination
Exhaust air
Evaporator
Fresh water
Generator
Air/Vapor mixture
Gas side parameter based on the specific area of the packed bed
Liquid/Vapor interface
Inlet
11
Liquid
Liquid side parameter based on the specific area of the packed bed
Liquid side parameter based on the specific wet area of the packed bed
Outlet
Available for refrigeration system
Saturated state
Saline water
12
Abstract of Thesis Presented to the Graduate School of the University of Florida in Partial Fulfillment of the Requirements for the Degree of Master of Science
ABSORPTION COOLING FOR DIFFUSION DRIVEN DESALINATION PROCESS
By
Uday Kiran Mahakali
August 2011
Chair: James F. Klausner Major: Mechanical Engineering
In order to make the diffusion driven desalination (DDD) process commercially
more attractive, the fresh water production from the process must be increased. This
research investigates the possible increase in the fresh water production from the DDD
process when the condenser fresh water inlet temperature is reduced. The reduction in
the temperature of fresh water is achieved by a single effect ammonia absorption
refrigeration system which can be run on waste heat like the DDD process. The heat
and mass transfer analysis for the DDD process is utilized and simulations are carried
out for the heated air / heated water case for different air and water mass fluxes.
Simulations are performed for two condenser feed water inlet temperatures of 25oC and
1oC, for the same diffusion tower outlet conditions. The results show an increase in the
fresh water production. A conceptual design of the DDD plant coupled with an ammonia
absorption refrigeration system working on waste heat from a power plant is conceived.
A parametric study is made in which the DDD plant and the ammonia absorption
refrigeration system are powered by the waste heat available at 93oC from a 271 MW
solar combined cycle power plant. The of the ammonia absorption refrigeration
system operating on the waste heat under the available conditions is calculated. Results
13
indicate that due to the low of the refrigeration system, there is a higher fresh
water production when the entire available waste heat is utilized by the DDD plant itself,
and the ammonia absorption refrigeration system is not used.
14
CHAPTER 1 INTRODUCTION
Water is an indispensable part of everyday human life. Fresh water is needed for
the biological activities of living organisms. Agriculture requires fresh water for crop
cultivation. Industries require fresh water for washing, cooling, fabrication and
processing. Approximately, 70% the Earth's surface is covered by a water body and
30% is composed of land. Unfortunately, of water available on the Earth, 97% is salt
water and only 3% is fresh water [1]. The salt water has very limited use for mammalian
life support. The 3% of fresh water is not completely available for ready use by
mammals since 69% is trapped in the form of ice and 30% resides under the ground as
ground water. The remaining 1% is available on the surface. Of this 1%, only 0.3% is
present in the rivers and lakes, which can be easily used by mammals. The remaining
0.7% is either present in the atmosphere as vapor or some other unusable form. Given
the limited availability of fresh water and its role in mammalian life, it should be treated
as a very precious resource.
The increase in population of humans and the proportional increase in their need
for fresh water have led to shortages of fresh water supply around the world. The
scientific and engineering communities are actively developing new technologies to
address this shortage. One such popular method is Desalination.
Many countries such as Saudi Arabia, United Arab Emirates, and Kuwait depend
on desalination technologies to meet their fresh water requirements. According to an
IDA Worldwide Desalting Plant Inventory Report [2], in 2009 approximately 1.7 billion
gallons per day of fresh water was being produced by desalinating salt and brackish
water in the desalination plants commissioned all over the world.
15
Desalination involves the conversion of the abundantly available salt and brackish
water to consumable fresh water. This is achieved by removing the salt and minerals
from the water. The desalination process sometimes yields sea salt as a by-product.
There are many different processes available for desalinating salt or brackish water [3]
such as processes based on phase change, processes using membranes, and
processes based on modifying the chemical bonds. Some of the commercially popular
methods [3] used for desalination are Vacuum Distillation, Low Temperature Thermal
Desalination, Multistage Flash Distillation, Multiple Effect Distillation, Electrodialysis and
Reverse Osmosis. Multistage Flash Distillation is the most widely used method while
the Reverse Osmosis method is gaining in popularity. The Low Temperature Thermal
Desalination method is a relatively new one. Some other methods of desalination are
solar humidification-dehumidification, freezing, renewable energy powered conventional
desalination, among others.
Although Multistage Flash Distillation and Reverse Osmosis are commercially
popular and reliable methods, there are certain disadvantages. For example, thermal
distillation is economically feasible only for very large scale production, typically more
than 300-400 kL/day [3]. Thermal distillation is very energy intensive and requires a high
level of technical knowledge to build, operate and maintain efficient plants. Reverse
Osmosis technology is gaining in popularity as the cost for equipment has reduced in
recent years due to mass production. However, the performance and longevity of a
Reverse Osmosis plant is significantly dependent on the pre-treatment of the feed
water, which is expensive. Also, there is a danger of contamination of the product due to
the growth of bacteria on the membranes. High pressures are required to operate the
16
Reverse Osmosis plant, and the high pressures lead to an increase in frequency of
plant shut down due to failures in the mechanical equipment providing the high
pressures.
In an attempt to find a lower cost desalination process, Humidification -
Dehumidification (HDH) was studied by Bourouni et al. [4]. According to Bourouni, it is a
simple and flexible process utilizing low grade heat energy. It is described as a process
involving low initial cost, lower operation and maintenance costs. Many novel methods
like the Multiple Effect Humidification process, Mechanically Intensified Evaporation
process which are based on the principle of HDH process, have been developed to
carry out desalination. However, each of them has its own disadvantages. For example,
the HDH process is unsuitable for the economical fresh water production on a large
scale when compared against Reverse Osmosis or Multistage Flash Distillation
methods because it requires a very large area of land.
In order to overcome the short comings of the HDH desalination method
mentioned above, an innovative desalination method known as the Diffusion Driven
Desalination (DDD) process was studied by Klausner et al. [5]. The DDD process
provides an economically feasible desalination method suitable for desalinating saline
water on a large scale. The DDD process, like the HDH method, can be run on low
grade waste heat. In the DDD process, air is pumped into a diffusion tower and is made
to contact saline or brackish water flowing in the opposite direction along the height of
the tower. Heat transfer and mass transfer occur between the air and saline or brackish
water and as a result only the fresh water vaporizes leaving behind salts and other
minerals. The air exits the diffusion tower humidified. This humidified air is then pumped
17
into another similar tower known as the condenser tower. In this tower, it is made to
contact fresh water flowing in opposite direction, which is at a lower temperature than
the air entering the condenser tower. Heat transfer occurs and the water vapor
condenses out of the air stream and joins the fresh water flowing in the tower. Thus the
mass of fresh water at the tower exit is greater than that at the tower inlet, the difference
being the fresh water production. Also, the air exits the condenser tower dehumidified.
The DDD process which has been described in detail by Li et al. [6] is presented in the
chapter 2 of this report.
It is known that as the temperature of air decreases, its capacity to hold water
vapor also decreases, and the water vapor condenses out. This is the principle utilized
in the condenser tower of the DDD process to extract fresh water from the air stream.
Currently, the amount of fresh water that can be extracted from the air stream is limited
by the temperature of the fresh cooling water being pumped into the condenser tower.
This temperature is the ambient temperature of fresh water available, which is typically
25oC. In the current work, this temperature is brought down to 1oC, which is the lowest
possible temperature for the safe circulation of water without forming ice. Utilizing the
heat and mass transfer analysis available for the DDD process which is developed by
Klausner et al. [7], the amount of fresh water produced when the fresh cooling water
temperature is1oC has been calculated for various mass flux combinations of air and
water. Also, the increment in the amount of fresh water produced due to the reduction in
the fresh cooling water temperature from 25oC to 1oC is also presented.
The main advantage of the DDD process compared with commercially available
processes is that it can run on low grade heat energy. Therefore, in an effort to keep up
18
with this advantage, the fresh cooling water is cooled to 1oC by an Ammonia Absorption
Refrigeration (AAR) plant, which can also be run on low grade energy. The results of a
study involving a 271 MW solar combined cycle electric power generation plant,
together with the DDD system and an AAR plant running on shared waste energy from
the power generation plant are presented in this work. The optimum operating condition
for the DDD process as part of this co-generation plant is also discussed.
19
CHAPTER 2 DIFFUSION DRIVEN DESALINATION
2.1 Description of Conventional DDD Plant
The conventional diffusion driven desalination process has been developed by
Klausner et al. [5]. A laboratory scale facility is currently in operation at the University of
Florida, Gainesville. A brief description of the operation of the DDD plant is given
below.
It is possible to run the DDD plant in three modes: 1. Ambient Air and Heated Water 2. Heated Air and Ambient Water 3. Heated Air and Heated Water
In the Ambient Air and Heated Water mode, the air that is passed into the diffusion
tower is at atmospheric temperature while the sea water that is passed into the diffusion
tower is heated to a temperature greater than that of the atmospheric air. In the Heated
Air and Ambient Water mode, the air that is passed into the diffusion tower is heated to
a higher temperature than that of the sea water that is passed into the diffusion tower,
which is at atmospheric temperature. In the Heated Air and Heated Water mode, both
air and water that are passed into the diffusion tower are heated to higher temperatures
than the atmospheric temperature at which they are available. The following description
on the operation of the DDD plant is based on the Ambient Air and Heated Water
operating mode.
Figure 2-1 shows a process flow diagram for a typical DDD facility. There are two
towers and three fluid circulation systems: Diffusion Tower, Condenser Tower, Saline
Pure ammonia in a gaseous state is sent into the absorber from the evaporator. In
the absorber, the pure gaseous ammonia comes into contact with the water which
absorbs ammonia. This absorption process is exothermic. However, the concentration
of ammonia in water increases with decreasing temperature. Therefore in order to have
maximum absorption of ammonia by water, the absorber temperature is maintained low
29
by removing the heat released due to the reaction by circulating cooling water. The
following reaction occurs in the absorber:
(3.3)
The strong solution of ammonia in water exiting the absorber is pumped into the
generator via the re-generator. Generally a centrifugal pump or a diaphragm pump is
used for this purpose. The energy consumed by this pump is very low compared to the
heat energy supplied to the generator, usually on the order of 0.25%. The pump also
raises the pressure of the Ammonia -Water strong solution. This strong solution is
passed through a re-generator which is a heat exchanger so as to preheat the solution
before entering into the generator. This reduces the amount of thermal energy supplied
to the generator and helps in improving the system . This strong solution at higher
pressure is then sent into the generator which is also a heat exchanger. Here, the heat
energy is supplied from sources like waste heat from a thermal power plant or a
renewable energy source like solar energy. The temperature at which heat is supplied is
generally above 85oC. In the generator, the heat energy supplied is used to raise the
temperature of the strong Ammonia-Water solution. The solubility of ammonia in water
decreases with increase in temperature and the pure ammonia vapor separates out
from the solution leaving a weak solution of Ammonia-Water behind. Ideally only pure
ammonia should leave the generator, but in practice the heat energy supplied also
vaporizes some water. So, a mixture of Ammonia-Water vapor leaves the generator.
When water vapor is also carried into the evaporator, it reduces the performance of the
system. In order to remove the water vapor in the mixture, it is passed through an
analyzer and then through a rectifier. The analyzer is placed on top of the generator and
30
it generally consists of a distillation column. It contains a number of horizontal plates
along its length. When the Ammonia-Water Vapor mixture enters the analyzer, it rises
up and cools down. The boiling point of water being higher than that of ammonia, it
condenses first and is collected in the bottom of the analyzer. The ammonia is still in
gaseous phase. A stronger mixture of Ammonia-Water vapor mixture exits the analyzer
from the top and passes into the rectifier in which further removal of water particles from
the mixture occurs and nearly pure ammonia in the gaseous state exits the rectifier. The
rectifier is a heat exchanger which is cooled externally by a coolant. This further
reduces the temperature of the Ammonia-Water vapor mixture, and water particles
condense out along with few ammonia particles. This mixture is then sent into the
analyzer and is collected at the bottom along with the analyzer exhaust. In both the
rectifier and the analyzer, the weak Ammonia-Water mixture drains down the system
into the generator by gravity. This is mixed with the strong Ammonia-Water mixture in
the generator and further heated to generate more ammonia vapor. Finally, the weak
Ammonia-Water mixture is drained down from the generator by gravity and is sprayed
into the absorber from the top. The weak mixture is passed through the re-generator
before being sprayed into the absorber, where it is pre-cooled losing its heat to pre-heat
the strong Ammonia-Water mixture. From the re-generator, it is passed through a valve
where it is further expanded lowering its temperature and finally into the absorber. The
pure ammonia gas which is at a high pressure and temperature at the exit of the rectifier
now enters into the condenser which is a heat exchanger similar to that in the vapor
compression system. In the condenser pure ammonia gas rejects heat to a coolant and
it condenses into liquid. The pressure remains almost constant barring minor flow
31
losses. The liquid ammonia is then sent through an expansion device where it expands
suddenly and significantly drops in pressure, there by further lowering its temperature. It
is through this valve that the flow rate of ammonia and the amount of expansion is
controlled which in turn determines the amount of cooling load and the minimum
temperature that can be attained through the refrigeration system. The liquid ammonia
which is at a very low pressure and temperature is then sent into the evaporator which
is the space to be refrigerated. The ammonia absorbs heat from the refrigerated space
and changes its phase into vapor. This low pressure but higher temperature gaseous
ammonia is then sent into the absorber for absorption by water and the cycle repeats.
3.2.2 Characteristics of Ammonia Absorption
The ammonia absorption refrigeration system has many characteristics that make
it suitable for use with low grade waste heat. Some of these characteristics are
discussed here.
The mechanical compression present in the conventional vapor compression
refrigeration (VCR) system is replaced by chemical-thermo compression in the VAR
system. As mentioned earlier, the VAR system can run on waste heat, unlike the VCR
system which requires electrical energy to operate. The VAR system converts the vapor
from the evaporator exit back into a liquid using a method that only requires heat, which
is low grade energy compared to electrical energy which is required for the VCR
system. To operate the VAR system, the source temperature can be relatively low,
although a higher source temperature improves the system . The mechanical
compressor from a conventional vapor compression refrigeration system is replaced by
an absorber, a pump and a generator in the VAR system. The absorber and generator
have no moving parts like the mechanical compressor utilized in the VCR system. Also
32
the pump employed in the VAR system operates between lesser pressure differential
compared to the compressor employed in the VCR system. A simple apparatus such as
re-generator and a rectifier can be incorporated to improve the system performance. A
sub-cooler can be placed in between the evaporator and absorber to cool the gaseous
ammonia before entering the absorber there by improving the system performance.
Multi-stage vapor absorption refrigeration systems, which are relatively expensive, are
also available. They have a higher COP than single stage vapor absorption refrigeration
systems.
3.2.3 Factors Affecting COP of Ammonia Absorption
The COP of the ammonia absorption refrigeration system is affected by the
generator temperature ( ), evaporator temperature ( ) and condenser temperature
( ) [11]. These effects are presented below:
The VAR system COP increases with an increase in the generator temperature ( ).
The system COP increases as the evaporator temperature ( ) increases and the
system COP increases as the condenser temperature ( ) decreases. It is also to be
noted that the cooling capacity increases as the condenser temperature ( ) decreases
[11].
3.2.4 Advantages of Ammonia Absorption Refrigeration System
The ammonia absorption system offers certain advantages over the conventional
vapor compression refrigeration system:
It has no moving parts except the solution pump. So there is less wear and tear leading
to less frequent maintenance and less shutdown time. This implies that the
maintenance cost of the VAR system will be less compared to the VCR system. The
33
VAR system can be installed out doors or on roof tops as is done for the VCR system. It
has a wide operating range of +5oC to -55oC as the freezing point of ammonia is -77oC.
The VAR system typically has a long life of at least 25 years.
There are some advantages of using ammonia as a refrigerant [13]. Ammonia has
zero potential for global warming and ozone layer depletion unlike the CFCs. Ammonia
has a higher latent heat of vaporization and hence is slightly more efficient as a
refrigerant than CFCs. Therefore the system runs on lesser energy. Ammonia is
cheaper than CFCs. Also, there exists tremendous amount of practical experience in
the handling of ammonia as a refrigerant. Ammonia has an unpleasant odor and this
property of it makes it easy to detect any leaks in the system. There is an unlimited
availability of ammonia which makes it an economical refrigerant.
However, there are few disadvantages of using ammonia as a refrigerant [13]:
It is poisonous to humans if inhaled beyond a certain amount. If the concentration of
ammonia in the air reaches 25 parts per million (ppm), it can cause headaches, nausea,
and intense burning of the eyes, nose, throat, and skin. Ammonia is combustible, but it
is very difficult to combust ammonia in air in the absence of a catalyst. Ammonia has an
auto ignition temperature of 651oC. Ammonia is a corrosive substance and it is
incompatible with copper, which is the most common material used in the current
refrigeration systems.
34
CHAPTER 4 MATHEMATICAL MODELLING OF DDD PROCESS
The diffusion tower and the direct contact condenser are the main components of
the DDD system. Inside the diffusion tower, evaporation occurs when heated saline
water is sprayed from the top leading to the formation of a thin film of saline water on
the packing material and is contacted by a low humidity turbulent air stream flowing in
the opposite direction to that of saline water. The principles of heat transfer and mass
are utilized to quantify rate of evaporation of water and the subsequent increase in the
humidity of the air. It is desired that for high production of fresh water from the DDD
system, the humidity ratio of the air stream coming out of the diffusion tower should be
as high as possible. Ideally, the air exiting the diffusion tower should be in a saturated
state. The equations governing the evaporation and humidification processes in the
diffusion tower have been developed by Klausner et al. [7]. It is based on a two-fluid film
model in which one dimensional conservation equations for mass and energy are
applied to a differential control volume shown in Figure 4-1.
Air/VaporLiquid
dmv,evap
dq
L
mL
G
ma+mv
z+dz
dz
z
Figure 4-1. Differential control volume for liquid/gas heat and mass transfer within
diffusion tower.
In the condenser tower, cool fresh water contacts the high humidity ratio turbulent
air stream in the packing material and the heat given up to the water film leads to the
35
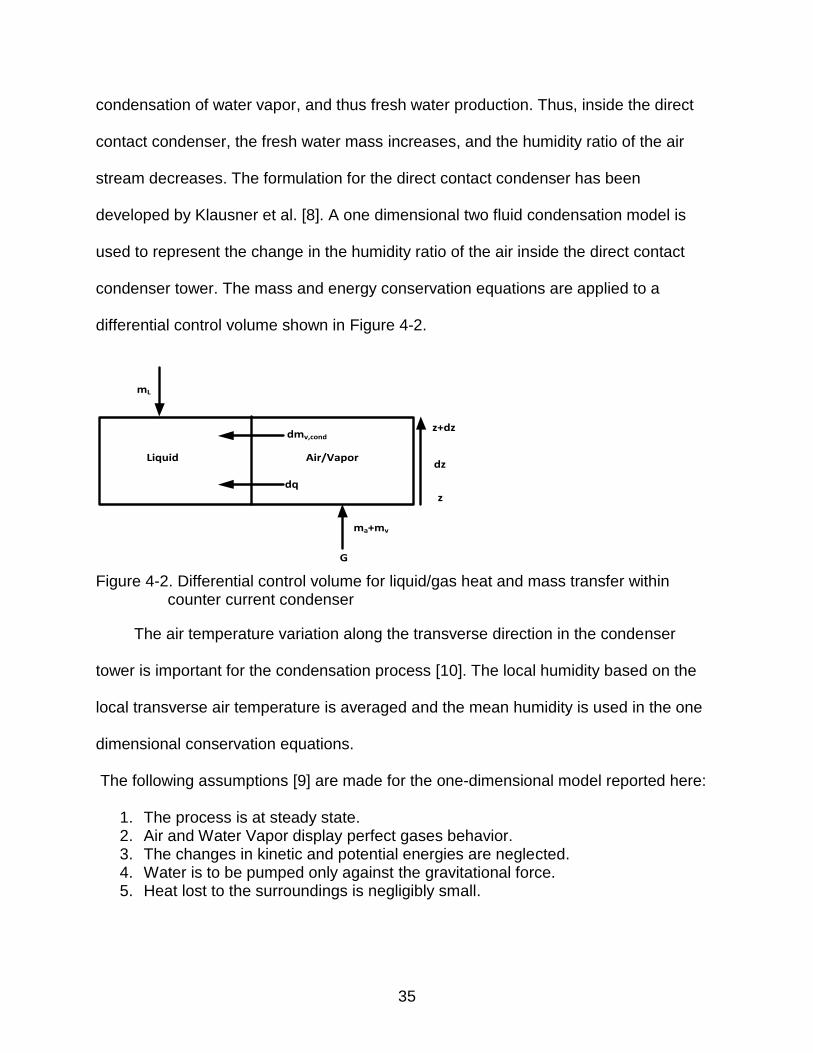
condensation of water vapor, and thus fresh water production. Thus, inside the direct
contact condenser, the fresh water mass increases, and the humidity ratio of the air
stream decreases. The formulation for the direct contact condenser has been
developed by Klausner et al. [8]. A one dimensional two fluid condensation model is
used to represent the change in the humidity ratio of the air inside the direct contact
condenser tower. The mass and energy conservation equations are applied to a
differential control volume shown in Figure 4-2.
Air/VaporLiquid
dmv,cond
dq
mL
G
ma+mv
z+dz
dz
z
Figure 4-2. Differential control volume for liquid/gas heat and mass transfer within
counter current condenser
The air temperature variation along the transverse direction in the condenser
tower is important for the condensation process [10]. The local humidity based on the
local transverse air temperature is averaged and the mean humidity is used in the one
dimensional conservation equations.
The following assumptions [9] are made for the one-dimensional model reported here:
1. The process is at steady state. 2. Air and Water Vapor display perfect gases behavior. 3. The changes in kinetic and potential energies are neglected. 4. Water is to be pumped only against the gravitational force. 5. Heat lost to the surroundings is negligibly small.
36
4.1 Flow in the Diffusion Tower
For the mathematical modeling of the flow inside the diffusion tower, the
conservation of mass principle is applied to the differential control volume shown in
Figure 4-1. The conservation equations are applied separately to both the liquid and
vapor phases in the differential control volume. Utilizing these conservation equations,
the convective law of mass transfer and the relationship between relative humidity ( )
and the humidity ratio ( ), the following first order ordinary differential equation for the
gradient of the humidity ratio in the diffusion tower is obtained:
(
) (4.1)
Here,
is the air mass flux, is the mass transfer coefficient, is the wetting
area of packing, is the Universal gas constant, is the vapor molecular weight, is
the system pressure and is the vapor saturation pressure at temperature . The
solution for Equation 4.1 yields the variation of humidity ratio along the height of the
diffusion tower. By assuming that the energy convected from the liquid is approximately
equal to that convected to the gas, the interfacial temperature ( is calculated using
the Equation 4.2 :
⁄
⁄
(4.2)
Here, and are the heat transfer coefficients on the gas and liquid respectively.
Applying conservation of energy to the liquid phase in the differential control
volume, a first order ordinary differential equation for the gradient of the liquid
temperature ( ) is obtained:
(4.3)
37
Here,
is the water mass flux, is the overall heat transfer coefficient is the
latent heat of vaporization, is enthalpy, is the specific area of packing material and
is the specific heat. This first order ordinary differential equation can be solved for ,
yielding the water temperature distribution along the height of the diffusion tower.
Similarly, applying conservation of energy to the air/vapor phase and neglecting
the heat loss from air [14], the following equation is obtained:
(4.4)
Equation 4.4 is also a first order ordinary differential equation which yields the air/vapor
mixture temperature, through the diffusion tower.
Together, the Equations 4.1, 4.3 and 4.4 constitute a set of coupled ordinary
differential equations that can be solved for the humidity ratio, water temperature and
air/vapor mixture temperature variations along the height of the diffusion tower. These
coupled sets of equations require closure relationships since a one dimensional
formulation is used here. This implies that the overall heat transfer coefficient and gas
side mass transfer coefficient are required. The heat transfer coefficients for the air and
vapor are evaluated using the heat and mass transfer analogy presented by Klausner et
al. [7]. Onda’s correlation [15] is used to calculate the mass transfer coefficients,
and , in the diffusion tower.
4.2 Flow in the Condenser Tower
The flow modeling in the counter-current direct contact condenser is described in
this section. The humidity ratio , which is dependent on the air temperature , is
calculated using the relationship between the relative humidity and the humidity
ratio utilizing Equation 4.5:
38
(4.5)
where, (kPa) is the total system pressure and (kPa) is the water saturation
pressure corresponding to the local air temperature, . (kPa) can be calculated
using the following empirical representation of the saturation line:
6.76138e-7 and (oC) is the temperature. For the DDD application, the temperature
range across any given cross-section is small and so the area averaged humidity ratio
can be approximated by in Equation 4.5 [6].
However, the relative humidity of air remains 100% during the condensation
process. This condition implies that the absolute humidity is only a function of air
temperature . Taking this into consideration and differentiating Equation 4.5 and
combining with Equation 4.6, the following first order ordinary differential equation
shown in Equation 4.7, which expresses the gradient of humidity along the height of the
direct contact condenser, is obtained,
(4.7)
Applying the conservation of energy to the liquid phase in the differential control
volume shown in Figure 4-2, the gradient of water temperature in the condenser tower
can be expressed as:
(4.8)
39
By applying energy conservation to the gas phase in the differential control volume
shown in Figure 4-2, the gradient of the air temperature in the condenser tower is
expressed as:
(4.9)
Similar to the evaporation model, a one dimensional approach is used for the
condensation model (Equations 4.7 and 4.8) and thus it requires closure relationships
(Equations. 4.4 and 4.6). Onda’s correlation and the heat and mass transfer analogy
presented in the Appendix A are used to calculate the mass transfer and heat transfer
coefficients. In this model the gas side mass transfer coefficient is taken as (see
Appendix A).
(4.10)
Onda suggests that the effective packing diameter affects the mass transfer coefficient
on the gas side and he recommended the use of 5.23 for the co-efficient in Equation
4.10 for the cases where the effective packing diameters are larger than 15mm and 2.0
for those less than 15mm. In the DDD system, the packing material used in the direct
contact condenser has an effective packing diameter of 17mm, which is close to the
limit reported by Onda. The use of 2.0 for the coefficient in Equation 4.10 is justified in
Knight et al. [14].
The fresh water production rate is calculated as follows:
(4.11)
Here, the subscripts , respectively refer to the fresh water, condenser inlet and
condenser outlet.
40
4.3 Numerical Procedure
The numerical procedure to compute the exit humidity ratio, exit water temperature
and exit air temperature from the diffusion tower and the condenser tower is presented
by Klausner et al. [9], and is detailed below:
1. Specify the inlet water temperature, air temperature and humidity.
2. Guess the exit water temperature.
3. Compute the temperature distributions and humidity distribution through the packed bed using Equations 4.1, 4.3 and 4.4.
4. Check whether the computed inlet water temperature agrees with the specified inlet water temperature and stop the computation if agreement is achieved, otherwise repeat from step 2.
For the counter-current direct contact condenser analysis, the numerical
procedure to calculate the exit water temperature, exit air temperature and exit humidity
ratio, is reported here:
1. Specify the inlet water temperature, air temperature and bulk humidity.
2. Guess the exit water temperature.
3. Compute the temperatures and bulk humidity at the next step change in height using Equations 4.7, 4.8 and 4.9.
4. Proceed to new height and restart the computation from step 3 until the computed air exit temperature matches the specified air exit temperature.
5. Check whether computed inlet water temperature agrees with the specified inlet water temperature and stop the computation if agreement is found, otherwise repeat the procedure from step 2.
41
CHAPTER 5 RESULTS AND DISCUSSION
The main aim of the discussion presented in this section is to investigate the
improvement in the performance of the DDD plant due to the introduction of AAR
system. The AAR system reduces the fresh water inlet temperature into the condenser
tower to 1oC from 25oC, and It is expected that there would be an increase in the
amount of condensation in the condenser tower. Thus, due to the increased
condensation, there will be an improvement in the amount of fresh water produced by
the DDD plant.
As mentioned earlier, the DDD plant can be run in three modes namely, the
heated air / ambient water mode, the heated air / heated water mode and the ambient
air / heated water mode. In the current analysis, the heated air / heated water mode is
chosen. The application of interest involves running the DDD plant with the waste heat
energy available from a solar driven combined cycle power plant, and both heated air
and heated water are readily available. Also, a preliminary study, which is not
mentioned in this report, indicates that the heated air / heated water case yields the
highest fresh water production among all the three cases for the same mass fluxes.
5.1 Diffusion Tower Analysis
The equations that were developed in the theoretical modeling of the diffusion
tower are solved using the numerical procedure that is described in the previous
chapter. A Runge-Kutta 4 numerical method was used to solve the equations developed
by Yi Li et al. [6]. A code is written by Yi Li in Fortran 77 for the same. The same code is
used to solve the heated air / heated water case. The coefficient used in Onda’s
correlation is fixed as 2.0 for this case as is justified by Knight et al. [14]. In the
42
numerical analysis results presented , the specific area of packing is taken as 267m2/m3
and the diameter of the packing material is taken as 0.018m. These are the
specifications corresponding to HD QPACK, a commercial packing material
manufactured by Lantec.
Certain temperatures, such as the saline water inlet temperature and air inlet
temperature into the diffusion tower, used in this numerical analysis are calculated from
the energy balance of a 271 MW power plant described in Appendix B.
In the heated air / heated water case, the temperature of air is taken as 93oC,
since it is the temperature of exhaust air available from the combined cycle power plant
which has been mentioned in [16]. It is assumed for the purpose of the numerical
analysis that saturated air at ambient i.e. at 25oC, is taken and heated to 93oC.
Therefore, the inlet humidity ratio of air at 93oC entering the diffusion tower remains
unchanged and is equal to the humidity ratio of saturated air at 25oC i.e. 0.0201. The
temperature of the saline water entering the diffusion tower of the DDD plant is
assumed to be 80oC for the reason that it is possible to heat the pre-heated saline
water, coming out of the steam turbine condenser at 35oC, to 80oC utilizing the energy
available in the exhaust air stream, which is at 93oC . The diffusion tower analysis is
performed in order to obtain the input data into the condenser tower like the
temperature and humidity ratio of air entering the condenser tower.
In the diffusion tower analysis, the numerical simulations were run for different air
to feed water mass flow ratios for a particular feed water mass flux. Results are
obtained in a similar way for different feed water mass fluxes. A sample of the numerical
values thus obtained are tabulated and presented in the Appendix C. The results are
43
plotted and are presented here. The results have been verified against the results
presented in Knight et al. [14] and it is observed that similarity exists in the trends
observed in both the results.
Figure 5-1. Diffusion tower exit air temperature variation with air to feed water mass flow ratio
Figure 5-2. Diffusion tower exit feed water temperature variation with air to feed water mass flow ratio.
45
50
55
60
65
70
75
0.4 0.6 0.8 1.0 1.2 1.4
Exit
Air
Te
mp
era
ture
(C)
Air to Feed Water Mass Flow Ratio
0.5
1
1.5
2
2.5
3
Diffusion Tower
mL (kg/m2-s)
44
45
46
47
48
49
50
51
0.4 0.6 0.8 1.0 1.2 1.4
Fee
d W
ate
r Ex
it T
em
pe
raru
re(C
)
Air to Feed Water Mass Flow Ratio
0.5
1
1.5
2
2.5
3
Diffusion Tower mL (kg/m2-s)
44
Figure 5-3. Diffusion tower exit humidity ratio variation with air to feed water mass flow ratio.
Figure 5-1 represents the variation of the exit air temperature from the diffusion
tower with air to feed water mass flow ratios, for different feed water mass fluxes. It is
seen that the exit air temperature from the diffusion tower is decreasing with increase in
the air mass flux, for a given feed water mass flux.
In Figure 5-2, the variation of feed water exit temperature with air to feed water
mass flow ratio, for various feed water mass fluxes is shown. It is seen that there is
initially a dip in the feed water exit temperature from the diffusion tower as the air to
feed water mass flow ratio increases. Further increase in the air to feed water mass flow
ratio causes a small increase in the feed water exit temperature. The plot shows that as
the water feed mass flux increases, the feed water exit temperature from the diffusion
tower decreases.
The exit feed water from the diffuser cannot be used as a coolant for either the
steam turbine condenser or the absorber in the ammonia-water vapor absorption
0.050
0.070
0.090
0.110
0.130
0.150
0.170
0.190
0.4 0.6 0.8 1.0 1.2 1.4
Dif
fusi
on
To
we
r Ex
it H
um
idit
y R
atio
Air to Feed Water Mass Flow Ratio
0.5
1
1.5
2
2.5
3
Diffusion Tower
mL (kg/m2-s)
45
refrigeration system utilized in the DDD plant. This is because it is clear from the graph
in Figure 5-2 that the feed water exit temperature from the diffusion tower is high,
making it unsuitable for use as a coolant in the present case. However, energy required
to heat the feed water for the diffusion tower can be reduced by re-circulating this exit
feed water.
Figure 5-3 shows the variation in the exit humidity ratio from diffusion tower as the
air to feed water mass flow ratio changes. A high exit humidity ratio is desired from the
diffusion tower as it indicates better mass transfer. However, it should be noted that a
high exit humidity ratio alone does not necessarily indicate a high fresh water
production. It can be observed from the graphs that a change in water feed mass flux
has no significant effect on the exit humidity ratio of air from the diffusion tower. It can
also be seen from the graphs that low air to feed water mass flow ratios yield higher exit
humidity ratios.
The arguments justifying the observed behavior of the different parameters
presented in the Figures 5-1, 5-2 and 5-3 have been mentioned in detail by Knight et al.
[14].
5.2 Condenser Tower Analysis
The results for the condenser tower are discussed next. Based on the results of
exit humidity ratio from the diffusion tower, the rate of water vapor evaporated into the
air stream, is computed as:
( ) (5.1)
where, is the mass flux of air, and are respectively the humidity ratio of air
at the inlet and at the outlet of the diffusion tower. From these results, exit humidity ratio
46
from the diffusion tower which yields the highest fresh water output is chosen and is
considered for the analysis of the condenser tower. The exit temperature, exit humidity
and mass flux of air from the diffusion tower of the highest exit fresh water output case
become the inlet temperature, inlet humidity ratio and inlet mass flux of air respectively,
in the condenser tower analysis. Interestingly, the highest fresh water output is obtained
for the lowest exit humidity case instead of the highest exit humidity case. This is due to
the fact that the lowest exit humidity from the diffusion tower is obtained for the highest
air to feed water mass flow ratio and hence, a large amount of air is available to
condense out the fresh water, there by yielding a high fresh water production. The
condenser analysis is similar to the diffusion tower analysis. In the diffusion tower
analysis presented previously, the air to feed water ratio is varied for different feed
water mass fluxes and the behavior of different parameters is observed. However, in the
condenser tower analysis, the fresh water feed to air mass flux ratio is varied for
different air mass fluxes, and the variation of different parameters such as the
condenser tower exit air and water temperatures and condenser tower exit humidity
ratio are computed. In addition, in the condenser tower analysis, the behavior of the
different parameters is compared for two inlet feed water temperatures, the
temperatures being 25oC and 1oC. As mentioned in the earlier section, the reason for
comparing the two temperatures is, it is expected that by reducing the inlet feed water
temperature in the condenser tower to 1oC, more condensation would be possible
leading to higher fresh water production. The choice of the fresh water feed inlet
temperature is made as 25oC because it is assumed that the fresh water at ambient is
available at this temperature. The other feed water inlet temperature is chosen as 1oC
47
as it is the lowest possible temperature below which water freezes and causes
operational problems for the DDD plant.
The same Runge-Kutta 4 numerical method used for the diffusion tower analysis is
utilized in the condenser analysis. Onda’s correlation coefficient is fixed as 2.0 for this
analysis. The other parameters that were involved in the numerical analysis are
mentioned here: The specific area of packing is taken as 267m2/m3 and the packing
diameter is taken as 0.017m.
Figures 5-4A and 5-4B show the variation of exit air temperature from the
condenser tower when fresh water inlet temperature is 25oC and 1oC respectively, for
different fresh water feed to air mass flow ratios. The variation in the exit air temperature
is also shown for various air mass fluxes. The change in the behavior of the exit air
temperature for the two inlet feed water temperatures is also presented in the graphs.
The exit air temperature from the condenser tower tends to remain nearly constant for
large fresh water feed to air mass flow ratio. It is observed that this constant
temperature value in both cases is approximately equal to the respective inlet feed
water temperatures i.e. 25oC and 1oC. However, in both cases, at low fresh water feed
to air mass flow ratios, the exit air temperature is elevated, indicating poor heat transfer
which can be attributed to the lack of a sufficient amount of fresh water for cooling. The
air mass flux is found to show a small influence on the exit air temperature from the
condenser tower for the 25oC inlet water case. However, for 1oC inlet water, the air
mass flux has a significant influence at low feed water to air mass flow ratios.
48
Figure 5-4. Condenser tower exit air temperature variation with fresh water feed to air mass flow ratio. Fresh water inlet temperature is: A) 25oC. B) 1oC.
It is desired that the exit air temperature from the direct contact condenser be as
low as possible because this air is intended to be used as a coolant for the condenser in
the AAR system. The lower the coolant temperature, the lower will be the temperature
20
25
30
35
40
45
0.0 2.0 4.0 6.0 8.0 10.0
Co
nd
en
ser
Tow
er
Exit
Air
Te
mp
era
ture
(C)
Fresh Water Feed to Air Mass Flow Ratio A
0.7
1.4
2.1
2.8
3.5
4.2
Condenser Tower Fresh Water Inlet
Temperature= 25oC
ma (kg/m2-s)
0
2
4
6
8
10
12
14
16
0.0 2.0 4.0 6.0 8.0 10.0
Co
nd
en
ser
Tow
er
Exit
Air
Te
mp
era
ture
(C)
Fresh Water Feed to Air Mass Flow Ratio B
0.7
1.4
2.1
2.8
3.5
4.2
Condenser Tower Fresh Water Inlet Temperature= 1oC
ma (kg/m2-s)
49
of the ammonia vapor cooled in the condenser and higher will be the efficiency of the
AAR system.
Figures 5-5A and 5-5B show the variation of the exit feed water temperature from
the direct contact condenser tower when fresh water inlet temperature is 25oC and 1oC
respectively. The graphs show that the exit feed water temperature from the direct
contact condenser decreases with an increase in the fresh water feed to air mass flow
ratio. It can be observed that in both cases, the exit feed water temperature decreases
rapidly up to a fresh water feed to air mass flow ratio of 4.0, and the decrease is gradual
with a further increase in the fresh water feed to air mass flow ratio. It can be observed
from the graphs that, in both cases, the exit feed water temperature from the direct
contact condenser tower is unaffected by the air mass flux in the condenser tower. In
general, the reason for the decrease in the feed water exit temperature with increase in
fresh water feed to air mass flow ratio is that, the amount of air available decreases and
the amount of heat carried and so there is lower amount of heat being transferred to the
feed water thereby decreasing its exit temperature. Specifically, when the feed water
temperature is 1oC, its exit temperature is desired to be as low as possible. This is
because, in the DDD plant, the exit feed water from the direct contact condenser is
cooled to 1oC by the AAR system and is re-circulated as inlet feed water to the
condenser tower. The lower this exit temperature is, the less cooling load will be
required from the AAR system.
Figures 5-6A and 5-6B show the variation of the exit humidity ratio from the direct
contact condenser tower when fresh water inlet temperature is 25oC and 1oC
50
respectively, for different fresh water feed to air mass flow ratios. This variation is
presented for the two fresh water feed inlet temperatures of 25oC and 1oC.
Figure 5-5. Condenser tower exit fresh water temperature variation with fresh water feed to air mass flow ratio. Fresh water inlet temperature is: A) 25oC. B) 1oC.
25
30
35
40
45
50
55
60
65
0.0 2.0 4.0 6.0 8.0 10.0
Co
nd
en
ser
Tow
er
Fre
sh W
ate
r Ex
it
Tem
pe
ratu
re(C
)
Fresh Water Feed to Air Mass Flow Ratio A
0.7
1.4
2.1
2.8
3.5
4.2
Condenser Tower Fresh Water Inlet
Temperature= 25oC
ma (kg/m2-s)
0
10
20
30
40
50
60
0.0 2.0 4.0 6.0 8.0 10.0
Co
nd
en
ser
Tow
er
Fre
sh W
ate
r Ex
it
Tem
pe
ratu
re(C
)
Fresh Water Feed to Air Mass Flow Ratio B
0.7
1.4
2.1
2.8
3.5
4.2
Condenser Tower Fresh Water Inlet Temperature= 1oC
ma (kg/m2-s)
51
Figure 5-6. Condenser tower exit humidity ratio variation with fresh water feed to air mass flow ratio. Fresh water inlet temperature is: A) 25oC. B) 1oC.
In general, it can be observed from the graphs that the exit humidity ratio from the
condenser tower remains largely unaffected by larger fresh water feed to air mass flow
0.000
0.005
0.010
0.015
0.020
0.025
0.030
0.035
0.040
0.045
0.0 2.0 4.0 6.0 8.0 10.0
Co
nd
en
ser
Tow
er
Exit
Hu
mid
ity
Rat
io
Fresh Water Feed to Air Mass Flow Ratio A
0.7
1.4
2.1
2.8
3.5
4.2
Condenser Tower Fresh Water Inlet
Temperature= 25oC
ma (kg/m2-s)
0.000
0.001
0.002
0.003
0.004
0.005
0.006
0.007
0.008
0.009
0.010
0.0 2.0 4.0 6.0 8.0 10.0
Co
nd
en
ser
Tow
er
Exit
Hu
mid
ity
Rat
io
Fresh Water Feed to Air Mass Flow Ratio B
0.7
1.4
2.1
2.8
3.5
4.2
Condenser Tower Fresh Water Inlet Temperature= 1oC
ma (kg/m2-s)
52
ratios. It is desired that the difference between the inlet and exit humidity ratios of air
from the direct contact condenser tower is as high as possible. This is because, this
difference in the humidity ratio directly relates to the amount of fresh water that can be
condensed. It can be observed from the graphs that when the fresh water feed inlet
temperature is 1oC, the exit humidity ratios are significantly lower, nearly 10 times less,
than their corresponding values when the fresh water feed inlet temperature is 25oC.
This implies that the difference between inlet and exit humidity ratios is significantly
higher when the fresh water feed inlet temperature is 1oC than when the fresh water
feed inlet temperature is 25oC. Therefore, it can be concluded from the graphs that by
reducing the fresh water feed inlet temperature to 1oC from 25oC, there can be a
significant increase in the production of fresh water from the DDD plant.
Figures 5-7A and 5-7B show the fresh water mass flux produced in the condenser
tower when the fresh water feed inlet temperature is 25oC and 1oC respectively, for
various fresh water feed to air mass flow ratios and also for different air mass fluxes in
the condenser tower. The rate of fresh water mass flux produced in the condenser
tower, is computed as,
(5.2)
where, is the mass flux of air, and are respectively the humidity ratio of air at
the inlet and at the outlet of the condenser tower. As observed from the graphs, in both
cases, there is no significant increase seen in the mass of fresh water produced with an
increase in the fresh water feed to air mass flow ratio beyond 2.0. It is economical to
operate the DDD system with the least amount of electric power. The electric power is
53
required in the DDD system to run the pumps and blowers which circulate air and water
throughout the system.
Figure 5-7. Fresh water production variation with fresh water feed to air mass flow ratio. Fresh water inlet temperature is: A) 25oC. B) 1oC.
0.00
0.05
0.10
0.15
0.20
0.25
0.30
0.0 2.0 4.0 6.0 8.0 10.0
Mas
s fl
ux
of
Fre
sh W
ate
rr P
rod
uce
d in
th
e
Co
nd
en
ser
Tow
er(
kg/m
2 -s)
Fresh Water Feed to Air Mass Flow Ratio A
0.7
1.4
2.1
2.8
3.5
4.2
Condenser Tower Fresh Water Inlet Temperature =250C
ma (kg/m2-s)
0.00
0.05
0.10
0.15
0.20
0.25
0.30
0.35
0.0 2.0 4.0 6.0 8.0 10.0
Mas
s fl
ux
of
Fre
sh W
ate
r P
rod
uce
d in
th
e
Co
nd
en
ser
Tow
er(
kg/m
2- s
)
Fresh Water Feed to Air Mass Flow Ratio B
0.7
1.4
2.1
2.8
3.5
4.2
Condenser Tower Fresh Water Inlet
Temperature =10C ma (kg/m2-s)
54
The electric power consumed by the pumps varies directly with the mass of fluid it can
pump. Yi Li’s work suggests that the DDD plant consumes least electricity for the
amount of fresh water produced at a fresh water feed to air mass flow ratio of 2.0.
Therefore, in keeping with the above argument, from the Figures 5-5 and 5-6, it can be
concluded that it is economical to operate the condenser tower of DDD plant at a fresh
water feed to air mass flow ratio of 2.0, since it yields the maximum fresh water
production with least electricity consumption.
The percent increase in water production by incorporating the AAR system is
shown in Figure 5-8. It is observed from Figure 5-8 that for higher air mass fluxes, there
is an increase in the mass flux of fresh water produced from the condenser tower due to
the reduction in the fresh water feed inlet temperature from 25oC to 1oC, for all
corresponding operating conditions. It is also clear from Figure 5-8 that for fresh water
feed to air mass flow ratios below 2.0, the improvement in the performance of the DDD
plant due to the addition of AAR system is significantly higher than that for fresh water
feed to air mass flow ratios above 2.0. Also, the increase in the performance of the DDD
plant remains nearly constant beyond a fresh water feed to air mass flow ratio of 2.0.
From the analysis presented in this section, it can be concluded that there is an
improvement in the performance of the DDD plant due to the reduction of the fresh
water feed inlet temperature into the condenser tower. Hence, the addition of a
refrigeration plant, which in this case is the AAR plant, to the DDD plant to reduce the
fresh water feed inlet temperature gives better performance. Whether or not the
increased performance can be justified based on cost requires an economic
assessment.
55
Figure 5-8. Percentage increase in fresh water production variation with fresh water feed to air mass flow ratio.
0
10
20
30
40
50
60
70
80
0.0 2.0 4.0 6.0 8.0 10.0
% In
cre
ase
in F
resh
Wat
er
Pro
du
ctio
n
Fresh Water Feed to Air Mass Flow Ratio
0.7
1.4
2.1
2.8
3.5
4.2
Condenser Tower ma (kg/m2-s)
56
CHAPTER 6 INDUSTRIAL APPLICATION OF DDD PLANT WITH AAR SYSTEM
In this section, a preferred operating condition for the DDD plant with an AAR
system is investigated where it is powered by the waste heat from a 271MW solar
combined cycle power plant. The operating conditions for the 271 MW solar power plant
are discussed in detail in Appendix B. The approach that is followed in arriving at a
preferred operating condition is described. is the mass flow rate (kg/s) of exhaust
air from the combined cycle power plant that is diverted to the AAR system to supply
heat energy to it, and is the total mass flow rate (kg/s) of exhaust air from the
combined cycle power plant. Therefore,
defines the fraction of exhaust air
(exhaust or waste energy) that is utilized to power the AAR plant. denotes the
fraction of exhaust air that powers the DDD plant. The ambient saline water temperature
and the ambient air temperature are taken as 25oC. The ambient sink temperature is
also taken as 25oC. The aim of this analysis is to arrive at a preferred value of which
yields the highest fresh water production with the available energy.
The most efficient operating conditions for the condenser tower were identified by
Yi Li et al. [6] as:
1. The areas of the diffusion and condenser towers are assumed to be equal.
2. Mass flux of air in the diffusion and condenser towers, = 1.5 kg/m2-s
3. Mass flow ratio of fresh water feed to air in the condenser tower,
= 2 where,
is the mass flux (kg/m2-s) of fresh water in the condenser tower.
Consider the AAR system,
= kW (6.1)
57
is the amount of waste heat available for the AAR system, where is the specific
heat of air at constant pressure (kJ/kg K), is the exhaust temperature of air from the
combined cycle plant which is 93oC, and is the temperature to which this exhaust air
can be cooled to. The value of depends on the temperature of the ammonia-water
mixture entering the generator of the AAR system and is taken to be approximately 5oC
greater than the temperature of the ammonia-water mixture entering the generator of
the AAR system.
Let the coefficient of performance of the AAR plant as defined in earlier sections
be denoted by . By definition of , the cooling load, , that can be achieved by
the AAR system with the available input energy, , is calculated as,
kW (6.2)
Let denote the mass flow rate (kg/s) of fresh water that can be cooled by an AAR
system with a cooling capacity of . Therefore,
( ) (6.3)
where, is the specific heat (kJ/kg K) of water, is the cooling fresh water
temperature entering the evaporator of the AAR system. Its value depends on the
cooling fresh water temperature exiting the condenser tower which is influenced by the
specified operating mass fluxes and temperatures of the DDD plant. The value of
is taken as 30oC in the cases where the cooling fresh water exit temperature from the
condenser tower is greater than 30oC. This is because, it is expected that with the
available sink temperature of 25oC, the cooling fresh water exiting the condenser tower
can be cooled to 30oC, thereby reducing the load on the AAR system. In the other
cases, is taken to be equal to the temperature of the cooling fresh water exiting
58
the condenser tower. In the cases of being less than 30oC, first an appropriate
value of is guessed and simulation is performed. The obtained value of is
compared against the guess value and if they both are different, another value of
is guessed and the procedure is iterated until the obtained value and guess value of
are equal. is the inlet temperature of fresh water feed in the condenser
tower. In the present application can be either 1oC or 25oC, depending on whether
AAR plant is utilized or not. is calculated from Equation 6.3, since all the other
parameters involved are specified. Also, the fresh water mass flux,
, is known,
where is the area (m2) of the diffusion tower and the condenser tower. Therefore, the
area of the towers is determined from knowing and .
Since, the air mass flux,
, is known, the mass flow rate (kg/s) of air flowing
through the DDD system, , is determined. From these variables, the saline water
mass flow rate (kg/s), , is determined as follows.
[ ] kW (6.4)
Here, is the amount of waste heat diverted to the DDD plant to supply heated feed
water. is the temperature to which the exhaust air can be cooled to and it depends on
, which is the steam turbine condenser cooling water outlet temperature. is taken to
be approximately 5oC greater than . The mass of saline feed water, that can be
heated to 80oC utilizing is calculated using,
( ) (6.5)
where, is the specific heat (kJ/kg K) of saline water, is the saline water inlet
temperature into the diffusion tower, which is equal to 80oC in the present case. Since
59
the area of the diffusion tower and are known, the mass flux of the saline feed
water into the diffusion tower,
, is calculated. Simulations for values of
ranging from 0 to 1.0 are carried out based on the values of , , and obtained
from the above calculations.
Based on the area of the towers, which depends on the parameter , the mass
flow rate of fresh water that is produced in the condenser tower, is evaluated for
each value of as,
kg/s (6.6)
For some larger values of , the value of becomes negative, indicating that
there is no waste heat available for heating saline water feed. In such a case, the saline
feed water temperature is taken to be equal to . Also, since cannot be obtained
by the approach mentioned previously, a value of the ratio
is chosen. In this
application, the ratio
is taken as 1.0 for =0.9, 1.0.
For =1, the entire waste heat is utilized for supplying cooling fresh water at 1oC to
the condenser tower by the AAR system. In this case, the temperature of air entering
the diffusion tower is equal to and the saline feed water temperature is equal to .
For =0, the entire waste heat is utilized for supplying heated air and heated water
to the DDD plant. Therefore, the cooling fresh water temperature entering the
condenser tower is taken to be equal to the sink temperature which is 25oC. The value
of
is chosen as 1.0 in the simulation.
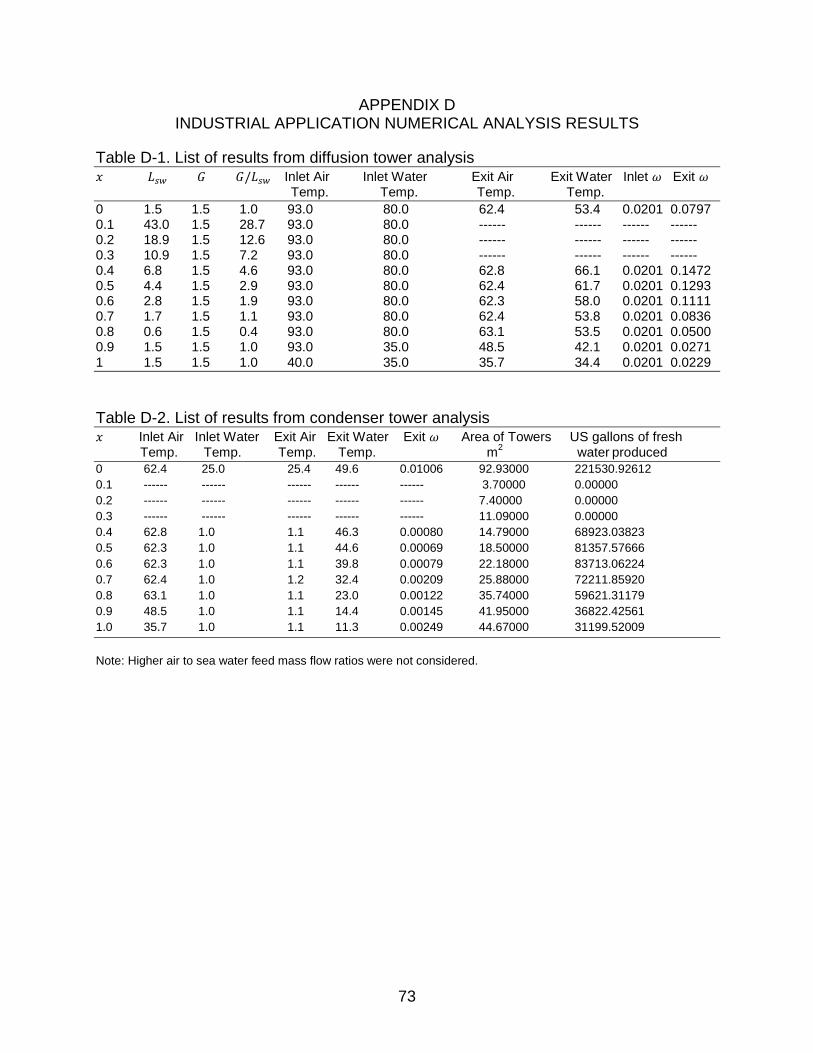
A sample calculation has been performed by taking the as 0.4, as
634 kg/s, and as 40oC and as 35oC. The remaining inlet conditions and the
60
results of the simulations for various values of are tabulated and presented in
Appendix D. The is taken as 0.4 as a result of an approximate theoretical analysis
performed on a single effect AAR system operating under the available conditions. The
results of the analysis are presented graphically below:
Figure 6-1 shows the volume of fresh water produced in one day by the DDD plant, in
US gallons, as varies from 0 to 1.0.
Figure 6-1. Variation of fresh water produced with .
It is observed in Figure 6-1 that there is a maximum production of fresh water
when is 0.There is also a local maximum occurring when is approximately 0.6. It is
observed that the fresh water produced when is 0.6 is significantly lower
(approximately 2.65 times) than that when is 0. The condition = 0 virtually
represents the absence of the AAR system. It can therefore be concluded from the
graph in Figure 6-1 that the addition of AAR system, though improves the amount of
condensation in the condenser tower and thereby the amount of fresh water produced
25000
75000
125000
175000
225000
0 0.2 0.4 0.6 0.8 1
Fre
sh W
ate
r P
rod
uce
d in
1 d
ay
(US
Gal
lon
s)
𝑥= (𝑚𝐴𝐴𝑅/𝑚𝑎 )
61
from the DDD plant, it does not increase fresh water production when both the DDD
plant and the AAR system are running on shared energy from the same source.
In other words, more fresh water can be produced from the DDD plant if the entire
available waste heat from the source is utilized by the DDD plant alone without the AAR
system. The reason for this is the low of the AAR system under the available
conditions. It has been determined that under the same operating conditions, if an AAR
system with a of approximately 4.0 can be designed, only then the fresh water
production from the DDD plant with an AAR system at least equals to that from the DDD
plant without an AAR system. It is estimated that it would be extremely difficult to
achieve a of approximately 4.0, even with a multiple effect AAR system, under the
available conditions. It is understood from the above discussion that an AAR system
with a greater than 4.0 is required in order to obtain higher fresh water production
rates from the DDD plant than that from a DDD plant without the AAR system. It is also
observed from the numerical calculations of the above analysis, which are not included
in this report, that as the increases, the second highest fresh water production
point shifts very slowly towards left.
The variation of the area of the diffusion tower and the condenser tower is shown
in Figure 6-2. It is observed from the graph that the area of the diffusion and condenser
towers is highest for = 1.0. As the increases, it is observed from the theoretical
analysis that only the area corresponding to = 0, remains the same but the area
corresponding to all other values of increases, with the area corresponding to = 1.0
being the highest.
62
Figure 6-2. Variation of required area for diffusion and condenser towers with .
0
10
20
30
40
50
60
70
80
90
100
0 0.2 0.4 0.6 0.8 1
Are
a o
f th
e D
iffu
sio
n a
nd
Co
nd
en
ser
Tow
ers
(m
2)
𝑥= (𝑚𝐴𝐴𝑅/𝑚𝑎 )
63
CHAPTER 7 CONCLUSIONS
In this work, the improvement in the performance of the DDD plant due to the
reduction of condenser inlet fresh water temperature from 25oC to 1oC has been
presented. A literature study is conducted to understand the DDD process and the
ammonia absorption refrigeration system in detail, which is included in this report.
Simulations are run utilizing Yi Li’s code, written in FORTRAN 77 for the heated air /
heated water case, for the condenser fresh water inlet temperatures of 25oC and 1oC,
for the same diffusion tower outlet conditions. The results of the simulations have been
analyzed, and it is found that there is an increase in the fresh water production from the
DDD plant due to reduction in the condenser fresh water inlet temperature. An ammonia
absorption refrigeration system is chosen for cooling the condenser inlet fresh water
from 25oC to 1oC, as it can run on waste heat. Waste heat from a solar combined cycle
power plant is distributed between the DDD plant and an ammonia absorption
refrigeration system and a theoretical analysis is carried out. The analysis yielded that
the highest fresh water production occurs when all heat is diverted to the DDD system..
The important outcomes of this work are listed below:
1. For the heated air / heated water case, reducing the condenser fresh water inlet temperature from 25oC to 1oC results in an increase in the fresh water production.
2. Utilizing the entire available waste heat for the DDD plant yields a higher fresh water production instead of distributing the energy between the DDD plant and a
low ammonia absorption refrigeration system.
3. In order to obtain higher fresh water production by reducing the condenser fresh
water inlet temperature, the of the refrigeration system must be greater than 4.0 in the present application.
64
It is recommended that no further studies for a joint DDD/AAR system are warranted.
Economic feasibility does not appear to be achievable.
65
APPENDIX A ONDA’S CORRELATION
* { [ (
) ⁄
⁄
⁄ ]}
⁄
[
] ⁄
⁄ , .
*This equation has been modified from original Onda’s correlation.
66
APPENDIX B CO-GENERATION PLANT DETAILS
1
2 3
4 5
6
7
89
Solar Heating
Gas Turbine
Steam Turbine
184 MW
87 MW
ThTc
Steam Generator
Air / Vapor Steam Cooling WaterCondensate of Steam
Table D-2. List of results from condenser tower analysis Inlet Air Inlet Water Exit Air Exit Water Exit Area of Towers US gallons of fresh Temp. Temp. Temp. Temp. m
Note: Higher air to sea water feed mass flow ratios were not considered.
74
LIST OF REFERENCES
1. Water: The Power, Promise, and Turmoil of North America’s Fresh Water, National Geographic Special Edition, National Geographic Society, Washington D.C., November 1993.
2. A.A. Alawadhi, Regional Report on Desalination-GCC Countries, in: Proceedings of the IDA World Congress on Desalination and Water Reuse, Manama, Bahrain, (2002) 8–13.
3. Introduction to Desalination Technologies in Australia. Retrieved on May 20, 2011 from http://www.affa.gov.au/content/publication.cfm
4. K. Bourouni, M.T. Chaibi and L. Tadrist, Water desalination by humidification and dehumidification of air: State of the art, Desalination, 137 (2001) 167-176.
5. J.F. Klausner, Y. Li, M. Darwish and R. Mei, Innovative diffusion driven desalination process, J. of Energy Resources Technology, 126 (2004) 219-225.
6. Y. Li, Heat and Mass Transfer for the diffusion driven desalination process, PhD dissertation. Department of Mechanical & Aerospace Engineering, University of Florida, Gainesville, Florida, 32611, USA, 2006.
7. J.F. Klausner, Y. Li and R. Mei, Evaporative heat and mass transfer for the diffusion driven desalination process, J. of Heat and Mass Transfer, 42(6) (2006) 528-536.
8. Y. Li, J.F. Klausner, R. Mei and J. Knight, Direct condensation in packed beds, International J. of Heat and Mass Transfer, 49 (2006) 4751-4761.
9. Y. Li, J.F. Klausner and R. Mei, Performance characteristics of the diffusion driven desalination process”, Desalination, 196 (2006) 188-209.
10. D. Bharathan, B.K. Parsons and J.A. Althof, Direct-Contact Condensers for Open-Cycle OTEC Applications. National Renewable Energy Laboratory Report SERI/TP-252-3108 for DOE Contract No. DEAC02-83CH10093, 1988.
11. I. Horuz, A comparison between ammonia-water and water-lithium bromide solutions in vapor absorption refrigeration systems, Int. Comm. Heat Mass Transfer, Vol. 25, No.5 (1998) 711-721.
12. Pongsid Srikhirin, Satha Aphornratana and Supachart Chungpaibulpatana, A review of absorption refrigeration technologies, Renewable and Sustainable Energy Reviews, 5 (2001) 343–372.
13. G. Lorentzen, The use of natural refrigerants: a complete solution to the CFC/HCFC predicament, Int. J. Refri, 9. Vol.18, No.3 (1995) 190-197.
14. J. Knight, Heat and mass transfer within the diffusion driven desalination process with heated air, Master’s Thesis. Department of Mechanical & Aerospace Engineering, University of Florida, Gainesville, Florida, 32611, USA, 2006.
15. K. Onda, H. Takechi and Y. Okumoto, Mass transfer coefficients between gas and liquid phases in packed columns, J. Chem. Eng. Jpn., 1 (1968) 56-62.
76
BIOGRAPHICAL SKETCH
Uday Kiran Mahakali was born in Nellore, India. Uday completed his Bachelor of
Technology in mechanical engineering from Jawaharlal Nehru Technological
University, Hyderabad, Andhra Pradesh, India, in May 2009 after which he joined
University of Florida to pursue his Master of Science degree in mechanical engineering.
Uday started working towards his master’s at the University of Florida from the fall
of 2009. Later, he got the opportunity to be a part of the diffusion driven desalination
process research team under the guidance of Dr. James F Klausner. Upon completion
of his master’s in August 2011, Uday plans to continue contributing to the mechanical
engineering industry and build on his knowledge and experience.