Absorption cross-section measurements of methane, ethane, ethylene and methanol at high temperatures Majed Alrefae, Et-touhami Es-sebbar, Aamir Farooq ⇑ Clean Combustion Research Center, Division of Physical Sciences and Engineering, King Abdullah University of Science and Technology (KAUST), Thuwal 23955-6900, Saudi Arabia article info Article history: Received 30 April 2014 In revised form 3 June 2014 Available online 6 July 2014 Keywords: Methane Ethane Ethylene Methanol Absorption cross-section FTIR HeNe laser abstract Mid-IR absorption cross-sections are measured for methane, ethane, ethylene and methanol over 2800– 3400 cm 1 (2.9–3.6 lm) spectral region. Measurements are carried out using a Fourier-Transform- Infrared (FTIR) spectrometer with temperatures ranging 296–1100 K and pressures near atmospheric. As temperature increases, the peak cross-sections decrease but the wings of the bands increase as higher rotational lines appear. Integrated band intensity is also calculated over the measured spectral region and is found to be a very weak function of temperature. The absorption cross-sections of the relatively small fuels studied here show dependence on the bath gas. This effect is investigated by studying the variation of absorption cross-sections at 3.392 lm using a HeNe laser in mixtures of fuel and nitrogen, argon, or helium. Mixtures of fuel with He have the highest value of absorption cross-sections followed by Ar and N 2 . Molecules with narrow absorption lines, such as methane and methanol, show strong depen- dence on bath gas than molecules with relatively broader absorption features i.e. ethane and ethylene. Ó 2014 Elsevier Inc. All rights reserved. 1. Introduction Laser-based diagnostic techniques are used in a variety of fields to measure the abundance of species of interest. Spectral absorp- tion features span different wavelength regions from ultraviolet (UV) to visible to infrared (IR) and more. The absorption strength of molecules at various wavelengths is governed by molecular structure and oscillator strengths. Chemical species containing a CAH bond have a fundamental vibrational mode, known as the CAH stretch, in the IR region near 3.3 lm. Absorption of radiation by this vibrational mode can be readily accessed by helium–neon (HeNe) lasers or difference-frequency-generation (DFG) based tunable laser systems [1,2]. These two laser systems can be used to develop fast time-response in-situ diagnostics to detect various hydrocarbons. For example, MacDonald et al. [3] used HeNe laser absorption at 3.392 lm to measure fuel concentration during the pyrolysis of n-dodecane, methylcyclohexane, and iso-cetane in a heated high-pressure shock tube. The species studied in this work (methane, ethane, ethylene and methanol) represent three different chemical groups: alkanes, alkenes and alcohol. These basic species are very important in combustion, atmospheric appli- cations and remote sensing. Quantitative measurements of species concentration using absorption spectroscopy require knowledge of absolute absorption cross-sections. The cross-sections of various hydrocarbons near 3.3 lm have previously been measured using FTIR spectrometer and HeNe laser. Klingbeil et al. [4] used an FTIR spectrometer to measure the spectra of twelve hydrocarbons over 2500–3400 cm 1 region for temperatures ranging from 298 to 773 K. Es-sebbar et al. [5,6] measured vacuum-UV and IR spectra of 1-butene and IR spectra of propylene in the temperature range of 296–529 K. Etzkorn et al. [7] measured UV and IR absorption cross-sections of 24 aromatic hydrocarbons at 298 K for atmospheric applications. The infrared absorption cross-sections of ethane and methanol were reported by Harrison et al. [8,9] at 296 K. Also, Harrison and Bernath [10] measured the infrared absorption cross-section of propane at 296 K. Furthermore, several databases have been compiled for hydrocarbon spectra, such as HITRAN [11], NIST [12] and PNNL [13]. The HITRAN database has primarily been validated at low temperatures and its high- temperature version HITEMP only contains H 2 O, CO 2 , CO, NO, and OH spectra. The NIST and PNNL databases provide absorption cross-sections of many species at low temperatures (up to 50 °C). For several important hydrocarbons, such as methane and ethyl- ene, absorption cross-section data are not available at tempera- tures larger than 500 °C. High-temperature cross-section data are critical for developing laser-based sensors for combustion applications. http://dx.doi.org/10.1016/j.jms.2014.06.007 0022-2852/Ó 2014 Elsevier Inc. All rights reserved. ⇑ Corresponding author. E-mail address: [email protected](A. Farooq). Journal of Molecular Spectroscopy 303 (2014) 8–14 Contents lists available at ScienceDirect Journal of Molecular Spectroscopy journal homepage: www.elsevier.com/locate/jms
Transcript
Journal of Molecular Spectroscopy 303 (2014) 8–14
Contents lists available at ScienceDirect
Journal of Molecular Spectroscopy
journal homepage: www.elsevier .com/locate / jms
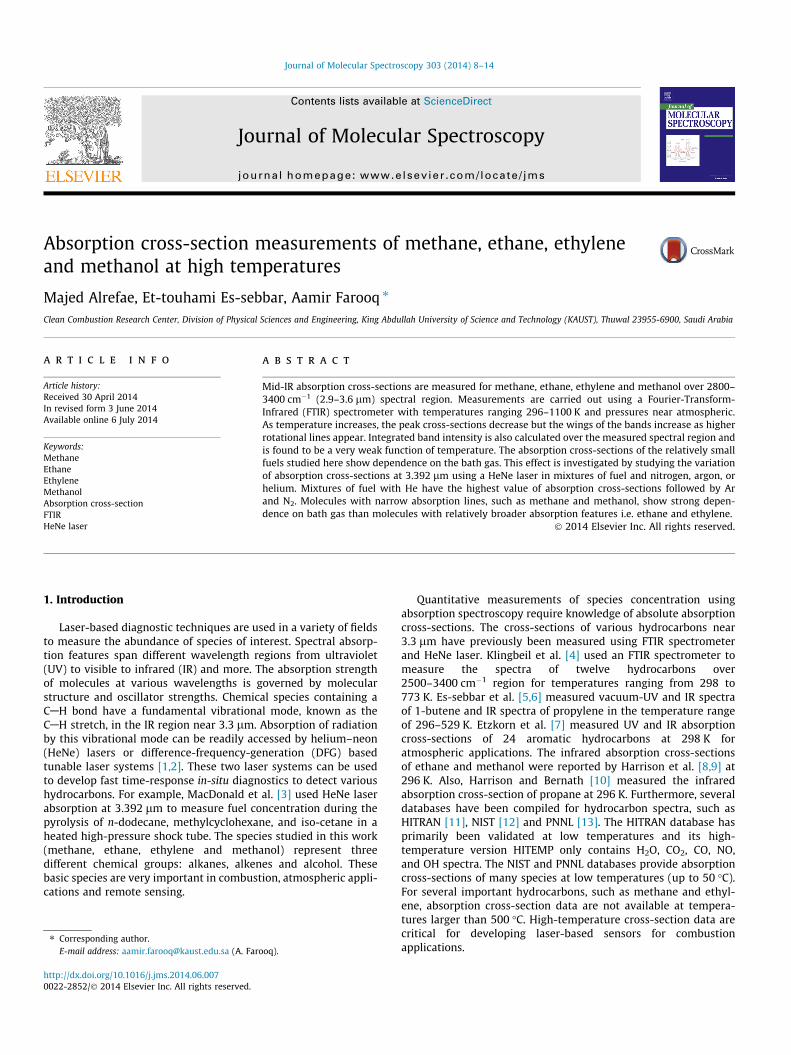
Absorption cross-section measurements of methane, ethane, ethyleneand methanol at high temperatures
http://dx.doi.org/10.1016/j.jms.2014.06.0070022-2852/� 2014 Elsevier Inc. All rights reserved.
Majed Alrefae, Et-touhami Es-sebbar, Aamir Farooq ⇑Clean Combustion Research Center, Division of Physical Sciences and Engineering, King Abdullah University of Science and Technology (KAUST), Thuwal 23955-6900, Saudi Arabia
a r t i c l e i n f o
Article history:Received 30 April 2014In revised form 3 June 2014Available online 6 July 2014
Mid-IR absorption cross-sections are measured for methane, ethane, ethylene and methanol over 2800–3400 cm�1 (2.9–3.6 lm) spectral region. Measurements are carried out using a Fourier-Transform-Infrared (FTIR) spectrometer with temperatures ranging 296–1100 K and pressures near atmospheric.As temperature increases, the peak cross-sections decrease but the wings of the bands increase as higherrotational lines appear. Integrated band intensity is also calculated over the measured spectral region andis found to be a very weak function of temperature. The absorption cross-sections of the relatively smallfuels studied here show dependence on the bath gas. This effect is investigated by studying the variationof absorption cross-sections at 3.392 lm using a HeNe laser in mixtures of fuel and nitrogen, argon, orhelium. Mixtures of fuel with He have the highest value of absorption cross-sections followed by Arand N2. Molecules with narrow absorption lines, such as methane and methanol, show strong depen-dence on bath gas than molecules with relatively broader absorption features i.e. ethane and ethylene.
� 2014 Elsevier Inc. All rights reserved.
1. Introduction
Laser-based diagnostic techniques are used in a variety of fieldsto measure the abundance of species of interest. Spectral absorp-tion features span different wavelength regions from ultraviolet(UV) to visible to infrared (IR) and more. The absorption strengthof molecules at various wavelengths is governed by molecularstructure and oscillator strengths. Chemical species containing aCAH bond have a fundamental vibrational mode, known as theCAH stretch, in the IR region near 3.3 lm. Absorption of radiationby this vibrational mode can be readily accessed by helium–neon(HeNe) lasers or difference-frequency-generation (DFG) basedtunable laser systems [1,2]. These two laser systems can be usedto develop fast time-response in-situ diagnostics to detect varioushydrocarbons. For example, MacDonald et al. [3] used HeNe laserabsorption at 3.392 lm to measure fuel concentration during thepyrolysis of n-dodecane, methylcyclohexane, and iso-cetane in aheated high-pressure shock tube. The species studied in this work(methane, ethane, ethylene and methanol) represent threedifferent chemical groups: alkanes, alkenes and alcohol. Thesebasic species are very important in combustion, atmospheric appli-cations and remote sensing.
Quantitative measurements of species concentration usingabsorption spectroscopy require knowledge of absolute absorptioncross-sections. The cross-sections of various hydrocarbons near3.3 lm have previously been measured using FTIR spectrometerand HeNe laser. Klingbeil et al. [4] used an FTIR spectrometer tomeasure the spectra of twelve hydrocarbons over2500–3400 cm�1 region for temperatures ranging from 298 to773 K. Es-sebbar et al. [5,6] measured vacuum-UV and IR spectraof 1-butene and IR spectra of propylene in the temperature rangeof 296–529 K. Etzkorn et al. [7] measured UV and IR absorptioncross-sections of 24 aromatic hydrocarbons at 298 K foratmospheric applications. The infrared absorption cross-sectionsof ethane and methanol were reported by Harrison et al. [8,9] at296 K. Also, Harrison and Bernath [10] measured the infraredabsorption cross-section of propane at 296 K. Furthermore, severaldatabases have been compiled for hydrocarbon spectra, such asHITRAN [11], NIST [12] and PNNL [13]. The HITRAN database hasprimarily been validated at low temperatures and its high-temperature version HITEMP only contains H2O, CO2, CO, NO,and OH spectra. The NIST and PNNL databases provide absorptioncross-sections of many species at low temperatures (up to 50 �C).For several important hydrocarbons, such as methane and ethyl-ene, absorption cross-section data are not available at tempera-tures larger than 500 �C. High-temperature cross-section data arecritical for developing laser-based sensors for combustionapplications.
M. Alrefae et al. / Journal of Molecular Spectroscopy 303 (2014) 8–14 9
Although FTIR spectrometer can measure cross-section dataover a range of wavelengths, HeNe laser has the advantages ofnarrow line-width, low cost and ease of operation. Olson et al.[14] reported the absorption coefficient of 7 hydrocarbon fuels inthe temperature range of 300–2000 K using a shock tube. Mallardand Gardiner [15] studied the absorption cross-section of methanefrom 300 to 2400 K using a shock tube. Tsuboi et al. [16] used ashock tube facility to measure the molar extinction coefficientsof different hydrocarbons over 292–1100 K. Perrin and Hartmann[17] measured the absorption of methane in the temperature rangeof 290–800 K and then reported the calculated absorptivity up to3000 K. Drallmeier measured room-temperature (296 K) absorp-tion coefficient of different hydrocarbon species; paraffins, olefinsand aromatics [18]. The dependence of absorption cross-sectionson temperature (298–673 K) and pressure (500–2000 Torr) at3.39 lm for different gaseous hydrocarbons was investigated byKlingbeil et al. [19]. Mével et al. [20] reported the gas phaseabsorption cross-sections of 21 liquid hydrocarbons in the temper-ature range of 303–413 K and suggested a correlation to calculatethe absorption cross-section based on the chemical structure ofspecies. The dependence of the cross-sections on bath gas hasnot been studied well before. Therefore, the cross-sections depen-dence on the argon, helium and nitrogen are studied in this work.
In this work, we report the spectra of methane, ethane, ethyleneand methanol at high temperatures (296–1120 K) over2800–3400 cm�1 (2.9–3.6 lm) region. This wavelength region isimportant due to relatively high absorption strengths and isaccessible by HeNe laser (3.392 lm) or tunable difference-frequency-generation (DFG) laser systems. Therefore, thesemeasured high-temperature spectra are needed to design interfer-ence-free quantitative absorption diagnostics for combustionapplications. Effect of instrument broadening is considered bycomparing measurements performed by FTIR spectrometer withHeNe laser. Additionally, the effect of bath gases on absorptioncross-sections is analyzed by performing measurements in argon,helium and nitrogen.
2. Experimental setup
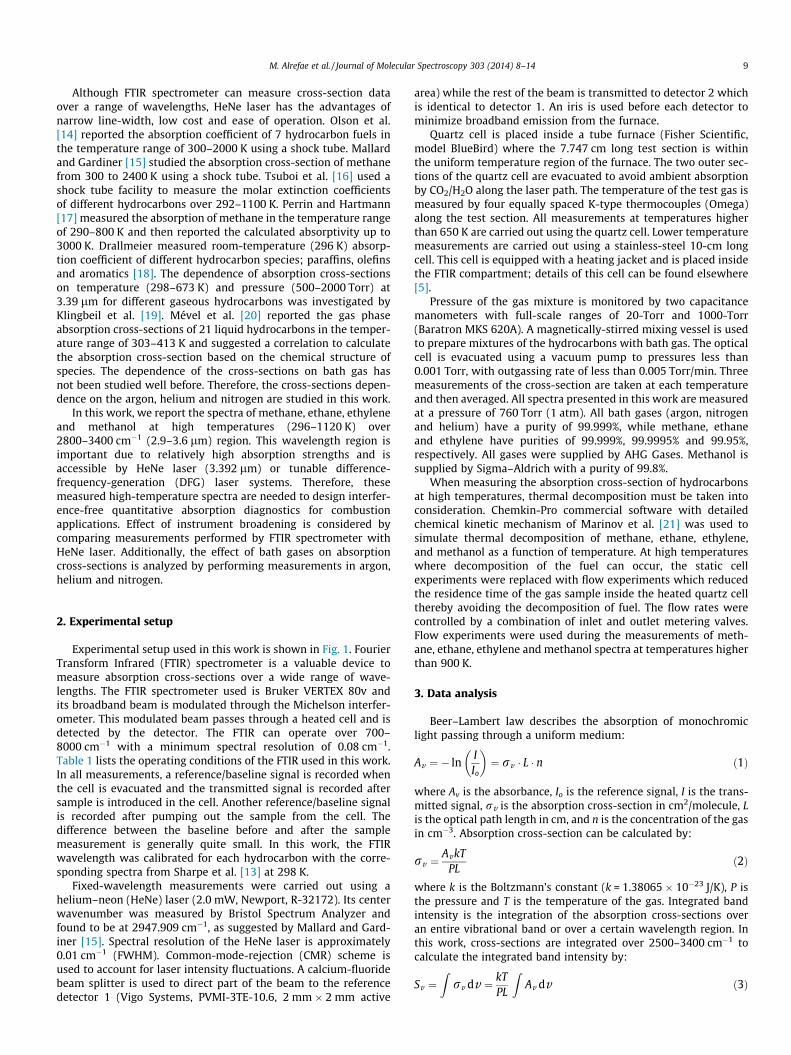
Experimental setup used in this work is shown in Fig. 1. FourierTransform Infrared (FTIR) spectrometer is a valuable device tomeasure absorption cross-sections over a wide range of wave-lengths. The FTIR spectrometer used is Bruker VERTEX 80v andits broadband beam is modulated through the Michelson interfer-ometer. This modulated beam passes through a heated cell and isdetected by the detector. The FTIR can operate over 700–8000 cm�1 with a minimum spectral resolution of 0.08 cm�1.Table 1 lists the operating conditions of the FTIR used in this work.In all measurements, a reference/baseline signal is recorded whenthe cell is evacuated and the transmitted signal is recorded aftersample is introduced in the cell. Another reference/baseline signalis recorded after pumping out the sample from the cell. Thedifference between the baseline before and after the samplemeasurement is generally quite small. In this work, the FTIRwavelength was calibrated for each hydrocarbon with the corre-sponding spectra from Sharpe et al. [13] at 298 K.
Fixed-wavelength measurements were carried out using ahelium–neon (HeNe) laser (2.0 mW, Newport, R-32172). Its centerwavenumber was measured by Bristol Spectrum Analyzer andfound to be at 2947.909 cm�1, as suggested by Mallard and Gard-iner [15]. Spectral resolution of the HeNe laser is approximately0.01 cm�1 (FWHM). Common-mode-rejection (CMR) scheme isused to account for laser intensity fluctuations. A calcium-fluoridebeam splitter is used to direct part of the beam to the referencedetector 1 (Vigo Systems, PVMI-3TE-10.6, 2 mm � 2 mm active
area) while the rest of the beam is transmitted to detector 2 whichis identical to detector 1. An iris is used before each detector tominimize broadband emission from the furnace.
Quartz cell is placed inside a tube furnace (Fisher Scientific,model BlueBird) where the 7.747 cm long test section is withinthe uniform temperature region of the furnace. The two outer sec-tions of the quartz cell are evacuated to avoid ambient absorptionby CO2/H2O along the laser path. The temperature of the test gas ismeasured by four equally spaced K-type thermocouples (Omega)along the test section. All measurements at temperatures higherthan 650 K are carried out using the quartz cell. Lower temperaturemeasurements are carried out using a stainless-steel 10-cm longcell. This cell is equipped with a heating jacket and is placed insidethe FTIR compartment; details of this cell can be found elsewhere[5].
Pressure of the gas mixture is monitored by two capacitancemanometers with full-scale ranges of 20-Torr and 1000-Torr(Baratron MKS 620A). A magnetically-stirred mixing vessel is usedto prepare mixtures of the hydrocarbons with bath gas. The opticalcell is evacuated using a vacuum pump to pressures less than0.001 Torr, with outgassing rate of less than 0.005 Torr/min. Threemeasurements of the cross-section are taken at each temperatureand then averaged. All spectra presented in this work are measuredat a pressure of 760 Torr (1 atm). All bath gases (argon, nitrogenand helium) have a purity of 99.999%, while methane, ethaneand ethylene have purities of 99.999%, 99.9995% and 99.95%,respectively. All gases were supplied by AHG Gases. Methanol issupplied by Sigma–Aldrich with a purity of 99.8%.
When measuring the absorption cross-section of hydrocarbonsat high temperatures, thermal decomposition must be taken intoconsideration. Chemkin-Pro commercial software with detailedchemical kinetic mechanism of Marinov et al. [21] was used tosimulate thermal decomposition of methane, ethane, ethylene,and methanol as a function of temperature. At high temperatureswhere decomposition of the fuel can occur, the static cellexperiments were replaced with flow experiments which reducedthe residence time of the gas sample inside the heated quartz cellthereby avoiding the decomposition of fuel. The flow rates werecontrolled by a combination of inlet and outlet metering valves.Flow experiments were used during the measurements of meth-ane, ethane, ethylene and methanol spectra at temperatures higherthan 900 K.
3. Data analysis
Beer–Lambert law describes the absorption of monochromiclight passing through a uniform medium:
Av ¼ � lnIIo
� �¼ rv � L � n ð1Þ
where Av is the absorbance, Io is the reference signal, I is the trans-mitted signal, rv is the absorption cross-section in cm2/molecule, Lis the optical path length in cm, and n is the concentration of the gasin cm�3. Absorption cross-section can be calculated by:
rv ¼AvkT
PLð2Þ
where k is the Boltzmann’s constant (k = 1.38065 � 10�23 J/K), P isthe pressure and T is the temperature of the gas. Integrated bandintensity is the integration of the absorption cross-sections overan entire vibrational band or over a certain wavelength region. Inthis work, cross-sections are integrated over 2500–3400 cm�1 tocalculate the integrated band intensity by:
Sv ¼Z
rv dv ¼ kTPL
ZAv dv ð3Þ
FTIR Spectrometer (Vertex 80v)
(a) FTIR and HeNe laser setup
(b) Quartz cell
Michelson Interferometer
FlippingFocusing
Mirror
FocusingMirror Light
Source
FTIR Detector
Furnace
Quartz cell (see detail below)
HeN
e L
aser
Mirror
BeamSplitter Mirror
Detector 1 Detector 2
Flipping Mirror
FocusingMirror
Fig. 1. Schematic of the experimental setup: (a) FTIR and HeNe laser setups and (b) detailed arrangement of the quartz cell.
Table 1FTIR settings used to measure mid-IR spectra of methane, ethane, ethylene andmethanol.
Beamsplitter Potassium bromide (KBr)Input aperture 2.5 mmDetector DigiTect DLaTGSLight source Globar (Mid-infrared)FT phase correction, zero fill Mertz, 2 � zero-filling
10 M. Alrefae et al. / Journal of Molecular Spectroscopy 303 (2014) 8–14
Detailed uncertainty analysis is carried out to estimate theerrors in the measured absorption cross-section and the integratedband intensity. According to Eqs. (2) and (3), there are five sourcesof uncertainty: absorbance, mole fraction, temperature, pressureand path length. In this work, absorbance (Av) values generallyvaried between 0.2 and 2 which resulted in relatively high sig-nal-to-noise-ratio (SNR). The uncertainty on the absorbance istaken from the standard deviation of the recorded data. The uncer-tainty on the mole fraction of the fuel is due to the partial pressureof the fuel and the total pressure. The uncertainty of the two pres-sure gauges (Baratrons) used is ±0.12% of the reading. To avoid theadsorption of methanol, a liquid fuel, to the walls of the mixing
vessel, the partial pressure of methanol is kept at less than halfof its saturation vapor pressure at 296 K. The temperature uncer-tainty comes from the temperature profile in the test section andthe uncertainty of the thermocouple readings. The pressureremains almost constant during the experiment and the uncer-tainty of the test pressure is ±0.12% of the reading. The uncertaintyin the path length is due to the expansion of the two optical win-dows with temperature and the path traveled by the laser beam.The overall uncertainty of the absorption cross-section (or the inte-grated band intensity) is given by:
The uncertainty of the measured absorption cross-section is cal-culated to be less than 5% for lower temperatures and about 8% fortemperatures higher than 700 K.
4. Results and discussion
Absorption cross-sections of methane, ethane, ethylene andmethanol are reported here over a temperature range of 296–
15.0x10 -19
10.0
5.0
ctio
n (c
m2 /m
olec
ule)
Sharpe et al. (2004)This Work
(cm
2 /m
olec
ule) 296 K
373 K 523 K 673 K 921 K
15.0
20x10-19
ν10
M. Alrefae et al. / Journal of Molecular Spectroscopy 303 (2014) 8–14 11
1100 K. The FTIR spectrometer is used to measure spectra over thewavelength range of 2800–3400 cm�1. HeNe laser, operating at3.932 lm, is used to measure the absorption cross-section at afixed frequency. Finally, the effect of bath gas on absorptioncross-sections is analyzed by making measurements in helium,argon and nitrogen as bath gases.
2800 2900 3000 3100 3200
2990 2995 3000 3005Cro
ss-s
e
Wavenumber (cm-1)
0.0Pressure ∼ 760 Torr
Abso
rptio
n C
ross
-sec
tion
Wavenumber (cm-1)
0.0
5.0
10.0
ν1
ν7
Fig. 3. FTIR-measured spectra of ethane showing the origin of the m1, m7 and m10
bands. Ethane concentration ranged from 1% to 10% (in N2) for different temper-atures. A comparison between this work and Sharpe et al. [13] is shown in theupper-right corner at 296 K.
2850 2900 2950 3000 3050 3100 3150 3200 3250
2985 2986 2987 2988 2989 2990
Abso
rptio
n C
ross
-Sec
tion
(cm
2 /m
olec
ule)
ν11
Pressure ∼ 760 Torr
Wavenumber (cm-1)
296 K 373 K 523 K 673 K 920 K
2.0
4.0x10⁻¹⁹
0.0
ν9
ν11Pressure ∼ 760 Torr
Cro
ss-S
ectio
n (c
m2 /m
olec
ule)
Wavenumber (cm-1)
296 K 373 K 523 K 673 K 920 K
2.0
4.0x10⁻¹⁹
0.0
Fig. 4. FTIR-measured spectra of ethylene showing the origin of the m11 and m9
bands. Ethylene concentration ranged from 10% to 40% (in N2) for differenttemperatures. The insert shows a zoomed-in view of the temperature dependenceof the m11 peak.
4.1. Temperature-dependent mid-IR spectra
Absorption cross-sections of methane, measured by the FTIR,are plotted in Fig. 2 as a function of temperatures (296–1120 K)over 2800–3300 cm�1 region. Methane spectra in this regionconsist of relatively narrow absorption lines and the spectra aredominated by strong absorptions due to the m3 CAH stretchingmode and small contribution from the m2 + m4 combination band[22]. It can be observed from Fig. 2 that as temperature increases,peak transition intensity decreases while higher rotational levelsget populated and the band continuum increases. As discussed ear-lier, to ensure methane does not undergo decomposition duringhigh-temperature measurements (919 K, 1120 K), a flow experi-ment is used to reduce the residence time. The FTIR measurementsare performed with a spectral resolution of 0.16 cm�1 for low tem-perature (T < 500 K) and 0.6 cm�1 for experiments at temperaturehigher than 500 K. The later resolution was selected to maximizethe signal-to-noise ratio for high-temperature measurementswhere the mid-IR beam was directed through the furnace andhad relatively low transmitted intensity.
Fig. 3 shows ethane spectra recorded over 2800–3200 cm�1
region by FTIR at five temperature values from 296 to 921 K. Theabsorption spectra exhibit strong absorption assigned to m7 CAHstretching mode together with small contribution of m10 featurenear 2985 cm�1 [22]. Similar to methane, the peak intensitiesdecrease with increasing temperature and the band continuumincrease. In the insert of the same figure, ethane spectrum obtainedat 296 K with a resolution of 0.16 cm�1 are compared withthe PNNL data measured at 0.112 cm�1 spectral resolution[13]. The two spectra agree very well with each other confirmingthat the chosen resolution of 0.16 cm�1 is sufficient to resolvevarious features of ethane spectrum.
Ethylene spectra measured between 2850 and 3250 cm�1 areshown in Fig. 4 as a function of temperature. The m11 featurelocated near 2988 cm�1 [22] is dominant in this region. The gastemperature has the same effect as discussed above for methane
2800 2900 3000 3100 3200 3300
20.0x10⁻¹⁹
15.0
0.0
10.0
Abso
rptio
n C
ross
-sec
tion
(cm
2 /m
olec
ule)
Wavenumber (cm-1)
296 K 373 K 523 K 673 K 919 K 1120 K
P-branchν3
Q-branch
R-branch
Pressure ∼ 760 Torr
5.0
Fig. 2. FTIR-measured spectra of methane showing the origin of the m3 band and theP, Q, R branches. Methane concentration ranged from 0.5% to 10% (in N2) fordifferent temperatures.
and ethane. The change in the peak intensity with temperature isillustrated in the insert of the figure for the m11 peak near2988 cm�1. The cross-sections of ethylene are weaker than ethanebecause of the replacement of the CAH bond by the C@C bond.
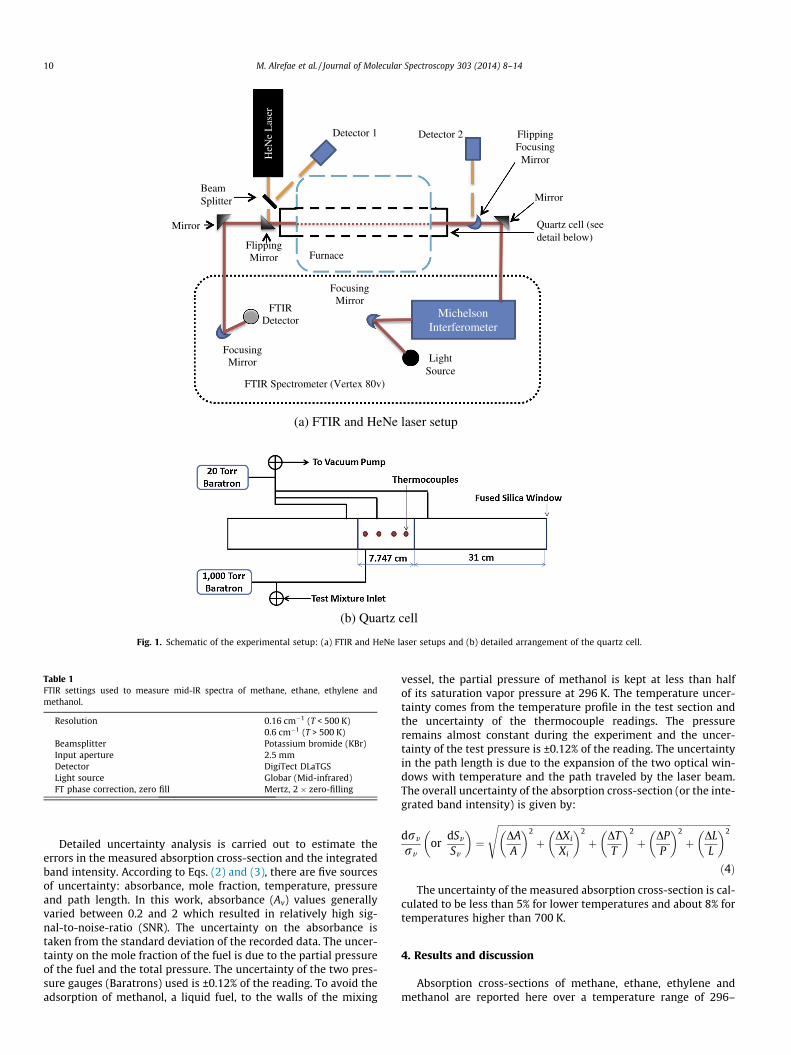
The measured absorption cross-sections of methanol in thespectral range of 2750–3400 cm�1 are presented in Fig. 5 as a func-tion of temperature (296–778 K). Recently, high-resolution(0.015 cm�1) absorption spectra of methanol were measured near3.3 lm at low temperatures (204–296 K) by Harrison et al. [9].There are three fundamental vibrational modes in this regionwhich are m2, m3 and m9 with values of 2999, 2844 and2970 cm�1, respectively [22]. Absorption cross-sections of metha-nol are weaker than methane due to the replacement of the CAHbond with the CAO one. However, methanol spectrum is relativelybroad due to the contribution of neighboring bands of methanol.
4.2. Integrated band intensities
Since absorption cross-sections are measured as a function oftemperature at two spectral resolutions (0.16 and 0.6 cm�1), it is
2800 2900 3000 3100 3200
Pressure ∼ 760 Torr
Abso
rptio
n C
ross
-sec
tion
(cm
2 /m
olec
ule)
Wavenumber (cm-1)
296 K 373 K 523 K 669 K 778 K
3.0x10⁻¹⁹
2.0
1.0
0.0
ν9
ν2ν3
Fig. 5. FTIR-measured spectra of methanol showing the origin of the m2, m3 and m9
bands. Methanol concentration ranged from 1.5% to 6% (in N2) for differenttemperatures.
12 M. Alrefae et al. / Journal of Molecular Spectroscopy 303 (2014) 8–14
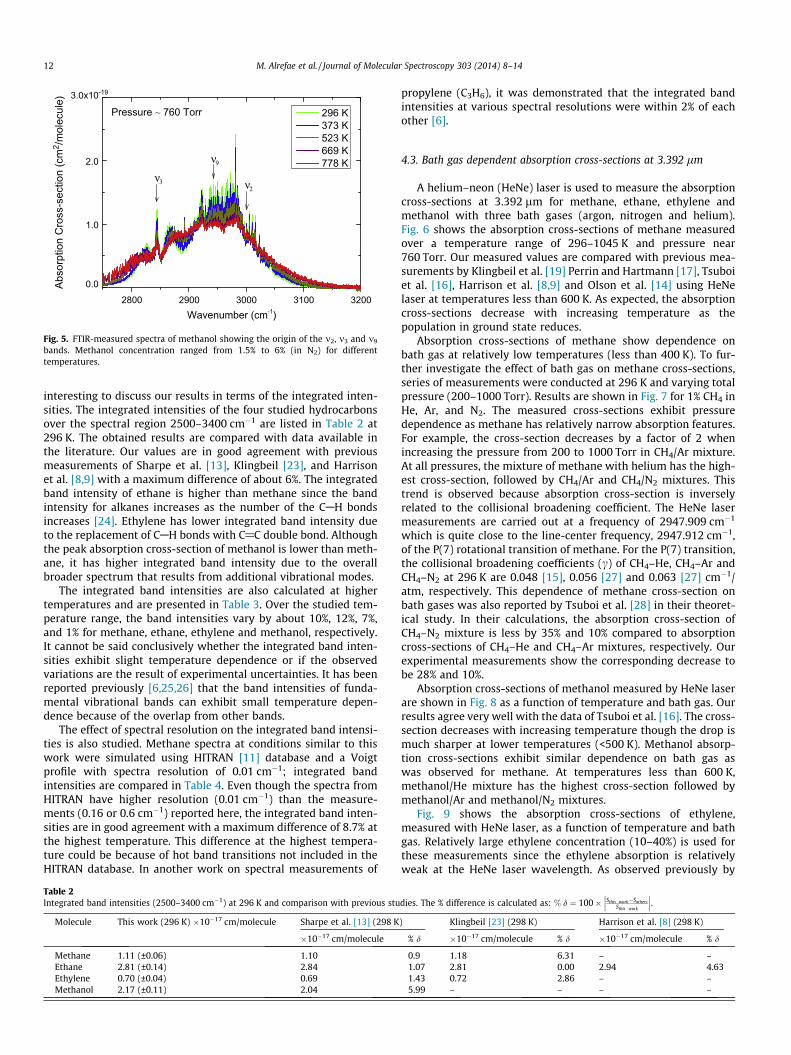
interesting to discuss our results in terms of the integrated inten-sities. The integrated intensities of the four studied hydrocarbonsover the spectral region 2500–3400 cm�1 are listed in Table 2 at296 K. The obtained results are compared with data available inthe literature. Our values are in good agreement with previousmeasurements of Sharpe et al. [13], Klingbeil [23], and Harrisonet al. [8,9] with a maximum difference of about 6%. The integratedband intensity of ethane is higher than methane since the bandintensity for alkanes increases as the number of the CAH bondsincreases [24]. Ethylene has lower integrated band intensity dueto the replacement of CAH bonds with C@C double bond. Althoughthe peak absorption cross-section of methanol is lower than meth-ane, it has higher integrated band intensity due to the overallbroader spectrum that results from additional vibrational modes.
The integrated band intensities are also calculated at highertemperatures and are presented in Table 3. Over the studied tem-perature range, the band intensities vary by about 10%, 12%, 7%,and 1% for methane, ethane, ethylene and methanol, respectively.It cannot be said conclusively whether the integrated band inten-sities exhibit slight temperature dependence or if the observedvariations are the result of experimental uncertainties. It has beenreported previously [6,25,26] that the band intensities of funda-mental vibrational bands can exhibit small temperature depen-dence because of the overlap from other bands.
The effect of spectral resolution on the integrated band intensi-ties is also studied. Methane spectra at conditions similar to thiswork were simulated using HITRAN [11] database and a Voigtprofile with spectra resolution of 0.01 cm�1; integrated bandintensities are compared in Table 4. Even though the spectra fromHITRAN have higher resolution (0.01 cm�1) than the measure-ments (0.16 or 0.6 cm�1) reported here, the integrated band inten-sities are in good agreement with a maximum difference of 8.7% atthe highest temperature. This difference at the highest tempera-ture could be because of hot band transitions not included in theHITRAN database. In another work on spectral measurements of
Table 2Integrated band intensities (2500–3400 cm�1) at 296 K and comparison with previous stu
Molecule This work (296 K) �10�17 cm/molecule Sharpe et al. [13] (298 K
propylene (C3H6), it was demonstrated that the integrated bandintensities at various spectral resolutions were within 2% of eachother [6].
4.3. Bath gas dependent absorption cross-sections at 3.392 lm
A helium–neon (HeNe) laser is used to measure the absorptioncross-sections at 3.392 lm for methane, ethane, ethylene andmethanol with three bath gases (argon, nitrogen and helium).Fig. 6 shows the absorption cross-sections of methane measuredover a temperature range of 296–1045 K and pressure near760 Torr. Our measured values are compared with previous mea-surements by Klingbeil et al. [19] Perrin and Hartmann [17], Tsuboiet al. [16], Harrison et al. [8,9] and Olson et al. [14] using HeNelaser at temperatures less than 600 K. As expected, the absorptioncross-sections decrease with increasing temperature as thepopulation in ground state reduces.
Absorption cross-sections of methane show dependence onbath gas at relatively low temperatures (less than 400 K). To fur-ther investigate the effect of bath gas on methane cross-sections,series of measurements were conducted at 296 K and varying totalpressure (200–1000 Torr). Results are shown in Fig. 7 for 1% CH4 inHe, Ar, and N2. The measured cross-sections exhibit pressuredependence as methane has relatively narrow absorption features.For example, the cross-section decreases by a factor of 2 whenincreasing the pressure from 200 to 1000 Torr in CH4/Ar mixture.At all pressures, the mixture of methane with helium has the high-est cross-section, followed by CH4/Ar and CH4/N2 mixtures. Thistrend is observed because absorption cross-section is inverselyrelated to the collisional broadening coefficient. The HeNe lasermeasurements are carried out at a frequency of 2947.909 cm�1
which is quite close to the line-center frequency, 2947.912 cm�1,of the P(7) rotational transition of methane. For the P(7) transition,the collisional broadening coefficients (c) of CH4–He, CH4–Ar andCH4–N2 at 296 K are 0.048 [15], 0.056 [27] and 0.063 [27] cm�1/atm, respectively. This dependence of methane cross-section onbath gases was also reported by Tsuboi et al. [28] in their theoret-ical study. In their calculations, the absorption cross-section ofCH4–N2 mixture is less by 35% and 10% compared to absorptioncross-sections of CH4–He and CH4–Ar mixtures, respectively. Ourexperimental measurements show the corresponding decrease tobe 28% and 10%.
Absorption cross-sections of methanol measured by HeNe laserare shown in Fig. 8 as a function of temperature and bath gas. Ourresults agree very well with the data of Tsuboi et al. [16]. The cross-section decreases with increasing temperature though the drop ismuch sharper at lower temperatures (<500 K). Methanol absorp-tion cross-sections exhibit similar dependence on bath gas aswas observed for methane. At temperatures less than 600 K,methanol/He mixture has the highest cross-section followed bymethanol/Ar and methanol/N2 mixtures.
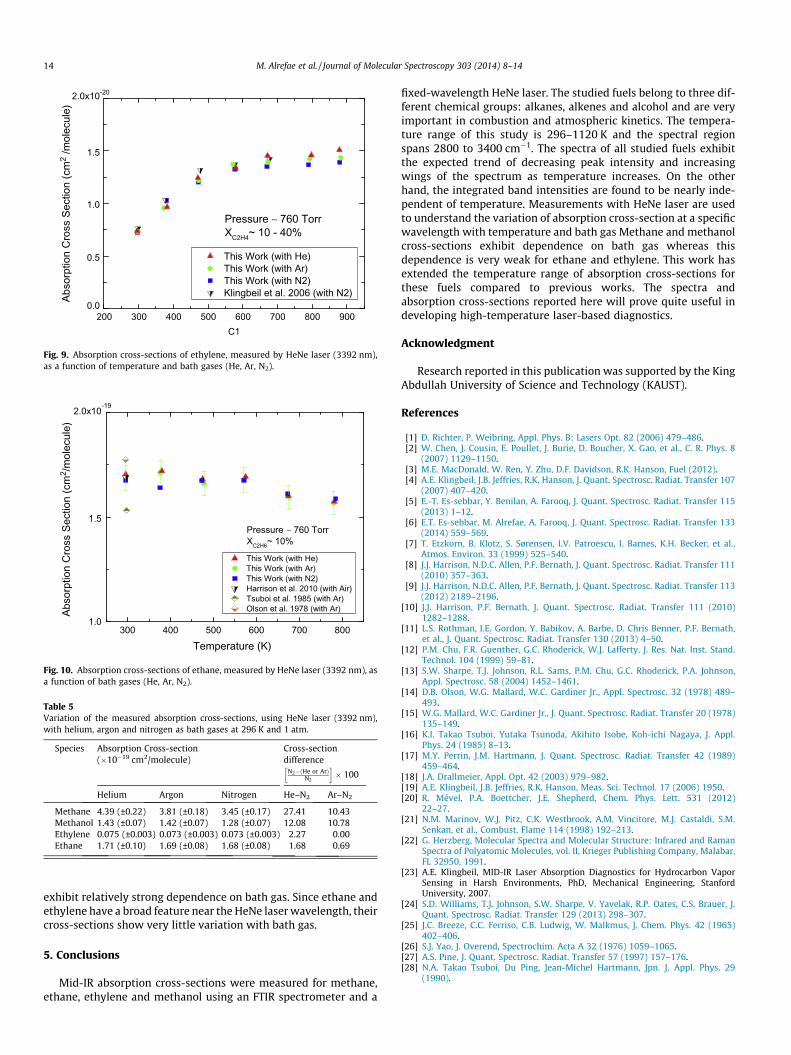
Fig. 9 shows the absorption cross-sections of ethylene,measured with HeNe laser, as a function of temperature and bathgas. Relatively large ethylene concentration (10–40%) is used forthese measurements since the ethylene absorption is relativelyweak at the HeNe laser wavelength. As observed previously by
dies. The % difference is calculated as: % d ¼ 100� Sthis work�SothersSthis work
��� ���.) Klingbeil [23] (298 K) Harrison et al. [8] (298 K)
Table 4Comparison between the integrated band intensities (2500–3400 cm�1) of methanefrom HITRAN and this work at various temperatures. The unit of the integrated bandintensity is (�10�17 cm/molecule).
T(K)
This work HITRANa (resolution0.01 cm�1)
Difference(%)
296 1.11 (resolution0.16 cm�1)
1.11 0.0
373 1.17 (resolution0.16 cm�1)
1.11 5.1
673 1.04 (resolution0.6 cm�1)
1.03 1.0
773 1.04 (resolution0.6 cm�1)
0.95 8.7
a Methane spectra were obtained from HITRAN on the Web.
200 300 400 500 600 700 800 900 1000 1100
Pressure ∼ 760 TorrXMethane~ 1 - 3%
5.0x10⁻¹⁹
4.0
3.0
2.0
1.0
Abso
rptio
n C
ross
Sec
tion
(cm
2 /m
olec
ule)
Temperature (K)
This Work (with He) This Work (with Ar) This Work (with N2) Klingbeil et al. 2006 (with N2) Perrin and Hartmann 1989 (with N2)
0.0
Fig. 6. Absorption cross-sections of methane, measured by HeNe laser (3392 nm),with different bath gases.
200 400 600 800 1000
15.0x10⁻¹⁹
10.0
5.0
Abso
rptio
n C
ross
-Sec
tion
(cm
2 /m
olec
ule)
Pressure (Torr)
CH4/He mixture CH4/Ar mixture CH4/N2 mixture
Temperature = 296 KXCH4~ 1%
0.0
Fig. 7. Bath gas dependent absorption cross-sections of methane with Ar, He and N2
at 296 K. Measurements are carried out with HeNe laser at 3.392 lm.
300 400 500 600 700 800
2.0x10⁻¹⁹
1.5
1.0
This Work (with He) This Work (with Ar) This Work (with N2) Tsuboi et al. 1985 (with Ar)
Abso
rptio
n C
ross
Sec
tion
(cm
2 /m
olec
ule)
Temperature (K)
Pressure ~ 760 TorrXMethanol~ 2.5%
0.5
Fig. 8. Absorption cross-sections of methanol, measured by HeNe laser (3392 nm),with different bath gases (Ar, He and N2).
M. Alrefae et al. / Journal of Molecular Spectroscopy 303 (2014) 8–14 13
Klingbeil et al. [19], the absorption cross-section of ethyleneincreases with temperature at the HeNe laser wavelength(2947.909 cm�1). This is due to the fact that this wavelength is closeto a hot band transition and its intensity increases with increasingtemperatures. Ethylene shows relatively less dependence on bathgas compared to methane and methanol. However, it is clear fromthe high-temperature (>600 K) data that the cross-section is largerfor helium mixture followed by argon and nitrogen mixtures.
Absorption cross-sections of ethane, measured by HeNe laser,are shown in Fig. 10 as a function of temperature and bath gas.Our measured values agree with Harrison et al. [8] and Olsonet al. [14] data but Tsuboi et al. [16] value appears to be lowerby about 10%. The cross-sections show very little temperaturedependence because the HeNe laser emission wavelength is closeto the inflexion region (between the peak and valley) which isknown to exhibit very little variation with temperature. For the
same reason, the cross-sections of ethane do not exhibit apprecia-ble dependence on the bath gas. The same phenomenon wasobserved in another study carried out in our laboratory forpropane, propylene and ethanol (data not shown here) where theircross-sections did not show any dependence on the bath gas.
The values of the cross-sections, measured by HeNe laser, atroom temperature (296 K) and atmospheric pressure (760 Torr)are summarized in Table 5 for different bath gases. As observed fromFigs. 6–10, Table 5 also demonstrates that methane and methanol
200 300 400 500 600 700 800 900
2.0x10⁻²⁰
1.5
1.0
0.5
Pressure ∼ 760 TorrXC2H4~ 10 - 40%
This Work (with He) This Work (with Ar) This Work (with N2) Klingbeil et al. 2006 (with N2)Ab
sorp
tion
Cro
ss S
ectio
n (c
m2
/mol
ecul
e)
C1
0.0
Fig. 9. Absorption cross-sections of ethylene, measured by HeNe laser (3392 nm),as a function of temperature and bath gases (He, Ar, N2).
300 400 500 600 700 800
Pressure ∼ 760 TorrXC2H6~ 10%
2.0x10⁻¹⁹
1.5
This Work (with He) This Work (with Ar) This Work (with N2) Harrison et al. 2010 (with Air) Tsuboi et al. 1985 (with Ar) Olson et al. 1978 (with Ar)Ab
sorp
tion
Cro
ss S
ectio
n (c
m2 /
mol
ecul
e)
Temperature (K)
1.0
Fig. 10. Absorption cross-sections of ethane, measured by HeNe laser (3392 nm), asa function of bath gases (He, Ar, N2).
Table 5Variation of the measured absorption cross-sections, using HeNe laser (3392 nm),with helium, argon and nitrogen as bath gases at 296 K and 1 atm.
Species Absorption Cross-section(�10�19 cm2/molecule)
14 M. Alrefae et al. / Journal of Molecular Spectroscopy 303 (2014) 8–14
exhibit relatively strong dependence on bath gas. Since ethane andethylene have a broad feature near the HeNe laser wavelength, theircross-sections show very little variation with bath gas.
5. Conclusions
Mid-IR absorption cross-sections were measured for methane,ethane, ethylene and methanol using an FTIR spectrometer and a
fixed-wavelength HeNe laser. The studied fuels belong to three dif-ferent chemical groups: alkanes, alkenes and alcohol and are veryimportant in combustion and atmospheric kinetics. The tempera-ture range of this study is 296–1120 K and the spectral regionspans 2800 to 3400 cm�1. The spectra of all studied fuels exhibitthe expected trend of decreasing peak intensity and increasingwings of the spectrum as temperature increases. On the otherhand, the integrated band intensities are found to be nearly inde-pendent of temperature. Measurements with HeNe laser are usedto understand the variation of absorption cross-section at a specificwavelength with temperature and bath gas Methane and methanolcross-sections exhibit dependence on bath gas whereas thisdependence is very weak for ethane and ethylene. This work hasextended the temperature range of absorption cross-sections forthese fuels compared to previous works. The spectra andabsorption cross-sections reported here will prove quite useful indeveloping high-temperature laser-based diagnostics.
Acknowledgment
Research reported in this publication was supported by the KingAbdullah University of Science and Technology (KAUST).
References
[1] D. Richter, P. Weibring, Appl. Phys. B: Lasers Opt. 82 (2006) 479–486.[2] W. Chen, J. Cousin, E. Poullet, J. Burie, D. Boucher, X. Gao, et al., C. R. Phys. 8
(2007) 1129–1150.[3] M.E. MacDonald, W. Ren, Y. Zhu, D.F. Davidson, R.K. Hanson, Fuel (2012).[4] A.E. Klingbeil, J.B. Jeffries, R.K. Hanson, J. Quant. Spectrosc. Radiat. Transfer 107
(2007) 407–420.[5] E.-T. Es-sebbar, Y. Benilan, A. Farooq, J. Quant. Spectrosc. Radiat. Transfer 115
(2013) 1–12.[6] E.T. Es-sebbar, M. Alrefae, A. Farooq, J. Quant. Spectrosc. Radiat. Transfer 133
(2014) 559–569.[7] T. Etzkorn, B. Klotz, S. Sørensen, I.V. Patroescu, I. Barnes, K.H. Becker, et al.,
Atmos. Environ. 33 (1999) 525–540.[8] J.J. Harrison, N.D.C. Allen, P.F. Bernath, J. Quant. Spectrosc. Radiat. Transfer 111
(2010) 357–363.[9] J.J. Harrison, N.D.C. Allen, P.F. Bernath, J. Quant. Spectrosc. Radiat. Transfer 113
(2012) 2189–2196.[10] J.J. Harrison, P.F. Bernath, J. Quant. Spectrosc. Radiat. Transfer 111 (2010)
1282–1288.[11] L.S. Rothman, I.E. Gordon, Y. Babikov, A. Barbe, D. Chris Benner, P.F. Bernath,
et al., J. Quant. Spectrosc. Radiat. Transfer 130 (2013) 4–50.[12] P.M. Chu, F.R. Guenther, G.C. Rhoderick, W.J. Lafferty, J. Res. Nat. Inst. Stand.