WM2018 Conference, March 18 – 22, 2018, Phoenix, Arizona, USA 1 Autonomous 3D and Radiation Mapping in Tunnel Environments Using Aerial Robots – 18156 Frank Mascarich, Taylor Wilson, Shehryar Khattak, Tung Dang, Christos Papachristos, Kostas Alexis University of Nevada, Reno ABSTRACT In this paper we present the algorithms and systems developed to enable autonomous 3D and radiation mapping, as well as radiological source localization in tunnel environments using aerial robots. The developed technologies aim to address the need of autonomous robotic inspection of nuclear sites such as facilities in the process of being decommissioned. As a motivational example, the PUREX tunnels at the Hanford Site are considered and the robot is designed to be able to conduct multi-modal 3D/radiation characterization of the tunnel environment without any prior knowledge or map provided beforehand. In order to enable the necessary GPS-denied simultaneous localization and mapping in dark, visually-degraded tunnel environments, a multi-modal mapping unit was developed which fuses the data from stereo vision cameras synchronized with flashing LEDs, inertial sensors, and three time-of-flight 3D depth sensors. The robot’s pose and surrounding map are estimated at 20Hz through a depth-enhanced visual-inertial localization and mapping framework. Provided this ability to estimate the robot’s pose and develop a dense map in real-time, a receding horizon sampling-based autonomous exploration path planning algorithm was utilized and equips the robot with the ability to explore its environment given no prior map. The aforementioned key robotic functionalities are further extended through the integration of miniaturized fully solid-state scintillation detectors, utilizing advanced scintillators and Silicon Photomultipliers. The derived sensor data is employed for radiation mapping, which when fused with the 3D maps and the spectroscopic source localization methods, allow the aerial robotic platform to localize the radiation source and identify the specific source isotope. The source location is estimated through a geometric algorithm which can localize a source given only three measurements and short dwell times. The developed systems were tested using two small aerial robot platforms of the F450 and F550 frame classes with weights of 2.6kg and 2.9kg respectively. All localization and planning as well as high- level control algorithms are executed onboard. The scintillation detector is integrated on the robot and its data is collected through a dedicated microcontroller. A set of field experiments were conducted inside the dark and GPS-denied environment of a 4.25m wide, 7.5m tall, and 137m long railroad tunnel. A Cs-137 source was placed within the tunnel, the associated 3D/radiation maps were derived, and the source location was estimated. Through these efforts, the goal is to develop the robotic technology that would enable the autonomous systematic inspection or emergency response in nuclear waste decommissioning facilities. INTRODUCTION Autonomous robots are ideal tools for exploring and characterizing environments which require personnel to perform dirty, dangerous, and dull tasks [1-6]. They are especially valuable in environments which are potentially hazardous to human health. Autonomous aerial robots in particular, equipped with GPS-denied localization and radiation detection capabilities correspond to excellent tools for remote access, monitoring and inspection. Aerial robotic characterization enables low-cost, low-risk, and highly- repeatable missions which suit the inspection, monitoring, and exploration tasks consistent with activities such as nuclear facility decommissioning, nuclear disasters, as well as the tracking of illicit radioactive sources. Examples of such environments include the nuclear waste storage system left behind by the Manhattan Project and active nuclear power stations with on-site spent fuel depositories.
Transcript
WM2018 Conference, March 18 – 22, 2018, Phoenix, Arizona, USA
1
Autonomous 3D and Radiation Mapping in Tunnel Environments Using Aerial Robots – 18156
Frank Mascarich, Taylor Wilson, Shehryar Khattak, Tung Dang, Christos Papachristos, Kostas Alexis
University of Nevada, Reno
ABSTRACT In this paper we present the algorithms and systems developed to enable autonomous 3D and
radiation mapping, as well as radiological source localization in tunnel environments using aerial robots.
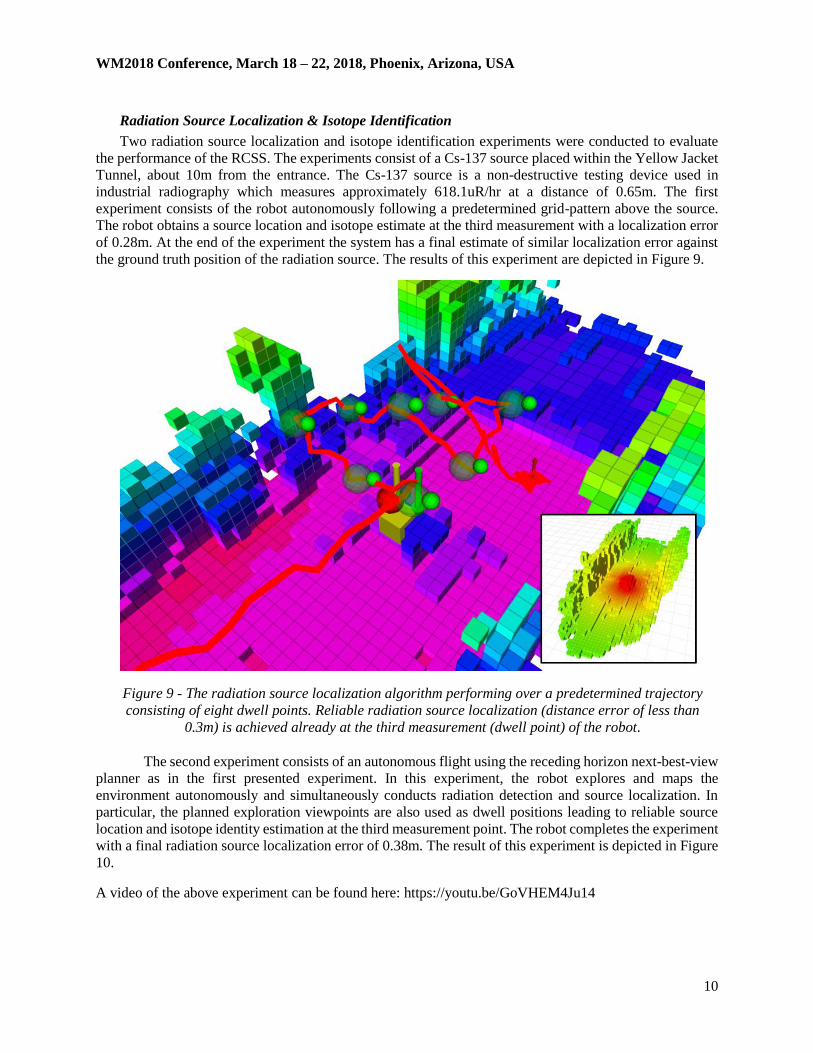
The developed technologies aim to address the need of autonomous robotic inspection of nuclear sites such
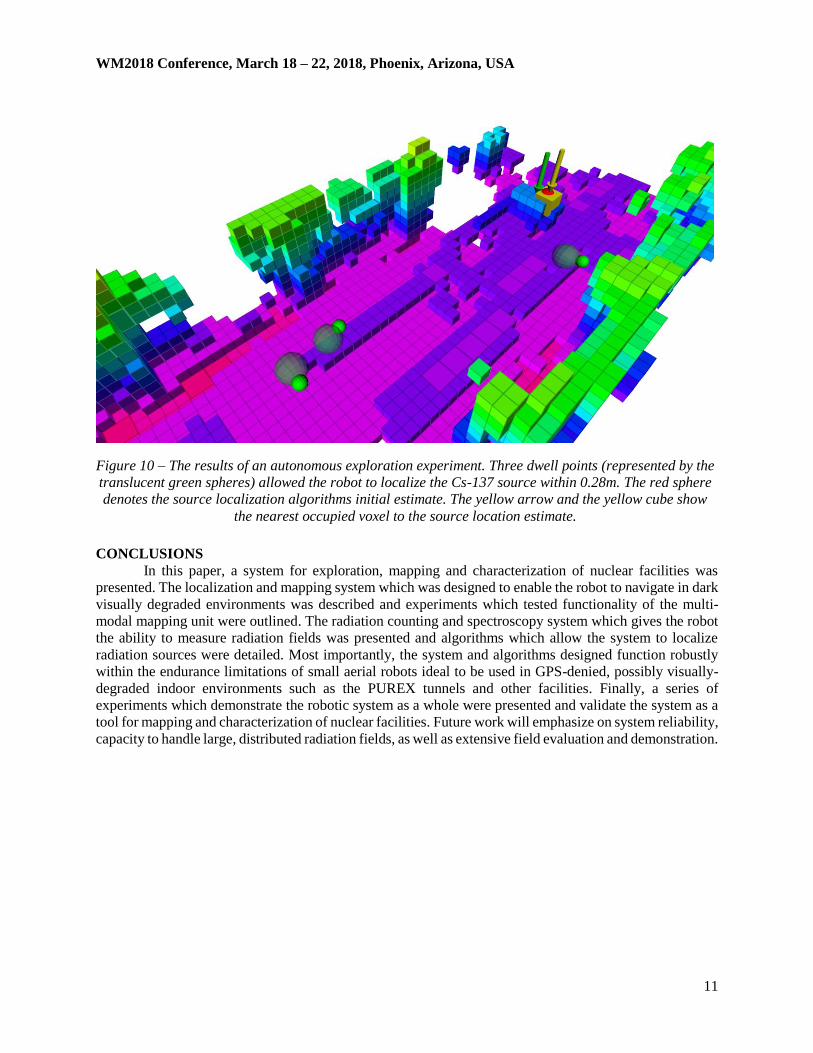
as facilities in the process of being decommissioned. As a motivational example, the PUREX tunnels at the
Hanford Site are considered and the robot is designed to be able to conduct multi-modal 3D/radiation
characterization of the tunnel environment without any prior knowledge or map provided beforehand. In
order to enable the necessary GPS-denied simultaneous localization and mapping in dark, visually-degraded
tunnel environments, a multi-modal mapping unit was developed which fuses the data from stereo vision
cameras synchronized with flashing LEDs, inertial sensors, and three time-of-flight 3D depth sensors. The
robot’s pose and surrounding map are estimated at 20Hz through a depth-enhanced visual-inertial
localization and mapping framework. Provided this ability to estimate the robot’s pose and develop a dense
map in real-time, a receding horizon sampling-based autonomous exploration path planning algorithm was
utilized and equips the robot with the ability to explore its environment given no prior map.
The aforementioned key robotic functionalities are further extended through the integration of
miniaturized fully solid-state scintillation detectors, utilizing advanced scintillators and Silicon
Photomultipliers. The derived sensor data is employed for radiation mapping, which when fused with the
3D maps and the spectroscopic source localization methods, allow the aerial robotic platform to localize
the radiation source and identify the specific source isotope. The source location is estimated through a
geometric algorithm which can localize a source given only three measurements and short dwell times.
The developed systems were tested using two small aerial robot platforms of the F450 and F550
frame classes with weights of 2.6kg and 2.9kg respectively. All localization and planning as well as high-
level control algorithms are executed onboard. The scintillation detector is integrated on the robot and its
data is collected through a dedicated microcontroller. A set of field experiments were conducted inside the
dark and GPS-denied environment of a 4.25m wide, 7.5m tall, and 137m long railroad tunnel. A Cs-137
source was placed within the tunnel, the associated 3D/radiation maps were derived, and the source location
was estimated. Through these efforts, the goal is to develop the robotic technology that would enable the
autonomous systematic inspection or emergency response in nuclear waste decommissioning facilities.
INTRODUCTION
Autonomous robots are ideal tools for exploring and characterizing environments which require
personnel to perform dirty, dangerous, and dull tasks [1-6]. They are especially valuable in environments
which are potentially hazardous to human health. Autonomous aerial robots in particular, equipped with
GPS-denied localization and radiation detection capabilities correspond to excellent tools for remote access,
monitoring and inspection. Aerial robotic characterization enables low-cost, low-risk, and highly-
repeatable missions which suit the inspection, monitoring, and exploration tasks consistent with activities
such as nuclear facility decommissioning, nuclear disasters, as well as the tracking of illicit radioactive
sources. Examples of such environments include the nuclear waste storage system left behind by the
Manhattan Project and active nuclear power stations with on-site spent fuel depositories.
WM2018 Conference, March 18 – 22, 2018, Phoenix, Arizona, USA
2
Such environments require aerial robotic platforms which are not only robust and safe to operate, but are
also capable of autonomously exploring their environments regardless of visual conditions and without
prior information. In security scenarios, locating an illicit or “lost” source using an aerial robot would
minimize the exposure of workers, as the robot could provide a search team with a highly accurate estimate
of the source’s position as well as intensity. In decommissioning scenarios, such as the PUREX tunnels, an
aerial robot would reduce risk to workers not only from a radiation exposure perspective, but also from the
inherent risks associated with working in aging facilities which may be prone to collapse and structural
failure. Finally, in disaster response scenarios, such a robotic system could perform the initial radiation field
mapping as well as guiding emergency responders and evacuees around the highly contaminated areas. For
all of these scenarios, algorithms and procedures which allow inspection and monitoring must be designed
to operate within the constraints of a robotic system operating in the real world. These constraints include
highly contaminated environments, and visually degraded conditions.
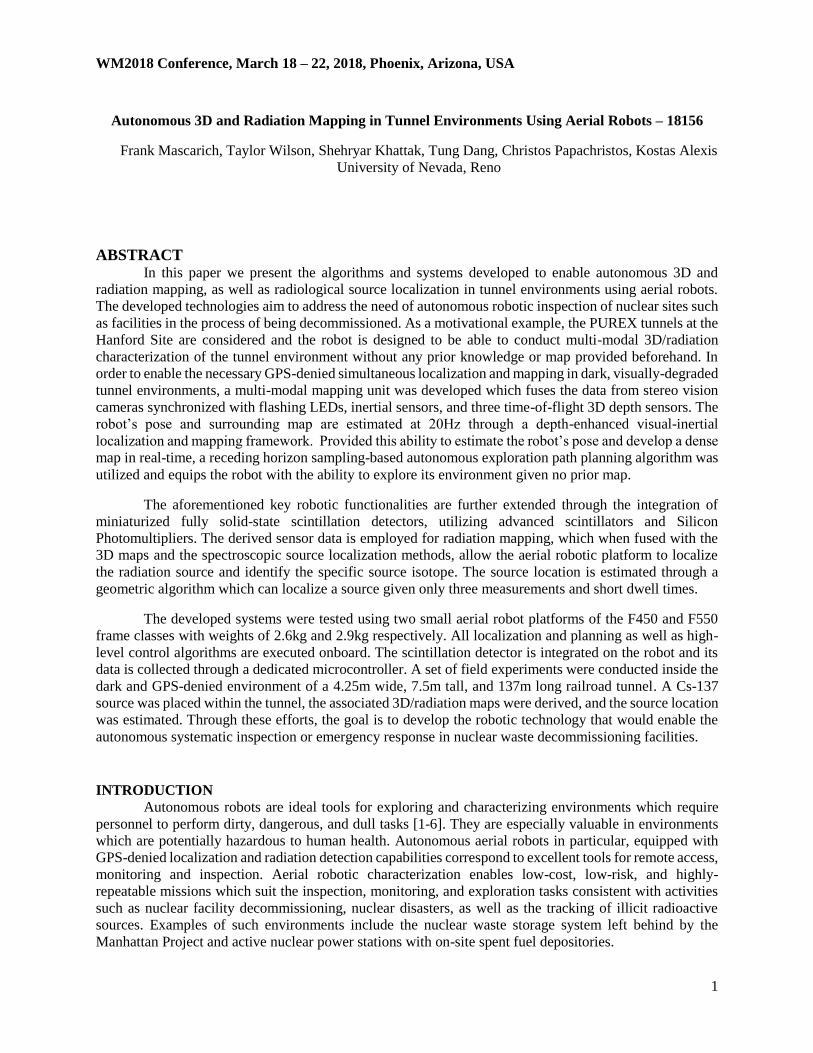
Figure 1 - On the left is a photograph taken during an autonomous radiation source localization
experiment. The derived radiation map is shown alongside the Radiation Counting and Spectroscopy
System. On the top right, a photograph of the tunnel used in the experimental studies is shown. Finally,
on the bottom right is a photograph of the robot taken during an exploration mission in dark, visually-
degraded conditions.
This paper details both the system and the methods required to explore and characterize unknown
environments which contain a radioactive source from an aerial robotic platform. Throughout its mission,
the robot produces a 3D occupancy map of the environment [7], collects radiation data as it navigates and
localizes the source of the radiation in the environment. Exploiting the obtained occupancy map, the source
localization algorithm constrains its solution space to the occupied areas of the environment. Most
importantly, the source localization algorithm was designed to provide reliable and accurate results even
when provided with only few measurements taken subject to the endurance limitations of the aerial
platform. The system is able to navigate in challenging, visually degraded environments using a visual-
inertial-depth localization system named the Multi-Modal Mapping Unit (M3U), and is able to collect
radiation data using a purpose-built scintillator spectroscopy system named the Radiation Counting and
Spectroscopy System (RCSS). In the rest of this paper, the design of the M3U and the RCSS are detailed,
alongside the source localization and isotope identification algorithms developed to enable 3D mapping
and radiation source localization from an aerial robot. In addition, a number of experiments conducted to
evaluate the performance of the M3U, the RCSS, and the associated algorithms are presented. An actual
Cs-137 radiation source was utilized and deployed inside a tunnel for the purposes of our experiments.
Figure 1 presents such an experiment.
WM2018 Conference, March 18 – 22, 2018, Phoenix, Arizona, USA
3
DESCRIPTION
System Overview
To accomplish radiation detection and source localization, 3D mapping and autonomous navigation, an
aerial robotic platform was developed. The robot maps and navigates using a multi-modal mapping unit
(M3U), consisting of a stereo camera pair coupled with a high-performance inertial measurement unit
(IMU), synchronized flashing LEDs to illuminate the environment, and Time-of-Flight (ToF) depth sensors
for dense environmental reconstruction. A Radiation Counting and Spectroscopy System (RCSS) was
developed to enable radiation detection and source localization on-board the aerial robot. The RCSS was
required to be lightweight and power-efficient, while capable of producing spectroscopy information as
well as counting statistics. The main processing of the image, depth, IMU, and radiation data takes place
on the robot’s Main Processing Unit (MPU). In this case, the MPU is an Intel NUC5i7RYH running Linux
with the support of the Robot Operating System (ROS), while a Pixhawk autopilot is used for the low-level
attitude control. Visual-inertial odometry is performed using the open-source package ROVIO [8], while
the open sourced linear model predictive controller in [9] is utilized for position control.
The Multi-Modal-Mapping Unit
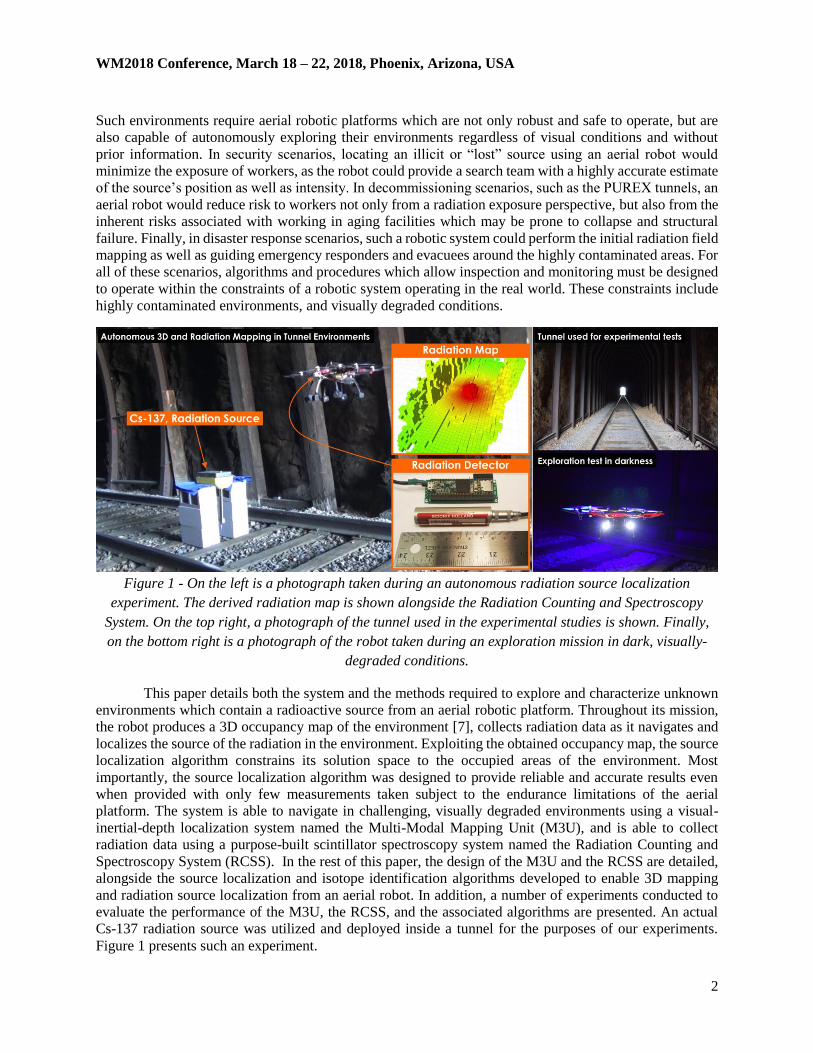
The M3U is a hardware synchronized visual-inertial-depth system capable of mapping and localization
in dark environments. Figure 2 shows the M3U and diagrams the associated components. At the heart of
the M3U is a 32-bit ARM microcontroller which produces the synchronization signals to the cameras, LEDs
and the IMU, and also transmits the IMU data to the MPU. Images are recorded in monochrome from a
pair of Global Shutter FLIR Chameleon 3 USB cameras which employ CCD (charge-coupled device)
technology in lieu of the more common CMOS (complementary metal-oxide semiconductor) sensors due
to their improved performance in dark and high dynamic range environments [10]. The cameras are
separated by a baseline of 0.08m, triggered at 20Hz, and have a shutter time of 2 msec. The IMU is triggered
at 200Hz and in a way such that every camera frame corresponds to an IMU frame taken in the middle of
the camera’s shutter. The stereo camera system is supplemented by a variable number of ToF Picoflexx
depth sensors which provide a dense representation of the environment. Depending on the requirements of
the mission, the M3U can utilize between one and three ToF sensors. Integration of three such depth sensors
leads to very wide field of view which makes the system optimized for tunnel exploration.
Figure 2 - Diagram showing the components of the Multi-Modal Mapping Unit (M3U). The M3U
consists of a pair of stereo cameras hardware synchronized with an Inertial Measurement Unit,
Ultra-bright LEDs, and one to three Time-Of-Flight depth sensors.
WM2018 Conference, March 18 – 22, 2018, Phoenix, Arizona, USA
4
In a tunnel, the environment is long but narrow, and therefore a system with wide field of view will
reduce the amount of yaw motion required for mapping which greatly improves the exploration rate and
range of the robot. Finally, the M3U is enclosed within a structure made of both 3D-printed nylon and
carbon fiber, which assures structural rigidity while minimizing any additional weight.
Radiation Counting & Spectroscopy System
The Radiation Counting and Spectroscopy System consists of a scintillator interfaced with custom
designed electronics for counting and spectroscopy data. The detector chosen is a Thallium-doped, Cesium-
Iodide Scintillation Crystal, a Silicon Photomultiplier (SiPm) and a preamplifier in a small cylindrical
package from Scionix. The scintillator itself weighs only 18g, and measures 66mm long and 16mm wide.
This scintillator offers spectroscopy-grade energy resolution, is lightweight, and consumes less than 0.4W.
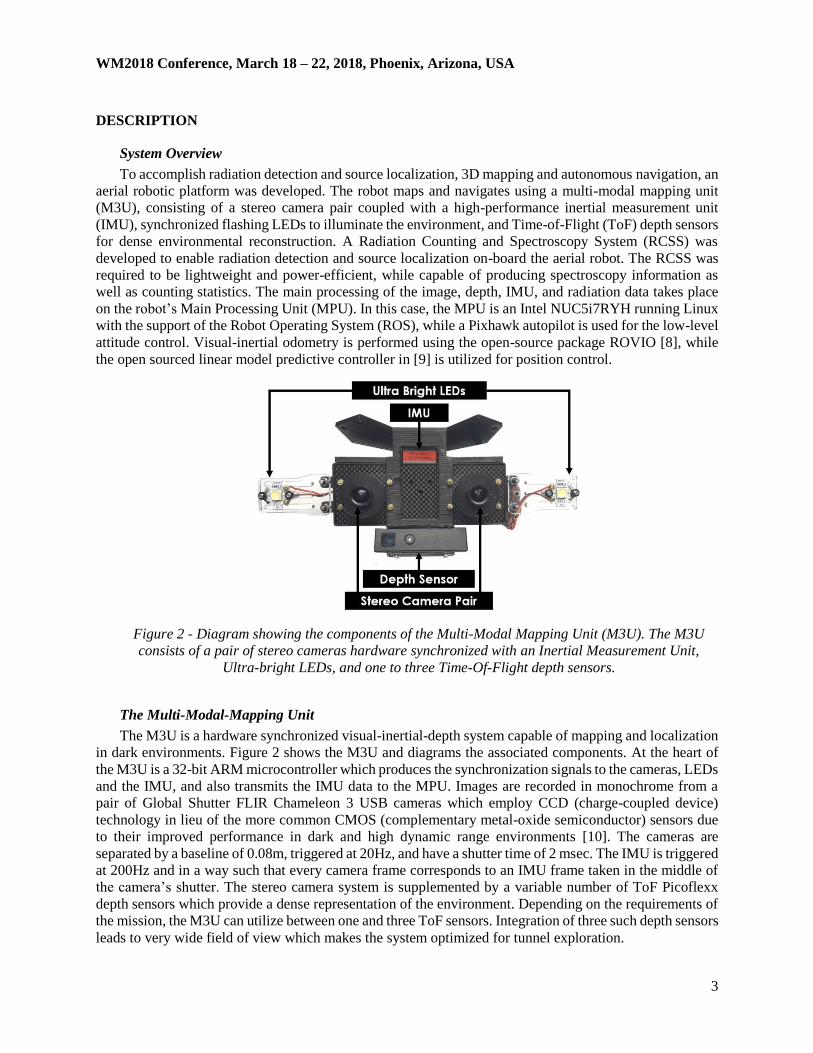
A custom microcontroller circuit was designed to interface with the scintillator and provide both count-rate
and spectroscopy information to the robot’s MPU. Figure 3 depicts an architectural diagram of the RCSS.
The circuit consists of a series of 32 comparators which compare the scintillator’s output signal against
a series of reference voltages generated by two Digital-to-Analog Converters (DAC) on a 32-bit ARM
microcontroller. This microcontroller counts the outputs from the comparators providing both the timing
of pulses, as well as amplitude information for spectroscopy to the MPU. The use of the two DACs on the
RCSS’s microcontroller allows the system to vary the position and resolution of the reference voltages to
tune the spectroscopy data for a specific energy range. In total, the RCSS, including the scintillator and all
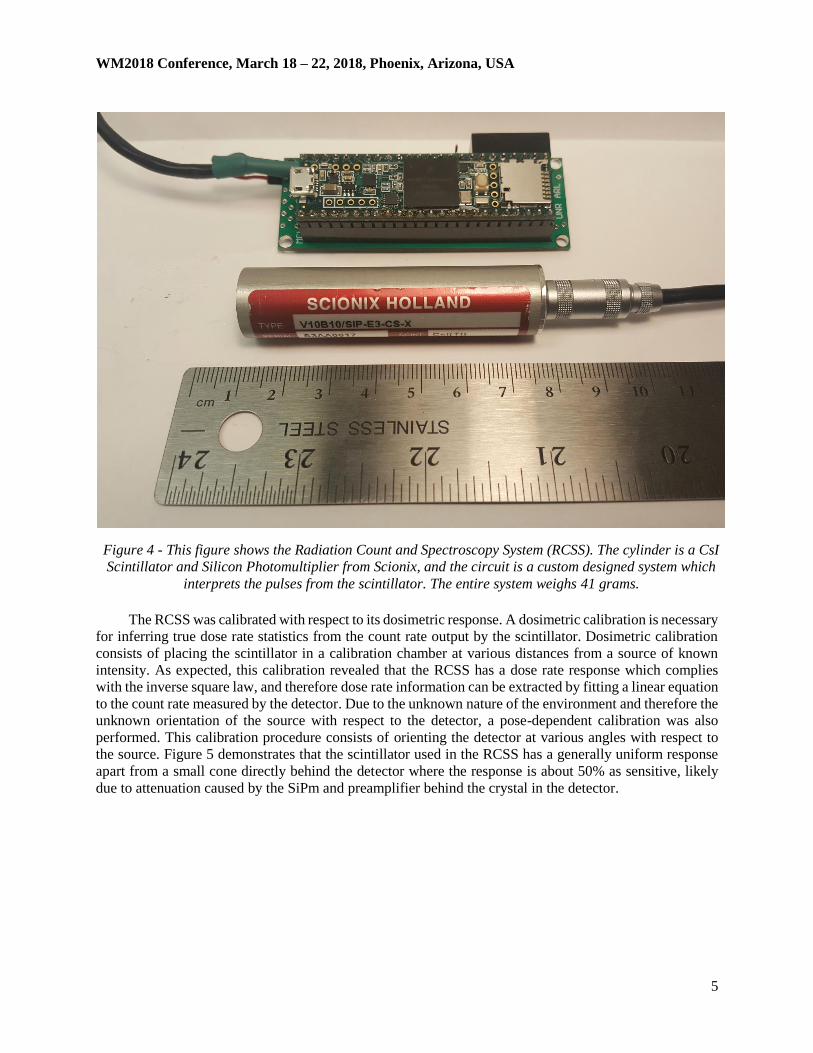
associated circuitry weighs only 41 grams. Figure 4 is a photograph showing the CsI scintillator and the
counting and spectroscopy circuit.
Figure 3 - The high level architecture of the Radiation Count and Spectroscopy System (RCSS). A voltage
pulse is output from the detector to the count and spectroscopy circuitry. A comparator array allows the
microcontroller to log the height and frequency of the pulse.
WM2018 Conference, March 18 – 22, 2018, Phoenix, Arizona, USA
5
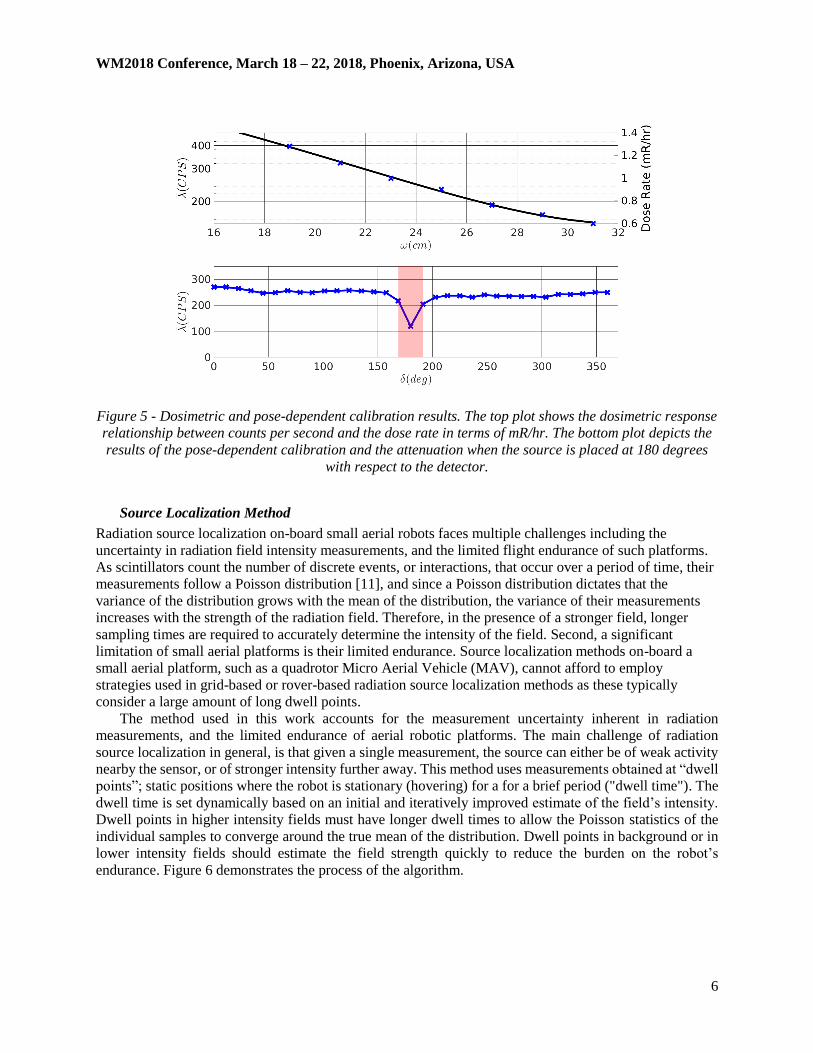
The RCSS was calibrated with respect to its dosimetric response. A dosimetric calibration is necessary
for inferring true dose rate statistics from the count rate output by the scintillator. Dosimetric calibration
consists of placing the scintillator in a calibration chamber at various distances from a source of known
intensity. As expected, this calibration revealed that the RCSS has a dose rate response which complies
with the inverse square law, and therefore dose rate information can be extracted by fitting a linear equation
to the count rate measured by the detector. Due to the unknown nature of the environment and therefore the
unknown orientation of the source with respect to the detector, a pose-dependent calibration was also
performed. This calibration procedure consists of orienting the detector at various angles with respect to
the source. Figure 5 demonstrates that the scintillator used in the RCSS has a generally uniform response
apart from a small cone directly behind the detector where the response is about 50% as sensitive, likely
due to attenuation caused by the SiPm and preamplifier behind the crystal in the detector.
Figure 4 - This figure shows the Radiation Count and Spectroscopy System (RCSS). The cylinder is a CsI
Scintillator and Silicon Photomultiplier from Scionix, and the circuit is a custom designed system which
interprets the pulses from the scintillator. The entire system weighs 41 grams.
WM2018 Conference, March 18 – 22, 2018, Phoenix, Arizona, USA
6
Figure 5 - Dosimetric and pose-dependent calibration results. The top plot shows the dosimetric response
relationship between counts per second and the dose rate in terms of mR/hr. The bottom plot depicts the
results of the pose-dependent calibration and the attenuation when the source is placed at 180 degrees
with respect to the detector.
Source Localization Method
Radiation source localization on-board small aerial robots faces multiple challenges including the
uncertainty in radiation field intensity measurements, and the limited flight endurance of such platforms.
As scintillators count the number of discrete events, or interactions, that occur over a period of time, their
measurements follow a Poisson distribution [11], and since a Poisson distribution dictates that the
variance of the distribution grows with the mean of the distribution, the variance of their measurements
increases with the strength of the radiation field. Therefore, in the presence of a stronger field, longer
sampling times are required to accurately determine the intensity of the field. Second, a significant
limitation of small aerial platforms is their limited endurance. Source localization methods on-board a
small aerial platform, such as a quadrotor Micro Aerial Vehicle (MAV), cannot afford to employ
strategies used in grid-based or rover-based radiation source localization methods as these typically
consider a large amount of long dwell points. The method used in this work accounts for the measurement uncertainty inherent in radiation
measurements, and the limited endurance of aerial robotic platforms. The main challenge of radiation
source localization in general, is that given a single measurement, the source can either be of weak activity
nearby the sensor, or of stronger intensity further away. This method uses measurements obtained at “dwell
points”; static positions where the robot is stationary (hovering) for a for a brief period ("dwell time"). The
dwell time is set dynamically based on an initial and iteratively improved estimate of the field’s intensity.
Dwell points in higher intensity fields must have longer dwell times to allow the Poisson statistics of the
individual samples to converge around the true mean of the distribution. Dwell points in background or in
lower intensity fields should estimate the field strength quickly to reduce the burden on the robot’s
endurance. Figure 6 demonstrates the process of the algorithm.
WM2018 Conference, March 18 – 22, 2018, Phoenix, Arizona, USA
7
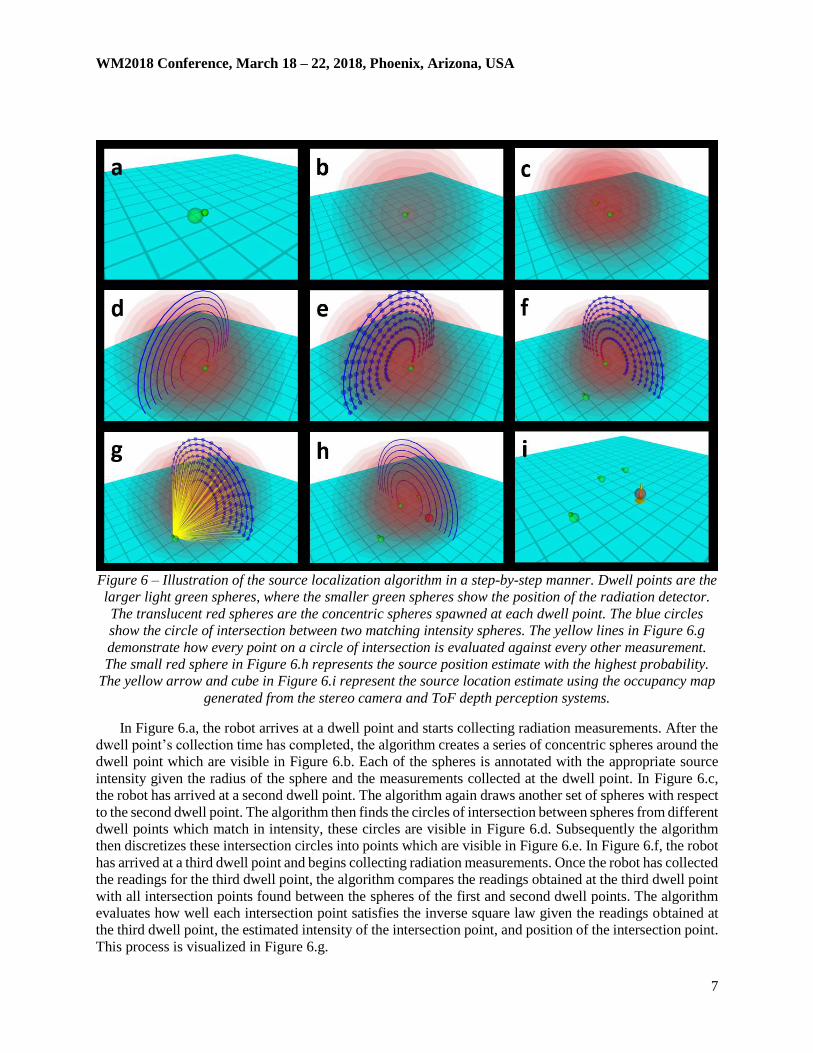
Figure 6 – Illustration of the source localization algorithm in a step-by-step manner. Dwell points are the
larger light green spheres, where the smaller green spheres show the position of the radiation detector.
The translucent red spheres are the concentric spheres spawned at each dwell point. The blue circles
show the circle of intersection between two matching intensity spheres. The yellow lines in Figure 6.g
demonstrate how every point on a circle of intersection is evaluated against every other measurement.
The small red sphere in Figure 6.h represents the source position estimate with the highest probability.
The yellow arrow and cube in Figure 6.i represent the source location estimate using the occupancy map
generated from the stereo camera and ToF depth perception systems.
In Figure 6.a, the robot arrives at a dwell point and starts collecting radiation measurements. After the
dwell point’s collection time has completed, the algorithm creates a series of concentric spheres around the
dwell point which are visible in Figure 6.b. Each of the spheres is annotated with the appropriate source
intensity given the radius of the sphere and the measurements collected at the dwell point. In Figure 6.c,
the robot has arrived at a second dwell point. The algorithm again draws another set of spheres with respect
to the second dwell point. The algorithm then finds the circles of intersection between spheres from different
dwell points which match in intensity, these circles are visible in Figure 6.d. Subsequently the algorithm
then discretizes these intersection circles into points which are visible in Figure 6.e. In Figure 6.f, the robot
has arrived at a third dwell point and begins collecting radiation measurements. Once the robot has collected
the readings for the third dwell point, the algorithm compares the readings obtained at the third dwell point
with all intersection points found between the spheres of the first and second dwell points. The algorithm
evaluates how well each intersection point satisfies the inverse square law given the readings obtained at
the third dwell point, the estimated intensity of the intersection point, and position of the intersection point.
This process is visualized in Figure 6.g.
WM2018 Conference, March 18 – 22, 2018, Phoenix, Arizona, USA
8
The algorithm thereby finds the probability of obtaining the measurement at the third dwell point if a source
of the expected intensity was found at the intersection point. The intersection points with the highest
probabilities are then found and their centroid is used as the source location estimate, as visualized in Figure
6.h using a red sphere. Finally, in Figure 6.i, the algorithm finds the closest occupied voxel to the source
position estimate using the occupancy map from the mapping solution, and uses this new position as its
radiation source position estimate.
This source localization method addresses two important challenges of aerial robotic radiation source
localization. First, with respect to radiation measurement uncertainty, the method utilizes an adaptive dwell
time process to dynamically adjust measurement periods dependent on an initial estimate of the field at the
measurement point. Second, the method was found to efficiently deal with the limited endurance of the
robot by requiring as few as three measurements to obtain a reliable estimate of the source’s position, and
by adaptively tuning the dwell times to measure stronger fields for longer periods of time.
Source Identification Method
To suit scenarios in which the identity of the source isotope is unknown, a source identification method
was developed. Using the spectroscopy information obtained from the RCSS, identification of the particular
source isotope is performed using a least-square-error fit. The standard energy calibration procedure for
scintillators and multi-channel-analyzers consists of exposing the scintillator to sources of known energies,
finding the channels which corresponds to the peak energies of the sources, and extrapolating the
corresponding energies for each channel. As these experiments only seek to identify the source isotope, the
exact energy calibration is unnecessary. Instead, the energy calibration in this work involves exposing the
detector to the isotopes of interest.
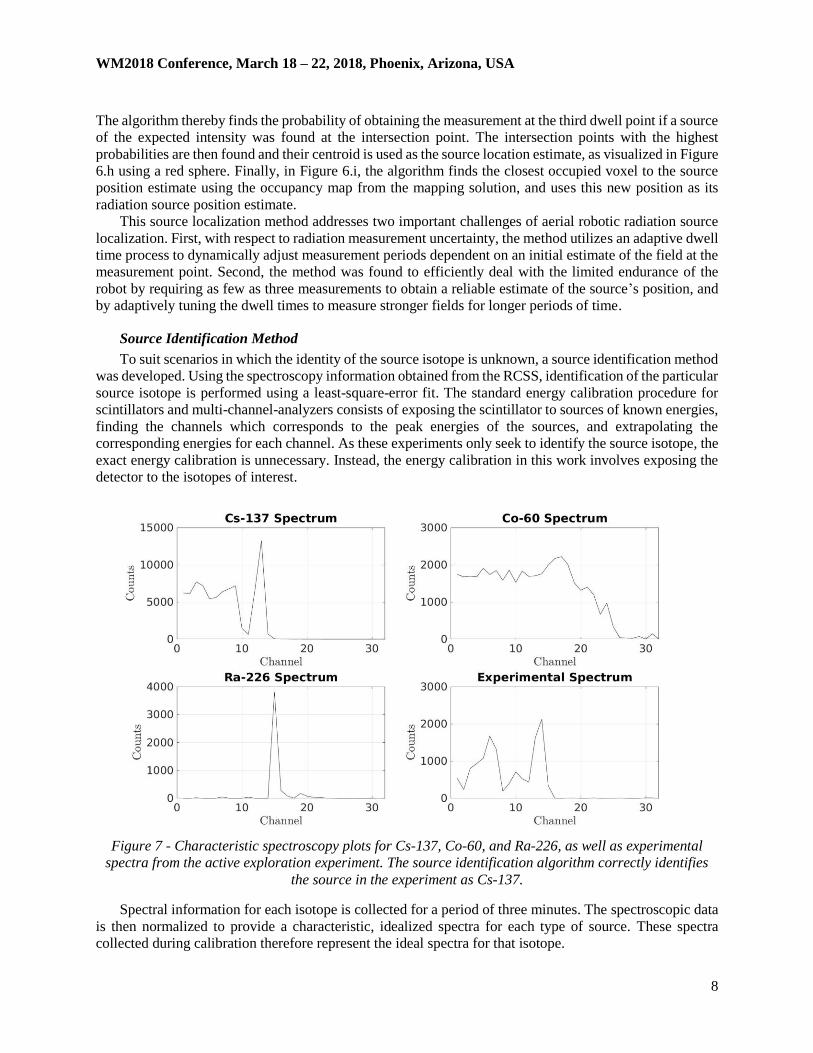
Figure 7 - Characteristic spectroscopy plots for Cs-137, Co-60, and Ra-226, as well as experimental
spectra from the active exploration experiment. The source identification algorithm correctly identifies
the source in the experiment as Cs-137.
Spectral information for each isotope is collected for a period of three minutes. The spectroscopic data
is then normalized to provide a characteristic, idealized spectra for each type of source. These spectra
collected during calibration therefore represent the ideal spectra for that isotope.
WM2018 Conference, March 18 – 22, 2018, Phoenix, Arizona, USA
9
If the robot had an infinite amount of time to dwell and measure a source’s spectra it would approach these
ideal spectra assuming the field is not attenuated, the background field doesn’t have strong energy
characteristics, and the sensor is noise free. The first three plots in Figure 7 show the ideal energy spectra
for Cs-137, Co-60, and Ra-226 before normalization. During flight, as the robot collects the spectroscopic
data from the scintillator, it first performs normalization and then an analysis that relies on least-squares-
error minimization principles is run on the data collected against the characteristic spectra collected for
each source type. This data, collected during the active exploration experiment, is shown in the bottom right
of Figure 7. The analysis consists of calculating the average squared error across all channels between the
experimental data and the idealized spectra for each isotope. The comparison result which has the smallest
average error is determined to be the isotope which is causing the observed measurements, and the source
position estimate from the localization algorithm is further annotated with the isotope identity of the source.
EXPERIMENTAL RESULTS
A series of experiments were conducted to validate the performance of the M3U and the RCSS alongside the associated algorithms for mapping and source localization, as well as based on the integration
of autonomous exploration path planning functionalities. All experiments were conducted inside the Yellow
Jacket Tunnel, a train tunnel located in Virginia City, Nevada. The tunnel is approximately 4.25m wide,
7.5m tall, and 137m long. The tunnel features a standard rail track in the center of the tunnel, and exposed
rock walls with wooden beams and steel ribbing representing a realistic and challenging environment both
for navigation and mapping, as well as for radiation source localization.
Degraded Visual Environment Exploration
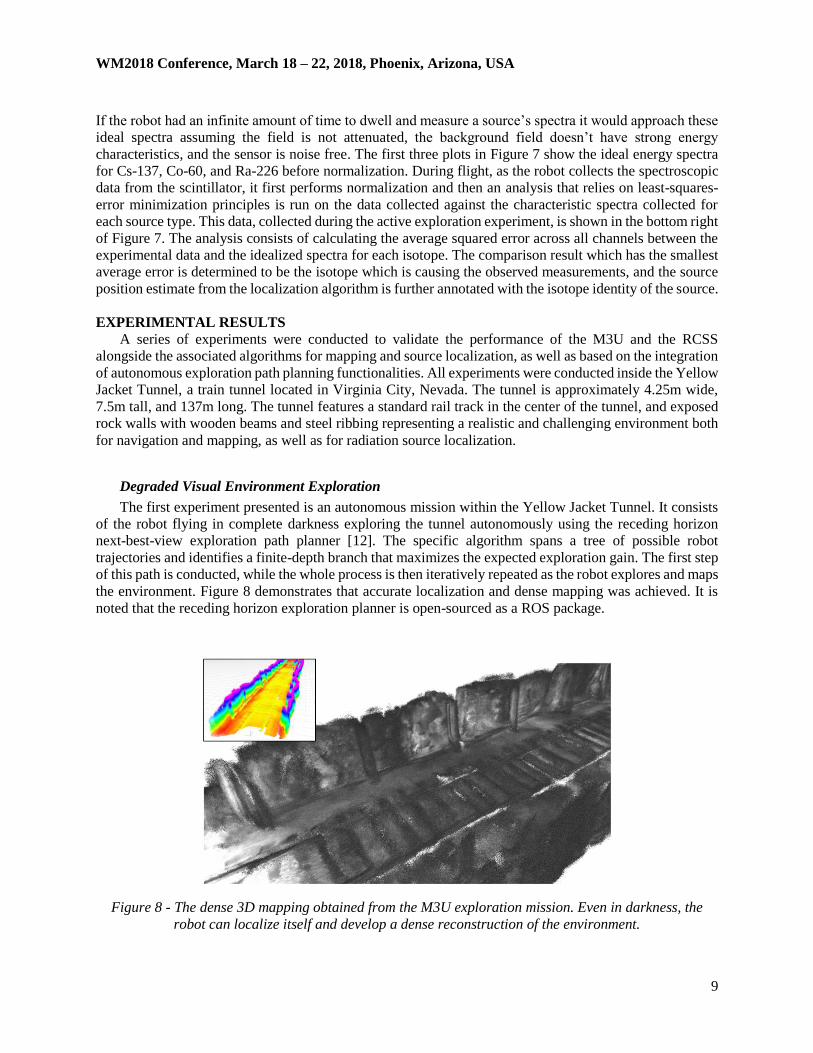
The first experiment presented is an autonomous mission within the Yellow Jacket Tunnel. It consists
of the robot flying in complete darkness exploring the tunnel autonomously using the receding horizon
next-best-view exploration path planner [12]. The specific algorithm spans a tree of possible robot
trajectories and identifies a finite-depth branch that maximizes the expected exploration gain. The first step
of this path is conducted, while the whole process is then iteratively repeated as the robot explores and maps
the environment. Figure 8 demonstrates that accurate localization and dense mapping was achieved. It is
noted that the receding horizon exploration planner is open-sourced as a ROS package.
Figure 8 - The dense 3D mapping obtained from the M3U exploration mission. Even in darkness, the
robot can localize itself and develop a dense reconstruction of the environment.
WM2018 Conference, March 18 – 22, 2018, Phoenix, Arizona, USA


![Future Research Perspectives With Autonomous, Intelligent Humanoid Robots [Presentation at EYE Lab Surfing Workshop]](https://static.documents.pub/doc/80x56/55944d761a28ab596f8b46bb/future-research-perspectives-with-autonomous-intelligent-humanoid-robots-presentation-at-eye-lab-surfing-workshop.jpg)


