Page 1
ABSTRACT BOWEN, LIESSA THOMAS. Seasonal Relationships Between Birds and Arthropods in Bottomland Forest Canopy Gaps. (Under the direction of Christopher E. Moorman and Daniel J. Robison.)
I investigated the influence of arthropod availability and vegetation structure on
avian habitat use at the center, edge, and adjacent to forest canopy gaps in 2001 and 2002. I
used mist-netting and plot counts to estimate abundance of birds using three sizes (0.13,
0.26, and 0.5 ha) of 7-8 year old group-selection timber harvest openings during four
seasons (spring migration, breeding, post-breeding, and fall migration) in a bottomland
hardwood forest in the Upper Coastal Plain of South Carolina. I used foliage clipping,
Malaise trapping, and pitfall trapping to determine arthropod abundance within each habitat,
and I used a warm water crop-flush on captured birds to gather information about arthropods
eaten.
I observed more birds, including forest interior species, forest-edge species, field-
edge species, and several individual species, in early-successional canopy gap and gap-edge
habitats than in surrounding mature forest during all seasons. I found a significant
interaction between season and habitat type for several groups and individual species,
suggesting a seasonal shift in habitat use. Captures of all birds, insectivorous birds, foliage-
gleaners, ground-gleaners, aerial salliers, Hooded Warbler (Wilsonia citrina), Northern
Cardinal (Cardinalis cardinalis), White-eyed Vireo (Vireo griseus), and Black-throated Blue
Warbler (Dendroica caerulescens) were positively correlated with understory vegetation
density during two or more seasons. I found relationships between insectivorous birds and
leaf-dwelling Lepidoptera, insectivorous birds and ground-dwelling arthropods, foliage-
gleaning birds and foliage-dwelling arthropods, and aerial salliers and flying arthropods, as
Page 2
well as between individual bird species and arthropods. Relationships were inconsistent,
however, with many species being negatively correlated with arthropod abundance.
Coleopteran, Lepidopteran, and Aranid prey items represented the greatest proportions of
crop-flush samples during all seasons. Proportional consumption of Coleopteran and
Hemipteran prey items was higher than their proportional availability, and consumption of
Aranid and Hymenopteran prey items was lower than their proportional availability during
all seasons. Individual bird species and guilds consistently consumed similar proportions of
certain groups of arthropods from spring through fall migration, with no apparent seasonal
shift in diet composition.
My research suggests that many species of birds selectively choose mid-successional
gap and gap-edge habitat over surrounding mature forest during the non-breeding season,
and the creation of small canopy gaps within a mature forest may increase local bird species
richness. It is less obvious how arthropod availability affects bird habitat use across
seasons. A structurally diverse mosaic of habitat types, including regenerating canopy gaps
within a mature forest, may provide valuable habitat for birds and a variety of arthropod
prey items across multiple seasons.
Page 3
SEASONAL RELATIONSHIPS BETWEEN BIRDS AND ARTHROPODS IN BOTTOMLAND FOREST CANOPY GAPS
by LIESSA THOMAS BOWEN
A dissertation submitted to the Graduate Faculty of North Carolina State University
in partial fulfillment of the requirements for the Degree of
Doctor of Philosophy
FORESTRY
Raleigh
2004
APPROVED BY:
______________________________ _____________________________ John Kilgo Richard Lancia
______________________________ _____________________________ Theodore Simons Daniel Robison
Co-chair of Advisory Committee
_____________________________ Christopher Moorman
Co-chair of Advisory Committee
Page 4
ii
BIOGRAPHY
I am very happy to have completed my PhD from North Carolina State University.
My interest in nature began in early childhood during family weekend retreats in rural
Washington County, Missouri, collecting frogs, fish, crawdads, and aquatic insects from a
small stream. My first biological internship was at the University of Chicago, assisting with
a study of inbreeding depression in two species of morning glory. My first position as a
field technician for a bird project was located on the rainforest-covered slopes of Mauna Kea
volcano on the Big Island of Hawaii. After that incredible experience, I was definitely
hooked on both birds and field research. Other biology-related jobs have included studying
aquatic insect larvae in Illinois, bird nesting success in Iowa and Wisconsin, plant
conservation in Missouri, and public outreach in Virginia. I received my MS degree from
Iowa State University in 1999 for my work studying bird response to a large-scale tallgrass
prairie restoration. My career goal includes a combination of field research, birds,
conservation, public outreach, writing, and photography. Personal interests include folk
music and dance, hiking, camping, and exploring the outdoors, and being a very involved
parent of a wonderful little boy.
Page 5
iii
ACKNOWLEDGMENTS
First of all, a big thank you to my advisor, Dr. Christopher Moorman, who accepted
me as his first PhD student. Thanks to my advisory committee, John Kilgo, Dick Lancia,
Ted Simons, and Dan Robison, for sticking with me and helping make this a very positive
experience. Thanks to Jean Pittman and Diane Brady for logistical assistance throughout
my field seasons and beyond. Thanks to my family and friends for offering many positive
words of encouragement, particularly my husband, Russ, for an abundance of good karma
and moral support. Thanks to my field crew who tolerated some long days of heat,
humidity, biting bugs, venomous snakes, vehicle breakdowns, and boredom: Krissy Mack,
Tracey Champlin, Darcie Westerman, and Steph Junker. Thanks to Marcia Gumpertz for
providing statistical consultation and Sandy Donaghy for many hours of help with SAS
programming. I offer a special recognition to the wealth of flora and fauna I encountered,
which always makes fieldwork so rewarding.
Financial support for this project was provided by the USDA CSREES National
Research Initiative Competitive Grants Program (Award No. 00-35101-9307), North
Carolina State University, and the U.S. Forest Service Southern Research Station. Thanks to
the U.S. Department of Energy - Savannah River for providing access to the study site.
Thanks to the U.S. Forest Service - Savannah River for logistical support, particularly Ed
Olson and John Blake.
Page 6
iv
TABLE OF CONTENTS
LIST OF TABLES.............................................................................v LIST OF FIGURES ...........................................................................vi 1. SEASONAL BIRD USE OF FOREST CANOPY GAPS IN A BOTTOMLAND HARDWOOD FOREST.......................................1 Abstract...........................................................................................2 Introduction.....................................................................................3 Study Area ......................................................................................4 Methods ..........................................................................................5 Results.............................................................................................7 Discussion.......................................................................................9 Acknowledgments ..........................................................................12 Literature Cited...............................................................................13 Appendix.........................................................................................28 2. SEASONAL RELATIONSHIPS BETWEEN ARTHROPOD ABUNDANCE AND BIRD USE OF FOREST CANOPY GAPS IN A BOTTOMLAND HARDWOOD FOREST..............................31 Abstract...........................................................................................32 Introduction.....................................................................................33 Study Area ......................................................................................34 Methods ..........................................................................................35 Data Analysis..................................................................................38 Results.............................................................................................40 Discussion.......................................................................................42 Acknowledgments ..........................................................................46 Literature Cited...............................................................................47 Appendix.........................................................................................69 3. SEASONAL BIRD DIET PREFERENCES IN A BOTTOMLAND FOREST ...............................................................72 Abstract...........................................................................................73 Introduction.....................................................................................74 Methods ..........................................................................................75 Results.............................................................................................80 Discussion.......................................................................................82 Acknowledgments ..........................................................................86 Literature Cited...............................................................................86
Page 7
v
LIST OF TABLES Page Chapter 1 1. Mean plot count detections per ha ..............................................17 2. Mean captures per 100 net hours ................................................20 Chapter 2 1. Mean arthropod abundance.........................................................52 2. Relationship between bird abundance and arthropods ...............55 3 Relationship between bird abundance and vegetation.................60 Chapter 3 1. Seasonal crop-flushing bird samples ..........................................95 2. Seasonal arthropod orders consumed .........................................96
Page 8
vi
LIST OF FIGURES Page Chapter 1 1. Seasonal bird counts ...................................................................23 2. Mean bird captures .....................................................................25 3. Percent of captures per season and habitat .................................27 Chapter 2 1. Forest canopy gaps .....................................................................62 2. Foliage height profiles ................................................................63 3. Seasonal foliage gleaning birds vs. arthropods...........................64 4. Insectivores vs. Lepidopterans....................................................65 5. Ground gleaning birds vs. arthropods.........................................66 6. Aerial sallier birds vs. arthropods...............................................67 7. Seasonal foliage-gleaner birds vs. vegetation.............................68 Chapter 3 1. Photo of prey items.....................................................................91 2. Percent availability and consumption of foliage-dwelling arthropods ..................................................................................92 3. Percent availability and consumption of ground-dwelling arthropods ..................................................................................94
Page 9
1
CHAPTER 1 Seasonal bird use of canopy gaps SEASONAL BIRD USE OF FOREST CANOPY GAPS IN A BOTTOMLAND HARDWOOD FOREST Liessa T. Bowen Christopher E. Moorman John C. Kilgo Liessa T. Bowen, North Carolina State University, Department of Forestry, Campus Box 8002, Raleigh, NC 27695-8002; Christopher E. Moorman, North Carolina State University, Department of Forestry, Campus Box 8003, Raleigh, NC 27695-8003; John C. Kilgo, Research Wildlife Biologist, Southern Research Station, USDA Forest Service- Savannah River, PO Box 700, New Ellenton SC 29809 John C. Kilgo, Research Wildlife Biologist, Southern Research Station, USDA Forest Service- Savannah River, PO Box 700, New Ellenton SC 29809, [email protected]
Page 10
2
ABSTRACT
Bird use of small canopy gaps within mature forests has not been well studied,
particularly across multiple seasons. We investigated seasonal differences in bird use of
forest and gap habitat within a bottomland hardwood forest in the Upper Coastal Plain of
South Carolina. Gaps were 0.13-0.5-ha, 7 to 8-year-old group-selection timber harvest
openings. Our study occurred during four bird-use seasons (spring migration, breeding,
post-breeding, and fall migration) in 2001 and 2002. We used plot counts and mist netting
to estimate bird abundance in canopy gaps and surrounding forest habitats. Using both
survey methods, we observed more birds, including forest-interior species, forest-edge
species, field-edge species, and several individual species, in mid-successional canopy gap
and gap-edge habitats than in surrounding mature forest during all seasons. We found a
significant interaction between season and habitat type for all birds, forest interior birds,
forest-edge birds, and field-edge birds, as well as several individual species. These
interactions suggest a seasonal shift in habitat use, often as bird activity shifted between
canopy gaps and the immediate gap edge, or as the proportion of birds using forested habitat
increased during the breeding season. Our research suggests that many species of birds
selectively choose early successional gap and gap-edge habitat over surrounding mature
forest during the non-breeding season, and the creation of small canopy gaps within a
mature forest may increase local bird species richness. The reasons for increased bird
activity in gaps, however, remain unclear.
Page 11
3
Human attempts to eliminate or control natural periodic disturbance is a leading cause of
landbird declines (Askins 2000), and as a result, many disturbance-dependent birds have
been identified as species of conservation concern (Hunter et al. 2001). Many species of
birds, including several species of conservation concern that breed in mature forests, require
some amount of forest disturbance (e.g., fire, ice, or wind) resulting in treefall gaps to create
ideal habitat (Hunter et al. 2001). One type of disturbance common in mature forests is the
creation of small light gaps in the forest canopy, often caused by natural treefall
occurrences. Canopy gaps created by small-scale timber harvest operations may mimic
these natural disturbances, providing different microclimates and habitat patches, leading to
a unique assortment of gap-associated flora and fauna (Watt 1947; Canham et al. 1990).
Birds select habitat based largely upon vegetation structure (Holmes et al. 1979), and
some may prefer early successional gap habitat based on the unique qualities of the
vegetation there (e.g., dense foliage, well-developed herb and shrub layer). Several bird
species seem to prefer small-scale canopy gap openings to mature forested habitat during
migration or the breeding season (Martin and Karr 1986; Germaine et al. 1997; Kilgo et al.
1999; Moorman and Guynn 2001). Forest canopy gaps may be used differently throughout
the year, depending on the availability of protective cover, desirable nesting habitat, or
suitable prey items (Robinson and Holmes 1982; Willson et al. 1982; Blake and Hoppes
1986).
During migration, birds pass through a series of unfamiliar habitats and tend not to
spend much time in any one location (Moore et al. 1993). Habitat selection during this time
may be influenced by accessible food resources, competition with other species, and risk of
predation (Petit 2000). During the breeding season, birds require habitat with suitable
Page 12
4
nesting sites. Early-successional-nesting birds, such as Common Yellowthroat and Indigo
Bunting, use regenerating canopy gaps for nesting (Moorman and Guynn 2001). During the
post-breeding period, adult birds may select densely vegetated habitats as refugia during
their molt (Vega Rivera et al. 1999), and young birds may seek the protective cover from
predators offered by gaps (Anders et al. 1998; Vega Rivera et al. 1998), as each group is
particularly vulnerable during these times.
The use of artificial, small-scale disturbances by birds within mature forests has not
been well studied, particularly across multiple seasons. Approximately 70 species of birds
use bottomland hardwood forests for breeding (Pashley and Barrow 1993), and bottomland
forests typically contain higher densities of birds than adjacent upland forests in all seasons
(Dickson 1978). Our goal was to determine relative use of gap and forest habitat by birds
during four seasons (spring, breeding, post-breeding, and fall) within a bottomland
hardwood forest. This study should aid land managers in assessing habitat needs for certain
bird species that use bottomland forests for migration or breeding.
STUDY AREA
We studied birds during 2001 and 2002 at the Savannah River Site (SRS), a 78000-
ha National Environmental Research Park owned and operated by the U. S. Department of
Energy. Our study site was a mature stand of bottomland hardwoods approximately 120 ha
in size, and located in Barnwell County in the Upper Coastal Plain of South Carolina. Birds
were surveyed in 12 group-selection gaps harvested in December 1994 and in the mature
forest adjacent to gaps. The gaps were of three sizes (0.13, 0.26, and 0.50 ha) with four
replicates of each size. It is within this size range that previous research has identified a
threshold in response by breeding (Moorman and Guynn 2001) and fall migrant birds (Kilgo
Page 13
5
et al. 1999). The mature forest canopy was dominated by laurel oak (Quercus laurifolia),
cherrybark oak (Q. falcata var. pagodaefolia), sweetgum (Liquidambar styraciflua), and
loblolly pine (Pinus taeda). The midstory was poorly developed, consisting primarily of red
mulberry (Morus rubra), ironwood (Carpinus carolinianus), and American holly (Ilex
opaca). The understory was dominated by dwarf palmetto (Sabal minor) and switchcane
(Arundinaria gigantea). Vegetation in the gaps was approximately 1-8 m in height and was
dominated by regenerating trees (primarily sweetgum, loblolly pine, sycamore [Platanus
occidentalis], green ash [Fraxinus pennsylvanica], oaks, and black willow [Salix nigra]) and
dense stands of blackberry (Rubus spp.), dwarf palmetto, and switchcane.
METHODS
We surveyed birds during four avian activity periods in 2001 and 2002: spring
migration (25 March through 15 May), breeding (16 May through 30 June), post-breeding (1
July through 31 August), and fall migration (1 September through 18 October).
Plot counts.-
Plot counts were conducted within each of the 12 experimental gaps and within 12
forested control plots of equivalent size. The 12 forested control plots were randomly
placed a minimum of 100 m from the nearest gap center within the mature forest
surrounding the study gaps. The forest plot perimeters were flagged so that observers could
easily determine plot boundaries. Each of the 24 plot count plots was visited three times
during each season and counts were averaged over the three visits. For approximately one
half of the plot counts and equally distributed across treatment types, two observers walked
slowly around the perimeter of each plot. When the observers met on the opposite side of
the plot, they compared observations and agreed upon a total number of each bird species
Page 14
6
observed within the gap/edge habitat. When only one observer was available, the single
observer walked slowly around the entire plot, recording all birds seen and heard. At both
forest and gap plots, birds observed within the actual plot and at the immediate edge (0-10 m
from the bole line or flagged boundary into the forest) were included in the count. Larger
plots and plots with more bird activity took longer to survey.
Mist netting.-
Constant effort mist nets were located at each of three sampling stations (gap, edge,
and forest) at each of the 12 study gaps. During the spring migration, post-breeding, and fall
migration seasons, netting was conducted once each week at each station, rotating between
stations on a regular weekly schedule. During the breeding season, nets were operated once
every two weeks because birds tend to remain fairly stationary during this period. Nets were
opened at first light and operated for 4-6 h, depending on daily weather conditions. Netting
was not conducted when wind exceeded 16 km per hour or during steady rainfall. Nets were
12-m long x 3-m tall, with 30-mm mesh. Captured birds were aged and sexed (Pyle et al.
1987), weighed, and banded with a USGS Biological Resources Division aluminum leg
band.
Statistical analysis.-
We used a linear mixed model (PROC MIXED, SAS Institute 1990) to perform
repeated measures analysis of variance (ANOVA). We analyzed the effects of habitat type,
season, and the interaction between habitat and season on bird abundance. For mist-netting
data analysis, habitats included gap, edge, and forest; for plot count data analysis, habitats
included gap/edge and forest. We used mean captures per 100 net hours as the dependent
variable for mist-netting analyses and mean birds per ha as the dependent variable for plot
Page 15
7
count analyses. We considered habitat type and season as fixed effects, with habitat type as
a split plot factor and season as the repeated measure. Year was not significant (p>0.05), so
years were pooled in the final analyses, and these pooled data are represented in tables and
figures.
Birds were assigned to habitat-use groups (Appendix 1): (1) all birds, (2) forest
interior species, (3) forest-edge species, and (4) field-edge species (Ehrlich et al. 1988;
Hamel 1992). We analyzed mist-netting captures and plot count detections for each group.
Individual species (see scientific names in Appendix 1) were chosen for analysis if they
accounted for at least 80 detections over both years for plot counts (Blue-gray Gnatcatcher,
Carolina Wren, Eastern Tufted Titmouse, Northern Cardinal, Northern Parula, and White-
eyed Vireo) or at least 80 captures over both years for mist netting (Black-throated Blue
Warbler, Carolina Wren, Hooded Warbler, Kentucky Warbler, Northern Cardinal, and
White-eyed Vireo). Birds considered winter residents, present only in early spring or late
fall, were not included in analyses.
RESULTS
Plot counts.-
From April through October, 2001 and 2002, we counted 1711 individuals
representing 70 species in gap/edge habitat and 38 species in forest habitat. We detected
more individuals in the gaps than in the surrounding forest during all seasons for all bird
groups and individual species analyzed (Table 1; Fig. 1). The abundance of forest-interior
birds, field-edge birds, Blue-gray Gnatcatcher, Carolina Wren, Eastern Tufted Titmouse,
Northern Cardinal, and Northern Parula differed among seasons, but no consistent patterns
were evident, as seasonal use varied considerably by species or group (Table 1). We
Page 16
8
documented a significant interaction between season and habitat type for field-edge birds,
Blue-gray Gnatcatcher, and Northern Parula (Table 1). Field-edge birds were detected most
often during spring and fall migration and primarily in gap/edge habitat. The greatest
proportion of forest detections of field-edge birds occurred during the post-breeding season.
Blue-gray gnatcatcher was most abundant in gap/edge habitat during all seasons, but forest
detections dropped to almost zero during fall migration. Northern Parula used both
gap/edge and forest habitat during spring migration and breeding season, and then dropped
to near zero occurrence in the forest during the post-breeding season and fall migration.
Mist netting.-.
From April through October, 2001 and 2002, during 7669 net hours, we recorded
1476 captures representing 56 species. We captured 55 species in gap/edge habitat and 26
species in forest habitat across all seasons. We captured more individuals in the gaps and at
their edges than in the surrounding forest during all seasons for all bird groups and
individual species except for Carolina Wren, which was captured more frequently at edge or
forest habitats than gaps during all seasons (Table 2; Fig. 2). Number of captures differed
among seasons for all groups and species analyzed except Kentucky Warbler and Northern
Cardinal, with most groups being most frequently captured during spring (Table 2). There
was an interaction between season and habitat type, suggesting a seasonal shift in habitat
use, for all birds, forest interior birds, forest-edge birds, field-edge birds, Black-throated
Blue Warbler, and Kentucky Warbler (Table 2). Some species (e.g., forest interior
specialists and Kentucky Warbler) shifted from gap during spring migration to edge during
the breeding season, and back to gap habitat after the breeding season. Forest-edge birds
were most abundant in the gap habitat during spring and fall migration, but both gap and
Page 17
9
edge were used equally during the breeding and post-breeding seasons. Total mist-net
captures tended to shift slightly between gap and edge habitat (gap during spring and fall
migratory periods, edge during breeding and post-breeding), with forest captures
representing just a small proportion of captures during each season. The highest proportion
of forest captures, however, occurred during the breeding season (Fig. 3). Forest interior
birds, forest-edge birds, Carolina Wren, and Hooded Warbler used forested habitat most
during the breeding season as well.
DISCUSSION
We observed and captured more birds in gap and gap-edge habitat than in the
surrounding mature forest during all bird-use seasons. Generally, bird detections in edge
habitat were more similar to detections in gap habitat than forested habitat. Carolina Wren
was the only species to show a distinct forest/edge preference, but based only upon mist-
netting captures. Many birds that are forest interior specialists or forest breeders, for
example, may seek out early successional habitats for foraging or shelter outside of the
breeding season. Other studies also have reported more bird activity in gaps than mature
forest, including migrating foliage gleaning insectivores (Willson et al. 1982; Blake and
Hoppes 1986; Martin and Karr 1986), fall migrants (Kilgo et al. 1999), breeding birds
(Smith and Dallman 1996; Germaine et al. 1997; King et al. 2001; Moorman and Guynn
2001) and post-breeding birds (Anders et al. 1998; Vega Rivera et al. 1998, 1999, 2003;
Pagen et al. 2000). Migrating birds also may prefer forest edge habitat to forest interior
habitat during fall migration (Rodewald and Brittingham 2002). Other researchers have
found that individual species, including Hooded Warbler (Annand and Thompson 1997;
Robinson and Robinson 1999), Carolina Wren (Robinson and Robinson 1999; Moorman
Page 18
10
and Guynn 2001), and White-eyed Vireo (Robinson and Robinson 1999; Moorman and
Guynn 2001) use regenerating group selection openings more than mature forest during the
breeding season. Hooded Warblers breed in the forest understory on our site (Moorman et
al. 2002), but were often seen foraging in the gap habitat during all seasons, and with young
in gap habitat during the post-breeding season (L. T. Bowen, pers. obs.).
It is possible that we captured more birds in gap habitat than forest habitat because of
differences in habitat structure (Remsen and Good 1996). Birds using the low early
successional vegetation within the gaps were more available for sampling with a 3-m high
net than birds in the forest. However, comparisons among seasons at a given location are
not subject to this potential bias. Additionally, our plot counts corroborated our mist-net
data; they sampled both the understory and canopy and also detected more birds using gap
habitat than forest habitat. Plot counts also included birds using the immediate edge of gaps,
a mix of habitat types and vegetation structures, which may have attracted forest-interior
birds more than the actual gap center. Detectability of birds in gaps during plot counts likely
was lower than in the forest because of the dense vegetation in the gaps, so our estimates of
bird use of gaps may actually be conservative. Seasonal differences in both bird captures
and plot counts may be attributed, in part, to more birds being available during spring and
fall migratory periods, yet within each season during this study, we consistently detected
more birds using the canopy gaps than forest.
While most birds used gap and edge habitat more than forested habitat during all
seasons, we also detected a seasonal shift in habitat use for several groups, as proportions of
gap, edge, and forest captures varied between seasons. Generally, bird use of gap and edge
habitats was highest during spring and fall migration, while use of forested habitat tended to
Page 19
11
be greatest during the breeding season and lowest during the post-breeding period. Other
researchers have documented seasonal shifts in habitat use between the breeding and post-
breeding periods, particularly as fledgling birds moved from forested habitat into early and
mid-successional habitats (Anders et al. 1998; Vega Rivera et al. 1998, 2003; Pagen et al.
2000), possibly in search of greater cover or more abundant food resources. Regenerating
forest canopy gaps may provide a necessary habitat type for birds during these seasons of
increased mobility, such as migration and post-breeding dispersal.
Gap interiors were not only densely vegetated, but also contained mid-successional
fruiting species (e.g., sumac and blackberry), while other fruiting species such as poison ivy
(Toxicodendron radicans) and hawthorn (Crataegus sp.) were common at the immediate
gap edge (L. T. Bowen, pers. obs.). We observed omnivorous birds eating fruits in gaps,
including American beautyberry (Callicarpa americana), flowering dogwood (Cornus
florida), grape (Vitis sp.), hawthorn, poison ivy, and winged sumac (Rhus copallinum) (L. T.
Bowen pers. obs.). Fruiting vegetation typically is most abundant in late summer to early
fall (McCarty et al. 2002). Willson et al. (1982) found that avian frugivores preferentially
visited natural forest openings during migratory periods, even when these gaps provided no
more fruit than surrounding forest habitat. We did not, however, find a corresponding shift
in habitat use for omnivorous species such as Northern Cardinal, suggesting that birds were
meeting their nutritional needs without closely following seasonal fruit availability.
The creation of 0.13- to 0.5-ha canopy gaps can be used to increase habitat diversity
within mature bottomland hardwood forest, thereby attracting a greater number of foraging,
breeding, and migrating birds. Kilgo et al. (1999) and Moorman and Guynn (2001) worked
in the same gaps at 2-5 years post-harvest and determined that larger gaps (e.g., 0.5 ha)
Page 20
12
supported greater bird abundance and species richness than uncut forest and smaller
openings, particularly those less than 0.26 ha. In our study, however, bird use did not vary
by gap size in any season. During our study, the 7-8 year-old canopy gaps were beginning
to more closely resemble the surrounding forest. As these gaps regenerate and pass through
successional stages, the bird community should also change accordingly. Robinson and
Robinson (1999) noted that long-term effects of small-scale canopy gaps upon the forest
bird community are unlikely because the regenerating forest matures and returns to pre-
harvest conditions in a relatively short time.
We found birds using regenerating canopy gaps more than mature forested habitat
during all seasons. Bird habitat use shifted slightly from gaps during spring migration to
forest during breeding season, then back to gaps during post-breeding season and fall
migration. Reasons for these habitat selections and seasonal shifts, however, remain
speculative. It is possible that omnivorous birds use canopy gaps more during seasons of
high fruit availability, but fruiting production within our canopy gaps was relatively low
highly seasonal. Rather, we suspect birds may select regenerating canopy gaps for the
protection offered by these densely vegetated areas, particularly during seasons of
vulnerability, such as during migratory periods as birds move through unfamiliar areas and
during the post-fledging periods when young are more vulnerable to predators.
ACKNOWLEDGMENTS
Financial support for this project was provided by the USDA CSREES National
Research Initiative Competitive Grants Program (Award No. 00-35101-9307), North
Carolina State University, and the U.S. Forest Service Southern Research Station. We thank
the U.S. Department of Energy - Savannah River for providing access to the study site and
Page 21
13
the U.S. Forest Service - Savannah River for logistical support, with a special thank you to
John Blake and Ed Olson. We thank R. Lancia, D. Robison, and T. Simons for reviewing
this manuscript. We are grateful for field assistance from T. Champlin, S. Junker, K. Mack,
and D. Westerman, and for statistical assistance from S. Donaghy, M. Gumpertz, and J.
Sloan.
LITERATURE CITED
American Ornithologists’ Union. 1998. Check-list of North American Birds, 7th ed.
American Ornithologists’ Union, Washington, D.C.
Anders, A. D., J. Faaborg, and F. R. Thompson III. 1998. Postfledging dispersal, habitat use,
and home-range size of juvenile wood thrushes. Auk 115:349-358.
Annand, E. M. and F. R. Thompson III. 1997. Forest bird response to regeneration practices
in central hardwood forests. J.Wildl. Manage. 61:159-171.
Askins, R. A. 2000. Restoring North America’s birds: lessons from landscape ecology. Yale
University Press, New Haven.
Blake, J. G. and W. G. Hoppes. 1986. Influence of resource abundance on use of tree-fall
gaps by birds in an isolated woodlot. Auk 103:328-340.
Canham, C. D., J. S. Denslow, W. J. Platt, J. R. Runkle, T. A. Spies, and P. S. White. 1990.
Light regimes beneath closed canopies and tree-fall gaps in temperate and tropical forests.
Can. J. For. Res. 20:620-631.
Dickson, J. G. 1978. Forest bird communities of the bottomland hardwoods. Pages 66-75 in
D. M. DeGraaf, ed. Proceedings of the workshop on management of southern forests for
nongame birds. USDA Forest Service GTR SE-14, Atlanta, GA.
Page 22
14
Ehrlich, P. R., D. S. Dobkin, and D. Wheye. 1988. The Birder’s Handbook: A Field Guide
to the Natural History of North American Birds. Simon and Schuster Inc., New York, NY.
Germaine, S. S., S. H. Vessey, and D. E. Capen. 1997. Effects of small forest openings on
the breeding bird community in a Vermont hardwood forest. Condor 99:708-718.
Hamel, P. B. 1992. Land Manager’s Guide to the Birds of the South.. The Nature
Conservancy, Chapel Hill, N.C; USDA Forest Service, Southern Region, Atlanta, GA.
Holmes, R. T., R. E. Bonney Jr., and S. W. Pacala. 1979. Guild structure of the Hubbard
Brook bird community: a multivariate approach. Ecology 60:512-520.
Hunter, W. C., D. A. Buehler, R. A. Canterbury, J. L. Confer, and P. B. Hamel. 2001.
Conservation of disturbance-dependent birds in eastern North America. Wildl. Soc. Bull.
29:440-455.
Kilgo, J. C., K. V. Miller, and W. P Smith. 1999. Effects of group-selection timber harvest
in bottomland hardwoods on fall migrant birds. J. Field Ornithol. 70:404-413.
King, D. I., R. M. DeGraaf, and C. R. Griffin. 2001. Productivity of early successional
shrubland birds in clearcuts and groupcuts in an eastern deciduous forest. J. Wildl. Manage.
65:345-350.
Martin, T. E. and J. R. Karr. 1986. Patch utilization by migrating birds: resource oriented?
Ornis Scandan. 17:165-174.
McCarty, J. P., D. J. Levey, C. H Greenberg, and S. Sargent. 2002. Spatial and temporal
variation in fruit use by wildlife in a forested landscape. For. Ecol. Manage. 164:277-291.
Moore, F. R., S. A. Gauthreaux, Jr., P. Kerlinger, and T. R. Simons. 1993. Stopover habitat:
management implications and guidelines. Pp. 58-69 in D. Finch and P. Stangel (eds.) Status
Page 23
15
and management of Neotropical migratory birds. Rocky Mountain Forest and Range
Experimental Station. Ft. Collins, CO. Gen. Tech. Rep. RM-229.
Moorman, C. E. and D. C. Guynn, Jr. 2001. Effects of group-selection opening size on
breeding bird habitat use in a bottomland forest. Ecol. Applications 11:1680-1691.
Moorman, C. E., D. C. Guynn, Jr., and J. C. Kilgo. 2002. Hooded Warbler nesting success
adjacent to group-selection and clearcut edges in a southeastern bottomland forest. Condor
104: 366-377.
Pagen, R. W., F. R. Thompson III, and D. E. Burhans. 2000. Breeding and post-breeding
habitat use by forest migrant songbirds in the Missouri Ozarks. Condor 102: 738-747.
Pashley, D. N. and W. C. Barrow. 1993. Effects of land use practices on Neotropical
migratory birds in bottomland hardwood forests. in D. Finch and P. Stangel, eds. Status and
Management of Neotropical Migratory Birds. U.S. Department of Agriculture, U.S. Forest
Service General Technical Report RH-229. 420 pp.
Petit, D. R. 2000. Habitat use by landbirds along Nearctic-Neotropical migration routes:
implications for conservation of stopover habitats. Studies in Avian Biol. 20:15-33.
Pyle, P., S. N. G. Howell, R. P. Yunick, and D. F. DeSante. 1987. Identification Guide to
North American Passerines. Slate Creek Press, Bolinas, CA.
Remsen, J. V., Jr. and D. A. Good. 1986. Misuse of data from mist-net captures to assess
relative abundance in bird populations. Auk 113:381-398.
Robinson, S. K. and R. T. Holmes. 1982. Foraging behavior of forest birds and the
relationships among search tactics, diet, and habitat structure. Ecology 63:1918-1931.
Robinson, W. D. and S. K. Robinson. 1999. Effects of selective logging on forest bird
populations in a fragmented landscape. Conserv. Biol. 13:58-66.
Page 24
16
Rodewald, P. G. and M. C. Brittingham. 2002. Habitat use and behavior of mixed species
landbird flocks during fall migration. Wilson Bull. 114:87-98.
SAS Institute. 1990. SAS user’s guide, version 6. SAS Institute, Inc., Cary, NC.
Smith, R. and M. Dallman. 1996. Forest gap use by breeding black-throated green warblers.
Wilson Bull. 108:588-591.
Vega Rivera, J. H., W. J. McShea, J. H. Rappole, and C. A. Haas. 1999. Postbreeding
movements and habitat use of adult wood thrushes in northern Virginia. Auk 116:458-466.
Vega Rivera, J. H., W. J. McShea, and J. H. Rappole. 2003. Comparison of breeding and
postbreeding movements and habitat requirements for the Scarlet Tanager (Piranga
olivacea) in Virginia. Auk 120:632-644.
Vega Rivera, J. H., J. H. Rappole, W. J. McShea, and C. A. Haas. 1998. Wood thrush
postfledging movements and habitat use in northern Virginia. Condor 100:69-78.
Watt, A. S. 1947. Pattern and process in the plant community. J. Ecol. 35:1-22.
Willson, M. F., E. A. Porter, and R. S. Condit. 1982. Avian frugivore activity in relation to
forest light gaps. Caribbean J. Sci. 18:1-6.
Page 25
17
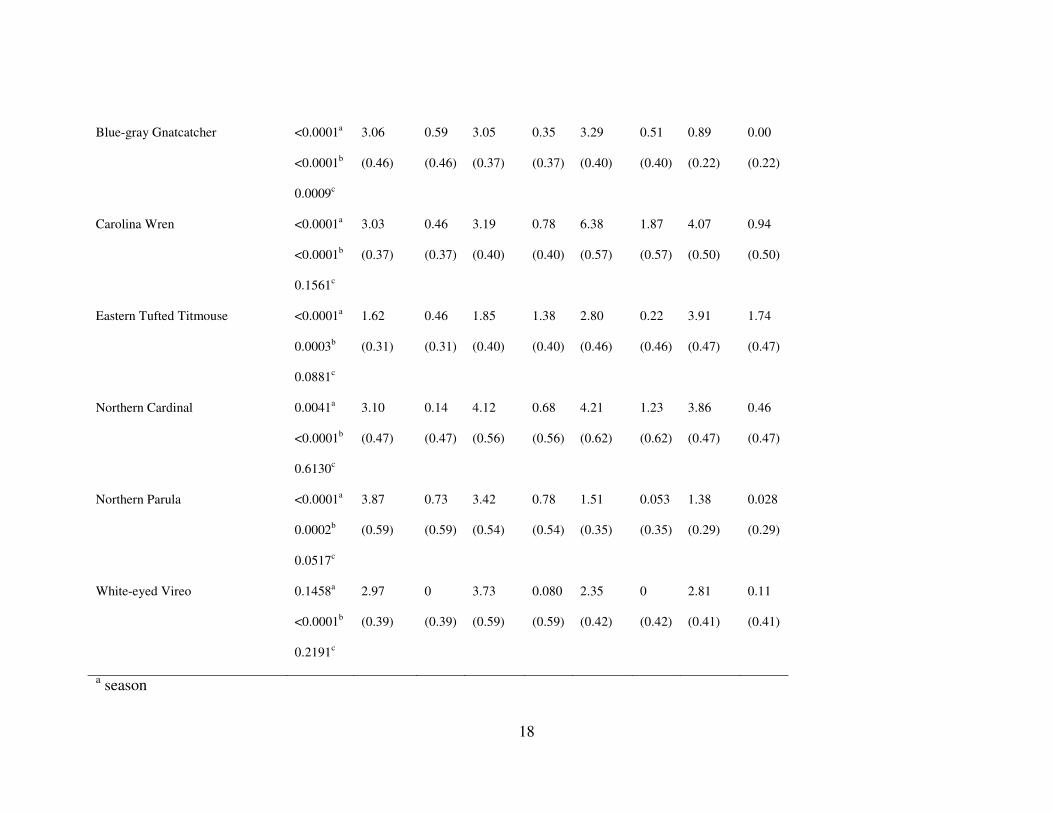
Table 1. Mean plot count detections per ha, for each season and count location (n=12) in a bottomland hardwood forest in
South Carolina, USA (2001-2002) with associated p-values for season, habitat type, and season*habitat type interaction. Standard
errors are in parentheses.
Spring Breeding Post-breeding Fall
Species or group P-value gap/edg for gap/edg for gap/edg for gap/edg for
All birds 0.3961a
<0.0001b
0.5797c
38.58
(3.37)
6.92
(3.37)
38.19
(3.28)
10.35
(3.28)
35.15
(3.40)
7.70
(3.40)
39.34
(3.52)
7.66
(3.52)
Forest interior spp. 0.0026a
<0.0001b
0.4777c
6.87
(0.83)
2.10
(0.83)
8.41
(1.26)
3.29
(1.26)
5.36
(0.87)
1.30
(0.87)
4.37
(0.61)
1.26
(0.61)
Forest-edge spp. 0.1022a
<0.0001b
0.6841c
25.01
(2.24)
4.76
(2.24)
29.25
(2.29)
7.04
(2.29)
29.04
(2.38)
6.20
(2.38)
29.83
(2.72)
5.95
(2.72)
Field-edge spp. <0.0001a
<0.0001b
<0.0001c
4.71
(0.41)
0.028
(0.41)
0.32
(0.11)
0.00
(0.11)
0.43
(0.13)
0.056
(0.13)
4.04
(0.45)
0.00
(0.45)
Page 26
18
Blue-gray Gnatcatcher <0.0001a
<0.0001b
0.0009c
3.06
(0.46)
0.59
(0.46)
3.05
(0.37)
0.35
(0.37)
3.29
(0.40)
0.51
(0.40)
0.89
(0.22)
0.00
(0.22)
Carolina Wren <0.0001a
<0.0001b
0.1561c
3.03
(0.37)
0.46
(0.37)
3.19
(0.40)
0.78
(0.40)
6.38
(0.57)
1.87
(0.57)
4.07
(0.50)
0.94
(0.50)
Eastern Tufted Titmouse <0.0001a
0.0003b
0.0881c
1.62
(0.31)
0.46
(0.31)
1.85
(0.40)
1.38
(0.40)
2.80
(0.46)
0.22
(0.46)
3.91
(0.47)
1.74
(0.47)
Northern Cardinal 0.0041a
<0.0001b
0.6130c
3.10
(0.47)
0.14
(0.47)
4.12
(0.56)
0.68
(0.56)
4.21
(0.62)
1.23
(0.62)
3.86
(0.47)
0.46
(0.47)
Northern Parula <0.0001a
0.0002b
0.0517c
3.87
(0.59)
0.73
(0.59)
3.42
(0.54)
0.78
(0.54)
1.51
(0.35)
0.053
(0.35)
1.38
(0.29)
0.028
(0.29)
White-eyed Vireo 0.1458a
<0.0001b
0.2191c
2.97
(0.39)
0
(0.39)
3.73
(0.59)
0.080
(0.59)
2.35
(0.42)
0
(0.42)
2.81
(0.41)
0.11
(0.41)
a season
Page 27
19
b habitat type
c season * habitat type
Page 28
20
Table 2. Mean captures per 100 net hours per season and net location (n=12) in a bottomland forest in South Carolina, USA
(2001-2002) with associated p-values for season, net location, and season*net location interaction. Standard errors are in parentheses.
Spring Breeding Post-breeding Fall
Species or group P-values* gap edg for gap edg for gap edg for gap edg for
All birds <0.0001a
<0.0001b
<0.0001c
53.80
(3.48)
34.71
(3.48)
5.73
(3.48)
22.13
(2.42)
26.92
(2.42)
10.27
(2.42)
14.59
(1.98)
15.50
(1.98)
3.26
(1.98)
28.29
(2.01)
20.15
(2.01)
5.43
(2.01)
Forest interior spp. <0.0001a
<0.0001b
<0.0001c
21.87
(2.64)
15.27
(2.64)
2.08
(2.64)
7.07
(1.50)
11.86
(1.50)
3.19
(1.50)
5.99
(1.00)
6.38
(1.00)
1.17
(1.00)
15.11
(1.61)
11.24
(1.61)
2.07
(1.61)
Forest-edge spp. <0.0001a
<0.0001b
<0.0037c
21.87
(1.92)
12.84
(1.92)
3.47
(1.92)
13.92
(2.25)
14.37
(2.25)
6.84
(2.25)
7.81
(1.19)
8.99
(1.19)
2.08
(1.19)
9.82
(1.34)
6.59
(1.34)
2.71
(1.34)
Field-edge spp. <0.0001a
<0.0001b
<0.0001c
10.07
(1.24)
6.59
(1.24)
0.17
(1.24)
1.14
(0.34)
0.68
(0.34)
0.23
(0.34)
0.78
(0.22)
0.12
(0.22)
0.00
(0.22)
3.23
(0.66)
2.33
(0.66)
0.65
(0.66)
Page 29
21
Black-throated Blue Warbler 0.0045a
<0.0001b
0.0331c
5.21
(0.61)
3.47
(0.61)
0.00
(0.61)
2.20
(0.61)
1.81
(0.61)
0.26
(0.61)
Carolina Wren 0.0111a
0.0001b
0.0758c
1.91
(0.99)
4.34
(0.99)
1.74
(0.99)
1.37
(0.99)
7.07
(0.99)
5.48
(0.99)
1.43
(0.99)
5.08
(0.99)
1.69
(0.99)
1.68
(0.99)
2.07
(0.99)
2.45
(0.99)
Hooded Warbler 0.0003a
<0.0001b
0.0754c
6.94
(0.94)
7.12
(0.94)
0.87
(0.94)
2.28
(0.94)
4.11
(0.94)
2.05
(0.94)
2.87
(0.94)
3.26
(0.94)
0.13
(0.94)
2.20
(0.94)
2.84
(0.94)
0.52
(0.94)
Kentucky Warbler 0.1087a
0.0008b
0.0005c
2.26
(0.56)
1.39
(0.56)
0.87
(0.56)
1.14
(0.56)
4.56
(0.56)
0.23
(0.56)
1.43
(0.56)
1.04
(0.56)
0.52
(0.56)
NA NA NA
Northern Cardinal 0.0854a
<0.0001b
0.4216c
2.43
(0.54)
2.43
(0.54)
0.87
(0.54)
2.51
(0.54)
0.46
(0.54)
0.46
(0.54)
2.73
(0.54)
1.95
(0.54)
0.13
(0.54)
1.42
(0.54)
1.16
(0.54)
0.00
(0.54)
White-eyed Vireo 0.0024a
<0.0001b
0.0982c
6.07
(0.83)
2.26
(0.83)
0.17
(0.83)
5.70
(0.83)
3.42
(0.83)
0.23
(0.83)
1.30
(0.83)
1.04
(0.83)
0.00
(0.83)
3.23
(0.83)
1.81
(0.83)
0.00
(0.83)
* a season
Page 30
22
b net location
c season * net location
Page 31
23
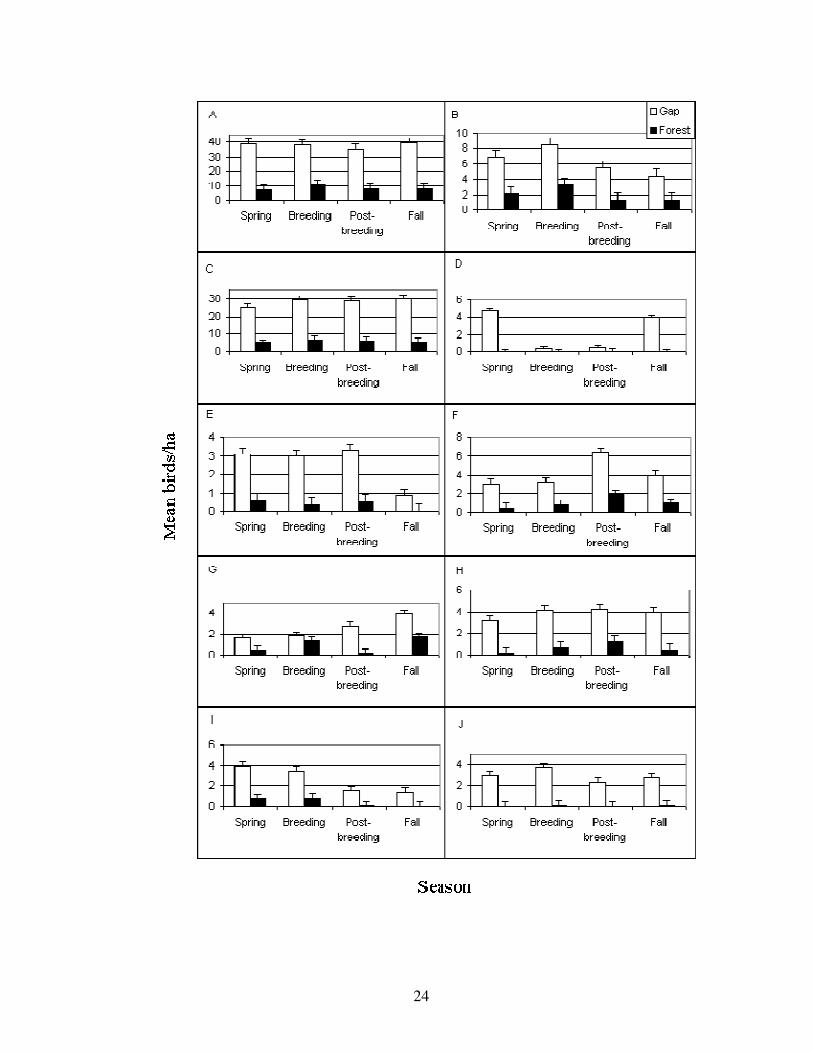
Fig. 1. Seasonal bird counts (birds per ha) for gap/edge and forest habitats, with
standard error bars (2001 and 2002 in South Carolina, USA). (A) all birds, (B) forest interior
species, (C) forest-edge species, (D) field-edge species, (E) Blue-gray Gnatcatcher, (F)
Carolina Wren, (G) Eastern Tufted Titmouse, (H) Northern Cardinal, (I) Northern Parula,
and (J) White-eyed Vireo
Page 33
25
Fig. 2. Mean bird captures per 100 net hours for each habitat and season with
standard error bars (2001 and 2002 in South Carolina, USA). (A) all birds, (B) forest
interior species, (C) forest-edge species, (D) field-edge species, (E) Black-throated Blue
Warbler, (F) Carolina Wren, (G) Hooded Warbler, (H) Kentucky Warbler, (I) Northern
Cardinal, and (J) White-eyed Vireo
Page 35
27
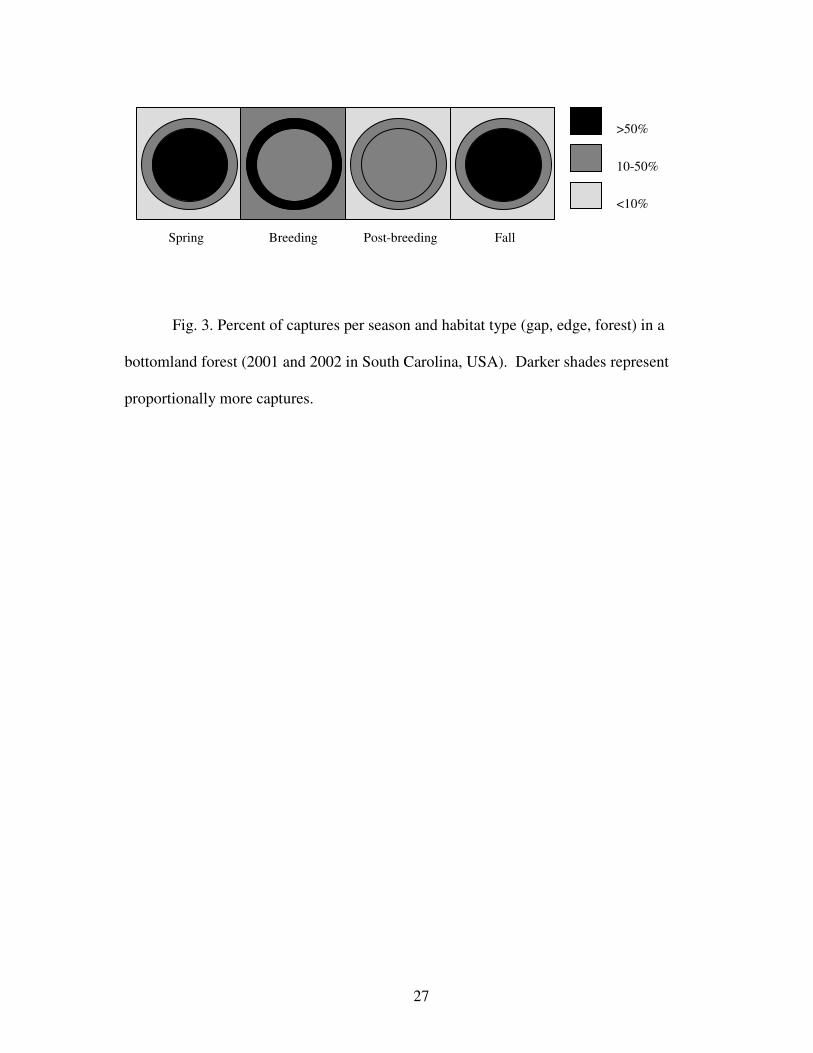
Fig. 3. Percent of captures per season and habitat type (gap, edge, forest) in a
bottomland forest (2001 and 2002 in South Carolina, USA). Darker shades represent
proportionally more captures.
Spring Breeding Post-breeding Fall
>50%
10-50%
<10%
Page 36
28
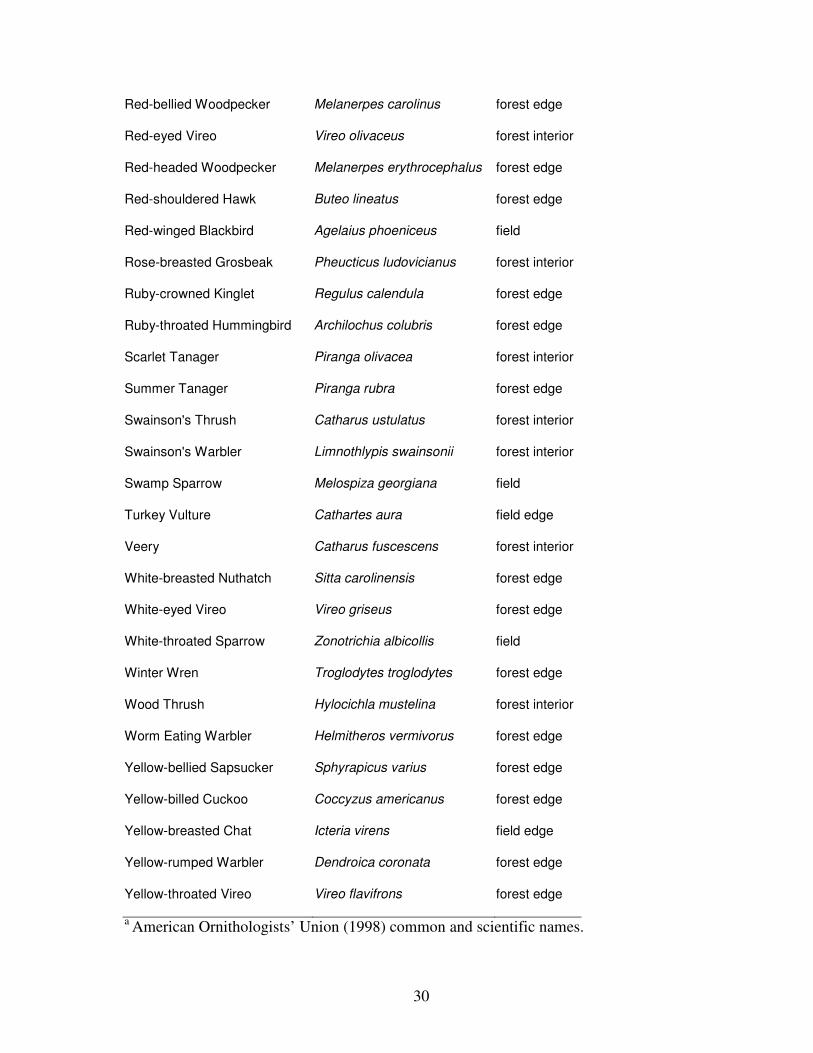
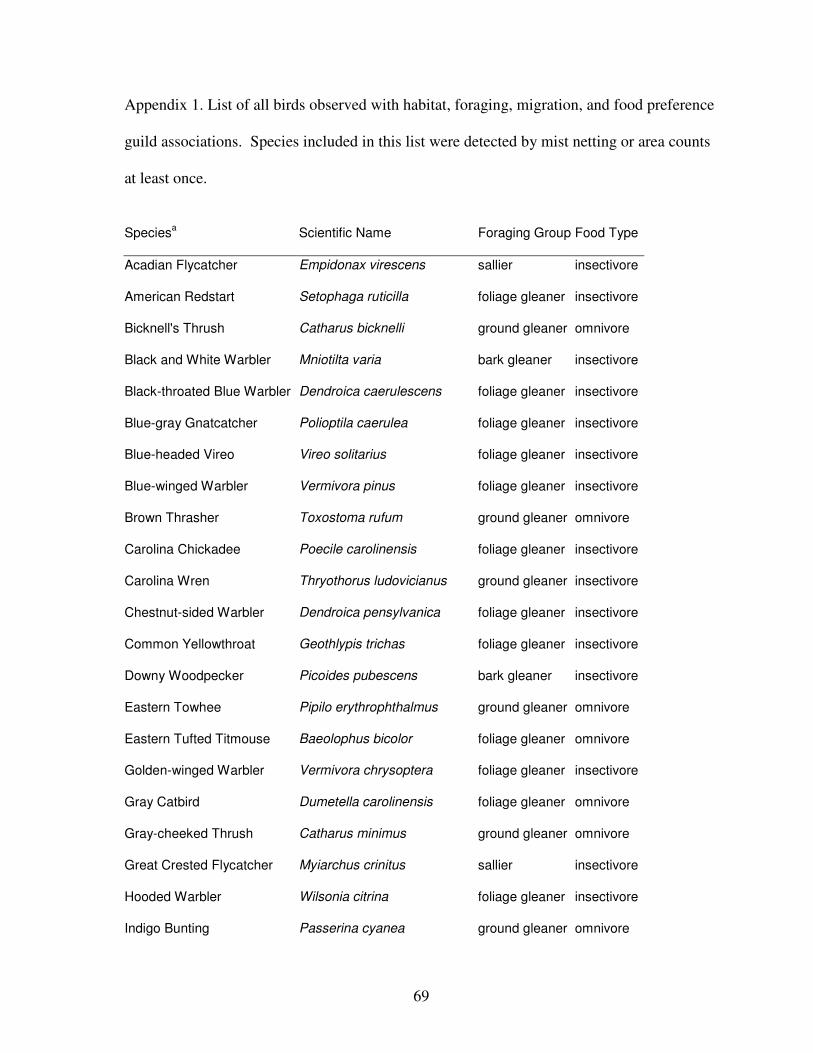
Appendix 1. List of all birds observed with habitat group associations. Species included in
this list were detected by plot counts or mist-netting at least once.
Speciesa Scientific Name Habitat Group
Acadian Flycatcher Empidonax virescens forest interior
American Crow Corvus brachyrhynchos forest edge
American Goldfinch Carduelis tristis field
American Redstart Setophaga ruticilla forest interior
Barred Owl Strix varia forest interior
Bicknell’s Thrush Catharus bicknelli forest interior
Black and White Warbler Mniotilta varia forest interior
Black-throated Blue Warbler Dendroica caerulescens forest interior
Black-throated Green Warbler Dendroica virens forest interior
Blue Jay Cyanocitta cristata forest edge
Blue-gray Gnatcatcher Polioptila caerulea forest edge
Blue-headed Vireo Vireo solitarius forest interior
Blue-winged Warbler Vermivora pinus field edge
Brown Thrasher Toxostoma rufum field edge
Brown-headed Cowbird Molothrus ater forest edge
Brown-headed Nuthatch Sitta pusilla forest edge
Canada Warbler Wilsonia canadensis forest interior
Carolina Chickadee Poecile carolinensis forest edge
Carolina Wren Thryothorus ludovicianus forest edge
Chestnut-sided Warbler Dendroica pensylvanica field edge
Chimney Swift Chaetura pelagica field
Common Grackle Quiscalus quiscula field edge
Common Yellowthroat Geothlypis trichas field edge
Page 37
29
Downy Woodpecker Picoides pubescens forest edge
Eastern Phoebe Sayornis phoebe forest edge
Eastern Towhee Pipilo erythrophthalmus field edge
Eastern Tufted Titmouse Baeolophus bicolor forest edge
Eastern Wood-Pewee Contopus virens forest edge
Fish Crow Corvus ossifragus forest edge
Golden-Winged Warbler Vermivora chrysoptera forest edge
Gray Catbird Dumetella carolinensis field edge
Gray-cheeked Thrush Catharus minimus forest interior
Great Crested Flycatcher Myiarchus crinitus forest edge
Hairy Woodpecker Picoides villosus forest interior
Hermit Thrush Catharus guttatus forest interior
Hooded Warbler Wilsonia citrina forest interior
Indigo Bunting Passerina cyanea field edge
Kentucky Warbler Oporornis formosus forest interior
Louisiana Waterthrush Seiurus motacilla forest interior
Magnolia Warbler Dendroica magnolia forest interior
Mourning Dove Zenaida macroura field edge
Northern Cardinal Cardinalis cardinalis forest edge
Northern Flicker Colaptes auratus forest edge
Northern Parula Parula americana forest edge
Northern Waterthrush Seiurus noveboracensis forest interior
Orange-crowned Warbler Vermivora celata forest edge
Ovenbird Seiurus aurocapillus forest interior
Pileated Woodpecker Dryocopus pileatus forest interior
Pine Warbler Dendroica pinus forest edge
Prairie Warbler Dendroica discolor field edge
Page 38
30
Red-bellied Woodpecker Melanerpes carolinus forest edge
Red-eyed Vireo Vireo olivaceus forest interior
Red-headed Woodpecker Melanerpes erythrocephalus forest edge
Red-shouldered Hawk Buteo lineatus forest edge
Red-winged Blackbird Agelaius phoeniceus field
Rose-breasted Grosbeak Pheucticus ludovicianus forest interior
Ruby-crowned Kinglet Regulus calendula forest edge
Ruby-throated Hummingbird Archilochus colubris forest edge
Scarlet Tanager Piranga olivacea forest interior
Summer Tanager Piranga rubra forest edge
Swainson's Thrush Catharus ustulatus forest interior
Swainson's Warbler Limnothlypis swainsonii forest interior
Swamp Sparrow Melospiza georgiana field
Turkey Vulture Cathartes aura field edge
Veery Catharus fuscescens forest interior
White-breasted Nuthatch Sitta carolinensis forest edge
White-eyed Vireo Vireo griseus forest edge
White-throated Sparrow Zonotrichia albicollis field
Winter Wren Troglodytes troglodytes forest edge
Wood Thrush Hylocichla mustelina forest interior
Worm Eating Warbler Helmitheros vermivorus forest edge
Yellow-bellied Sapsucker Sphyrapicus varius forest edge
Yellow-billed Cuckoo Coccyzus americanus forest edge
Yellow-breasted Chat Icteria virens field edge
Yellow-rumped Warbler Dendroica coronata forest edge
Yellow-throated Vireo Vireo flavifrons forest edge
a American Ornithologists’ Union (1998) common and scientific names.
Page 39
31
CHAPTER 2
Seasonal bird-arthropod-vegetation relationships SEASONAL RELATIONSHIPS BETWEEN ARTHROPOD ABUNDANCE, VEGETATION STRUCTURE, AND BIRD USE OF FOREST CANOPY GAPS IN A BOTTOMLAND HARDWOOD FOREST Liessa T. Bowen Christopher E. Moorman John C. Kilgo James L. Hanula Scott Horn Liessa T. Bowen, North Carolina State University, Department of Forestry, Campus Box 8002, Raleigh, NC 27695-8002; Christopher E. Moorman, North Carolina State University, Department of Forestry, Campus Box 8003, Raleigh, NC 27695-8003; John C. Kilgo, Research Wildlife Biologist, Southern Research Station, USDA Forest Service- Savannah River, PO Box 700, New Ellenton SC 29809; James L. Hanula and Scott Horn, USDA Forest Service, 320 Green St., Athens, GA 30602-2044 Christopher E. Moorman, North Carolina State University, Department of Forestry, Campus Box 8003, Raleigh, NC 27695-8003, [email protected]
Page 40
32
ABSTRACT
We investigated the influence of arthropod abundance and vegetation structure on
avian habitat use in three sizes (0.13, 0.26, and 0.5 ha) of 7-8 year old group-selection
timber harvest openings during four seasons (spring migration, breeding, post-breeding, and
fall migration) in a bottomland hardwood forest in the Upper Coastal Plain of South
Carolina. We used mist netting to estimate abundance of birds using canopy gap, gap edge,
and surrounding forest habitats. We used foliage clipping, Malaise trapping, and pitfall
trapping to determine arthropod abundance at the same locations. We captured more birds,
including insectivores, foliage gleaners, and ground gleaners, in mid-successional canopy
gap and edge habitats than in surrounding mature forest habitat during all seasons. Foliage-
dwelling arthropod density generally was highest in forest habitats, while flying arthropod
biomass was greatest in the gap habitats during all seasons. Ground-dwelling arthropods did
not differ among habitats, but were dramatically less abundant during fall migration than the
previous three seasons. We found significant relationships between insectivorous birds and
leaf-dwelling Lepidoptera, insectivores and ground-dwelling arthropods, foliage-gleaning
birds and foliage-dwelling arthropods, and aerial salliers and flying arthropods, as well as
several relationships between individual bird species and arthropods. Relationships were
inconsistent, however, with many groups or species being negatively correlated with
arthropod abundance. Captures of all birds, insectivorous birds, foliage gleaners, ground
gleaners, aerial salliers, Hooded Warbler (Wilsonia citrina), Northern Cardinal (Cardinalis
cardinalis), White-eyed Vireo (Vireo griseus), and Black-throated Blue Warbler
(Dendrouca caerulescens) each were positively correlated with understory vegetation
density during two or more seasons. We conclude that the high bird abundance associated
Page 41
33
with canopy gaps may have resulted less from high food resource availability than from
complex understory and midstory vegetation structure.
Canopy gaps created by small-scale harvest operations can be used to mimic natural
treefall disturbances. Canopy gaps within a mature forest habitat contain different
microclimates, leading to a unique assortment of gap-associated flora and fauna (Watt 1947;
Canham et al. 1990). Across multiple seasons, birds tend to be more abundant in forest
canopy gaps created either by natural treefalls (Willson et al. 1982; Martin and Karr 1986)
or group-selection harvest (Kilgo et al. 1999; Moorman and Guynn 2001; Bowen 2004).
Bird habitat use patterns change across seasons (Bowen 2004), depending upon
particular seasonal needs, including protective cover, abundant food resources, appropriate
breeding habitat, and places to raise young during breeding and post-breeding seasons
(Robinson and Holmes 1982; Willson et al. 1982; Blake and Hoppes 1986; Moore et al.
1995; Petit 2000; Vega Rivera et al. 2003). Passerines often shift into more densely
vegetated habitats between breeding and post-breeding periods (Anders et al. 1998; Vega
Rivera et al. 1998, 2003; Pagen et al. 2000) and use a wider variety of forested habitats
during migratory periods (Petit 2000; Rodewald and Brittingham 2002). Not only do habitat
needs change across seasons, each species responds differently to its habitat on a local scale,
including vegetation structure and food resource availability (Holmes et al. 1986). Like
birds, arthropod populations may use habitats differently, depending upon seasonality and
habitat type (Johnson and Sherry 2001; Greenberg and Forrest 2003) as well as canopy gap
size (Shure and Phillips 1991).
Page 42
34
Avian needs vary by season, but birds may benefit by selecting habitat based upon
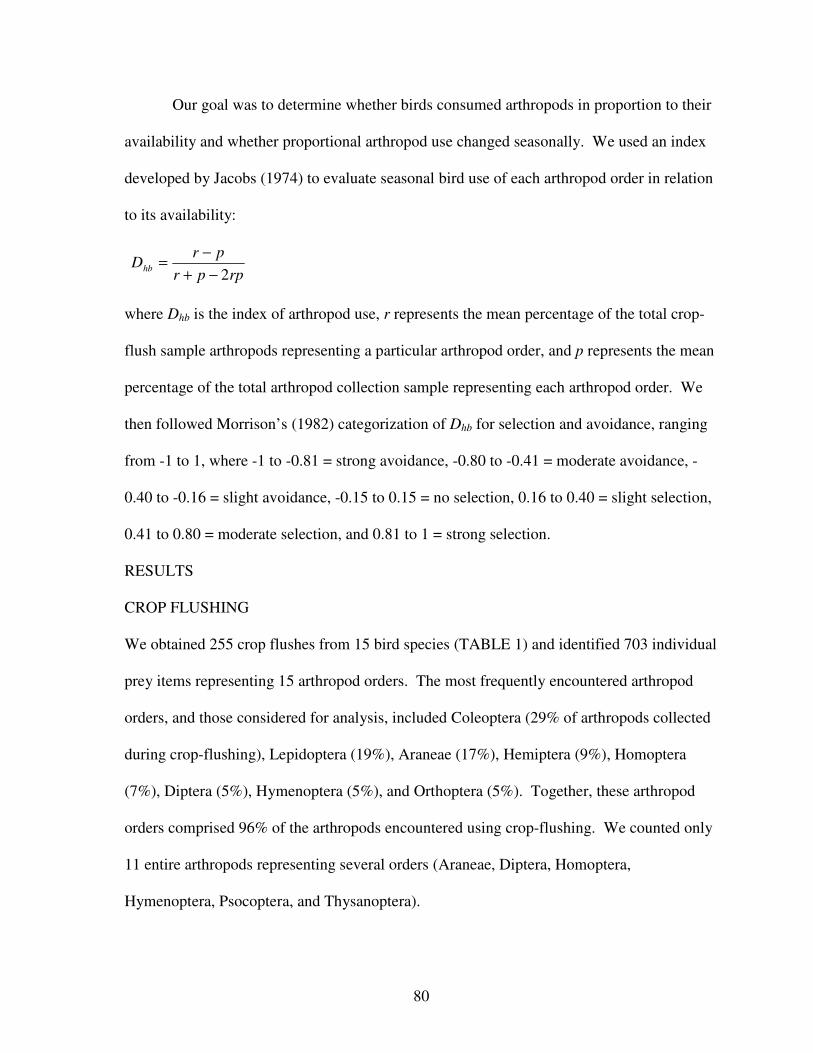
arthropod abundance, as they require food resources during all seasons. It would be
advantageous for birds to choose sites with the greatest resource availability (Martin and
Karr 1986), and indeed, it has been suggested that greater invertebrate biomass is linked to
higher bird abundance (Blake and Hoppes 1986; Holmes et al. 1986), higher daily nest
survival rates and faster growth rates of nestlings (Duguay et al. 2000), and timing of
warbler migration (Graber and Graber 1983). Studies of experimental prey removal,
however, have not linked decreased prey abundance with negative consequences for the
local bird community (Nagy and Smith 1997; Marshall et al. 2002; T. Champlin,
unpublished data).
Previous studies have not investigated seasonal shifts in avian habitat use as related
to resource availability over multiple seasons. Using sampling stations established within
forest canopy gaps, gap edges, and mature bottomland forest, we sampled birds, foliage-
dwelling arthropods, ground-dwelling arthropods, flying arthropods, and understory
vegetation density. Our goal was to examine the influences of both arthropod abundance
and vegetation structure on seasonal avian habitat use, from spring migration through fall
migration.
STUDY AREA
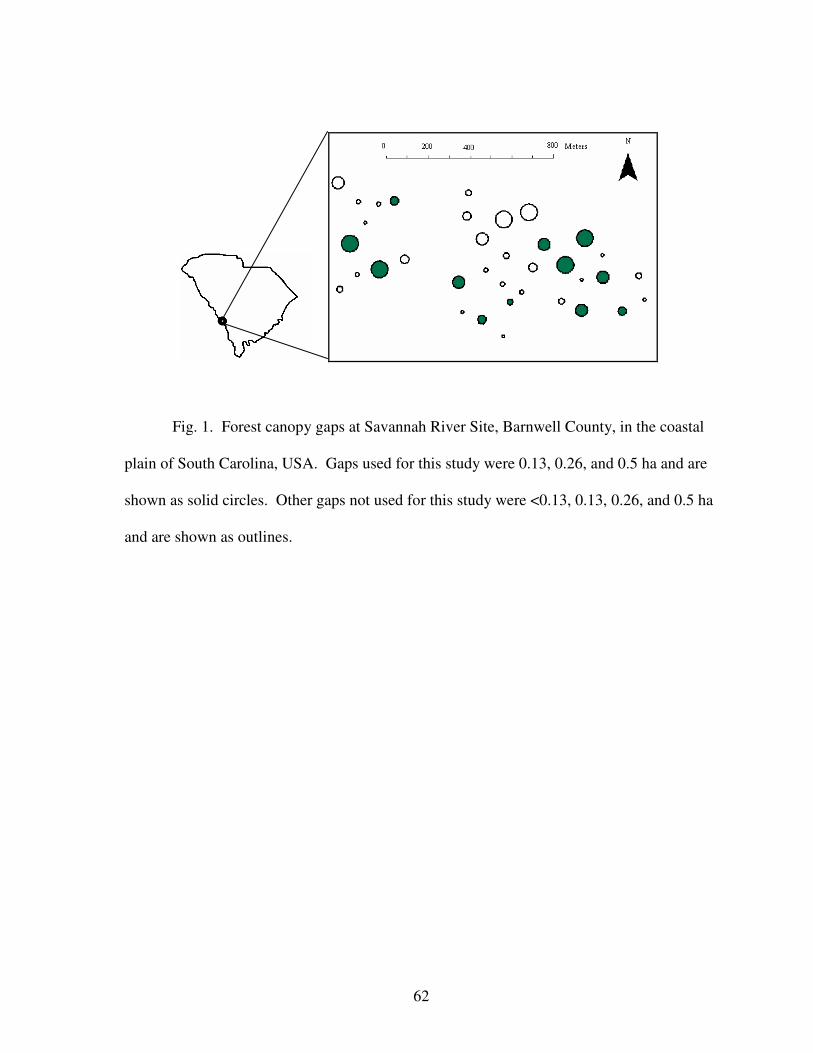
We conducted the study during 2001 and 2002 at the Savannah River Site (SRS), a
78000-ha National Environmental Research Park owned and operated by the U. S.
Department of Energy. Our study site was a mature stand of bottomland hardwoods
approximately 120 ha in size, located in Barnwell County in the Upper Coastal Plain region
of South Carolina (Fig. 1). Birds, arthropods, and vegetation structure were surveyed in 12
Page 43
35
group-selection gaps harvested in December 1994 and in the mature forest adjacent to gaps.
The gaps were in their seventh and eighth growing seasons post-harvest during the study.
They were of three sizes (0.13, 0.26, and 0.50 ha) with four replicates of each size. It is
within this size range that previous research has identified a threshold in response by
breeding (Moorman and Guynn 2001) and fall migrant birds (Kilgo et al. 1999). The mature
forest canopy was dominated by laurel oak (Quercus laurifolia), cherrybark oak (Q. falcata
var. pagodaefolia), sweetgum (Liquidambar styraciflua), and loblolly pine (Pinus taeda).
The midstory was poorly developed, consisting primarily of red mulberry (Morus rubra),
ironwood (Carpinus carolinianus), and American holly (Ilex opaca). The understory was
dominated by dwarf palmetto (Sabal minor) and switchcane (Arundinaria gigantea).
Vegetation in the gaps varied from approximately 1-8 m in height and was dominated by
regenerating trees [primarily sweetgum, loblolly pine, sycamore (Platanus occidentalis),
green ash (Fraxinus pennsylvanica), oaks, and black willow (Salix nigra)] and patches of
blackberry (Rubus spp.), dwarf palmetto, and switchcane.
METHODS
We surveyed birds and arthropods during four avian activity periods (hereafter,
seasons) in 2001 and 2002: spring migration (25 March through 15 May), breeding (16 May
through 30 June), post-breeding (1 July through 31 August), and fall migration (1 September
through 18 October). We established a sampling transect radiating southward from the
center of each gap with three bird and arthropod sampling stations along each transect, one
in the gap center, one at the southern edge, and one 50 m into the forest.
Vegetation.-
Page 44
36
During June 2001 and 2002, we measured vegetation structure along 10-m transects
on each side of and parallel to all mist-net stations at least 1.5 m from each net. Following
techniques modified from Karr (1971), we measured vertical distribution of vegetation at 1-
m intervals along each 10-m transect (total 20 points). At 12 height intervals (0-0.25, 0.25-
0.5, 0.5-0.75, 0.75-1, 1-1.5, 1.5-2, 2-3, 3-5, 5-10, 10-20, 20-25, and 25-30 m), we recorded
whether vegetation touched a 2-m pole or the height intervals directly above the pole.
Touches >2 m high were estimated visually. The percent cover for each height interval was
determined by calculating the percentage of the 20 sampling points with vegetation touches
in that interval. We grouped height intervals to calculate an index of foliage cover for
vegetation layers by taking the mean percent cover of the height intervals in 0-3 m
(understory), 3-20 m (midstory), and 20-30 m (canopy).
Arthropod collection.-
During each season in 2001 and 2002, we sampled foliage-dwelling, ground-
dwelling, and flying arthropods at each station. We used foliage clipping (Cooper and
Whitmore 1990) to sample foliage-dwelling arthropods on each of five target plant species
groups. (1) white oaks [white oak (Quercus alba), swamp chestnut oak (Quercus michauxii),
overcup oak (Quercus lyrata), Durand oak (Quercus durandii)], (2) lobed red oaks
(cherrybark oak), (3) unlobed red oaks [water oak (Quercus nigra), laurel oak, willow oak
(Quercus phellos)], (4) sweetgum, and (5) switchcane. This suite of species was selected to
represent dominant members of both the understory and overstory, as well as species
important as avian foraging substrates (J. C. Kilgo and C. E. Moorman, pers. obs.). Each
sample consisted of 25 branch tips from each target species group (total sample=125 branch
tips) collected in the vicinity of each sampling station (i.e., staying within the target habitat
Page 45
37
type). Each branch-tip clipping was between 2.54 and 15.24 cm and usually came from the
end of a branch that included several leaves. We collected foliage from ground level to
about 2.5 m, and clippings were immediately placed in plastic bags. Samples of target
species occasionally were difficult to find, so not all samples included 125 clippings. Once
the samples were collected, they were placed in a freezer for 24 hrs to kill all arthropods.
We then shook the foliage to collect the arthropods, put them in alcohol, and identified them
to order. Foliage was oven-dried for 48 h at 40o C.
We used Malaise traps (Cooper and Whitmore 1990) to sample flying arthropods
during each season, using 7-day trapping periods in 2001 and 2-day trapping periods in
2002. The Malaise traps (Sante Traps, Lexington, KY) were modified from the traditional
Malaise trap design (Townes 1972) and allowed arthropod collection from any direction.
Collecting jars were located both at the top and bottom of each trap to collect arthropods
that, when trapped, either dropped or flew upward. The traps were suspended from EMT
electrical conduit approximately 3 m off the ground, thereby leaving the traps hanging
slightly above the ground. The 3-m section of conduit was connected by an elbow to a 1-m
section of conduit that had a hook at the end, which allowed traps to be suspended. One
lower corner of the trap was connected to the conduit pole to hold the trap in place during
windy conditions. At the end of each trapping period, arthropods were collected from the
jars, sorted by order, and recorded as dry weight (g) per day (to account for different
collecting periods in different years).
We sampled ground-dwelling arthropods using two pitfall traps (Cooper and
Whitmore 1990) at each sampling station. We used 7-day trapping periods in 2001 and 2-
day trapping periods in 2002, and operated the traps once during each season. The pitfall
Page 46
38
traps consisted of a 480-ml plastic cup buried to ground level, with a small funnel (8.4 cm
diameter) to direct arthropods into a smaller 120-ml specimen cup. The cup was positioned
at the intersection of two 1-m long drift fences. Two pitfall traps were placed 5 m apart at
each station. The collecting jars were filled with a detergent and NaCl-formaldehyde
solution (New and Hanula 1998). Samples were dried, weighed, stored in 70% alcohol, and
identified to order.
Mist netting.-
Continuous operation mist nets were located at each of the three sampling stations at
each of the 12 study gaps. During the spring migration, post-breeding, and fall migration
seasons, netting was conducted once each week at each station, rotating between stations on
a regular weekly schedule. During the breeding season, nets were operated once every two
weeks because birds tend to remain fairly stationary during this period. Nets were opened at
first light and operated for 4-6 h, depending on daily weather conditions. Netting was not
conducted when wind exceeded 16 km per hour or during steady rainfall. Nets were 12-m
long x 3-m tall with 30-mm mesh. Captured birds were aged and sexed (Pyle et al. 1987),
weighed, and banded with a USGS Biological Resources Division aluminum leg band.
DATA ANALYSIS
We assigned birds to several foraging guilds (Appendix 1): (1) all birds, (2)
insectivores, (3) foliage gleaners, (4) ground gleaners, and (5) salliers (Ehrlich et al. 1988;
Hamel 1992). Birds considered winter residents, present only in early spring or late fall,
were not included in analyses. We analyzed mist-netting captures for each of the above
guild groups. Individual species were chosen for analysis if they accounted for at least 80
captures over both years. These included Black-throated Blue Warbler, Carolina Wren,
Page 47
39
Hooded Warbler, Kentucky Warbler, Northern Cardinal, and White-eyed Vireo (see
scientific names in Appendix 1). Black-throated Blue Warbler is a transient species so data
analysis only included spring and fall migratory periods, and Kentucky Warbler is an early
migrant, so analysis of this species did not include fall migration.
We used a linear mixed model (PROC MIXED, SAS Institute 1990) to conduct
analysis of variance (ANOVA) with covariates and interactions to analyze the effects of net
location (gap, edge, forest), season, and arthropod abundance on bird captures. We used
mean captures per 100 net hours for each guild or species as the dependent variable. We
considered net location and season as fixed effects, with net location as a split plot factor
and season as the repeated measure. Arthropod abundance was a continuous variable. We
included all two-way interactions. We used a PROC MIXED model to examine the
relationship between bird captures and understory (0-3 m) vegetation density with
vegetation as the covariate. Because vegetation was only recorded once each year, this
model did not include season. Year and gap size were not significant (p�0.05) in any
models, so these variables were not included in final models. Arthropod captures were
standardized by g/day for Malaise traps and pitfall traps and by number of arthropods per g
of foliage for foliage clippings. We compared captures of the foliage-gleaning guild to
foliage-dwelling arthropod abundance, captures of the aerial sallier guild to flying arthropod
abundance, and captures of the ground-gleaning guild to ground-dwelling arthropod
abundance. We modeled bird abundance with Lepidopteran abundance based upon previous
studies that have shown Lepidopterans to be a primary avian food source (Holmes et al.
1986; McMartin et al. 2002). We modeled each individual bird species abundance with
Aranids and Coleopterans only when deemed important based on diets of individual species
Page 48
40
analyzed (Haggerty and Martin 1995; Halkin and Linville 1999; Whitehead and Taylor
2002; Bowen 2004).
RESULTS
Vegetation structure and diversity.-
The highest understory vegetation density occurred in the early successional gap
habitat. Gaps tended to have very dense understory vegetation with little or no canopy
cover, whereas forested habitat tended to have a relatively open understory, moderately
developed midstory, and closed canopy (Fig. 2).
Arthropods.-
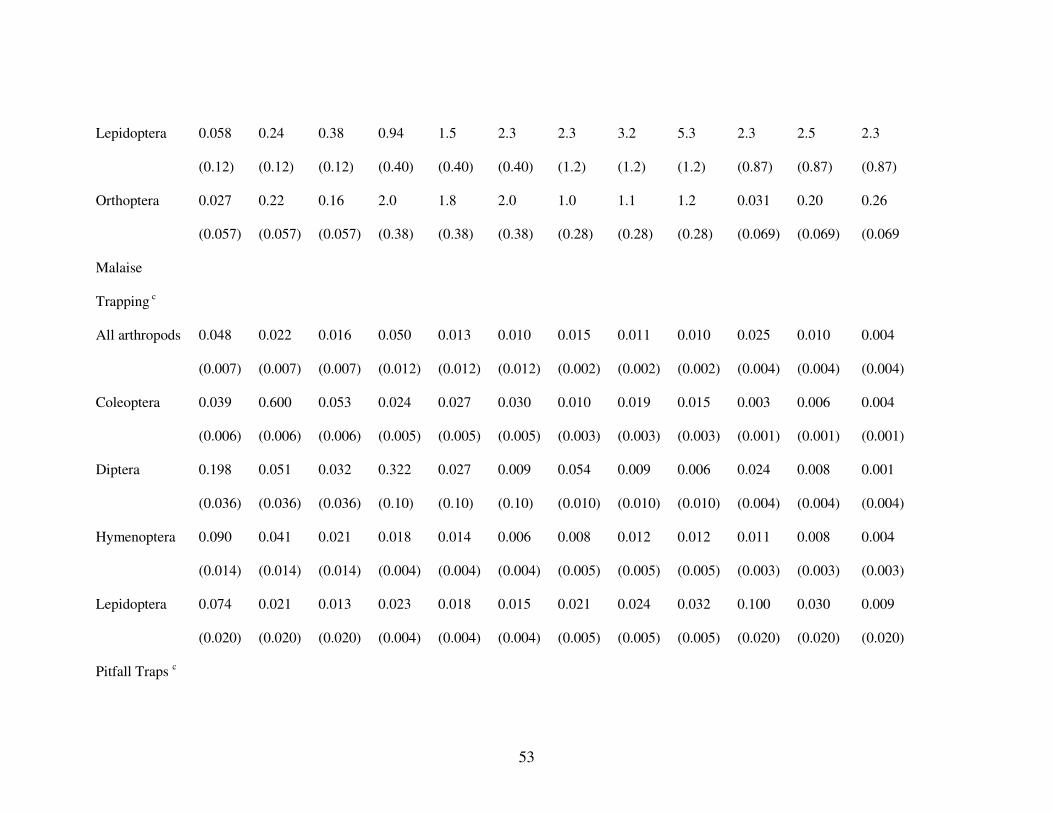
We captured arthropods representing 21 orders using foliage clipping during 2001
and 2002. Total arthropod density (number of arthropods per g of foliage) generally was
slightly lower during spring migration than the other three seasons, and tended to be slightly
greater at edge and forest habitats than in the gaps (Table 1). The five most frequently
encountered arthropod orders, representing at least 150 individuals, were Araneae,
Coleoptera, Homoptera, Hymenoptera, and Lepidoptera. Aranids, Hymenopterans, and
Lepidopterans tended to follow the same general pattern as all arthropods. Coleopteran
density tended to be greatest in the forest and edge habitats and lowest during post-breeding
season and fall migration. Homopteran density was highly variable by habitat with the
greatest density at the edge during fall migration.
We captured arthropods representing 17 orders using Malaise traps during 2001 and
2002. There were more arthropods (g/day) collected from gap habitats than either edge or
forest during every season (Table 1). Total arthropod biomass was highest during the
breeding season and lowest during post-breeding season and fall migration. The five most
Page 49
41
abundant arthropod orders were Diptera, Lepidoptera, Coleoptera, Hymenoptera, and
Orthoptera; these represented biomass of at least 1 g/day. Coleopterans and Dipterans were
most abundant at the edge but other orders tended to be more abundant in gaps.
Coleopterans and Hymenopterans were most abundant during spring migration, Dipterans
were most abundant during breeding season, and Lepidopterans were most abundant during
fall migration.
We captured arthropods representing 23 orders using pitfall traps during 2001 and
2002. Total arthropod biomass (g/day) was greater during spring migration through post-
breeding seasons than during fall migration, but it did not differ among habitat types (Table
1). The five most abundant arthropod orders were Diptera, Hymenoptera, Araneae,
Coleoptera, and Orthoptera, which represent biomass of at least 100 g/day. These five
orders all followed the same general pattern as total arthropod biomass.
Arthropod effects on birds.-
Bird captures were not consistently related to arthropod abundance (Table 2). We
found an interaction between foliage-dwelling arthropods and season. Therefore, when the
relationships between foliage-gleaning birds and foliage-dwelling arthropods was broken
down by season, we found foliage-gleaning bird abundance to be positively associated with
foliage-dwelling arthropods during the breeding and post-breeding seasons, and negatively
associated during fall migration (Table 2; Fig. 3). There was a positive relationship between
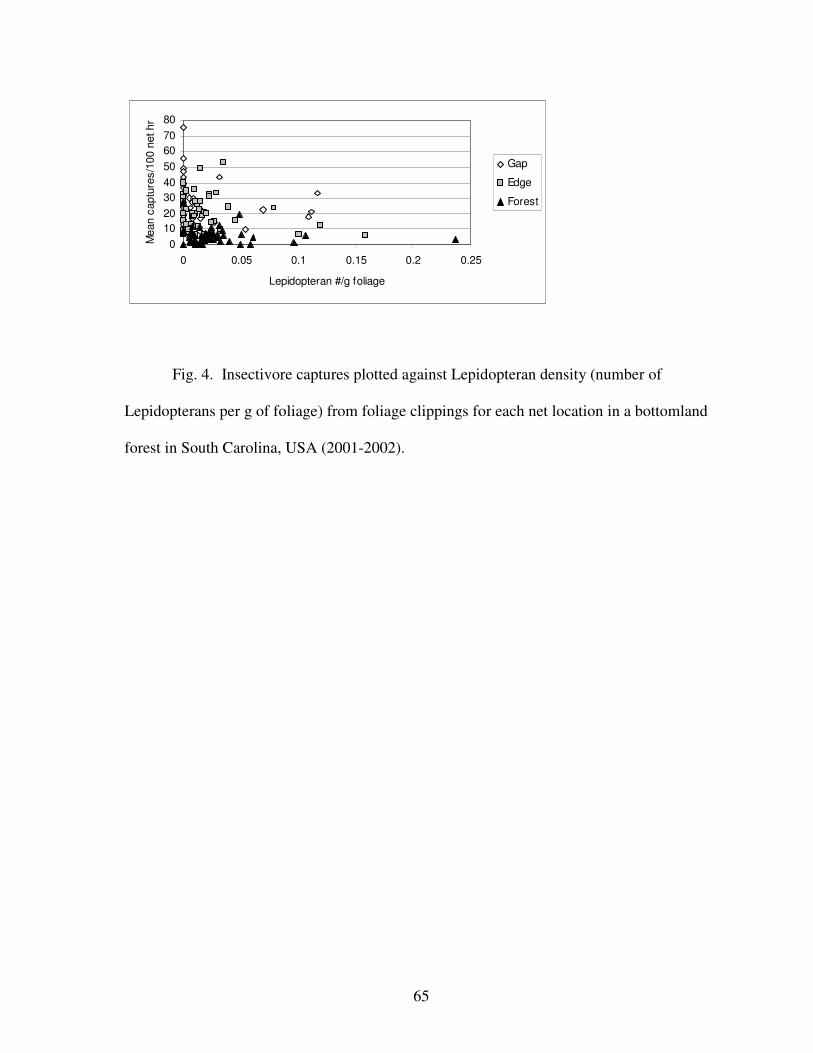
foliage-dwelling Lepidoterans and both White-eyed Vireo (during spring migration and
breeding season) and Kentucky Warblers (Table 2), but a negative overall relationship
between insectivorous birds and foliage-dwelling Lepidopterans (Table 2; Fig. 4). Northern
Cardinals were negatively associated with foliage-dwelling arthropods, Aranids, and
Page 50
42
breeding-season Lepidopterans (Table 2). Insectivorous birds tended to be negatively
associated with ground-dwelling arthropods during spring migration and the post-breeding
season, but ground-gleaning birds were not associated with ground-dwelling arthropods
during any season (Table 2; Fig. 5). Both aerial sallier and Acadian Flycatcher abundance
tended to be negatively associated with all flying arthropods (Table 2; Fig. 6).
Vegetation structure effects on birds.-
All birds and foliage-gleaning birds were positively associated with understory
vegetation density during all seasons (Table 3). Insectivorous birds were positively
associated with understory vegetation density during spring and fall migration and during
the breeding season (Table 3; Fig. 7). Ground gleaners were positively associated with
understory foliage density only during spring and fall migratory periods, and aerial salliers
only during the post-breeding season and fall migration (Table 3). All groups of birds,
except Carolina Wren and Kentucky Warbler, were positively associated with understory
vegetation density during at least one season (Table 3).
DISCUSSION
Our study suggests that birds do not closely follow local variations in arthropod
availability. From spring migration through fall migration, we found no consistent
relationships between arthropod availability and bird abundance for any group of birds or
arthropods. When we did find bird-arthropod relationships, some were positive and some
were negative depending upon the season and groups analyzed. A manipulative study
conducted concurrent to ours at the SRS showed no effect of arthropod removal on breeding,
post-breeding, and migrating bird communities using forest canopy gaps (T. Champlin,
unpublished data). In other studies, the removal of Lepidopteran larvae had little or no
Page 51
43
effect on avian site fidelity or reproductive success (Nagy and Smith 1997; Marshall et al.
2002). Some studies, however, have suggested that birds may be able to follow changes in
invertebrate abundance (Graber and Graber 1983; Blake and Hoppes 1986; Holmes et al.
1986; Gray 1993; Duguay et al 2000; Johnson and Sherry 2001). For example, Duguay et
al. (2000) found a positive correlation between invertebrate biomass and daily nest survival
rates of breeding birds and faster growth rates of nestlings in forest stands with greater
invertebrate biomass. Graber and Graber (1983) determined that warbler migration
coincides with the peak spring outbreak of Lepidopteran larvae, and Holmes et al. (1986)
reported that bird abundance often is related to outbreaks of Lepidopteran larvae, a primary
component of the warbler diet.
While birds were consistently more abundant in gap habitat than forested habitat, we
found different patterns of abundance between foliage-dwelling, ground-dwelling, and
flying arthropods. Foliage-dwelling arthropods were most abundant in forested habitat and
most abundant during the breeding season, ground-dwelling arthropods varied by season for
each habitat but abundance dropped dramatically during fall migration, and flying
arthropods were most abundant in gap habitat but declined in abundance in the fall. In other
studies of seasonal arthropod abundance, arthropod biomass increased through multiple
seasons (Duguay et al. 2000; Greenberg and Forrest 2003), and bird habitat use was
generally positively associated with prey availability. Greenberg and Forrest (2003)
reported invertebrate biomass to be highest in the summer and greater in forested plots than
in canopy gaps, while Blake and Hoppes (1986) found certain types of insects to be more
abundant in canopy gaps during migratory periods. Duguay et al. (2000) reported mean
invertebrate biomass was similar for selection cut and unharvested forests early in the
Page 52
44
breeding season, but was higher in unharvested stands than group-selection stands during the
post-breeding season.
The inconsistent relationships between arthropods and birds, especially the negative
relationships we found, indicate that arthropod abundance is not the prime factor influencing
bird use of forest canopy gaps. Instead, the relationships documented in our study may be
artifacts of the different habitat relations of the bird and arthropod groups we compared.
The relationships were sometimes consistent with each other (resulting in positive
correlations) and sometimes inconsistent (resulting in negative correlations). It is possible
that potential relationships between birds and arthropods occurred at a different scale than
we were able to detect, or that birds perceive prey on a different scale than we were able to
represent with our collection techniques. For example, because birds were sampled
continually throughout each season and arthropods were collected just once (1-day sampling
periods for foliage-dwelling arthropods and 2- or 7-day sampling periods for ground-
dwelling and flying arthropods), the arthropod data may not accurately represent actual prey
availability during all periods in a season. Because we found no consistent bird-arthropod
relationships, our data indicate that arthropods may not be a limiting resource for birds in
southeastern bottomlands (i.e., they are capable of finding sufficient food resources across
the area, even in areas of relatively low arthropod abundance), and that bird use of gaps is
more closely related to the vegetation structure important for other aspects of their life
history (e. g., cover for fledglings, foraging, and molting). It is not clear whether this
relationship between bird use and vegetation structure adequately explains bird use of gaps
in other regions and habitats.
Conservation Implications.-
Page 53
45
Birds tended to respond positively to understory vegetation structure. We
consistently detected more birds in the gap and edge habitats during all seasons, and the
understory vegetation density also is highest in these habitats. Dense understory vegetation
could be associated with increased foraging substrate density, thereby increasing foraging
efficiency, even if the number of arthropods per g of foliage was equal to or lower than areas
with less complex vegetation structure. Nets placed in dense understory vegetation also
were more likely to capture birds, as any bird moving through this habitat would encounter
the net, unlike a bird using the forest canopy out of range of our nets (Remsen and Good
1986). Birds foraging in forested habitat would only be available to netting if they were
using the relatively sparse forest understory rather than the canopy vegetation. We were,
therefore, only able to compare bird captures in the understory vegetation representing each
habitat type.
Bowen (2004) documented a seasonal shift in habitat use for several bird groups,
where birds used each habitat type differently during different seasons. Generally, the
greatest bird use of gap habitat occurred during spring and fall migration, with the highest
proportion of both edge and forest captures occurring during the breeding season. This
seasonal shift in habitat use, however, was not explained by arthropod abundance. Rather,
the avian shifts in habitat use that we observed may be the result of several factors, including
a slight shift to forested habitat during breeding season for forest breeders, and an overall
increase in the numbers of birds using the bottomland forest during spring and fall
migration.
Other studies also have shown that forest stands with greater foliage density and
understory habitat structure, such as in small-scale canopy gaps, tend to have more birds
Page 54
46
than mature forest (Blake and Hoppes 1986; Martin and Karr 1986; Kilgo et al. 1999;
Moorman and Guynn 2001; Wilson and Twedt 2003). Birds may select mid- successional
habitat with greater foliage density during migratory periods as well as during breeding and
post-breeding seasons because of increased foraging substrate and protective cover. These
factors may be particularly important during migration when birds move through unfamiliar
territories and for fledgling birds during the post-breeding season. Dense understory
vegetation also offers birds a number of perching sites, protection from the elements, greater
cover during molt (Anders et al. 1998; Vega Rivera et al. 1998; 2003), protective habitat for
young during the post-breeding period (Pagen et al. 2000), or protection from predators
(Moore et al. 1995).
Future work on bird use of gaps in other regions should consider the influence of
arthropod abundance to determine its universal importance relative to vegetation structure.
For the greatest benefit to Neotropical migrant birds locally, Pashley and Barrow (1993)
recommended a management regime that mimics natural disturbances to maintain habitat
heterogeneity. In order to provide suitable habitat for a variety of birds during breeding,
post-breeding, and migratory periods, all season-specific requirements (e.g. foraging
substrates, nesting sites, protection from predators) must be available within close
proximity. Future research should examine the relationship among birds, vegetation density,
and arthropod abundance continually throughout several seasons to isolate the factors most
important in determining seasonal shifts in bird habitat use.
ACKNOWLEDGMENTS
Financial support for this project was provided by the USDA CSREES National
Research Initiative Competitive Grants Program (Award No. 00-35101-9307), North
Page 55
47
Carolina State University, and the U.S. Forest Service Southern Research Station. We thank
the U.S. Department of Energy - Savannah River for providing access to the study site and
the U.S. Forest Service - Savannah River for logistical support, with a special thank you to
John Blake and Ed Olson. We thank R. Lancia, D. Robison, and T. Simons for reviewing
this manuscript. We are grateful for field and laboratory assistance from T. Champlin, D.
Dyer, S. Junker, K. Mack, J. Pitts, W. Sikora, C. Smith, M. Ulyshen, and D. Westerman, and
for statistical assistance from M. Gumpertz, J. Sloan, and S. Donaghy.
LITERATURE CITED
American Ornithologists’ Union. 1998. Check-list of North American Birds, 7th ed.
American Ornithologists’ Union, Washington, D.C.
Anders, A. D., J. Faaborg, and F. R. Thompson III. 1998. Postfledging dispersal, habitat use,
and home-range size of juvenile wood thrushes. Auk 115:349-358.
Blake, J. G. and W. G. Hoppes. 1986. Influence of resource abundance on use of tree-fall
gaps by birds in an isolated woodlot. Auk 103:328-340.
Bowen, L. T. 2004. Seasonal relationships between birds and arthropods in bottomland
forest canopy gaps. Ph.D.dissertation, North Carolina State University, Raleigh, NC.
Canham, C. D., J. S. Denslow, W. J. Platt, J. R. Runkle, T. A. Spies, and P. S. White. 1990.
Light regimes beneath closed canopies and tree-fall gaps in temperate and tropical
forests. Canadian Journal of Forest Research 20:620-631.
Cooper, R. J. and R. C. Whitmore. 1990. Arthropod sampling methods in ornithology.
Studies in Avian Biology 13:29-37.
Page 56
48
Duguay, J. P., P. B. Wood, and G. W. Miller. 2000. Effects of timber harvests on
invertebrate biomass and avian nest success. Wildlife Society Bulletin 28:1123-
1131.
Ehrlich, P. R., D. S. Dobkin, and D. Wheye. 1988. The Birder’s Handbook: A Field Guide
to the Natural History of North American Birds. Simon and Schuster, Inc., New
York, NY.
Graber, J. W. and R. R. Graber. 1983. Feeding rates of warblers in spring. Condor 85:139-
150.
Greenberg, C. H. and T. G. Forrest. 2003. Seasonal abundance of ground-occurring
macroarthropods in forest and canopy gaps in the southern Appalachians.
Southeastern Naturalist 2:591-608.
Haggerty, T. M. and E. S. Morton. 1995. Carolina Wren (Thryothorus ludovicianus). In The
Birds of North America, No. 188 (A. Poole and F. Gill, eds). The Birds of North
America, Inc., Philadelphia, PA.
Halkin, S. L. and S. U. Linville. 1999. Northern Cardinal (Cardinalis cardinalis). In The
Birds of North America, No. 440 (A. Poole and F. Gill, eds). The Birds of North
America, Inc., Philadelphia, PA.
Hamel, P. B. 1992. Land Manager’s Guide to the Birds of the South. The Nature
Conservancy, Chapel Hill, NC; USDA Forest Service, Southern Region, Atlanta,
GA.
Holmes, R. T., T. W. Sherry, and F. W. Sturges. 1986. Bird community dynamics in a
temperate deciduous forest: long-term trends at Hubbard Brook. Ecological
Monographs 56:201-220.
Page 57
49
Johnson, M. D. and T. W. Sherry. 2001. Effects of food availability on the distribution of
migratory warblers among habitats in Jamaica. Journal of Animal Ecology 70:546-
560.
Karr, J. R. 1971. Structure of avian communities in selected Panama and Illinois habitats.
Ecological Monographs 41:207-229.
Kilgo, J. C., K. V. Miller, and W. P Smith. 1999. Effects of group-selection timber harvest
in bottomland hardwoods on fall migrant birds. Journal of Field Ornithology 70:404-
413.
Marshall, M. R., R. J. Cooper, J. A. DeCecco, J. Strazanac, and L. Butler. 2002. Effects of
experimentally reduced prey abundance on the breeding ecology of the Red-eyed
Vireo. Ecological Applications 12:261-280.
Martin, T. E. and J. R. Karr. 1986. Patch utilization by migrating birds: resource oriented?
Ornis Scandanavica 17:165-174.
McMartin, B., I. Bellocq, and S. M. Smith. 2002. Patterns of consumption and diet
differentiation for three breeding warbler species during a spruce budworm outbreak.
Auk 119:216-220.
Moore, F. R., S. A. Gauthreaux, Jr., P. Kerlinger, and T. R. Simons. 1995. Habitat
requirements during migration: important link in conservation. Pp 121-144 in T. E.
Martin and D. M. Finch, (eds.). Ecology and Management of Neotropical Migratory
Birds: A Synthesis and Review of Critical Issues. Oxford University Press, New
York, NY.
Page 58
50
Moorman, C. E. and D. C. Guynn, Jr. 2001. Effects of group-selection opening size on
breeding bird habitat use in a bottomland forest. Ecological Applications 11:1680-
1691.
Nagy, L. R. and K G. Smith. 1997. Effects of insecticide-induced reduction in Lepidopteran
larvae on reproductive success of hooded warblers. Auk 114:619-627.
New, K. C. and J. L. Hanula. 1998. Effect of time elapsed after prescribed burning in
longleaf pine stands on potential prey of the red-cockaded woodpecker. Southern
Journal of Applied Forestry 22:175-183.
Pagen, R. W., F. R. Thompson III, and D. E. Burhans. 2000. Breeding and post-breeding
habitat use by forest migrant songbirds in the Missouri Ozarks. Condor 102:738-747.
Pashley, D. N. and W. C. Barrow. 1993. Effects of land use practices on Neotropical
migratory birds in bottomland hardwood forests. In D. Finch and P. Stangel, (eds.).
Status and Management of Neotropical Migratory Birds. U.S. Department of
Agriculture, U.S. Forest Service General Technical Report RH-229. 420 pp.
Petit, D. R. 2000. Habitat use by landbirds along Nearctic-Neotropical migration routes:
implications for conservation of stopover habitats. Studies in Avian Biology 20:15-
33.
Pyle, P., S. N. G. Howell, R. P. Yunick, and D. F. DeSante. 1987. Identification Guide to
North American Passerines. Slate Creek Press, Bolinas, CA.
Remsen, J. V., Jr. and D. A. Good. 1996. Misuse of data from mist-net captures to assess
relative abundance in bird populations. Auk 113:381-398.
Page 59
51
Robinson, S. K. and R. T. Holmes. 1982. Foraging behavior of forest birds and the
relationships among search tactics, diet, and habitat structure. Ecology 63:1918-
1931.
Rodewald, P. G. and M. C. Brittingham. 2002. Habitat use and behavior of mixed species
landbird flocks during fall migration. Wilson Bulletin 114:87-98.
SAS Institute. 1990. SAS user’s guide, version 6. SAS Institute, Inc., Cary, NC.
Shure, D. J. and D. L. Phillips. 1991. Patch size of forest openings and arthropod
populations. Oecologia 86:325-334.
Townes, H. 1972. A light weight Malaise trap. Entomological News 83:239-247.
Vega Rivera, J. H., J. H. Rappole, W. J. McShea, and C. A. Haas. 1998. Wood thrush
postfledging movements and habitat use in northern Virginia. Condor 100:69-78.
Vega Rivera, J. H., W. J. McShea, and J. H. Rappole. 2003. Comparison of breeding and
postbreeding movements and habitat requirements for the Scarlet Tanager (Piranga
olivacea) in Virginia. Auk 120:632-644.
Watt, A. S. 1947. Pattern and process in the plant community. Journal of Ecology 35:1-22.
Whitehead, D. R. and T. Taylor. 2002. Acadian Flycatcher (Empidonax virescens). In The
Birds of North America, No. 614 (A. Poole and F. Gill, eds). The Birds of North
America, Inc., Philadelphia, PA.
Willson, M. F., E. A. Porter, and R. S. Condit. 1982. Avian frugivore activity in relation to
forest light gaps. Caribbean Journal of Science 18:1-6.
Wilson, R. R. and D. J. Twedt. 2003. Spring bird migration in Mississippi alluvial valley
forests. American Midland Naturalist 149:163-17.
Page 60
52
Table 1. Mean arthropod abundance with standard error in parentheses for each arthropod trapping method and most abundant arthropod orders by
season and net location in a bottomland forest (2001-2002, South Carolina, USA).
Spring Breeding Post-breeding Fall
Gap Edge For Gap Edge For Gap Edge For Gap Edge For
Foliage
Clippingsa, b
All arthropods 6.7
(1.3)
9.3
(1.3)
13
(1.3)
18
(2.1)
14
(2.1)
22
(2.1)
9.5
(2.9)
13
(2.9)
20
(2.9)
12
(2.3)
18
(2.3)
23
(2.3)
Araneae 1.4
(0.56)
2.4
(0.56)
2.8
(0.56)
5.2
(0.57)
3.5
(0.57)
6.8
(0.57)
5.5
(0.77)
5.5
(0.77)
8.1
(0.77)
7.1
(0.80)
6.7
(0.80)
9.1
(0.80)
Coleoptera 2.0
(0.78)
2.7
(0.78)
4.3
(0.78)
1.7
(0.51)
1.9
(0.51)
3.9
(0.51)
0.89
(0.24)
1.3
(0.24)
1.3
(0.24)
0.70
(0.27)
0.97
(0.27)
2.1
(0.27)
Homoptera 0.25
(0.15)
0.28
(0.15)
0.48
(0.15)
2.5
(0.41)
0.83
(0.41)
2.4
(0.41)
0.38
(0.11)
0.30
(0.11)
0.24
(0.11)
0.56
(0.20)
0.40
(0.20)
0.46
(0.20)
Hymenoptera 0.77
(0.64)
2.3
(0.64)
3.0
(0.64)
3.1
(1.4)
3.7
(1.4)
3.4
(1.4)
0.021
(0.93)
2.0
(0.93)
2.1
(0.93)
1.2
(1.3)
4.9
(1.3)
3.2
(1.3)
Page 61
53
Lepidoptera 0.058
(0.12)
0.24
(0.12)
0.38
(0.12)
0.94
(0.40)
1.5
(0.40)
2.3
(0.40)
2.3
(1.2)
3.2
(1.2)
5.3
(1.2)
2.3
(0.87)
2.5
(0.87)
2.3
(0.87)
Orthoptera 0.027
(0.057)
0.22
(0.057)
0.16
(0.057)
2.0
(0.38)
1.8
(0.38)
2.0
(0.38)
1.0
(0.28)
1.1
(0.28)
1.2
(0.28)
0.031
(0.069)
0.20
(0.069)
0.26
(0.069
Malaise
Trapping c
All arthropods 0.048
(0.007)
0.022
(0.007)
0.016
(0.007)
0.050
(0.012)
0.013
(0.012)
0.010
(0.012)
0.015
(0.002)
0.011
(0.002)
0.010
(0.002)
0.025
(0.004)
0.010
(0.004)
0.004
(0.004)
Coleoptera 0.039
(0.006)
0.600
(0.006)
0.053
(0.006)
0.024
(0.005)
0.027
(0.005)
0.030
(0.005)
0.010
(0.003)
0.019
(0.003)
0.015
(0.003)
0.003
(0.001)
0.006
(0.001)
0.004
(0.001)
Diptera 0.198
(0.036)
0.051
(0.036)
0.032
(0.036)
0.322
(0.10)
0.027
(0.10)
0.009
(0.10)
0.054
(0.010)
0.009
(0.010)
0.006
(0.010)
0.024
(0.004)
0.008
(0.004)
0.001
(0.004)
Hymenoptera 0.090
(0.014)
0.041
(0.014)
0.021
(0.014)
0.018
(0.004)
0.014
(0.004)
0.006
(0.004)
0.008
(0.005)
0.012
(0.005)
0.012
(0.005)
0.011
(0.003)
0.008
(0.003)
0.004
(0.003)
Lepidoptera 0.074
(0.020)
0.021
(0.020)
0.013
(0.020)
0.023
(0.004)
0.018
(0.004)
0.015
(0.004)
0.021
(0.005)
0.024
(0.005)
0.032
(0.005)
0.100
(0.020)
0.030
(0.020)
0.009
(0.020)
Pitfall Traps c
Page 62
54
All arthropods 1.2
(0.17)
0.75
(0.17)
0.91
(0.17)
1.3
(0.19)
1.0
(0.19)
0.67
(0.19)
0.71
(0.14)
0.99
(0.14)
1.1
(0.14)
0.35
(0.053)
0.28
(0.053)
0.28
(0.053)
Araneae 2.3
(0.45)
1.2
(0.45)
1.3
(0.45)
2.8
(1.0)
2.1
(1.0)
1.1
(1.0)
0.85
(0.43)
1.8
(0.43)
0.68
(0.43)
0.46
(0.11)
0.42
(0.11)
0.27
(0.11)
Coleoptera 0.59
(0.23)
0.74
(0.23)
1.0
(0.23)
0.77
(0.41)
1.6
(0.41)
0.59
(0.41)
0.54
(0.18)
0.91
(0.18)
1.7
(0.18)
0.62
(0.13)
0.71
(0.13)
0.56
(0.13)
Diptera 4.4
(0.83)
2.2
(0.83)
1.7
(0.83)
3.3
(0.50)
1.7
(0.50)
0.98
(0.50)
0.84
(0.16)
0.81
(0.16)
1.2
(0.16)
0.85
(0.16)
0.49
(0.18)
0.35
(0.16)
Hymenoptera 1.3
(0.47)
1.3
(0.47)
1.9
(0.47)
1.4
(0.24)
0.96
(0.24)
0.89
(0.24)
2.2
(0.69)
2.2
(0.69)
2.8
(0.69)
0.24
(0.077)
0.17
(0.077)
0.28
(0.077)
Orthoptera 0.35
(0.11)
0.43
(0.10)
0.27
(0.10)
0.59
(0.14)
0.88
(0.15)
0.52
(0.14)
0.49
(0.10)
0.66
(0.10)
0.61
(0.10)
0.15
(0.03)
0.15
(0.029)
0.10
(0.03)
a number of arthropods/g dry foliage
b numbers in table for foliage clipping arthropods are estimate*100
c g/day
Page 63
55
Table 2. Relationship between bird abundance (mist net captures per 100 net hrs) and
arthropod availability in a bottomland hardwood forest on the Savannah River Site, South
Carolina, 2001-2002. Positive or negative relationships are indicated in parentheses.
Dependent variable Independent variablesa F DF P
Bird and foliage-dwelling arthropods
All birds All Arthropods (-) 1.47 1/33 0.234
All arthropods*season 1.16 3/33 0.340
Lepidoptera (-) 3.19 1/33 0.0831
Lepidoptera*season 1.62 3/33 0.202
Insectivores All arthropods (-) 0.05 1/33 0.825
All arthropods*season 0.83 3/33 0.489
Lepidoptera (-) 5.08 1/33 0.0312
Lepidoptera*season 2.25 3/33 0.101
Foliage gleaners All arthropods (-) 0.48 1/33 0.493
All arthropods*season 5.44 3/33 0.0044
Spring (-) 1.17 33 0.287
Breeding (+) 18.49 33 0.0001
Post-breeding (+) 9.36 33 0.0044
Fall (-) 5.43 33 0.0261
Lepidoptera (-) 1.22 1/33 0.277
Arthropod*season 1.60 3/33 0.207
Hooded Warbler All arthropods (-) 0.11 1/33 0.748
All arthropods*season 0.53 3/33 0.668
Araneae (-) 2.02 1/33 0.164
Araneae*season 1.24 3/33 0.311
Page 64
56
Coleoptera (+) 4.61 1/33 0.0391
Coleoptera*season 5.79 3/33 0.0027
Spring (-) 6.60 33 0.0150
Breeding (+) 1.69 33 0.201
Post-breeding (-) 4.67 33 0.0384
Fall (+) 5.62 33 0.0235
Lepidoptera (-) 1.30 1/33 0.0621
Lepidoptera*season 0.70 3/33 0.560
Northern Cardinal All Arthropods (-) 6.06 1/33 0.0192
All arthropods*season 2.03 3/33 0.129
Araneae (-) 4.22 1/33 0.0479
Araneae*season 2.15 3/33 0.113
Coleoptera (-) 3.66 1/33 0.0645
Coleoptera*season 0.49 3/33 0.693
Lepidoptera (-) 1.08 1/33 0.307
Lepidoptera*season 3.14 3/33 0.0381
Spring (-) 1.23 33 0.274
Breeding (-) 7.24 33 0.0111
Post-breeding (+) 1.77 33 0.193
Fall (+) 3.57 33 0.0675
White-eyed Vireo All arthropods (+) 2.93 1/33 0.0965
All arthropods*season 1.48 3/33 0.237
Araneae (+) 1.18 1/33 0.285
Araneae*season 2.16 3/33 0.112
Coleoptera (+) 2.60 1/33 0.117
Coleoptera*season 1.07 3/33 0.376
Lepidoptera (+) 31.51 1/33 0.0001
Page 65
57
Lepidoptera*season 20.62 3/33 0.0001
Spring (+) 5.43 33 0.0261
Breeding (+) 46.51 33 0.0001
Post-breeding (-) 0.0025 33 0.964
Fall (-) 0.073 33 0.789
Black-throated Blue Warbler All arthropods (-) 0.85 1/33 0.363
All arthropods*season 3.13 3/33 0.0862
Araneae (-) 0.21 1/33 0.651
Araneae*season 2.87 1/33 0.0994
Coleoptera (-) 0.00 1/33 0.957
Coleoptera*season 0.10 1/33 0.758
Lepidoptera (-) 0.00 1/33 0.964
Lepidoptera*season 0.26 1/33 0.613
Kentucky Warbler All arthropods (+) 1.05 1/33 0.312
All arthropods*season 1.54 2/33 0.229
Araneae (-) 0.04 1/33 0.846
Araneae*season 0.08 2/33 0.921
Coleoptera (-) 0.35 1/33 0.559
Coleoptera*season 0.09 2/33 0.911
Lepidoptera (+) 5.52 1/33 0.0249
Lepidoptera*season 1.91 2/33 0.164
Birds and ground-dwelling arthropods
All birds All arthropods (+) 0.72 1/33 0.401
All arthropods*season 5.79 3/33 0.0027
Spring (-) 2.69 33 0.111
Breeding (+) 0.058 33 0.811
Page 66
58
Post-breeding (-) 3.53 33 0.0695
Fall (+) 0.59 33 0.448
Insectivores All arthropods (+) 0.00 1/33 0.959
All arthropods*season 5.37 3/33 0.0040
Spring (-) 3.92 33 0.0561
Breeding (+) 0.56 33 0.460
Post-breeding (-) 5.24 33 0.0283
Fall (+) 1.90 33 0.178
Ground gleaners All arthropods (-) 2.06 1/33 0.161
All arthropods*season 0.62 3/33 0.606
Carolina Wren All arthropods (-) 1.98 1/33 0.169
All arthropods*season 0.35 3/33 0.789
Araneae (-) 0.00 1/33 0.968
Aranae*season 0.37 3/33 0.778
Coleoptera (+) 0.01 1/33 0.943
Coleoptera*season 0.28 3/33 0.837
Birds and flying arthropods
All birds All arthropods (+) 0.16 1/33 0.690
All arthropods*season 0.27 3/33 0.843
Insectivores All arthropods (+) 0.07 1/33 0.787
All arthropods*season 0.79 3/33 0.511
Aerial salliers All arthropods (-) 4.02 1/33 0.0531
All arthropods*season 1.29 3/33 0.293
Acadian Flycatcher All arthropods (-) 6.15 1/33 0.0184
All arthropods*season 2.23 3/33 0.104
Coleoptera (+) 2.38 1/33 0.133
Page 67
59
Coleoptera*season 0.71 3/33 0.555
a Each arthropod variable was tested against bird abundance in a separate model, which also
included season and net location as fixed effects to control for their influence. Given here
are the results only for arthropod variables and their interactions with season.
Page 68
60
Table 3. Relationship between bird abundance (mist net captures per 100 net hrs) and
understory (0-3 m) vegetation density in a bottomland hardwood forest on the Savannah
River Site, South Carolina, 2001-2002. Numerator DF is 1 and denominator DF is 26 for
each category.
Bird Group Season F P
All birds Spring (+) 114.65 0.0001
Breeding (+) 7.38 0.0116
Post-breeding (+) 9.56 0.0047
Fall (+) 62.37 0.0001
Insectivores Spring (+) 111.97 0.0001
Breeding (+) 5.56 0.0261
Post-breeding (+) 3.14 0.0884
Fall (+) 49.19 0.0001
Foliage gleaners Spring (+) 131.37 0.0001
Breeding (+) 22.64 0.0001
Post-breeding (+) 17.08 0.0003
Fall (+) 47.07 0.0001
Ground gleaners Spring (+) 9.99 0.0040
Breeding (-) 1.00 0.327
Post-breeding (-) 3.89 0.0592
Fall (+) 16.60 0.0004
Aerial salliers Spring (-) 2.45 0.130
Breeding (+) 0.02 0.890
Page 69
61
Post-breeding (+) 6.19 0.0196
Fall (+) 4.60 0.0415
Carolina Wren Spring (+) 0.08 0.777
Breeding (-) 2.05 0.164
Post-breeding (-) 3.69 0.0659
Fall (-) 0.38 0.543
Hooded Warbler Spring (+) 17.00 0.0003
Breeding (+) 0.81 0.376
Post-breeding (+) 8.61 0.0069
Fall (+) 3.68 0.0662
Northern Cardinal Spring (+) 1.23 0.278
Breeding (+) 2.24 0.147
Post-breeding (+) 8.53 0.0071
Fall (+) 10.34 0.0035
White-eyed Vireo Spring (+) 40.88 0.0001
Breeding (+) 13.83 0.0010
Post-breeding (+) 2.82 0.105
Fall (+) 6.47 0.0172
Black-throated Blue Warbler Spring (+) 27.16 0.0001
Fall (+) 5.71 0.0244
Kentucky Warbler Spring (+) 0.90 0.351
Breeding (+) 0.14 0.711
Post-breeding (+) 1.07 0.311
Page 70
62
Fig. 1. Forest canopy gaps at Savannah River Site, Barnwell County, in the coastal
plain of South Carolina, USA. Gaps used for this study were 0.13, 0.26, and 0.5 ha and are
shown as solid circles. Other gaps not used for this study were <0.13, 0.13, 0.26, and 0.5 ha
and are shown as outlines.
Page 71
63
0
50
100
0-0.
25
0.25
-0.5
0.5-
0.75
0.75
-1
1-1.
5
1.5-
2
2-3
3-5
5-10
10-2
0
20-2
5
25-3
0
Height interval (m)
Perc
ent c
over
Gap
Edge
Forest
Fig. 2. Foliage height profiles for gap, edge, and forest net locations in a bottomland
forest in South Carolina, USA (2001-2002). Vegetation measures were collected in June of
each year.
Page 72
64
Fig. 3. Seasonal foliage-gleaning bird captures plotted against arthropod density
(number of arthropods per g of foliage) from foliage clippings for each net location in a
bottomland forest in South Carolina, USA (2001-2002).
Page 73
65
01020304050607080
0 0.05 0.1 0.15 0.2 0.25
Lepidopteran #/g foliage
Mea
n ca
ptur
es/1
00 n
et h
rGap
Edge
Forest
Fig. 4. Insectivore captures plotted against Lepidopteran density (number of
Lepidopterans per g of foliage) from foliage clippings for each net location in a bottomland
forest in South Carolina, USA (2001-2002).
Page 74
66
05
1015202530
0 1 2 3
Arthropod g/day
Mea
n ca
ptur
es/1
00 n
et h
rGap
Edge
Forest
Fig. 5. Ground gleaner bird captures plotted against arthropod biomass (g/day) from
pitfall trapping for each net location in a bottomland forest in South Carolina, USA (2001-
2002).
Page 75
67
0123456
0 0.05 0.1 0.15
Arthropod g/day
Mea
n ca
ptur
es/1
00 n
et h
r
Gap
Edge
Forest
Fig. 6. Aerial sallier bird captures plotted against arthropod biomass (g/day) from
Malaise trapping for each net location in a bottomland forest in South Carolina, USA (2001-
2002).
Page 76
68
Fig. 7. Seasonal foliage gleaner captures plotted against mean understory foliage
density (mean vegetation pole touches per understory height interval) for each net location
in a bottomland forest in South Carolina, USA (2001-2002).
Page 77
69
Appendix 1. List of all birds observed with habitat, foraging, migration, and food preference
guild associations. Species included in this list were detected by mist netting or area counts
at least once.
Speciesa Scientific Name Foraging Group Food Type
Acadian Flycatcher Empidonax virescens sallier insectivore
American Redstart Setophaga ruticilla foliage gleaner insectivore
Bicknell's Thrush Catharus bicknelli ground gleaner omnivore
Black and White Warbler Mniotilta varia bark gleaner insectivore
Black-throated Blue Warbler Dendroica caerulescens foliage gleaner insectivore
Blue-gray Gnatcatcher Polioptila caerulea foliage gleaner insectivore
Blue-headed Vireo Vireo solitarius foliage gleaner insectivore
Blue-winged Warbler Vermivora pinus foliage gleaner insectivore
Brown Thrasher Toxostoma rufum ground gleaner omnivore
Carolina Chickadee Poecile carolinensis foliage gleaner insectivore
Carolina Wren Thryothorus ludovicianus ground gleaner insectivore
Chestnut-sided Warbler Dendroica pensylvanica foliage gleaner insectivore
Common Yellowthroat Geothlypis trichas foliage gleaner insectivore
Downy Woodpecker Picoides pubescens bark gleaner insectivore
Eastern Towhee Pipilo erythrophthalmus ground gleaner omnivore
Eastern Tufted Titmouse Baeolophus bicolor foliage gleaner omnivore
Golden-winged Warbler Vermivora chrysoptera foliage gleaner insectivore
Gray Catbird Dumetella carolinensis foliage gleaner omnivore
Gray-cheeked Thrush Catharus minimus ground gleaner omnivore
Great Crested Flycatcher Myiarchus crinitus sallier insectivore
Hooded Warbler Wilsonia citrina foliage gleaner insectivore
Indigo Bunting Passerina cyanea ground gleaner omnivore
Page 78
70
Kentucky Warbler Oporornis formosus foliage gleaner insectivore
Louisiana Waterthrush Seiurus motacilla ground gleaner insectivore
Magnolia Warbler Dendroica magnolia foliage gleaner insectivore
Northern Cardinal Cardinalis cardinalis foliage gleaner omnivore
Northern Parula Parula americana foliage gleaner insectivore
Northern Waterthrush Seiurus noveboracensis ground gleaner insectivore
Orange-crowned Warbler Vermivora celata foliage gleaner insectivore
Ovenbird Seiurus aurocapillus ground gleaner insectivore
Pileated Woodpecker Dryocopus pileatus bark gleaner insectivore
Pine Warbler Dendroica pinus foliage gleaner insectivore
Prairie Warbler Dendroica discolor foliage gleaner insectivore
Red-bellied Woodpecker Melanerpes carolinus bark gleaner insectivore
Red-eyed Vireo Vireo olivaceus foliage gleaner insectivore
Red-headed Woodpecker Melanerpes erythrocephalus bark gleaner insectivore
Ruby-crowned Kinglet Regulus calendula foliage gleaner insectivore
Ruby-throated Hummingbird Archilochus colubris foliage gleaner omniivore
Summer Tanager Piranga rubra foliage gleaner insectivore
Swainson's Thrush Catharus ustulatus ground gleaner insectivore
Swainson's Warbler Limnothlypis swainsonii ground gleaner insectivore
Swamp Sparrow Melospiza georgiana ground gleaner omnivore
Traill's Flycatcher Empidonax spp. hover gleaner insectivore
Veery Catharus fuscescens ground gleaner omnivore
White-eyed Vireo Vireo griseus foliage gleaner insectivore
White-throated Sparrow Zonotrichia albicollis ground gleaner omnivore
Winter Wren Troglodytes troglodytes ground gleaner insectivore
Wood Thrush Hylocichla mustelina ground gleaner omnivore
Worm Eating Warbler Helmitheros vermivorus foliage gleaner insectivore
Page 79
71
Yellow-bellied Sapsucker Sphyrapicus varius bark gleaner insectivore
Yellow-billed Cuckoo Coccyzus americanus foliage gleaner insectivore
Yellow-breasted Chat Icteria virens foliage gleaner insectivore
a American Ornithologists’ Union (1998)
Page 80
72
CHAPTER 3
Seasonal bird diets SEASONAL BIRD DIETS IN A BOTTOMLAND FOREST Liessa T. Bowen Christopher E. Moorman John C. Kilgo Clyde E. Sorenson James L. Hanula Scott Horn Liessa T. Bowen, North Carolina State University, Department of Forestry, Campus Box 8002, Raleigh, NC 27695-8002; Christopher E. Moorman, North Carolina State University, Department of Forestry, Campus Box 8003, Raleigh, NC 27695-8003; John C. Kilgo, Research Wildlife Biologist, Southern Research Station, USDA Forest Service- Savannah River, PO Box 700, New Ellenton SC 29809; Clyde E. Sorenson, North Carolina State University, Department of Entomology, Campus Box 7630, Raleigh, NC 27695-7630; James L. Hanula and Scott Horn, USDA Forest Service, 320 Green St., Athens, GA 30602-2044 Christopher E. Moorman, North Carolina State University, Department of Forestry, Campus Box 8003, Raleigh, NC 27695-8003, [email protected]
Page 81
73
Abstract. Canopy gaps in bottomland hardwood forests provide important habitat for
a wide variety of both migratory and resident bird species. Little is known about how birds
forage in relation to arthropod availability, and less is known about how these patterns vary
seasonally. We captured birds using mist netting and then used a warm water crop-flush to
gather information about arthropods eaten over multiple bird-use seasons. We used leaf
clipping and pitfall trapping to determine which arthropod groups were available to foliage-
gleaning birds and ground-gleaning birds. Individual bird species and foraging guilds
analyzed included Carolina Wren (Thryothorus ludovicianus), Hooded Warbler (Wilsonia
citrina), Kentucky Warbler (Oporornis formosus), White-eyed Vireo (Vireo griseus),
foliage-gleaning birds and ground-gleaning birds. The arthropod orders Coleoptera,
Lepidoptera, and Araneae represented the highest percentages of total bird diet for each bird
species and group analyzed. We compared bird use vs. availability of potential prey items
and ranked the most frequent prey items by degree of selection or avoidance. In general,
birds selected Coleopterans and Hemipterans during all seasons and avoided Aranids and
Hymenopterans during all seasons. Bird diet analysis did not demonstrate a consistent
selection pattern for other arthropod orders (Dipterans, Homopterans, Lepidopterans, and
Orthopterans). Ground-gleaning birds demonstrated a stronger selection for Homopterans
and Lepidopterans than foliage-gleaners. Individual bird species and guilds tended to
consistently select or avoid certain groups of arthropods from spring through fall migration,
with no apparent seasonal shift in diet preference among arthropod orders.
Key words: Birds, bottomland forest, crop flushing, diet analysis, prey selection
Page 82
74
INTRODUCTION
Passerine birds feed almost continuously during daylight hours (Stevenson 1933), and food
resource availability is thought to be a driving force behind habitat selection (Blake and
Hoppes 1986, Holmes et al. 1986, Johnson and Sherry 2001). Bird prey selection is
influenced by prey availability, including proximity, detection, acceptance, pursuit, and
successful capture of a potential prey item (Wolda 1990). However, little is known about
food preferences of certain passerine species (Evans and Stutchburg 1994, McDonald 1998),
or about how birds’ prey-selection patterns change across seasons.
Canopy gaps within mature forest provide additional habitat for birds. Both natural
gaps (Willson et al. 1982, Martin and Karr 1986) and group-selection harvest gaps (Kilgo et
al. 1999, Moorman and Guynn 2001) typically contain greater numbers of birds than the
surrounding mature forest. Arthropod populations also are affected by forest canopy gaps,
and earlier stages of gap succession may support greater arthropod abundance than older
forest canopy gaps (Ulyshen et al. 2004). Flying arthropods may be more abundant in gap
habitats than surrounding forest, while other groups, such as ground-dwelling arthropods
have been reported in lower numbers in gap habitat (Greenberg and Forrest 2003).
Accurately determining prey availability, as perceived by a bird, is a research
challenge with many potential biases (Johnson 1980, Cooper and Whitmore 1990,
Rosenberg and Cooper 1990, Wolda 1990). A bird’s ability to capture prey is determined,
in part, by vegetation structure in the foraging habitat (Robinson and Holmes 1982),
arthropod prey characteristics, such as life stage, activity level, and palatability (Cooper and
Whitmore 1990), and the bird’s behavior and search tactics (Hutto 1990). Several direct
observations of bird diets have shown certain arthropod groups to be preferred over others
Page 83
75
(Raley and Anderson 1990, Sillett 1994, Deloria-Sheffield et al. 2001, McMartin et al. 2002,
Yard et al. 2004), but none of these studies has addressed bird-arthropod relationships in
eastern deciduous forests.
Our goals were to examine both arthropod availability and prey selection by
insectivorous birds, both in and around small-scale forest canopy gaps in a southeastern
bottomland hardwood forest. We sought to determine whether birds exhibited a seasonal
shift in prey use from spring migration through fall migration. We compared percentages of
arthropod groups both available to and consumed by foliage-gleaning and ground-gleaning
passerine birds to determine whether birds selected arthropod prey items in relative
proportion to their availability.
METHODS
We surveyed birds and arthropods during four avian activity periods (hereafter, seasons) in
2001 and 2002: spring migration (25 March through 15 May), breeding (16 May through 30
June), post-breeding (1 July through 31 August), and fall migration (1 September through 18
October). We established a sampling transect radiating southward from the center of each of
12 gaps with three bird and arthropod sampling stations along each transect: one in the gap
center; one at the southern edge; and one 50 m into the forest.
STUDY AREA
We conducted this research during 2001 and 2002 at the Savannah River Site (SRS), a
78000-ha National Environmental Research Park owned and operated by the U. S.
Department of Energy. Our study site was a mature stand of bottomland hardwoods
approximately 120 ha in size, located in Barnwell County in the Upper Coastal Plain of
South Carolina. We surveyed birds and arthropods in 12 group-selection gaps harvested in
Page 84
76
December 1994 and in the mature forest adjacent to gaps. The gaps were of three sizes
(0.13, 0.26, and 0.50 ha) with four replicates of each size. The mature forest canopy was
dominated by laurel oak (Quercus laurifolia), cherrybark oak (Q. falcata var. pagodaefolia),
sweetgum (Liquidambar styraciflua), and loblolly pine (Pinus taeda). The midstory was
poorly developed, consisting primarily of red mulberry (Morus rubra), ironwood (Carpinus
carolinianus), and American holly (Ilex opaca). The understory was dominated by dwarf
palmetto (Sabal minor) and switchcane (Arundinaria gigantea). Vegetation in the gaps
varied from approximately 1-8 m in height and was dominated by regenerating trees
(primarily sweetgum, loblolly pine, sycamore [Platanus occidentalis], green ash [Fraxinus
pennsylvanica], oaks, and black willow [Salix nigra]) and dense stands of blackberry (Rubus
spp.), dwarf palmetto, and switchcane.
MIST NETTING
Continuous operation mist nets were located at each of the three sampling stations at each of
the 12 study gaps. During the spring migration, post-breeding, and fall migration seasons,
netting was conducted once each week at each station, rotating between stations on a regular
weekly schedule. During the breeding season, nets were operated once every two weeks
because birds tend to remain fairly stationary during this period. Nets were opened at first
light and operated for 4-6 h, depending on daily weather conditions. We did not conduct
netting when wind exceeded 16 km per hour or during steady rainfall. We used 12-m long x
3-m tall nets, with 30-mm mesh. Captured birds were aged and sexed (Pyle et al. 1987),
weighed, and banded with a USGS Biological Resources Division aluminum leg band.
CROP-FLUSHING
Page 85
77
We used a warm water crop-flush to identify the proportions of various arthropod orders
consumed by birds (Rosenberg and Cooper 1990). We selected several target species for
crop-flushing, including Carolina Wren (Thryothorus ludovicianus), Hooded Warbler
(Wilsonia citrina), Kentucky Warbler (Oporornis formosus), and White-eyed Vireo (Vireo
griseus). Other medium-sized insectivorous species caught were also crop-flushed, but in
lower numbers (TABLE 1). We did not crop-flush the same individual twice in one season
and did not crop-flush individual birds that appeared stressed. We inserted a thin, flexible,
10-cm plastic tube down the throat and into the crop. Using a small syringe, we slowly
squirted warm water into the crop as we withdrew the tube, and caught the regurgitate in a
shallow plastic dish. We preserved samples in 70% alcohol. We then sorted, counted, and
identified arthropod fragments to order using a dissecting microscope and entomology
reference book (Gillott 1995). We identified the most frequently encountered orders by the
following fragments (FIGURE 1): Araneae (mouthparts, leg fragments); Coleoptera
(mandibles, elytra, leg fragments); Diptera (antennae, eyes, wings, foot pads/empodium);
Hemiptera (mouthparts, wing fragments, leg fragments, scutella); Homoptera (mouthparts,
leg fragments, ovipositor); Hymenoptera (mouthparts, leg fragments, various body
fragments, wing fragments); Lepidoptera (adult wing scales, larval mandibles, setae,
crochets, integument, and spherical plates); and Orthoptera (leg fragments, nymphal
wingpads, and stridulatory organ). Exact numbers of individuals were difficult to estimate
because of the high degree of fragmentation, and as a result, we estimated numbers
conservatively.
ARTHROPOD SAMPLING
Page 86
78
During each season in 2001 and 2002, we sampled foliage-dwelling and ground-dwelling
arthropods at each station. We used foliage clipping (Cooper and Whitmore 1990) to
sample foliage-dwelling arthropods on each of five target plant species groups. (1) white
oaks (white oak [Quercus alba], swamp chestnut oak [Quercus michauxii], overcup oak
[Quercus lyrata], Durand oak [Quercus durandii]), (2) lobed red oaks (cherrybark oak), (3)
unlobed red oaks [water oak (Quercus nigra), laurel oak, willow oak (Quercus phellos)], (4)
sweetgum, and (5) switchcane. This group of species was selected to represent dominant
members of both the understory and overstory, as well as species important as avian
foraging substrates (J. C. Kilgo and C. E. Moorman, pers. obs.). Each sample consisted of
25 branch tips from each target species group (total sample=125 branch tips) collected in the
vicinity of each sampling station (i.e. staying within the target habitat type). Each branch-tip
clipping was between 2.54 and 15.24 cm and usually came from the end of a branch that
included several leaves. We collected foliage from ground level to about 2.5 m, and
immediately placed clippings in plastic bags. Samples of target species occasionally were
difficult to find, so not all samples included 125 clippings. Once collected, we placed
samples in a freezer for 24 hrs, shook the foliage to collect the arthropods, put them in
alcohol, and identified them to order.
We sampled ground-dwelling arthropods using two pitfall traps (Cooper and
Whitmore 1990) at each sampling station. We used 7-day trapping periods in 2001 and 2-
day trapping periods in 2002, and operated the traps once during each season. The pitfall
traps consisted of a 480-ml plastic cup buried to ground level, with a small funnel (8.4 cm
diameter) to direct arthropods into a smaller 120-ml specimen cup. The trap was positioned
at the intersection of two 1-m long drift fences. Two pitfall traps were placed 5 m apart at
Page 87
79
each station. The collecting jars were filled with a detergent and NaCl-formaldehyde
solution (New and Hanula 1998). Samples were dried, weighed, stored in 70% alcohol, and
identified to order.
ANALYSIS
For each of the four bird-use seasons, we examined the relationships between bird species
(Carolina Wren, Hooded Warbler, Kentucky Warbler, and White-eyed Vireo) or foraging
guild (foliage-gleaners and ground-gleaners) and potential arthropod prey items. Both bird
crop-flush samples and arthropod availability samples from foliage clipping and pitfall
trapping were summarized by percentages, i.e., the percentage of the entire crop-flush or
arthropod availability sample containing a particular arthropod order. Bird and arthropod
data were averaged between years and among sampling locations (gap, edge, forest).
Arthropod abundance may not reflect actual prey availability, as birds may not eat all
potentially available arthropods, depending on prey size, life stage, palatability, color, and
activity pattern (Cooper and Whitmore 1990). Differences in proportional availability vs.
use of arthropod prey items may also be attributed to bird foraging strategy and arthropod
distribution (Raley and Anderson 1990). Additionally, bird diets may differ depending upon
season, time of day, habitat type, and sex of the bird (Wheelwright 1986). Because birds do
not forage equally on all available potential prey items, and because of the great number of
factors affecting prey selection, it may be difficult to interpret bird diet analyses. We
attempted to minimize this bias by matching as closely as possible each species’ preferred
foraging strategy with the most readily available arthropods. We compared foliage-gleaning
birds with foliage-dwelling arthropods, and ground-gleaning birds with ground-dwelling
arthropods.
Page 88
80
Our goal was to determine whether birds consumed arthropods in proportion to their
availability and whether proportional arthropod use changed seasonally. We used an index
developed by Jacobs (1974) to evaluate seasonal bird use of each arthropod order in relation
to its availability:
rppr
prDhb 2−+
−=
where Dhb is the index of arthropod use, r represents the mean percentage of the total crop-
flush sample arthropods representing a particular arthropod order, and p represents the mean
percentage of the total arthropod collection sample representing each arthropod order. We
then followed Morrison’s (1982) categorization of Dhb for selection and avoidance, ranging
from -1 to 1, where -1 to -0.81 = strong avoidance, -0.80 to -0.41 = moderate avoidance, -
0.40 to -0.16 = slight avoidance, -0.15 to 0.15 = no selection, 0.16 to 0.40 = slight selection,
0.41 to 0.80 = moderate selection, and 0.81 to 1 = strong selection.
RESULTS
CROP FLUSHING
We obtained 255 crop flushes from 15 bird species (TABLE 1) and identified 703 individual
prey items representing 15 arthropod orders. The most frequently encountered arthropod
orders, and those considered for analysis, included Coleoptera (29% of arthropods collected
during crop-flushing), Lepidoptera (19%), Araneae (17%), Hemiptera (9%), Homoptera
(7%), Diptera (5%), Hymenoptera (5%), and Orthoptera (5%). Together, these arthropod
orders comprised 96% of the arthropods encountered using crop-flushing. We counted only
11 entire arthropods representing several orders (Araneae, Diptera, Homoptera,
Hymenoptera, Psocoptera, and Thysanoptera).
Page 89
81
We also identified a category of “other” non-arthropod contents, including a few
small feathers, insect eggs, a small flower, and small seeds. Percentages of arthropods
found in bird diets represent only the total arthropod content of the crop-flushing, and any
non-arthropod (“other”) contents were disregarded. Plant material (usually seeds) occurred
in only 10 of the 255 crop-flush samples from several species: Hooded Warbler, Kentucky
Warbler, Ovenbird (Seiurus aurocapillus), Veery (Catharus fuscescens), and White-eyed
Vireo.
ARTHROPOD SAMPLING
Eight arthropod orders comprised 95% of total arthropod captures from foliage clipping.
These orders included Araneae (39% of total arthropods captured), Hymenoptera (15%),
Lepidoptera (13%), Coleoptera (12%), Homoptera (6%), Orthoptera (6%), Hemiptera (3%),
and Diptera (1%). These same eight orders comprised 93% of total pitfall captured
arthropods: Diptera (24%), Hymenoptera (23%), Araneae (22%), Coleoptera (15%),
Orthoptera (6%), Hemiptera (1%), Homoptera (1%), and Lepidoptera (1%).
ARTHROPOD USE VS. AVAILABILITY
Using Morrison’s (1982) rankings of selection and avoidance, Coleopterans, Hemipterans,
and Lepidopterans tended to be selected by all birds in all seasons, while Aranids and
Hymenopterans tended to be avoided by all birds in all seasons (TABLE 2). Dipterans were
well represented by pitfall traps but poorly represented by foliage clippings, and were
avoided by ground-gleaning birds and highly selected by foliage-gleaning birds. Similarly,
Lepidopterans were well represented by foliage clippings and poorly represented by pitfall
trapping, leading to a seemingly strong selection by ground gleaners and either no selection
or slight selection by foliage-gleaners. These data do not distinguish between larval and
Page 90
82
adult Lepidopterans, although most of the crop-flushed Lepidopterans represented larval
individuals. Overall, the most abundant foliage-dwelling arthropods were Aranids,
Lepidopterans, Coleopterans, and Hemipterans, and of these, foliage-gleaning birds selected
Coleopterans above all others during all seasons (FIGURE 2). The most abundant ground-
dwelling arthropods were Aranids, Coleopterans, Hemipterans, and Lepidopterans, and of
these, ground-gleaning birds selected Coleopterans above all others during all seasons
except the post-breeding season, when Coleopteran consumption was approximately
equivalent to that of Lepidopteran consumption (FIGURE 3).
DISCUSSION
Each bird species and group studied consumed three arthropod orders in the highest overall
proportions: Araneae, Coleoptera, and Lepidoptera. By comparing usage vs. availability of
arthropod orders, however, both the foliage-gleaning and ground-gleaning birds we studied
consistently consumed Coleopteran prey items in greater proportion than their relative
availability during all seasons. Other direct observation studies of bird diets have also
shown strong avian selection for Coleopterans (Robinson and Holmes 1982, Wheelwright
1986, Raley and Anderson 1990, Sillett 1994, Poulin and Lefebvre 1996, McMartin et al.
2002, Yard et al. 2004). We also found proportionally greater consumption of Hemipteran
prey items than relative availability during all seasons and for all bird groups analyzed.
Hemipterans, however, represented a low proportion of total bird diet composition, and
indeed, Hemipterans have not previously been identified as a selected food resource. Both
foliage-gleaning and ground-gleaning birds in our study consistently consumed Aranid and
Hymenopteran prey items in the lowest proportions relative to availability during all
seasons, though both orders are reportedly common avian food items elsewhere (Robinson
Page 91
83
and Homes 1982, Poulin and Lefebvre 1996, Yard et al. 2004), and Aranids represented a
high overall proportion of total bird diet composition in our study as well. Avian
consumption or avoidance of other arthropod orders (Dipterans, Homopterans,
Lepidopterans, and Orthopterans) during our study was less consistent, varying considerably
between bird foraging guild and season. Other researchers have reported Lepidopterans as
an important avian food resource for insectivorous birds (Robinson and Holmes 1982,
Wheelwright 1986, McMartin et al. 2002, Yard et al. 2004), and our data suggests that
Lepidopterans comprise a high percentage of total bird diet as well. We found the highest
proportion of Lepidopterans, relative to availability, only in ground-gleaning birds.
Homopterans were reported as a selected food item by Robinson and Holmes (1982) and
Deloria-Sheffield et al. (2001) but Raley and Anderson (1990) found them to be avoided. In
our study, the proportion of Homopterans in crop-flushes from ground-gleaning birds was
higher than the percent available, but similar to the percent available for foliage-gleaning
birds.
For individual species, our findings were generally consistent with previous reports,
but some exceptions existed. For each individual species examined, Coleopterans, Aranids,
and Lepidopterans comprised the highest percentages of the total diet. In our study, relative
to availability, crop-flushes of both Hooded Warblers and Kentucky Warblers contained
higher proportions of Coleopterans, Dipterans, and Hemipterans during all seasons, and
lower proportions of Aranids, Hymenopterans, and Orthopterans. Evans and Stutchbury
(1994) similarly reported that the main diet of Hooded Warblers included Coleopterans and
Dipterans, but in contrast to our findings, they also reported that Aranids, Lepidopterans,
and Orthopterans were important components of the diet. Likewise, our findings for
Page 92
84
Kentucky Warblers contrast those of McDonald (1998), who reported that the primary diet
this species consisted of Lepidopterans and Aranids. We found White-eyed Vireos
consumed relatively higher proportions of Coleopterans, Dipterans, and Hemipterans during
all seasons, but lower proportions of Aranids and Hymenopterans. Hopp et al. (1995)
describe the White-eyed Vireo diet to consist primarily of Lepidopterans, Coleopterans,
Dipterans, and Aranids. Finally, we found Carolina Wrens to consistently consume higher
proportions of Coleopterans, Hemipterans, Homopterans, and Lepidopterans. Haggerty and
Morton (1995) describe the diet of Carolina Wrens as consisting primarily of Lepidopterans,
Hemipterans, and Coleopterans. Despite these inconsistencies in avian diet preferences,
arthropod orders that are consumed in lower proportions than their relative availability may
still be an important component of avian diets (Raley and Anderson 1990). Our sampling
suggests that each species selects some arthropod groups before others, but also consumes a
variety of other prey items as well, including several groups used less than their proportional
availability.
Direct observations of avian diets, such as ours, are complicated by the highly
variable digestion rates of different arthropod orders (Mook and Marshall 1965, Swanson
and Bartonek 1970, Rosenberg and Cooper 1990). Prey item digestibility depends on prey
size, prey body type (soft or hard), and the overall condition of the bird (Custer and Pitelka
1975). Caterpillars and other soft-bodied insect larvae are more easily digested than
arthropods with hard body-parts and may, therefore, be underrepresented in bird diet
samples (Wheelwright 1986). The time between prey ingestion and prey-item sampling
must also be considered. Birds caught in nets continue to digest prey (Rosenberg and
Cooper 1990), while in the nets and while being transported to the banding station (Mook
Page 93
85
and Marshall 1965, Rosenberg and Cooper 1990). In one study, invertebrate material in
birds’ stomachs became uncountable and unrecognizable after just 40 minutes, with soft-
bodied (Aranid) arthropods disappearing faster than hard-bodied (Coleopteran) arthropods
(Custer and Pitelka 1975). In another study, the average passage time from consumption to
excretion was just 1.5 h (Stevenson 1933). Because of the lag between capture time and
crop-flushing and the highly fragmented nature of the arthropods we found during crop-
flushing, it seems likely that many of the prey items ingested were already moderately
digested and may have moved further down the digestive tract before crop-flushing
occurred. Thus, proportions of soft-bodied arthropods, such as Aranids and Lepidopterans,
are probably underrepresented in our analyses, and may be more important in bird diets than
indicated by our results. Additionally, when sampling occurs after prey items are partially
digested, correct identification of highly fragmented arthropods can become very difficult
(Rosenberg and Cooper 1990). These caveats notwithstanding, because we regularly
identified both hard-bodied and soft-bodied prey items, we believe that our data represent
the wide variety of prey items consumed by birds during different seasons.
Coleopterans comprised the highest overall proportions of all bird diet samples
collected. Relative to proportional availability, the two most heavily selected arthropod
orders overall, the Coleopterans and the Hemipterans, were generally more abundant in the
forest than in gaps during all seasons (Bowen 2004). Forest habitat, therefore, appears to
provide necessary arthropod prey items and valuable foraging opportunities. We detected
many bird species and foraging groups, however, more commonly in regenerating canopy
gaps (Bowen 2004). Increased foliage density in gaps was not accounted for when
calculating overall arthropod availability and for foliage-dwelling arthropods in particular,
Page 94
86
prey items per g of foliage may be greater in gaps than our data suggests. Forest managers
and those wishing to manage habitat for breeding and migratory birds should provide a
forested landscape capable of supporting a variety of bird species but also a variety of
arthropod prey items. A large mature bottomland forest perforated by small-scale canopy
gaps may provide sufficient habitat and arthropod prey resources for foliage-gleaning and
ground-gleaning birds across multiple seasons. Regenerating canopy gaps provide dense
understory vegetation that may also offer valuable foraging and resting areas safe from
predators.
ACKNOWLEDGMENTS
Financial support for this project was provided by the USDA CSREES National Research
Initiative Competitive Grants Program (Award No. 00-35101-9307), North Carolina State
University, and the U.S. Forest Service Southern Research Station. We thank the U.S.
Department of Energy - Savannah River for providing access to the study site and the U.S.
Forest Service - Savannah River for logistical support, with a special thank you to John
Blake and Ed Olson. We thank R. Lancia, D. Robison, and T. Simons for reviewing this
manuscript. We are grateful for field and laboratory assistance from T. Champlin, D. Dyer,
S. Junker, K. Mack, J. Pitts, W. Sikora, C. Smith, M. Ulyshen, and D. Westerman.
LITERATURE CITED
Blake, J. G. and W. G. Hoppes. 1986. Influence of resource abundance on use of tree-fall
gaps by birds in an isolated woodlot. Auk 103:328-340.
Bowen, L. T. 2004. Seasonal relationships between birds and arthropods in bottomland
forest canopy gaps. Ph.D.dissertation, North Carolina State University, Raleigh, NC.
Page 95
87
Cooper, R. J. and R. C. Whitmore. 1990. Arthropod sampling methods in ornithology.
Studies in Avian Biology 13:29-37.
Custer, T. W. and F. A. Pitelka. 1975. Correction factors for digestion rates for prey taken
by snow buntings (Plectrophenax nivalis). Condor 77:210-212.
Deloria-Sheffield, C. M., K. F. Millenbah, C. I. Bocetti, P. W. Sykes, Jr., and C. B. Kepler.
2001. Kirtland's Warbler diet as determined through fecal analysis. Wilson Bulletin
113:384-387.
Evans, L. J. and B. J. Stutchburg. 1994. Hooded Warbler (Wilsonia citrina) in The Birds of
North America, No. 110 (A. Poole and F. Gill, eds.). The Birds of North America, Inc.,
Philadelphia, PA.
Gillott, C. 1995. Entomology, 2nd edition, Plenum Press, New York, NY.
Greenberg, C. H. and T. G. Forrest. 2003. Seasonal abundance of ground-occurring
macroarthropods in forest and canopy gaps in the southern Appalachians. Southeastern
Naturalist 2:591-608.
Haggerty, T. M. and E. S. Morton. 1995. Carolina Wren (Thryothorus ludovicianus) in The
Birds of North America, No. 188 (A. Poole and F. Gill, eds.). The Birds of North America,
Inc., Philadelphia, PA.
Holmes, R. T., T. W. Sherry, and F. W. Sturges. 1986. Bird community dynamics in a
temperate deciduous forest: long-term trends at Hubbard Brook. Ecological Monographs
56:201-220.
Hopp, S. L., A. Kirby, and C. A. Boone. 1995. White-eyed Vireo (Vireo griseus) in The
Birds of North America, No. 168 (A. Poole and F. Gill, eds.). The Birds of North America,
Inc., Philadelphia, PA.
Page 96
88
Hutto, R. L. 1990. Measuring the availability of food resources. Studies in Avian Biology
13:20-28.
Jacobs, J. 1974. Quantitative measurement of food selection: a modification of the forage
ratio and Ivlev’s Electivity Index. Oecologia 14:413-417.
Johnson, D. H. 1980. The comparison of usage and availability measurements for evaluating
resource preference. Ecology 61:65-71.
Johnson, M. D. and T. W. Sherry. 2001. Effects of food availability on the distribution of
migratory warblers among habitats in Jamaica. Journal of Animal Ecology 70:546-560.
Kilgo, J. C., K. V. Milller, and W. P Smith. 1999. Effects of group-selection timber harvest
in bottomland hardwoos on fall migrant birds. Journal of Field Ornithology 70:404-413.
Martin, T. E. and J. R. Karr. 1986. Patch utilization by migrating birds: resource oriented?
Ornis Scandanavica 17:165-174.
McDonald, M. V. 1998. Kentucky Warbler (Oporonia formosus) in The Birds of North
America, No. 324 (A. Poole and F. Gill, eds.). The Birds of North America, Inc.,
Philadelphia, PA.
McMartin, B., I. Bellocq, and S. M. Smith. 2002. Patterns of consumption and diet
differentiation for three breeding warbler species during a spruce budworm outbreak. Auk
119:216-220.
Mook, L. J. and H. G. W. Marshall. 1965. Digestion of spruce budworm larvae and pupae in
the olive-backed thrush, Hylochichla ustulata swainsoni (Tschudi). Canadian Entomologist
97:1144-1149.
Morrison, M. L. 1982. The structure of western warbler assemblages: ecomorphological
analysis of the black-throated gray and hermit warblers. Auk 99:503-513.
Page 97
89
Moorman, C. E. and D. C. Guynn, Jr. 2001. Effects of group-selection opening size on
breeding bird habitat use in a bottomland forest. Ecological Applications 11:1680-1691.
New, K. C. and J. L. Hanula. 1998. Effect of time elapsed after prescribed burning in
longleaf pine stands on potential prey of the red-cockaded woodpecker. Southern Journal of
Applied Forestry 22:175-183.
Poulin, B. and G. Lefebvre. 1996. Dietary relationships of migrant and resident birds from a
humid forest in central Panama. Auk 113:277-287.
Pyle, P., S. N. G. Howell, R. P. Yunick, and D. F. SeSante. 1987. Identification guide to
North American passerines. Slate Creek Press, Bolinas, CA.
Raley, C. M. and S. H. Anderson. 1990. Availability and use of arthropod food resources by
Wilson’s warblers and Lincoln’s sparrows in southeastern Wyoming. Condor 92:141-150.
Robinson, S. K. and R. T. Holmes. 1982. Foraging behavior of forest birds: the relationships
among search tactics, diet and habitat structure. Ecology 63:1918-1931.
Rosenberg, K. V. and R. J. Cooper. 1990. Approaches to avian diet analysis. Studies in
Avian Biology 13:80-90.
Sillett, T. S. 1994. Foraging ecology of epiphyte-searching insectivorous birds in Costa
Rica. Condor 96:863-877.
Stevenson, J. 1933. Experiments on the digestion of food by birds. Wilson Bulletin 45:155-
167.
Swanson, G. A. and J. C. Bartonek. 1970. Bias associated with food analysis in gizzards of
blue-winged teal. Journal of Wildlife Management 34:739-746.
Page 98
90
Ulyshen, M. D., J. L. Hanula, S. Horn, J. C. Kilgo, and C. E. Moorman. 2004. Spatial and
temporal patterns of beetles associated with coarse woody debris in managed bottomland
hardwood forests. Forest Ecology and Management 199:259-272.
Wheelwright, N. T. 1986. The diet of American robins: an analysis of U.S. Biological
Survey records. Auk 103:710-725.
Willson, M. F., E. A. Porter, and R. S. Condit. 1982. Avian frugivore activity in relation to
forest light gaps. Caribbean Journal of Science 18:1-6.
Wolda, H. 1990. Food availability for an insectivore and how to measure it. Studies in Avian
Biology 13:38-43.
Yard, H. K., C. Van Riper, III, B. T. Brown, and M. J. Kearsley. 2004. Diets of
insectivorous birds along the Colorado River in Grand Canyon, Arizona. Condor 106:106-
115.
Page 99
91
FIGURE 1. Photograph illustrating high degree of fragmentation of prey items from crop-
flushing samples taken from insectivorous birds in a bottomland forest in South Carolina
(2001-2002). Top row, L-R: Coleoptera elytra, Coleoptera elytra, Coleoptera leg. Bottom
row, L-R: Coleoptera mandible, Coleoptera prothorax, Lepidoptera mandible, Coleoptera
mandible.
Page 100
92
FIGURE 2. Percent availability and consumption of four most frequently encountered (by
crop-flushing) arthropod orders: comparison between foliage-gleaning birds and foliage-
clipping arthropods in a bottomland forest in South Carolina (2001-2002). Percentages
represent the percent of total arthropod sample containing each arthropod order. A =
Foliage-clipping arthropods; B = Foliage-gleaning birds; C = Hooded Warbler; D =
Kentucky Warbler; E = White-eyed Vireo
Page 102
94
FIGURE 3. Percent availability and consumption of four most frequently encountered (by
crop-flushing) arthropod orders: comparison between ground-gleaning birds and pitfall
trapping for arthropods in a bottomland forest in South Carolina (2001-2002). Percentages
represent the percent of total arthropod sample containing each arthropod order. A = Pitfall-
trapped arthropods; B = Ground-gleaning birds; C = Carolina Wren
Page 103
95
TABLE 1. Seasonal number of birds sampled using a warm water crop-flush in a
bottomland forest in South Carolina, 2001-2002.
Common Name Scientific Name Guilda S-1b S-2 S-3 S-4
Black-throated Blue Warbler Dendroica caerulescens FG 0 0 0 11
Carolina Wren Thryothorus ludovicianus GG 9 9 15 15
Common Yellowthroat Geothlypis trichas FG 1 0 0 5
Eastern Tufted Titmouse Baeolophus bicolor FG 0 1 0 0
Grey-cheeked Thrush Catharus minimus GG 0 0 0 1
Hooded Warbler Wilsonia citrina FG 20 21 20 22
Kentucky Warbler Oporornis formosus FG 6 10 13 3
Ovenbird Seiurus aurocapillus GG 1 0 2 6
Red-eyed Vireo Vireo olivaceus FG 1 2 3 0
Swainson’s Thrush Catharus ustulatus GG 0 0 0 3
Swainson’s Warbler Limnothlypis swainsonii GG 1 0 0 0
Veery Catharus fuscescens GG 0 0 0 2
White-eyed Vireo Vireo griseus FG 6 14 9 17
Worm-eating Warbler Helmitheros vermivorus FG 1 0 0 4
Yellow-breasted Chat Icteria virens FG 0 0 1 0
a FG = Foliage-gleaner; GG = Ground-gleaner
b Sample size (n) per season: S-1 = Spring migration; S-2 = Breeding season; S-3 = Post-
breeding season; S-4 = Fall migration
Page 104
96
TABLE 2. Seasonal arthropod orders consumed by birds in a bottomland forest in South Carolina, 2001-2002.
Bird
(arthropod sample) Season n Araneaea Coleoptera Diptera Hemiptera Homoptera Hymenoptera Lepidoptera Orthoptera
Carolina Wren 1 9 - ++ - - - + +++ - - - +++ ++
(pitfall traps) 2 9 0 ++ - - - ++ +++ - - - +++ 0
3 15 0 + - +++ +++ - - - +++ 0
4 15 0 + - - - +++ +++ - - +++ -
all 48 0 ++ - - - ++ +++ - - - +++ 0
Hooded Warbler 1 20 - + ++ +++ 0 - - - ++ ++
(foliage clipping) 2 21 - - ++ ++ + 0 - - -
3 20 - - ++ ++ + 0 + 0 - - -
4 22 - - ++ ++ ++ ++ - - - - -
all 83 - - ++ ++ ++ 0 - 0 -
Kentucky Warbler 1 6 - 0 ++ +++ + - ++ - - -
(foliage clipping) 2 10 - ++ ++ + - - - 0 -
3 13 - ++ - - - + + - - - + - - -
4 3 - - +++ ++ ++ - - - - - 0 - - -
all 32 - ++ ++ ++ 0 - - + - -
Page 105
97
White-eyed Vireo 1 6 - - - ++ +++ ++ 0 - - 0 +++
(foliage clipping) 2 14 - ++ + 0 - - - - - 0
3 9 - - ++ ++ ++ + - - - ++ -
4 17 - - +++ - - - ++ 0 - - - + -
all 46 - - ++ ++ ++ 0 - - - + 0
Foliage gleaners 1 35 - - + ++ +++ 0 - - ++ ++
(foliage clipping) 2 48 - - ++ ++ + - - - 0 0
3 46 - - ++ ++ + 0 0 + - -
4 62 - - ++ + ++ + - - 0 0
all 191 - - ++ ++ ++ 0 - - + -
Ground gleaners 1 11 - ++ - - - ++ +++ - - - +++ +
(pitfall traps) 2 9 0 ++ - - - ++ +++ - - - +++ 0
3 17 0 + - +++ +++ - - - +++ 0
4 28 - + - - +++ +++ - - +++ 0
all 65 - ++ - - ++ +++ - - - +++ 0
a Arthropod order proportional use compared with proportional availability, referring to Dhb. + + + = use much greater than
availability, + + = use moderately greater than availability, + = use slightly greater than availability, 0 = use same as
Page 106
98
availability, - = use slightly lower than availability, - - = use moderately lower than availability, and - - - = use much lower
than availability.