Page 1
Kasem Bundit Engineering Journal Vol.8 Special Issue May 2018
The 9th International Science, Social Science, Engineering and Energy Conference (I-SEEC 2018) 327
SPATIAL DATA WAREHOUSE AND INTERACTIVE MAPPING
APPLICATION FOR SUPPORTING DENGUE FEVER SURVEILLANCE
Duangduen Asavasuthirakul
Lecturer, Department of Computer Science and Information Technology, Faculty of Science,
Naresuan University, 99 Moo 9, Thapho, Muaeng, Phitsanulok, 65000, Thailand
ABSTRACT
Health information systems, like other information systems, store huge amount of spatial
data in various forms distributed over databases of responsible agencies. Turning such data
into useful geographic information is needed in order to support insightful and timely decision
making especially for controlling epidemic diseases such as dengue fever. Therefore, this
study focuses on designing and implementing a spatial data warehouse and developing an
interactive mapping application as a prototype system. The clinical data relating to dengue
cases as well as public health resources obtained from the Kamphaeng Phet Provincial
Health Office were used as a case study. The snowflake schema model was adopted for
denormalizing data from various data sources into the data warehouse. The system interface
was implemented as a web application. It provides tools for the interactive analysis of
multidimensional data with various granularities through maps and charts, which helps to
facilitate effective monitoring and controlling of the disease outbreaks. The system was
implemented using open-source software including PostgreSQL/PostGIS and Leaflet. The
result of the user satisfaction evaluation showed that they satisfied using the system at the
highest level in terms of effectiveness (�̅�𝑥 = 4.58 out of 5), design (�̅�𝑥 = 4.35 out of 5) and
user satisfaction (�̅�𝑥 = 4.83 out of 5).
KEYWORDS: Spatial data warehouse, dengue fever, online mapping, map representation
1. Introduction
Health information system (HIS) is a huge system that health-related records are
associated with a location in one form or another. Thus, there are many health-related studies
utilizing Geographic Information System (GIS) tools for visualizing data on the map and
performing spatial analysis to support data interpretation and decision-making [1]. HIS in
Faculty of Engineering, Kasem Bundit University
Page 2
Kasem Bundit Engineering Journal Vol.8 Special Issue May 2018
The 9th International Science, Social Science, Engineering and Energy Conference (I-SEEC 2018) 328
Thailand has reached a milestone that it can collect clinical data from most healthcare
facilities throughout the country into data centers or warehouses [2]. However, the usage of
such data is mainly focused on administrative reports. For example, the national vector-
borne diseases prevention and control program under the ministry of public health (MOPH)
publishes weekly reports on dengue fever cases in forms of data tables and graphs. Static
maps showing case density are also provided but it is difficult to compare such picture maps
across areas within a period. The geographical aspect has left unimportant so it is difficult
to represent and analyze some phenomena on a map. Hence, the integration of geographic
information in a health data warehouse becomes essential to the process of epidemiologic
surveillance and decision making.
Research related to spatial data warehouse (SDW) for public health has been scarce.
However, basic issues can consult from a number of work. For example, Cembalo et al. [3]
designed a data warehouse using spatial online analytical processing (SOLAP) approach
and develop a decision support application for epidemiology domain. Derbal et al. [4] propose
a data warehouse model as a snowflake schema by integrating the geographic object of
roads to support road risk analysis. Park and Hwang [5] designed a spatial data warehouse
based on snowflake schema and implemented a pilot system to estimate the targeted
marketing area from spatial analysis of the customers’ purchasing power.
This research attempts to incorporate geographic information into data warehouse to
facilitate spatial query and analysis on dengue fever data. The contributions of this work are
(1) design of the SDW that integrates health information with spatial components and (2)
development of a geospatial decision support prototype based on the SDW to support
dengue disease analysis, control and surveillance through interactive maps and charts.
This paper is organized as follows. Section 2 describes the user’s needs and data
sources for developing our system. Section 3 presents the design of the proposed SDW and
Section 4 presents the architecture of the prototype system. In Section 5, we present the
developed system with sample queries and reports. The user satisfaction evaluation was
presented in Section 6. This paper ends with a conclusion and discussion on future issues.
2. User’s requirements and data sources
According to an interview to public health experts and information and communications
technology (ICT) officers at the Kamphaeng Phet provincial health office (KPHO), we found
Geographical Information Science (GIS)
Page 3
Kasem Bundit Engineering Journal Vol.8 Special Issue May 2018
The 9th International Science, Social Science, Engineering and Energy Conference (I-SEEC 2018) 329
out even though KPHO had been continuously published summaries of dengue data online
in forms of tables and charts, it was difficult to search for a certain data at a specific
administrative area with a few clicks. The users, mostly officers, must be familiar and
remember where the data was located. Therefore, if we could represent dengue data on the
map, it would escalate data searching time and also promote a quick understanding of
dengue situations.
To start developing our system, we obtained a sample dataset from KPHO. In Thailand,
MOPH regulates that all health records of each healthcare facilities have to transfer to the
national HIS (NHIS) with the supervision of administrative health offices. The dataset
contains records of patients with dengue fever between 2013 and 2014 from all healthcare
facilities supervised by KPHO. The population data between 2013 and 2014 was downloaded
from the Department of Provincial Administration’s web service. The administrative
boundaries of Kamphaeng Phet were also obtained from the Department of Provincial
Administration as shapefiles. The location of each healthcare facility was queried from the
MOPH’s website.
3. Conceptual design of spatial data warehouse
Based on our analysis of the user’s requirements and the needs for dengue reports on
the maps. We designed the structure of the SDW for supporting the dengue fever
surveillance as shown in Figure 1. Unlike the star schema which is popularly used for
designing data warehouses, in this study we chose to model the SDW based on snowflake
schema due to the relationships of administrative data and the population data and also
additional information of hospital types and patient data, which cause branches of the
structure. The choice of fact and dimension tables was driven by the input dataset and the
requirements on the querying reports. The model contains a central fact of the patient
records. The dimension tables of the schema are time, patient, disease type, healthcare
facility, and age range. The patient record loaded into the fact table is normalized according
to the administrative levels, which are province, district (Amphor) and sub-district (Tambon).
Each level contains its geographic boundary, stored as a polygon in the Well-Known Binary
(WKB) representation in geographic coordinates (latitude/longitude), and its administrative
code and name and the administrative name of the former levels to expedite the query
processing. The patient dimension has further information on occupation, nationality,
Faculty of Engineering, Kasem Bundit University
Page 4
Kasem Bundit Engineering Journal Vol.8 Special Issue May 2018
The 9th International Science, Social Science, Engineering and Energy Conference (I-SEEC 2018) 330
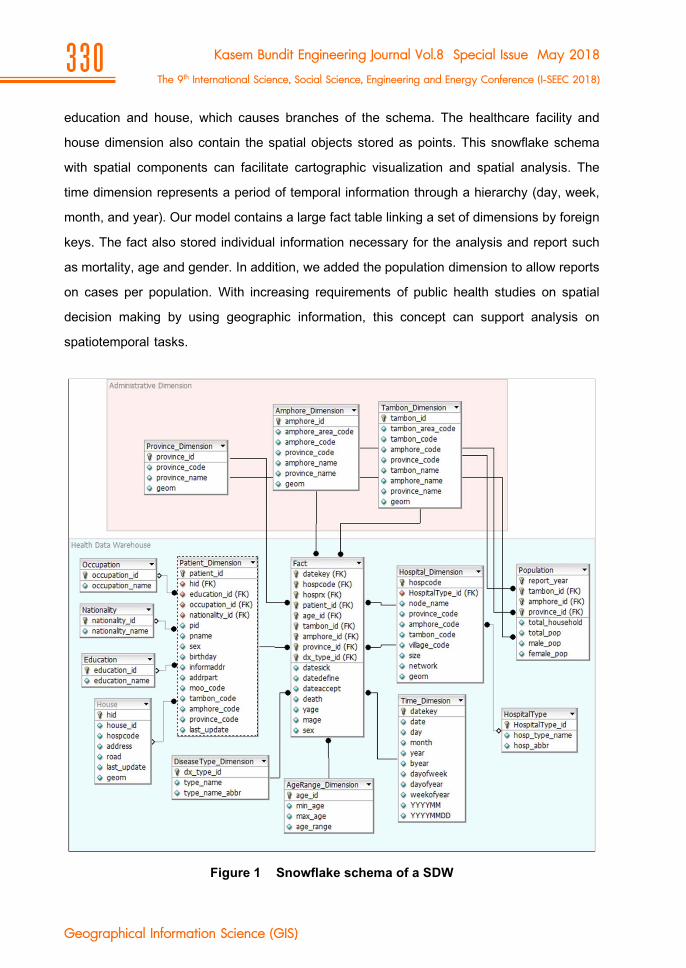
education and house, which causes branches of the schema. The healthcare facility and
house dimension also contain the spatial objects stored as points. This snowflake schema
with spatial components can facilitate cartographic visualization and spatial analysis. The
time dimension represents a period of temporal information through a hierarchy (day, week,
month, and year). Our model contains a large fact table linking a set of dimensions by foreign
keys. The fact also stored individual information necessary for the analysis and report such
as mortality, age and gender. In addition, we added the population dimension to allow reports
on cases per population. With increasing requirements of public health studies on spatial
decision making by using geographic information, this concept can support analysis on
spatiotemporal tasks.
Figure 1 Snowflake schema of a SDW
Geographical Information Science (GIS)
Page 5
Kasem Bundit Engineering Journal Vol.8 Special Issue May 2018
The 9th International Science, Social Science, Engineering and Energy Conference (I-SEEC 2018) 331
4. Architecture of the system prototype
The overview of the system architecture presents in Figure 2. The data was pulled from
the data center at KPHO, then the data was extracted, transformed, and loaded (ETL) into
the designed SDW. The prototype system was developed using open-sourced software tools.
The SDW was implemented using PostgreSQL with PostGIS extension which has spatial
functions for storing spatial objects and facilitating complex spatial queries. We use Apache
as an application server to serve our web application. The web application has a user-friendly
interface that allows the user to quickly observe the data in several aspects using maps,
charts, and tables. We use Leaflet, open-source JavaScript library, for creating interactive
maps and use Highcharts, also JavaScript library, for building dynamic charts.
Figure 2 Overall architecture of the system prototype
5. Implementation of the system prototype
Functionalities of our prototype systems are presented through the following interfaces.
Three categories of users are considered: unregistered users, health officers or decision-
makers, and administrators. The main page of the application is shown in Figure 3.
Unregistered users can interactively interrogate the number of dengue cases on the map
across different years and administrative granularities. No authentication is required since
the system provides only statistical data of dengue cases without individual information. For
example, in Figure 3 shows a map of dengue case rates per 100,000 population in 2013
categorized by districts. The user can hover over on the map and click on each feature of
Faculty of Engineering, Kasem Bundit University
Page 6
Kasem Bundit Engineering Journal Vol.8 Special Issue May 2018
The 9th International Science, Social Science, Engineering and Energy Conference (I-SEEC 2018) 332
the map, in this case is a district, then the system will show a pop-up chart of monthly case
summaries containing all the historical data as shown in Figure 4. This cartographic
visualization allows to users quickly realize the situation of the dengue disease as well as
historical data on a specific area.
Figure 3 Main page of the prototype system
Figure 4 A chart report of the selected map feature
Geographical Information Science (GIS)
Page 7
Kasem Bundit Engineering Journal Vol.8 Special Issue May 2018
The 9th International Science, Social Science, Engineering and Energy Conference (I-SEEC 2018) 333
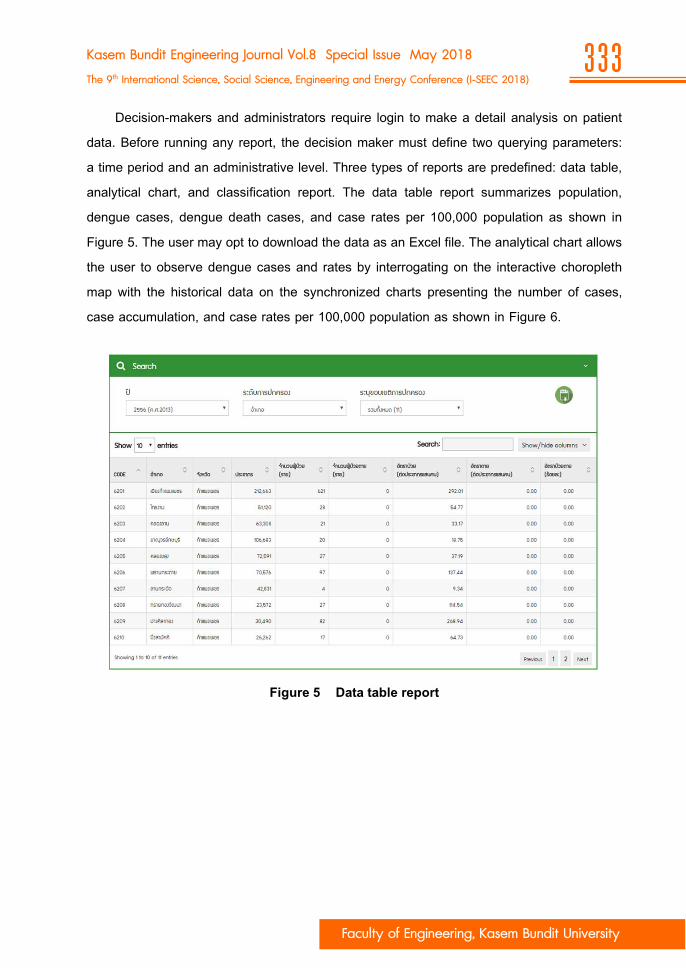
Decision-makers and administrators require login to make a detail analysis on patient
data. Before running any report, the decision maker must define two querying parameters:
a time period and an administrative level. Three types of reports are predefined: data table,
analytical chart, and classification report. The data table report summarizes population,
dengue cases, dengue death cases, and case rates per 100,000 population as shown in
Figure 5. The user may opt to download the data as an Excel file. The analytical chart allows
the user to observe dengue cases and rates by interrogating on the interactive choropleth
map with the historical data on the synchronized charts presenting the number of cases,
case accumulation, and case rates per 100,000 population as shown in Figure 6.
Figure 5 Data table report
Faculty of Engineering, Kasem Bundit University
Page 8
Kasem Bundit Engineering Journal Vol.8 Special Issue May 2018
The 9th International Science, Social Science, Engineering and Energy Conference (I-SEEC 2018) 334
Figure 6 Data table report
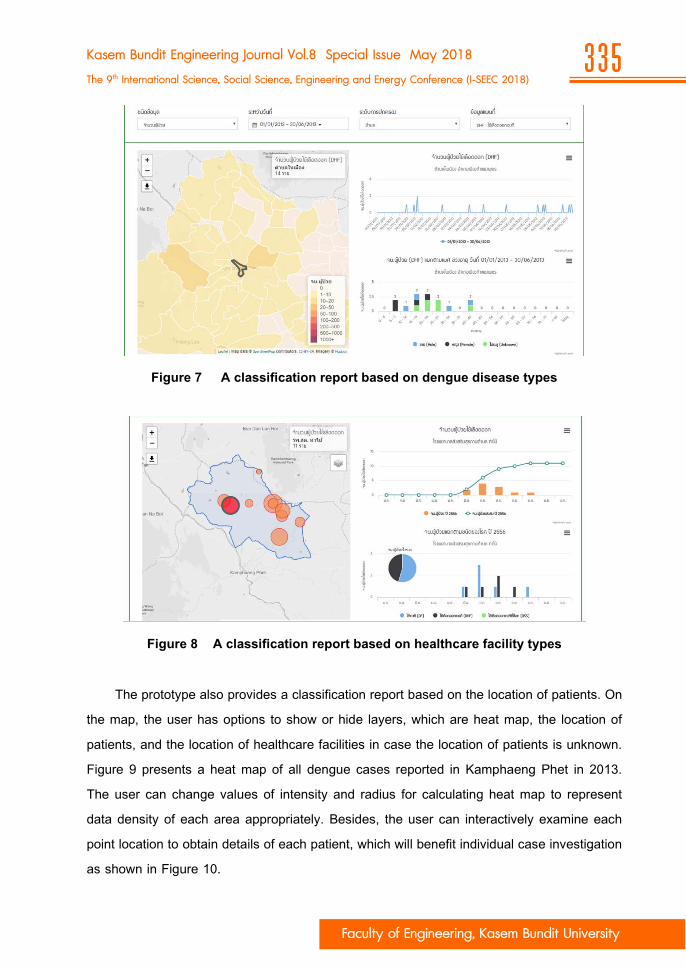
The classification report adds querying parameters on disease types, healthcare types,
and patient location. The dengue disease types are dengue fever (DF), dengue hemorrhagic
fever (DHF), and dengue shock syndrome (DSS). Figure 7 shows the query result for the
DHF cases in Tambon Nai Muang, Muang, Kamphaeng Phet during Jan 1st – Jun 30th 2013,
which consists of a choropleth map, a chart of the monthly number of DHF cases, and a
stack chart represents gender and age range of the DHF cases. This study adopted the
types of healthcare facilities given by MOPH [2]. Figure 8 presents the querying result of the
dengue cases for health promotion hospitals in Prankratai District hovering over the Tha Mai
health promotion hospital for more details of cases.
Geographical Information Science (GIS)
Page 9
Kasem Bundit Engineering Journal Vol.8 Special Issue May 2018
The 9th International Science, Social Science, Engineering and Energy Conference (I-SEEC 2018) 335
Figure 7 A classification report based on dengue disease types
Figure 8 A classification report based on healthcare facility types
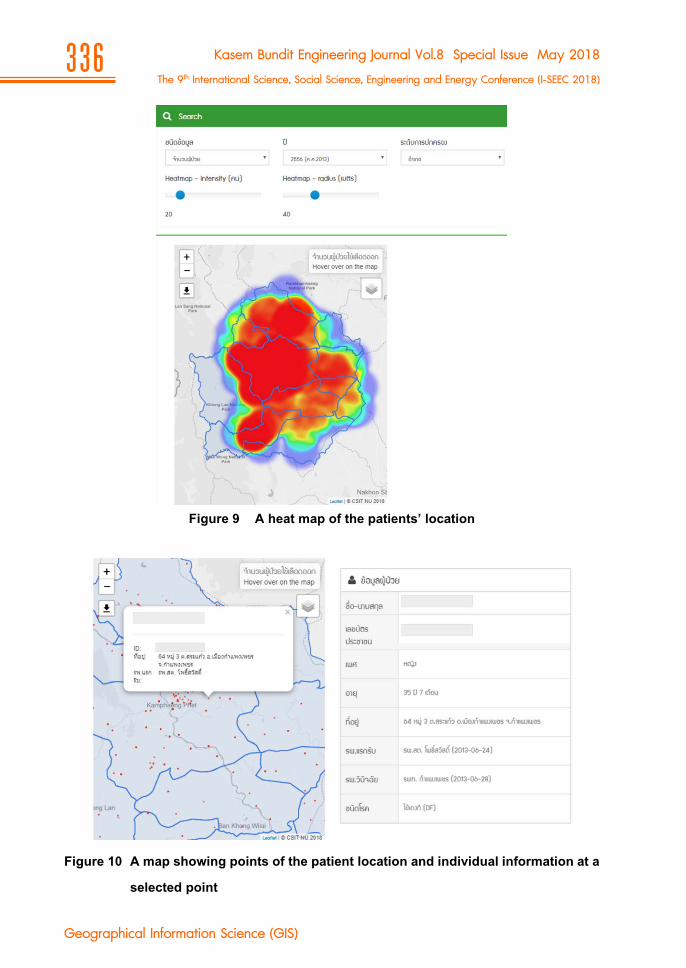
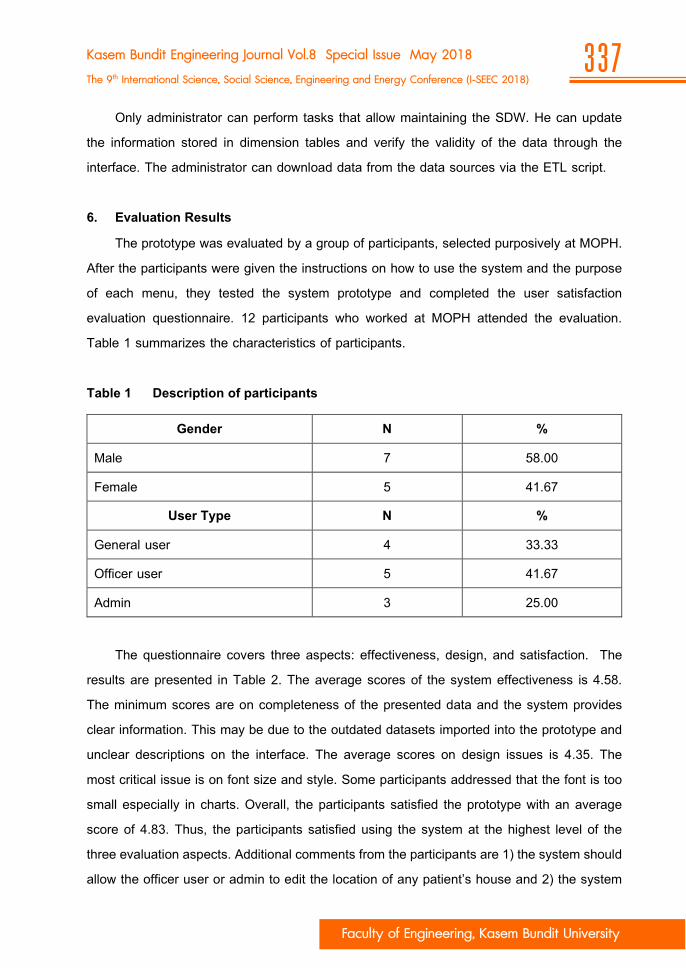
The prototype also provides a classification report based on the location of patients. On
the map, the user has options to show or hide layers, which are heat map, the location of
patients, and the location of healthcare facilities in case the location of patients is unknown.
Figure 9 presents a heat map of all dengue cases reported in Kamphaeng Phet in 2013.
The user can change values of intensity and radius for calculating heat map to represent
data density of each area appropriately. Besides, the user can interactively examine each
point location to obtain details of each patient, which will benefit individual case investigation
as shown in Figure 10.
Faculty of Engineering, Kasem Bundit University
Page 10
Kasem Bundit Engineering Journal Vol.8 Special Issue May 2018
The 9th International Science, Social Science, Engineering and Energy Conference (I-SEEC 2018) 336
Figure 9 A heat map of the patients’ location
Figure 10 A map showing points of the patient location and individual information at a
selected point
Geographical Information Science (GIS)
Page 11
Kasem Bundit Engineering Journal Vol.8 Special Issue May 2018
The 9th International Science, Social Science, Engineering and Energy Conference (I-SEEC 2018) 337
Only administrator can perform tasks that allow maintaining the SDW. He can update
the information stored in dimension tables and verify the validity of the data through the
interface. The administrator can download data from the data sources via the ETL script.
6. Evaluation Results
The prototype was evaluated by a group of participants, selected purposively at MOPH.
After the participants were given the instructions on how to use the system and the purpose
of each menu, they tested the system prototype and completed the user satisfaction
evaluation questionnaire. 12 participants who worked at MOPH attended the evaluation.
Table 1 summarizes the characteristics of participants.
Table 1 Description of participants
Gender N %
Male 7 58.00
Female 5 41.67
User Type N %
General user 4 33.33
Officer user 5 41.67
Admin 3 25.00
The questionnaire covers three aspects: effectiveness, design, and satisfaction. The
results are presented in Table 2. The average scores of the system effectiveness is 4.58.
The minimum scores are on completeness of the presented data and the system provides
clear information. This may be due to the outdated datasets imported into the prototype and
unclear descriptions on the interface. The average scores on design issues is 4.35. The
most critical issue is on font size and style. Some participants addressed that the font is too
small especially in charts. Overall, the participants satisfied the prototype with an average
score of 4.83. Thus, the participants satisfied using the system at the highest level of the
three evaluation aspects. Additional comments from the participants are 1) the system should
allow the officer user or admin to edit the location of any patient’s house and 2) the system
Faculty of Engineering, Kasem Bundit University
Page 12
Kasem Bundit Engineering Journal Vol.8 Special Issue May 2018
The 9th International Science, Social Science, Engineering and Energy Conference (I-SEEC 2018) 338
should have a way for admin to update the boundary of administrative regions on the
interface.
Table 2 Scores on questions of the user satisfaction evaluation questionnaire
Effectiveness Mean S.D.
1. The system’s menus are enough and appropriate 4.58 0.51
2. Accurateness of data processing, map representation, chart, and
report
4.50 0.52
3. Completeness of the presented data 4.25 0.62
4. The system is user friendly 4.83 0.39
5. The system provides clear information 4.25 0.62
6. The system shortens the data searching time 4.67 0.49
7. The system helps dengue surveillance locally and in timely manner 4.67 0.49
8. The system facilitates on dengue reports to support executive’s
decision making
4.75 0.45
9. Presenting the statistics of dengue data on maps and charts
promotes the understanding of the disease cycle
4.75 0.45
Average of effectiveness 4.58 0.53
Design Mean S.D.
10. The interface looks beautiful, modern, and favorable 4.42 0.51
11. The layout is easy to read and use 4.50 0.52
12. Font size and style are appropriate (readable and beautiful) 4.08 0.67
13. Maps, charts, and data table are presented properly and quickly 4.42 0.51
Average of the design 4.35 0.56
Satisfaction Mean S.D.
14. The system is reliable and it is helpful for practical use 4.83 0.39
7. Conclusions
This paper presents the design of a spatial data warehouse and the implementation of
spatial decision supporting system in order to improve the surveillance and analysis of
Geographical Information Science (GIS)
Page 13
Kasem Bundit Engineering Journal Vol.8 Special Issue May 2018
The 9th International Science, Social Science, Engineering and Energy Conference (I-SEEC 2018) 339
dengue fever epidemic. The conceptual design of the SDW is based on the snowflake
schema consisting of both spatial and non-spatial dimensions at different granularities. For
a better analysis and exploitation, the system presents the results on the map and charts,
which allow interactive interrogation of the data. The implementation of the prototype utilizes
all open-source software tools. Nevertheless, some issues remain to be addressed in future
research. (1) The capability of the application could be enriched; for example, the map should
automatically roll-up and drill-down to show aggregate cases after zoom. (2) There is no
measure in this SDW design due to the requirement of individual information. Thus, if the
system requires only aggregation of cases, the patient dimension could be removed and a
measure, i.e., the number of patients, should be added to the fact instead. And (3) the current
prototype does not link to the existing HIS. Therefore, there is a need to modify the ETL
process to pull data from the data sources accurately.
Acknowledgement
The author would like to thank Naresuan University for funding this project under the
contract number R2558C079.
References
[1] Foody GM. GIS: health applications. Progress in Physical Geography 2006;30:691-5.
[2] Ingun P, Narkpaichit C, Boongerd P. Thailand health information system improvement
through universal health coverage implementation. Journal of the Thai Medical
Informatics Association 2015;2:137-47.
[3] Cembalo A, Ferrucci M, Pisano FM, Pigliasco G. SOLAP4epidemiologist: A spatial data
warehousing application in epidemiology domain. In: Bellatreche L, Mohania MK,
editors. Proceedings of the 15th International Conference on Data Warehousing and
Knowledge Discovery, 2013 Aug 26-29; Prague, Czech Republic. Heidelberg: Springer;
2013. p.97-109.
[4] Derbal K, Ibtissem F, Boukhalfa K, Alimazighi Z. Spatial data warehouse and geospatial
decision making tool for efficient road risk analysis. In: Ouksel AM, Nouali-Taboudjemat
N, editors. Proceedings of the 1st International Conference on Information and
Faculty of Engineering, Kasem Bundit University
Page 14
Kasem Bundit Engineering Journal Vol.8 Special Issue May 2018
The 9th International Science, Social Science, Engineering and Energy Conference (I-SEEC 2018) 340
Communication Technologies for Disaster Management; 2014 Mar 24-25; Algiers,
Algeria. New York: IEEE; 2014. p.1-7.
[5] Park J, Hwang C. A design and practical use of spatial data warehouse. In: Hayden LB,
Jearld A editors. IEEE International Geoscience and Remote Sensing Symposium. 2005
Jul 25-29; Seoul, South Korea. New York: IEEE; p.726-729.
Author’s Profile
Duangduen Asavasuthirakul received the B.Eng. degree in
electrical engineering from Chiang Mai University, Thailand, and the
M.S. and Ph.D. degree in Information Science from University of
Pittsburgh, USA. She is currently an Assistant Professor in
Department of Computer Science and Information Technology,
Faculty of Science, Naresuan University, Phitsanulok, Thailand. Her
research focuses on GIS, navigation systems and location-based
services. Email: [email protected]
Geographical Information Science (GIS)