Abstract:Regular mammogram screenings for women are the most effective method for early detection of breastcancer. The objective of this study was to examine factors associated with the Health Belief Model(HBM) that influence a woman’s decision to receive mammogram screenings within the BozemanSchool District #7. More specifically, this study examined the following questions: 1) Are women (35years and older) with higher cues to action more likely to receive a mammogram screening than womenwith lower cues to action? 2) Are women (35 years and older) with higher perceived benefits morelikely to receive a mammogram screening than women with lower perceived benefits? 3) Are women(35 years and older) with lower perceived barriers more likely to receive a mammogram screening thanwomen with higher perceived barriers? and, 4) Are women (35 years and older) with higher perceivedsusceptibility more likely to receive a mammogram screening than women with lower perceivedsusceptibility? The convenience sample consisted of 269 women 35 years of age or older and wereemployees of the Bozeman School District #7. Survey booklets were distributed via in-school mail andcontained questions related to health beliefs, mammography screening behaviors, and demographics.The response rate was 66%. Regression analysis indicated a significantly strong association betweentwo of the HBM components, cues to action and perceived benefits, and prior mammography screeningbehavior. Additionally, perceived barriers played a moderate role in explaining prior mammographyscreening behavior. That is, women who participated in prior mammography screenings weresignificantly more likely to perceive greater benefits, greater cues to action, and fewer barriers tomammography than those who did not participate. No support was found for perceived susceptibility asa predictor of prior mammography screening behavior. Based on these results, individualizedinterventions designed to foster an employee’s self-care motivation toward increased participation inmammography screenings can be developed. Practical implications for an employee wellness programwere suggested.
HEALTH BELIEF MODEL AND IT’S APPLICATION TO MAMMOGRAPHY
SCREENING IN A K-12 SCHOOL DISTRICT
EMPLOYEE WELLNESS PROGRAM
by
Kimberly Ann Hartman
A thesis submitted in partial fulfillment of the requirements for the degree
This thesis has been read by each memhdnpf the thesis committee and has been found to be satisfactory regarding content, Englign usage, format, citations, bibliographic style, and consistency, and is ready for subrrps'sfon Wthe College of Graduate Studies.
Dr. Tim Dunnagan(Signature) (Date)
Approved for the Department of Health and Human Development
Dr. Ellen Kreighbaum A . Ctr-- y/ j ^(Signature) / y (Date)
Approved for the College of Graduate Studies
Dr. Bruce McLeod
Ill
STATEMENT OF PERMISSION TO USE
In presenting this thesis in partial fulfillment of the requirements for a master's
degree at Montana State University, I agree that the Library shall make it available to
borrowers under rules of the Library.
IfI have indicated my intention to copyright this thesis by including a copyright
notice page, copying is allowable only for scholarly purposes, consistent with "fair use"
as prescribed in the U.S. Copyright Law. Requests for permission for extended quotation
from or reproduction of this thesis in whole or in parts may be granted only by the
copyright holder.
Date ^
ACKNOWLEDGMENTS
I would like to thank my committee chair, Dr. Tim Duimagan for continuously
keeping me focused on the goals of this research and for the belief in my ability to
complete this task properly. Additionally, I would like to give a heart-felt thank you to
Dr. Tim Dunnagan for the, guidance, expertise, and opportunities he has given me
throughout my program. Dr. George Haynes, I cannot thank enough for the support,
guidance, and assistance with my statistical analyses. To Dr. Craig Stewart I would like
to extend my thanks and appreciation for his expertise and constructive feedback in
getting this project into its final form.
I would like to express my sincere appreciation to the employees of the Bozeman
School District who participated in the focus group sessions and completed the survey. A
special thanks goes to Bruce Colton, Steve Johnson, and Alberta Fredrickson, whose
support and funding made this research project possible.
A special thank you goes to Mary Bolhuis, a dear friend and colleague, who was
always there to listen to me and had faith in me when I had lost all faith in myself. My
heartfelt appreciation goes to the wonderful friends and colleagues for always showing
me they cared. A final thank you to my family who provided me with love,
understanding, and support throughout my graduate program.
V
TABLE OF CONTENTS
1. INTRODUCTION........................................................................................................ IResearch Objective.....................................................................................................2Significance of the Study.......................................................................................... 3Definition of Terms.....................................................................................................4Delimitations............................................................................................................... 6Limitations.................................................................................................................... 7Assumptions.................................................................................................................. 7
2. REVIEW OF LITERATURE......................................................................................... 8A Historical View of WHP......................................................................................... 8Evaluation Techniques and Strategies................................................................ 10
Evaluation Techniques.............................................................................................. 10' Breast Cancer............................................................................................................ 11
The Health Belief Model and it's application to Mammography..................... 12HBM and Breast Cancer Screenings......................................................................... 15
Survey Respondent Information............................................................................ 35Demographic and Socioeconomic Characteristics.............................................35Mammography Screening Behavior....................................................................... 37
vi
Mammogram Screening Behavior Compared to the State of MontanaPopulation.................................................................................................................. 38Health Belief Model Components..........................................................................39
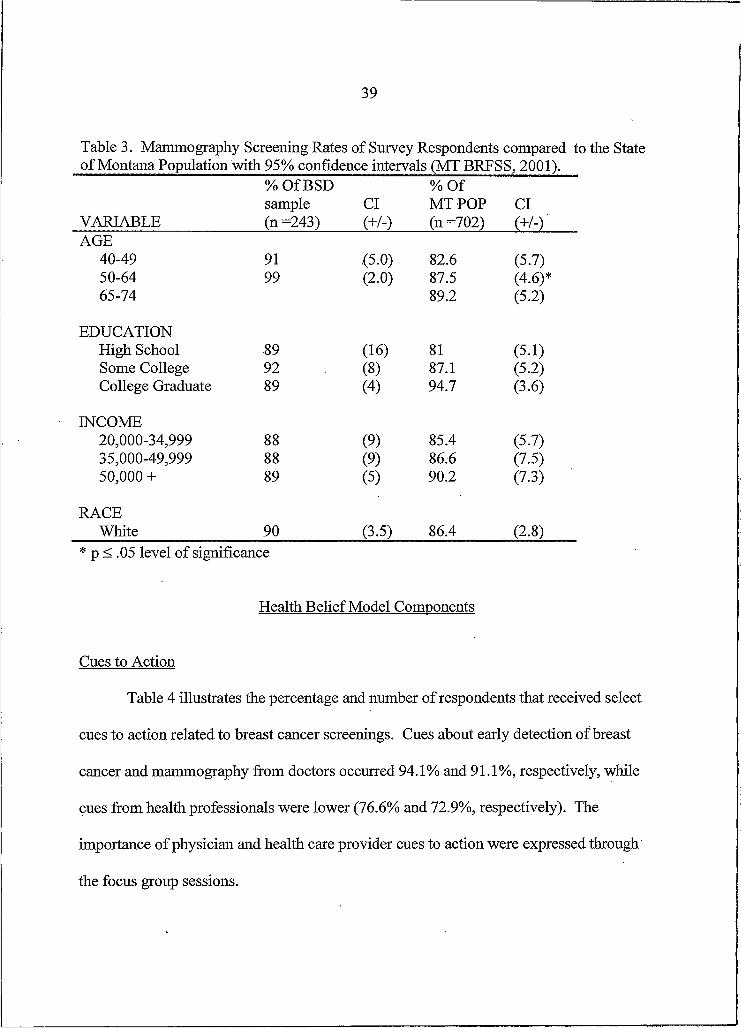
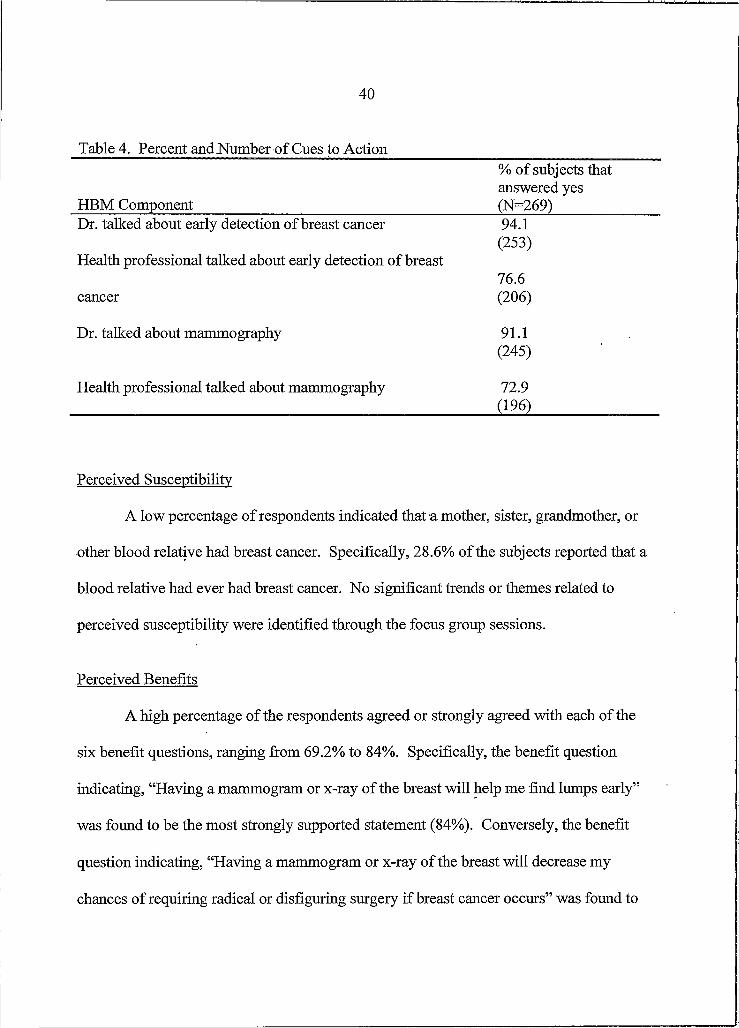
Cues to Action........................................................................................................... 39Perceived Susceptibility..................................................................... 40Perceived Benefits.................................................................................................... 40Perceived Barriers..................................................................................................... 41
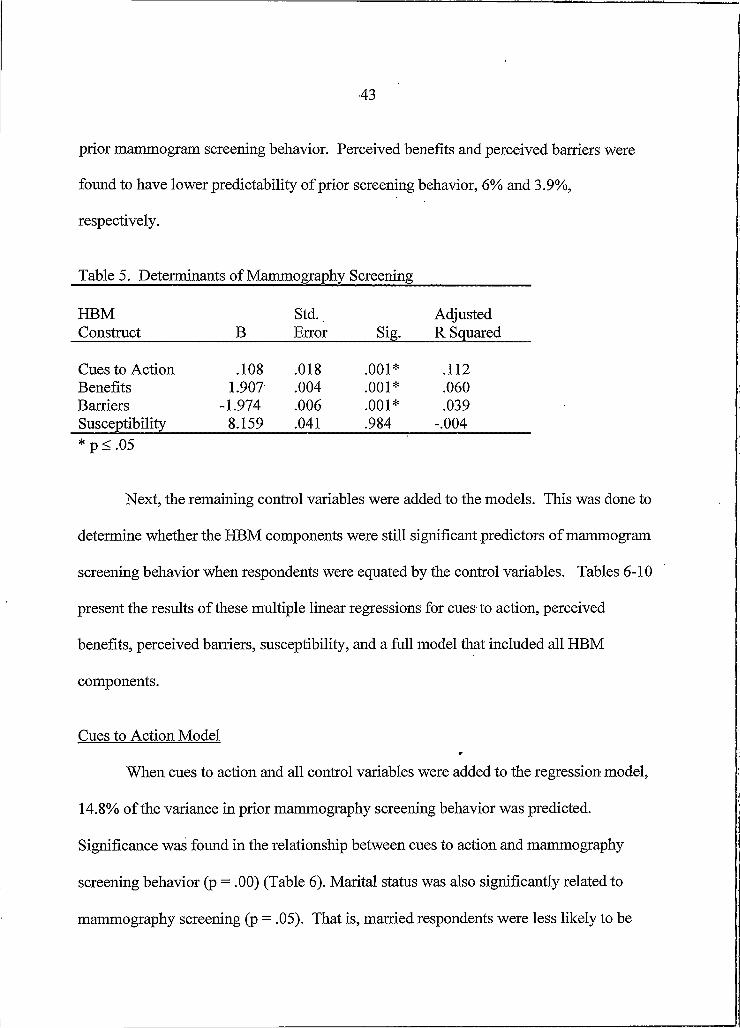
Linear Regression Results......................................................................................41Cues to Action Model............................................................................................... 43Perceived Benefits Model.........................................................................................44Perceived Barriers Model.........................................................................................46Perceived Susceptibility Model................................................................................47Full Model.................................................................................................................48Regression Summary.......................................................................... 48
Descriptive Statistics: Benefits, Barriers, and Cues to action...................... 50Summary of Two by Two Tables............................................................................. 52
APPENDIX A - Questionnairre................................................................................67APPENDIX B - Human Subjects Committee Letter................................................75
V ll
LIST OF TABLES
Table Page
1. Demographic and Socioeconomic Characteristics ofSurvey Respondents Compared to the BSD Population............................36
2. Percent and Number of Mammogram Screening Behavior........................ 38
3. Mammography Screening Rates of Survey Respondentsto the State of Montana Population with 95% confidenceintervals (MT BRFSS5 2001)..................................................................... 39
4. Percent and number of cues to action..... ................................................... 40
5. Determinants of Mammography S creening........................................ 43
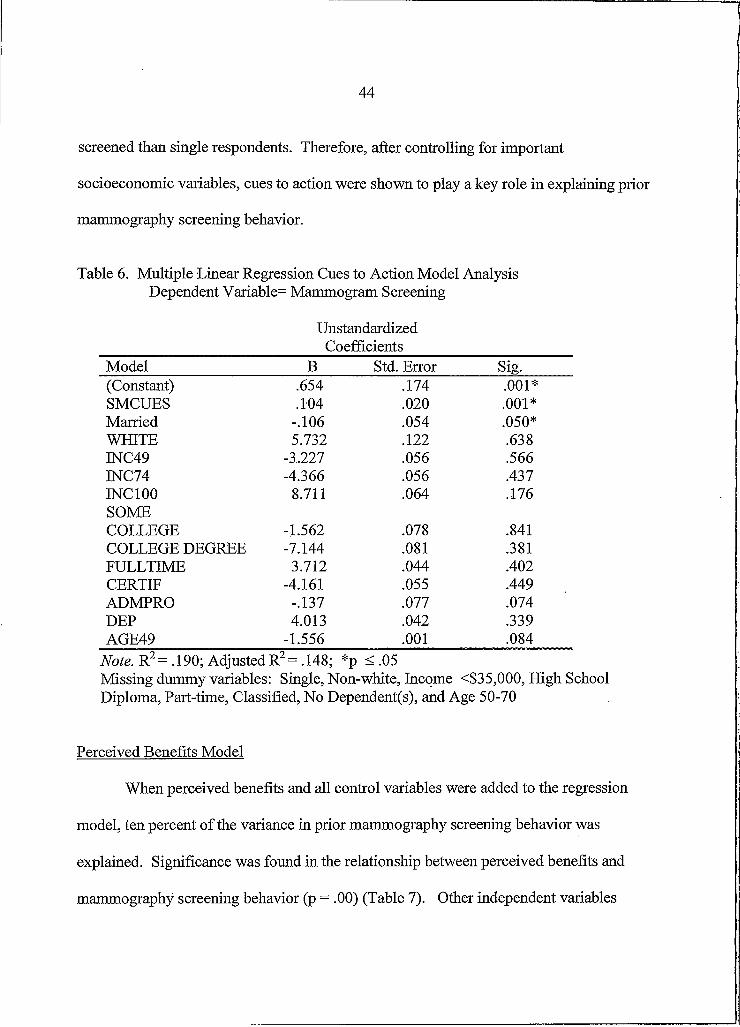
6. Multiple Linear Regression Cues to Action Model AnalysisDependent Yariable=Mammogram Screening........................................... 44
7. Multiple Linear Regression Benefits Model AnalysisDependent Variable=Mammogram Screening.......................... 45
8. Multiple Linear Regression Barriers Model AnalysisDependent Variable=Mammogram Screening........................................... 46
9. Multiple Linear Regression Susceptibility Model AnalysisDependent Variable=Mammogram Screening............. 47
10. Multiple Linear Regression Full Model AnalysisDependent Variable=Mammogram Screening..........................................49
11. Mammogram Screening Behavior with Benefits and Barriers................51
12. Mammogram Screening Behavior with Benefits and Cues toAction...................................................................................................... 51
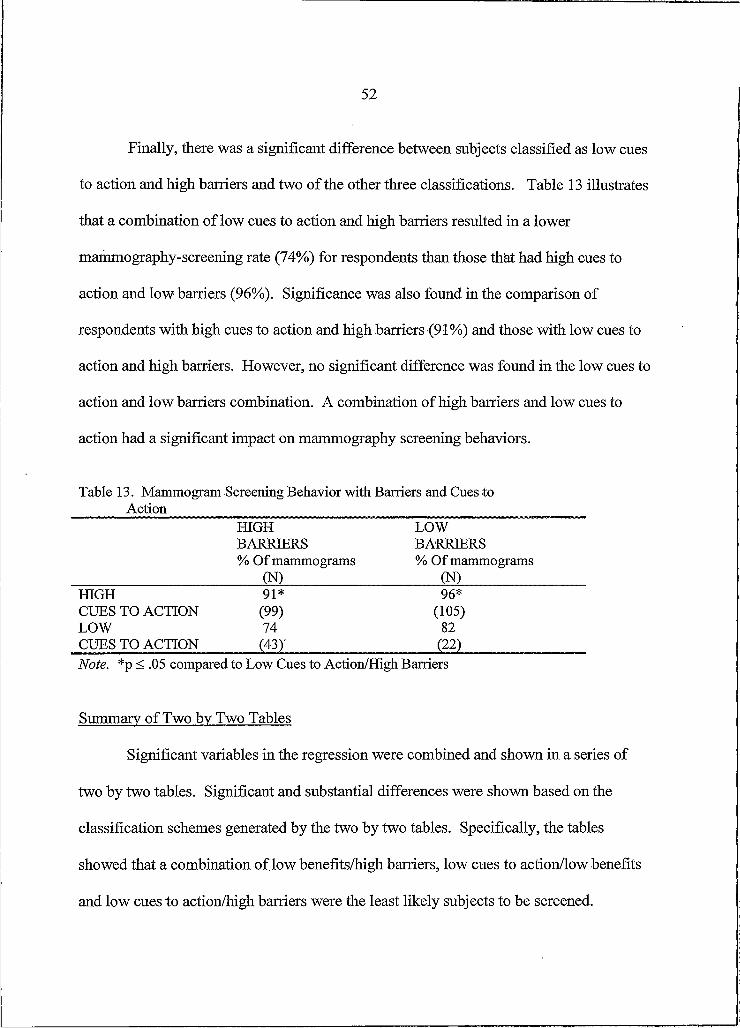
13. Mammogram Screening Behavior with Barriers and Cues toAction..................................................................................................... 52
ABSTRACT
Regular mammogram screenings for women are the most effective method for early detection of breast cancer. The objective of this study was to examine factors associated with the Health BeliefModel (HBM) that influence a woman’s decision to receive mammogram screenings within the Bozeman School District #7. More specifically, this study examined the following questions: I) Are women (35 years and older) with higher cues to action more likely to receive a mammogram screening than women with lower cues to action? 2) Are Women (35 years and older) with higher perceived benefits more likely to receive a mammogram screening than women with lower perceived benefits? 3) Are women (35 years and older) with lower perceived barriers more likely to receive a mammogram screening than women with higher perceived barriers? and, 4) Are women (35 years and older) with higher perceived susceptibility more likely to receive a mammogram screening than women with lower perceived susceptibility? The convenience sample consisted of 269 women 35 years of age or older and were employees of the Bozeman School District #7. Survey booklets were distributed via in-school mail and contained questions related to health beliefs, mammography screening behaviors, and demographics. The response rate Was 66%. Regression analysis indicated a significantly strong association between two of the HBM components, cues to action and perceived benefits, and prior mammography screening behavior. Additionally, perceived barriers played a moderate role in explaining prior mammography screening behavior. That is, women who participated in prior mammography screenings were significantly more likely to perceive greater benefits, greater cues to action, and fewer barriers to mammography than those who did not participate. No support was found for perceived susceptibility as a predictor of prior mammography screening behavior. Based on these results, individualized interventions designed to foster an employee’s self-care motivation toward increased participation in mammography screenings can be developed. Practical implications for an employee wellness program were suggested.
I
CHAPTER I
INTRODUCTION
Over the last two decades, health promotion programs have gained popularity in
worksite settings. Initially, these programs were offered as a benefit or “perk” to
employees. Today, they have evolved into a more comprehensive approach. For
example, programs may consist of a single component (i.e. Health Risk Appraisal,
tobacco control, etc.) or may include multiple strategies and interventions such as stress
management, blood pressure, physical activities, and weight control. Along with this
evolution of expanding programs, a focus on the financial and health value associated
with these programs has emerged.
However, most health promotion programs do not have sufficient resources to
assess program effectiveness. Consequently, evaluation efforts are often simplistic or
nonexistent. Nevertheless, an essential piece in worksite wellness programming is
evaluation. The Bozeman Public School Employee Wellness Program (BPSEWP) is an
example of a health promotion program that has limited resources. The program director
is a full time teacher that is paid a stipend for his work in the wellness program.
Consequently, the program has been in existence for eleven years and a formal evaluation
has never been administered.
The BPSEWP serves over one thousand employees, retirees, spouses, and
dependents. The goals of the program focus on the prevention, protection, and
2
maintenance of the employees and their spouses. Therefore, programs are established
with education, activity, and the family in mind. The main thrust of energy and resources
are put toward the Annual Health Fair. In addition to the Health Fair, the BPSEWP
offers mammogram screenings. The Employee Benefits Clerk indicated that the
incidences of breast cancer were high and utilization of the mammogram screenings was
low. Therefore, a need existed to examine and enhance the rate of mammogram
screenings within the Bozeman School District.
Several research studies have been conducted to determine theory-based
explanations of mammography screening usage (Champion, 1995; Champion & Miller,
1996; Lauver, Nabholz, Scott, &Tak, 1997; Holm, Frank, & Curtin, 1999). The Health
BeliefModel (HBM) has been widely used as a guide for explaining or predicting breast
cancer screening behavior. Results have been mixed, however, there was some evidence
to support that women with perceptions of I) enhanced susceptibility, 2) fewer barriers,
3) more benefits, and cues to action (i.e. physician) are more likely to participate in breast
cancer screening. II
:Research Objective \I
The objective of this study was to examine factors associated with the Health
BeliefModel that influence a woman’s decision to receive mammogram screenings
within the Bozeman School District #7. More specifically, this study will examine the
following research questions: I) Are women (35 years and older) with higher cues to
action more likely to receive a mammogram screening than women with lower cues to
3
action? 2) Are women (35 years and older) with higher perceived benefits more likely to
receive a mammogram screening than women with lower perceived benefits? 3) Are
women (35 years and older) with lower perceived barriers more likely to receive a
mammogram screening than women with higher perceived barriers? and, 4) Are women
(35 years and older) with higher perceived susceptibility more likely to receive a
mammogram screening than women with lower perceived susceptibility?
Significance of the Study
Breast cancer is the second leading cause of cancer death for women in the United
States. The American Cancer Society (ACS, 2002) projects 203,500 new cases of breast
cancer and 40,000 deaths in the United States in 2002. Currently, the method of
prevention of breast cancer is unknown. However, early detection through breast cancer
screening can be an effective way to significantly decrease the mortality rate. In fact, the
survival rate is as high as 95%, if the cancer is detected early (National Cancer Institute,
2001). One preventative health practice, screening mammography, has been found to
dramatically reduce mortality associated with breast cancer. A goal of Healthy People
2000 included increasing the percentage of women age 50 and older to have a
mammogram every one to two years to 60% (U.S. Department of Health and Human
Services, 1995).
Despite its life-saving potential, mammography remains underused. Only half of
the women in the age group of 50 and older have received a mammogram in the
preceding one to two years (U.S. Department of Health and Human Services, 1995;
4
Lauver, Nabholz, Scott, &Tak, 1997). Moreover, even when physicians recommend a
mammogram to women, more than one-third do not follow through with the actual
Note. R2= .190; Adjusted R2= .148; *p < .05Missing dummy variables: Single, Non-white, Income <$35,000, High School Diploma, Part-time, Classified, No Dependent(s), and Age 50-70
Perceived Benefits Model
When perceived benefits and all control variables were added to the regression
model, ten percent of the variance in prior mammography screening behavior was
explained. Significance was found in the relationship between perceived benefits and
Note. R2= .126; Adjusted R2= .081; *p < .05Missing dummy variables: Single, Non-white, Income <$35,000, High School Diploma, Part-time, Classified, No Dependent(s), and Age 50-70
47
Perceived Susceptibility Model
When perceived susceptibility and all control variables were added to the regression
model, less than one percent of the variance in prior mammography screening behavior
was explained. No significant relationship between perceived susceptibility and
mammogram screening behavior was found (Table 9). Once again, other independent
variables were statistically significant and included Age 49 (p =. 01) and job
classification Administrator/Professional (p = .04). That is, mammography screening was
less likely in respondents that were younger and had administrative and professional job
classifications. Therefore, after controlling for important socioeconomic variables,
perceived susceptibility was shown to play a weak and nonsignificant role in explaining
prior mammography screening behavior.
Table 9. Multiple Linear Regression Susceptibility Model Analysis Dependent Variable = Mammogram Screening
Note. R2= .099; Adjusted R2= .053; *p < .05Missing dummy variables: Single, Non-white, Income <$35,000, High School Diploma, Part-time, Classified, No Dependent(s), and Age 50-70
48
Full Model
When the four HBM components and all control variables were added to the
regression model, 17.6% of the variance in prior mammography screening behavior was
explained. Significance was found in the relationship between the full model and
Note. R2= .225; Adjusted R2= .176; *p < .05Missing dummy variables: Single, Non-white, Income <$35,000, High School Diploma, Part-time, Classified, No Dependent(s), and Age 50-70
50
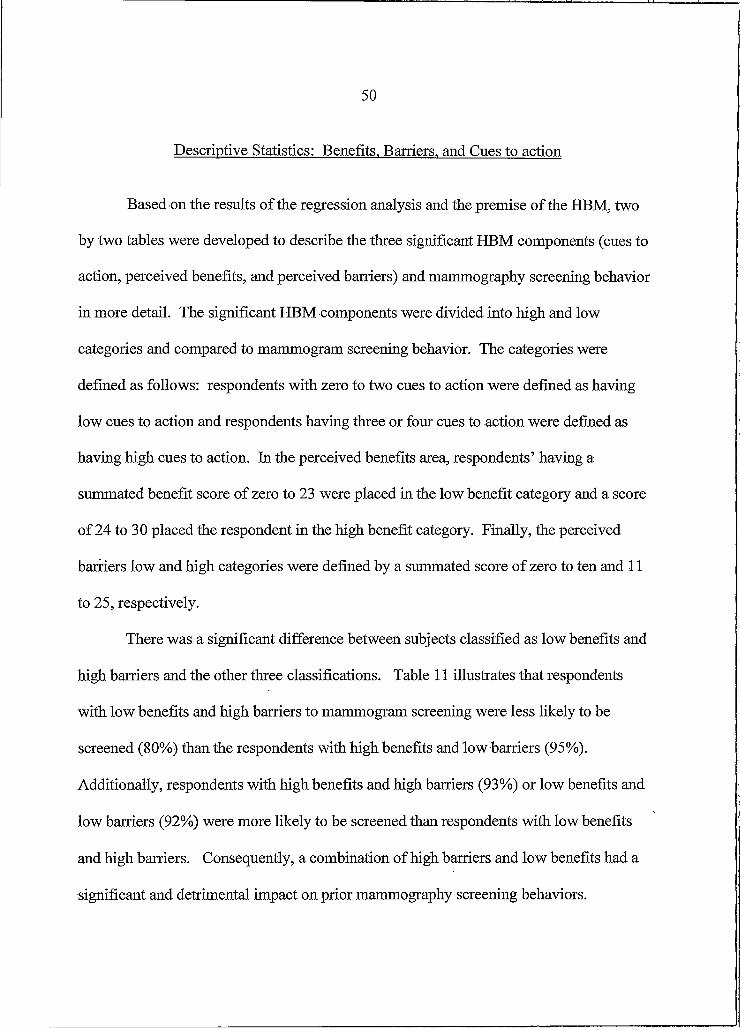
Descriptive Statistics: Benefits. Barriers, and Cues to action
Based on the results of the regression analysis and the premise of the HBM, two
by two tables were developed to describe the three significant HBM components (cues to
action, perceived benefits, and perceived barriers) and mammography screening behavior
in more detail. The significant HBM components were divided into high and low
categories and compared to mammogram screening behavior. The categories were
defined as follows: respondents with zero to two cues to action were defined as having
low cues to action and respondents having three or four cues to action were defined as
having high cues to action. In the perceived benefits area, respondents’ having a
summated benefit score of zero to 23 were placed in the low benefit category and a score
of 24 to 30 placed the respondent in the high benefit category. Finally, the perceived
barriers low and high categories were defined by a summated score of zero to ten and 1 1
to 25, respectively.
There was a significant difference between subjects classified as low benefits and
high barriers and the other three classifications. Table 11 illustrates that respondents
with low benefits and high barriers to mammogram screening were less likely to be
screened (80%) than the respondents with high benefits and low barriers (95%).
Additionally, respondents with high benefits and high barriers (93%) or low benefits and
low barriers (92%) were more likely to be screened than respondents with low benefits
and high barriers. Consequently, a combination of high barriers and low benefits had a
significant and detrimental impact on prior mammography screening behaviors.
51
Table 11. Mammogram Screening Behavior with Benefits and BarriersHIGH BENEFITS % Of mammograms
One explanation for this finding may be that mammography screening is a measure of
secondary prevention. That is, mammography screening will not prevent breast cancer.
Therefore, the perceived susceptibility construct may be more applicable to disease or
60
illness prevention screenings (Holm, Frank, and Curtin, 1999). Nevertheless, perceived
susceptibility will not be a part of the wellness program intervention.
Summary
A significant association was found between two of the four HBM components
and prior mammography screening behavior. Specifically, cues to action (e.g. physician)
and perceived benefits remained significant in all regression analyses. The perceived
barriers component was shown to play a moderate role in explaining prior mammography
screening behavior while the perceived susceptibility component was shown to be
nonsignificant. Based on these results, a variety of interventions techniques should be
utilized based on available resources to modify significant HBM constructs to increase
screening rates in the Bozeman School District.
!,imitations
In interpreting the present results, readers should consider the limitations to this
study. First, the investigator depended on self-reports of mammography screening
behavior and history along with other important variables (e.g., physician and health care
provider input). However, self-reports of mammography screening have been shown to
be highly accurate (Rimer Sc King, 1992).
Second, the results of this study are not generalizable outside the population of the
Bozeman School District #7 female employees. The BSD population can be
characterized as white, well educated, and middle class, with access to medical care.
61
Third, the entire Health BeliefModel was not utilized. Two HBM components,
perceived severity and self-efficacy were left out of the study. As indicated earlier, most
individuals view cancer as a serious disease. However, perceived severity has been used
in previous studies with mixed results (Aiken et ah, 1994; Drossaert, Boer, Sc Seydel,
• 1996). Due to the strong interrelationship between the six HBM components, further
research should examine the complete model as a combination of constructs.
Finally, although significant, most correlations in this study were low, indicating
that other sources of variance not measured are important in predicting mammography
screening utilization. These results do suggest the need for considering a broad range of
predisposing variables in attempts to increase mammography screening.
62
REFERENCES CITED
63
Aiken, L. S., West, S. G., Woodward, C. K., & Reno, R. R. (1994). Health beliefs and compliance with mammography screening recommendations in asymptomatic women. Health Psychology, 13(2), 122-129.
Aldana, S. (1998). Financial impact of worksite health promotion and methodological quality of the evidence. The Art o f Health Promotion,2(7A 1-8.
American Cancer Society (2001) Cancer Facts and Figures - 2001.American Cancer Society, Atlanta.
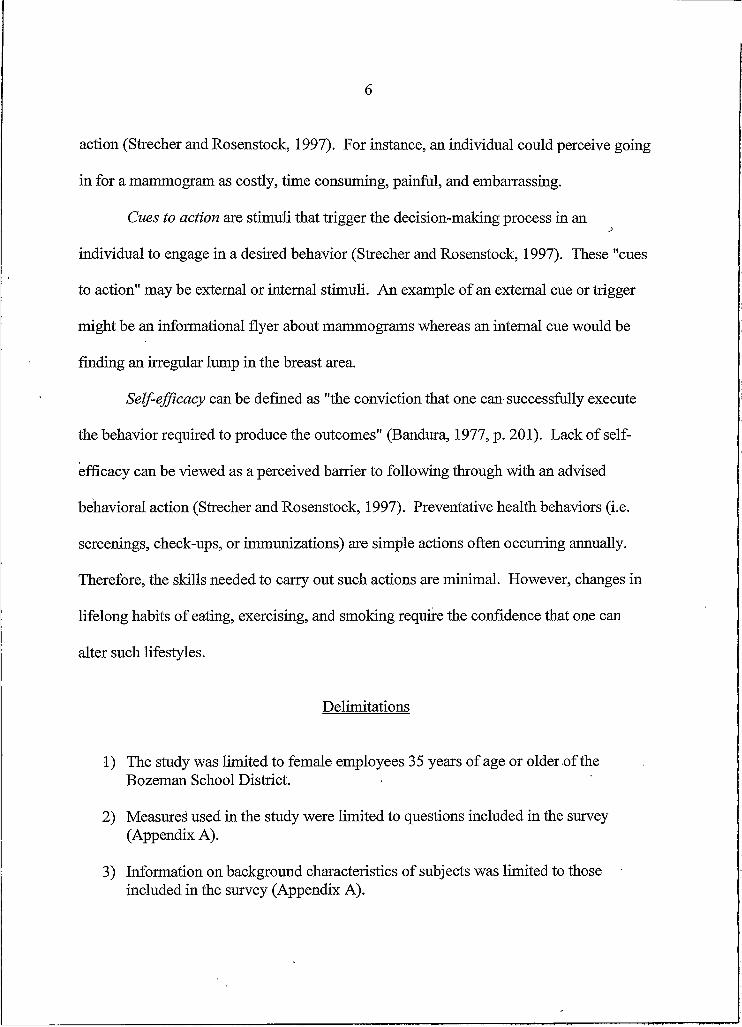
Bandura, A. (1977). Self-efficacy: Toward a unifying theory of behavior change. psychological Review, 84, 191-215.
Bernstein Hyman, R., Baker, S., Ephraim, R., Moadel, A., & Philip,,!. (1994). Health belief model variables as predictors of screening mammography utilization. JournalofBehavioralMedicine, 17(4), 391-406.
Centers for Disease Control and Prevention (1998). Behavioral risk factor surveillance system user's guide. Atlanta, GA: U.S. Department of Health and Human Services, Centers for Disease Control and Prevention.
Champion V. (1991). Compliance with guidelines for mammography screening. Cancer Detection Prevention, 16, 253-258.
Champion V. (1994). Relationship of age to mammography compliance. Cancer Supplement, 74, 329-335.
Champion V. (1995). Development of a benefits and barriers scale for mammography utilization Cancer Nursing, 18, 53-59.
Champion V. and Menon U. (1997). Predicting mammography and breast self examination in African American women. Cancer Nursing, 20, 315-322.
Champion V. and Miller A.M. (1996). Recent mammography in women aged 35 and older: predisposing variables. Health Care for Women International, 17, 233- 245.
Di liman, D. A. (2000). Mail and Internet Surveys: The Tailored Design Method (Second ed.). New York: John Wiley & Sons.
64
Dolan N., Reifler D, McDermott M, & McGaghie W. (1995). Adherence to screeningmammography recommendations in a university general medicine clinic. Journal o f General Internal Medicine, 10, 299-306.
Drossaert, C. C. H., Boer, H. & Seydel, E. R. (1996). Perceived risk, anxiety,mammogram uptake, and breast self-examination of women with a family history of breast cancer: the role of knowing to be at increased risk. Cancer Detection and Prevention 20, 76-85.
Dunnagan, T., Duncan, S., & Paul, L. (2000). Doing effective evaluations: a casestudy of family empowerment due to welfare reform. Evaluation and Program Planning: An International Journal, 23, 125-136.
Dunnagan, T., Peterson, M., & Wilson, J. (1997). Qualitative evaluation techniques and wellness programming. American Journal o f Health Studies, 13(4), 205-214.
Goetzel, R. & Ozminkowski, R. (2000). Health and productivity management: emerging opportunities for health promotion professionals for the 21st century. American Journal o f Health Promotion, 14(4), 211-214.
Goldbeck, W. Forward. In: O'Donnell MP, Ainsworth, TH, Eds. Health Promotion in the Workplace. New York: John Wiley and Sons; 1984, vi.
Holm, C. J., Frank, D. I., & Curtin, J. (1999). Health beliefs, health locus of control, and' women’s mammography behavior. Cancer Nursing, 22, 149-156.
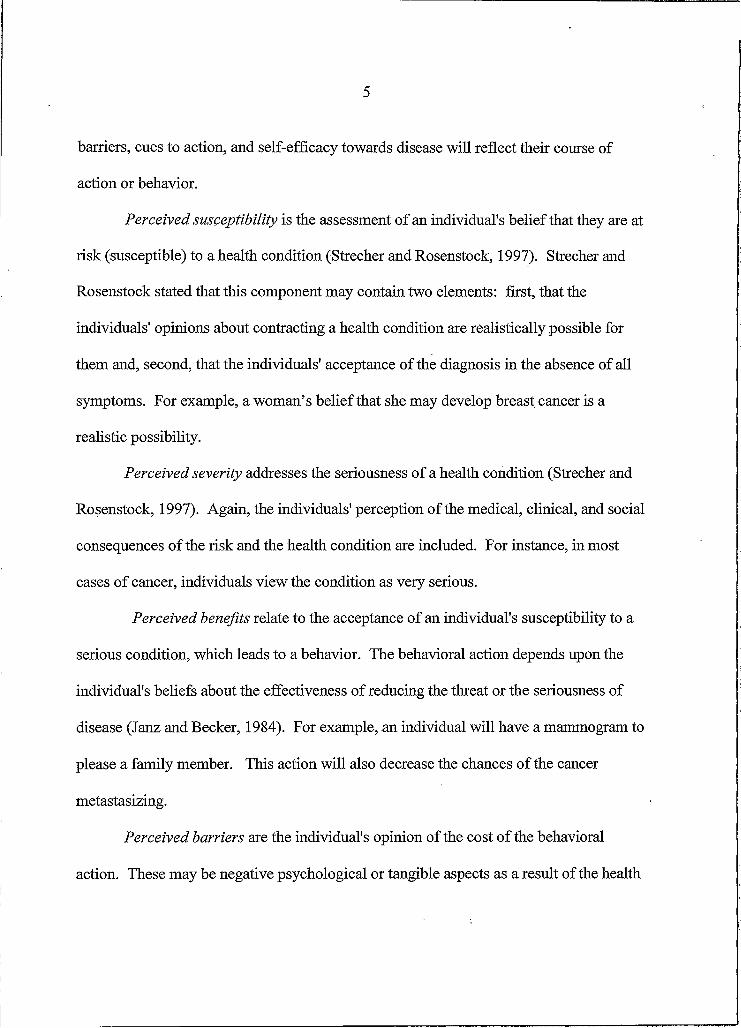
Janz, N. K. & Becker, M. H. (1984). The health belief model: A decade later. Health Education Quarterly, 11(1), 1-47.
Kirscht, J. P. (1974). The Health BeliefModel and Illness Behavior. Health Education Monographs, 2(4), 387-408.
Krueger, R. A. (1998). Developing Questions for Focus Groups. Thousand Oaks, CA: Sage Publications, Inc.
Lauver, D., Nabholz, S., Scott, K., & Tak, Y. (1997). Testing theoretical explanations of mammography use. NursingResearch, 46, 32-39.
Montana Department of Public Health and Human Services. (2001). Assessing health risks in Montana: 1999 survey results from the Montana behavioral risk factor surveillance system. Helena, MT: Montana DPHHS, Health Planning and Evaluation Section.
65
Montano, D. E. & Taplin, S. H. (1991). A test of an expanded theory of reasoned action to predict mammography participation. Social Science and Medicine, 32, 733- 741.
National Cancer Institute. (2001). Cancer Information, [Web Site]. National Cancer Institute. Available: http://cancer.gov [2002, February 21].
Office of Disease Prevention and Health Promotion. (1992). Washington, DC: US Public Health Service.
Patton, M. (1990). QualitativeEvaluationandResearchMethods. London: Sage Publications.
Reardon, J. (1998). The history and impact of worksite wellness.Nursing Economics, 16(3), 117-121.
Rimer, B. K., & King, E. S. (1992). Why aren’t older women getting mammograms and clinical breast exams? Women’s Health Issues, 2, 94-101.
Silverstein, M. J. (1994). Noninvasive breast cancer. Obstet Gynecol Clin NorthAm,27, 539-658.
SPSS. (2000). SPSS Graduate Pack 10.0 for Macintosh: SPSS, Inc.
Stokols, D. (1996). Translating social ecological theory into guidelines for community health promotion. American Journal o f Health Promotion, 10(4), 282-298.
Strecher V.J. and Rosenstock TM. (1997). The health belief model. In K. Glanz, F. M. Lewis, & B. K. Rimer (Eds.), Health Behavior and Health Education: Theory, Research and Practice (pp. 41-59). Jszn Francisco, CA: Jossey-Bass Publishers.
Tabachnick, B. G. and Fidell, L. S. (1989). Using Multivariate Statistics (Second ed.). New York: Harper & Row.
U.S. Department of Health and Human Services. (1995). Healthy people 2000midcourse review and 1995 revisions. Washington, DC: U.S. Government Printing Office.
Yarbrough S.S. and Braden C.J. (2001). Utility of health belief model as a guide forexplaining or predicting breast cancer screening behaviours. Journal o f Advanced Nursing, 33(5), 677-688.
I am writing to request your participation in a school district wide research effort, and with the hope that you will participate.
The research concerns our Employee Wellness Program (EWP). The study is intended to evaluate the impact of the EWP on the employee population as well as provide guidance in future programming. The study is being conducted by Kim Hartman, graduate student at Montana State University. This project has the full support of the Bozeman Wellness Committee.
Your participation is of course, voluntary but I hope you will choose to take part. The investigator has gone through an extensive process, approved by the MSU-Bozeman Human Subjects Committee, to protect respondent anonymity. Only summarized information from all the respondents will be used or published.
Please take some time right now to complete and return the enclosed questionnaire. By responding within the next five days, you can help us save resources and time that would otherwise go to follow-ups with those who have not responded. If you have any questions about the study, please feel free to call Kim Hartman at Chief Joseph Middle School (522-6349).
Again, thank you for your support and assistance in this research project.
Sincerely,
Bruce Colton Wellness Director
69
We urge you to respond, to give us the benefit of your candid judgments and experiences, regardless of the extent of any involvement in Employee Wellness Program activities. Your participation is, of course, voluntary. Confidentiality will be strictly maintained. Please complete and return this questionnaire within the next five days. An in-house address, on the back page of this questionnaire is provided for your convenience. Please feel free to call Kim Hartman at 522-6349 if you have any questions or concerns.INSTRUCTIONS
Who should complete this survey?
We are asking all of the Bozeman School District female employees to complete this survey.
What is this survey about?
We are interested in your thoughts, feelings, and attitudes and experiences as they relate to breast cancer screening. There are no right or wrong answers.
What do I do?
Please mark one box (X) or write in the most appropriate response for each question.
START HERE
I. Has your physician ever talked to you about early detection of breast cancer?
□ Yes□ No
2. Has a health professional, other than your physician, talked to yoti about early detection of breast cancer?
□ Yes□ No
3. Has your physician discussed mammography with you?
□ Yes□ No
4. Has a health professional, other than your physician, discussed mammography with you?
□ Yes□ No
5. Has your mother, sister, grandmother, or any other blood relative had breast cancer?
□ Yes□ No
6. A mammogram is an x-ray of each breast to look for breast cancer. Have you ever had a mammogram?
□ Yes□ No (Go to question #11)
70
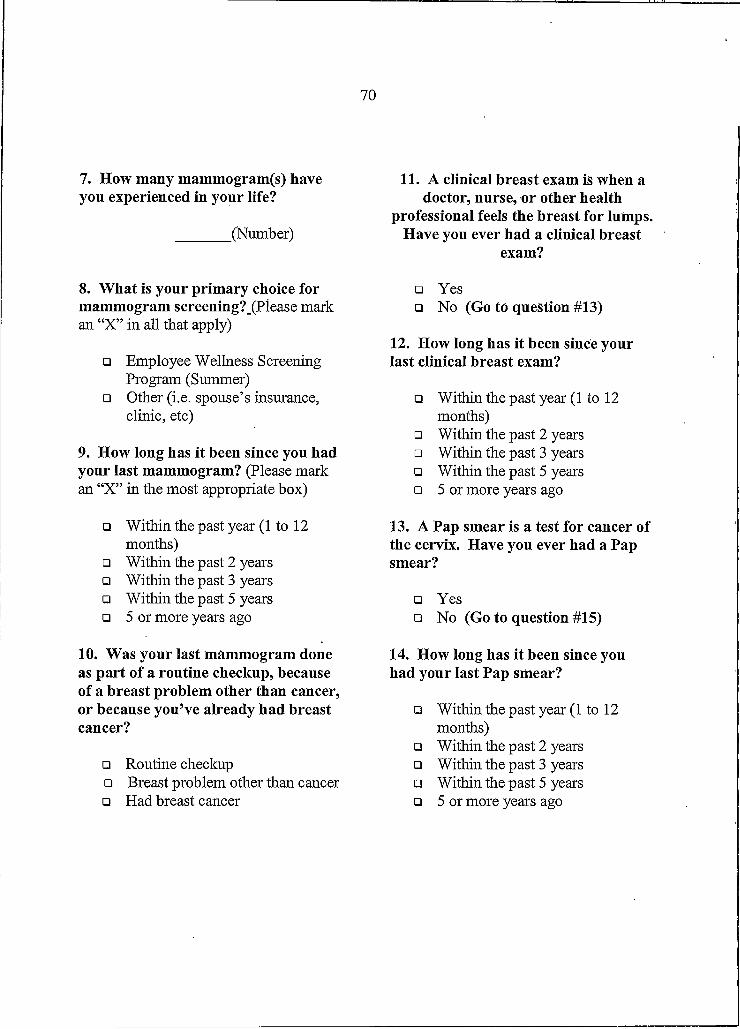
7. How many mammogram(s) have you experienced in your life?
_______(Numb er)
8. What is your primary choice for mammogram screening?_(Please mark an “X” in all that apply)
□ Employee Wellness Screening Program (Summer)
□ Other (i.e. spouse’s insurance, clinic, etc)
9. How long has it been since you had your last mammogram? (Please mark an “X” in the most appropriate box)
□ Within the past year (I to 12 months)
□ Within the past 2 years a Within the past 3 years a Within the past 5 years a 5 or more years ago
10. Was your last mammogram done as part of a routine checkup, because of a breast problem other than cancer, or because you’ve already had breast cancer?
□ Routine checkupa Breast problem other than cancer□ Had breast cancer
11. A clinical breast exam is when a doctor, nurse, or other health
professional feels the breast for lumps. Have you ever had a clinical breast
exam?
a Yes□ No (Go to question #13)
12. How long has it been since your last clinical breast exam?
□ Within the past year (I to 12 months)
□ Within the past 2 years□ Within the past 3 years□ Within the past 5 years□ 5 or more years ago
13. A Pap smear is a test for cancer of the cervix. Have you ever had a Pap smear?
□ Yeso No (Go to question #15)
14. How long has it been since you had your last Pap smear?
a Within the past year (I to 12 months)
□ Within the past 2 years□ Within the past 3 years□ Within the past 5 years□ 5 or more years ago
71
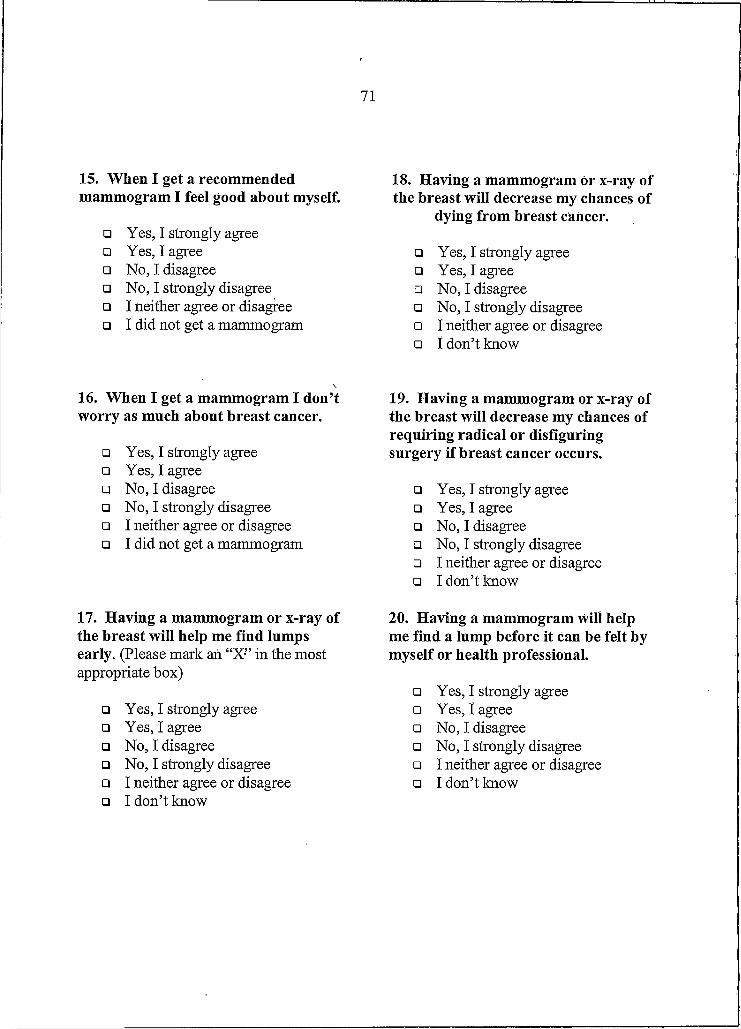
15. When I get a recommended mammogram I feel good about myself.
□ Yes, I strongly agree□ Yes, I agree□ No, I disagree□ No, I strongly disagree□ I neither agree or disagree□ I did not get a mammogram
18. Having a mammogram or x-ray of the breast will decrease my chances of
dying from breast cancer.
□ Yes, I strongly agree□ Yes, I agree□ No, I disagree□ No, I strongly disagree□ I neither agree or disagree□ I don’t know
16. When I get a mammogram I don’t worry as much about breast cancer.
□ Yes, I strongly agree□ Yes, I agree□ No, I disagree□ No, I strongly disagree□ I neither agree or disagree□ I did not get a mammogram
17. Having a mammogram or x-ray of the breast will help me find lumps early. (Please mark ah “X” in the most appropriate box)
□ Yes, I strongly agree□ Yes, I agree□ No, I disagree□ No, I strongly disagree□ I neither agree or disagree□ I don’t know
19. Having a mammogram Or x-ray of the breast will decrease my chances of requiring radical or disfiguring surgery if breast cancer occurs.
□ Yes, I strongly agree□ Yes, I agree□ No, I disagree□ No, I strongly disagree□ I neither agree or disagree□ I don’t Icnow
20. Having a mammogram Will help me find a lump before it can be felt by myself or health professional.
□ Yes, I strongly agree□ Yes, I agree□ No, I disagree□ No, I strongly disagree□ I neither agree or disagree□ I don’t know
72
21. Having a routine mammogram or x-ray of the breast would make me worry about breast cancer.
□ Yes, I strongly agree a Yes, I agree□ No, I disagreea No, I strongly disagree□ I neither agree or disagree a I don’t know
22. Having a mammogram or x-ray of the breast would be embarrassing.
a Yes, I strongly agree □ Yes, I agree a No, I disagree a No, I strongly disagree a I neither agree or disagree D I don’t know
24. Having a mammogram or x-ray of the breast would be painful.
a Yes, I strongly agree□ Yes, I agree□ No, I disagreea No, I strongly disagree□ I neither agree Or disagree□ I don’t know
25. Having a mammogram or X-ray of the breast would cost too much money. (Please mark an “X” in the most appropriate box)
□ Yes, I strongly agree a Yes, I agreea No, I disagree□ No, I strongly disagree□ I neither agree or disagree a I don’t know
23. Having a mammogram or x-ray of the breast would take too much time.
a Yes, I strongly agree o Yes, I agree□ No, I disagreea No, I strongly disagree o I neither agree or disagree□ I don’t know
26. The Employee Wellness summer time mammogram screening is difficult to fit into my schedule.
a Yes, I strongly agree□ Yes, I agree□ No, I disagree□ No, I strongly disagreea I neither agree or disagree a I don’t know
73
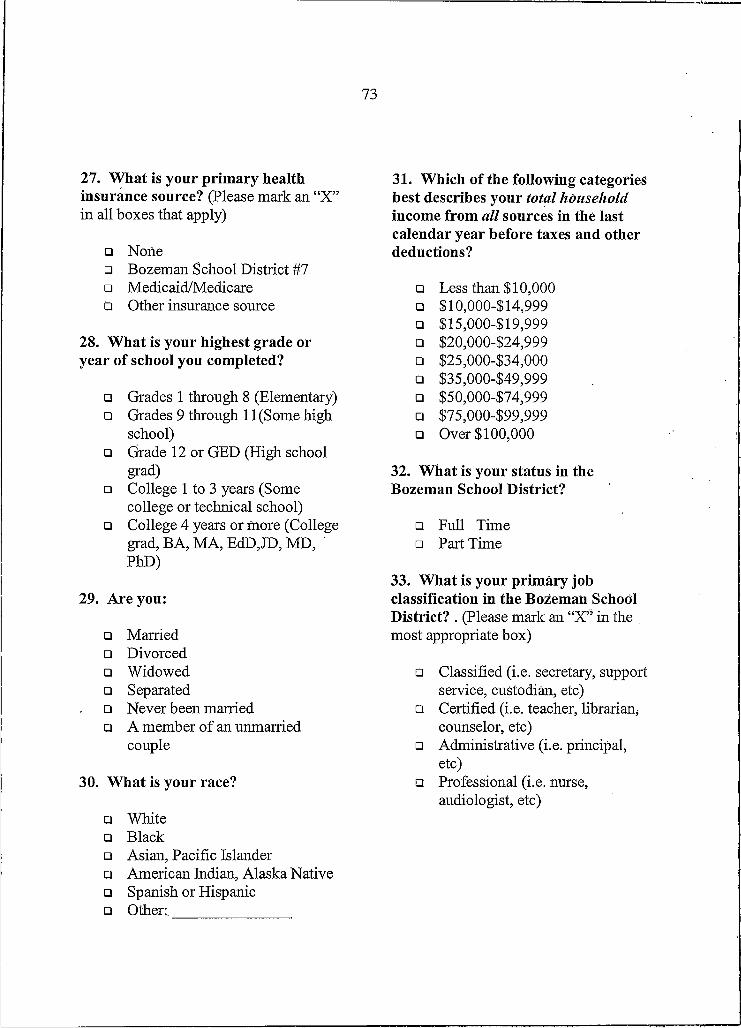
27. What is your primary health insurance source? (Please mark an “X” in all boxes that apply)
a Nonea Bozeman School District #7□ Medicaid/MedicareD Other insurance source
28. What is your highest grade or year of school you completed?
□ Grades I through 8 (Elementary) a Grades 9 through I !(Some high
school)a Grade 12 or GED (High school
grad)a College I to 3 years (Some
college or technical school) a College 4 years or more (College
grad, BA, MA, EdD,JD, MD, ' PhD)
29. Are you:
□ Married□ Divorced a Widowed a Separated□ Never been marrieda A member of an unmarried
couple
30. What is your race?
a White a Black□ Asian, Pacific Islandera American Indian, Alaska Native□ Spanish or Hispanic□ Other;_______________
31. Which of the following categories best describes your to ta l h o u seh o ld income from a ll sources in the last calendar year before taxes and other deductions?
a Less than $ 10,000 a $10,000-$14,999 a $15,000-$ 19,999□ $20,000-$24,999 o $25,000-$34,000 a $35,000-$49,999□ $50,000-$74,999 a $75,000-$99,999□ Over $100,000
32. What is your status in the Bozeman School District?
□ Full Time a Part Time
33. What is your primary job classification in the Bozeman School District? . (Please mark an “X” in the most appropriate box)
a Classified (i.e. secretary, support service, custodian, etc)
34. How many dependents do you have, other than a spouse, in each age category? (Include children and any others.) Place an (X) next to “none” if you have no dependents.
None
_____Under 6 years
_____6-12 years
____ 13-17 years
_____18-65 years
_____Over 65 years
35. Who would you listen to about getting a mammogram? Please rank the following people or groups in order of importance with I being the most important and 8 being the least important.
_____Breast cancer survivorFamily
_____Friend_____Physician_____Health Professional, other than a
Physician_____Media_____Co-worker_____Spouse/Significant other
36. What is your age as of your last birthday?
________Age (years)
37. Please indicate your primary building assignment:
□ High School□ Bridger Alternative□ Chief Joseph Middle□ Sacajawea Middle□ Emily Dickinson□ Hawthorne□ Irving□ Longfellow□ Morning Star□ Whittier□ Wilson□ Support Services
The appropriate data will be combined and provided in summarized form to the research investigator; no identification will be included. This process of ensuring anonymity has been carefully reviewed and approved by the MSU- Bozeman Human Subjects Committee, which oversees research like this with human subjects. However, if you choose not to provide us with your building assignment, we urge you to still return your completed questionnaire. Thank you!
Please tri-fold your survey and staple so that “Kim Hartman CJMS” shows on the back of this booklet and send via in-house mail.
76
B o z e m a n
WI E Wl O R A N D U WI
WWAMI Medical Program 308 LeonJolmson Hall P.O. Box 173080 Montana State University Bozeman, MT 59717-3080 Telephone: 406-994-4411 FAX: 406-994-4398 E-mail: [email protected]
TO: Kimberly Ann Hartman
Stephen Guggenheim, M.D.Human Subjects Administrator '
/ /FROM:
DATE: February 8, 2002
SUBJECT: Health Belief Model and its Application of Mammography in a K-12 School District Employee Wellness Program
The above research, described in your submission of February 5, 2002 is exempt from the requirement of review by the human subjects committee in accordance with the Code of Federal Regulations, Part 46, section 101. The specific paragraph which applies to your research is
___ (b)(1) Research conducted in established or commonly accepted educational settings,involving normal educational practices.
X (b)(2) Research involving the use of educational tests, survey procedures, interview procedures or observation of public behavior.
___ (b)(4) Research involving the collection or study of existing data, documents, records,pathological specimens, or diagnostic specimens, if these specimens are publicly available, or if the information is recorded by the investigator in such a manner that the subjects cannot be identified.
___ Other
Although review by the Human Subjects Committee is not required for the above research, the Committee will be glad to review it. If you wish a review and committee approval, please submit 3 copies of the usual application form and it will be processed by expedited review.
^WlWAMT > C l □ a b
Regional Medical School for Washington, Wyoming, Alaska, Montana & Idaho