Abstract SHEIK NAINAR, MOHAMED ASHRAF ALI. The Effects of Gain Adaptation for QoS Deterioration in Internet-based Teleoperation Involving Use of a Virtual Reality Interface. (Under the direction of Dr. David B.Kaber) The goals of this study included evaluating the affects of different types of communication network delays on remote-control rover (telerover) performance, operator telepresence experiences and workload. The study also evaluated the utility of gain adaptation for communication delays on telepresence, performance and workload. Finally, the work examined the relationship between performance and subjective presence in an Internet-based teleoperation scenario utilizing a virtual reality (VR) interface. Telepresence has been identified as a design ideal for teleoperation systems; and task environment factors, such as disturbances in human-machine interaction, have been identified as potential underpinnings of presence experiences. A VR-based simulation of a telerover navigation task was developed for this study. The task involved navigating the rover in a virtual environment (VE) between obstacles, like a slalom ski race. Task performance measures included time-to-task completion (TTC) and the number of collisions of the rover with task obstacles (errors). Two levels of telerover automation (LOA) were implemented including teleoperation, or manual control, and telerobotic or automation assisted control. Combinations of LOAs and delay types, including constant and random, were tested with and without gain adaptation. A mixed between-within experimental design was used in which LOA served as a grouping variable. Each subject experienced 10 test trials (2 no-delay + 2 × (2 delay types × 2 adaptation settings)) under either the teleoperation or
Transcript
A b s t r a c t
SHEIK NAINAR, MOHAMED ASHRAF ALI. The Effects of Gain
Adaptation for QoS Deterioration in Internet-based Teleoperation Involving
Use of a Virtual Reality Interface. (Under the direction of Dr. David B.Kaber)
The goals of this study included evaluating the affects of different types of
communication network delays on remote-control rover (telerover)
performance, operator telepresence experiences and workload. The study also
evaluated the utility of gain adaptation for communication delays on
telepresence, performance and workload. Finally, the work examined the
relationship between performance and subjective presence in an Internet-based
teleoperation scenario utilizing a virtual reality (VR) interface. Telepresence has
been identified as a design ideal for teleoperation systems; and task
environment factors, such as disturbances in human-machine interaction, have
been identified as potential underpinnings of presence experiences.
A VR-based simulation of a telerover navigation task was developed for this
study. The task involved navigating the rover in a virtual environment (VE)
between obstacles, like a slalom ski race. Task performance measures included
time-to-task completion (TTC) and the number of collisions of the rover with
task obstacles (errors). Two levels of telerover automation (LOA) were
implemented including teleoperation, or manual control, and telerobotic or
automation assisted control. Combinations of LOAs and delay types, including
constant and random, were tested with and without gain adaptation. A mixed
between-within experimental design was used in which LOA served as a
grouping variable. Each subject experienced 10 test trials (2 no-delay + 2 × (2
delay types × 2 adaptation settings)) under either the teleoperation or
telerobotic control mode. Subject exposure to various network conditions was
randomized. Presence questionnaire and the NASA Task Load Index were
used to capture subjective telepresence and workload ratings, respectively, at the
end of each test trial.
Results revealed that LOA, delay, adaptation and the interaction of LOA and a
variable describing the overall network condition (a combination of delay and
adaptation) significantly affected TTC. The telerobotic control mode produced
the best TTC irrespective of the delay type and adaptation. Both delay types
combined with adaptation produced the worst TTC within each LOA, as
compared to all other network conditions. Performance errors/collisions were
significantly affected by LOA, delay and adaptation. The telerobotic control
mode produced the greatest number of errors and the adaptation conditions
were superior to no-adaptation conditions. The constant delay produced more
errors than the random delay type.
Both telepresence and workload were significantly affected by LOA and
individual differences with telerobotic control producing higher telepresence
ratings along with lower workload scores.
Telepresence was found to be significantly correlated with TTC, specifically
there was a reduction in TTC with an increase in telepresence ratings.
Workload was significantly positively correlated with telepresence. Although
the telerobotic control mode reduced operator workload, it off-loaded some of
the rover control responsibilities from the user to the machine system allowing
the operator to pay more attention to the VR displays promoting their
knowledge of the current state of the VE and possibly presence sensations.
These correlation analysis results are similar to those established by previous
research. It was expected that the gain adaptation would better support users in
achieving and sustaining telepresence. Although changes in telepresence across
the adaptation and no-adaptation conditions under telerobotic control were
inline with this hypothesis, similar results were not found with teleoperation
control.
The results of this study are directly applicable to the selection of guaranteed
communication network parameters through Quality of Service (QoS) in
Internet-based telemanipulation systems. The results also can be used as
guidelines for telerover control mode selection for time and error critical
teleoperation. Finally, the results support the notion that telepresence may be
important to performance in teleoperation tasks (and that gain adaptation for
network delays under certain control modes may be beneficial to telepresence).
THE EFFECTS OF GAIN ADAPTATION FOR QOS
DETERIORATION IN INTERNET-BASED TELEOPERATION
INVOLVING USE OF A VIRTUAL REALITY INTERFACE
by
MOHAMED SHEIK NAINAR
A thesis submitted to the Graduate Faculty of North Carolina State University
in partial fulfillment of the requirements for the Degree of
Master of Science
COMPUTER ENGINEERING
Raleigh
2002
Approved By:
ii
D e d i c a t i o n
Dedicated to my dearest Dad and Mom and to my Sister who is my friend,
philosopher and guide.
iii
B i o g r a p h y
Mohamed Ashraf Sheik Nainar was born in a small town called Nagore, in the
state of Tamil Nadu in the southern part of India. He was raised in Madras
(now called Chennai), where he completed his high school education in 1994.
He later joined the University of Madras for a Bachelor of Engineering in
Mechanical Engineering and graduated in 1998. Following graduation, he
joined Caborundum Universal Ltd., an abrasive manufacturing company as a
Graduate Engineer Trainee.
In fall 2000, the author began his graduate study at North Carolina State
University. Since that time, he has been working with Dr. David Kaber,
primarily in creating virtual reality simulations for a number of research
experiments and designing the websites for funded research projects.
iv
A c k n o w l e d g e m e n t
Foremost, I wish to thank Dr. David Kaber for giving me the opportunity to
conduct this research with his guidance. I am also thankful to Dr. Mo-Yuen
Chow and Dr. Alexander Dean for their support and patience. I would also like
to thank the National Science Foundation for support through a Graduate
Research Assistantship as part of the grant, "CAREER: Telepresence in
Teleoperation" (No. IIS-9734504), without which my studies would not have
been possible. My thanks are also due to my colleagues in the NC State
Ergonomics lab and to my friends who motivated me when I needed it the
most. Finally, I am gratefully indebted to my Dad, Mom and Sister without
whom I would not be where I am today. And last but not least, I thank and
pray to Almighty God for his blessings.
v
TABLE OF CONTENTS
List of Tables......................................................................................................................vii List of Figures ...................................................................................................................viii Glossary................................................................................................................................ ix 1. Introduction.....................................................................................................................1
1.1 Computers and Virtual Environments................................................................3 1.2 Communication Medium.......................................................................................5 1.3 Disturbances from the Real-World Environment ............................................7 1.4 Task Factors .............................................................................................................7
2.1 History of Internet-based Telerobots..................................................................8 2.2 Communication Protocols.....................................................................................9 2.3 General Limitations of the Internet...................................................................10 2.4 Internet-based Teleoperation versus Conventional Teleoperation .............11 2.5 Quality of Service ..................................................................................................12
3. Motivation and Problem Statement ..........................................................................13 4. Virtual Reality Interface ...............................................................................................16
4.1 Schematic of the VR Interface............................................................................16 4.1.1 Main Controller.............................................................................................16 4.1.2 Local Controller ............................................................................................18 4.1.3 Telerover ........................................................................................................18 4.1.4 Network..........................................................................................................18
4.2 Main Controller Adaptation................................................................................19 4.3 Interface Design ....................................................................................................19
7.1.1 Time-to-Task Completion ..........................................................................35 7.1.2 Number of Errors/Collisions ....................................................................37 7.1.3 Potential Advantages of Gain Adaptation ...............................................40
8.1.1 Time-to-Task Completion ..........................................................................46 8.1.2 Number of Errors/Collisions ....................................................................47
9.1 Limitations of Current Research ........................................................................52 9.2 Design Implications ..............................................................................................54 9.3 Future Research Directions.................................................................................54
10. References ....................................................................................................................56 Appendix A: Mathematical Model of the System.......................................................62 Appendix B: Presence Questionnaire............................................................................69 Appendix C: NASA-TLX Workload Survey ...............................................................70 Appendix D: Anthropometric Data Survey.................................................................72 Appendix E: Subject Instructions ..................................................................................73 Appendix F: Informed Consent.....................................................................................83 Appendix G: Simulator Sickness Questionnaire .........................................................85
vii
L i s t o f T a b l e s
Table 5.1 Data collection table based on experimental design................................28
Table 5.2 Training protocol ...........................................................................................29
Table 7.1 F-values and p-values from ANOVA on error as response measure – Full Model .......................................................................................................38
Table 7.2 F-values and p-values from ANOVA on error as response measure – Reduced Model ..............................................................................................39
Table 7.3 Pearson product moment coefficients for telepresence and workload ratings ................................................................................................................44
Table A.1 Parameters of telerover ................................................................................65
viii
L i s t o f F i g u r e s
Figure 4.1 Schematic of the VR interface....................................................................17
Figure 4.2 Zones in aerial window for view panning and destination selection using crosshairs .................................................................................................21
Figure 4.3 VR interface for telerover navigation.........................................................21
Figure 5.1 Exocentric view of telerover navigation...................................................24
Figure 5.2 Aerial view of telerover navigation............................................................24
Figure 5.3 Histogram of random delays generated for the experiment.................26
Figure 7.1 Mean TTC for LOA groups by each network condition......................36
Figure 7.2 Mean TTC under various network conditions grouped by LOA .......37
Figure 7.3 Average collisions for different LOA groups by network condition..39
Figure 7.4 Average collisions for different network conditions grouped by LOA ...............................................................................................................................40
Figure 7.5 Effects of gain adaptation on TTC and errors under the two LOAs ...........................................................................................................................41
Figure 7.6 Average telepresence ratings for different LOAs grouped by Network conditions ..........................................................................................................42
Figure 7.7 Average workload index for different LOAs grouped by Network conditions ..........................................................................................................43
Figure A.1 Block diagram of Main controller and Local controller .......................62
Figure 5.3. Histogram of random delays generated for the experiment.
5.3 Dependent Variables The dependent measures of interest in this study included performance,
telepresence and workload. As previously mentioned, both the efficiency and
effectiveness of teleoperation task performance were recorded during the
experiment. The time-to-navigate through the entire set of obstacles and the
number of navigation errors/collisions with obstacles were captured by the
workstation running the simulation.
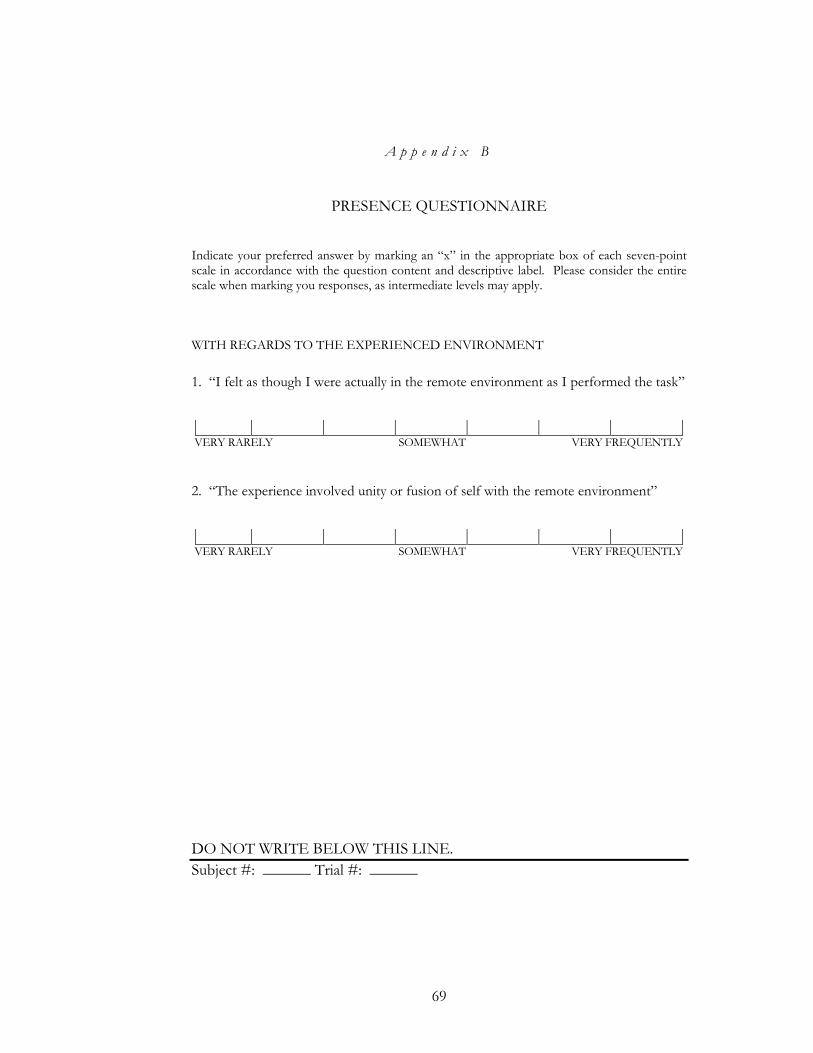
Telepresence was measured using a 2-question Presence Questionnaire (PQ)
developed by Draper and Blair (1996) (Appendix B). The items in the
questionnaire included: “I felt as though I were actually in the remote
environment as I performed the task” and “The experience involved unity or
fusion of self with the remote environment”. A 7-point rating scale was
associated with each question and was used to capture the degree to which a
user agreed with each statement (i.e., subjective rating of telepresence was
made).
27
In order to assess the task workload experienced by subjects during the test
trials, the NASA-Task Load Index (TLX) subjective workload survey
(Appendix C) was administered. Subjects completed a subjective comparison
of demand factors (mental, physical, temporal, performance, frustration and
effort) once before the beginning of the test trials and rated the subjective
perceived workload at the end of each test trial. The rankings and ratings of the
demand components were used to compute a composite index of workload for
the telerover navigation task (a weighted sum of the ratings across all demands).
5.4 Subjects Thirty-two subjects were recruited from the graduate and undergraduate
student population at NC State University for participation in this study on a
voluntary basis. Appendix D presents an anthropometric data survey that was
used in the study to record subject characteristics, such as personal computer
(PC) and PC-based video game experiences. This information was used to
characterize the subject sample. There were 29 male subjects and 3 female
subjects. The average age was 23.72 years. All the subjects had 20/20 vision
without correction. As part of the anthropometric data survey, the subjects
were asked to rate their prior experience with PCs, in general, and PC-based
video gaming using a five-point scale with “1” equal to no experience and “5”
equal to frequent experience. The average rating for PC usage and PC games
were 3.125 and 5.0, respectively.
5.5 Experimental Design Each subject was exposed to all combinations of the three different delay
conditions, including the no-delay (control condition), constant and random
delays, and the two adaptation settings. That is, the type of delay and
adaptation were manipulated as within-subjects variables. However, the LOA
was used as a subject-grouping variable. Each subject was exposed to only one
28
control mode. Half of the subject sample experienced teleoperation control
mode and the remaining half used telerobotic control mode. LOA was handled
as between-subjects variable in order to limit the potential of training carry over
effects from one mode of control to another. The entire experimental design
was replicated once. Thus, two trials were conducted under each delay–
adaptation combination, which produced 10 trials per subject. Table 5.1 shows
the complete data collection table for the experiment and specifically the
distribution of subjects across the experimental conditions.
Table 5.1. Data collection table based on experimental design.
5.6 Procedures The subject training and testing procedures for the experiment are summarized
in Tables 5.2 and 5.3 respectively. The entire training procedure took 45-60
minutes, while the entire testing procedure took 90-120 minutes. Consequently,
subjects were recruited to participate for a maximum of 3 hours in order to
29
Steps in procedure Approximate Time in minutes
1. Introduction to experiment and equipment. 5
2. Completion of informed consent (Appendix F) and anthropometric data survey (Appendix D).
10-15
3. Familiarization of subject with different types of displays as part of VE interface.
10-15
4. Subject familiarization with simulation with no obstacles. 5
5. Completion of simulator sickness questionnaire (SSQ) (Kennedy, Lane, Berbaum, Lilienthal, 1993) to obtain baseline reading (Appendix G).
5
6. Completion of training with reduced number of obstacles with no-delay/lag.
10-15
7. Completion of SSQ (Appendix G). 5
8. Familiarization of subject with telepresence questionnaire (Appendix B).
5
9. Familiarization of subject with NASA-TLX subjective workload survey (Appendix C) and completion of demand factors comparison based on training experience.
10
Table 5.2. Training Protocol.
Step in procedure Approximate Time in minutes
1. Each subject experienced 10 trials of approximately 5-7 minutes. Trials were separated by a 2-minute break.
50-70
2. At the end of each trial, the telepresence questionnaire and NASA-TLX rating form were administered.
20-30
3. After the 5th trial, the SSQ was administered followed by a 5-minute break.
5-10
4. After the 10th trial, the SSQ was administered. 5-10
Table 5.3. Testing Protocol.
30
complete the entire experiment. The specific instructions to subjects as part of
the experiment are presented in Appendix E. Each of the steps presented in
Tables 5.2 and 5.3 is covered in the Appendix E.
5.7 Hypotheses This research primarily assessed the impact of network/communication delays
in teleoperation on human operator performance, presence experiences and
perceived workload. It was expected that when there was an increase in
delay/lag, performance would degrade, or TTC and the number of errors would
increase, with a corresponding decrease in presence and increase in workload.
To offset the impact of lag on user performance and perceived presence, the
concept of gain adaptation was explored. When network delays increased, the
telerover controller would automatically adapt its gain (or speed) to maintain
safe and accurate performance and system stability. This adaptation of gain was
expected to increase TTC, but limit the number of performance errors
(collisions) in comparison to the conditions involving no-adaptation. It was
also hypothesized that when there was deterioration in the network QoS,
adapting the gain would result in a less significant decrease in presence ratings
than when no-adaptation was used to account for the lag. Thus, the adaptation
conditions were expected to result in higher presence ratings compared to the
no-adaptation conditions.
It was also expected that changes in telepresence might vary between the
teleoperation and telerobotic control modes. In the telerobotic mode, since the
user specified a target location and supervised the telerover actions, the impact
of network delay on the user was expected to be minimal. The user did not
directly control the motion of the telerover and thus, only saw a slight decrease
in navigation speed. In the teleoperation mode, the user directly controlled the
31
telerover and hence when there was an adaptation to network QoS
deterioration, the user perceived a drop in navigation speed. This would
increase task completion time and was expected to cause user frustration with
system performance resulting in reduced presence and increased workload. In
general, it was hypothesized that subjects using telerobotic control would
experience less deterioration of presence and lower workload compared to
those using teleoperation control.
Finally, the research was expected to provide insight into the effectiveness of
the adaptation scheme for maintaining performance and facilitating presence.
The study was also expected to provide insight into the relationships between
telepresence, performance and workload under the various teleoperation test
conditions.
32
C h a p t e r 6
DATA ANALYSIS
According to the experimental design, LOA was treated as between-subjects
variable, and network delay and adaptation were handled as within-subjects
variables. All statistical analyses were performed using SAS. They included
multi-way analyses of variance (ANOVA) applied to the dependent variables to
investigate the influence of the delay type, LOA and adaptation on the sense of
telepresence and task performance. The entire experiment was replicated once.
increased frustration and effort. The negative correlation between error and
physical demand suggests that as the subject made less of an effort in
controlling the rover, the task errors increased.
49
8.2 Telepresence Only the LOA manipulation had a significant impact on subjective telepresence
ratings (PQ1). It was hypothesized that the no-delay condition would produce
a greater sense of telepresence as compared to other delay modes and that any
degradation in telepresence under the random mode would be greater than for
the constant mode. It was also expected that adaptation would result in higher
ratings than the no-adaptation mode. The ratings across the network
conditions did not support these hypotheses.
In the telerobotic control mode, users may have had greater attentional
resources to concentrate on the details of the VE due to the off-loading of
some task responsibility to the remote rover, which might have led to increased
telepresence experiences. It might also be possible that increases in
telepresence could have been due to lower impact of lag conditions on
telerobot control since users were not required to control the speed of the
rover.
It was observed from the telerobotic control condition, that on average, ratings
were higher for no-delay condition, constant delay with adaptation and random
delay with adaptation, as compared to constant delay with no-adaptation and
random delay with no-adaptation. Although, not significant, this observation
on the telepresence means supports the research hypothesis that ratings would
improve on account of gain adaptation. A similar observation could not be
made on the teleoperation mode. This may have been due to the user control
of the rover speed under the teleoperation mode in that they could have
developed their own adaptation strategy based on the nature of the task and
personal attitudes (i.e., more conservative or more risky). It was observed
during the experiment that subjects who were more conservative were more
prone to drive the rover at a lower speed resulting in reduced errors in their
50
control actions, as compared to those individuals who were risky in their actions
and committed errors in order to finish the task faster. Related to this
argument, there were considerable individual differences among subjects within
the various control mode groups, as demonstrated by ANOVA results.
Telepresence had a significant positive correlation with the overall workload
index. It is possible that greater task load may have led to increases in
telepresence. Ma (2002) showed a positive correlation between telepresence
and mental workload. It was also found that the telepresence ratings were
significantly correlated with individual components of the NASA-TLX
including mental demand, physical demand, and performance. Telepresence
increased with increases in mental demand, physical demand, and user
perception of performance.
8.3 Workload
The results demonstrated significant effects of LOA and individual differences
on subjective perceptions of workload. The teleoperation mode resulted in
higher workload that the telerobotic mode. This was consistent with the widely
accepted notion that workload is greater for manual control of a system
compared to automation assisted control modes. In this study, teleoperation
referred to the manual/direct control mode and telerobotic referred to the
automated assisted control mode. There was no apparent trend in workload
across the adaptation and no-adaptation conditions.
As mentioned in the preceding sections, Pearson product-moment coefficients
revealed a significant positive relationship between workload and telepresence
ratings. With increases in workload, there were corresponding increases in
telepresence. This result on the relationship between workload and
telepresence is similar to the results obtained by Draper and Blair (1996), in
51
which telepresence rating was significantly correlated with composite workload
scores during completion of a pipe-cutting task using a teleoperator. Although
the two responses were positively correlated, telepresence was higher and
workload was lower under the telerobotic control mode, as the user essentially
acted as a supervisor of the system whereas under the teleoperation mode, the
user was responsible for complete control of the rover.
52
C h a p t e r 9
CONCLUSION The goals of this study were to: (1) evaluate the effects of different types of
communication network delays (constant and random delays) on telerover
control performance and operator telepresence experiences and workload; (2)
evaluate the effects of gain adaptation on telepresence, performance and
workload; and (3) examine the relationship between performance and presence
in an Internet-based teleoperation scenario.
9.1 Limitations of current research: Every research study has limitations that may form the basis for future work in
an area. The limitations of the present study are related to the subject
population, the VR simulation and the specific characteristics of the VE
interface design. The subjects used in the experiment were students who were
familiar with PC-based video games. These subjects cannot be compared to
human operators of telerobotic devices who have received dedicated training on
a system and have applied experiences in real teleoperation scenarios. Such
operators may take the task of driving a remote rover very seriously and may be
more motivated to high performance.
The simulation used in this experiment was not linked to a real telerover nor
was the task implemented in the experiment a real teleoperation task. It is
possible that this affected subject perceptions of realism in driving the telerover
and, consequently, telepresence. It is expected that operator stress levels and
perceptions of workload would be different if the VE interface were used to
control a real rover on which subjects received live-video feedback.
Furthermore, modeling and presentation of a more representative telerover
53
task, such as mine excavation and neutralization (see Riley and Kaber, 2001)
might also serve to promote higher perceived realism and affect subject
behavior. It is important to note, however, that the relevance of VE interfaces
to teleoperators is currently limited to structured and known task environments
because of limitations in near real-time modeling methods, as observed by
Ballantyne, Greenspan and Lipsett (1997).
Finally, in regard to the specifics of VE interface features, it was observed
during the experiment that under the teleoperation control mode subjects
tended to use the exocentric view more extensively than the aerial view, save a
few subjects who solely used the aerial view for task completion. One
disadvantage of focusing on the aerial view was that the orientation of the
telerover continuously changed with respect to the joystick navigation control
and, as a result, subjects lost their sense of direction relative to the joystick
control. For example, when subjects wanted to make the telerover turn right,
they steered it to the left. With the current joystick display design, there was a
lot of eye movement required back and forth between the main window and
joystick display; that is, the user observed the direction of the desired motion
and clicked on the corresponding arrow in the joystick control display. It is
possible that using a real joystick would result in reduced distraction from the
task possibly promoting more telepresence and performance.
Under the telerobotic mode, users selected a destination for the rover using the
aerial window and the main simulation window was considered to be of less
importance to task performance. The aerial view was located in the lower-left
part of the VR interface, which was in peripheral vision but outside foveal
vision of subjects. This may have resulted in eyestrain for some users potentially
impacting overall performance. Providing users with the capability to swap the
aerial view window and exocentric view window under the telerobotic control
54
mode might serve to reduce the visual requirements of the simulation and
possibly improve performance.
9.2 Design Implications Given the results of the current research, a number of design recommendations
can be offered for implementing gain adaptation in teleoperation systems,
including:
1. When the number of performance errors is more important than the
time to complete the task, teleoperated control is more suitable than
telerobotic control. Teleoperated control is applicable to this type of
task goal irrespective of the nature of the network condition (i.e.,
constant, random or no-delay).
2. When the task completion time is more important than the number of
errors, then a telerobotic control mode is more appropriate. This is true
for constant, random and no-delay network conditions.
3. When the task involves higher workload, utilizing the telerobotic
control mode can distribute the overall load between the user and rover.
4. When the task requires high level of attention from user promoting
higher telepresence, a telerobotic mode can be used to best exploit the
user’s state in terms of overall system performance.
9.3 Future research directions This study established the importance of gain adaptation in Internet-based
teleoperation and its impact on performance and system safety. The study also
established the relationship between performance, presence and workload
55
under LOAs and NCs. The study identified gain adaptation as an important
concept for human factors research in promoting performance and maintaining
system safety in mission critical and dangerous situations.
Based on the results of the experiment and the caveats, it would be interesting
to integrate the VR interface with a real teleoperator using the Internet and
study the effects of gain adaptation on system stability and human performance
and presence experiences. In addition, the use of a more complex task,
representative of an actual teleoperation task, might improve the utility to
generalize the research results.
Based on the VE interface design issues discussed above, it would also be
interesting to explore user preferences in exocentric and aerial viewpoint use in
controlling a telerover by allowing subjects to customize the interface before
testing. In addition, the use of a natural control, like a joystick, instead of a
keyboard and mouse might eliminate additional interface-affects on user
performance.
Finally it would be interesting to implement user selectable LOAs, where the
user could switch between teleoperated and telerobotic control modes
whenever he/she deems necessary. This mode of operation would take
advantage of reduced time-to-task completion due to telerobotic control and
reduce task performance errors due to teleoperation control. It would also be
interesting to investigate how much task processing capability (e.g., collision
avoidance) could be integrated into the remote rover in order to reduce the
operator workload and the negative impact of lag on performance. This might
be dependent upon the complexity of the task and the minimal amount of
information required by the user in the control loop in order to take over the
system control at times of emergency.
56
R e f e r e n c e s
Anderson, R. J. & Spong, W. (1989). Bilateral control of teleoperators with time delay. IEEE Transaction on Automatic Control, 34(5), 494-501. Ballantyne, J., Greenspan, M. & Lipsett, M. (1997). Virtual Environment for Remote Operation. In proceedings of ANS 7th Tropical Meeting on Robotics and Remote Systems (pp.545-549). Augusta, GA: American Nuclear Society. Barfield, W. & Weghorst, S. (1993). The sense of presence within virtual environments: A conceptual framework. In G.Salvendy and M.Smith (Eds.), Human-computer interaction: Software and Hardware interfaces (pp.699-704). Amsterdam, Netherlands: Elsevier Science Publisher. Bishop, G. & Fuchs, H. (Eds.) (1992). Research Directions in Virtual Environments, Report of an NSF Invitational Workshop. Chapel Hill, NC: University of North Carolina. Cheong, F. & Lai, R. (1999). QoS specification and mapping for distributed multimedia systems: A survey of issues. The Journal of Systems and Software, 45(2), 127-139. Comer, D. E. (2000). Interconnecting with TCP/IP, Upper Saddle River, NJ: Prentice Hall. Cox. M. J. & Baruch, J. E. F. (1994). Robotic Telescopes: An Interactive Exhibit on the World Wide Web. In the Proceedings of the Second International Conference of the World Wide Web. Chicago, IL: Elsevier Science Publishers. Draper, J. V. & Blair, L. M. (1996). Workload, Flow and Telepresence during Teleoperation, In Proceedings of the IEEE International Conference on Robotics and Automation (Vol.2, pp.1030-1035). Minneapolis, MN: IEEE Robotics and Automation Society. Draper, J. V., Kaber, D. B. & Usher, J. M., (1998). Telepresence. Human Factors, 40(3), 354-375. Draper, J. V., Kaber, D. B. & Usher, J. M., (1999). Speculations on the value of Telepresence. Cyberpsychology and Behavior, 2(4), 349-362. Eberst, C., Stoffler, N. O., Barth, M. & Farber, G. (1999). Compensation of time delays in telepresence applications by photo-realistic scene prediction of
57
partially unknown environments. In Proceedings of International conference on Robotics and Applications - IASTED '99 (pp.163-168). Santa Barbara, CA: International Association of Science and Technology for Development. Eusebi, A. & Melchiorri, C. (1995). Stability analysis of bilateral teleoperation robotic systems. In Proceedings of 3rd European Control Conference (ECC '95). Rome, Italy: European Control Conference. Ferwon, A., Roque, R. & Vecchia, I. (1999). MAX: Wireless teleoperation via the World Wide Web. In Proceedings of IASTED Conference on Robotics and Applications (pp.158-162). Santa Barbara, CA: International Association for Science and Technology Development. Fong, T., Thorpe, C. & Baur, C. (2001). Advanced Interfaces for Vehicle Teleoperation: Collaborative Control, Sensor Fusion Displays, and Web-based Tools. Autonomous Robot, 11(1). Göktas, F. (2000). Distributed control of systems over communication networks. Unpublished doctoral dissertation. University of Pennsylvania, Philadelphia, PA. Goldberg, K., Mascha, M., Gentner, S., Rothenberg, N., Sutter, C. & Wiegley, J. (1995). Desktop Teleoperation via the World Wide Web. In the Proceedings of IEEE International Conference on Robotics and Automation (ICRA) (pp. 654-659). Nagoya, Japan: IEEE Robotics and Automation Society. Goldberg, S., Bekey, G., Akatsuka, Y. & Bressanelli, M. (1998). DIGIMUSE: An interactive telerobotic system for remote viewing of 3D art objects. In Proceedings of SPIE (Vol.3524, pp.196-200). Telemanipulator and Telepresence Technologies, Mathew. V. & Stein. R. (Eds.). Held, R. M. & Durlach, N. I. (1992). Telepresence. Presence: Teleoperators and Virtual Environments, 1 (1). Hendrix, C. & Barfield, W. (1996). Presence within virtual environments as a function of visual display parameters. Presence: Teleoperators and Virtual Environments, 5(3), 274-290. Hine, B., Hontalas, P., Fong, T., Piguet, L., Nygren, E. & Kline, A. (1995). VEVI: A Virtual Environment Teleoperations Interface for Planetary Exploration. SAE 25th International conference on Environmental Systems. San Diego, CA: Society of Automobile Engineers.
58
Hu, H., Yu, L., Tsui, P. W. & Zhou, Q. (2001). Internet-based Robotic Systems for Teleoperation. International Journal of Assembly Automation, 21(2), 143-151. International Telecommunication Union, Telecommunication Standardization, (1994). Terms and Definitions Related to Quality of Service and Network Performance Including Dependability - Telephone Network and ISDN Quality of Service, Network Management and Traffic Engineering (E.800). Geneva, Switzerland: ITU-T. Kennedy, R. S., Lane, N.E., Berbaum, K.S., & Lilienthal, M. G. (1993). Simulator Sickness Questionnaire: An Enhanced Method for Quantifying Simulator Sickness. International Journal of Aviation Psychology, 3(3), 203-220. Kim, W. S., Hannaford, B. & Bejczy, A. K. (1992). Force reflection and shared compliant control in operating telemanipulators with time delay. IEEE Transaction on Robotics and Automation, 8(2), 176-185. Kosuge, K., Kikuchi, J. & Takeo, K. (1998). VISIT: A Teleoperation system via Computer Network. In Proceedings of the International Conference on Intelligent Robots and Systems (pp.61-66). Victoria, Canada: IEEE Robotics and Automation Society. Luck, R. & Ray, A. (1990). An observer-based compensator for distributed delays, Automatica, 26(5), 903-908. Ma, R. (2002). Telepresence and Performance in an Immersive Virtual Environment and Sporting Task. Unpublished Masters Thesis. North Carolina State University, Raleigh, NC. MacKenzie. S. & Ware, C. (1993). Lag as a determinant of Human performance in interactive systems. In Proceedings of the ACM Conference on Human Factors in Computing Systems - INTERCHI '93 (488-493). New York, NY: ACM SIGCHI. McKee, G. T. & Barson, R. (1996). NETROLAB: Providing access to robotics technology using the Internet. Robotics and Machine Perception, Special Issue of SPIE International Technical Working Group Newsletter on Robotics and Machine Perception, 5(1), 6-10. Nash, E. B., Edwards, G. W., Thompson, J. A. & Barfield, W. (2000). A review of Presence and Performance in Virtual Environments. International Journal of Human-Computer Interaction, 12 (1), 1-41.
59
Nehmzow, U., Buhlmeier, A., Durer, H. & Nolte, M. (1996). Remote control of mobile robot via Internet (Technical Report Series, UMCS-96-2-3). Manchester, UK: Department of Computer Science, University of Manchester. Niemeyer, G. & Slotine, J. E. (1991). Stable adaptive teleoperation. IEEE Journal of Oceanic Engineering, 16(1), 152-162. Nilsson, J., Bernhardsson, B. & Wittenmark, B. (1990). Stochastic analysis and control of real-time systems with random time delays. Automatica, 34(1), 57-64. Riley, J. M. & Kaber, D. B. (1999). Telepresence and performance effects of visual display type and navigational aid in virtual reality training of telerover navigation. In Proceedings of ANS 8th Topical Meeting on Robotics and Remote systems (CD-ROM). LaGrange Park, IL: American Nuclear Society. Riley, J. M. & Kaber, D. B. (2001). Utility of situation awareness and attention for describing telepresence experiences in a virtual telepresence task. In B. Das and W. Karwowski (Eds.), In Proceedings of the 2001 International Conference on Computer-Aided Ergonomics and Safety (CD-ROM). Maui, HI: International Ergonomics Association. Sheridan, T. B. (1992). Telerobotics, Automation and Human Supervisory Control. Cambridge, MA: The MIT Press. Simsarian, K. T. (2001). A system of mobile robotic telepresence employing VR as the communication medium: Interface metaphors. Kista, Sweden: Swedish Institute of Computer Science. Slater, M. & Usoh, M. (1993). An experimental exploration of presence in virtual environments. London, UK: Department of Computer Science, QMW University. Song, D. & Kaber, D. B. (2000). Web-based interface design for Teleoperation. In proceedings of the XIVth Triennial Congress of the International Ergonomics Association and the 44th Annual Meeting of the Human Factors and Ergonomics Society (pp. 449-452). Santa Monica, CA: Human Factors and Ergonomics Society. Stanney, K. M., Mourant, R. R. & Kennedy, R. S. (1998). Human factors issues in virtual environments: A review of literature. Presence: Teleoperators and Virtual Environments, 7(4), 327-351. Steuer, J. (1992). Defining Virtual Reality: Dimensions Determining Telepresence. Journal of Communications, 2(4), 73-93.
60
Sutherland, I. E. (1965). The Ultimate Display. Proceedings of the IFIPS Congress 1965, 2, 506-508. Taylor, K. & Trevelyan, J. (1995). A Telerobot on the World Wide Web. National Conference of Australian Robotic Association. Melbourne, Australia: Australian Robot Association. Tipsuwan, Y. & Chow, M. (2001). Network-Based Controller Adaptation Based on QoS Negotiation and Deterioration, In Proceedings of 27th Annual Conference of the IEEE Industrial Electronics Society (IECON '01), pp.1794-1799. Denver, CO: IEEE Industrial Electronics Society. Walsh, G. C., Ye, H. & Bushnell, L. (1999). Stability analysis of networked control systems. In Proceedings of the 1999 American Control Conference (pp.2876-2880). San Diego, CA: American Automatic Control Council. Watson, B., Spaulding, V., Walker, N. & Ribarsky, W. (1997). Evaluation of the effects of frame time variation on VR task performance. VRAIS ’97 IEEE Virtual Reality Annual Symposium, pp.38-44. Albuquerque, NM: IEEE Computer Society. Watson, B., Walker, N., Ribarsky, W. & Spaulding, V. (1998). Effects of variation in system responsiveness on user performance in virtual environments. Human Factors, 40(3), 403-414. Witmer, B. G. & Singer, M. J. (1994). Measuring presence in virtual environments (Tech. Rep. No.1014). Washington D.C.: U.S. Army Research Institute. Yoshizawa, K., Hashimoto, H., Wada, M. & Mori, S. M. (1996). Path tracking control of mobile robots using a quadratic curve. In Proceedings of the 1996 IEEE Intelligent Vehicles Symposium (pp.58-63). Tokyo, Japan: IEEE Industrial Electronics Society.
61
Appendices
62
A p p e n d i x A
MATHEMATICAL MODEL OF THE SYSTEM
The following mathematical model is adapted from Tipsuwan and Chow
(2001).
Figure A.1. Block diagram of Main controller and Local controller
QoS Adaptation Scheme The networked telerover system is shown in figure A-1. The mobile robot
state-space is described as follows
),,( tuxfx RRRR =&
),,( tuxhy RRRR =
where the state vector nTRnRR Xxxx ∈= ],...,[ 1 , the state space; the output
vector nTRnRR Yyyy ∈= ],...,[ 1 , the output space; the input vector
nTRnRR Uuuu ∈= ],...,[ 1 , the input space and +∈Rt is the time parameter.
QoS of the network from the main controller to the telerover and vice versa, at
time t is defined as sTs Qtqtqtq ∈= )](),...,([)( 1 , the network QoS space. We
can define q1(t) as the available bandwidth on the network, q2(t) as end-to-end
63
delay bound etc. These depend on the characteristics of the network protocols,
network topologies, etc.
At every sampling time period t, the telerover packetizes and sends yR across the
network to the main controller. The output measurement after depacketized at
the controller is in the form
))(()( qtyty RCRC τ−= ,
where )(qRCτ is the network-induced delay from the telerover to the main
controller. The main controller computes the control signal
( )CCCCC pygtr ,,)( α= ,
where Cp (t) is the reference path and Cα is the adaptation scheme to be
selected by the main controller to compensate for deteriorative changes in QoS.
When this control signal is sent to the telerover, it receives as
))(()( qtrtr CRCR τ−= ,
where )(qCRτ is the network-induced delay from the main controller to the
telerover.
The local controller uses the received signal to compute the local control signal
during every sampling time as
( )RRRRR rygtu ,,)( α= , where [ ]TRbRR ααα ,....1= is the adjustable local controller parameter vector
which can also be used to compensate for changes in QoS. We assume Rα as a
pre-calculated vector and use Cα for adaptation.
Quadratic path tracking algorithm
Telerover Dynamics The dynamics of the telerover is described as
64
=
L
R
WW
vωω
ρρ
ρρ
ω22
θcosvxI =&
θsinvyI =&
ωθ =&
Figure A.2. Differential-drive telerover
where (xI, yI) is the position in the inertial coordinates, (xM, yM) is the position
in the telerover coordinate, θ is the azimuth angle of the telerover, v is the
linear velocity of the telerover, W is the distance between two wheels, ρ is the
radius of the wheels, ω is the angular velocity of the telerover where Lω and
Rω corresponds to the left and right wheels respectively.
65
The state-space description of the telerover is given as
The following table gives the parameters of rover such as wheel diameter and
wheelbase.
W Distance between two wheels 0.3 m ρ Radius of wheels 0.03 m
Table A.1 Parameters of telerover
Local Controller
The local controller is two simple Proportional-Integral (PI) controllers, one for
each wheel and is defined as
∫+=t
IP deKteKtu0
)()()( ξξ
where Kp is the proportional gain and Ki is the integral gain, r(t) is the reference
speed for the motor to track, y(t) is the system output and e(t)=r(t)-y(t). The
66
output y(t) for the left and right wheels are 3ry and 4ry respectively. Similarly,
the input u(t) for the left and right wheels are 1ru and 2ru respectively. The
control gains used to control both motors are set to be same since they are
assumed to have identical characteristics.
Main Controller
The main controller computes the control signal for the local controller in the
telerover to track a desired path. In teleoperation mode, the controller
computes the speed of the motors based on the input given by the user, which
are then sent to the local controller.
In the case of telerobotic mode, the user specifies a target location and the
controller computes the path-tracking algorithm based on the quadratic curve
approach [40] as implemented by Tipsuwan and Chow [39]. This algorithm
lends itself suitable for real-time application because of its simplicity in
computation with minimal amount of information [39]. The algorithm works
as follows:
(1) Setup an initial distance 0,0)(0 => kkd between current robot
position [ ]TIII yxx θ,,= and the reference point
[ ]Trefrefref yxxtp θ,,)( = . Both positions are in inertial coordinates.
(2) Compute the error Iref xx − and transform the error into telerover
coordinates.
[ ] ( )IrefT
yx xxeeee −
−==
1000cossin0sincos
θθθθ
θ
67
(3) Find a quadratic curve between the robot coordinate and the reference
point.
22 )sgn(,
x
yx e
eeAwhereAxy ==
(4) Compute the reference linear and angular velocities of the telerover
along the quadratic curve.
kkkref
kkref
KA
Kv
2,
,
=
=
ω
ρω
ρω
2,,
,
Wv krefkrefrefR +=
ρω
ρω
2,,
,
Wv krefkrefrefL −=
where k
xK AesignK
+=
1)( α and 2)(
x
yx e
eesignA = .
The result is the control signal TrefRrefLc tr ],[)( ,, ωω= .
(5) Update the distance for the next sampling time.
kA
dkdβ+
=+1
)1( max0
where β is the positive constant indicating how far the
next reference point is projected ahead, dmax is the maximum distance
between reference point and the telerover.
(6) Compute the velocity of the reference point pathv along the desired path
based on the actual velocity of the telerover, which keeps the distance
between the robot, and the reference point.
68
(7) Compute the new reference point on the desired path based on the
current reference point velocity pathv and update refx and repeat the
above seven steps.
Network QoS profiles
q1(t) denotes the point-to-point maximal delay bound of the largest packet and
q2(t) denotes the network throughput bound.
Path tracking performance measures
{ }dtytyxtxT
JT
pathIpathI∫ −+−=0
221 ))(())((min1
∫==T
dtTJ0
2
where ),( pathpath yx is any point on the pre-computed path and T is the elapsed
time. The first relation measures how close the telerover is tracking the desired
path and second relation measure how quick the telerover tracks the path.
69
A p p e n d i x B
PRESENCE QUESTIONNAIRE Indicate your preferred answer by marking an “x” in the appropriate box of each seven-point scale in accordance with the question content and descriptive label. Please consider the entire scale when marking you responses, as intermediate levels may apply. WITH REGARDS TO THE EXPERIENCED ENVIRONMENT 1. “I felt as though I were actually in the remote environment as I performed the task”
VERY RARELY SOMEWHAT VERY FREQUENTLY
2. “The experience involved unity or fusion of self with the remote environment”
VERY RARELY SOMEWHAT VERY FREQUENTLY
DO NOT WRITE BELOW THIS LINE. Subject #: ______ Trial #: ______
70
A p p e n d i x C
SUBJECTIVE COMPARISION OF DEMAND FACTORS: NASA-TLX
Indicate the demand of greater importance by circling its label on each line below.
Mental Demand / Physical Demand
Mental Demand / Temporal Demand
Mental Demand / Performance
Mental Demand / Frustration
Mental Demand / Effort
Physical Demand / Temporal Demand
Physical Demand / Performance
Physical Demand / Frustration
Physical Demand / Effort
Temporal Demand / Performance
Temporal Demand / Frustration
Temporal Demand / Effort
Performance / Frustration
Performance / Effort
Frustration / Effort
DO NOT WRITE BELOW THIS LINE. Subject #: ______
71
SUBJECTIVE RATING OF PERCEIVED WORKLOAD: NASA-TLX
Indicate the level of demand experienced during the navigation task for each of these factors by drawing a straight vertical line on the scale directly below.
Mental Demand
Low High Physical Demand
Low High Temporal Demand
Low High Performance
Low High Frustration
Low High Effort
Low High DO NOT WRITE BELOW THIS LINE. Subject #: ______ Trial #: ______
72
A p p e n d i x D
ANTHROPOMETRICS DATA SURVEY
SUBJECT SURVEY
The intended purpose of this form is to establish a subject profile based on volunteered anthropometrics data. Please complete the sheet to the best of your knowledge following the example formats indicated in the parentheses adjacent to each data field label. Age (XX yr.): _____ Gender (M/F): ______ Handedness (Left/Right): _____ Corrected Visual Acuity: Left Eye (XX/XX): ____ Right Eye (XX/XX): ____ Video Game Experience 1 2 3 4 5 None Occasional Frequent PC Experience 1 2 3 4 5 None Occasional Frequent DO NOT WRITE BELOW THIS LINE. Subject #: ______
73
A p p e n d i x E
SUBJECT INSTRUCTIONS
I. Introduction
Thank you for volunteering to participate in this experiment. The goal of this
study is to examine performance and presence in a virtual environment (VE) as
a control interface to a teleoperation system. The experimental task will require
you to use a head-mounted display, or HMD. You will control the inputs to the
system via a standard mouse and graphical controls as part of visual displays.
The virtual task is a high-fidelity 3-dimensional simulation of telerover
navigation.
You will be asked to navigate the telerover between obstacles in the VE until
you pass/negotiate all of them at least once without collision. The obstacles are
cylindrical objects that may be either blue or red in color. During the
experiment, you will complete an extensive training session and ten test trials.
Overview of Procedures
The procedures we will follow during the experiment will be executed in one
session. You will first experience 3 training trials. A 5-minute break will follow
training. You will then complete 10 test trials with the first 5 trials separated
from the later 5 trials by a 5-minute break.
An overview of the procedures for the session includes:
1. Introduction to the experiment.
2. Collection of anthropometric survey data.
74
3. Familiarization with the equipment.
4. Administration of a sim-sickness questionnaire.
5. Familiarization with different types of control displays as part of system
interface.
6. Completion of 3 training trials
7. Administration of a sim-sickness questionnaire.
8. A 5-minute break.
9. Familiarization with presence questionnaire.
10. Familiarization with NASA-TLX subjective workload survey.
11. Completion of 5 test trials, each of which will be followed by the presence
questionnaire and NASA-TLX subjective workload survey.
12. Administration of sim-sickness questionnaire.
13. A 5-minute break.
14. Completion of the last 5 trials (total 10 trials), each of which will be
followed by the presence questionnaire and NASA-TLX subjective
workload survey.
15. Administration of sim-sickness questionnaire.
Informed Consent
[Give the subject the informed consent form. Summarize the informed consent for the subject
and encourage them to read the form.]
This form summarizes the information that has been presented to you thus far
and identifies the persons responsible for the study. The form also addresses
University liability to the experiment. I encourage you to read the form. You
must sign the form, however, it will not be associated with any of the other
survey forms used in this experiment. In order to participate in this study you
must have 20/20 or corrected vision, and you must not have a seizure disorder
75
or use a pacemaker. You may experience sim-sickness (or "motion-sickness"
like symptoms) from using the HMD, but precautionary measures will be taken
to insure your well-being. Please sign and date this form.
[The reason for not allowing persons with seizure disorder or one using a pacemaker to
participate in these kind of experiments because of the Electromagnetic field which is found to
cause problems to them]
Anthropometric Data Sheet [Present the subject with the Anthropometric sheet.]
This form asks about your personal characteristics and will serve to verify your
qualifications for the study. Please take a few moments to complete the survey.
If you have any questions, I will be happy to address them. This form, like the
informed consent form, will not be associated with any of the other survey
forms used in this experiment.
Payment Sheet [Have subjects complete the payment forms for participation. Be sure to record the start time.]
This is the payment form that will be used to calculate your compensation for
participating in this experiment. Please fill-out the information. Your Social
Security number must be included on this form for tax purposes; however, this
form will not be associated with any of the other survey forms used in the study.
The income you earn from this experiment is taxable and you should report it to
the IRS. You will also have an opportunity to win $30 gift certificate to Udupi
Indian Restaurant, if you are the best performer among all other subjects in terms
of lowest average number of errors and lowest average time to task completion.
However, this gift is not taxable.
[Be certain to sign the form at the close the experiment]
76
II. Familiarization
I will present all instructions to you orally. If you do not understand certain
instructions, you will be able to ask questions before completion of each step in
the procedure. You may also ask questions about the experiment during the
familiarization, training, and rest periods. You will need to follow all
instructions carefully.
Equipment Familiarization
The equipment to be used in this experiment includes, a high-performance
graphics visualization workstation presenting the virtual environment and task.
The system is integrated with a standard keyboard and standard mouse. A
HMD will be used to isolate your vision to the VE and to simulate 3-D viewing
of the VE.
[Check to see if the subject has any questions about the equipment or setup.]
Simulator Sickness Information
It is possible that you may experience simulator sickness when using the
immersive VE displays. Therefore, procedures will be employed to assure your
safety and well-being. Please inform us at any point if you begin to experience
motion sickness-like symptoms.
In order to determine the possible presence of simulator sickness symptoms,
the Simulator Sickness Questionnaire (SSQ) will be administered to you at the
beginning of experimental testing, after the training session, and after trials 5
and 10. If your pre-exposure scores on the SSQ indicate that you are not
currently in good health, you will not be permitted to continue your
participation. If the post-exposure scores indicate that you may be suffering
from sim-sickness, the questionnaire will be administered at 20-minute intervals
77
after a trial for up to 1 hour. If scores do not return to pre-test levels within 1
hour after an experiment, you will be advised not to drive a motor vehicle for
24 hours, and a ride will be provided to you. It will also be recommended that
you seek medical counsel for "motion sickness-like" symptoms. This first sim-
sickness form will be used as a baseline to compare your post-trial scores.
Please fill out this form carefully.
[Present the subject with sim-sickness form and let them fill out. Calculate sim-sickness score
SimSick.xls on the desktop of computer. If scores exceed criteria, dismiss subject.]
[Read if subject scores exceed criteria.]
Thank you for coming today. This concludes your participation in the
experiment. You will be compensated for the time you have spent here.)
[After the training session, and after trials 5 and 10, make subjects fill-out the SSQ form
again. Calculate sim-sickness score using SimSick.xls on the desktop of the computer.]
III. Training
[Before completion of the training, explain the various control displays.]
The VE interface to the telerover consists of – a main simulation window
displaying the telerover, an aerial display of the telerover and operating
environment, a joystick navigation control display and a speedometer display, which
will show the speed of the rover.
The joystick control is used to navigate the telerover in the environment. Place the cursor on
top of the arrow pointing in the direction of the desired navigation. Click the left mouse button
to increase the speed and right mouse button to decrease the speed. Five clicks of the left mouse
button will throttle the telerover to its maximum speed and five clicks of the right mouse
78
button will bring the rover to its minimum speed. Place the cursor on top of the red hexagon
at the center of the display and press the left/right mouse button to stop the telerover.
[Show the subjects how the joystick navigation control works]
The aerial map will show the current position and direction of the telerover in
the environment.
You will use this display to select the destination position for the telerover to reach/navigate.
The destination selection is achieved by moving the cross-wire by clicking and holding down the
left mouse button in the required direction. When the left mouse button is released, the
corresponding position of the cross-wire in the environment is taken as the target position and
rover starts to navigate towards the destination.
The aerial view can be panned by clicking and holding down the right mouse
button over the aerial display in the required direction. Also the aerial view can
be zoomed in or out by clicking and holding the middle mouse button in the
upper half or lower half of the display for zoom in and zoom out respectively.
[Show the subjects how to select the destination, pan and zoom using aerial display]
The speedometer display gives you an idea of how fast the telerover travels in
the environment in mm/sec.
As mentioned, you will now complete 3 training trials. This training is provided
to allow you to learn the control of telerover. Please utilize the time period to
get accustomed with the visual displays. The goal of the task is to successfully
navigate the telerover between all the obstacles in the environment much like a
slalom ski race. At the start of the simulation, the obstacles will be red or blue
79
in color. Navigating the telerover between a red and blue obstacle will make
the blue obstacle turn green in color. A sound cue will also be provided to
notify that an obstacle has been cleared. This indicates that you have
successfully navigated this obstacle. A blue obstacle may or may not change its
color to green even though you navigated between a blue and a red obstacle
because each blue obstacle is paired with only one nearest red obstacle. If you
collide with any obstacle either blue or red, it will change to black in color. A
sound cue will be provided to notify you. You are expected to navigate the
telerover through all the obstacles until no blue colored obstacles remain in the
environment.
[Setup the computer to run the training trial]
[After completion of the training, make the subject fill out sim-sickness form. Calculate sim-
sickness score using SimSick.xls on the desktop of the computer. ]
You will now be provided with a 5-minute break.
Telepresence Questionnaire
Now, I will provide you with a brief explanation of the Telepresence
Questionnaire, which is intended to assess your association with the virtual task
and environment during performance. The telepresence questionnaire will be
completed after each trial. It is intended to capture the degree to which you felt
as part of the telerover navigation task and environment. I will show you the
survey and please read the instructions on the survey so that you will know how
to respond to the questions with a rating following the test trials.
[Show the subject the Telepresence Questionnaire and read the statement at the top of a copy of
the Telepresence Questionnaire.]
80
NASA-TLX Subjective Workload Survey:
In order to assess the task workload that you experience during experimental
testing, you will complete a subjective comparison of various mental and
physical demand factors [show NASA-TLX demand comparison form] that you will
also rate during task performance. Both your comparisons and ratings of these
factors will be used to compute a composite score of workload for the telerover
navigation task.
At the end of each test trial, you will be required to complete subjective ratings
of perceived workload. You will rate task workload using this form. [Show hard
copy of NASA-TLX]
You will complete the NASA-TLX form by drawing a straight vertical line on
the scale directly below each of the factors indicating the level of demand
experienced during the telerover navigation task.
A sheet of descriptions of each of the factors to be rated will be provided. [Give
subject NASA-TLX factor description sheet.] Please make reference to this sheet
when rating the various demands.
Please fill out the demand comparison form by referring to the description
sheet.
[Ask the subject to complete the comparison of demand factors referring to the factor
description sheet based on the task experienced during the training session]
Do you have any questions?
81
IV. Experimental Testing
Now we will begin the test trials. The goal of the task remains the same as in
training trials, but your task completion time and number of collisions will be
recorded. All the obstacles will be placed at random during the start of each
test trial.
Now, you will complete 10 test trials in the navigation task that you have
trained on.
[Check to see if the subject has any questions.]
Due to the nature of the experiment, keeping your attention focused on
completing the task is important. I ask that you refrain from talking during the
testing periods. If you have any difficulties, however, please do not hesitate to
bring them to my attention and I will assist you.
You will now begin your first test trial.
[Help the subject to put on the HMD.]
[Open and start the simulation for the 10 testing trials. Run the subject through test
conditions in random order, according to the condition form for the trial.]
[Have subject complete presence questionnaire after each test trial.]
[Also have subject complete SSQ (after trials 5 & 10). Calculate sim-sickness score using
SimSick.xls on the desktop of the computer.]
[Allow subject a 5-minute break between the trials 5 and 6.]
82
1. Calculate sim-sickness score after subject has completed the SSQ form (after trial 5
and trial 10).
2. If sim-sickness score <= pretest score, skip step 3.
3. If sim-sickness score is higher than pre-test score, have subject wait for 20 minutes.
a. After 20 minutes, give sim-sickness test again.
b. (This sequence may be repeated for an hour. If scores are not back to
normal after an hour, dismiss subject.)
[Read if subject sim-sickness scores do not return to pretest levels.]
Thank you for coming today! This concludes your participation in the
experiment. You will be compensated for the time you have spent here.
[Give subject instructions for obtaining payment. Calculate their total payment and instruct
them to go to Riddick to collect their money.]
[Set up next trial.]
[After the completion of 10 trials, ask the subject to fill out Simulator sickness questionnaire
and presence questionnaire. Check to see if the subject’s SSQ score is within permissible
limits. If so, then direct the subject on obtaining payment. Else follow the sim-sickness
recovery procedure]
83
A p p e n d i x F
INFORMED CONSENT FORM
I hereby give my consent for voluntary participation in the research project titled, “The effects of gain adaptation on QoS deterioration on Internet-based teleoperation using virtual reality interface”. I understand that the person responsible for this project is Dr. David B. Kaber, who can be telephoned at (919) 515-3086. He or one of his authorized assistants, Mohamed Sheik Nainar, has explained to me the objective of the study is to investigate the effects of QoS adaptation on user performance and presence in a Internet-based teleoperation scenario using a VR interface. Dr. Kaber, or one of his authorized assistant, Mohamed Sheik Nainar, have agreed to answer any inquiries I may have concerning the procedures of the research and have informed me of my right to refuse to answer any specific questions asked of me. He or his authorized assistant has also informed me that I may contact the North Carolina State University (NCSU), Institutional Review Board for the Protection of Human Subjects by writing them in care of Dr. Matt Zingraff, Chair of IRB, Research Administration, NCSU, 1 Leazar Hall, Box 7514, Raleigh, NC 27695, or by calling (919) 515-2444. Information concerning compensation for my participation in this study has been explained to me as follows: (1) I will receive $7.50 per hour for each hour of my participation in the experiment. (2) I also have the opportunity to win a $30 gift certificate, if I achieve the overall best performance of all subjects in the experiment. (3) In the event that I choose to terminate my participation in the experiment, I will be paid for only the time I have provided. (4) The researchers for the study have the right to terminate my participation if I am not cooperative or I experience discomfort or fatigue. Dr. Kaber or one of his authorized assistants has explained to me the procedures to be followed in this study and the potential risks and discomforts. In summary the procedures include: (1) an equipment familiarization period; (2) a sim-sickness questionnaire; (3) an extensive training session to learn and practice the control displays and features of the VR navigation task; (4) 10 test trials with the VR interface using a head-mounted display (HMD); (6) and a debriefing on the study. All training and testing will be conducted during a single experimental session that will require approximately 3 hour of my time. The risks have also been explained to me, as a potential exists for visual strain and/or fatigue in viewing the virtual environment displays through immersive
84
displays including the HMD and desktop VR display. These risks are not substantially different from those associated with my everyday PC use. In the event that I experience fatigue or discomfort, I will inform the experimenters immediately. In addition, I will be tested for motion sickness symptoms before and after the experiment. I understand that if the symptoms have not dissipated after 1 hour, I will be advised not to drive a car for 24 hours and a ride will be provided. I understand that if this research project results in any physical or mental harm to me, treatment is not necessarily available at the NCSU, Student Health Services, nor is there necessarily any insurance carried by the University or its personnel applicable to cover any such injury. Financial compensation for any such injury must be provided through my own insurance program. Further information about these matters may be obtained from the Institutional Review Board at (919) 515-2444, 1 Leazar Hall, NCSU Campus. I understand that I will not derive any therapeutic treatment from my participation in this study. I understand that I may discontinue my participation in this study at any time without prejudice. I understand that all data will be kept confidential and that my name will not be used in any reports, written or unwritten. I have received a copy of this consent form for my personal records. Signature of Subject: Date: ______ ______ Signature of Authorized Representative: _______
85
A p p e n d i x G
SIMULATOR SICKNESS QUESTIONNAIRE
Instruction: Circle the items that apply to you RIGHT NOW.
SYMPTOM RATING
General Discomfort None Slight Moderate Severe
Fatigue None Slight Moderate Severe
Headache None Slight Moderate Severe
Eye Strain None Slight Moderate Severe
Difficulty Focusing None Slight Moderate Severe
Increased Salivation None Slight Moderate Severe
Sweating None Slight Moderate Severe
Nausea None Slight Moderate Severe
Difficulty Concentrating None Slight Moderate Severe
“Fullness of the Head” None Slight Moderate Severe
Blurred Vision None Slight Moderate Severe
Dizzy (eyes open) None Slight Moderate Severe
Dizzy (eyes closed) None Slight Moderate Severe
Vertigo None Slight Moderate Severe
Stomach Awareness* None Slight Moderate Severe
Burping None Slight Moderate Severe
Other. Please describe.
* “Stomach Awareness” is usually used to indicate a feeling of discomfort, which is just short of nausea DO NOT WRITE BELOW THIS LINE. Subject #: ______ Base/Training/Trial 5/Trial 10