Page 1
ABSTRACT
Title of Document: Nutrition, Sensory, Quality and Safety Evaluation
of A New Specialty Produce: Microgreens
Zhenlei Xiao, Doctor of Philosophy, 2013
Directed By: Assistant Professor Qin Wang
Department of Nutrition and Food Science
Microgreens are new emerging food products, which are young seedlings of
vegetables and herbs, having two fully developed cotyledons with the first pair of true
leaves emerging or partially expanded. They have gained popularity in upscale
restaurants and grocery stores in recent years. However, little relevant scientific data
is currently available on microgreens. The present research project was dedicated to
explore the nutritional value, sensory attributes, consumer acceptance, postharvest
quality and microbiological safety of microgreens.
In the first part of this project, phytonutrients were determined in 25
commercially available microgreens. Results showed that different microgreens
provided extremely varying amounts of phytonutrients. Among the 25 microgreens
assayed, red cabbage (Brassica oleracea L.), cilantro (Coriandrum sativum L.),
garnet amaranth (Amaranthus hypochondriacus L.) and green daikon radish
(Raphanus sativus L.) had the highest concentrations of ascorbic acids, carotenoids,
phylloquinone, and tocopherols, respectively. Compared with the nutrient
concentrations in mature leaves recorded in USDA National Nutrient Database,
microgreens possessed higher nutrient density.
Page 2
Although microgrees are nutrient-dense, there is little information and data on the
consumer acceptability of microgreens; therefore, consumer acceptance test were
carried out. Six microgreens were first selected out of 25 varieties of microgreens in
the preliminary test and subsequently evaluated by 80 consumer panelists for sensory
attributes. Chemical compositions and nutritional values of the taste-panel tested
microgreens were also investigated for correlations with sensory attributes. All
microgreens evaluated demonstrated “good” to “excellent” consumer acceptance and
nutritional profile and overall acceptability of microgreens was significantly
correlated with flavor acceptability.
Generally, microgreens are very tender, and thus have a short shelf life. To
optimize the postharvest handling conditions, the effects of temperature, modified
atmosphere packaging (MAP) and chlorine wash on postharvest quality and shelf life
of daikon radish microgreens (Raphanus sativus L. var. longipinnatus) were studied.
The impacts of light exposure during storage on sensorial quality and bioactive
compounds were also investigated. Results showed that 1) one degree Celsius was the
optimal temperature for radish microgreens storage; 2) MAP did not significantly
affect quality attributes during 28 days of storage at 1°C; 3) chlorine wash treatment
reduced microbial populations initially, however, it rebounded to pre-washed levels
within 7 days; and 4) light exposure accelerated quality deterioration and increased
the amount of ascorbic acid, while dark storage may be profound for quality and
carotenoid retention.
The final part of this project was a comparative microbiological study between
radish sprouts and radish microgreens produced from artificially contaminated radish
Page 3
seeds. Starting from seeds with same contamination levels, E. coli O157: H7 and E.
coli O104: H4 populations on harvested radish microgreens were 3-5 logs lower than
that on radish sprouts. These results demonstrated that the microbial growth on
sprouts were much faster than that on microgreens, which poses great risk of
microbiological hazard to sprout-consumers. In contrast, microgreens seem to bear a
relatively low food safety risk.
Page 4
NUTRITION, SENSORY, QUALITY AND SAFETY EVALUATION OF A NEW
SPECIALTY PRODUCE: MICROGREENS
By
ZHENLEI XIAO
Dissertation submitted to the Faculty of the Graduate School of the
University of Maryland, College Park, in partial fulfillment
of the requirements for the degree of
Doctor of Philosophy
2013
Advisory Committee:
Professor Qin Wang, Chair
Professor Liangli (Lucy) Yu
Professor Yang Tao
Research Food Technologist, Yaguang (Sunny) Luo
Research Plant Physiologist, Gene E. Lester
Page 5
© Copyright by
Zhenlei Xiao
2013
Page 6
ii
Acknowledgements
First and foremost, I would like to thank my major advisor Dr. Qin Wang. I owe
her a great debt of gratitude. I appreciate her kindness for accepting me as her Ph.D.
student. She has been motivating, encouraging, and enlightening me during my Ph.D.
study. All the contributions of her knowledge, patience and help made my Ph.D. study
brilliant and productive. She is not only a great mentor, but also a kind friend. She
never pushed me when I was in a struggling situation. Her warm heart, kind care,
generous help and endless support accompanied me all the time, especially when I
was in need of direction. As a Ph.D. student, I feel extremely lucky to have her as my
advisor.
I also sincerely appreciate my two advisors with USDA: Dr. Yaguang (Sunny)
Luo and Dr. Gene E. Lester. Both of them are very important in my Ph.D. study.
Without Dr. Luo‟s initiation of collaboration, I could not have the chance to do my
research in USDA. Her creative ideas always inspired me and sparked my research;
her enthusiasm stimulated me to work proactively; her willingness and
encouragement gave me much support and confidence to achieve more. Dr. Gene E.
Lester is also a great mentor. Without his initiative on the microgreens project, I
could not have had a wonderful Ph.D. study. His rigorous training, profound
knowledge, genuine caring and faith in me during the whole process lighted my way and
enabled me to become more and more professional and fruitful.
I would like to express my appreciation to the remaining members of my
dissertation committee, Dr. Liangli (Lucy) Yu and Dr. Yang Tao. Their academic
Page 7
iii
support and guidance through the whole Ph.D. study are very valuable to help me
develop the research proposal and achieve the research goal.
I am also very grateful to Dr. Xiangwu Nou, who advised me during the last part
of my Ph.D. study. His knowledge and guidance on microbiology leads me to learn
the world of microorganisms. His patience and guidance has been very helpful in
finishing my Ph.D. study. I also want to thank Dr. Pei Chen and Dr. Tianbao Yang for
their help and advice during my study.
I also would like to thank my labmates and colleagues in UMD and USDA: Dr.
Boce Zhang, Zi Teng, Yunpeng Wu, Jing Hu, Haiqiu (Jason) Huang, Dr. Zhuohong
(Kenny) Xie, Dr. Bin Zhou, Dr. Liping Kou, Dr. David T. Ingram, Ellen Turner,
Eunhee Park, Norman Livsey, Ernest W. Paroczay, Steven Rausch, Vivian Nguyen
and many others around me. During the past years, I have received so many kinds of
help, support and care from them. They also bring me great joy and friendship.
Without them, my Ph.D. journey could not be successful and joyful.
My deepest gratitude goes to my family. Their unselfish love, endless support and
unconditional encouragement give me infinite courage to face all the difficulties in
my life. I appreciate all they have given me and what they have done for me. Special
thanks go to my husband, Dr. Yangchao (Albert) Luo. I could not find the words that
express how I feel and what his love and company has meant for me.
I gratefully acknowledge the funding sources. I was funded by Dr. Qin Wang, the
department of Nutrition and Food Science, the U.S. Department of Agriculture,
Agricultural Research Service and Graduate School via Ann G. Wiley Dissertation
Fellowship. My academic goals could not be fulfilled with their funding support.
Page 8
iv
Table of Contents
Acknowledgements ....................................................................................................... ii
Table of Contents ......................................................................................................... iv
List of Tables .............................................................................................................. vii
List of Figures ............................................................................................................ viii
Chapter 1: Literature Review ........................................................................................ 1
1.1 Introduction of Microgreens ............................................................................... 1
1.2 Health Benefits of Fruits and Vegetables ........................................................... 1
1.3 Phytonutrients in Fruits and Vegetables ............................................................. 2
1.3.1 Ascorbic Acid .............................................................................................. 2
1.3.2 Carotenoids .................................................................................................. 3
1.3.3 Tocopherols.................................................................................................. 4
1.3.4 Polyphenols .................................................................................................. 5
1.3.5 Phytoestrogens ............................................................................................. 6
1.3.6 Sulphur-containing Compounds .................................................................. 6
1.4 Sensory Evaluation and Consumer Acceptance ................................................. 7
1.5 Postharvest Storage and Quality Control ............................................................ 8
1.5.1 Low Temperature Storage ............................................................................ 8
1.5.2 Modified Atmosphere Packaging ................................................................ 9
1.5.3 Edible Coating ........................................................................................... 10
1.6 Microbial Risks and Safety Ensurance ............................................................. 10
1.6.1 Foodborne Outbreaks Asscociated with Produce ...................................... 10
1.6.2 Sanitation Methods on Fresh Produce ....................................................... 11
Chapter 2: Assessment of Vitamin and Carotenoid Concentrations of Emerging Food
Products: Edible Microgreens ..................................................................................... 16
2.1 Abstract ............................................................................................................. 16
2.2 Introduction ....................................................................................................... 17
2.3 Materials and Methods ...................................................................................... 18
2.3.1 Plant Materials ........................................................................................... 18
2.3.2 Dry Weight................................................................................................. 19
2.3.3 Nutrient Analysis ....................................................................................... 19
2.3.4 Statistical Analysis ..................................................................................... 25
2.4 Results and Discussion ..................................................................................... 25
2.4.1 Dry Weight Percentage .............................................................................. 25
2.4.2 Phylloquinone Concentrations ................................................................... 25
2.4.3 Ascorbic Acid Concentrations ................................................................... 28
2.4.4 Carotenoid Concentrations ........................................................................ 30
2.4.5 Tocopherol Concentrations ........................................................................ 34
2.5 Conclusions ....................................................................................................... 36
Chapter 3: Evaluation and Correlation of Sensory, Chemical and Nutritional Quality
Characteristics of Microgreens ................................................................................... 38
3.1 Abstract ............................................................................................................. 38
3.3 Materials and Methods ...................................................................................... 40
Page 9
v
3.3.1 Sample Materials ....................................................................................... 40
3.3.2 Sensory Evaluation .................................................................................... 41
3.3.3 Chemical Analysis ..................................................................................... 43
3.3.4 Phytonutrient Analysis ............................................................................... 45
3.3.5 Statistical Analysis ..................................................................................... 47
3.4 Results and Discussion ..................................................................................... 48
3.4.1 Descriptive Analysis and Preliminary Test ................................................ 48
3.4.2 Consumer Acceptance Test ........................................................................ 50
3.4.3 Relationships between Sensory Attributes................................................. 55
3.4.4 Chemical Composition ............................................................................... 56
3.4.5 Phytochemcial Concentrations ................................................................... 59
3.4.6 Relationships between Sensory and Chemical Attributes ......................... 61
3.5 Conclusions ....................................................................................................... 64
Chapter 4: Postharvest Quality and Shelf Life of Radish Microgreens as Impacted by
Storage Temperature, Packaging Film, and Chlorine Wash Treatment ..................... 65
4.1 Abstract ............................................................................................................. 65
4.2 Introduction ....................................................................................................... 66
4.3 Materials and Methods ...................................................................................... 68
4.3.1 Sample Preparation .................................................................................... 68
4.3.2 Headspace Gas Composition ..................................................................... 70
4.3.3 Quality Index ............................................................................................. 70
4.3.4. Statistical Analysis .................................................................................... 73
4.4 Results and Discussion ..................................................................................... 73
4.4.1 Effect of Temperatures on Quality and Shelf Life ..................................... 73
4.4.2 Effect of Modified Atmosphere Packaging on Quality and Shelf Life ..... 77
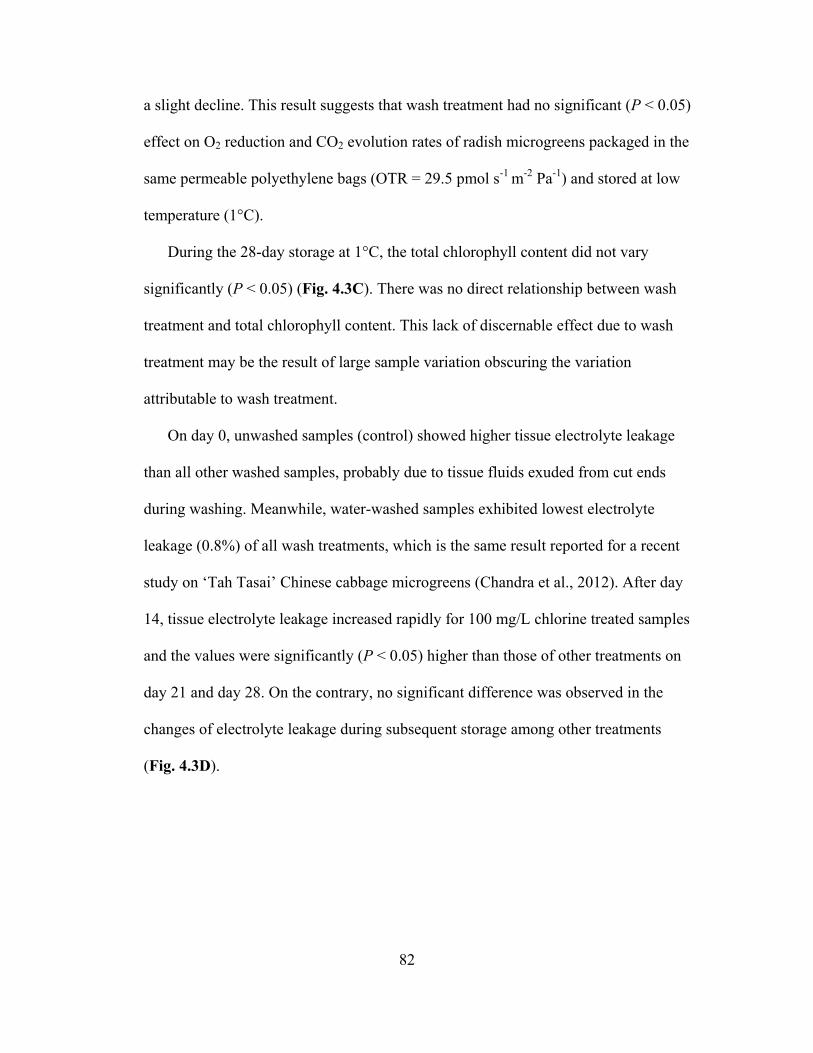
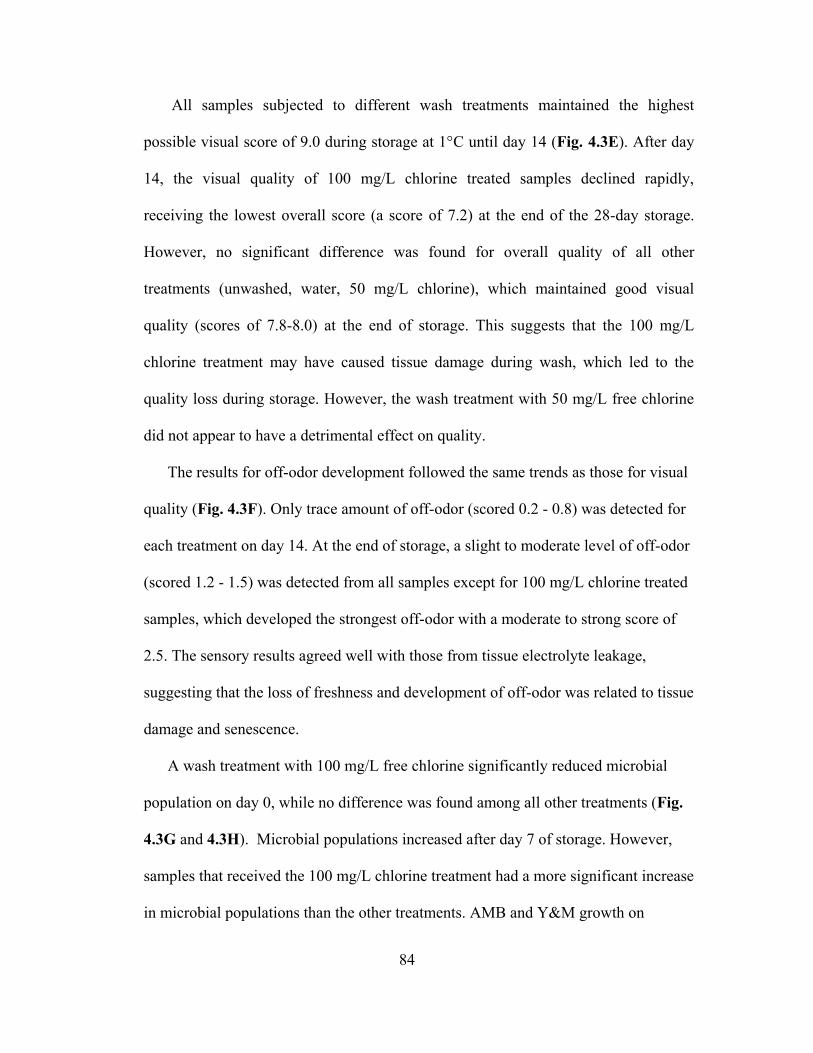
4.4.3 Effect of Wash Treatment on Quality and Shelf Life ................................ 81
4.5 Conclusions ....................................................................................................... 85
Chapter 5: Effect of Light Exposure on Sensorial Quality, Concentrations of
Bioactive Compounds and Antioxidant Capacity of Radish Microgreens during Low
Temperature Storage ................................................................................................... 87
5.1 Abstract ............................................................................................................. 87
5.2 Introduction ....................................................................................................... 88
5.3 Materials and Methods ...................................................................................... 89
5.3.1 Sample Preparation .................................................................................... 89
5.3.2 Headspace Gas Composition ..................................................................... 90
5.3.3 Quality Attributes....................................................................................... 90
5.3.4 Analysis of Bioactive Compounds ............................................................ 92
5.3.5 Determination of Antioxidant Capacity ..................................................... 92
5.3.6 Statistical Analysis ..................................................................................... 93
5.4 Results and Discussions .................................................................................... 94
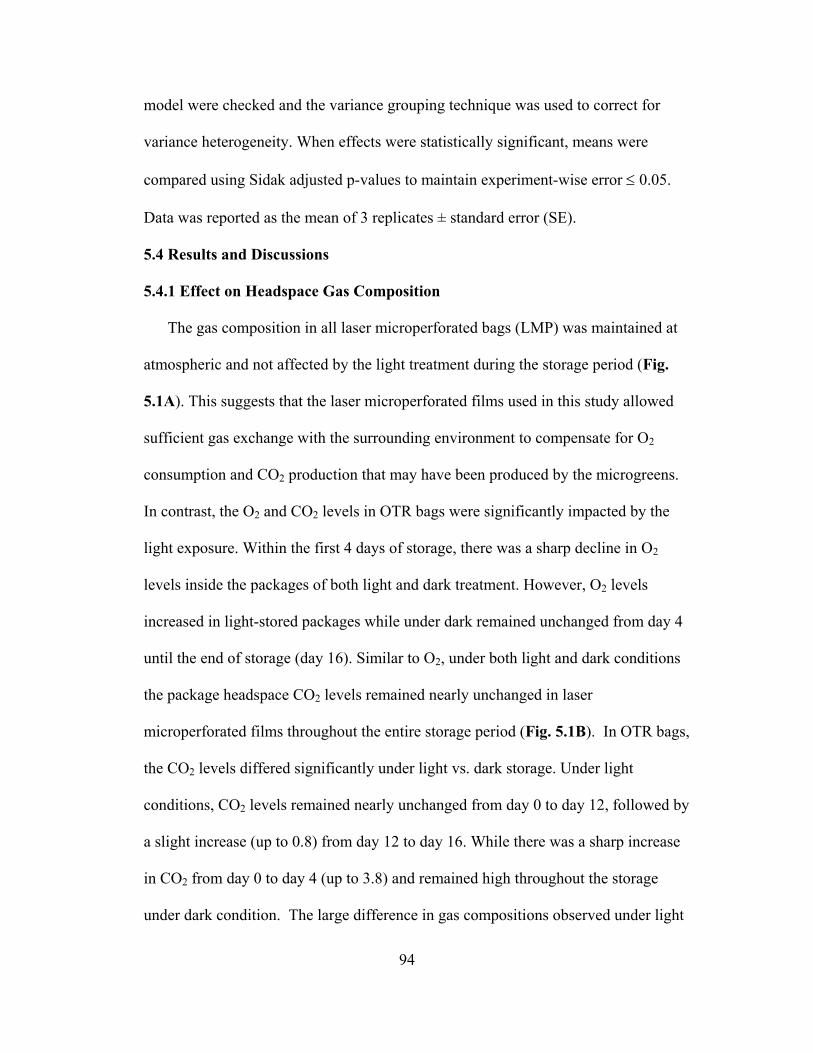
5.4.1 Effect on Headspace Gas Composition...................................................... 94
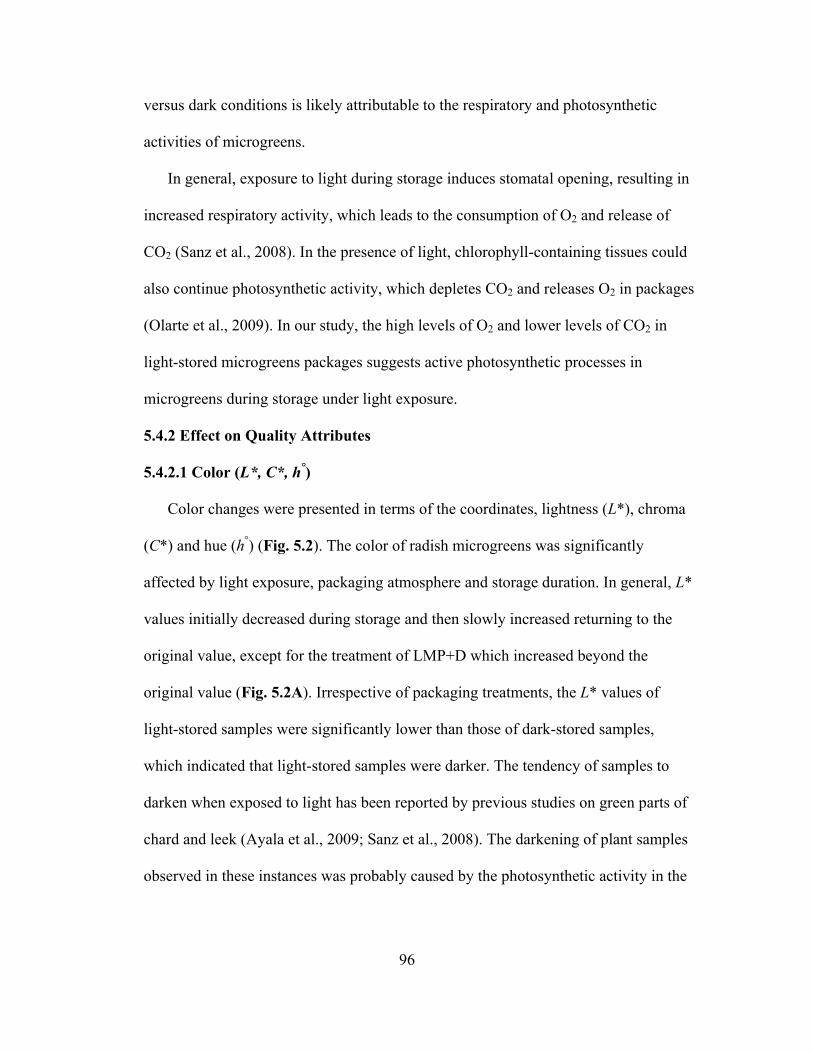
5.4.2 Effect on Quality Attributes ....................................................................... 96
5.4.3 Effect on Bioactive Compounds .............................................................. 102
5.4.4 Effect on Antioxidant Properties ............................................................. 106
5.5 Conclusions ..................................................................................................... 109
Page 10
vi
Chapter 6: Comparison of the Growth of Escherichia coli O157: H7 and O104: H4
during Sprouting and Microgreen Production from Contaminated Radish Seeds .... 110
6.1 Abstract ........................................................................................................... 110
6.2 Introduction ..................................................................................................... 110
6.3 Materials and Methods .................................................................................... 112
6.3.1 Bacterial strains and inoculum preparation .............................................. 112
6.3.2 Seeds and inoculation .............................................................................. 113
6.3.3 Sprouting .................................................................................................. 114
6.3.4 Microgreen growth................................................................................... 114
6.3.5 Enumeration of E. coli ............................................................................. 115
6.3.6 Microbiological profile of growth media and seeds ................................ 116
6.3.7 Statistical analysis .................................................................................... 117
6.4 Results and Discussion ................................................................................... 117
6.4.1 Microbiological profile of growth medium and seeds ............................. 117
6.4.2 E. coli O157: H7 growth on radish sprouts and microgreens .................. 119
6.4.3 E. coli O104: H4 growth on radish sprouts and microgreens .................. 121
6.5 Conclusions ..................................................................................................... 123
Chapter 7: Conclusions and Future Work ................................................................. 124
7.1 Conclusions ..................................................................................................... 124
7.2 Future Work .................................................................................................... 125
7.2.1 Chemical, Enzymatic and Molecular Analysis of Microgreens. ............. 125
7.2.2 Ready-to-eat Microgreens Versus Living Microgreens ........................... 125
7.2.3 Microbiological Safety Study of Microgreens ......................................... 126
References ................................................................................................................. 127
Page 11
vii
List of Tables
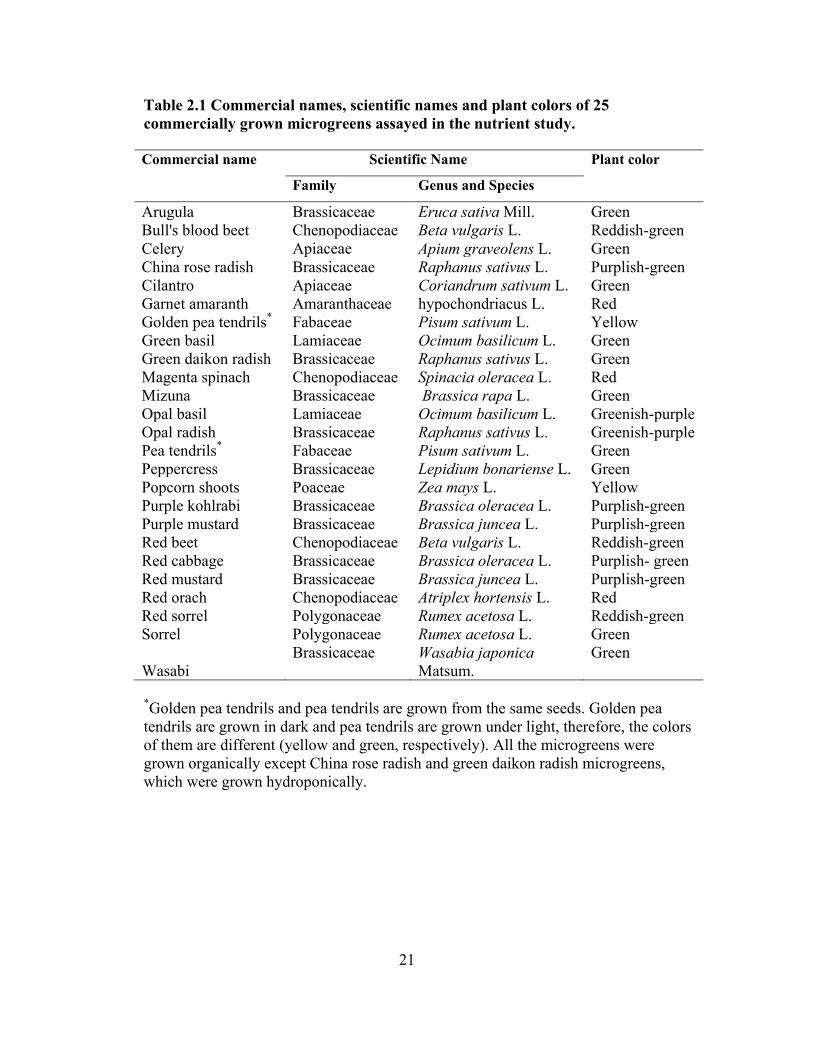
Table 2.1 Commercial names, scientific names and plant colors of 25 commercially
grown microgreens assayed in the nutrient study.
Table 2.2 Dry weight percentage and phylloquinone concentrations in 25
commercially grown microgreens.
Table 2.3 Total ascorbic acid (TAA), ascorbic acid (AA), and dehydroascorbic acid
(DHA) concentrations in 25 commercially grown microgreens.
Table 2.4 β-Carotene, violaxanthin and lutein/zeaxanthin concentrations in 25
commercially grown microgreens.
Table 2.5 α-Tocopherol and γ-tocopherol concentrations in 25 commercially grown
microgreens.
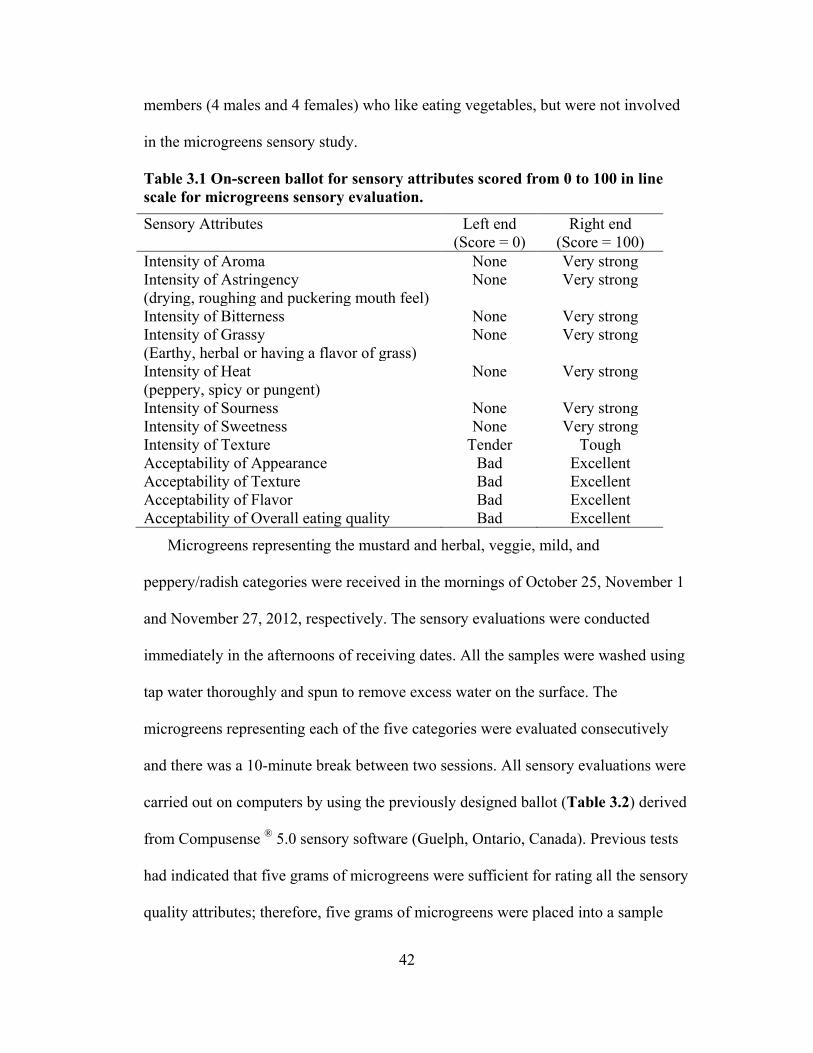
Table 3.1 On-screen ballot for sensory attributes scored from 0 to 100 in line scale for
microgreens sensory evaluation.
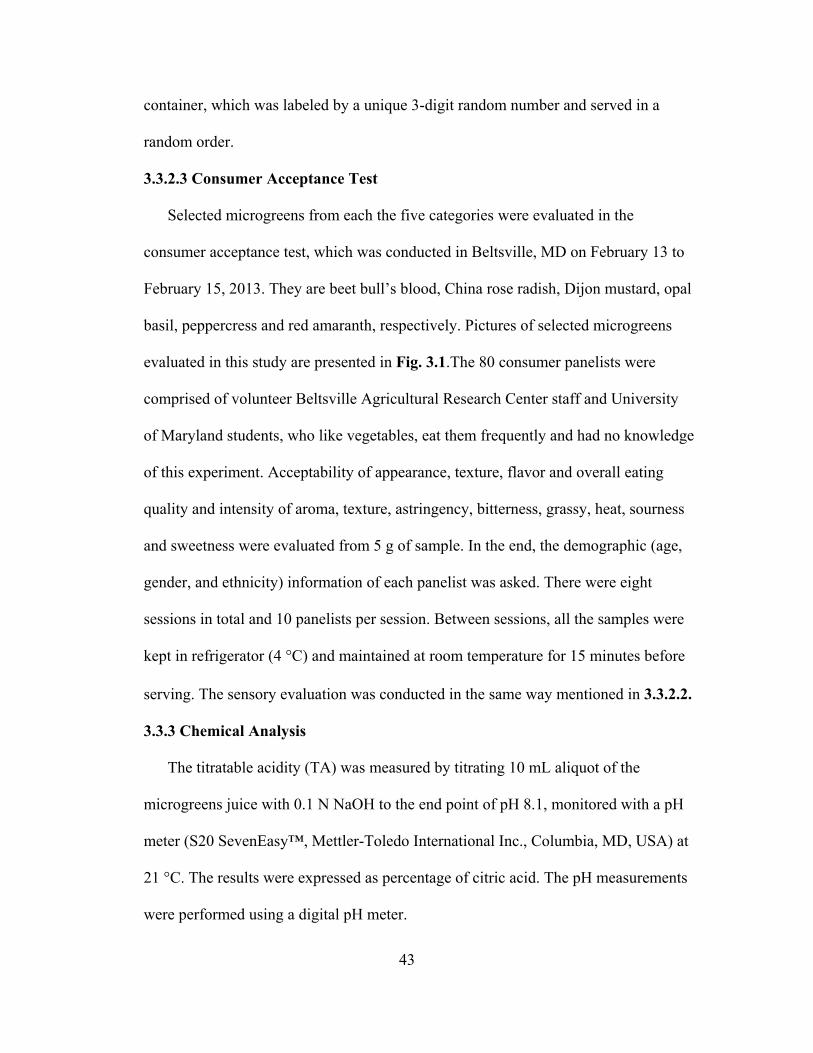
Table 3.2 Commercial names and scientific names of 25 commercially available
microgreens in five groups evaluated in the in-house preliminary sensory test.
Table 3.3 Age, gender and ethnicity make-up of consumer panel.
Table 3.4 Intensity and acceptability of microgreen sensory attributes by consumer
panel across age, gender and ethnicity.
Table 3.5 Intensity and acceptability of microgreen sensory attributes by female and
male consumer panelists across age and ethnicity.
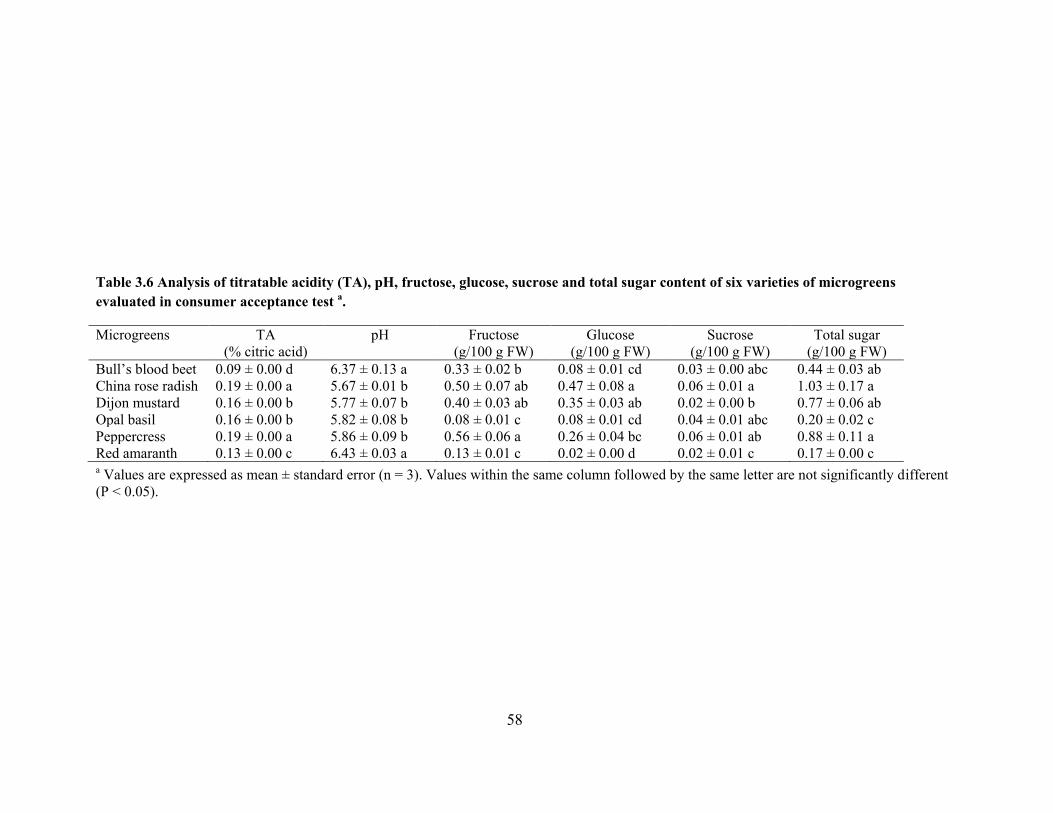
Table 3.6 Analysis of titratable acidity (TA), pH, fructose, glucose, sucrose and total
sugar content of six varieties of microgreens evaluated in consumer acceptance test.
Table 3.7 Analysis of water content, ascorbic acid (AA), dehydroascorbic acid
(DHA), total ascorbic acid (TAA), phylloquinone (Vk1) and total phenolics (TPC)
concentrations of six varieties of microgreens evaluated in consumer acceptance test.
Table 3.8 Analysis of β-carotene, lutein/zeaxanthin, violaxanthin, α-tocopherol, γ-
tocopherol concentrations of six varieties of microgreens evaluated in consumer
acceptance test.
Page 12
viii
List of Figures
Fig. 2.1 Pictures of 25 commercially available microgreens.
Fig. 2.2 HPLC chromatograms of Vitamin K standards and extraction of garnet
amaranth microgreens.
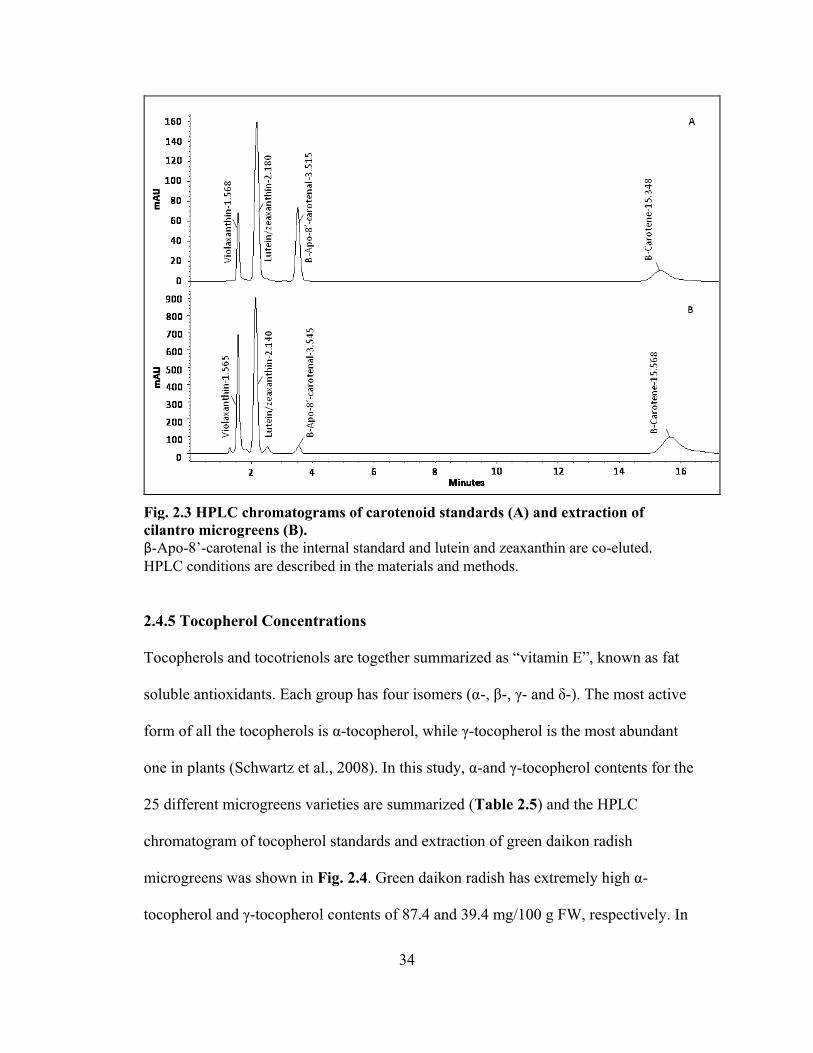
Fig 2.3 HPLC chromatograms of carotenoid standards and extraction of cilantro
microgreens.
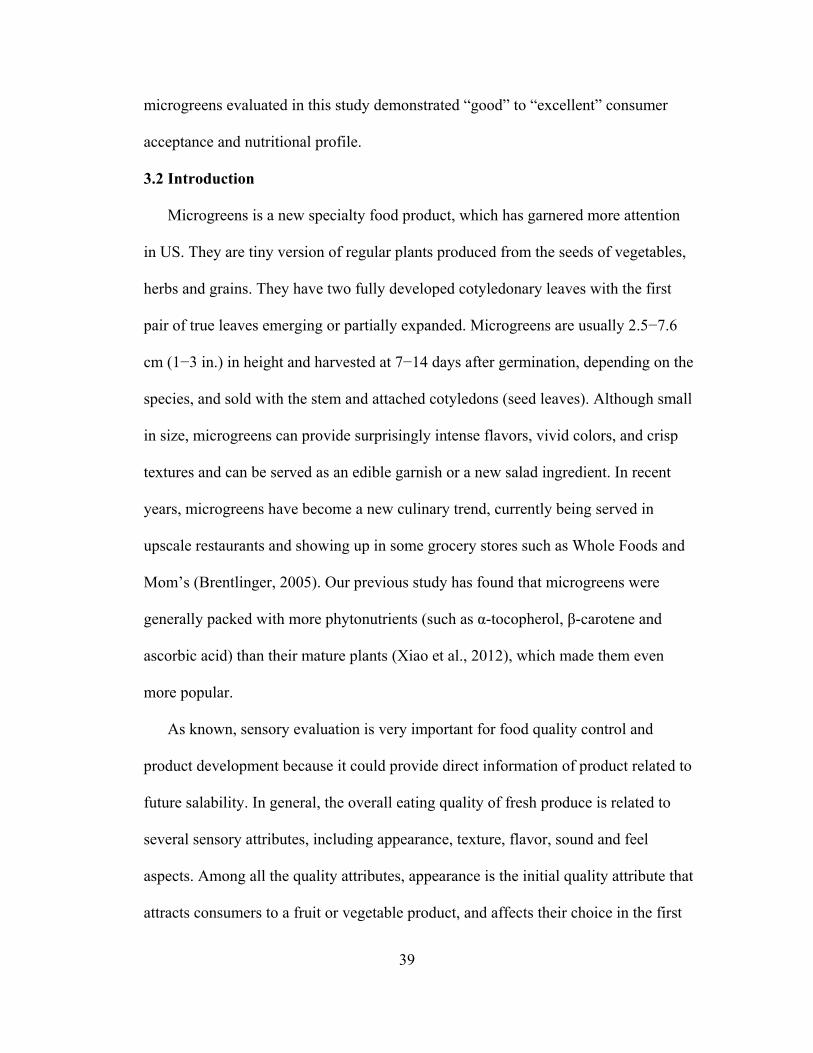
Fig. 2.4 HPLC chromatograms of tocopherol standards and extraction of radish
microgreens.
Fig. 3.1 Pictures of six varieties of microgreens evaluated in consumer acceptance
test.
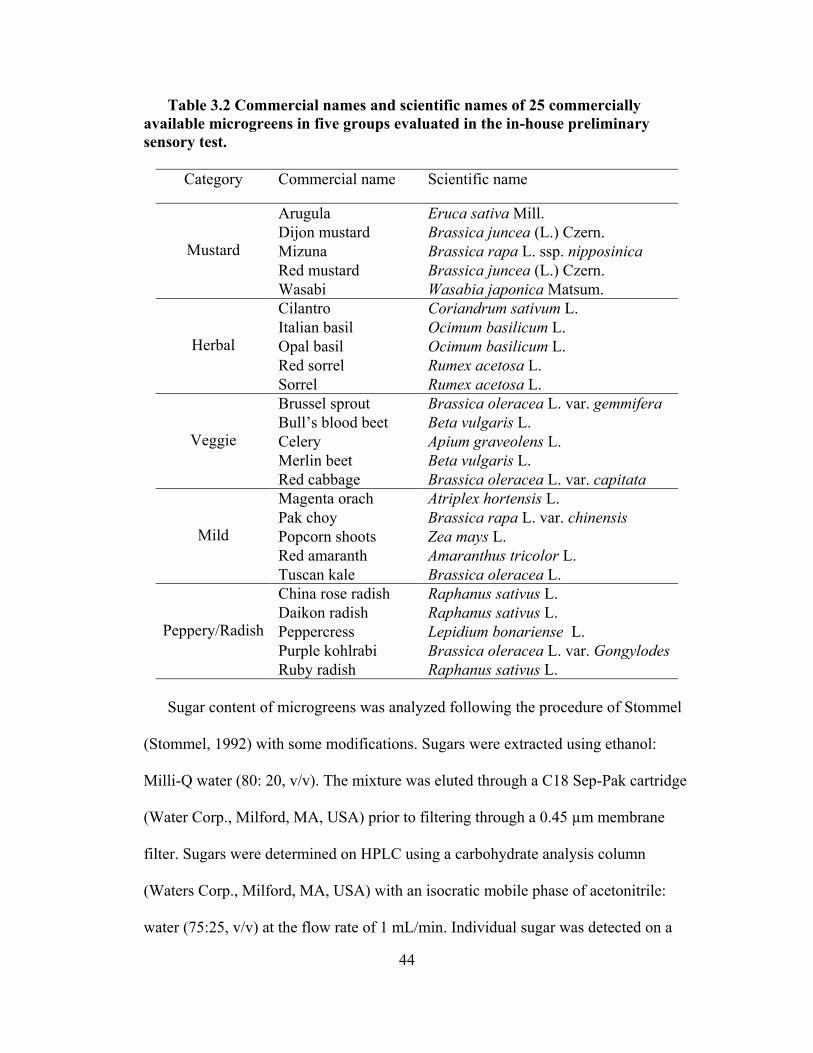
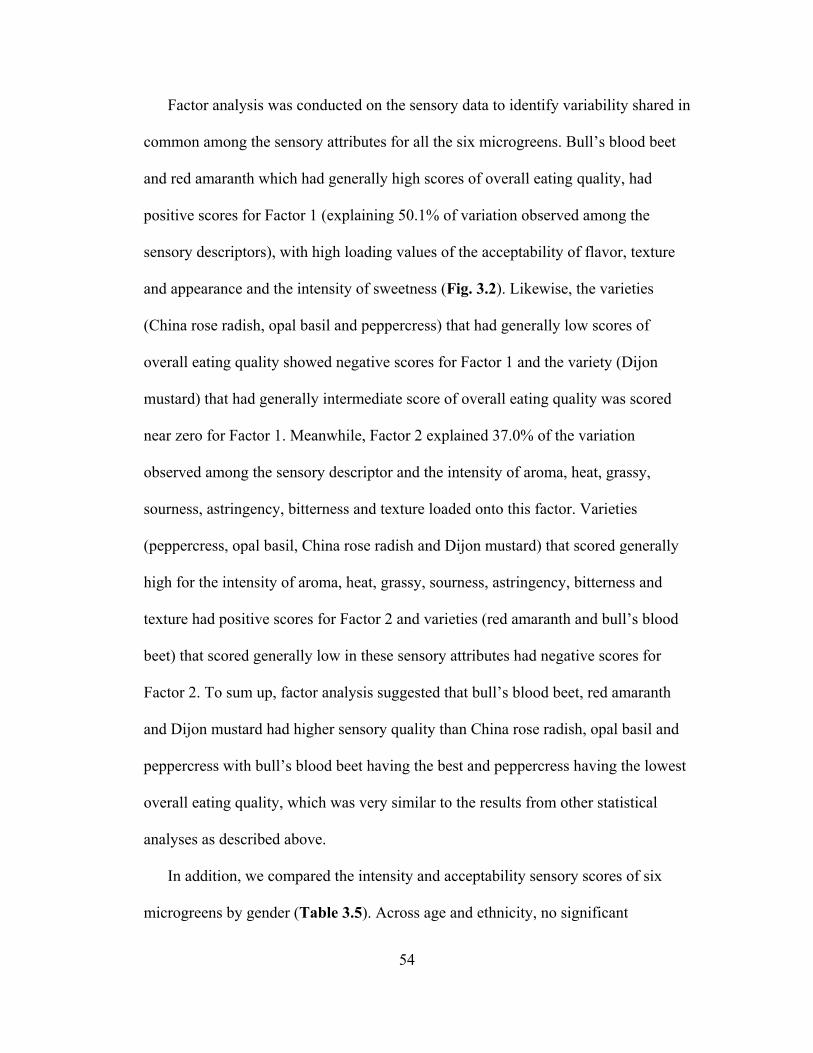
Fig. 3.2 Factor analysis of the sensory data of six varieties of microgreens evaluated
in consumer acceptance test.
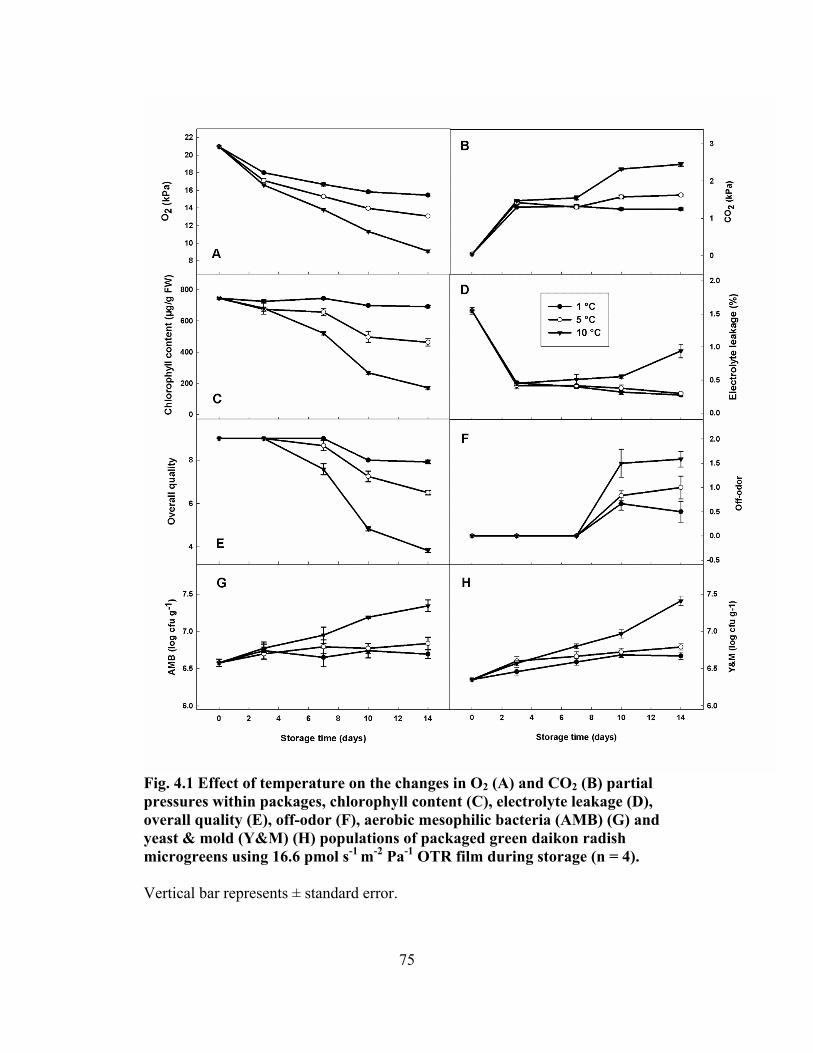
Fig. 4.1 Effect of temperature on the quality of radish microgreens during postharvest
storage.
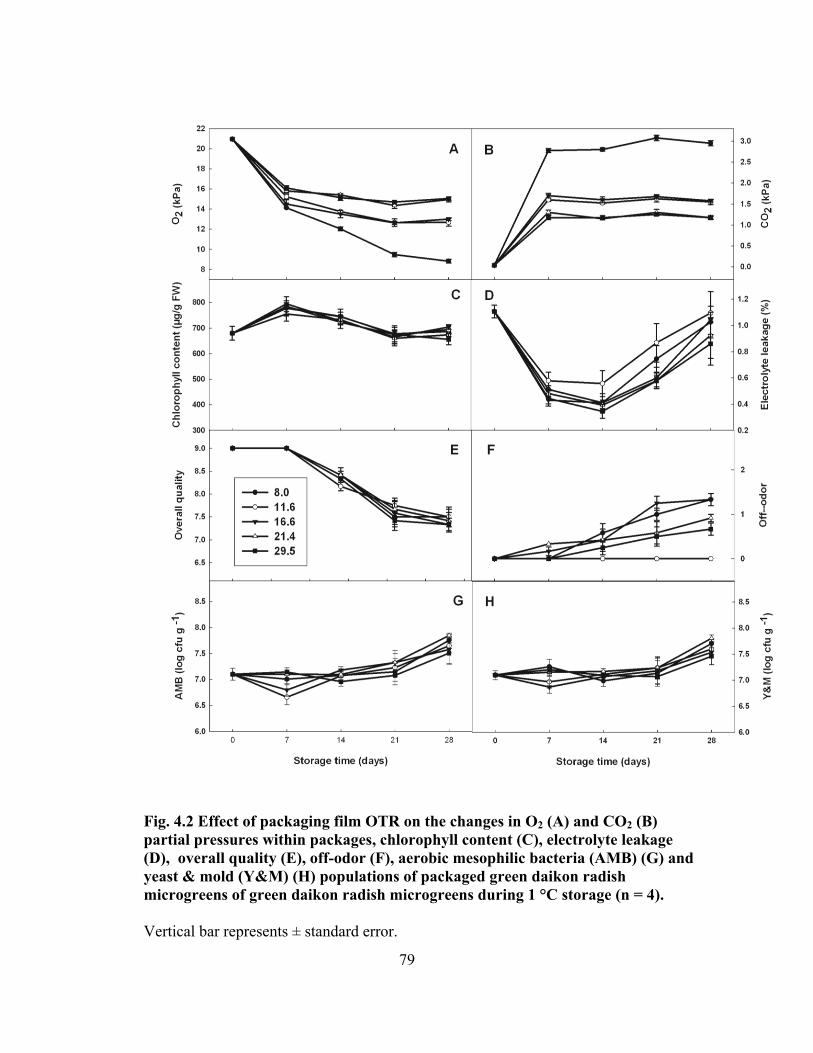
Fig. 4.2 Effect of modified packaging atmosphere (MAP) on the quality of radish
microgreens during postharvest storage.
Fig. 4.3 Effect of chlorine wash on the quality of radish microgreens during
postharvest storage.
Fig. 5.1 Effect of light exposure on the headspace gas composition in oxygen
transmission bags (OTR) and laser microperforated bags (LMP) during postharvest
storage.
Fig. 5.2 Effect of light exposure on lightness (L*), chroma (C*), hue angle (h°) of
radish microgreens during postharvest storage.
Fig. 5.3 Effect of light exposure on visual, off-odor and weight loss of radish
microgreens during postharvest storage.
Fig. 5.4 Effect of light exposure on dry weight, ascorbic acid, dehydroascorbic acid,
total ascorbic acid, β-carotene, lutein/zeaxanthin, violaxanthin, α-tocopherol of radish
microgreens during postharvest storage.
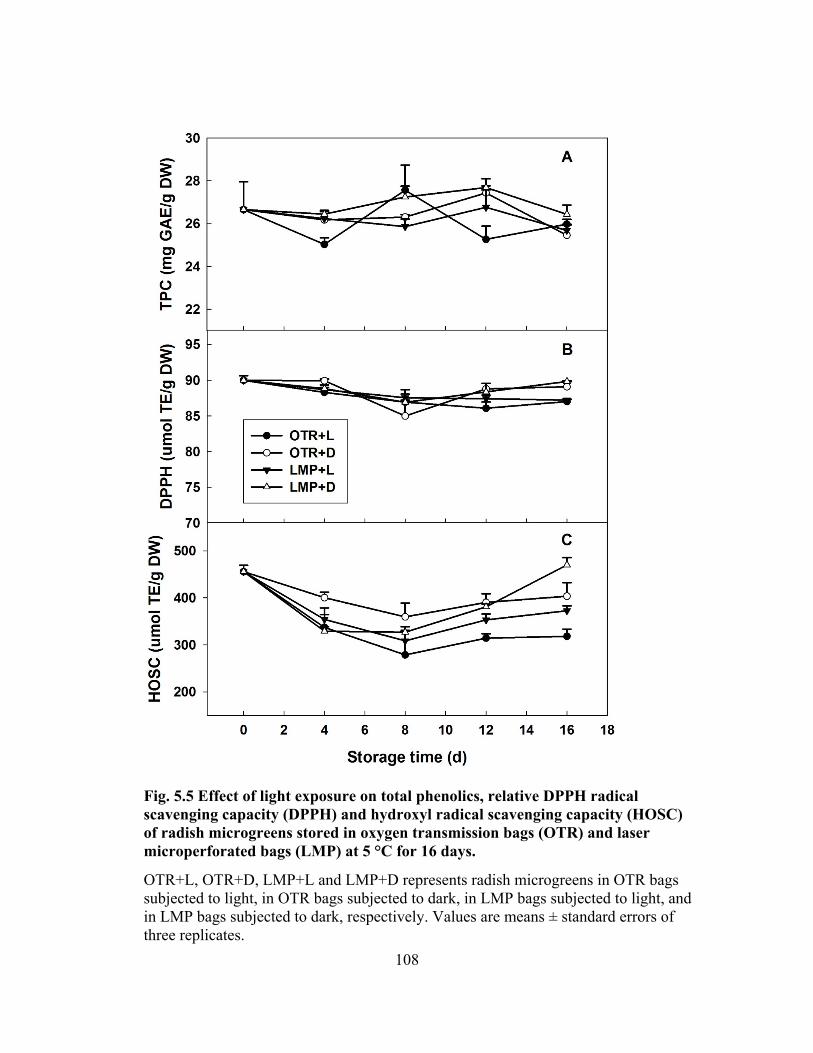
Fig. 5.5 Effect of light exposure on total phenolics, relative DPPH radical scavenging
capacity (DPPH) and hydroxyl radical scavenging capacity (HOSC) of radish
microgreens during postharvest storage.
Fig. 6.1 Populations of total aerobic plate counts (APC), yeast and mold (Y&M),
Enterobacteriaceae count (EB) and E. coli/Coliforms count (EC) on growth medium
and radish seeds.
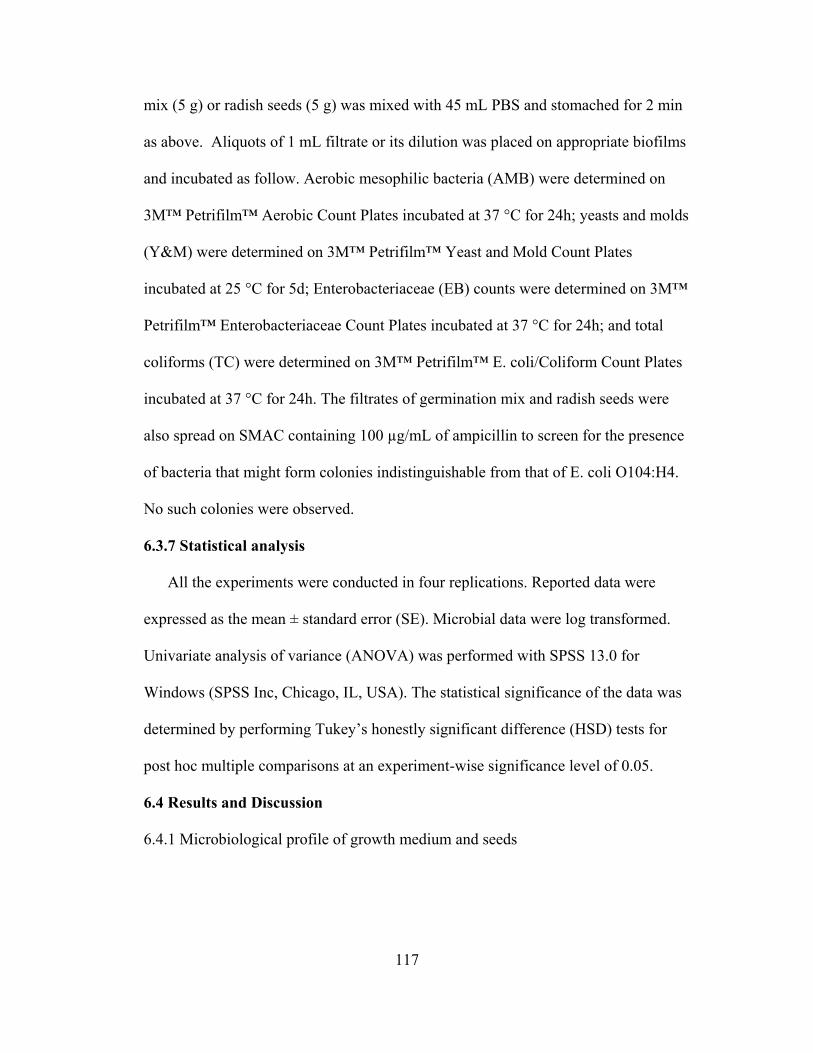
Fig. 6.2 Populations of E. coli O157: H7 on radish seeds, sprouts, and microgreens,
produced from un-inoculated, low level, high level and sporadically inoculated seeds.
Fig. 6.3 Populations of E. coli O104: H4 on radish seeds, sprouts, and microgreens,
produced from un-inoculated, low level, high level and sporadically inoculated seeds.
Page 13
1
Chapter 1: Literature Review
1.1 Introduction of Microgreens
Microgreens are an exotic genre of edible greens appearing in upscale markets
and restaurants which have gained popularity as a new culinary trend over the past
few years. They are tender immature greens produced from the seeds of vegetables
and herbs, having two fully developed cotyledon leaves with or without the
emergence of a rudimentary pair of first true leaves. They are older than sprouts and
much younger than baby greens. Microgreens became popular in the middle of 1990s
in California and the first use of the word “microgreens” was documented in 1998.
Microgreens are usually 1-3 inches in height, harvested at 7-14 days after germination,
depending on the species, and sold with the stem and attached cotyledons (seed
leaves). Although small in size, microgreens can provide a large array of intense
flavors, vivid colors and tender textures. Therefore, microgreens can be served as a
new ingredient in salad, soups and sandwiches enhancing their color, texture, and/or
flavor, and also can be used as edible garnish to brighten up a wide variety of main
dishes (Murphy et al., 2010; Treadwell et al., 2010.; Lee et al., 2009). Although
microgreens have been claimed as nutritionally beneficial, to the best of our
knowledge, little scientific data are available on microgreens.
1.2 Health Benefits of Fruits and Vegetables
Epidemiological studies have shown that consumption fruit and vegetable is
strongly associated with reduced risk in the development of chronic disease, such as
cancer, heart disease, diabetes, hypertension and metabolic syndrome (Bergquist et al.,
2006; Hung et al., 2004). Diets rich in fruit and vegetables provides an abundance of
Page 14
2
human bioactive compounds, such as ascorbic acid, carotenoids, tocopherols,
anthocyanins, and isoflavones, which are known to have protective benefits against
cancers and cardiovascular disease (Craig, 1997; Rice-Evans et al., 1995). The foods
and herbs with the highest anticancer activity include garlic, soybeans, cabbage,
ginger, licorice, and the umbelliferous vegetables. Citrus, in addition to providing an
ample supply of vitamin C, folic acid, potassium, and pectin, contains a host of active
phytochemicals (Craig & Beck, 1999).The new Dietary Guidelines for
Americans (2010) released by the U.S. Department of Agriculture (USDA) and the
Department of Health and Human Services (DHHS) specifically recommends
Americans to fill half of their plate with fruits and vegetables because they possess
benefits for human health.
1.3 Phytonutrients in Fruits and Vegetables
Phytonutrients play an important role in human growth, development and health
maintenance. They are being intensively studied to evaluate their effects on health.
These compounds vary widely in chemical structure and function and are grouped
accordingly (Kris-Etherton et al., 2002).
1.3.1 Ascorbic Acid
Ascorbic acid (vitamin C) is an essential nutrient for the human body, acting as
the most effective water-soluble antioxidant. There are two available forms of vitamin
C in plants: reduced form (L-ascorbic acid) and oxidized form (dehydroascorbic
acid). When plants are subject to physical or physiological stresses (chilling,
irradiation, harvesting injury, etc.), L-ascorbic acid can be oxidized into
dehydroascorbic acid (Hodges et al., 2001). In the dietary source, ascorbic acid is also
Page 15
3
unstable and easily oxidized under oxygen, alkali and high temperature. It is
previously reported that the utilization of dehydroascorbic acid is equivalent to that of
free ascorbic acid, although the metabolic turnover time is different (Tsujimura et al.,
2008). It is abundantly found in citrus fruits (Citrus L.), peppers (Capsicum annuum
L.), strawberries (Fragaria × ananassa D.), tomatoes (Solanum lycopersicum L.),
broccoli (Brassica oleracea L. var. italica), Brussels sprouts (Brassica oleracea L.
var. gemmifera), turnips (Brassica rapa L.var. rapa) and other leafy vegetables.
Numbers of studies have provided strong evidence to link dietary vitamin C with
protective effects against various oxidative stress-related diseases such as cancers,
cardiovascular disease, aging and cataract formation (Steinmetz & Potter, 1996; Iqbal
et al., 2004)
1.3.2 Carotenoids
Carotenoids are one of the most widespread groups of naturally occurring
pigments. Within the carotenoids are carotenes and xanthophylls and the difference of
their structures is that xanthophylls contain one or more oxygen atoms on the basis of
carotenes, which are purely hydrocarbons. These compounds are largely responsible
for the red, yellow, and orange color of fruits and vegetables, and are also found in
many dark green vegetables (Rao & Rao, 2007). The most abundant carotenoids in
the North American diet are β-carotene, α-carotene, γ-carotene, lycopene, lutein,
zeaxanthin and β-cryptoxanthin. Several carotenoids are known to exhibit antioxidant
activity and some of them such as β-carotene, α-carotene, and cryptoxanthin are
recognized as provitamin A, which are turned into vitamin A in the body and,
therefore, perform the same functions in the body as vitamin A (Stahl & Sies, 2003).
Page 16
4
Food sources of carotenoids include carrots (Daucus carota L.), sweet potatoes
(Ipomoea batatas (L.) Lam.), spinach (Spinacia oleracea L.), kale (Brassica oleracea
L. var. acephala), collard greens (Brassica oleracea L. var. acephala), bell peppers
(Capsicum annuum L.), tomatoes (Solanum lycopersicum L.) and papayas (Carica
papaya L.). Numerous observational studies have found that people who include
more carotenoids in their diets have a reduced risk of several chronic diseases,
including cancer, cardiovascular diseases, cataracts, age-related macular degeneration
and other diseases (Mayne, 1996). Some studies have shown that smokers with diets
high in carotenoids have a lower rate of lung cancer development than their
counterparts whose carotenoid intake is relatively low. Other research efforts have
suggested that diets high in carotenoids may also be associated with a decreased risk
of breast cancer (Kaur & Kapoor, 2001).
1.3.3 Tocopherols
Tocopherols and tocotrienols are together summarized as “Vitamin E”, known as
the main dietary fat soluble antioxidants. Each group has four isomers (α-, β-, γ- and
δ-), all of which are naturally occurred and synthesized by plants (Papas, 1999). All
chlorophyll-containing tissues contain tocopherols, primarily in the chloroplasts. The
most abundant sources of tocopherols are oil seeds, leaves, and other green parts of
higher plants. Tocotrienols have been identified in a number of plant tissues, ranging
from kale and broccoli to cereal grains and nuts (Piironen et al., 1986). The vitamin E
compounds are well recognized for their effective inhibition of lipid oxidation in
foods and biological systems. Among these compounds, α-tocopherol has the highest
Page 17
5
biological activity, followed by β-, γ-, and δ-tocopherols (Kamal-Eldin & Appelqvist,
1996).
Tocopherols scavenge free radicals by its intermediate a tocopheroxyl radical
coupling with lipid peroxyl radicals (Yamauchi, 2007). Evidence exists that
tocopherols can prevent atherosclerosis by interfering with the oxidation of LDL, a
factor associated with increased risk of heart diseases (Stampfer et al., 1993). It
provides vital antioxidant protection for cell membranes, where it works together with
both vitamin C and coenzyme Q10. Although vitamin E does not show anticancer
activity in animals, a recent clinical chemoprevention study suggests that
supplemental vitamin E might decrease risk of prostate cancer, and epidemiological
studies support its protective role against colon cancer (Kaur & Kapoor, 2001).
1.3.4 Polyphenols
Polyphenols, including their subcategory, flavonoids, are ubiquitous in all plants.
Polyphenols traditionally have been considered antinutrients by animal nutritionists,
because of the adverse effect of tannins, one type of polyphenol, on protein
digestibility (Bravo, 1998). However, recent interest in food phenolics has increased
greatly, owing to their antioxidant capacity (free radical scavenging and metal
chelating activities) and their possible beneficial implications in human health.
Laboratory studies have shown that specific flavonoids suppress tumor growth,
interfere with sexual hormones, prevent blood clots, and have anti-inflammatory
properties. Among the important flavonoids are resveratrol, quercetin, and catechin.
Evidence suggests that resveratrol (found in red wine, grapes, olive oil) may be
extremely potent. In laboratory studies, it increases cell survival and has been shown
Page 18
6
to increase the life span of worms and fruit flies. Catechins are the primary flavonoids
in tea and may be responsible for its possible beneficial effects. Flavonoids in dark
chocolate may also be health protective (Kris-Etherton et al., 2002).
1.3.5 Phytoestrogens
Phytoestrogens, commonly known as isoflavones, have actions that are similar to
the female hormone estrogen. A high consumption of soy, which is primarily
composed of isoflavones, may reduce symptoms resulting from estrogen depletion
during menopause. Various phytoestrogens are present in soy, but also in flaxseed oil,
whole grains, fruits, and vegetables. They have antioxidant properties, and some
studies demonstrated favorable effects on other CVD risk factors, and in animal and
cell culture models of cancer (Kris-Etherton et al., 2002). Lignan is another
phytoestrogen and is found in the fiber layers of whole-grains, berries, some seeds,
some vegetables, and a few fruits. In laboratory studies, it seems to have anti-cancer
properties.
1.3.6 Sulphur-containing Compounds
Organosulfurs are part of the allium family of phytochemicals. Compounds such
as allicin may have benefits on the immune system, assist the liver in rendering
carcinogens harmless, and reduce production of cholesterol in the liver. These
compounds are found in garlic, leeks, onions, chives, scallions, and shallots (Kris-
Etherton et al., 2002). Isothiocyanates and related substances, indoles, are also known
as mustard oils and are responsible for the sharp taste in cruciferous vegetables. Such
vegetables include broccoli, cabbage, Brussels sprouts, cauliflower (Brassica
oleracea L. var. botrytis), collard greens, kale, kohlrabi (Brassica oleracea L. var.
Page 19
7
gongylodes), mustard greens (Brassica juncea L.), rutabaga (Brassica napobrassica
(L.) Mill.), turnips, and bok choy (Brassica rapa L. var. chinensis). Isothiocyanates
stimulate enzymes that convert estrogen to a more benign form and may block steroid
hormones that promote breast and prostate cancers.
1.4 Sensory Evaluation and Consumer Acceptance
New product development is the driving force and stimulus in the growth of food
industry. In this process, new technologies play an important role in sustainable
innovation of new product development. However, the advantages that a new
processing technology has to offer are not enough to ensure acceptance of these
technologies in the market place, because consumer acceptance is a critical factor
which considerably affect the marketability of a new food product (Lyndhurst, 2009).
Some technologies like organic production are warmly welcomed by many
consumers, whereas others like genetic modification and irradiation have been firmly
rejected. Thus, we can see that consumers‟ perception and acceptance to a new
product can prevent the application of a technology and delay the marketing
promotion of a new product, like in the case of irradiation and genetic modification.
“On this background it is very important to know how much consumers will like the
new products developed by new technology” (Olsena et al., 2010).
The quality control of food has a significant role in assuming a high quality, safe
and nutritious food supply for the public, for their good health and for the economic
benefits derived from trade of safe and high quality food. Quality control is applicable
throughout the entire processing of food production, continuously involved from raw
materials to end products. There are many analytical and instrumental evaluation
Page 20
8
methods in quality control, such as electronic nose to discriminate red wines, gas
chromatography-mass spectrometry (GC-MS) to analyze volatiles, colorimeter to
estimate color evolution and texture analyzer to evaluate firmness of many kinds of
food products (Hansen et al., 2005). Even so, there are still different kinds of
limitations resulting from the instruments inevitably. The most reliable way to
evaluate the potential human perception is to conduct the human sensory tests.
Human sensation is received from an organoleptic system, which can deliver the
comprehensive information on the given sensory attributes of the food product,
including appearance, color, texture, taste and flavor and overall liking. Therefore, in
the modern food industry, human sensory evaluation is becoming more and more
important in establishing consumer acceptability, quality controls and new product
development.
1.5 Postharvest Storage and Quality Control
1.5.1 Low Temperature Storage
Storage temperature is one of the most important factors affecting the postharvest
physiology and storage behavior of produce. In general, low temperature storage can
reduce quality loss and extend shelf life by depressing rates of respiration,
senescence, and growth of spoilage microorganisms (Spinardi & Ferrante, 2012;
Paull, 1999). Optimum storage temperature varies depending on the fruit or
vegetable. For some chilling sensitive fruits and vegetables, the use of low
temperature storage adversely affects quality attributes and causes deterioration more
rapidly (Galvez et al., 2010; Sandhya, 2010). Even though an optimal low
temperature is maintained through the storage, transportation and retail, the fruits and
Page 21
9
vegetables can still spoil, as evidenced by fungal attacks and detrimental quality
changes. Therefore, low temperature storage should be combined with other
postharvest handling methods, like modified atmosphere packaging or UV irradiation.
1.5.2 Modified Atmosphere Packaging
Modified atmosphere packaging is an effective technology for maintaining
freshness and prolonging shelf life of produce, which can be created by altering the
gas composition in the package, thus to provide an optimum atmosphere for
prolonging storage length and maintaining the quality of food. The modified
atmosphere can be achieved by using controlled atmosphere (CA) and /or active or
passive modified atmosphere packaging (MAP) (Farber et al., 2003). To data, CA and
MAP have been successfully applied in fresh and minimally processed produce to
increase the quality, such as apple (Malus × domestica Borkh.), pear (Pyrus
communis L.), lettuce (Lactuca sativa L.), broccoli, spinach (Spinacia oleracea L.),
and mushrooms (Sandhya, 2010). In addition, modification of the atmosphere can
help restrict the growth of microorganisms surrounding the product by provide the
„hurdle‟ of microbial growth. Another „hurdle‟ can be provided by storage at low
temperatures (< 4 °C). The combination of chill temperatures and MAP generally
results in a more effective and safer storage regime and longer shelf-life. There are
many factors influencing package atmosphere of products, including product
respiration rate, packaging film oxygen transmission rate (OTR), product weight,
package surface area, storage temperature and relative humidity (Sandhya, 2010). In
food supply chains, package size and product weight are often pre-determined,
Page 22
10
therefore, selecting a packaging film with suitable OTR to match the product
respiration rate is the best way to maintain quality and extend shelf life of produce.
1.5.3 Edible Coating
Edible coatings, a new strategy to extend shelf-life and improve food quality of
whole fresh-cut fruits and vegetables, have been applied to many products. On one
hand, edible coatings provide a selective barrier to moisture, oxygen and carbon
dioxide, which retards gas transfer, slows ripening, reduces moisture loss and helps to
maintain fresh aroma and flavor (Olivas & Barbosa-Canovas, 2005). On the other
hand, edible coatings are used as carriers of active ingredients, such as antibrownings,
antimicrobials, texture enhancers, flavors, and nutrients, to improve the quality,
safety, and nutritional value of fresh-cut fruits (Rojas-Graü et al., 2009). Several types
of edible coatings, such as alginate, pectin, gellan, methylcellulose, have been used
for extending shelf life of fresh and fresh-cut commodities like apples, pears, melons,
papayas and pineapples (Ananas comosus (L.) Merr.) (Oms-Oliu et al., 2010).
Numerous studies have shown that the use of edible coatings is a promising approach
for maintaining “fresh” quality of produce and thus contributing to greater consumer
acceptance.
1.6 Microbial Risks and Safety Ensurance
1.6.1 Foodborne Outbreaks Associated with Produce
From the Center of Disease Control and Prevention (CDC) database, it can be
seen that foodborne illness outbreak associated with fresh fruits and vegetables
happened almost every year and most of them were multistate outbreaks. In 2006, the
United States Food and Drug Administration (US FDA) announced a large E. coli
Page 23
11
O157:H7 outbreak of illness associated with bagged spinach. By the time the
outbreak was over, 204 people were reported to have become ill across 26 States and
Canada, 104 had been hospitalized, 31 had developed serious complications, and 3
had died. From November of 2010 through February of 2011, the Salmonella
outbreak linked to eating alfalfa sprouts or spicy sprouts at Jimmy John‟s restaurants
caused 140 individuals to have become infected in 26 states including the District of
Columbia. Statistical data showed that since 1996 there have been at least 30 reported
outbreaks of foodborne illness associated with raw sprouts. Last year, a Salmonella
outbreak was linked to cantaloupe: a total of 261 people were infected, 94 people
hospitalized and 3 deaths were reported from across 24 states.
These dreadful outbreaks have triggered increasing attention of microbiological
safety of produce. More and more studies have been extensively carried out to
identify critical control points during preharvest and postharvest process and develop
novel technologies to ensure produce safety.
1.6.2 Sanitation Methods on Fresh Produce
1.6.2.1 Washing and Sanitizing
Washing and sanitizing treatments play a crucial role in reducing microbial
populations on fresh fruits and vegetables, thereby, improving the quality and safety
of fresh or fresh-cut produce.
Chlorine is the most widely used sanitizing agent for fresh produce (Beuchat,
1998). It was shown that the efficacy of chlorine sanitation on produce surface is not
sufficient within the range of 1-2 log reduction of microbial population (Sapers et al.,
1998). Meanwhile, the reaction of chlorine with organic residues can result in the
Page 24
12
formation of potentially mutagenic or carcinogenic reaction products (Hidaka et al.,
1992). The use of chlorine in food products has been restricted or prohibited in some
countries, such as the European Union (EU) (Johnson, 2011). Therefore, alternatives
to chlorine have been studied, and some are in commercial use.
Electrolyzed water (EW) has been received a lot of attention as a new sanitizing
agent for produce in recent years. EW has many advantages, such as effective
disinfection, easy operation, relatively inexpensive, and environmentally friendly.
However, some disadvantages should be considered as well: 1) the initial cost for the
equipment purchase is high; and 2) The chlorine gas generated is bothersome to
operators. Only recently has EW been tested and used as a disinfectant in the food
industry (Huang et al., 2008).
Ozone (O3) is a strong oxidizing agent with numerous potential applications in the
food industry, which has been used for decades in many countries. High reactivity,
penetrability, and spontaneous decomposition to a nontoxic product (i.e., O2) make
ozone a viable disinfectant. However, excessive use of ozone may affect food quality
due to oxidation of some ingredients on food surface. Caution is needed for workers
during operation, since inevitable contact of ozone may affect respiration and cause
dizziness and irritation. Ozone has been used with mixed success to inactivate
contaminant microflora on meat, poultry, eggs, fish, fruits, vegetables, and dry foods.
Peroxyacetic acid, also known as peracetic acid, is a mixture of the peroxy
compound, hydrogen peroxide, and acetic acid. It is usually commercialized as a
liquid, like Tsunami®
. Peroxyacetic acid is a strong oxidizing agent and tolerant to
several factors such as temperature, pH (from 1 to 8), hardness and soil
Page 25
13
contamination; therefore, it is currently applied in the fruit and vegetable processing
(Artés et al., 2007). Additionally, the break-down products (acetic acid, O2, CO2 and
water) of peroxyacetic acid are not particularly harmful for the ecosystem (Artés et
al., 2009). However, it is more expensive than chlorine and exposure to peroxyacetic
acid can cause irritation to the skin, eyes and respiratory system.
Chlorine dioxide (ClO2) is a stable dissolved gas in solution, having a higher
oxidation and penetration power than NaClO and more effective against spores (EPA,
1999). ClO2 is a strong bactericide and virucide at levels as low as 0.1 μg/mL. Unlike
chlorine, ClO2 does not ionize to form weak acids in water and remains as dissolved
gas in solution, which enables ClO2 to be effective over a wide pH range. The main
drawback is that it has to be generated on-site by reacting sodium chlorite and acid or
chlorine (EPA, 1999). Besides, ClO2 is unstable and can be explosive when the
concentration reaches 10% or more in air (Betts & Everis, 2005).
Hydrogen peroxide is a powerful oxidant, which has been demonstrated to be
effective in extending shelf-life and reducing native microbial and pathogen
populations in fresh and fresh-cut produce products (Sapers & Sites, 2003; Artés et
al., 2007). However, such treatments require lengthly application times (i.e., 15-60
min) and can cause injury to some commodities such as mushroom and strawberries
(Sapers & Simmons, 1998). Therefore, handling methods and safety issues of
hydrogen peroxide are still in discussion (Taormina et al., 1999).
1.6.2.2 Irradiation
Irradiation (increasingly referred to as “cold pasteurization”) is a control measure
in the production of several types of raw or minimally processed foods such as
Page 26
14
poultry, meat and meat products, fish, seafood, and some fruits and vegetables. It has
the potential to eliminate vegetative forms of bacterial pathogens as well as parasites
(Molins et al., 2001). Irradiation is a safe technology, since scientific research has
determined that food irradiation does not make food „radioactive‟ and at low to
medium doses, has little negative effect on vitamins and other nutrients humans
obtain from their food supply (Crawford & Ruff, 1996; Lester et al., 2010a). Today,
40 countries permit the irradiation of one or more foodstuffs: 12 countries have
approved its use for pathogen control in poultry, 8 other for use in meats, and 13 in
fish and seafood (Molins et al., 2001). In the USA, there are more than 40 irradiation
plants in operation today, all of which are dedicated to sterilization of certain
industrial products and medical supplies and there is only one commercial food
irradiation plant operating in the USA. To some extent, the slow growth of food
irradiation processing in this country is mainly attributable to consumer perceptions.
Surveys show that Americans know very little about the food irradiation process and
are inclined to answer „no‟ when asked if they would purchase irradiated foods.
However, those same surveys indicate that when consumers are told about the
benefits and safety of irradiation, their acceptance level increases (Crawford & Ruff,
1996). While there is very strong support for food irradiation among the informed
scientific community and health organizations, extensive education is needed for
broad public acceptance.
1.6.2.3 Intense light pulses
Intense light pulse (ILP) is an emerging nonthermal technology for
decontamination of food surfaces and food packages, consisting of short time high-
Page 27
15
peak pulses of broad spectrum white light. It is considered an alternative to
continuous ultraviolet light treatments for solid and liquid foods and has been
approved by the US FDA that could be suitable for disinfecting fresh-cut produce.
(Oms-Oliu et al., 2010).Intense light pulses treatment kills microorganisms using
short time (from 85 ns to 0.3 ms) high frequency pulses (from 0.45 to 15 Hz) and
energy per pulse ranging from 3 to 551 J of an intense broad spectrum, rich in UV–C
light (Gómez-López et al., 2005). It seems to induce structural changes of microbial
DNA, comparable to the effect caused by continuous UV sources, but others
mechanisms seem to be involved (Takeshita et al., 2003). Since the ILP
decontamination effect seems to be dependent on light absorption by microorganisms,
certain food components could also absorb the effective wavelengths and decrease
their efficiency. ILP has been used to successfully inactivate E. coli O157:H7 on
alfalfa seeds (Sharma & Demirci, 2003). Gómez-López et al. (2005) reported that
foods rich in carbohydrate, such as fruit and vegetables, seem to be more suitable for
decontamination by ILP (Artés et al., 2009). ILP has considerable potential to be
implemented in the food industry. However, technological problems need to be
solved in order to avoid food overheating as well as to achieve better penetration and
treatment homogeneity.
Page 28
16
Chapter 2: Assessment of Vitamin and Carotenoid
Concentrations of Emerging Food Products: Edible
Microgreens
Xiao, Z., Lester, G. E., Luo, Y., Wang, Q. (2012) Journal of Agricultural and Food
Chemistry, 60 (31), 7644–7651.
2.1 Abstract
Microgreens have gained popularity as a new culinary trend over the past few
years. Although small in size, microgreens can provide surprisingly intense flavors,
vivid colors and crisp textures. No scientific data is currently available on the
nutritional content of microgreens. The present study was conducted to determine the
concentrations of ascorbic acid, carotenoids, phylloquinone and tocopherols in 25
commercially available microgreens. Results showed that different microgreens
provided extremely varying amounts of phytonutrients. Total ascorbic acid contents
ranged from 20.4 to147.0 mg per 100 g fresh weight (FW), β-carotene,
lutein/zeaxanthin and violaxanthin concentrations ranged from 0.6 to 12.1, 1.3 to 10.1
and 0.9 to 7.7 mg/100 g FW, respectively. Phylloquinone level varied from 0.6 to 4.1
μg/g FW, meanwhile, α-tocopherol and γ-tocopherol ranged from 4.9 to 87.4 and 3.0
to 39.4 mg/100 g FW, respectively. Among the 25 microgreens assayed, red cabbage,
cilantro, garnet amaranth and green daikon radish had the highest concentrations of
ascorbic acids, carotenoids, phylloquinone, and tocopherols, respectively. Compared
mature leaves nutritional concentrations recorded in USDA National Nutrient
Database, microgreen cotyledon leaves possessed higher nutritional densities.
Page 29
17
2.2 Introduction
Epidemiological studies have shown that fruit and vegetable consumption is
associated with reduction in the development of chronic disease, such as cancer and
cardiovascular disease (Bergquist et al., 2006; Hung et al., 2004). Diets rich in fruits
and vegetables provide an abundance of phytonutrients (Craig & Beck, 1999), such as
ascorbic acid (vitamin C), carotenoids (provitamin A compounds), phylloquinone
(vitamin K1) and tocopherols (vitamin E), which are known to have health protective
benefits against cancers and cardiovascular disease (Catherine Rice-Evans, 1995).
The new Dietary Guidelines for Americans (2010) released by the U.S. Department
of Agriculture (USDA) and the Department of Health and Human Services (DHHS)
specifically recommends Americans to fill half of their plate with fruits and
vegetables because they possess benefits for human health.
Microgreens are an exotic genre of edible greens appearing in upscale markets
and restaurants which have gained popularity as a new culinary trend over the past
few years. Microgreens are tender immature greens produced from the seeds of
vegetables and herbs, having two fully developed cotyledon leaves with or without
the emergence of a rudimentary pair of first true leaves. Microgreens are usually 2.5-
7.6 cm (1-3 in.) in height, harvested at 7-14 days after germination, depending on the
species, and sold with the stem and attached cotyledons (seed leaves). Although small
in size, microgreens can provide a large array of intense flavors, vivid colors and
tender textures. Therefore, microgreens can be served as a new ingredient in salad,
soups and sandwiches enhancing their color, texture, and/or flavor, and also can be
Page 30
18
used as edible garnish to brighten up a wide variety of main dishes (Treadwell, 2010;
Lee et al., 2004; Lee et al., 2009; Murphy & Pill, 2010).
Although microgreens have been claimed as nutritionally beneficial, to the best of
our knowledge, no scientific data are available on the exact phytochemical content of
microgreens. Limited studies have shown that some young seedlings may have much
higher levels of vitamins, minerals and other health-giving phytonutrients than the
mature leaves. In a recent study from Lester et al. (2010a), it was reported that the
younger leaves of baby spinach (Spinacia oleracea L.) generally had higher levels of
phytonutrients: vitamins C, B9 and K1, and the carotenoids (lutein, violaxanthin,
zeaxanthin and beta-carotene) than the more mature leaves. Oh et al. (2010) also
found that young lettuce (Lactuca sativa) seedlings, 7 days after germination, had the
highest total phenolic concentration and antioxidant capacity in comparison to the
older leaves. Therefore, the object of this study was to assess the phytonutrients
content of the 25 commercially available microgreens varieties. The phytonutrients
assayed include ascorbic acid (total, free and dehydro), carotenoids (beta-carotene,
violaxanthin and lutein/zeaxanthin), phylloquinone, and tocopherols (α-tocopherol
and γ-tocopherol).
2.3 Materials and Methods
2.3.1 Plant Materials
Twenty-five varieties of microgreens were purchased from Sun Grown Organics
Distributors, Inc. (San Diego, CA, USA) from May through July, 2011. They were
produced by the grower in an unheated greenhouse and under ambient light except
etiolated golden pea tendrils and popcorn shoots, which were grown in the dark. All
Page 31
19
the microgreens were grown in soil and fertilized in a proprietary manner except
China rose radish and green daikon radish microgreens, which were grown
hydroponically. Samples were harvested without roots, packed in clamshell
containers (113.4 g of each) and shipped overnight in a cardboard box which was
filled with frozen-ice packs. When received, three grams of fresh tissue were weighed
for ascorbic acid analysis. Remaining tissue was frozen in liquid nitrogen and
lyophilized for dry weight and other vitamin and carotenoid determinations. It is
worth mentioning that golden pea tendrils and green pea tendrils are grown from the
same seed source. Golden pea tendrils were grown in dark and green pea tendrils
were grown under ambient light. Photographs of the 25 commercially grown
microgreens assayed in this study were shown in Fig. 2.1 and commercial names,
scientific names and plant colors are listed in Table 2.1.
2.3.2 Dry Weight
Dry matter was determined by freeze-drying according to a previous procedure
(Julkunen-Tiitto & Sorsa, 2001). Ten grams of fresh microgreens were weighed into
plastic tubes, frozen in liquid nitrogen, and lyophilized for 48 h (VirTis Freezemobile
35 ES Sentry 2.0 freeze dryer, SP Scientific Corp., Warminster, PA, USA), followed
by holding at room temperature in a dessicator prior to weighing.
2.3.3 Nutrient Analysis
All chemicals and standards unless otherwise stated were obtained through
Sigma-Aldrich Chemical Corp. (St. Louis, MO, USA). Standards of lutein and
zeaxanthin were obtained from ChromaDex (Irvine, CA, USA).
Page 32
20
Fig. 2.1 Pictures of 25 commercially available microgreens.
Page 33
21
Table 2.1 Commercial names, scientific names and plant colors of 25
commercially grown microgreens assayed in the nutrient study.
Commercial name Scientific Name Plant color
Family Genus and Species
Arugula Brassicaceae Eruca sativa Mill. Green
Bull's blood beet Chenopodiaceae Beta vulgaris L. Reddish-green
Celery Apiaceae Apium graveolens L. Green
China rose radish Brassicaceae Raphanus sativus L. Purplish-green
Cilantro Apiaceae Coriandrum sativum L. Green
Garnet amaranth Amaranthaceae hypochondriacus L. Red
Golden pea tendrils* Fabaceae Pisum sativum L. Yellow
Green basil Lamiaceae Ocimum basilicum L. Green
Green daikon radish Brassicaceae Raphanus sativus L. Green
Magenta spinach Chenopodiaceae Spinacia oleracea L. Red
Mizuna Brassicaceae Brassica rapa L. Green
Opal basil Lamiaceae Ocimum basilicum L. Greenish-purple
Opal radish Brassicaceae Raphanus sativus L. Greenish-purple
Pea tendrils* Fabaceae Pisum sativum L. Green
Peppercress Brassicaceae Lepidium bonariense L. Green
Popcorn shoots Poaceae Zea mays L. Yellow
Purple kohlrabi Brassicaceae Brassica oleracea L. Purplish-green
Purple mustard Brassicaceae Brassica juncea L. Purplish-green
Red beet Chenopodiaceae Beta vulgaris L. Reddish-green
Red cabbage Brassicaceae Brassica oleracea L. Purplish- green
Red mustard Brassicaceae Brassica juncea L. Purplish-green
Red orach Chenopodiaceae Atriplex hortensis L. Red
Red sorrel Polygonaceae Rumex acetosa L. Reddish-green
Sorrel Polygonaceae Rumex acetosa L. Green
Wasabi
Brassicaceae Wasabia japonica
Matsum.
Green
*Golden pea tendrils and pea tendrils are grown from the same seeds. Golden pea
tendrils are grown in dark and pea tendrils are grown under light, therefore, the colors
of them are different (yellow and green, respectively). All the microgreens were
grown organically except China rose radish and green daikon radish microgreens,
which were grown hydroponically.
Page 34
22
2.3.3.1 Ascorbic Acid
Total ascorbic acid (TAA) and free L-ascorbic acid (AA) were determined
spectrophotometrically according to the procedure previously reported by Hodges et
al. (2001). Fresh tissue (3 g) was weighed into a 50 mL centrifuge tube, and 10 mL of
ice-cold 5% (w/v) meta-phosphoric acid was added, followed by homogenization at
the speed of 15,000 rpm for 1 min in ice-water bath using a polytron homogenizer
(Brinkman Instruments, Westbury, NY, USA). Homogenized tissue was centrifuged
at 7000 g (Beckman J2-MI, Beckman Coulter, Inc., Irving, TX, USA) for 20 min at
4°C, and supernatant was filtered through Whatman Grade 4 filter paper (Millipore
Corp. Bedford, MA, USA). Filtrate was used for AA determination and TAA by
converting dehydroascorbic acid (DHA) to AA with dithiothreitol. TAA and AA were
determined spectrophotometrically (Genesys 20, Thermo Scientific Inc, Logan, UT,
USA) at 525 nm. Concentrations of TAA and AA were calculated using an L-
ascorbic acid standard curve (all the R2 ≥ 0.99), and their difference was equal to the
concentration of DHA.
2.3.3.2 Carotenoids and Tocopherols
Carotenoids and tocopherols were extracted under yellow light according to the
modified method described by Lester et al. (2010a). Briefly, 0.05 g of lyophilized
samples were weighed into 15 mL screw cap glass vials, and then 7.5 mL of 1%
butylated hydroxytoluene (BHT) in ethanol and 500 µL of internal standard (86.82
µM trans-β-apo-8 carotenal) were added, followed by ultrasonic homogenization for
15 s using a Fisher Scientific Model 300 Sonic Dismembrator (Pittsburg, PA, USA).
The vials were capped under a stream of N2 and placed in a 70°C dry bath for 15 min,
Page 35
23
after which 180 µL of 80% KOH was added. After mixing and flushing with flow N2,
vials were capped again and placed in a 70°C dry bath for 30 min. Vials were then
removed and cooled for 5 min in ice, and then transferred into 15 mL centrifuge
tubes, after which 3.0 mL of deionized water and 3.0 mL of hexane/toluene solution
(10:8 v/v) were added. The mixture was vortexed for 1 min, and then centrifuged at
1000 g (Clay Adams Dynac II Centrifuge, Block Scientific, Inc., Bohemia, NY, USA)
for 5 min. The top organic layer was collected into an 8 mL glass culture tube, and
immediately placed into a nitrogen evaporator (Organomation Associates, Inc.,
Berlin, MA, USA) set at 30°C and flushed with stream of N2. The bottom layer was
extracted again with 3.0 mL of hexane/toluene solution (10:8 v/v) for further
partition. This extraction was repeated at least four times until the top layer was
colorless, and all the supernatants were combined into a glass culture tube. After
evaporation, the residue was reconstituted in 500 µL of mobile phase
acetonitrile/ethanol (1:1 v/v), filtered into an HPLC amber vial through 0.22 µm
nylon filter (Milliopore Corp., Bedford, MA, USA) with a glass syringe and 20 µL
was injected for HPLC analysis. Carotenoids and tocopherols concentrations were
simultaneously determined using an isocratic reverse phase high performance liquid
chromatography (RP-HPLC), which were separated on a C18 column (Adsorbosphere
C18-UHS, 5µm, 150×4.6mm, Grace, Deerfield, IL, USA) with a photo diode array
detector (DAD) (G1315C, Agilent, Santa Clara, CA, USA), using isocratic mobile
phase acetonitrile/ethanol (1:1 v/v). The flow rate was 1.2 mL/min and the running
time was 20 min. Absorbance was measured at 290 and 450 nm simultaneously for
Page 36
24
tocopherols and carotenoids, respectively. Quantification was based on a standard
curve for each compound.
2.3.3.3 Phylloquione
Phylloquinone was extracted from 25 microgreens under dim light and
determined by reversed-phase high performance liquid chromatography (RP-HPLC),
as described by Booth et al. (1994). Each sample (0.1 gram of freeze-dried tissue)
was homogenized (Brinkman Instruments, Westbury, NY, USA) with 10 mL of H2O
and 0.4 mL of 200 µg/mL menaquinone (internal standard) at the speed of 15000 rmp
for 1min, after which 15 mL of 2-propanol/hexane (3:2 v/v) was added. The sample
was then vortexed for 1 min and centrifuged (Beckman J2-MI, Beckman Coulter,
Inc., Irving, TX, USA) for 5 min at 1500g, 21°C. The upper (hexane) layer was
transferred into a glass culture tube and dried under a stream of N2. The residue was
dissolved in 4 mL of hexane. The sample extract was purified by loading 1 mL of
redissolved extract onto preconditioned silica gel columns (4mL of 3.5% ethyl ether
in hexane, followed by 4 mL of 100% hexane), and then washing column with 2 mL
of hexane. Phylloquinone was eluted with 8 mL of 3.5% ethyl ether in hexane, and
the eluate was evaporated on a water-jacketed heating block (Pierce Reacti-Therm,
Pierce Chemical Company, Rockford, IL, USA) at 40°C under N2 flow, and then
reconstituted in 2 mL of mobile phase (99% Methanol, 1% 0.05M sodium acetate
buffer, pH=3.0) and filtered through a 0.22 µm nylon syringe filter (Millipore Corp.,
Bedford, MA, USA). Detection of phylloquinone was with a photodiode array
detector (DAD) (G1315C, Agilent, Santa Clara, CA, USA) on Agilent 1200 Series
HPLC system and absorbance wavelength was 270 nm. The extract (20 µL) was
Page 37
25
injected into HPLC and run through a C18 column (201TP, 5µm, 150 × 4.6 mm,
Grace, Deerfield, IL, USA) using an isocratic mobile phase (described above) flowing
at the rate of 1 mL/min. The phylloquinone content of the samples was quantified
according to the internal standard method based on the peak areas.
2.3.4 Statistical Analysis
Dry weight analysis and all assays were performed on three replicates. All
phytonutrient analysis was conducted through one extraction of each replicate from
each sample. All the data was reported as the mean of three replicates ± standard
error. Statistical separation of phytonutrient values per species is based by Coefficient
of Variability (CV) and this variability is in relation to the mean of the population
from mature leaf data. A combined population of microgreens for each phytonutrient
CV is listed in tables.
2.4 Results and Discussion
2.4.1 Dry Weight Percentage
Dry weight percentage of the 25 commercially available microgreens ranged from
4.6% to 10.2%, as shown in Table 2.2. Among them, pea tendrils had the highest dry
weight percentage and red beet possessed the lowest one. The overall average dry
weight percentage of the 25 varieties of microgreens was 6.9 ± 0.1 %.
2.4.2 Phylloquinone Concentrations
Phylloquinone (vitamin K1) is required for blood coagulation and most abundant
in photosynthetic tissues of dark-green vegetables, such as spinach (Spinacia
oleracea L.), kale (Brassica oleracea L. var. acephala) and broccoli (Brassica
oleracea var. italica) (Bolton-Smith et al., 2000). The HPLC chromatograph of
Page 38
26
Vitamin K standards and extract from microgreens was shown in Fig. 2.2. Among the
25 microgreens assayed, there was considerable variation in phylloquinone
concentration, ranging from 0.6 to 4.1 µg/g fresh weight (FW) as shown in Table 2.2.
Among them, the most concentrated in phylloquinone was garnet amaranth (4.1 µg/g
FW), red sorrel (3.3 µg/g FW), green basil (3.2 µg/g FW), pea tendrils (3.1 µg/g FW)
and red cabbage (2.8 µg/g FW) microgreens. In contrast, magenta spinach, golden
pea tendrils, red orach microgreens and popcorn shoots had vitamin K1 concentration
ranging from 0.6 to 0.9 µg/g FW. Samples identified as rich in phylloquinone were
generally green (e.g. pea tendrils) and bright red in color (e.g. garnet amaranth
microgreens), while yellow-colored microgreens, such as popcorn shoots and golden
pea tendrils, had relatively low concentration of vitamin K1, which is in agreement
with a previous report (Bolton-Smith et al., 2000). Surprisingly, magenta spinach,
which has a similar appearance to the leading vitamin K1 microgreens source, garnet
amaranth (4.1 µg/g FW), had among the lowest vitamin K1 concentration.
Comparison of fully-grown and cotyledon leaves demonstrated that growth stage
affected vitamin K1 concentration, and for some of the varieties, the effect was
obvious. For example, according to the USDA National Nutrient Database (2011),
phylloquinone concentration in mature amaranth, basil and red cabbage were 1.14,
0.41 and 0.04 µg/g FW, respectively, which were much lower than their
corresponding microgreens (4.09, 3.20 and 2.77 µg/g FW, respectively). Four of the
25 microgreen varieties assayed in this study had comparable amount of
phylloquinone to mature leaf spinach, which is generally considered as an excellent
Page 39
27
source of vitamin K1; and 18 out of 25 exhibited vitamin K1 densities equal to or
higher than that of broccoli, the most commonly consumed vegetable in US (Bolton-
Smith et al., 2000; USDA, 2011); demonstrating that most of the 25 microgreens can
serve as good natural sources of vitamin K1.
Table 2.2 Dry weight percentage and phylloquinone concentrations in 25
commercially grown microgreensa.
Microgreen name Dry Weight (%) Phylloquinone (µg/g FW)
Arugula 5.5 ± 0.0 1.6 ± 0.1
Bull's blood beet 6.2 ± 0.1 2.0 ± 0.1
Celery 6.8 ± 0.1 2.2 ± 0.1
China rose radish 8.1 ± 0.1 1.8 ± 0.1
Cilantro 8.3 ± 0.1 2.5 ± 0.1
Garnet amaranth 9.3 ± 0.1 4.1 ± 0.0
Golden pea tendrils 9.8 ± 0.2 0.7 ± 0.0
Green basil 7.3 ± 0.0 3.2 ± 0.1
Green daikon radish 7.8 ± 0.1 1.9 ± 0.1
Magenta spinach 5.1 ± 0.2 0.6 ± 0.0
Mizuna 5.3 ± 0.0 2.0 ± 0.0
Opal basil 6.8 ± 0.1 2.0 ± 0.1
Opal radish 7.8 ± 0.1 2.2 ± 0.2
Pea tendrils 10.2 ± 0.2 3.1 ± 0.2
Peppercress 7.3 ± 0.1 2.4 ± 0.2
Popcorn shoots 7.0 ± 0.1 0.9 ± 0.0
Purple kohlrabi 6.1 ± 0.0 2.3 ± 0.1
Purple mustard 5.7 ± 0.1 1.3 ± 0.1
Red beet 4.6 ± 0.1 1.9 ± 0.1
Red cabbage 7.7 ± 0.1 2.8 ± 0.1
Red mustard 5.6 ± 0.1 1.9 ± 0.1
Red orach 6.2 ± 0.2 0.7 ± 0.0
Red sorrel 7.0 ± 0.1 3.3 ± 0.0
Sorrel 4.9 ± 0.0 1.7 ± 0.1
Wasabi 5.6 ± 0.0 1.9 ± 0.1
Coefficient of variation 15% a
Values are expressed as means ± standard error (n=3).
Page 40
28
Fig. 2.2 HPLC chromatograms of vitamin K standards (A) and extraction of
garnet amaranth microgreens (B).
Menaquinone (Vit K2) is the internal standard. HPLC conditions are described in the
materials and methods.
2.4.3 Ascorbic Acid Concentrations
Ascorbic acid (vitamin C) is an essential nutrient for the human body, acting as an
antioxidant. When the plant is subject to physical or physiological stress (harvesting
injury, chilling, irradiation, etc.), the AA can be oxidized into DHA (Hodges et al.,
2001). It is previously reported that the utilization of DHA is equivalent to that of
AA, although the metabolic turnover time is different (Tsujimura et al., 2008). In this
study, TAA, AA and DHA concentration were determined and listed in Table 2.3.
The 25 microgreens exhibited TAA concentration ranging from 20.4 to 147.0
mg/100 g FW. Among samples tested, red cabbage and garnet amaranth microgreens
Page 41
29
had the highest TAA contents, followed by China rose radish, opal basil and opal
radish. The vitamin C content of red cabbage microgreens (147.0 mg/100 g FW) was
6-fold higher than previously published data of the mature red cabbage (24.4 mg/100
g FW) (Singh et al., 2006) and 2.6 times greater than that (57.0 mg/100 g FW)
recorded in USDA National Nutrient Database for Standard Reference, Release 24
(USDA, 2011), and was determined to be 2.4 times greater than estimated average
requirement (EAR) for ascorbic acid. Garnet amaranth (131.6 mg/100g FW) had
much higher ascorbic acid content than reported concentration of mature leaf (11.6-
45.3 mg/100 g FW) (Mensah et al., 2008; Punia et al., 2004). China rose radish, opal
basil and opal radish microgreens also were relatively abundant sources of vitamin C
with more than 90.0 mg/100 g FW, equal to 1.5 times of the recommended dietary
allowance (RDA).These microgreen varieties had higher ascorbic acid concentration
than does broccoli (89.2 mg/100 g FW) (USDA, 2011), which is generally recognized
as an excellent source of vitamin C. Even though some of the 25 microgreens tested
had relatively low levels of total AA, such as golden pea tendrils (25.1 mg/100 g FW)
and sorrel microgreens (20.4 mg/100 g FW), they were comparable to spinach (28.1
mg/100 g FW) (USDA, 2011), which is one of the most commonly consumed leaf-
vegetables in US. Therefore, it was suggested that fresh microgreens are generally
good to excellent sources of ascorbic acid and likely more concentrated with TAA
than their mature plant counterparts, which is in accordance with Bergquist‟s (2006)
findings on baby spinach: that younger plants had higher ascorbic acid content than
older harvested leaves.
Page 42
30
Table 2.3 Total ascorbic acid (TAA), free ascorbic acid (AA), and
dehydroascorbic acid (DHA) concentrations in 25 commercially grown
microgreens a.
a Values are expressed as mean ± standard error (n=3).
2.4.4 Carotenoid Concentrations
2.4.4.1 β-Carotene
β-Carotene (provitamin A) is an important fat-soluble antioxidant and can protect
cellular membranes by scavenging free radicals (Singh et al., 2006). Together with
other carotenoids, the HPLC chromatogram of β-carotene standard and extraction of
Microgreen name TAA
(mg/100 g FW)
AA
(mg/100 g FW)
DHA
(mg/100 g FW)
Arugula 45.8 ± 3.0 32.7 ± 1.3 13.2 ± 2.8
Bull's blood beet 46.4 ± 3.0 46.0 ± 3.3 0.5 ± 0.3
Celery 45.8 ± 3.1 32.6 ± 1.3 13.2 ± 2.8
China rose radish 95.8 ± 10.3 73.2 ± 3.4 22.6 ± 7.4
Cilantro 40.6 ± 2.4 24.5 ± 1.8 16.1 ± 2.2
Garnet amaranth 131.6 ± 2.9 105.1 ± 3.1 26.5 ± 1.4
Golden pea tendrils 25.1 ± 0.7 15.3 ± 1.7 9.8 ± 1.2
Green basil 71.0 ± 2.7 59.0 ± 1.8 12.0 ± 1.1
Green daikon radish 70.7 ± 2.7 58.8 ± 1.7 11.9 ± 1.1
Magenta spinach 41.6 ± 0.8 36.0 ± 0.8 5.6 ± 0.2
Mizuna 42.9 ± 1.6 32.3 ± 1.0 10.6 ± 0.7
Opal basil 90.8 ± 2.7 81.8 ± 1.6 9.0 ± 2.0
Opal radish 90.1 ± 2.7 81.1 ± 1.7 9.0 ± 1.9
Pea tendrils 50.5 ± 0.9 27.9 ± 1.1 22.5 ± 0.3
Peppercress 57.2 ± 1.6 33.0 ± 0.7 24.2 ± 1.8
Pop corn shoots 31.8 ± 0.7 21.4 ± 2.5 10.4 ± 3.0
Purple kohlrabi 62.8 ± 7.3 48.1 ± 3.7 14.7 ± 3.7
Purple mustard 72.1 ± 4.6 53.6 ± 2.6 18.5 ± 4.4
Red beet 28.8 ± 0.4 27.5 ± 0.3 1.3 ± 0.5
Red cabbage 147.0 ± 3.6 103.3 ± 9.0 43.7 ± 5.4
Red mustard 62.2 ± 2.6 40.8 ± 1.4 21.4 ± 1.3
Red orach 45.4 ± 0.9 43.7 ± 0.9 1.7 ± 0.2
Red sorrel 56.7 ± 1.4 41.9 ± 1.9 14.9 ± 0.7
Sorrel 20.4 ± 0.5 17.9 ± 0.3 2.6 ± 0.2
Wasabi 44.8 ± 1.9 35.0 ± 2.0 9.8 ± 0.1
Coefficient of variation 12% 18% 35%
Page 43
31
cilantro microgreens was shown in Fig. 2.3. As shown in Table 2.4, the β-carotene
levels ranged from 0.6-12.1 mg/100 g FW. Among the tested microgreens, red sorrel
had the highest β-carotene concentration (12.1 mg/100 g FW), followed by cilantro,
red cabbage and peppercress (11.7, 11.5, and 11.1 mg/ 100 g FW, respectively). The
lowest β-carotene concentration was found in golden pea tendrils and popcorn shoots
(around 0.6 mg/100 g FW) with the other microgreens at intermediate values (5.2 to
8.6 mg/100 g FW). Compared with fully-developed cilantro leaves, cilantro seedlings
contained 3-fold more β-Carotene. Red cabbage microgreens contained an average of
11.5 mg/100 g FW which is approximately 260-fold more than the value (0.044
mg/100 g FW) reported for mature red cabbage leaves (Singh et al., 2006). Wasabi,
green basil, pea tendrils and garnet amaranth microgreens are also abundantly
concentrated with β-carotene. The β-carotene concentration in these microgreens is
comparable to that of carrot (Daucus carota L.) and sweet potato (Ipomoea
batatas (L.) Lam) which are well known β-carotene-rich vegetables (Punia et al.,
2004; USDA, 2011). In summary, all the microgreens tested can be considered
as excellent sources of β-carotene, with the exceptions of popcorn shoots and golden
pea tendrils.
2.4.4.2 Lutein/zeaxanthin
Lutein and zeaxanthin are xanthophyll carotenoids, accumulating in the macula of
human eyes. Numerous epidemiological studies have shown lutein and zeaxanthin
play a critical role in the prevention of age-related macular degeneration and cataract
Page 44
32
Table 2.4 β-Carotene, violaxanthin and lutein/zeaxanthin concentrations in 25
commercially grown microgreensa.
Microgreen name β-Carotene
(mg/100 g FW)
Lutein/zeaxanthin
(mg/100 g FW)
Violaxanthin
(mg/100 g FW)
Arugula 7.5 ± 0.4 5.4 ± 0.2 2.6 ± 0.1
Bull's blood beet 5.3 ± 0.8 4.3 ± 0.7 2.3 ± 0.1
Celery 5.6 ± 0.1 5.0 ± 0.1 2.6± 0.1
China rose radish 5.4 ± 0.5 4.9 ± 0.4 1.9 ± 0.1
Cilantro 11.7 ± 1.1 10.1 ± 0.3 7.7 ± 0.6
Garnet amaranth 8.6 ± 0.3 8.4 ± 0.1 4.4 ± 0.1
Golden pea tendrils 0.6 ± 0.0 2.7 ± 0.0 1.0 ± 0.1
Green basil 8.4 ± 0.4 6.6 ± 0.3 2.7 ± 0.2
Green daikon radish 6.1 ± 0.1 4.5 ± 0.1 1.7 ± 0.0
Magenta spinach 5.3 ± 0.3 3.2 ± 0.2 3.7 ± 0.5
Mizuna 7.6 ± 0.4 5.2 ± 0.3 2.4 ± 0.1
Opal basil 6.1 ± 0.4 5.3 ± 0.3 2.0 ± 0.0
Opal radish 6.3 ± 1.0 5.5 ± 0.9 2.3 ± 0.4
Pea tendrils 8.2 ± 1.1 7.3 ± 1.2 3.9 ± 1.4
Peppercress 11.1 ± 0.6 7.7 ± 0.4 3.1 ± 0.2
Popcorn shoots 0.6 ± 0.1 1.3 ± 0.1 0.9 ± 0.1
Purple kohlrabi 5.7 ± 0.2 4.0 ± 0.1 1.5 ± 0.0
Purple mustard 5.6 ± 0.4 6.4 ± 1.9 1.0 ± 0.2
Red beet 7.7 ± 0.1 5.5 ± 0.0 3.7 ± 0.0
Red cabbage 11.5 ± 1.2 8.6 ± 1.0 2.9 ± 0.3
Red mustard 6.5 ± 0.4 4.9 ± 0.3 1.7 ± 0.1
Red orach 6.3 ± 0.3 3.9 ± 0.2 3.2 ± 0.2
Red sorrel 12.1 ± 0.6 8.8 ± 0.2 3.6 ± 0.1
Sorrel 5.2 ± 1.0 4.2 ± 0.8 1.3 ± 0.3
Wasabi 8.5 ± 0.2 6.6 ± 0.3 2.2 ± 0.2
Coefficient of Variation 31% 18% 18% a Values are expressed as mean ± standard error (n=3).
(Ma & Lin, 2010). In the analysis of lutein and zeaxanthin, these two isomers were
co-eluted in HPLC system, so all the values were calculated based on the area under
the curve of lutein standard and expressed in lutein equivalents but represented as the
sum of lutein and zeaxanthin. While all 25 microgreens assayed in this study
contained lutein and zeaxanthin (Table 2.4), cilantro had the highest
lutein/zeaxanthin levels with 10.1 mg/100g FW. Red sorrel, red cabbage and garnet
Page 45
33
amaranth microgreens followed with lutein/zeaxanthin concentrations of 8.8, 8.6 and 8.4
mg/100g FW, respectively. These values were higher than that of mature spinach (7.2
mg/100g FW) , which contains high quantities of lutein/zeaxanthin (Perry et al., 2009).
The lowest concentration of lutein/zeaxanthin, 1.3 mg/100g FW was found in popcorn
shoots. According to the USDA National Nutrient Database (2011), it was determined
that the values of lutein/zeaxanthin in raw mature cilantro and red cabbage were 0.9 and
0.3 mg/100g FW, respectively, which contrasted with the more abundant concentrations
in their microgreens counterparts which had 11.2 times and 28.6 times greater
lutein/zeaxanthin concentrations, respectively. These findings suggest that these
immature leaves of the microgreens tend to possess higher lutein/zeaxanthin
concentration than their fully-grown plant counterparts (USDA, 2011).
2.4.4.3 Violaxanthin
Violaxanthin is a natural orange-colored carotenoid found in photosynthetic organs of
plants. The concentrations of violaxanthin in the 25 microgreens varied considerably with
cilantro microgreens containing 7.7 mg/100 g FW violaxanthin while popcorn shoots and
golden pea tendrils only containing 0.9 and 1.0 mg/100 g FW violaxanthin, respectively
(Table 2.4). The rest of the microgreens had violaxanthin ranged from 1.3 to 4.3 mg/100
g FW. The maximum concentration of violaxanthin in cilantro microgreens was more
than 5-fold than that of mature cilantro leaves (1.4 mg/100 g FW) and 2.8 times than that
of mature spinach (2.7 mg/100 g FW), both of which are considered as good sources of
violaxanthin (Bunea et al., 2008; Kobori & Arnaya, 2008). Twenty-two out of the 25
microgreens assayed possessed violaxanthin concentration higher than mature cilantro,
and 40% of them were at levels equal to or higher than commonly consumed mature-leaf
spinach and baby-leaf spinach (Lester et al., 2010a).
Page 46
34
Fig. 2.3 HPLC chromatograms of carotenoid standards (A) and extraction of
cilantro microgreens (B).
β-Apo-8‟-carotenal is the internal standard and lutein and zeaxanthin are co-eluted.
HPLC conditions are described in the materials and methods.
2.4.5 Tocopherol Concentrations
Tocopherols and tocotrienols are together summarized as “vitamin E”, known as fat
soluble antioxidants. Each group has four isomers (α-, β-, γ- and δ-). The most active
form of all the tocopherols is α-tocopherol, while γ-tocopherol is the most abundant
one in plants (Schwartz et al., 2008). In this study, α-and γ-tocopherol contents for the
25 different microgreens varieties are summarized (Table 2.5) and the HPLC
chromatogram of tocopherol standards and extraction of green daikon radish
microgreens was shown in Fig. 2.4. Green daikon radish has extremely high α-
tocopherol and γ-tocopherol contents of 87.4 and 39.4 mg/100 g FW, respectively. In
Page 47
35
addition, cilantro, opal radish and peppercress microgreens are also excellent sources
of α-tocopherol and γ-tocopherol, with the α-tocopherol concentrations ranging from
41.2 to 53.1 mg/100 g FW, and γ-tocopherol values from 12.5 to 16.7 mg/100 g FW.
Even though the values of α-tocopherol (4.9 mg/100g FW) and γ-tocopherol (3.0
mg/100g FW) in golden pea tendrils were among the lowest of the 25 microgreens,
their values were still markedly higher than those for more mature spinach leaves (2.0
and 0.2 mg/100g FW, respectively) (USDA, 2011). Red cabbage microgreens
contained over 40 times the vitamin E content of that in its mature counterpart (0.06
mg/100 g FW) reported by Podsedek et al. (2006).
Fig. 2.4 HPLC chromatogram of tocopherol standards (A) and extraction of
green daikon radish microgreens (B).
Page 48
36
Table 2.5 α-Tocopherol and γ-tocopherol concentrations in 25 commercially
grown microgreensa.
Microgreens name α-Tocopherol (mg/ 100 g FW) γ-Tocopherol (mg/ 100 g FW)
Arugula 19.1 ± 4.3 7.1 ± 2.4
Bull's blood beet 18.5 ± 2.5 5.0 ± 0.7
Celery 18.7 ± 5.1 6.1 ± 1.4
China rose radish 19.7 ± 3.1 7.5 ± 1.1
Cilantro 53.0 ± 13.5 12.5 ± 2.0
Garnet amaranth 17.1 ± 2.1 11.2 ± 1.3
Golden pea tendrils 4.9 ± 0.3 3.0 ± 0.2
Green basil 19.9 ± 0.3 6.0 ± 0.4
Green daikon radish 87.4 ± 15.9 39.4 ± 7.8
Magenta spinach 14.2 ± 3.3 5.1 ± 0.8
Mizuna 25.0 ± 3.7 9.6 ± 1.4
Opal basil 24.0 ± 2.1 8.3 ± 0.8
Opal radish 47.7 ± 14.6 16.7 ± 5.3
Pea tendrils 35.0 ± 6.8 8.3 ± 2.0
Peppercress 41.2 ± 3.7 14.5 ± 1.4
Popcorn shoots 7.8 ± 0.1 3.5 ± 0.0
Purple kohlrabi 13.8 ± 1.0 5.6 ± 0.4
Purple mustard 18.6 ± 1.3 7.0 ± 0.7
Red beet 34.5 ± 2.3 8.3 ± 0.6
Red cabbage 24.1 ± 5.5 10.3 ± 3.1
Red mustard 22.1 ± 1.9 8.2 ± 0.7
Red orach 18.3 ± 2.8 7.0 ± 0.9
Red sorrel 21.8 ± 1.2 7.7 ± 0.5
Sorrel 9.3 ± 1.5 3.1 ± 0.5
Wasabi 18.7 ± 2.9 7.6 ± 1.0
Coefficient of Variation 20% 16% a Values are expressed as mean ± standard error (n=3).
2.5 Conclusions
In summary, the phytonutrient contents of 25 commercially available microgreens
varieties have been determined. In general, microgreens contain considerably higher
concentration of phytonutrients than their mature plant counterparts, although large
variations were found among these 25 species tested. Maximum values of vitamin C,
vitamin K1, and vitamin E were found in red cabbage, garnet amaranth and green
daikon radish microgreens, respectively. In terms of carotenoids, cilantro microgreens
Page 49
37
showed the highest concentration of lutein/zeaxanthin and violaxanthin and ranked
second in β-carotene concentration. In contrast, popcorn shoots and golden pea
tendrils were relatively low in phytonutrients, although they were still comparable
nutritionally to some commonly consumed mature vegetables. It is also noted that
golden pea tendrils, which is grown in the absence of light, processed much lower
phytonutrient concentrations than pea tendrils grown under light, suggesting that light
plays an important role on nutritional values during the growth of microgreens. The
data generated by this research likely provides a scientific basis for evaluating the
phytonutrient concentration of microgreens cotyledon leaves. It can also be used as a
possible reference in estimating the dietary intake and adequacies of vitamins from
microgreens. However, since growing, harvesting, and postharvest handling
conditions may have a considerable impact on the synthesis and degradation of
phytonutrients, additional studies maybe needed to evaluate the effect of these
agricultural practices on phytonutrient retention.
Page 50
38
Chapter 3: Evaluation and Correlation of Sensory, Chemical
and Nutritional Quality Characteristics of Microgreens
3.1 Abstract
Sensory attributes, chemical compositions and nutritional values of six varieties
of microgreens representing one or more of the sensory categories: mustard, herbal,
veggie, mild or peppery/radish were selected from 25 varieties of microgreens by a
preliminary in-house panel. Consumer acceptance of the 6 microgreen varieties was
carried out by 80 consumer panelists. Representing the „veggie‟ category, Bull‟s
blood beet (Beta vulgaris L.) was rated highest in acceptability of appearance,
texture, flavor and overall eating quality. In contrast, peppercress (Lepidium
bonariense L.) representing the peppery/radish category, was scored lowest in
acceptability of flavor and overall eating quality. Chemical compositions and
nutritional values differed among six varieties. China rose radish (Raphanus sativus
L.) had the highest titratable acidity and total sugars, while red amaranth (Amaranthus
tricolor L.) had the highest pH value and lowest total sugars. The highest amounts of
total ascorbic acid, phylloquinone, carotenoids, tocopherols and total phenolics were
found in China rose radish, opal basil (Ocimum basilicum L.), red amaranth, China
rose radish and opal basil, respectively. The relationships between sensory-sensory
and sensory-chemical attributes were further studied. Overall eating quality of
microgreens was best correlated with flavor scores. The pH values and total phenolic
contents were strongly correlated with flavor-related sensory attributes (such as
sourness, astringency, bitterness, etc.) and overall eating quality. Overall, all the
Page 51
39
microgreens evaluated in this study demonstrated “good” to “excellent” consumer
acceptance and nutritional profile.
3.2 Introduction
Microgreens is a new specialty food product, which has garnered more attention
in US. They are tiny version of regular plants produced from the seeds of vegetables,
herbs and grains. They have two fully developed cotyledonary leaves with the first
pair of true leaves emerging or partially expanded. Microgreens are usually 2.5−7.6
cm (1−3 in.) in height and harvested at 7−14 days after germination, depending on the
species, and sold with the stem and attached cotyledons (seed leaves). Although small
in size, microgreens can provide surprisingly intense flavors, vivid colors, and crisp
textures and can be served as an edible garnish or a new salad ingredient. In recent
years, microgreens have become a new culinary trend, currently being served in
upscale restaurants and showing up in some grocery stores such as Whole Foods and
Mom‟s (Brentlinger, 2005). Our previous study has found that microgreens were
generally packed with more phytonutrients (such as α-tocopherol, β-carotene and
ascorbic acid) than their mature plants (Xiao et al., 2012), which made them even
more popular.
As known, sensory evaluation is very important for food quality control and
product development because it could provide direct information of product related to
future salability. In general, the overall eating quality of fresh produce is related to
several sensory attributes, including appearance, texture, flavor, sound and feel
aspects. Among all the quality attributes, appearance is the initial quality attribute that
attracts consumers to a fruit or vegetable product, and affects their choice in the first
Page 52
40
phase of purchase; however, other organoleptic characteristics (e.g., flavor and
texture) play a crucial role in consumer satisfaction and future purchases (Barrett et
al., 2010; Francis et al., 2012). As consumers desire more and more nutritious and
healthy foods, nutritional values of food are often intwined in consumers‟ purchasing
decision.
To date, no comprehensive study has been performed on the emerging food
product: microgreens. Therefore, the objective of this study is 1) to assess sensory
properties and consumer acceptance of microgreens; 2) to investigate the
relationships between chemical compositions and sensory attributes of microgreens;
3) to identify chemical measurements that may predict overall eating quality and
consumer acceptability of microgreens; and 4) to evaluate the nutritional quality of
microgreens.
3.3 Materials and Methods
3.3.1 Sample Materials
All the microgreens evaluated in this study were generously donated by Fresh
Origins Farm (San Diego, CA, USA). They were grown in peat moss in unheated
greenhouses under ambient light and harvested without roots. Samples were then
immediately packed in clamshell containers (113.4 g of each ✕ 3 containers) and
shipped overnight in a cardboard box with foam and ice packs inside. All microgreens
were received as bare-root seedlings at ARS Beltsville Agricultural Research Center,
Beltsville, MD, where the samples were inspected to remove any defective
microgreens before being used for sensory analysis. Sub-samples of each container
used for chemical analysis were immediately weighed and freeze-dried for HPLC
Page 53
41
analysis or juiced for titratable acidity and pH analysis. The remainder of the samples
was stored in 1°C for 1 d prior to sensory analyses.
3.3.2 Sensory Evaluation
3.3.2.1 Descriptive analysis
So far, there is no lexicon for sensory properties of microgreens; therefore, an
appropriate sensory ballot specifically for microgreens was developed for the
following sensory tests. In this study, descriptive sensory analysis was first profiled.
A qualitative sensory profile of microgreens was developed by an 8-member panel in
which everyone had much experience on sensory evaluation of produce. The sensory
components included appearance, texture, aroma, taste and flavor of microgreens.
The sensory terminology and language was generated, developed and justified by
evaluating 25 commercially available microgreens in five different sessions on May
4, May 10, May 11, May 17 and June 20, respectively. The 25 varieties of
microgreens were then classified into five categories by the panel, mainly based on
their flavor characteristics.
3.3.2.2 In-house Preliminary Test
After the sensory ballot (Table 3.1) was developed and flavor categories were
established, an in-house preliminary test was conducted. Based on the perceived
sensory characteristics, the 25 varieties of microgreens were sorted into five
categories, namely: mustard group, herbal group, veggie group, mild group and
peppery/radish group, respectively. The category/group information on their
commercial names and scientific names were listed in Table 3.2. To select the most
liked microgreens in each category, an in-house preliminary sensory test using 8 staff
Page 54
42
members (4 males and 4 females) who like eating vegetables, but were not involved
in the microgreens sensory study.
Table 3.1 On-screen ballot for sensory attributes scored from 0 to 100 in line
scale for microgreens sensory evaluation.
Sensory Attributes Left end
(Score = 0)
Right end
(Score = 100)
Intensity of Aroma None Very strong
Intensity of Astringency
(drying, roughing and puckering mouth feel)
None Very strong
Intensity of Bitterness None Very strong
Intensity of Grassy
(Earthy, herbal or having a flavor of grass)
None Very strong
Intensity of Heat
(peppery, spicy or pungent)
None Very strong
Intensity of Sourness None Very strong
Intensity of Sweetness None Very strong
Intensity of Texture Tender Tough
Acceptability of Appearance Bad Excellent
Acceptability of Texture Bad Excellent
Acceptability of Flavor Bad Excellent
Acceptability of Overall eating quality Bad Excellent
Microgreens representing the mustard and herbal, veggie, mild, and
peppery/radish categories were received in the mornings of October 25, November 1
and November 27, 2012, respectively. The sensory evaluations were conducted
immediately in the afternoons of receiving dates. All the samples were washed using
tap water thoroughly and spun to remove excess water on the surface. The
microgreens representing each of the five categories were evaluated consecutively
and there was a 10-minute break between two sessions. All sensory evaluations were
carried out on computers by using the previously designed ballot (Table 3.2) derived
from Compusense ®
5.0 sensory software (Guelph, Ontario, Canada). Previous tests
had indicated that five grams of microgreens were sufficient for rating all the sensory
quality attributes; therefore, five grams of microgreens were placed into a sample
Page 55
43
container, which was labeled by a unique 3-digit random number and served in a
random order.
3.3.2.3 Consumer Acceptance Test
Selected microgreens from each the five categories were evaluated in the
consumer acceptance test, which was conducted in Beltsville, MD on February 13 to
February 15, 2013. They are beet bull‟s blood, China rose radish, Dijon mustard, opal
basil, peppercress and red amaranth, respectively. Pictures of selected microgreens
evaluated in this study are presented in Fig. 3.1.The 80 consumer panelists were
comprised of volunteer Beltsville Agricultural Research Center staff and University
of Maryland students, who like vegetables, eat them frequently and had no knowledge
of this experiment. Acceptability of appearance, texture, flavor and overall eating
quality and intensity of aroma, texture, astringency, bitterness, grassy, heat, sourness
and sweetness were evaluated from 5 g of sample. In the end, the demographic (age,
gender, and ethnicity) information of each panelist was asked. There were eight
sessions in total and 10 panelists per session. Between sessions, all the samples were
kept in refrigerator (4 °C) and maintained at room temperature for 15 minutes before
serving. The sensory evaluation was conducted in the same way mentioned in 3.3.2.2.
3.3.3 Chemical Analysis
The titratable acidity (TA) was measured by titrating 10 mL aliquot of the
microgreens juice with 0.1 N NaOH to the end point of pH 8.1, monitored with a pH
meter (S20 SevenEasy™, Mettler-Toledo International Inc., Columbia, MD, USA) at
21 °C. The results were expressed as percentage of citric acid. The pH measurements
were performed using a digital pH meter.
Page 56
44
Table 3.2 Commercial names and scientific names of 25 commercially
available microgreens in five groups evaluated in the in-house preliminary
sensory test.
Category Commercial name Scientific name
Mustard
Arugula Eruca sativa Mill.
Dijon mustard Brassica juncea (L.) Czern.
Mizuna Brassica rapa L. ssp. nipposinica
Red mustard Brassica juncea (L.) Czern.
Wasabi Wasabia japonica Matsum.
Herbal
Cilantro Coriandrum sativum L.
Italian basil Ocimum basilicum L.
Opal basil Ocimum basilicum L.
Red sorrel Rumex acetosa L.
Sorrel Rumex acetosa L.
Veggie
Brussel sprout Brassica oleracea L. var. gemmifera
Bull‟s blood beet Beta vulgaris L.
Celery Apium graveolens L.
Merlin beet Beta vulgaris L.
Red cabbage Brassica oleracea L. var. capitata
Mild
Magenta orach Atriplex hortensis L.
Pak choy Brassica rapa L. var. chinensis
Popcorn shoots Zea mays L.
Red amaranth Amaranthus tricolor L.
Tuscan kale Brassica oleracea L.
Peppery/Radish
China rose radish Raphanus sativus L.
Daikon radish Raphanus sativus L.
Peppercress Lepidium bonariense L.
Purple kohlrabi Brassica oleracea L. var. Gongylodes
Ruby radish Raphanus sativus L.
Sugar content of microgreens was analyzed following the procedure of Stommel
(Stommel, 1992) with some modifications. Sugars were extracted using ethanol:
Milli-Q water (80: 20, v/v). The mixture was eluted through a C18 Sep-Pak cartridge
(Water Corp., Milford, MA, USA) prior to filtering through a 0.45 µm membrane
filter. Sugars were determined on HPLC using a carbohydrate analysis column
(Waters Corp., Milford, MA, USA) with an isocratic mobile phase of acetonitrile:
water (75:25, v/v) at the flow rate of 1 mL/min. Individual sugar was detected on a
Page 57
45
refractometer (model 410, Waters Corp., Milford, MA, USA). Total sugar content
was expressed as the sum of fructose, glucose and sucrose contents.
3.3.4 Phytonutrient Analysis
3.3.4.1 Ascorbic Acid
Total ascorbic acid (TAA) and free ascorbic acid (AA) were determined using a
reverse phase high performance liquid chromatography (RP-HPLC) according to the
method of Bartoli et al. (2006) with modifications. In this assay, dehydroascorbic acid
(DHA), the oxidized form of AA, was reduced to AA for TAA determination. Fresh
tissue (3 g) was ground in 10 mL of ice-cold 5% (w/v) meta-phosphoric acid at the
speed of 15,000 rpm for 1 min in ice-water bath using a polytron homogenizer
(Brinkman Instruments, Westbury, NY, USA). The mixture was centrifuged at 7000 g
(Beckman J2-MI, Beckman Coulter, Inc., Irving, TX, USA) for 15 min at 4 °C, and
the supernatant was filtered through Whatman #4 filter paper (Millipore Corp.
Bedford, MA, USA). Ascorbic acid was detected with a photodiode array detector
(DAD) (Model: G1315C) on an Agilent 1200 series HPLC system (Agilent, Santa
Clara, CA, USA) at 243 nm. The extract was filtered through a 0.22 μm nylon syringe
filter (Millipore, Bedford, MA, USA) and then directly injected (vol. = 10 µL) into
the HPLC and run through a C18 column (Luna, 5 µm, 250 ✕ 2.0 mm, Phenomenex,
Torrance, CA, USA) with an isocratic mobile phase (100 mM phosphate buffer, pH =
3.0) flowing at the rate of 0.6 mL/min. Total AA was determined by HPLC after
reducing DHA by mixing the same volume of the sample filtrate with 5 mM
dithiothreitol (DTT) in 150 mM phosphate buffer (pH = 7.4 with 5 mM EDTA) for
15 min in darkness. Concentrations of TAA and AA were quantified based on peak
Page 58
46
areas using a reduced ascorbic acid standard curve (R2 ≥ 0.99), and their difference
was equal to the concentration of DHA.
3.3.4.2 Phylloquinone
Phylloquinone was extracted under dim light and determined by RP-HPLC, as
described in 2.3.3.3.
3.3.4.3 Carotenoids and tocopherols
Carotenoids and tocopherols were simultaneously determined using an isocratic
RP-HPLC according to the procedure previously established in our laboratory, as
described in 2.3.3.2.
3.3.4.4 Total phenolic content
Total phenolic concentration (TPC) was measured using Fast Blue BB (FBBB)
assay developed by Medina (2011) and modified for chlorophyll-containing tissue by
Lester et al. (2013). Briefly, lyophilized microgreens sample (100 mg) was extracted
with 10 mL of 80% MeOH by sonicating for 30 s. Hexane (4 mL) was then added
into the extraction mixture to remove chlorophyll. After sonication for 30 s and
centrifugation at 6650 x g for 5 min at 4 °C, the hexane layer was removed and
discarded. The hexane wash procedure was repeated two more times. The washed
methanolic extract was filtered through Whatman Grade No. 4 filter paper (Millipore
Corp., Bedford, MA, USA) and then diluted with DI H2O to the appropriate
concentrations. One milliliter of diluted sample, gallic acid standard or DI H2O blank
control was added to borosilicate tubes, followed by 0.1 mL of 0.1% FBBB [4-
benzoylamino-2, 5-dimethoxybenzenediazonium chloride hemi (zinc chloride) salt].
Page 59
47
The solution was mixed for 30 s, followed by adding 0.1 mL of 5% (w/v) NaOH, and
mixed and incubated for 90 min under light at room temperature. Absorbance was
measured at 420 nm. The total phenolic concentration of samples was measured
against the gallic acid (GA) calibration standard (concentrations of 0, 10, 50, 100, 200
250, 500 mg/L) and the results were expressed as milligram of gallic acid equivalents
(GAE) per gram of dried weight sample.
3.3.5 Statistical Analysis
The sensory data of the in-house preliminary test was analyzed by PROC MIXED
and overall acceptability was ranked by PROC RANK (SAS 9.2, SAS Institute, Inc.,
Cary, NC, USA). The distribution of sensory data in consumer test was examined
using PROC UNIVARIATE and analyzed using PROC MIXED. Sources of variation
were varieties (6) considered fixed and the panel sessions (8) and panelists (80)
considered random. Relationships of variety preference relative to gender and age
were examined using analysis of covariance (ANCOVA). Chemical composition and
nutrient data were analyzed using PROC GLM for one-way analysis of variance
(ANOVA). Mean comparisons were evaluated using Tukey‟s honestly significant
difference (HSD) test with P value of 0.05. Data were also analyzed using PROC
CORR to determine whether there were any correlations between different sensory
quality attributes and between chemical composition and sensory quality attributes,
using Pearson correlation: (*), (**), and (***) are used in the text to indicate 0.05,
0.01 and 0.001 levels of significance, respectively. Sensory data was additionally
examined by Factor Analysis using PROC FACTOR to extract factors which could
describe variability shared in common among sensory attributes.
Page 60
48
3.4 Results and Discussion
3.4.1 Descriptive Analysis and Preliminary Test
A sensory ballot was developed as to describe the perceived sensory attributes of
microgreens by an 8-member panel (Table 3.1). Twelve sensory attributes were
defined and developed, including the intensity of aroma, texture, astringency,
bitterness, grassy, heat, sourness and sweetness and the acceptability of appearance,
texture, flavor and overall eating quality. Among them, some attributes were
specifically defined: astringency was defined as drying, roughing and puckering
mouth feel, grassy was defined as earthy, herbal flavor or having a flavor of grass and
heat was defined as peppery, spicy or pungent. In the preliminary screening test, one
or two microgreens were selected for each category/group. It is worthy note the
screening test was a preliminary test and not a consumer test; therefore, it was only
utilized to provide reference information to select several varieties of microgreens
used for the 80-panelist consumer test. All the data was not shown in this paper.
In the mustard category, Dijon mustard was selected as it showed highest scores
of heat flavor intensity and acceptability of flavor and second highest overall eating
quality, which could best represent the mustard group. In the herbal category, opal
basil was outstanding as it has highest intensity score of sweetness and lowest
intensity scores of bitterness, astringency, heat and sourness, which contributed to the
highest acceptability of flavor and overall acceptability. In the veggie category, bull’s
blood beet was highlighted due to the attractive red-greenish color. Besides, the
acceptability of flavor and overall eating quality of bull‟s blood beet was scored
Page 61
49
Fig. 3.1 Pictures of six varieties of microgreens evaluated in consumer
acceptance test.
A = Bull‟s blood beet; B = Red amaranth; C = Dijon mustard;
D = China rose radish; E = Peppercress; F = Opal basil.
Page 62
50
highest. In the mild category, red amaranth stood out from the rest with highest
scores of acceptability of appearance, flavor and overeall eating quality. In the
peppery/radish category, China rose radish was selected since it presented the
strongest heat/peppery flavor, which was the typical flavor of radish and chili pepper.
The good visual display of green leaves and red stems of China rose radish also
contribute to its good overall acceptability. Meanwhile, there was another one
drawing our attention: peppercress, which showed the highest intensity of aroma,
bitterness, astringency, sourness, sweetness and grassy and the second highest of heat.
Although the resultant flavor and overall acceptability of peppercress was rated
lowest, it was of great interest for us to further investigate its complex sensory
quality; therefore, peppercress was also included in the consumer test. Overall, six
varieties of microgreens were selected for the following consumer acceptance test,
which are Dijon mustard, opal basil, bull‟s blood beet, red amaranth, China rose
radish and peppercress, respectively.
3.4.2 Consumer Acceptance Test
The make-up of 80-member consumer panel and demographic information was
shown in Table 3.3. For all six microgreens evaluated, sensory scores of
acceptability of appearance/visual quality were excellent (scores > 70), with the
exception of opal basil, which was scored as good (scores of 40 to 70) (Saftner et al.,
2008), as shown in Table 3.4. Among all microgreens, scores were excellent for
acceptability of texture during chewing, with relatively high scores of 71.3 to 85.5.
Scores of acceptability of flavor were generally in the good range except peppercress,
Page 63
51
which was also scored as the lowest in overall eating quality. Since scores of overall
eating quality were good to excellent (in the range of ~40/39.7 to 76.5), all the six
microgreens were considered to be of at least acceptable/good eating quality, of
which bull‟s blood beet was scored highest and considered excellent with a score of
76.5.
Among all the six microgreens, they varied in all sensory quality scores. Bull‟s
blood beet was scored highest and peppercress was scored lowest in overall eating
quality while no significantly difference was found in other four varieties. Bull‟s
blood beet and red amaranth, each of which are partially/entirely red/garnet in color,
were scored highest and second highest in overall eating quality. Both bull‟s blood
beet and red amaranth were scored high for acceptability of appearance, texture and
flavor and for intensity of sweetness, meanwhile scored low for intensity of
bitterness, astringency, heat, sourness and textural toughness. Except for the high
intensity of heat, Dijon mustard has similar sensory quality characteristics to those of
bull‟s blood beet and red amaranth, and consequently it was also scored high in
overall eating quality (No. 3).
In contrast, peppercress was scored highest in the intensity of astringency,
bitterness and sourness and high in the grassy, heat, sourness, and lowest in the
acceptability of flavor, resulting in the lowest score of overall eating quality. Overall,
higher bitterness and astringency ratings for peppercress, Dijon mustard and China
rose radish microgreens (both in Brassicaceae family) were likely to be associated
with the presence of high concentrations of glucosinolates, which are widely
recognized as bitter compounds. These results suggest flavor (such as astringency,
Page 64
52
Table 3.3 Age, gender and ethnicity make-up of consumer panel.
Age (years) Ethnicity (%)
20 or less 21 to 30 31 to 40 41 to 50 51 to 60 61 or older Total (%) Black/African-
American
4
Female 3 10 7 10 11 5 46 (58%) Asian 25
Male 2 3 8 5 10 6 34 (42%) Hispanic 4
Total 5 (6%) 13 (16%) 15 (19%) 15 (19%) 21 (26%) 11 (14%) 80 (100%) White 66
Table 3.4 Intensity and acceptability of microgreen sensory attributes by consumer panel across age, gender and ethnicity.
Intensity of
(rating 0 to 100)
Acceptability of
(rating 0 to 100)
Microgreens
Aroma
Astringency
Bitter
Grassy
Heat
Sour
Sweet
Texture
Texture
Flavor
Appearance
Overall
Eating
Quality
Bull‟s blood beet 20.0 c 19.3 c 31.0 bc 61.0 ab 12.7 d 13.3 b 14.4 a 23.7 b 85.5 a 66.9 a 86.4 a 76.5 a
China rose radish 21.6 c 40.7 a 40.3 ab 58.2 ab 67.2 b 24.2 ab 8.6 a 40.3 a 72.2 b 52.5 bc 72.7 b 53.7 b
Dijon mustard 24.3 bc 35.5 ab 40.8 ab 50.2 b 86.2 a 24.0 ab 11.5 a 24.3 b 80.2 ab 54.9 ab 86.2 a 61.0 b
Opal basil 49.5 a 36.6 a 51.3 a 69.5 a 30.9 c 24.0 ab 8.7 a 32.6 ab 71.3 b 46.0 bc 55.9 c 49.0 bc
Peppercress 35.1 b 41.9 a 51.9 a 61.7 ab 66.0 b 29.5 a 10.4 a 29.3 ab 71.9 b 39.5 c 77.8 ab 39.7 c
Red amaranth 29.2 bc 23.1 bc 24.1 c 69.5 a 10.8 d 17.2 b 14.6 a 23.1 b 79.2 ab 59.1 ab 82.5 a 63.1 ab
Page 65
53
bitterness, and sourness) is a very important quality attribute determining the
acceptance of microgreens. The results are also consistent with previous reports that
bitter taste and astringency were identified as the main reason for consumers to reject
many vegetables containing phytonutrients (e.g. glucosinolates in Brassica
vegetables), despite their known health benefits (Drewnowski & Gomez-Carneros,
2000).
Fig. 3.2 Factor analysis of sensory data for six varieties of microgreens evaluated
in consumer acceptance test.
Page 66
54
Factor analysis was conducted on the sensory data to identify variability shared in
common among the sensory attributes for all the six microgreens. Bull‟s blood beet
and red amaranth which had generally high scores of overall eating quality, had
positive scores for Factor 1 (explaining 50.1% of variation observed among the
sensory descriptors), with high loading values of the acceptability of flavor, texture
and appearance and the intensity of sweetness (Fig. 3.2). Likewise, the varieties
(China rose radish, opal basil and peppercress) that had generally low scores of
overall eating quality showed negative scores for Factor 1 and the variety (Dijon
mustard) that had generally intermediate score of overall eating quality was scored
near zero for Factor 1. Meanwhile, Factor 2 explained 37.0% of the variation
observed among the sensory descriptor and the intensity of aroma, heat, grassy,
sourness, astringency, bitterness and texture loaded onto this factor. Varieties
(peppercress, opal basil, China rose radish and Dijon mustard) that scored generally
high for the intensity of aroma, heat, grassy, sourness, astringency, bitterness and
texture had positive scores for Factor 2 and varieties (red amaranth and bull‟s blood
beet) that scored generally low in these sensory attributes had negative scores for
Factor 2. To sum up, factor analysis suggested that bull‟s blood beet, red amaranth
and Dijon mustard had higher sensory quality than China rose radish, opal basil and
peppercress with bull‟s blood beet having the best and peppercress having the lowest
overall eating quality, which was very similar to the results from other statistical
analyses as described above.
In addition, we compared the intensity and acceptability sensory scores of six
microgreens by gender (Table 3.5). Across age and ethnicity, no significant
Page 67
55
differences were found between female and male in all the sensory attributes of six
microgreens, except for the acceptability of flavor and overall eating quality of Dijon
mustard. Surprisingly, female and male showed significantly different (P = 0.001)
perception on Dijon mustard microgreens, with female demonstrating much lower
acceptability scores of flavor and therefore overall eating quality.
3.4.3 Relationships between Sensory Attributes
In order to more accurately assess the impact of each sensory quality
characteristic on overall eating quality, the relationships among sensory attributes
were investigated. For all microgreens, overall eating quality was most strongly
correlated with acceptability of flavor (r = 0.98***). Overall eating quality was also
strongly correlated with scores of acceptability of texture (r = 0.82***) and intensity
of sourness (r = -0.87***), bitterness (r = -0.71***), astringency (r = -0.66**),
sweetness (r = 0.61**). Additionally, eating quality scores were weakly correlated
with score of acceptability of appearance (r = 0.49*) and intensity of aroma (r = -
0.53*). Acceptability of flavor was correlated with the intensity of some flavor-
related characteristics: sourness (r = -0.84***), bitterness (r = -0.68**), astringency (r
= -0.57*) and sweetness (r = 0.53*). These results suggest that flavor-related
characteristics best predict consumer preferences for overall eating quality, though
textural and visual quality characteristics also contribute. Among these flavor-related
characteristics, there were some inherent correlations. For example, intensity of
sourness was strongly correlated with intensity of astringency (r = 0.81***),
bitterness (r = 0.80***), and heat (r = 0.72***) and weakly correlated with intensity
of sweetness (r = -0.53*). Intensity of astringency was strongly correlated with
Page 68
56
intensity of bitterness (r = 0.77***) and heat (r = 0.70***). Intensity of bitterness was
correlated with intensity of sweetness (r = -0.67 **), which confirmed that sweetness
and bitterness are mutually suppressed in mixtures. All of these correlations showed
that flavor is a gestalt perception, which is very important to overall sensory
acceptance.
3.4.4 Chemical Composition
In general, TA and total sugar content are used to describe flavor of fruits and
vegetables (Francis et al., 2012). TA and sugar contents of six microgreens were
presented in Table 3.6. TA is related to the concentration of organic acids present in a
food, and it is commonly used as quality parameter. The TA of fresh microgreens,
expressed in grams of citric acid per 100 g of fresh microgreens, was between 0.09
and 0.019 g citric acid/100 g (Fig. 4). China rose radish and peppercress microgreens
showed the highest TA values and bull‟s blood beet microgreen was ranked the
lowest. Surprisingly, the TA data set perfectly matched with the sensory high and low
scores of sourness intensity in the same order, which suggests that the difference in
TA among varieties is large enough to impact sensory perception, especially for
sourness. Opposite to the TA, the lowest pH value was found in China rose radish
microgreen, and the highest ones were in bull‟s blood beet and red amaranth
microgreens.
Overall, total sugar contents were low and generally presented at about 1.0 g/100g
or less, with glucose (0.08–0.56 g/100g FW) and fructose (0.02–0.06 g/100g FW)
being the two major sugars in all microgreens. There was no report on sugar contents
of microgreens to date. Wills and coworkers reported the sugar content of bean
Page 69
57
a Values are expressed as mean ± standard error (n = 3). Values within the same column followed by the same letter are not significantly different
(P < 0.05). b N.S. = Non-significant (P < 0.05).
Table 3.5 Intensity and acceptability of microgreen sensory attributes by female and male consumer panelists across age and ethnicity a.
Intensity of
(rating 0 to 100)
Acceptability of
(rating 0 to 100)
Microgreens
Aroma
Astringency
Bitter
Grassy
Heat
Sour
Sweet
Texture
Texture
Flavor
Appearance
Overall
Eating
Quality
Female
Bull‟s blood beet 17.9 b 17.6 c 29.9 cd 62.5 ab 12.3 ef 10.8 c 11.0 ac 20.8 bc 86.4 a 68.4 a 87.6 a 79.2 a
China rose radish 20.1 b 44.4 a 41.4 ad 61.9 ab 68.0 bc 28.7 ab 7.1 ac 65.1 ab 71.4 bc 48.2 bd 72.3 bc 49.5 cd
Dijon mustard 25.8 b 39.8 ab 46.6 ac 55.7 bc 88.1 a 28.6 ab 8.6 ac 22.3 bc 79.2 ac 43.8 bd 88.3 a 50.0 cd
Opal basil 47.8 a 38.9 ab 51.3 ab 74.2 a 33.8 d 26.1 ab 5.2 c 30.8 ac 69.2 c 40.9 cd 56.1 c 41.8 d
Peppercress 33.6 ab 45.0 a 49.5 ab 62.9 ab 70.7 bc 31.7 a 6.5 bc 26.9 bc 71.2 ac 39.6 d 77.4 ab 38.4 d
Red amaranth 26.2 b 22.0 bc 25.1 d 63.0 ab 10.6 f 20.3 ac 15.1 a 18.6 c 78.6 ac 57.6 ac 81.7 ab 61.5 ac
Male
Bull‟s blood beet 22.1 b 21.5 bc 32.9 bd 58.8 ac 13.2 ef 16.8 ac 17.8 ab 27.6 bc 84.2 ab 64.8 ab 84.8 a 72.9 ab
China rose radish 23.7 b 35.8 ab 38.9 ad 53.3 bc 66.1 bc 18.0 ac 10.2 ac 47.3 a 73.3 ac 58.3 ad 73.2 bc 59.3 ad
Dijon mustard 22.3 b 29.6 ac 32.9 bd 42.7 c 83.6 ab 17.7 ac 14.4 ac 26.9 bc 81.5 ac 68.5 a 83.4 ab 72.1 ab
Opal basil 51.9 a 33.6 ac 51.2 ab 62.9 ab 27.0 de 21.2 ac 12.2 ac 35.1 ab 74.2 ac 52.8 ad 55.6 c 56.2 bd
Peppercress 37.2 ab 37.8 ab 55.0 a 60.0 ac 59.5 c 26.5 ac 14.4 ac 32.5 ac 72.9 ac 39.2 cd 78.3 ab 41.3 d
Red amaranth 33.2 ab 24.6 bc 22.9 d 71.6 ab 11.1 ef 12.9 bc 15.2 ac 29.1 ac 79.8 ac 61.2 ab 83.6 ab 64.7 ac
Female vs. Male
Bull‟s blood beet N.S.b N.S. N.S. N.S. N.S. N.S. N.S. N.S. N.S. N.S. N.S. N.S.
China rose radish “ “ “ “ “ “ “ “ “ “ “ “
Dijon mustard “ “ “ “ “ “ “ “ “ 0.001 “ 0.001
Opal basil “ “ “ “ “ “ “ “ “ N.S “ N.S
Peppercress “ “ “ “ “ “ “ “ “ “ “ “
Red amaranth “ “ “ “ “ “ “ “ “ “ “ “
Page 70
58
Table 3.6 Analysis of titratable acidity (TA), pH, fructose, glucose, sucrose and total sugar content of six varieties of microgreens
evaluated in consumer acceptance test a.
Microgreens TA
(% citric acid)
pH Fructose
(g/100 g FW)
Glucose
(g/100 g FW)
Sucrose
(g/100 g FW)
Total sugar
(g/100 g FW)
Bull‟s blood beet 0.09 ± 0.00 d 6.37 ± 0.13 a 0.33 ± 0.02 b 0.08 ± 0.01 cd 0.03 ± 0.00 abc 0.44 ± 0.03 ab
China rose radish 0.19 ± 0.00 a 5.67 ± 0.01 b 0.50 ± 0.07 ab 0.47 ± 0.08 a 0.06 ± 0.01 a 1.03 ± 0.17 a
Dijon mustard 0.16 ± 0.00 b 5.77 ± 0.07 b 0.40 ± 0.03 ab 0.35 ± 0.03 ab 0.02 ± 0.00 b 0.77 ± 0.06 ab
Opal basil 0.16 ± 0.00 b 5.82 ± 0.08 b 0.08 ± 0.01 c 0.08 ± 0.01 cd 0.04 ± 0.01 abc 0.20 ± 0.02 c
Peppercress 0.19 ± 0.00 a 5.86 ± 0.09 b 0.56 ± 0.06 a 0.26 ± 0.04 bc 0.06 ± 0.01 ab 0.88 ± 0.11 a
Red amaranth 0.13 ± 0.00 c 6.43 ± 0.03 a 0.13 ± 0.01 c 0.02 ± 0.00 d 0.02 ± 0.01 c 0.17 ± 0.00 c a Values are expressed as mean ± standard error (n = 3). Values within the same column followed by the same letter are not significantly different
(P < 0.05).
Page 71
59
sprouts at the same level of microgreens analyzed in our study (Wills et al., 1984). In
this study, high total sugar content did not result in particularly high scores of sweet
taste. China rose radish microgreens had the highest contents of total sugars, glucose
and sucrose, whereas it had the lowest score of sweetness intensity. Conversely, while
red amaranth microgreen had the lowest contents of total sugar, fructose, glucose and
sucrose, it was evaluated having the highest score of sweetness intensity. It was
reported that sweetness perception can be modified by acid levels and aroma
compounds (Tieman et al., 2012). The lowest score of sweetness in China rose radish
microgreens could be associated with its high content of acids, which offset the
perception of sweet taste. Correspondingly, red amaranth microgreens did show a
relatively low TA value, probably making the sweetness standing out of other flavors.
3.4.5 Phytochemical Concentrations
The results of phytochemical analyses on ascorbic acid, phylloquinone,
carotenoids, tocopherols and total phenolics of six microgreens were showed in Table
3.7 and Table 3.8. The TAA concentration in six microgreens ranged from 10.6 to
68.0 mg/100g FW. Among the six samples, China rose radish microgreens had the
highest TAA concentration, followed by Dijon mustard, peppercress and red
amaranth. Bull‟s blood beet and opal basil microgreens contained the relatively low
level of TAA. The phylloquinone concentration of all the six microgreens evaluated
was about the same level, ranging between 2.1 and 4.0 µg/ g FW. For carotenoids, red
amaranth had the highest amounts of β-carotene, lutein/zeaxanthin and violaxanthin,
followed by Dijon mustard, China rose radish and peppercress. All the carotenoid
data was consistent with those of our previous study (Xiao et al., 2012).Total
Page 72
60
Table 3.7 Analysis of water content, ascorbic acid (AA), dehydroascorbic acid (DHA), total ascorbic acid (TAA), phylloquinone (Vk1) and
total phenolics (TPC) of six varieties of microgreens evaluated in consumer acceptance test a.
a Values are expressed as mean ± standard error (n = 3). Values within the same column followed by the same letter are not significantly different
(P < 0.05).
Table 3.8 Analysis of β-carotene (β-C), lutein/zeaxanthin (L/Z), violaxanthin (VX), α-tocopherol (α-T), γ-tocopherol (γ-T) of six varieties of
microgreens evaluated in consumer acceptance test a.
Microgreens Carotenoids
(mg/100g FW)
Tocopherols
(mg/100g FW)
β-C L/Z VX α-T γ-T
Bull‟s blood beet 3.8 ± 0.3 d 3.5 ± 0.2 d 2.0 ± 0.0 bc 0.0 ± 0.0 c 0.1 ± 0.0 d
China rose radish 5.8 ± 0.3 b 5.1 ± 0.3 b 1.7 ± 0.2 bc 2.0 ± 0.2 a 0.5 ± 0.0 a
Dijon mustard 6.1 ± 0.1 b 4.7 ± 0.2 bc 2.3 ± 0.1 b 1.1 ± 0.0 b 0.3 ± 0.0 b
Opal basil 4.3 ± 0.2 cd 3.9 ± 0.2 cd 1.2 ± 0.1 c 0.0 ± 0.0 c 0.2 ± 0.0 cd
Peppercress 5.5 ± 0.1 bc 4.6 ± 0.1 bc 1.9 ± 0.0 bc 0.0 ± 0.0 c 0.3 ± 0.0 b
Red amaranth 8.1 ± 0.5 a 6.7 ± 0.3 a 4.2 ± 0.4 a 0.0 ± 0.0 c 0.2 ± 0.0 c a Values are expressed as mean ± standard error (n = 3). Values within the same column followed by the same letter are not significantly different
(P < 0.05).
Microgreens Water content
(%)
Ascorbates
(mg/100g FW)
Phylloquinone
(ug/g FW)
Total phenolics
(mg GAE/100g
FW)
AA DHA TAA Vk1 TPC
Bull‟s blood beet 95.1 ± 0.2 a 7.6 ± 0.2 a 5.6 ± 1.9 c 13.2 ± 1.9 c 2.1 ± 0.4 a 303.0 ± 9.8 c
China rose radish 92.1 ± 0.5 c 16.6 ± 10.2 a 51.4 ± 10.5 a 68.0 ± 3.6 a 3.2 ± 0.6 a 465.5 ± 15.9 b
Dijon mustard 94.3 ± 0.0 ab 22.6 ± 10.9 a 36.3 ± 10.8 abc 58.9 ± 0.8 a 3.2 ± 0.7 a 149.5 ± 3.9 d
Opal basil 94.3 ± 0.2 ab 2.0 ± 0.0 a 8.6 ± 0.5 bc 10.6 ± 0.5 c 4.0 ± 0.7 a 700.4 ± 9.7 a
Peppercress 93.8 ± 0.1 b 8.1 ± 2.9 a 37.9 ± 3.3 ab 46.0 ± 2.1 b 2.9 ± 0.7 a 274.7 ± 20.1 c
Red amaranth 93.5 ±0.2 b 12.6 ± 2.4 a 23.2 ± 3.4 abc 35.8 ± 2.7 b 2.3 ± 0.4 a 256.5 ± 12.0 c
Page 73
61
phenolic content (TPC) varied significantly among varieties from 149.5 to 700.4 mg
GAE/100 g FW in the six microgreens. The highest TPC was found in opal basil,
which was almost 5-fold higher than Dijon mustard, which surprisingly still contained
slightly higher TPC than some commonly consumed vegetables, e.g. broccoli (35-100
mg GAE/100 g) (Turkmen et al., 2005; Zhang & Hamauzu, 2004). The α-tocopherol
was not present in all the six microgreens. Only China rose radish and Dijon mustard
microgreens contained certain amounts of α-tocopherol, with the number of 2.0
mg/100 g FW and 1.1 mg/100 g FW, respectively. The γ-tocopherol concentrations
were ranging from 0.1 to 0.5 mg/100 g FW. These results on tocopherols were not in
accordance with our previous report, in which all the 25 microgreens were rich in
tocopherols. Nutritional profile of produce could be affected by many preharvest and
postharvest factors, such as seed source, growth location, growth environments,
storage time and duration. With respect to these phytonutrients, all the six
microgreens analyzed in our study could be considered to be good sources of
phytonutrients and antioxidants.
3.4.6 Relationships between Sensory and Chemical Attributes
The sensory evaluation provides information about the attributes of a product
from consumers‟ perspectives. However, it is usually difficult to recruit enough
consumers or trained panelists to get involved in sensory evaluations before a new
food product is marketed. Therefore, it is significant to develop a relationship
between the chemical composition of a product and its sensory attributes, as well as
between sensory perceptions and acceptability for consumers (Escribano et al., 2010).
Page 74
62
In our study, the TA values of all the six microgreens were not significantly
correlated with the intensity of sourness or any other sensory quality characteristics.
Not as expected, a negative correlation between TA and pH was not found in this
study, nevertheless, the tendency of TA and pH were almost in the opposite way.
Whilst, the pH values have correlations with many sensory attributes. It has a
significant correlation with acceptability of overall eating quality (r = -0.70***) and
flavor (r = -0.67**), intensity of bitterness (r = 0.77***), sourness (r = 0.60**) and
astringency (r = 0.52*), and negative correlation with sweetness (r = -0.50*),
suggesting that the pH value may be a good indicator for flavor and overall eating
quality. Many other researchers previously reported that astringency elicited by acids
was a function of pH and not concentration or anion species while sourness was
influenced by concentration, pH and anion species (Goldman et al., 1999; Lawless et
al., 1996; Sowalsky & Noble, 1988). This could explain why astringency was
correlated with pH (r = 0.52*), not TA, while sourness was correlated with pH (r =
0.60**) and not TA (r = 0.42, not significant).
Total sugar content was not correlated with the sensory scores of intensity of
sweetness but weakly and negatively correlated with intensity of bitterness (r = -0.45,
not significant). Sucrose content was negatively correlated with intensity of bitterness
(r = -0.62**) and sourness (r = -0.48*). Similarly, glucose was also negatively
correlated with bitterness (r = -0.62**). Sugars were not alone in accounting for
variation in the sweetness of fruits and vegetables, especially when the amount of
sugar was low. The perception of sweetness may be affected by other acidic or bitter
compounds present in fruits and vegetables (Keast & Breslin, 2003). Taking China
Page 75
63
rose radish as an example, the total sugar content of China rose radish was highest;
however, its intensity of sweetness score was the lowest. The difference between
sensory perception and chemical components could lie in the acid contents (Abbott et
al., 2004; Baldwin et al., 1998). The high acidity, shown as highest TA value and
lowest pH value, could make China rose radish taste less sweet. Similarly, red
amaranth that had the lowest total sugar content was scored highest for intensity of
sweetness, which was probably due to the low acidity, making red amaranth
perceived as much sweeter.
The TPC value was strongly correlated with overall eating quality (r = 0.66***)
and sensory scores of flavor-related attributes: intensity of astringency (r = -0.73***),
heat (r = -0.84***), sourness (r = -0.80***), bitterness (r = -0.60**) and sweetness (r
= 0.58**) and acceptability of flavor (r = 0.58*). It is well known that food
astringency is due to the presence of phenolic compounds, like procyanidins in many
fruits. In addition, phenolic compounds also contribute to the bitter taste (e.g.
flavanon neohesperidosides in citrus fruits) and pungent taste (e.g. capsaicins in chili
peppers) (Tomás‐Barberán & Espin, 2001). Based on the results obtained in current
study, the TPC value may be considered as an informative parameter in evaluating the
overall eating quality and flavor-related sensory attributes of microgreens. Therefore,
it is of significance to measure TPC value and appropriately interpret it into sensory
information.
In addition, some phytonutrient data also had relationship with the sensory
attributes. Violaxanthin has strong correlations with intensity of sourness (r =
0.77***) and bitterness (r = 0.60**), acceptability of flavor (r = -0.72***) and overall
Page 76
64
eating quality (r = -0.7***). Both α-tocopherol and γ-tocopherol had correlations with
bitterness (r = -0.64** and r = -0.61**, respectively). However, future work is
needed to further specify the inherent mechanism for those relationships.
3.5 Conclusions
In conclusion, six selected microgreens evaluated in our study varied in sensory
quality characteristics with consumer panel ranking bull‟s blood beet with the highest
preference and peppercress with the lowest acceptance. Among all the sensory quality
attributes tested, flavor quality attribute best predicted overall eating quality of
microgreens. Visual and textural quality attributes also affected consumer acceptance.
The pH and TPC values could be used as indicators to provide sensory information
and predict consumer acceptability. Overall, microgreens with good consumer
acceptability have a good nutritional profile and can provide health benefits to
consumers.
Page 77
65
Chapter 4: Postharvest Quality and Shelf Life of Radish
Microgreens as Impacted by Storage Temperature,
Packaging Film, and Chlorine Wash Treatment
Xiao Z., Luo Y., Lester G. E., Kou L., Yang T., Wang Q. (2013) LWT-Food Science
and Technology, 55 (2), 551-558.
4.1 Abstract
Microgreens are new and emerging products, which are young seedlings of
vegetables and herbs. Our previous study showed that microgreens contain higher
nutrients compared to their mature counterparts. However, they typically have a short
shelf life (1-2 days) at ambient temperature. The objective of this study was to
optimize postharvest handling conditions to reduce the quality loss and extend the
shelf life of daikon radish microgreens. Storage temperature, packaging film, and
wash treatment were investigated. Changes in headspace composition, quality index,
chlorophyll concentration, tissue electrolyte leakage, and aerobic mesophilic bacteria
(AMB) and yeast & mold (Y&M) counts were monitored periodically during storage.
Results indicated that 1) storage temperature significantly (P < 0.05) affected package
atmosphere, product quality and shelf life. One degree Celsius was the optimal
temperature for storage of radish microgreens with no chilling injury observed; 2)
film oxygen transmission rate (OTR) significantly (P < 0.05) affected O2 and CO2
composition, but OTR did not significantly affect quality attributes during 28 days of
storage at 1°C; 3) Chlorine wash treatment (100 mg/L) significantly reduced initial
Page 78
66
microbial populations by 0.5 log cfu/g, including AMB and Y& M. However,
microbial populations rebounded after day 7.
4.2 Introduction
Microgreens have gained popularity as a new culinary trend appearing in upscale
markets and restaurants over the past few years. They are tender cotyledonary-leaf
plants having vivid colors, intense flavors and tender textures; therefore, they are
usually served fresh as ingredients in salad, soups and sandwiches or used as an
edible garnish (Treadwell et al., 2010). In a recent study, we found that microgreens
generally contain higher concentrations of phytonutrients (such as α-tocopherol, β-
carotene and ascorbic acid) than their mature-leaf counterparts (Xiao et al., 2012).
However, microgreens are delicate and have a very short shelf life (1-2 days) at
ambient temperature; and as such are categorized to be highly perishable products
(Chandra et al., 2012).
Storage temperature is one of the most important factors affecting the postharvest
physiology and storage behavior of produce. In general, low temperature storage can
reduce quality loss and extend shelf life by depressing rates of respiration,
senescence, and growth of spoilage microorganisms (Manolopoulou et al., 2010;
Spinardi & Ferrante, 2012). Optimum storage temperature varies depending on the
fruit or vegetable. For some chilling sensitive fruits and vegetables, the use of low
temperature storage adversely affects quality attributes and causes deterioration more
rapidly (Galvez et al., 2010; Paull, 1999). Thus, the selection of optimum storage
temperature is crucial.
Page 79
67
Modified atmosphere packaging (MAP) is an effective technology for
maintaining freshness and prolonging shelf life of produce, which has been
successfully applied in fresh and minimally processed produce, such as lettuce
(Lactuca sativa L.), broccoli (Brassica oleracea L. cv. Acadi), spinach (Spinacia
oleracea L.) and mushrooms (Agaricus bisporus cv. U3 Sylvan 381) (Sandhya, 2010).
There are many factors influencing package atmosphere of products, including
product respiration rate, packaging film oxygen transmission rate (OTR), product
weight, package surface area, storage temperature and relative humidity (Sandhya,
2010). In food supply chains, package size and product weight are often pre-
determined. Selecting a packaging film with suitable OTR to match the product
respiration rate is the best way to maintain quality and extend shelf life of produce.
Consumer demand for fresh, convenient and nutritional foods have spurred a
recent rapid growth of the minimally processed fruit and vegetable (Kobori et al.,
2011). In the fresh-cut processing chain, chlorine-based solutions are very potent and
efficient sanitizers and have been widely used in the fresh-cut industry in the USA.
However, the use of chlorinated sanitizers is banned in some European countries due
to the potential risk of undesirable disinfection by-products (DBPs) upon reaction
with organic matters, such as chloroform (CHCl3), haloacetic acids or other
trihalomethanes (THMs) (Artes et al., 2009). In recent years, some alternatives have
been proposed, e.g. irradiation, ozone, electrolyzed water, essential oils, and organic
acids. However, none of them have gained widespread acceptance by the industry
(Rico et al., 2007).
Page 80
68
Currently, there is no ready-to-eat microgreens are commercially available in the
food supply chains due to their perishability and high price. Green daikon radish
(Raphanus sativus L.var. longipinnatus) is one of the most commonly-grown
commercial microgreens. It has an extraordinarily high concentration of α-tocopherol
(87.4 mg/100 g FW) (Xiao et al., 2012), which is an important lipid-soluble
antioxidant and can protect cell membranes from oxidative stress. Moreover, the
potent spicy flavor, bright green color and tender texture of daikon radish
microgreens are also favorable. However, little information is available on optimal
storage temperature, packaging film and wash treatment configuration of green
daikon radish microgreens. Therefore, the objectives of this study were 1) to optimize
storage temperature; 2) to evaluate the effect of packaging film OTR under optimum
storage temperature; and 3) to investigate the effect of chlorine wash treatment under
optimal storage temperature and packaging film OTR on maintaining quality and
prolonging shelf life of green daikon radish microgreens.
4.3 Materials and Methods
4.3.1 Sample Preparation
Green daikon radish (Raphanus sativus var. longipinnatus) seeds were purchased
from Living Whole Foods, Inc. (Springville, UT, USA). Seeds were sown in 28 cm
W ✕ 54 cm L ✕ 6 cm D culture trays (Vacuum-Formed Standard 1020 Open Flats
without holes, Growers Supply, Dyersville, IA, USA). The media was Fafard 3B
potting soil consisting of 45% peat moss, 15% vermiculite, 15% perlite and 25% bark
(Griffin Greenhouse & Nursery Supplies, Bridgeton, NJ, USA). Seeds were grown in
a temperature-controlled (25°C) growth chamber. During the first three days, the
Page 81
69
trays were covered and seeds were germinated in the dark. For the next 4 days, the
seedlings were exposed to light irradiance (42 µmol s-1
m-2
, determined by LI-1000
datalogger, LI-COR, Lincoln, NB, USA) for a 12-hr photoperiod. Seven-day-old
radish microgreens were harvested by cutting stem ends with scissors sterilized with
75 mL/100 mL alcohol. After harvest, radish microgreens were inspected prior to any
treatment and plants with defects were discarded.
4.3.1.1. Temperature Treatments
Fifteen grams of radish microgreens were packaged in polyethylene bags (15 cm
✕ 15 cm, Pacific Southwest Container Inc., Modesto, CA, USA) with film oxygen
transmission rate (OTR) of 16.6 pmol s-1
m-2
Pa-1
. All the bags were sealed and stored
at 1, 5, or 10°C cold rooms under dark for 14 days. Evaluations were performed on
day 0, 3, 7, 10 and 14. All treatments were conducted in four replicates.
4.3.1.2. Packaging Treatments
Radish microgreens (15 g) were packaged in 15 cm × 15 cm bags prepared from
polyethylene films with OTRs of 8.0, 11.6, 16.6, 21.4, or 29.5 pmol s-1
m-2
Pa-1
. The
permeability of the films was tested by the manufacturer (Pacific Southwest
Container Inc., Modesto, CA, USA) under conditions of 23°C and 101.3 kPa using a
MOCON apparatus according to ASTM F2714-08 and ASTM F2622-08 standards.
Four replicates of each treatment were prepared for each evaluation day (day 0, 7, 14,
21 and 28). All samples were stored at 1°C in a dark room for subsequent evaluation.
4.3.1.3. Wash Treatments
The sodium hypochlorite (NaOCl) wash solutions (50, or 100 mg/L free chlorine,
pH 6.5) were prepared using Clorox®
(6 mL/100 mL sodium hypochlorite, Clorox
Page 82
70
Co., Oakland, CA, USA) and the pH was adjusted with citric acid solution. All the
free chlorine levels before treatments were measured with a chlorine photometer (CP-
15, HF Scientific Inc., Fort Myers, FL, USA). Radish microgreen samples (350-400
g) were washed in pre-disinfected mesh bags with gentle agitation in 40 L wash
solutions at 20°C for 1 min, followed by rinsing with 20°C tap water for 1 min.
Washed samples were then centrifuged at 300 rpm for 3 min with a commercial T-
304 salad centrifugal dryer (Garroute Spin Dryer, Meyer Machine Co., San Antonio,
TX, USA) to remove excess surface water. Unwashed samples were used as controls.
Portions (15 g) of washed and unwashed radish microgreens were placed into
polyethylene bags (15 cm × 15 cm) with OTR of 29.5 pmol s-1
m-2
Pa-1
and stored at
1°C for 28 days in the dark. Four bags were randomly selected on each sampling day
(day 0, 7, 14, 21 and 28) for quality evaluations.
4.3.2 Headspace Gas Composition
The O2 and CO2 contents in the headspace of packages were analyzed using an
O2/CO2 gas analyzer (CheckMate II, PBI-Dansensor A/S, Ringsted, Denmark) by
inserting the needle of the measuring assembly through a septum adhered to the
packaging film.
4.3.3 Quality Index
4.3.3.1 Chlorophyll Analysis
Total chlorophyll content was determined spectrophotometrically using the
method of Auderset et al. (1986) with minor modifications. Excised radish
cotyledonary leaves (1.0 g) were transferred into 50-mL centrifuge tubes. After
homogenization in 10 mL 80 mL/100 mL acetone (HPLC-UV grade, Pharmco-Aaper,
Page 83
71
Brookfield, CT, USA) solution at the speed of 17, 500 rpm for 30 s (Adaptable
homogenizer, VDI 25, VWR International, West Chester, PA, USA), the mixture was
filtered (Grade 413 Filter Paper, Qualitative, VWR International, West Chester, PA,
USA) into a 25 mL amber volumetric flask and rinsed with 80 mL/100 mL acetone
solution until filter cake became colorless. The filtrate was diluted with 80 mL/100
mL acetone solution to 25 mL and stored at -20 °C until ready to measure.
Absorbance was read at 646, 663, and 710 nm (UV-1700 Spectrophotometer,
Shimadzu, Kyoto, Japan) and total chlorophyll was calculated by the following
formula:
Total chlorophyll (µg/g FW) =
[(A646 – A710) * 0.01732 + (A663 – A710) * 0.00718] * dilution volume (mL) * 1000/
fresh weight (g)
4.3.3.2 Electrolyte Leakage Analysis
Tissue electrolyte leakage was measured following a modified procedure from
Allende et al. (Allende et al., 2004). Radish microgreens (5 g) were submerged in 150
mL deionized water at 20 °C and shaken for 30 min. The electrolyte of the solution
was measured using a Model 135A Thermo Orion conductivity meter (Beverly City,
MA, USA). Total electrolytes were obtained after freezing the samples at -20 °C for
24 h and subsequent thawing. Tissue electrolyte leakage was expressed as a
percentage of the total electrolyte.
4.3.3.3 Overall Quality and Off-odor Evaluation
Overall visual quality and off-odor were evaluated following the procedure of
Luo et al. (2004) and Meilgaard et al. (1991). Briefly, the visual quality was evaluated
Page 84
72
on a 9-point hedonic scale, where 9, 8, 7 and 6 = like extremely, strongly, moderately
and slightly, respectively, 5 = neither like nor dislike and 1, 2, 3 and 4 = dislike
extremely, strongly, moderately and slightly, respectively. A score of 6 was
considered the limit of salability (Kim et al., 2004). Off-odor score was based on a 0
to 4 scale where 0 = no off-odor, 1 = slight off-odor, 2 = moderate off-odor, 3 =
strong off-odor, and 4 = extremely strong off-odor. All visual quality and off-odor
evaluation were carried out by three trained evaluators (1 male and 2 female, aged 28
and 43 years old). The evaluators have had over five-year of research experience with
fresh produce, especially performing sensory evaluation of leafy greens. Prior to the
start of this experiment, additional trainings specific to the organoleptic properties of
radish microgreens were provided to the evaluators.
4.3.3.4 Microbial Enumeration
Microbial growth on radish microgreens was assayed following a procedure from
Luo et al. (2004) and Allende et al. (2004b) with some modifications. Samples of 3 g
radish microgreens were macerated with 27 mL sterile phosphate buffered saline
(PBS, 10 ✕ solution, Fisher Scientific, Pittsburgh, PA, USA) with a stomacher
blender (Model 80, Seward Medical, London, UK) for 2 min at high speed. A 50 µL
sample of each filtrate or its appropriate dilution was logarithmically spread on agar
plates with a Whitley automatic spiral plater (Wasp II, Don Whitley Scientific Ltd.,
West Yorkshire, UK). The aerobic mesophilic bacteria (AMB) population was
determined by plating samples on tryptic soy agar (TSA, Difco, Detroit, MI, USA)
and incubating at 28 °C for 24 h. Yeast and mold (Y&M) enumeration was performed
by culturing with potato dextrose agar (PDA, Difco, Detroit, MI, USA) supplemented
Page 85
73
with 200 mg L-1
chlorophenicol (Sigma-Aldrich, St Louis, MO, USA) and incubated
at room temperature (22 °C) for 44-48 h. Microbial colony counting was conducted
with a ProtoCOL automated colony counter (Synbiosis, Cambridge, UK) and reported
as log CFU/g of tissue.
4.3.4. Statistical Analysis
Four replicates from each treatment were evaluated on each sampling day. Data
was analyzed using SPSS 13.0 (SPSS Inc., Chicago, IL, USA) by one-way analysis of
variance (ANOVA). To determine the statistical significance of the data, Tukey‟s
honestly significant difference (HSD) test was conducted for post-hoc multiple
comparisons at a significance level of 0.05. All the data was reported as the mean of 4
replicates ± standard error (SE).
4.4 Results and Discussion
4.4.1 Effect of Temperatures on Quality and Shelf Life
The changes in headspace atmospheres of packaged radish microgreens were
significantly (P < 0.05) affected by storage temperature (Fig. 4.1A and 4.1B).
Packages stored at 10 °C experienced a rapid depletion of O2 and accumulation of
CO2, with the low O2 (9.1 kPa) and high CO2 (2.5 kPa) levels within the packages at
the end of 14-day storage. In contrast, all the packages stored at 1 and 5 °C
maintained a higher level of O2 (15.5 and 13.1 kPa, respectively) and a lower
concentration of CO2 (1.3 and 1.6 kPa, respectively) than the packages stored at
higher temperature 10°C. This is likely due to the lower respiration rate of the
samples stored at lower temperatures.
Page 86
74
Decrease in chlorophyll content is associated with cellular degradation and/or
senescence, which is often used to estimate quality loss of green vegetables (Hodges
et al., 2000). No information has been found specifically on total chlorophyll content
of microgreens. In this study, the initial chlorophyll content of radish microgreen
leaves was around 754 µg/g fresh weight (FW). As shown in Fig. 4.1C, total
chlorophyll content decreased in all samples through 14-day storage except for those
held at 1 °C, at which temperature samples maintained the highest chlorophyll
content (691.1 µg/g FW), and no apparent yellowing phenomenon was observed at
the end of the storage period. In contrast, samples stored at 10 °C were first to show
signs of yellowing on day 7, with a rapid decline in chlorophyll content with a final
value of 171.8 µg/g fresh weight. Decrease in chlorophyll content is clearly
temperature-dependant with lower temperature resulting in greater chlorophyll
retention. It is probably due to the reduction of metabolic activity on chlorophyll
degradation under low temperature (Pogson & Morris, 1997).
Tissue electrolyte leakage is an indicator of cell membrane damage (Fan &
Sokorai, 2005) and has been closely related to quality loss in fresh-cut produce during
storage (Kim et al., 2005; Luo et al., 2004). During this study, there was no
significant difference found in three temperature treatments (1, 5, and 10 °C) (Fig.
4.1D). All the samples showed minimal increase (0.3 - 0.9%) in electrical
conductivity during the entire 14-day storage, indicating that the samples stored at
low temperature did not lose cell membrane integrity. It was also suggested that
daikon radish microgreen is not susceptible to chilling injury (Chandra et al., 2012).
Page 87
75
Fig. 4.1 Effect of temperature on the changes in O2 (A) and CO2 (B) partial
pressures within packages, chlorophyll content (C), electrolyte leakage (D),
overall quality (E), off-odor (F), aerobic mesophilic bacteria (AMB) (G) and
yeast & mold (Y&M) (H) populations of packaged green daikon radish
microgreens using 16.6 pmol s-1
m-2
Pa-1
OTR film during storage (n = 4).
Vertical bar represents ± standard error.
Page 88
76
Overall visual quality and off-odor are important factors influencing the
marketability of a food product. In this experiment, storage temperature significantly
affected visual quality deterioration and off-odor development (Fig. 4.1E and 4.1F).
Throughout the whole 14-day storage period, radish microgreens stored at 1 °C were
rated highest in overall quality, followed by samples at 5 °C, with the final score of
7.9 and 6.5 on day 14, respectively. Samples stored at 10 °C maintained acceptable
visual quality (a score of 7.6) until day 7, however, after day 7, yellowing was
observed and all these samples experienced a sharp decline in overall quality which
became unacceptable (scored 4.8) within 10 days of storage, indicating that
temperature abuse is severely detrimental for the delicate radish microgreens. No off-
odor was detected on radish microgreens before day 7 for all treatments. On day 10,
all the three treatments displayed slight to moderate off-odor and the higher the
storage temperature was, the higher the intensity of off-odor was detected. At the end
of 14-day storage, only slight off-odors were detected (scored 0.5 and 1.0,
respectively) in the samples stored at 1 and 5 °C and moderate off-odor (scored 1.6)
was detected in 10 °C treatment. The development of off-odors had a positive
correlation with the decrease of O2 and the increase of electrolyte leakage, suggesting
that tissue senescence and deterioration resulted in cell membrane damage and
undesirable fermentative volatiles, such as ethanol and acetaldehyde (Kim et al.,
2005).
Changes in aerobic mesophilic bacteria (AMB) and yeast and mold (Y&M)
populations on radish microgreens stored at different temperatures were shown in
Fig. 4.1G and Fig. 4.1H. Storage temperatures significantly (P < 0.05) affected
Page 89
77
microbial growth rate. During the 14-day storage, AMB populations on radish
microgreens stored at 10 °C increased more rapidly than those stored at 1and 5 °C.
AMB populations at 10 °C increased by a total of 0.8 log cfu/g, compared to 0.1 and
0.2log for 1 and 5 °C, respectively. Y&M growth followed a similar trend. Low
temperature significantly inhibited the growth of AMB and Y&M and samples stored
at 1 °C maintained a relatively lower bacterial population than samples stored at 5 °C.
Storage temperature significantly affected the quality attributes and microbial
growth of green daikon radish microgreens. Samples stored at 1 °C maintained the
best quality during the 14-day storage; therefore, 1 °C was considered to be the
optimal storage temperature for green daikon radish microgreens and was selected for
the following packaging film and chlorine wash experiments.
4.4.2 Effect of Modified Atmosphere Packaging on Quality and Shelf Life
Packaging film OTR significantly (P < 0.05) affected the headspace O2 and CO2
concentrations of radish microgreens packages at 1°C (Fig. 4.2A and 4.2B).
Atmospheres in the packages prepared with higher OTR films (21.4 and 29.5 pmol s-1
m-2
Pa-1
) equilibrated at higher levels of O2 (15.0 - 16.0 kPa) and lower levels of CO2
(1.2 - 1.3 kPa). This finding is in accordance with a previous report on fresh-cut salad
savory (Kim et al., 2004). Packages prepared with 8 pmol s-1
m-2
Pa-1
film OTR
exhibited a relatively more rapid depletion of O2 and accumulation of CO2, than those
occurred in all other treatments. However, the headspace O2 concentrations were as
high as 8.8 kPa and CO2 concentrations were relatively low (3.0 kPa) on day 28,
indicating that the tissues had not experienced anaerobic respiration.
Page 90
78
After the 28-day storage at 1 °C, the content of total chlorophyll had declined
slightly to a final range of 656-678 µg/g FW. Among all packaging film treatments,
the total chlorophyll contents did not vary significantly over the entire storage time
(Fig. 4.2C). Compared to 8.0 and 11.6 pmol s-1
m-2
Pa-1
film OTR treatments, total
chlorophyll loss of samples in 21.4 and 29.5 pmol s-1
m-2
Pa-1
OTR film packages
were slightly greater at the end of storage, however, the difference was not
statistically significant (P < 0.05).
There was no significant difference on the tissue electrolyte leakage of radish
microgreens among different packaging film OTRs (Fig. 4.2D). Interestingly, it was
noted that there was a sharp decrease in tissue electrolyte leakage for all treatments
from day 0 to day 7, and also a slight decrease in the following seven days (from day
7 to day 14). This phenomenon was also observed in fresh-cut cilantro leaves during
the early stages of storage at 0 °C by Luo et al. (2004). This decrease in electrolyte
leakage on day 7 suggested that a cell membrane damage recovery process may exist
in plants/produce in the early stages of cold storage (Luo et al., 2004). During
subsequent storage, increased electrolyte leakage was recorded for all packaging
treatments. At the end of the 28-day storage period, samples packaged in 29.5 pmol s-
1 m
-2 Pa
-1 OTR film had the lowest electrolyte leakage percentage (0.9%), whereas,
the highest value (1.3%) was found in the lowest (8.0 pmol s-1
m-2
Pa-1
) OTR film
package.
Page 91
79
Fig. 4.2 Effect of packaging film OTR on the changes in O2 (A) and CO2 (B)
partial pressures within packages, chlorophyll content (C), electrolyte leakage
(D), overall quality (E), off-odor (F), aerobic mesophilic bacteria (AMB) (G) and
yeast & mold (Y&M) (H) populations of packaged green daikon radish
microgreens of green daikon radish microgreens during 1 °C storage (n = 4).
Vertical bar represents ± standard error.
Page 92
80
There was no noticeable quality loss among all treatments from day 0 to day 7
(Fig. 4.2E). Starting on day 14, tiny black spots were observed on the leaves of radish
microgreens, resulting in reduced quality scores. At the end of storage, the overall
quality scores of radish microgreens in all treatments had declined to 7.3-7.5, which
was above the acceptable level.
Slight off-odor (a score of 0.7-1.3) developed in all samples at the end of storage
(Fig. 4.2F). Samples from 29.5 pmol s-1
m-2
Pa-1
OTR film packages developed the
least off-odor, followed by 21.4 pmol s-1
m-2
Pa-1
OTR film packages. This trend of
increasing values with decrease in film OTR was in accordance with that found for
electrolyte leakage, indicating that the development of off-odor was associated with
loss of cell membrane integrity (Wang et al., 2005). In addition, it is noted that no off-
odor (a score of 0) was detected in samples packaged in 11.6 pmol s-1
m-2
Pa-1
OTR
film bags; instead, a pleasant but incongruent smell was present on all sampling days.
The same experiments were repeated in another 1°C chamber, and the same results
were obtained. No satisfactory explanation was found.
The initial microbial load on radish microgreens was relatively high (7.1 log cfu/g
of AMB and Y&M), similar to that found in baby spinach leaves (Allende et al.,
2004). The result is also consistent with the finding recently reported by Chandra et
al. (2012) for unwashed „Tah Tasai‟ Chinese cabbage microgreens. It was also
hypothesized by Chandra et al. (2012) that the delicate microgreen stalks may be
more vulnerable to microbial attachment and growth than mature ones. From day 7 to
day 21, AMB and Y&M populations (Fig. 4.2G and 4.2H) on radish microgreens
remained stable at 1 °C. After day 21, the growth of AMB and Y&M increased
Page 93
81
slowly with the final count of 7.5-7.8 log cfu/g. Although gas compositions were
significantly affected by different packaging treatments, there was no significant
difference in the growth of AMB and Y&M among treatments (P < 0.05), suggesting
that gas composition did not influence the overall growth of AMB and Y&M of
radish microgreens under 1 °C storage. Luo et al. (2004) found similar results for
fresh-cut cilantro leaves. Therefore, it may be deduced from these results that
temperature is the predominant factor influencing growth for most microorganisms
(Koseki & Itoh, 2002).
Among all the OTR film treatments, no significant difference was found on
maintaining the quality and prolonging the shelf life of radish microgreens. Overall,
samples packaged in 29.5 pmol s-1
m-2
Pa-1
OTR film maintained relatively better
quality during 28-day storage under 1 °C, demonstrating lowest tissue electrolyte
leakage, AMB and Y&M counts, and off-odor score (except the suspicious off-odor
score of 11.6 pmol s-1
m-2
Pa-1
OTR film treatment); thus, the film with 29.5 pmol s-1
m-2
Pa-1
OTR was chosen to be used in the subsequent wash study of daikon radish
microgreens.
4.4.3 Effect of Wash Treatment on Quality and Shelf Life
During the entire 28-day storage period, no significant difference (P < 0.05) was
found in the changes of O2 and CO2 composition in packages among all wash
treatments (Fig. 4.3A and 4.3B). In the first seven days, the headspace O2
concentration of all bags dropped rapidly, nearly reaching equilibrium by day 7. All
treatments maintained a constant high level of O2 (14.0-16.0 kPa) until the end of
storage. Meanwhile, the CO2 level increased rapidly during the 1st 7 days followed by
Page 94
82
a slight decline. This result suggests that wash treatment had no significant (P < 0.05)
effect on O2 reduction and CO2 evolution rates of radish microgreens packaged in the
same permeable polyethylene bags (OTR = 29.5 pmol s-1
m-2
Pa-1
) and stored at low
temperature (1°C).
During the 28-day storage at 1°C, the total chlorophyll content did not vary
significantly (P < 0.05) (Fig. 4.3C). There was no direct relationship between wash
treatment and total chlorophyll content. This lack of discernable effect due to wash
treatment may be the result of large sample variation obscuring the variation
attributable to wash treatment.
On day 0, unwashed samples (control) showed higher tissue electrolyte leakage
than all other washed samples, probably due to tissue fluids exuded from cut ends
during washing. Meanwhile, water-washed samples exhibited lowest electrolyte
leakage (0.8%) of all wash treatments, which is the same result reported for a recent
study on „Tah Tasai‟ Chinese cabbage microgreens (Chandra et al., 2012). After day
14, tissue electrolyte leakage increased rapidly for 100 mg/L chlorine treated samples
and the values were significantly (P < 0.05) higher than those of other treatments on
day 21 and day 28. On the contrary, no significant difference was observed in the
changes of electrolyte leakage during subsequent storage among other treatments
(Fig. 4.3D).
Page 95
83
Fig. 4.3 Effect of chlorine wash treatment on the changes in O2 (A) and CO2 (B)
partial pressures within packages, chlorophyll content (C), electrolyte leakage
(D), overall quality (E), off-odor (F), aerobic mesophilic bacteria (AMB) (G) and
yeast & mold (Y&M) (H) populations of green daikon radish microgreens
during 1 °C storage using 29.5 pmol s-1
m-2
Pa-1
OTR film (n = 4). Control
represents unwashed sample.
Vertical bar represents ± standard error.
Page 96
84
All samples subjected to different wash treatments maintained the highest
possible visual score of 9.0 during storage at 1°C until day 14 (Fig. 4.3E). After day
14, the visual quality of 100 mg/L chlorine treated samples declined rapidly,
receiving the lowest overall score (a score of 7.2) at the end of the 28-day storage.
However, no significant difference was found for overall quality of all other
treatments (unwashed, water, 50 mg/L chlorine), which maintained good visual
quality (scores of 7.8-8.0) at the end of storage. This suggests that the 100 mg/L
chlorine treatment may have caused tissue damage during wash, which led to the
quality loss during storage. However, the wash treatment with 50 mg/L free chlorine
did not appear to have a detrimental effect on quality.
The results for off-odor development followed the same trends as those for visual
quality (Fig. 4.3F). Only trace amount of off-odor (scored 0.2 - 0.8) was detected for
each treatment on day 14. At the end of storage, a slight to moderate level of off-odor
(scored 1.2 - 1.5) was detected from all samples except for 100 mg/L chlorine treated
samples, which developed the strongest off-odor with a moderate to strong score of
2.5. The sensory results agreed well with those from tissue electrolyte leakage,
suggesting that the loss of freshness and development of off-odor was related to tissue
damage and senescence.
A wash treatment with 100 mg/L free chlorine significantly reduced microbial
population on day 0, while no difference was found among all other treatments (Fig.
4.3G and 4.3H). Microbial populations increased after day 7 of storage. However,
samples that received the 100 mg/L chlorine treatment had a more significant increase
in microbial populations than the other treatments. AMB and Y&M growth on
Page 97
85
samples treated with 100 mg/L chlorine overtook that of all other treatments on day
14 and continued to outgrow others until the end of storage. This is in agreement with
the more rapid quality loss observed in this treatment, probably due to tissue damage
incurred during washing. A similar result was reported for „Tah Tasai‟ Chinese
cabbage microgreens treated with chlorinated water (Lee et al., 2009). Water washed
samples experienced slightly less microbial growth after day 14 than did 50 mg/L
chlorine washed samples. Among all treatments, unwashed samples maintained
lowest microbial growth after the 14th
day of storage, which is in accordance with the
finding in a recent study of Kou et al. (2013). This result is probably due to the lower
moisture content in these packages. Excess moisture remaining on washed leaf
surfaces, and the possible damaged incurred from agitation during washing and
drying may have promoted microbial growth in those packages. Radish microgreens
have young and delicate leaf tissues that can be easily damaged during preparation.
Since removal of excess water without tissue injury is often closely related to the
maintenance of quality and shelf life of fresh or fresh-cut produce, future studies may
need to optimize the washing, and drying processes.
4.5 Conclusions
The quality and shelf life of radish microgreens as impacted by three major
postharvest treatment factors, i.e. storage temperature, packaging film OTR, and
chlorine wash treatment, were evaluated in this study. Storage temperature had a
significant impact on package atmosphere, product visual quality, microbial growth
and membrane integrity. A storage temperature of 1 °C was rated as the best
treatment followed by 5 °C storage. Samples stored at 1 °C maintained the highest
Page 98
86
overall visual quality with minimum off-odor development, lowest AMB and Y&M
counts. This treatment also maintained the highest tissue integrity with minimum
chlorophyll degradation, whereas those stored at 10 °C lost quality more rapidly.
Packaging film OTR significantly affected headspace gas composition during 1
°C storage; however, it did not have a significant effect (P < 0.05) on the quality and
shelf life of the product, probably due to the presence of high level O2 and low level
CO2 within the packages over time and low respiration rate of microgreens stored at 1
°C. In our study, microgreens packaged in all OTR film bags stored at 1 °C
maintained good quality and shelf life throughout 28 days.
Among all wash treatments and control (no wash), 100 mg/L free chlorine wash
treatment had a significant impact on the reduction of microbial population initially.
However, microbial growth on these samples exceeded those of all other treatments
after 7 days. In this study, the use of chlorine washing solutions did not achieve the
goal of producing ready-to-eat radish microgreens with low microbial load and long
shelf life, therefore, some alternative treatments need to be further investigated in the
future study.
Page 99
87
Chapter 5: Effect of Light Exposure on Sensorial Quality,
Concentrations of Bioactive Compounds and Antioxidant
Capacity of Radish Microgreens during Low Temperature
Storage
Xiao, Z., Lester, G.E., Luo, Y., Xie, Z., Yu, L., Wang, Q. (2014) Food Chemistry,
151, 472-479.
5.1 Abstract
Radish microgreens constitute a good source of bioactive compounds; however,
they are very delicate and have a short shelf life. In this study, we investigated the
impact of light exposure and modified atmosphere packaging on sensorial quality,
bioactive compound concentrations and antioxidant capacity of radish microgreens
during storage. Results showed that light exposure during storage increased the
amount of ascorbic acid and had no effect on α-tocopherol or total phenolic
concentrations. Dark storage resulted in higher hydroxyl radical scavenging capacity
and carotenoid retention. No significant differences were found for relative 2, 2-
diphenyl-1-picrylhydrazyl (DPPH) radical scavenging capacity between light and
dark treatments. Radish microgreens in bags of 29.5 pmol s-1
m-2
Pa-1
oxygen
transmission rate (OTR) maintained better quality than those within laser-
microperforated bags. In conclusion, light exposure accelerated deterioration of
radish microgreens, while dark storage maintained quality; and application of OTR
bags was beneficial in extending shelf life.
Page 100
88
5.2 Introduction
Microgreens are a new class of specialty vegetables that are often harvested at the
cotyledonary leaf stage without roots and seed coats. Microgreens are favored by
chefs and consumers in high-end restaurants for their attractive colors, tender texture,
and intense flavors. A recent report on phytonutrient studies (Xiao et al., 2012)
demonstrated that most microgreens contain substantially higher levels of bioactive
compounds, such as ascorbic acid, phylloquinone, tocopherols and carotenoids, than
their more mature true-leaf forms. As the demand for microgreens increases, and they
begin to appear in farmer‟s markets and specialty grocery stores, the optimization of
their postharvest storage conditions is therefore becoming important.
Commercially, containers used for microgreens are plastic clamshell containers,
in which the gas composition is atmospheric. In order to accurately measure the
headspace gas composition, laser microperforated plastic bags were used in the
current study as a substitute for clamshell containers. However, our previous studies
found that using optimized modified atmosphere packaging and low temperature
storage considerably extended the shelf-life of radish microgreens (Xiao et al., 2013).
Thus both packaging conditions will be investigated.
Fresh produce, including microgreens, are usually displayed under light in
grocery stores. Recently, the effect of light exposure on quality and phytochemical
concentrations of different vegetables has been studied extensively. Büchert et al.
(2011) reported that continuous low intensity light delayed yellowing and postharvest
senescence of broccoli florets (Brassica oleracea L.). Noichinda, et al. (2007)
reported that low intensity fluorescent light accelerated fresh weight loss, but
Page 101
89
prevented the loss of vitamin C of Chinese kale (Brassica oleracea var. alboglabra)
during storage. Lester et al. (2010b) found that continuous light exposure prevented
loss of ascorbic acid and was beneficial in enhancing carotenoids and tocopherols of
baby-leaf spinach (Spinacia oleracea L.). Studies also showed that light exposure
could cause detrimental effects on produce quality. A study by Sanz et al. (2009)
demonstrated that asparagus (Asparagus officinalis L.) stored under light
experienced accelerated deterioration and shortened shelf life than those stored under
continuous dark. Martínez-Sánchez et al. (2011) also observed that light exposure
could promote browning of fresh-cut Romaine lettuce.
Daikon radish microgreens (Raphanus sativus var. longipinnatus) were chosen in
this study due to its abundance in bioactive compounds relevant to human health
(Xiao et al., 2012) and broad usage in restaurants in the US. The objective of this
study is to determine the effect of light exposure and packaging conditions on
sensorial quality, concentrations of bioactive compounds, and antioxidant capacity of
daikon radish microgreens during cold storage.
5.3 Materials and Methods
5.3.1 Sample Preparation
Daikon radish microgreens (Raphanus sativus var. longipinnatus) were grown by
Sun Grown Organic Distributors, Inc. (San Diego, CA, USA) in an unheated
greenhouse and under ambient light. Samples were harvested without roots, packed in
clamshell containers and shipped overnight in insulated containers with ice packs.
When received, all samples were inspected prior to packaging and defective plant
tissues were discarded. Samples (20 g) were re-packaged in 12.5 cm ✕ 12.5 cm
Page 102
90
plastic bags, which were made of either polyethylene film (Pacific Southwest
Container Inc., Modesto, CA, USA) with OTR of 29.5 pmol s-1
m-2
Pa-1
or laser-
microperforated oriented polypropylene film (LMP), provided by Dole Fresh
Vegetables, Inc. (Salinas, CA, USA), respectively. The samples in each packaging
type were further randomly divided into two groups and subjected to light and dark
treatments. The samples subjected to light were stored under continues fluorescent
light (light intensity ≈ 30 μmol∙s-1
∙m-2
) and those receiving dark treatment were stored
in two-layer brown paper bags (light intensity ≈ 0.1 μmol∙s-1
∙m-2
). The light intensity
was measured by LI-1000 data loggers (LI-COR, Lincoln, NB, USA) at the top of
packages. Three packages of radish microgreens were randomly selected from each
treatment on day 0, 4, 8, 12 and 16 for evaluations.
5.3.2 Headspace Gas Composition
Packaging headspace gas samples were withdrawn by inserting the needle through
a septum adhered to the packaging film. The gas composition (O2 and CO2) was
measured using an O2/CO2 gas analyzer (CheckMate II, PBI-Dansensor A/S,
Ringsted, Denmark).
5.3.3 Quality Attributes
5.3.3.1 Color (L*, C*, h°)
Color coordinates (CIE L*, C*, h°) were directly measured on the products using
a model CR-410 colorimeter (Konica Minolta, Ramsey, NJ, USA) with a 50 mm
diameter viewing aperture. The equipment was calibrated with a standard white plate
(Y = 94.0, x = 0.3130 and y = 0.3191). The concentrations of each package of radish
Page 103
91
microgreens were transferred to a clear plastic tray. Color was measured at ten
locations and the mean value was taken to ensure that color readings were
representative of each sample. Three replicate packages were evaluated for each
treatment on each sampling day (day 0, 4, 8, 12 and 16). The results were expressed
as lightness (L*), Chroma (C*) and hue angle (h°) values.
5.3.3.2 Weight Loss
Weight loss was determined by weighing the bagged samples from at the
beginning of storage and during storage. Three replicates were evaluated for each
treatment on each sampling day (day 0, 4, 8, 12 and 16). Results were expressed as
percentage of weight loss relative to the initial fresh weight.
5.3.3.3 Sensory Evaluation
Sensory evaluation was conducted by a six-member trained panel using a ballot
designed with Compusense®
5.0 system (Guelph, Canada). All the samples were
evaluated under controlled yellow light in individually partitioned sensory booths. A
total of 4 samples, one from each of the four treatments were served one at a time to
each panelist. Each sample was labeled with a random 3-digit number and served to
the panel members in random orders. The visual quality was rated using a 9-point
hedonic scale, anchored by 9 = like extremely, 5 = neither like nor dislike and 1=
dislike extremely (Meilgaard et al., 1991); a score of 6 was considered the limit of
salability (Kim et al., 2004). Off-odor was scored on a 0 to 4 scale where 0 = no off-
odor, 1 = slight off-odor, 2 = moderate off-odor, 3 = strong off-odor, and 4 =
extremely strong off-odor.
Page 104
92
5.3.4 Analysis of Bioactive Compounds
5.3.4.1 Ascorbic Acid
Total ascorbic acid (TAA) and free ascorbic acid (AA) were determined using a
reverse phase high performance liquid chromatography (RP-HPLC) using the
protocol described in 3.3.4.1. In this assay, the amount of dehydroascorbic acid
(DHA) was equal to the difference between TAA and AA.
5.3.4.2 Carotenoids and Tocopherols
Carotenoids and tocopherols were simultaneously determined using an isocratic
RP-HPLC according to the procedure previously established in our laboratory (Xiao
et al., 2012), as described in 2.3.3.2.
5.3.5 Determination of Antioxidant Capacity
5.3.5.1 Total Phenolics
Total phenolic content (TPC) was measured using Fast Blue BB (FBBB) assay
developed by Medina (2011) and modified for chlorophyll-containing tissue by Lester
et al. (2013), as described in 3.3.4.4.
5.3.5.2 Relative DPPH Radical Scavenging
The relative 2, 2-diphenyl-1-picrylhydrazyl (DPPH) radical scavenging capacity
(DPPH) was evaluated according to the method of Cheng et al. (2006). The test
solution (0.1 mL) of sample extracts, Trolox standards, or blank solvent control was
added to 0.1 mL of freshly prepared DPPH solution to initiate the reaction. The
absorbance of the reaction mixture was measured at 515 nm for 40 min of reaction in
Page 105
93
the dark. DPPH values were calculated using areas under the curve and expressed as
micromoles of Trolox equivalents (TE) per gram of dried weight sample.
5.3.5.3 Hydroxyl Radical Scavenging Capacity
Hydroxyl radical scavenging capacity (HOSC) assay was conducted according to
the protocol of Moore et al. (2006) using a Victor multilabel plate reader
(PerkinElmer, Turku, Finland). Aqueous sample extracts were evaporated to dryness
and redissolved in 50% acetone. Reaction mixtures consisted of 170 µL of 9.28 × 10⁻⁸
M fluorescein prepared in 75 mM sodium phosphate buffer, 30 µL of standard,
sample extract, or blank, 40 µL of 0.1990M H2O2 and 60 µL of 3.43 mM FeCl3.
Fluorescence was measured every minute for 3 h with an excitation wavelength of
485 nm and emission wavelength of 535 nm. HOSC values were expressed as
micromoles of Trolox equivalents (TE) per gram of sample on a dry weight basis.
5.3.6 Statistical Analysis
Package atmospheres, dry weight, weight loss, antioxidant activity, color,
nutrient, and quality and off odor data were analyzed as three-factor linear models
using the PROC MIXED procedure (SAS Institute Inc., Version 9.2, Cary, NC,
USA). Analysis factors were storage time (5 levels), package film (2 levels), and light
condition (2 levels). Three replications were evaluated per treatment on each
sampling day for all parameters except quality and off odor for which 6 replications
were evaluated per treatment per sampling day. Quality and off-odor evaluator ratings
were averaged for each sample. Different samples were analyzed on each evaluation
day for all studies. Assumptions of normality and variance homogeneity of the linear
Page 106
94
model were checked and the variance grouping technique was used to correct for
variance heterogeneity. When effects were statistically significant, means were
compared using Sidak adjusted p-values to maintain experiment-wise error 0.05.
Data was reported as the mean of 3 replicates ± standard error (SE).
5.4 Results and Discussions
5.4.1 Effect on Headspace Gas Composition
The gas composition in all laser microperforated bags (LMP) was maintained at
atmospheric and not affected by the light treatment during the storage period (Fig.
5.1A). This suggests that the laser microperforated films used in this study allowed
sufficient gas exchange with the surrounding environment to compensate for O2
consumption and CO2 production that may have been produced by the microgreens.
In contrast, the O2 and CO2 levels in OTR bags were significantly impacted by the
light exposure. Within the first 4 days of storage, there was a sharp decline in O2
levels inside the packages of both light and dark treatment. However, O2 levels
increased in light-stored packages while under dark remained unchanged from day 4
until the end of storage (day 16). Similar to O2, under both light and dark conditions
the package headspace CO2 levels remained nearly unchanged in laser
microperforated films throughout the entire storage period (Fig. 5.1B). In OTR bags,
the CO2 levels differed significantly under light vs. dark storage. Under light
conditions, CO2 levels remained nearly unchanged from day 0 to day 12, followed by
a slight increase (up to 0.8) from day 12 to day 16. While there was a sharp increase
in CO2 from day 0 to day 4 (up to 3.8) and remained high throughout the storage
under dark condition. The large difference in gas compositions observed under light
Page 107
95
Fig. 5.1 Effect of light exposure on the headspace gas composition in oxygen
transmission bags (OTR) and laser microperforated bags (LMP) at 5 °C for 16
days.
OTR+L, OTR+D, LMP+L and LMP+D represents radish microgreens in OTR bags
subjected to light, in OTR bags subjected to dark, in LMP bags subjected to light, and
in LMP bags subjected to dark, respectively. Values are means ± standard errors of
three replicates.
Page 108
96
versus dark conditions is likely attributable to the respiratory and photosynthetic
activities of microgreens.
In general, exposure to light during storage induces stomatal opening, resulting in
increased respiratory activity, which leads to the consumption of O2 and release of
CO2 (Sanz et al., 2008). In the presence of light, chlorophyll-containing tissues could
also continue photosynthetic activity, which depletes CO2 and releases O2 in packages
(Olarte et al., 2009). In our study, the high levels of O2 and lower levels of CO2 in
light-stored microgreens packages suggests active photosynthetic processes in
microgreens during storage under light exposure.
5.4.2 Effect on Quality Attributes
5.4.2.1 Color (L*, C*, h°)
Color changes were presented in terms of the coordinates, lightness (L*), chroma
(C*) and hue (h°) (Fig. 5.2). The color of radish microgreens was significantly
affected by light exposure, packaging atmosphere and storage duration. In general, L*
values initially decreased during storage and then slowly increased returning to the
original value, except for the treatment of LMP+D which increased beyond the
original value (Fig. 5.2A). Irrespective of packaging treatments, the L* values of
light-stored samples were significantly lower than those of dark-stored samples,
which indicated that light-stored samples were darker. The tendency of samples to
darken when exposed to light has been reported by previous studies on green parts of
chard and leek (Ayala et al., 2009; Sanz et al., 2008). The darkening of plant samples
observed in these instances was probably caused by the photosynthetic activity in the
Page 109
97
Fig. 5.2 Effect of light exposure on lightness (L*), chroma (C*), hue angle (h°) of
radish microgreens stored in oxygen transmission bags (OTR) and laser
microperforated bags (LMP) at 5 °C for 16 days.
OTR+L, OTR+D, LMP+L and LMP+D represents radish microgreens in OTR bags
subjected to light, in OTR bags subjected to dark, in LMP bags subjected to light, and
in LMP bags subjected to dark, respectively. Values are means ± standard errors of
three replicates.
Page 110
98
presence of light during postharvest storage, through which the green pigment
chlorophyll was produced.
Chroma (C*) represents the intensity or purity of the hue (Gómez et al., 2010).
The higher the C* value, the more intense the sample hue appears. Among all four
treatments, the least change in C* was found in dark-stored OTR microgreens
samples, indicating that the intensity of hue of the tissue was not significantly
affected by this storage condition (Fig. 5.2B).
In this study, all the h° (color) values were in the quadrant of 90° (yellow) to 180°
(green); therefore, the decrease of h° value means that samples tend to turn from
green to yellow-green. The higher the h° value, the greener the microgreens. Our
results demonstrate that light exposure clearly affected h° value of samples stored in
OTR bags with a progressive decrease in h° during storage, while samples in dark-
stored OTR bags were minimally affected with only a slight decrease in h° values on
day 8, and no change thereafter (Fig. 5.2C). The yellowing observed in the light-
stored samples at the end of the storage period provides additional evidence that light
exposure accelerates discoloration of radish microgreens. Hue values of microgreens
packaged in LMP bags decreased during storage but no significant differences were
found between light and dark treatments, indicating that LMP packaging played a
more important role in tissue discoloration than OTR packaging. The high oxygen
concentration in LMP packages resulted in more rapid yellowing, an indication of
tissue senescence and chlorophyll degradation (Heaton & Marangoni, 1996).
Contradictory reports were found in literature regarding the effect of light
exposure on quality maintenance of fresh produce. Studies from Sanz et al. (2008)
Page 111
99
and Ayala et al. (2009) showed a similar gradual decrease in hue angle values of
chard and leek, respectively, during storage. However, Kasim and Kasim (2007)
reported that low intensity light exposure was beneficial to the preservation of green
color of Brussels sprout and broccoli florets. Based on the L*, C*, h° coordinate data
in our study, it was concluded that the impact of packaging film is more important
than that of light or dark exposure in maintaining visual quality of radish microgreens
light- and dark-stored OTR bags maintained the freshest appearance compared to
light- and dark-stored LMP bags following 16 days at low temperature storage.
5.4.2.2 Effect on Sensorial Quality
The effect of light exposure on the sensorial quality, irrespective of packaging,
resulted in that dark-stored microgreens having significantly better visual quality than
samples in lighted storage. Initially, all microgreens had a fresh appearance on day 4
with no significant difference among treatments. However, by day 8, microgreens
stored under dark received significantly higher visual quality scores than those stored
under light (Fig. 5.3A). After 8 days of storage, OTR samples stored in darkness
maintained high visual quality while the visual quality of light-exposed OTR samples
and all the LMP samples were below the limit of acceptability. The visual quality of
dark-stored OTR microgreens was rated above 5.0 (i.e. considered likeable)
throughout the entire 16 day storage while all other microgreens continued sharp
decline in visual quality. Accompanying the changes in visual quality, radish
microgreens exposed to light produced an off-odor more slowly than those stored
under dark conditions (Fig. 5.3B). While light exposure initially prevented the
occurrence of off-odor in OTR samples, after 8 days of storage the intensity of off-
Page 112
100
Fig. 5.3 Effect of light exposure on visual, off-odor and weight loss of radish
microgreens stored in oxygen transmission bags (OTR) and laser
microperforated bags (LMP) at 5 °C for 16 days.
OTR+L, OTR+D, LMP+L and LMP+D represents radish microgreens in OTR bags
subjected to light, in OTR bags subjected to dark, in LMP bags subjected to light, and
in LMP bags subjected to dark, respectively. Values are means ± standard errors of
six replicates.
Page 113
101
odor of light-exposed microgreens was higher than that of dark-stored samples.
Samples stored in LMP packages in darkness showed less intensity of off-odors at
each sampling day than those stored in OTR packages except for day 4 when there
was no significant difference between packaging treatments. The lower off-odor
scores for LMP bags than for OTR bags were probably due to higher permeability of
LMP film. In our study, exposure to light during postharvest storage was found to
have a negative effect on the sensorial quality maintenance of radish microgreens,
which is in accordance with the findings reported by some previous researchers on
minimally processed chard, leek, asparagus and Romaine lettuce (Ayala et al., 2009;
Martínez-Sánchez et al., 2011; Sanz et al., 2008; Sanz et al., 2009).
5.4.2.3 Effect on Weight Loss
Weight loss of radish microgreens under light exposure was significantly (P <
0.05) higher than that for dark-stored samples on each sampling day (Fig. 5.3C). The
weight loss of light-stored microgreens increased throughout storage, ending up with
8.1% and 7.6% of weight loss in OTR and LMP packages, respectively. In contrast,
samples stored in the dark maintained a stable fresh weight and with little weight loss
(around 1.0%) during the entire 16-day storage period. Similar research findings were
reported for light-exposed storage of Brussels sprout, Chinese kale, broccoli and
cauliflower (Kasim & Kasim, 2007; Noichinda et al., 2007; Olarte et al., 2009),
which showed that stomata were closed in darkness within 1 day of storage, but
remained open during storage under light conditions. It is generally recognized that
the degree of stomatal opening is directly related to both the transpiration rate and the
diffusion of CO2 for photosynthesis. Under light exposure, an increased transpiration
Page 114
102
rate, due to more stomatal openings, consequently accelerates the loss of water vapor
from tissues, which is the likely cause of the higher weight loss. It was also observed
that there was substantial moisture condensation inside the packaging film in light
exposed packages, which was further evidence of high leaf transpiration rate under
light.
5.4.3 Effect on Bioactive Compounds
5.4.3.1 Ascorbic Acid
Dry weight percentage was shown in Fig. 5.4A, which was used for calculating
all the nutrient concentrations. The changes in AA concentration of radish
microgreens in all treatment groups followed a similar trend over the 16-day low
temperature (5°C) storage (Fig. 5.4B). With the exception of samples stored in OTR
bags and exposed to light (OTR+L), free ascorbic acid concentration increased
initially (from day 0 to day 8), decreased until day 12, and then increased again until
the end of storage. Compared with the samples stored in dark, radish microgreens
stored under light showed significantly (P < 0.01) higher AA concentrations during
the entire storage. Dehydroascorbic acid (DHA), the oxidized form of AA followed
the opposite trend of AA, decreasing during the first 4 days of storage for all samples
except samples packaged in LMP bags and stored in dark (LMP+D) and then slightly
increasing until day 12, and declining thereafter (Fig. 5.4C). Dehydroascorbic acid
for LMP+D samples increased gradually until day 8 and then increased rapidly
through the end of the storage. The increase in total ascorbic acid (TAA) which
occurred in all radish microgreens during the 16-day storage period regardless of the
presence of light and packaging treatments (Fig. 5.4D) is due to the combination of
Page 115
103
Fig. 5.4 Effect of light exposure on dry weight, ascorbic acid, dehydroascorbic
acid, total ascorbic acid, β-carotene, lutein/zeaxanthin, violaxanthin, α-
tocopherol of radish microgreens stored in oxygen transmission bags (OTR) and
laser microperforated bags (LMP) at 5 °C for 16 days.
OTR+L, OTR+D, LMP+L and LMP+D represents radish microgreens in OTR bags
subjected to light, in OTR bags subjected to dark, in LMP bags subjected to light, and
in LMP bags subjected to dark, respectively. Values are means ± standard errors of
three replicates.
Page 116
104
increase in AA or DHA. In general, light-stored samples showed higher TAA
concentrations than dark-stored samples over the entire storage period. The TAA
concentration of radish microgreens was initially 30.8 mg/100mg FW on day 0 and
increased by 18.3% in OTR samples after 16-day light exposure. In comparison, OTR
samples stored in the dark retained very stable level of TAA (30.8-31.7 mg/100mg
FW) during storage, with a small increase in the middle of the period (34.0
mg/100mg FW). Samples stored in OTR films preserved more AA and less DHA
than those stored in LMP films during storage, regardless of light or dark storage.
In our study, the exposure to light contributed to higher levels of TAA over time.
As expected, light exposure may increase the photosynthetic capacity of radish
microgreens during postharvest storage, which resulted in production of D-glucose,
which is the precursor of AA synthesis (Zhan et al., 2012). Interestingly, there was no
TAA loss in radish microgreens packaged in OTR film bags stored at 5°C regardless
of light or dark storage. Instead, light exposure positively boosted the total amount of
TAA. A similar trend for total ascorbic acid in light-exposed baby spinach was found
by Lester et al. (2010b).
It is noted that AA at 1.4 mg/100g FW only accounted for 4% of TAA
concentration on day 0, meaning that most of the vitamin C was present as DHA, its
oxidized form. This phenomenon is thought to be associated with postharvest
oxidative stresses, resulting from a variety of factors, including physical damage,
temperature fluctuation, and internal senescence, all of which may contribute to the
decrease in AA by oxidizing it to DHA (Hodges et al., 2004).
Page 117
105
5.4.3.2 Carotenoids
Light exposure significantly accelerated β-carotene degradation in radish
microgreens during storage in both packaging treatments, whereas the samples stored
in the dark showed little change in β-carotene level throughout the storage period
(Fig. 5.4E). Other researchers reported similarly that more β-carotene concentration
was preserved in spinach leaves stored in dark condition than in light condition
(Lester et al., 2010b). The changes of lutein/zeaxanthin concentrations in all
treatments followed a similar trend during storage, with LMP+D samples leading the
way with faster decrease and earlier increase, but all treatments increasing after day 8
(Fig. 5.4F). Similarly to β-carotene, lutein/zeaxanthin and violaxanthin (Fig. 5.4G)
concentration was lower in the samples stored under light than in those stored in
darkness. It is known that when the light energy is excessive to the need of plants for
photosynthesis, a reversible xanthophylls conversion of violaxanthin to zeaxanthin
via the intermediate antheraxanthin (violaxanthin cycle) occurs, whereby violaxanthin
can be de-epoxidized into zeaxanthin (Havaux & Niyogi, 1999; Jahns et al., 2009). In
our study, more violaxanthin was observed in dark condition, which indicated that the
epoxidation reaction may occur in this storage condition. Zeaxanthin epoxidation to
form violaxanthin is commonly induced under low light conditions (Lubián &
Montero, 1998). Although the lutein/zeaxanthin concentration in radish microgreens
did not decrease in the dark storage as the violaxanthin increased, this data was the
sum of lutein and zeaxanthin, which may not reflect the change in zeaxanthin.
Page 118
106
5.4.3.3 Tocopherols
It is generally recognized that α-tocopherol is the predominant form found in
leaves, while γ-tocopherol and tocotrienols accumulate to higher levels in seed of
many plant species (Demurin et al., 1996; Tan, 1989). Gamma-Tocopherol is the
precursor of α-tocopherol (Lester et al., 2010b). In higher plants, γ-tocopherol
methyltransferase is an important enzyme in the biosynthetic pathway of α-
tocopherol, which catalyzes the last step of α-tocopherol biosynthesis (Dwiyanti et
al., 2011). During storage, the α-tocopherol concentration increased (Fig. 5.4H) over
time, irrespective of light/dark treatment. Conversely, a substantial decline in γ-
tocopherol occurred during the 16 day storage. However, there was no consistent
difference between γ-tocopherol concentrations of light and dark treated samples
(data not shown). Although there was no clear trend in γ-tocopherol concentrations,
the γ-tocopherol concentration tended to decrease as the α-tocopherol increased and
vice versa for most of the treatments and storage periods. In a previous study, Lester
et al. (2010b) reported that continuous light exposure helped retain more α-tocopherol
and γ-tocopherol in baby spinach during storage than did dark storage. In this case,
photo-oxidative stress may have induced an increase in α-tocopherol (Porfirova et al.,
2002).
5.4.4 Effect on Antioxidant Properties
There were no significant differences in TPC among package or light treatments
over the storage period (Fig. 5.5A). A previous study on fresh-cut romaine lettuce
showed that TPC was not significantly different among samples stored under light but
dark storage tended to have higher level of TPC (Martínez-Sánchez et al., 2011). It is
Page 119
107
well known that phenolic compounds are generally synthesized via the
phenylpropanoid metabolic pathway, in which L-phenylalanine is converted into
trans-cinnamic acid by the enzyme phenylalanine ammonia lyase (PAL, EC 4.3.1.5)
and some other phenolic compounds are subsequently produced, such as chlorogenic
acid (Martínez-Sánchez et al., 2011; Zhan et al., 2012). Phenolic compounds also act
as important antioxidants and they can be oxidized to quinone during oxidative stress.
Therefore, the TPC value assayed actually depends on the balance of synthesis and
oxidation (Zhan et al., 2012).
DPPH radical scavenging capacity was not significantly affected by light
exposure or storage duration during the 16 days they were held at 5°C (Fig. 5.5B).
The trend was very similar to that of TPC described above, which may be due to the
same antioxidant mechanism of electron transfer (ET) reaction. Differently, the
HOSC assay is measuring the scavenging capacity of hydroxyl radical, in which
hydrogen atom transfer (HAT) reaction is involved (Huang et al., 2005). Our data
showed that the HOSC values of radish microgreens were significantly affected by
different light and packaging film treatments (Fig. 5.5C). The HOSC of radish
microgreens in all conditions underwent a substantial decline for the first 8 days of
storage and a slight increase thereafter until the end of storage period. Compared to
samples under darkness, those under light exposure had significantly lower HOSC
values at each sampling day, irrespective of packaging film. In food system,
antioxidants (such as vitamin C) may act as pro-oxidants by indirectly catalyzing the
hydroxyl radical generation (Huang et al., 2005).Thus, as AA concentration increased
(described above), more hydroxyl radicals may have been generated,
Page 120
108
Fig. 5.5 Effect of light exposure on total phenolics, relative DPPH radical
scavenging capacity (DPPH) and hydroxyl radical scavenging capacity (HOSC)
of radish microgreens stored in oxygen transmission bags (OTR) and laser
microperforated bags (LMP) at 5 °C for 16 days.
OTR+L, OTR+D, LMP+L and LMP+D represents radish microgreens in OTR bags
subjected to light, in OTR bags subjected to dark, in LMP bags subjected to light, and
in LMP bags subjected to dark, respectively. Values are means ± standard errors of
three replicates.
Page 121
109
resulting in decreased HOSC antioxidant activity in light exposed samples. Studies
have shown that antioxidants such as phenolics may go through synthesis and
metabolism during storage (Kalt et al., 1999). The change in the bioactive compounds
profile may decrease or increase the overall antioxidant capacities of fruits and
vegetables (Kevers et al., 2007). Overall, the trend in the change of the antioxidant
capacities sheds light on the complexity of bioactive behavior in microgreens during
storage. Unfortunately this cannot be explained by the amount change of bioactive
compounds as determined in this study. A further study examining the metabolism of
individual bioactive compound in radish microgreens during storage may provide us
more understanding on these activities.
5.5 Conclusions
In conclusion, light exposure during storage contributed to the maintenance of a
higher concentration of ascorbic acid in daikon radish microgreens; but it accelerated
quality deterioration and weight loss during storage. Dark storage helped to preserve
the quality and prolong the shelf life of radish microgreens. Additionally, dark-stored
radish microgreens maintained higher levels of β-carotene, lutein/zeaxanthin and
HOSC antioxidant activity. No significant differences in α-tocopherol concentration,
total phenolics concentration and DPPH antioxidant capacity were found between
light and dark stored OTR and LMP packaged microgreens. These results showed
that postharvest environmental conditions need to be considered carefully in order to
maintain consumer acceptability, concentration of bioactive compounds and storage
life.
Page 122
110
Chapter 6: Comparison of the Growth of Escherichia coli
O157: H7 and O104: H4 during Sprouting and Microgreen
Production from Contaminated Radish Seeds
6.1 Abstract
Radish sprouts and microgreens were produced using seeds inoculated with
Escherichia coli O157: H7 and O104: H4. Sprouts were harvested after 5 days and
microgreens harvested after 7 days, and E. coli populations on sprouts and
microgreens were compared. Both E. coli O157:H7 and O104:H4 proliferated rapidly
during sprouting, reaching contamination levels of 5.8 to 8.1 log cfu/g and 5.2 to 7.3
log cfu/g, respectively, depending on the initial inoculation of the seeds. In
comparison, E. coli O157:H7 and O104:H4 populations on harvested microgreens
ranged from 0.8 to 4.5 log cfu/g and from 0.6 to 4.0 log cfu/g, respectively, at
corresponding seeds contamination levels. Although harvested microgreens carried
significantly less (P < 0.001) E. coli than the corresponding sprouts, significant
proliferation by E. coli O157:H7 and O104:H4 occurred during both sprouting and
microgreen growth.
6.2 Introduction
As consumers‟ demand for healthy and convenient food increases, raw seed
sprouts have gained popularity worldwide as they are perceived as healthier sources
of carbohydrates, proteins, minerals, and vitamins (Martínez-Villaluenga et al., 2008).
However, sprouts consumption has recently been implicated in several foodborne
Page 123
111
illnesses outbreaks. An outbreak of enterohemorrhagic Escherichia coli (EHEC)
O157: H7 which affected over 6000 people in Japan in 1996, was linked to the
consumption of contaminated radish sprouts (Taormina et al., 1999). The recent
Jimmy John‟s Salmonella outbreak associated with consumption of alfalfa sprouts in
December 2010 sickened 88 people across 15 states in the United States. In 2011,
sprouts from an organic farm in Germany were determined the sources of an outbreak
of enteroaggregative E. coli (EAEC) O104:H4, which infected nearly 4000 people,
and caused 53 deaths (Uphoff et al., 2013). These outbreaks have heightened
consumer concerns to the safety of sprouts, and prompted many food retail/service
establishments to institute policies restricting the availability of sprouts.
In recent years, consumer demands for microgreens have also grown rapidly.
Microgreens are tender cotyledonary-leaf plants with cotyledonary leaves fully
developed and the first pair of true leaves emerged or partially expanded. Compared
to mature leafy produce, microgreens exhibit more vivid colors, intense flavors and
tender textures. A recent study showed that microgreens generally contained higher
concentrations of phytonutrients (such as α-tocopherol, β-carotene and ascorbic acid)
than their mature-leaf counterparts (Xiao et al., 2012).
Unlike mature fresh produce, both sprouts and microgreens are grown in facilities
that restrict the access of insects and wild animals, and minimize other factors of
environmental contaminations. Contaminated seeds are generally the source in most
sprout-related outbreaks (NACMCF, 1999), which would also likely be true for
microgreens. For commercial production, sprouts typically germinate from seeds in
rolling drums with high humidity and frequent watering. The conditions for sprouting
Page 124
112
are conducive of bacterial growth, and it has been reported that E. coli can exceed 7
log cfu/g during sprout production without negatively affecting the appearance of the
sprouts (Taormina et al., 1999). In contrast, microgreens are grown hydroponically or
in a shallow layer of soil/soil substitutes in green houses as real plants. To date, there
is a lack of scientific information relative to the microbiological safety risks of
microgreens. The primary objective of this work was to investigate the survival and
proliferation of E.coli O157: H7 and O104: H4 on radish sprouts and microgreens
cultured under laboratory conditions simulating commercial sprout and microgreen
productions.
6.3 Materials and Methods
6.3.1 Bacterial strains and inoculum preparation
E. coli O157: H7 strain ATCC 43888 harboring a stable plasmid (pGFP) that
encode for green fluorescence protein (GFP) and ampicillin-resistance (Fratamico et
al., 1997), and strain ATCC 43895 were from EMFSL collections. E. coli O157:H7
strain EC415, which was isolated from spinach outbreak in 2006, was provided by
Dr. M. Marmmel (FDA CFSAN, Laurel, MD). E. coli O104:H4 strain TW16133,
which was isolated from Germany sprout outbreak in 2011, was obtained from Dr.
Shannon D. Manning of Michigan State University (Al Safadi et al., 2012). Both
ATCC 43895 and EC415 were transformed with pGFP extracted from ATCC
43888/pGFP. Plasmid stability of the transformed strains was evaluated by two
consecutive overnight subculturings (approximately 60 generations) in the absence of
selective antibiotic (Ampicillin) followed by plating on non-selective agar plates. All
the colonies examined expressed GFP, indicating stable maintenance of the plasmid.
Page 125
113
All strains were maintained at -80 °C in brain heart infusion broth (BHI, Difco,
Detroit, MI, USA) with 20% glycerol.
Individual strains were re-activated on tryptic soy agar (TSA, Difco, USA) plate
and single colonies were then inoculated into 20 tryptic soy broth (TSB, Difco, USA)
containing 100 µg/mL Ampicillin and grown at 37 °C overnight with shaking at 200
rpm. Cells were harvested by centrifugation at 6000 × g for 5 min at 4 °C and
resuspended in sterile phosphate buffered saline (PBS) solution. Aliquots of cell
suspensions were further diluted in sterile distilled (DI) water to obtain desired
concentrations for inoculation. Cell suspensions of the three O157:H7 strains were
combined as a cocktail for seed inoculation, and the O104:H4 strain was used
separately for inoculation.
6.3.2 Seeds and inoculation
Daikon radish (Raphanus sativus var. longipinnatus) seeds were purchased from
a commercial provider (Living Whole Foods, Springville, UT, USA) and stored at 4
°C in sealed plastic bags until use. For inoculation, radish seeds were visually
inspected and those with visible defects purged. A portion of 100 g seeds were
immersed in 200 mL of appropriate inoculum suspension with gentle swirling for 5
min at ambient temperature. To achieve targeted low and high levels of inoculation
on seeds, the concentrations of inoculum suspensions were 102~10
3 and 10
5~10
6
cfu/mL, respectively. After draining, inoculated seeds were spread over sterile
absorbent sheets and air-dried overnight under a laminar/ventilated flow biological
safety hood. After drying, inoculated seeds were stored in refrigerator and used for
sprout germination or microgreen planting with 48 hours. The targeted low level
Page 126
114
inoculation of radish seeds was 1 log cfu/g, and that of high level inoculation was 4
log cfu/g. Radish seeds with high inoculums density and un-inoculated seeds were
also mixed at a ratio of 1:99 (w/w) to form sporadically inoculated seed batches. The
same batches of seeds with specific inoculation levels were used for sprouting and
growing microgreens.
6.3.3 Sprouting
Inoculated radish seeds (10 g) were placed in a sterile sprouting glass jar (source,
location) and soaked in sterile DI water for 4 hours at ambient temperature. After
draining, seeds were incubated at 25 °C with relative humidity of 70 ± 5% in the dark
for 3 days. Sprouting jars were kept at an angle that ensured proper drainage during
the incubation. Germinating seeds were rinsed with water twice daily. Radish sprouts
were exposed to light on day 4 and harvested on day 5 as whole plants, including
undeveloped leaf buds, stem and roots, for microbial enumeration.
6.3.4 Microgreen growth
Fafard Super Fine Germination Mix (Griffin Greenhouse & Nursery Supplies,
Bridgeton, NJ, USA), a soil substitute commonly used by microgreen growers, was
evenly spread in standard 1020 flat plastic culture trays (28 cm W x 54 cm L x 6 cm
D, Growers Supply, Dyersville, IA, USA) to form a thin layer of approximately 2.5
cm in depth. The germination mix was moisturized with sterile water before seeding.
Inoculated seeds (10 g) were evenly spread on top of the germination mix in each tray
and incubated in a temperature-controlled growth chamber set at 25/18°C (day/night)
with 12 hour photoperiods. During the first three days, trays were covered and seeds
germinated in the dark. On day 4, the seedlings were exposed to white fluorescent
Page 127
115
light (light irradiance = ~150 µmol s-1
m-2
, determined by LI-1000 datalogger, LI-
COR, Lincoln, NE, USA). Radish microgreens were daily irrigated to saturation
using an overhead sprayer. On the 7th
day, microgreens were harvested by cutting
stems at 1 cm above the substratum surface with sterilized scissors. A 5-g subsample
of randomly selected microgreens from each tray (replicate) was collected for
microbial enumeration.
6.3.5 Enumeration of E. coli
E. coli populations on the seeds, sprouts and microgreens were enumerated
following a procedure from Luo and coworkers (Luo et al., 2004) with some
modifications. A combination of direct plating technique and most probable number
(MPN) method for enumeration was used in this study. In preliminary study, bacterial
enumeration data obtained using direct plating and MPN methods were compared and
no significant difference (P < 0.05) was found when identical samples were tested.
The results were also consistent with a previous report of Line and coworkers (Line et
al., 2001). Therefore, MPN method was used for complementing the direct plating
method, especially when the microbial population was lower than the detection limit
of direct plating. In this study, when the detection limit was equal or higher than 2.30
log cfu/g, direct plating method was used. When detection limit was lower than 2.30
log cfu/g, MPN method was used.
Five grams of seeds, aseptically harvested sprouts, or microgreens were
pummeled with 45 mL sterile PBS in filtered bags using a stomacher (Model 80,
Seward Medical, London, UK) for 2 min at high speed mode. Filtered solution was
used for microbial enumeration either by plating or by Most Probably Number (MPN)
Page 128
116
procedure. For direct plating, 50 µLfiltrate or appropriate dilution was spiral plated
on Sorbitol MacConkey agar (SMAC, Neogen Inc., Lansing, MI, USA) plates
supplemented with 200 µg/mL ampicillin using a Whitley automatic spiral plater
(Wasp II, Don Whitley Scientific Ltd., West Yorkshire, UK) and incubated at 37 °C
overnight. Colonies of E. coli O157:H7 or O104:H4 were counted with an automated
plate counter (ProtoCOL, Synoptics, Cambridge, UK) and reported as log cfu/g of
sample. For the purpose of direct quantitative comparison, E. coli counts on sprouts
and microgreens were also reported as log cfu per “gram seed equivalent” (gse),
which represented cell counts on sprouts or microgreens germinated from 1 g of seed
and was calculated by factoring in the average yields of sprouts or microgreens. MPN
procedure (Luo et al., 2011) was used when the expected cell population was low (<
2.3 log cfu/g). Eight 3-mL aliquots of sample filtrate were 10-fold serially diluted
using TSB supplemented with 100 µg/mL ampicillin in a deepwell microplate (5.0
mL x 48 wells) and incubated overnight at 37 °C. Subsequently, 2.5 µL of the
enriched bacterial solution in each well was arrayed on SMAC plates with 200 mg/L
ampicillin and incubation overnight 37 °C. Corresponding patches with green
fluorescence were counted as positive for E. coli O157:H7, and red (sorbitol
fermenting) patches counted as E. coli O104:H4. The E. coli population was
calculated using an online MPN calculator (Curiale, 2004). The results were
expressed as log cfu/g of sample.
6.3.6 Microbiological profile of growth media and seeds
The microbiological profiles of germination mix and un-inoculated radish seeds
were determined using 3M™ Petrifilms (3M Inc., St. Paul, MN, USA). Germination
Page 129
117
mix (5 g) or radish seeds (5 g) was mixed with 45 mL PBS and stomached for 2 min
as above. Aliquots of 1 mL filtrate or its dilution was placed on appropriate biofilms
and incubated as follow. Aerobic mesophilic bacteria (AMB) were determined on
3M™ Petrifilm™ Aerobic Count Plates incubated at 37 °C for 24h; yeasts and molds
(Y&M) were determined on 3M™ Petrifilm™ Yeast and Mold Count Plates
incubated at 25 °C for 5d; Enterobacteriaceae (EB) counts were determined on 3M™
Petrifilm™ Enterobacteriaceae Count Plates incubated at 37 °C for 24h; and total
coliforms (TC) were determined on 3M™ Petrifilm™ E. coli/Coliform Count Plates
incubated at 37 °C for 24h. The filtrates of germination mix and radish seeds were
also spread on SMAC containing 100 µg/mL of ampicillin to screen for the presence
of bacteria that might form colonies indistinguishable from that of E. coli O104:H4.
No such colonies were observed.
6.3.7 Statistical analysis
All the experiments were conducted in four replications. Reported data were
expressed as the mean ± standard error (SE). Microbial data were log transformed.
Univariate analysis of variance (ANOVA) was performed with SPSS 13.0 for
Windows (SPSS Inc, Chicago, IL, USA). The statistical significance of the data was
determined by performing Tukey‟s honestly significant difference (HSD) tests for
post hoc multiple comparisons at an experiment-wise significance level of 0.05.
6.4 Results and Discussion
6.4.1 Microbiological profile of growth medium and seeds
Page 130
118
Fig. 6.1 showed the microbial populations of germination mix and raw radish
seeds. The main microbiological group in germination mix was yeasts and molds at
5.7 log cfu/g and followed by total aerobic mesophilic bacteria at 3.7 log cfu/g.
Fig. 6.1 Populations of total aerobic plate counts (APC), yeast and mold (Y&M),
Enterobacteriaceae count (EB) and E. coli/Coliforms count (EC) on growth
medium and radish seeds.
Vertical bars represent standard errors (n = 4).
Enterobacteriaceae counts in germination mix amounted to 3.5 log cfu/g, same as
total E. coli/Coliform, indicating Enterobacteriaceae in germination mix was
primarily composed of E. coli/Coliforms. The main component of germination mix is
Sphagnum peat moss which could inhibit bacterial growth due to the low pH, but had
Page 131
119
a less effect on yeast and molds (Cocozza et al., 2003; Everett et al., 2013). This
could explain why the yeasts and molds count was high and target pathogens were not
found in the growth medium.
Indigenous microbial populations on raw radish seeds were mainly composed of
aerobic mesophilic bacteria and yeast & mold, amounting to 3.3 and 2.5 log cfu/g,
respectively. These results agree with previously published observations showing that
seeds typically carried microbial loads ranging from 103 to 10
6 cfu/g (Kim et al.,
2009; Robertson et al., 2002). Enterobacteriaceae or E. coli/Coliform bacteria were
not detected on radish seeds.
6.4.2 E. coli O157: H7 growth on radish sprouts and microgreens
The survival and growth of E. coli O157: H7 on radish sprouts and microgreens
produced from seeds with different inoculation levels were shown in Fig. 6.2. E. coli
O157: H7 was not detected on non-inoculated radish seeds or the resultant sprouts
and microgreens. By the end of 5-day sprouting, sprouts germinated from radish
seeds inoculated at high level (4.6 log cfu/g) carried E. coli O157: H7 population of
8.1 log cfu/g (or 9.0 log cfu/gse). Those from radish seeds inoculated at low level (1.5
log cfu/g) carried a much lower E. coli O157:H7 population (7.6 log cfu/g or 8.5 log
cfu/gse). For sporadically contaminated seeds (1% seed inoculated), E. coli O157: H7
populations on sprouts reached 5.8 log cfu/g (or 6.7 log cfu/gse). Although no attempt
was made to quantify the growth of E. coli O157:H7 during sprouting, the above data
indicated that E. coli O157:H7 was capable of growth by at least 3.2 to 5.1 logs.
Previous studies showed that low levels of Salmonella species inoculated on alfalfa
seeds increased by as much as 4 to 5 logs in the germinated sprouts (Andrews et al.,
Page 132
120
1982) and E. coli O157: H7 inoculated alfalfa seeds increased by 2 to 4 logs in the
sprouts (Stewart et al., 2001). Prokopowich et al. (1991) previously reported that
Fig. 6.2 Populations of E. coli O157: H7 on radish seeds, sprouts, and
microgreens, produced from un-inoculated, low level, high level and sporadically
inoculated seeds.
Sporadically contaminated seed treatment is a mix of 1% high level inoculated seeds
with un-inoculated seeds. Vertical bars represent standard errors (n = 4).
microbial populations on sprouts obtained from retail stores reached as high as 109
cfu/g. In contrast, microgreens grown from similarly inoculated radish seeds carried
significantly lower (P < 0.001) population of E. coli O157: H7 cells. E. coli O157:H7
population reached 3.5, 4.5, and 0.8 log cfu/g on microgreens grown from low, high,
and sporadically inoculated radish seeds, respectively, which corresponded to 4.5, 5.5
and 1.8 log cfu/gse.
Page 133
121
6.4.3 E. coli O104: H4 growth on radish sprouts and microgreens
The initial inoculation levels of E. coli O104: H4 on radish seeds were 4.3 log
cfu/g for high level, 0.8 log cfu/g for low level and 2.3 log cfu/g for sporadic
inoculation which is a mix of 1% high level inoculated seeds with un-inoculated
seeds. Un-inoculated seeds were also carried out as control, with no target bacteria
detected in either sprouts or microgreens. As with E. coli O157:H7, the populations of
E. coli
Fig. 6.3 Populations of E. coli O104: H4 on radish seeds, sprouts, and
microgreens, produced from un-inoculated, low level, high level and sporadically
inoculated seeds.
Sporadically contaminated seed treatment is a mix of 1% high level inoculated seeds
with un-inoculated seeds. Vertical bars represent standard errors (n = 4).
Page 134
122
O104: H4 on radish sprouts were significantly (P < 0.001) higher (3.3 to 4.6 logs)
than those on the seeds, indicating significant proliferation during seed germination
and sprout growth. E. coli O104:H4 populations on sprouts reached 5.2, 7.3 and 5.3
log cfu/g, or 6.1, 8.2 and 6.2 log cfu/gse, respectively, for those germinated from low,
high, and sporadically inoculated radish seeds. Disregarding E. coli O104:H4 cells
removed with daily rinsing, these results represented a proliferation of E. coli
O104:H4 during sprouting by 2.9 - 4.4 logs from seeds inoculated at different levels.
On the other hand, the proliferation of E. coli O104:H4 on the edible part of
microgreens was less significant. E. coli O104:H4 populations on harvested
microgreens reached 1.8, 4.0 and 0.6 log cfu/g, or 2.8, 5.0, and 1.6 log cfu/gse,
respectively, for seeds inoculated at low level, high level, and those inoculated
sporadically. These would represent proliferation of E. coli O104:H4 by -0.6, 0.0 and
1.0 logs on the microgreens. However, since it was likely that a large fraction of the
proliferations by E. coli O104:H4 was not counted for by analyzing the harvested
microgreen tissues, the actual proliferation by E. coli O104:H4 was likely more
significant. The low proliferation of E. coli O104:H4 on microgreens germinated
from sporadically inoculated seeds could be due to un-uniform distribution of bacteria
and sampling of microgreens.
Overall, both E. coli O157:H7 and O104: H4 on inoculated radish seeds
significantly proliferated during sprouting, and to a lesser extent, during the
germination and growth of microgreens, regardless of the initial inoculation levels. At
the same seed contamination level, cell counts of E. coli O157:H7 and O104:H4 on
harvested microgreens tend to be 3-4 logs lower than those on sprouts. The higher
Page 135
123
growth of E. coli on sprouts could be primarily due to the frequent rinsing and
mixing, which greatly promote the dispersion and redistribution of bacterial cells on
various parts of sprouts. Other factors unique to sprouting, such as high humidity and
darkness, could also contribute to the higher growth of bacterial pathogens on sprouts.
Another evident explanation for the lower bacterial cell counts on microgreens is the
fact that only a part of the plants is harvested, leaving bacterial cells on seed coats,
roots, and lower stems, and in growth substrata unaccounted.
Since neither sprouts nor microgreens generally involve a kill step for bacterial
inactivation before consumption, preventing seed contamination is the key to
ensuring the safety of these products. Current FDA guidelines require effective
antimicrobial seed treatments for sprouting. However, most of the available seed
treatments fail to completely inactivate bacteria cells attached to various seeds used
for sprouting (Chyer et al., 2003; Weissinger & Beuchat, 2000). Data presented here
indicated that significant proliferation by both E. coli O157:H7 and O104:H4
occurred during sprouting at low levels of seed contamination.
6.5 Conclusions
In conclusion, E. coli populations on harvested radish microgreens were 3-4 logs
lower than that on sprouts produced from seeds with same contamination levels. In
our laboratory study, microgreens seemed to present relatively low food safety risks
in comparison to sprouts germinated from seeds with the same contamination levels;
however, significant proliferation of bacterial pathogens occurs during microgreen
growth. Therefore, it is of great importance to minimize bacterial contamination of
seeds for sprouts and microgreens.
Page 136
124
Chapter 7: Conclusions and Future Work
7.1 Conclusions
This research project is the first comprehensive study the new specialty food
product: microgreens. The main research findings are as follows:
Microgreens provide attractive appearance, tender texture and intense flavor,
and serve as excellent sources of healthful nutrients.
Microgreens are generally more nutrient-dense than their mature counterparts,
compared with the records in USDA National Nutrient Database.
All microgreens evaluated in our study demonstrated “good” to “excellent”
consumer acceptance and nutritional profile.
Overall acceptability of microgreens was strongly correlated to flavor
acceptability.
The quality maintenance and shelf life extension of radish microgreens could
be achieved by using low temperature and modified atmosphere packaging.
Light exposure speeded up transpiration, thus accelerated quality deterioration
and increased weight loss of radish microgreens during postharvest storage.
During postharvest storage, transportation and retail of radish microgreens,
light exposure should be avoided as it hasten senescence attributes.
E. coli populations on radish microgreens were 3-4 logs lower than that on
sprouts produced from seeds with same contamination levels.
Compared to sprouts, microgreens seem to bear relatively lower safety risks.
Page 137
125
7.2 Future Work
Several research directions arise from our research findings in this dissertation.
7.2.1 Chemical, Enzymatic and Molecular Analysis of Microgreens.
It is our intention to investigate thoroughly the underlying mechanism of the
observation that microgreens are more nutrient-dense than mature plants. The starting
point will be nutrient biosynthesis during growth and gene expression. Taking
ascorbic acid as an example, as reported in the literatures (Dan et al., 1996), ascorbic
acid is synthesized from L-galactono-1, 4-lactone by L-galactono-γ-lactone
dehydrogenase (GLDH; EC 1.3.2.3); therefore, enzymatic and molecular analysis of
plants at different growth stages could provide us the information on the changes in
enzyme activity and gene expression occurred during seed germination and plant
growth.
7.2.2 Ready-to-eat Microgreens Versus Living Microgreens
Our quality study on microgreens has shown us the optimal condition for
postharvest storage, however, wash treatment did not work well on developing ready-
to-eat microgreens products. To date, there is no ready-to-eat microgreens available
in supermarkets, therefore, it is necessary to develop ready-to-eat microgreens with
good quality, long shelf life and ensured safety. Our aim is to develop and explore
appropriate wash and dry processes, well-performed packaging materials and
effective sanitizers to minimize the safety risk of microgreens consumption.
As seen in some restaurants and grocery stores, microgreens are sold as living forms
in containers with growth medium in it. It seems like the living microgreens look
fresher and have longer shelf life. Is it true? As living plants, microgreens need
Page 138
126
adequate light exposure to maintain photosynthesis, otherwise, yellowing and wilting
could happen. During transportation and storage, living microgreens may undergo a
long period of dark time, which may have an impact on sensorial and nutritional
quality. It will be of interest to carry out a comparative postharvest study between
ready-to-eat microgreens and living microgreens.
7.2.3 Microbiological Safety Study of Microgreens
Based on our research finding on the comparison of E. coli growth on sprouts and
microgreens, it can be seen that microgreens seem to present a lower food safety risk.
Therefore, the mechanisms of bacterial distribution, attachment and interaction with
the microgreens plants could be further investigated. As reported, specific virulence
genes are required for bacterial attachment to plant tissues (Barak et al., 2005);
therefore, molecular genetic analysis would help to explore the interaction of
pathogens and microgreens. In addition, microscopy strategy, such as confocal
scanning laser microscopy, can be used to observe the morphology of pathogen and
plant cells and interaction between them.
Page 139
127
References
Abbott, J.A., Saftner, R.A., Gross, K.C., Vinyard, B.T., Janick, J., 2004. Consumer
evaluation and quality measurement of fresh-cut slices of „Fuji,‟ „Golden Delicious,‟
„Gold Rush,‟ and „Granny Smith‟ apples. Postharvest Biol. Tec. 33, 127-140.
Al Safadi, R., Abu-Ali, G.S., Sloup, R.E., Rudrik, J.T., Waters, C.M., Eaton, K.A.,
Manning, S.D., 2012. Correlation between in vivo biofilm formation and virulence
gene expression in Escherichia coli O104: H4. PloS one 7, e41628.
Allende, A., Luo, Y.G., McEvoy, J.L., Artés, F., Wang, C.Y., 2004. Microbial and
quality changes in minimally processed baby spinach leaves stored under super
atmospheric oxygen and modified atmosphere conditions. Postharvest Biol. Tec. 33,
51-59.
Andrews, W., Mislivec, P., Wilson, C., Bruce, V., Poelma, P., Gibson, R., Trucksess,
M., Young, K., 1982. Microbial hazards associated with bean sprouting. J. AOAC Int.
65, 241-248.
Artés, F., Gómez, P., Aguayo, E., Escalona, V., Artés-Hernández, F., 2009.
Sustainable sanitation techniques for keeping quality and safety of fresh-cut plant
commodities. Postharvest Biol. Tec. 51, 287-296.
Artés, F., Gómez, P., Artés-Hernández, F., Aguayo, E., Escalona, V., 2007. Improved
strategies for keeping overall quality of fresh-cut produce. ISHS Acta Horticulturae
746, 245-258.
Auderset, G., Sandelius, A.S., Penel, C., Brightman, A., Greppin, H., Morre, D.J.,
1986. Isolation of plasma membrane and tonoplast fractions from spinach leaves by
Page 140
128
preparative free-flow electrophoresis and effect of photoinduction. Physiol. Plantarum
68, 1-12.
Ayala, F., Echavarri, J.F., Olarte, C., Sanz, S., 2009. Quality characteristics of
minimally processed leek packaged using different films and stored in lighting
conditions. Int. J. Food Sci. Tech. 44, 1333-1343.
Baldwin, E., Scott, J., Einstein, M., Malundo, T., Carr, B., Shewfelt, R., Tandon, K.,
1998. Relationship between sensory and instrumental analysis for tomato flavor. J.
Am. Soc. Hortic. Sci. 123, 906-915.
Barak, J.D., Gorski, L., Naraghi-Arani, P., Charkowski, A.O., 2005. Salmonella
enterica virulence genes are required for bacterial attachment to plant tissue. Appl.
Environ. Microbiol. 71, 5685-5691.
Barrett, D.M., Beaulieu, J.C., Shewfelt, R., 2010. Color, flavor, texture, and
nutritional quality of fresh-cut fruits and vegetables: desirable levels, instrumental
and sensory measurement, and the effects of processing. Crit. Rev. Food Sci. Nutr.
50, 369-389.
Bartoli, C.G., Yu, J., Gómez, F., Fernández, L., McIntosh, L., Foyer, C.H., 2006.
Inter-relationships between light and respiration in the control of ascorbic acid
synthesis and accumulation in Arabidopsis thaliana leaves. J. Exp. Bot. 57, 1621-
1631.
Bergquist, S.A.M., Gertsson, U.E., Olsson, M.E., 2006. Influence of growth stage and
postharvest storage on ascorbic acid and carotenoid content and visual quality of baby
spinach (Spinacia oleracea L.). J. Sci. Food Agr. 86, 346-355.
Page 141
129
Betts, G., Everis, L., Jongen, W., 2005. Alternatives to hypochlorite washing systems
for the decontamination of fresh fruit and vegetables. Improving the safety of fresh
fruit and vegetables, 351-372.
Beuchat, L., 1998. Surface decontamination of fruits and vegetables eaten raw: a
review. WHO/FSF/FOS/98.2, 42.
Bolton-Smith, C., Price, R.J.G., Fenton, S.T., Harrington, D.J., Shearer, M.J., 2000.
Compilation of a provisional UK database for the phylloquinone (vitamin K1) content
of foods. Brit. J. Nutr. 83, 389-399.
Booth, S.L., Davidson, K.W., Sadowski, J.A., 1994. Evaluation of an HPLC method
for the determination of phylloquinone (vitamin K1) in various food matrices. J. Agr.
Food Chem. 42, 295-300.
Brentlinger, D., 2005. New trends in hydroponic crop production in the US,
International Conference and Exhibition on Soilless Culture: ICESC 742, 31-33.
Bravo, L., 1998. Polyphenols: chemistry, dietary sources, metabolism, and nutritional
significance. Nutr. Rev. 56, 317-333.
Büchert, A.M., Lobato, M.E.G., Villarreal, N.M., Civello, P.M., Martinez, G.A.,
2011. Effect of visible light treatments on postharvest senescence of broccoli
(Brassica oleracea L.). J. Sci. Food Agr. 91, 355-361.
Bunea, A., Andjelkovic, M., Socaciu, C., Bobis, O., Neacsu, M., Verhe, R., Van
Camp, J., 2008. Total and individual carotenoids and phenolic acids content in fresh,
refrigerated and processed spinach (Spinacia oleracea L.). Food Chem. 108, 649-656.
Catherine Rice-Evans, N.J.M., 1995. Antioxidants - the case for fruit and vegetables
in the diet. Brit. Food J. 97, 35 - 40.
Page 142
130
Chandra, D., Kim, J.G., Kim, Y.P., 2012. Changes in microbial population and
quality of microgreens treated with different sanitizers and packaging films. Hortic.
Environ. Biotech. 53, 32-40.
Cheng, Z., Moore, J., Yu, L., 2006. High-throughput relative DPPH radical
scavenging capacity assay. J. Agr. Food Chem. 54, 7429-7436.
Chyer, K., Yen-Con, H., Brackett, R.E., Chyi-Shen, L., 2003. Efficacy of electrolyzed
oxidizing water in inactivating Salmonella on alfalfa seeds and sprouts. J. Food
Protect. 66, 208-214.
Cocozza, C., D'orazio, V., Miano, T., Shotyk, W., 2003. Characterization of solid and
aqueous phases of a peat bog profile using molecular fluorescence spectroscopy, ESR
and FT-IR, and comparison with physical properties. Org. Geochem. 34, 49-60.
Craig, W.J., 1997. Phytochemicals: guardians of our health. J. Am. Diet. Assoc. 97,
S199-S204.
Craig, W., Beck, L., 1999. Phytochemicals: Health Protective Effects. Can. J. Diet
Pract. Res. 60, 78 -84.
Crawford, L.M., Ruff, E.H., 1996. A review of the safety of cold pasteurization
through irradiation. Food Control 7, 87-97.
Curiale M. 2004. MPN calculator (VB6 version) for food, feed, and water
microbiologist. Available from: www.i2workout.com/mcuriale/mpn/index.html.
Dan, K., Nagata, M., Yamashita, I., 1996. Changes in lipid peroxidation and
antioxidants content in cotyledons of Japanese radish [Raphanus sativus]. J. Jpn. Soc.
Hortic. Sci. 65.
Page 143
131
Demurin, Y., Skoric, D., Karlovic, D., 1996. Genetic variability of tocopherol
composition in sunflower seeds as a basis of breeding for improved oil quality. Plant
Breeding 115, 33-36.
Drewnowski, A., Gomez-Carneros, C., 2000. Bitter taste, phytonutrients, and the
consumer: a review. Am. J. Clin. Nutr. 72, 1424-1435.
Dwiyanti, M.S., Yamada, T., Sato, M., Abe, J., Kitamura, K., 2011. Genetic variation
of γ-tocopherol methyltransferase gene contributes to elevated α-tocopherol content
in soybean seeds. Plant Biology 11, 1-17.
EPA Guidance Manual, 1999.
http://water.epa.gov/lawsregs/rulesregs/sdwa/mdbp/upload/2001_01_12_mdbp_alter_
chapt_4.pdf
Escribano, S., Sánchez, F.J., Lázaro, A., 2010. Establishment of a sensory
characterization protocol for melon (Cucumis melo L.) and its correlation with
physical–chemical attributes: indications for future genetic improvements. Eur. Food
Res. Technol. 231, 611-621.
Everett, D., Vizzier-Thaxton, Y., McDaniel, C., Kiess, A., 2013. The impact of peat
moss amendments on the microbial load in used pine shaving poultry litter. Int. J.
Poultry Sci. 12, 202-205.
Fan, X.T., Sokorai, K.J.B., 2005. Assessment of radiation sensitivity of fresh-cut
vegetables using electrolyte leakage measurement. Postharvest Biol. Tec. 36, 191-
197.
Page 144
132
Farber, J., Harris, L., Parish, M., Beuchat, L., Suslow, T., Gorney, J., Garrett, E.,
Busta, F., 2003. Microbiological safety of controlled and modified atmosphere
packaging of fresh and fresh‐cut produce. Compr. Rev. Food Sci. F. 2, 142-160.
Francis, G., Gallone, A., Nychas, G., Sofos, J., Colelli, G., Amodio, M., Spano, G.,
2012. Factors affecting quality and safety of fresh-cut produce. Crit. Rev. Food Sci.
Nutr. 52, 595-610.
Fratamico, P.M., Deng, M.Y., Strobaugh, T.P., Palumbo, S.A., 1997. Construction
and characterization of Escherichia coli O157: H7 strains expressing firefly luciferase
and green fluorescent protein and their use in survival studies. J. Food Protect. 60,
1167-1173.
Galvez, A.B., Garcia, M.V., Corrales, J.C., Lopez, A.C., Valenzuela, J.A.L., 2010.
Effect of gradual cooling storage on chilling injury and phenylalanine ammonia-lyase
activity in tomato fruit. J. Food Biochem. 34, 295-307.
Goldman, I.L., Kader, A.A., Heintz, C., 1999. Influence of production, handling, and
storage on phytonutrient content of foods. Nutr. Rev. 57, S46-S52.
Gómez, P., Alzamora, S., Castro, M., Salvatori, D., 2010. Effect of ultraviolet-C light
dose on quality of cut-apple: Microorganism, color and compression behavior. J.
Food Eng. 98, 60-70.
Gómez-López, V.M., Devlieghere, F., Bonduelle, V., Debevere, J., 2005. Intense
light pulses decontamination of minimally processed vegetables and their shelf-life.
Int. J. Food Microbiol. 103, 79-89.
Page 145
133
Hansen, T., Petersen, M.A., Byrne, D.V., 2005. Sensory based quality control
utilising an electronic nose and GC-MS analyses to predict end-product quality from
raw materials. Meat science 69, 621-634.
Havaux, M., Niyogi, K.K., 1999. The violaxanthin cycle protects plants from
photooxidative damage by more than one mechanism. Proceedings of the National
Academy of Sciences of the United States of America 96, 8762-8767.
Heaton, J.W., Marangoni, A.G., 1996. Chlorophyll degradation in processed foods
and senescent plant tissues. Trends Food Sci. Tech. 7, 8-15.
Hidaka, T., Kirigaya, T., Kamijo, M., Kikawa, H., Kawamura, T., Kawauchi, S.,
1992. Disappearance of residual chlorine and formation of chloroform in vegetables
treated with sodium hypochlorite. J. Food Hyg. Soc. Japan, 33, 267.
Hodges, D.M., Forney, C.F., Wismer, W., 2000. Processing line effects on storage
attributes of fresh-cut spinach leaves. HortScience 35, 1308-1311.
Hodges, D.M., Forney, C.F., Wismer, W.V., 2001. Antioxidant responses in
harvested leaves of two cultivars of spinach differing in senescence rates. J. Am. Soc.
Hortic. Sci. 126, 611-617.
Hodges, D.M., Lester, G.E., Munro, K.D., Toivonen, P.M.A., 2004. Oxidative stress:
Importance for postharvest quality. Hortscience 39, 924-929.
Huang, D.J., Ou, B.X., Prior, R.L., 2005. The chemistry behind antioxidant capacity
assays. J. Agr. Food Chem. 53, 1841-1856.
Huang, Y.R., Hung, Y.C., Hsu, S.Y., Huang, Y.W., Hwang, D.F., 2008. Application
of electrolyzed water in the food industry. Food Control 19, 329-345.
Page 146
134
Hung, H.C., Joshipura, K.J., Jiang, R., Hu, F.B., Hunter, D., Smith-Warner, S.A.,
Colditz, G.A., Rosner, B., Spiegelman, D., Willett, W.C., 2004. Fruit and vegetable
intake and risk of major chronic disease. J. Natl. Cancer Inst. 96, 1577-1584.
Iqbal, K., Khan, A., Khattak, M., 2004. Biological significance of ascorbic acid
(vitamin C) in human health - a review. Pakistan J. Nutr. 3, 5-13.
Jahns, P., Latowski, D., Strzalka, K., 2009. Mechanism and regulation of the
violaxanthin cycle: The role of antenna proteins and membrane lipids. Biochim.
Biophys. Acta Bioenergetics 1787, 3-14.
Johnson, R., 2010. Potential trade implications of restrictions on antimicrobial use in
animal production. DIANE Publishing.
Julkunen-Tiitto, R., Sorsa, S., 2001. Testing the effects of drying methods on willow
flavonoids, tannins, and salicylates. J. Chem. Ecol. 27, 779-789.
Kalt, W., Forney, C.F., Martin, A., Prior, R.L., 1999. Antioxidant capacity, vitamin
C, phenolics, and anthocyanins after fresh storage of small fruits. J. Agi. Food Chem.
47, 4638-4644.
Kamal-Eldin, A., Appelqvist, L., 1996. The chemistry and antioxidant properties of
tocopherols and tocotrienols. Lipids 31, 671-701.
Kasim, R., Kasim, M.U., 2007. Inhibition of yellowing in Brussels sprouts (B.
oleraceae var. gemmifera) and broccoli (B. oleraceae var. italica) using light during
storage. J. Food Agric. Environ. 5, 126-130.
Kaur, C., Kapoor, H.C., 2001. Antioxidants in fruits and vegetables-the millennium‟s
health. Int. J. Food Sci. Tech. 36, 703-725.
Page 147
135
Keast, R.S., Breslin, P.A., 2003. An overview of binary taste-taste interactions. Food
Qual. Prefer. 14, 111-124.
Kevers, C., Falkowski, M., Tabart, J., Defraigne, J.O., Dommes, J., Pincemail, J.,
2007. Evolution of antioxidant capacity during storage of selected fruits and
vegetables. J. Agr. Food Chem. 55, 8596-8603.
Kim, H., Lee, Y., Beuchat, L.R., Yoon, B.J., Ryu, J.H., 2009. Microbiological
examination of vegetable seed sprouts in Korea. J. Food Protect. 72, 856-859.
Kim, J.G., Luo, Y., Gross, K.C., 2004. Quality and shelf-life of salad savoy under
different storage temperatures. J. Kor. Soc. Hort. Sci. 45, 307-311.
Kim, J.G., Luo, Y.G., Saftner, R.A., Gross, K.C., 2005. Delayed modified atmosphere
packaging of fresh-cut romaine lettuce: Effects on quality maintenance and shelf-life.
J. Am. Soc. Hortic. Sci. 130, 116-123.
Kobori, C.N., Arnaya, D.B.R., 2008. Uncultivated Brazilian green leaves are richer
sources of carotenoids than are commercially produced leafy vegetables. Food Nutr.
Bull. 29, 320-328.
Kobori, C.N., Huber, L.S., Sarantopoulos, C.I.G.L., Rodriguez-Amaya, D.B., 2011.
Behavior of flavonols and carotenoids of minimally processed kale leaves during
storage in passive modified atmosphere packaging. J. Food Sci. 76, H31-H37.
Koseki, S., Itoh, K., 2002. Effect of nitrogen gas packaging on the quality and
microbial growth of fresh-cut vegetables under low temperatures. J. Food Protect. 65,
326-332.
Page 148
136
Kou, L.P., Luo, Y.G., Yang, T.B., Xiao, Z.L., Turner, E.R., Lester, G.E., Wang, Q.,
Camp, M.J., 2013. Postharvest biology, quality and shelf life of buckwheat
microgreens. LWT-Food Sci. Technol. 51, 73-78.
Kris-Etherton, P.M., Hecker, K.D., Bonanome, A., Coval, S.M., Binkoski, A.E.,
Hilpert, K.F., Griel, A.E., Etherton, T.D., 2002. Bioactive compounds in foods: their
role in the prevention of cardiovascular disease and cancer. Am. J. Med. 113, 71-88.
Lawless, H.T., Horne, J., Giasi, P., 1996. Astringency of organic acids is related to
pH. Chem. Senses 21, 397-403.
Lee, J. S., Pill, W.G., Cobb, B. B., Olszewski, M., 2004. Seed treatments to advance
greenhouse establishment of beet and chard microgreens. J. Hortic. Sci. Biotech. 79,
565-570. Lee, J. S., Kim, J. G., Park, S., 2009. Effects of chlorine wash on the
quality and microbial population of 'Tah Tasai' Chinese cabbage (Brassica campestris
var. narinosa) microgreen. Korean J. Hortic. Sci. Tech. 27, 625-630.
Lester, G.E., Hallman, G.J., Perez, J.A., 2010a. Gamma-irradiation dose: effects on
baby-leaf spinach ascorbic acid, carotenoids, folate, alpha-tocopherol, and
phylloquinone concentrations. J. Agr. Food Chem. 58, 4901-4906.
Lester, G.E., Makus, D.J., Hodges, D.M., 2010b. Relationship between fresh-
packaged spinach leaves exposed to continuous light or dark and bioactive contents:
effects of cultivar, leaf size, and storage duration. J. Agr. Food Chem. 58, 2980-2987.
Lester, G.E., Makus, D.J., Hodges, D.M., Jifon, J.L., 2013. Summer (subarctic)
versus winter (subtropic) production affects spinach (Spinacia oleracea L.) leaf
bionutrients: vitamins (C, E, Folate, K1, provitamin A), lutein, phenolics, and
antioxidants. J. Agr. Food Chem. 61, 7019-7027.
Page 149
137
Line, J., Stern, N., Lattuada, C., Benson, S.T., 2001. Comparison of methods for
recovery and enumeration of Campylobacter from freshly processed broilers. J. Food
Protect. 64, 982-986.
Lubián, L.M., Montero, O., 1998. Excess light-induced violaxanthin cycle activity in
Nannochloropsis gaditana (Eustigmatophyceae): effects of exposure time and
temperature. Phycologia 37, 16-23.
Luo, Y., McEvoy, J.L., Wachtel, M.R., Kim, J.G., Huang, Y., 2004. Package
atmosphere affects postharvest biology and quality of fresh-cut cilantro leaves.
HortScience 39, 567-570.
Luo, Y., Nou, X., Yang, Y., Alegre, I., Turner, E., Feng, H., Abadias, M., Conway,
W., 2011. Determination of free chlorine concentrations needed to prevent
Escherichia coli O157: H7 cross-contamination during fresh-cut produce wash. J.
Food Protect. 74, 352-358.
Lyndhurst, B., 2009. An evidence review of public attitudes to emerging food
technologies. Social Science Research Unit, Food Standards Agency, Crown.
Ma, L., Lin, X.M., 2010. Effects of lutein and zeaxanthin on aspects of eye health. J.
Sci. Food Agr. 90, 2-12.
Manolopoulou, H., Lambrinos, G., Chatzis, E., Xanthopoulos, G., Aravantinos, E.,
2010. Effect of temperature and modified atmosphere packaging on storage quality of
fresh-cut romaine lettuce. J. Food Quality 33, 317-336.
Martínez-Sánchez, A., Tudela, J.A., Luna, C., Allende, A., Gil, M.I., 2011. Low
oxygen levels and light exposure affect quality of fresh-cut Romaine lettuce.
Postharvest Biol. Tec. 59, 34-42.
Page 150
138
Martínez-Villaluenga, C., Frías, J., Gulewicz, P., Gulewicz, K., Vidal-Valverde, C.,
2008. Food safety evaluation of broccoli and radish sprouts. Food Chem. Toxicol. 46,
1635-1644.
Mayne, S.T., 1996. Beta-carotene, carotenoids, and disease prevention in humans.
The FASEB Journal 10, 690-701.
Medina, M.B., 2011. Determination of the total phenolics in juices and superfruits by
a novel chemical method. J. Funct. Foods 3, 79-87.
Meilgaard, M., Civille, G.V., Carr, T., 1991. Sensory evaluation techniques, 2nd
edition. CRC Press, Boca Raton, FL.
Mensah, J.K., Okoli, R.I., Ohaju-Obodo, J.O., Eifediyi, K., 2008. Phytochemical,
nutritional and medical properties of some leafy vegetables consumed by Edo people
of Nigeria. Afr. J. Biotech. 7, 2304-2309.
Molins, R., Motarjemi, Y., Käferstein, F., 2001. Irradiation: a critical control point in
ensuring the microbiological safety of raw foods. Food Control 12, 347-356.
Moore, J., Yin, J.J., Yu, L., 2006. Novel fluorometric assay for hydroxyl radical
scavenging capacity (HOSC) estimation. J. Agr. Food Chem. 54, 617-626.
Murphy, C.J., Pill, W.G., 2010. Cultural practices to speed the growth of microgreen
arugula (roquette; Eruca vesicaria subsp sativa). J. Hortic. Sci. Biotech. 85, 171-176.
NACMCF, 1999. Microbiological safety evaluations and recommendations on
sprouted seeds. Int. J. Food Microbiol. 52, 123-153.
Noichinda, S., Bodhipadma, K., Mahamontri, C., Narongruk, T., Ketsa, S., 2007.
Light during storage prevents loss of ascorbic acid, and increases glucose and
Page 151
139
fructose levels in Chinese kale (Brassica oleracea var. alboglabra). Postharvest
Biol.Tec. 44, 312-315.
Oh, M.M., Carey, E.E., Rajashekar, C.B., 2010. Regulated water deficits improve
phytochemical concentration in lettuce. J. Am. Soc. Hortic. Sci. 135, 223-229.
Olarte, C., Sanz, S., Echavarri, J.F., Ayala, F., 2009. Effect of plastic permeability
and exposure to light during storage on the quality of minimally processed broccoli
and cauliflower. LWT-Food Sci. Technol. 42, 402-411.
Olivas, G., Barbosa-Cánovas, G., 2005. Edible coatings for fresh-cut fruits. Crit. Rev.
Food Sci. Nutr. 45, 657-670.
Olsen, N.V., Grunert, K.G., Sonne, A.-M., 2010. Consumer acceptance of high-
pressure processing and pulsed-electric field: a review. Trends Food Sci. Technol. 21,
464-472.
Oms-Oliu, G., Martín-Belloso, O., Soliva-Fortuny, R., 2010. Pulsed light treatments
for food preservation. A review. Food and Bioprocess Technology 3, 13-23.
Papas, A.M., 1999. The Vitamin E Factor, HarperCollins Publishers, Inc., New York,
NY.
Paull, R.E., 1999. Effect of temperature and relative humidity on fresh commodity
quality. Postharvest Biol. Tec. 15, 263-277.
Perry, A., Rasmussen, H., Johnson, E.J., 2009. Xanthophyll (lutein, zeaxanthin)
content in fruits, vegetables and corn and egg products. J. Food Compos. Anal. 22, 9-
15.
Piironen, V., Syvaoja, E., Varo, P., Salminen, K., Koivistoinen, P., 1986. Tocopherols
and tocotrienols in cereal products from Finland. Cereal Chem. 63, 78-81.
Page 152
140
Podsedek, A., Sosnowska, D., Redzynia, M., Anders, B., 2006. Antioxidant capacity
and content of Brassica oleracea dietary antioxidants. Int. J. Food Sci. Technol. 41,
49-58.
Pogson, B.J., Morris, S.C., 1997. Consequences of cool storage of broccoli on
physiological and biochemical changes and subsequent senescence at 20 degrees C. J.
Am. Soc. Hortic. Sci. 122, 553-558.
Porfirova, S., Bergmuller, E., Tropf, S., Lemke, R., Dormann, P., 2002. Isolation of
an Arabidopsis mutant lacking vitamin E and identification of a cyclase essential for
all tocopherol biosynthesis. Proceedings of the National Academy of Sciences of the
United States of America 99, 12495-12500.
Prokopowich, D., Blank, G., 1991. Microbiological evaluation of vegetable sprouts
and seeds. J. Food Protect. 54.
Punia, D., Yadav, S.K., Gupta, M., Khetarpaul, N., 2004. Nutrient composition of
amaranth (Amaranthus tricolor) and kondhara (Digeria arvensis) leaves and their
products. J. Food Sci. Technol.-Mysore 41, 563-566.
Rao, A., Rao, L.G., 2007. Carotenoids and human health. Pharmacol. Res. 55, 207-
216.
Rice-evans, C.A., Miller, N.J., Bolwell, P.G., Bramley, P.M., Pridham, J.B., 1995.
The relative antioxidant activities of plant-derived polyphenolic flavonoids. Free
Radical Res. 22, 375-383.
Rico, D., Martin-Diana, A.B., Barat, J.M., Barry-Ryan, C., 2007. Extending and
measuring the quality of fresh-cut fruit and vegetables: a review. Trends Food Sci.
Tech. 18, 373-386.
Page 153
141
Robertson, L.J., Johannessen, G.S., Gjerde, B.K., Loncarevic, S., 2002.
Microbiological analysis of seed sprouts in Norway. Int. J. Food Microbiol. 75, 119-
126.
Rojas-Graü, M.A., Soliva-Fortuny, R., Martín-Belloso, O., 2009. Edible coatings to
incorporate active ingredients to fresh-cut fruits: a review. Trends Food Sci. Technol.
20, 438-447.
Saftner, R., Polashock, J., Ehlenfeldt, M., Vinyard, B., 2008. Instrumental and
sensory quality characteristics of blueberry fruit from twelve cultivars. Postharvest
Biol. Tec. 49, 19-26.
Sandhya, S., 2010. Modified atmosphere packaging of fresh produce: Current status
and future needs. LWT-Food Sci. Technol. 43, 381-392.
Sanz, S., Olarte, C., Ayala, F., Echavarri, J.F., 2008. The response to lighting of
minimally processed chard: influence on its shelf life. J. Sci. Food Agr. 88, 1622-
1631.
Sanz, S., Olarte, C., Ayala, F., Echavarri, J.F., 2009. Evolution of quality
characteristics of minimally processed asparagus during storage in different lighting
conditions. J. Food Sci. 74, S296-S302.
Sapers, G.M., Simmons, G.F., 1998. Hydrogen peroxide disinfection of minimally
processed fruits and vegetables. Food Technol. 52, 48-52.
Sapers, G., Sites, J., 2003. Efficacy of 1% hydrogen peroxide wash in
decontaminating apples and cantaloupe melons. J. Food Sci. 68, 1793-1797.
Page 154
142
Schwartz, H., Ilainen, V., Pfironen, V., Lampi, M.A., 2008. Tocopherol, tocotrienol
and plant sterol contents of vegetable oils and industrial fats. J. Food Compos. Anal.
21, 152-161.
Sharma, R., Demirci, A., 2003. Inactivation of Escherichia coli O157: H7 on
inoculated alfalfa seeds with pulsed ultraviolet light and response surface modeling. J.
Food Sci. 68, 1448-1453.
Singh, J., Upadhyay, A.K., Bahadur, A., Singh, B., Singh, K.P., Rai, M., 2006.
Antioxidant phytochernicals in cabbage (Brassica oleracea L. var. capitata). Scientia
Horticulturae 108, 233-237.
Sowalsky, R.A., Noble, A.C., 1998. Comparison of the effects of concentration, pH
and anion species on astringency and sourness of organic acids. Chem. Senses 23,
343-349.
Spinardi, A., Ferrante, A., 2012. Effect of storage temperature on quality changes of
minimally processed baby lettuce. J. Food Agric. Environ. 10, 38-42.
Stahl, W., Sies, H., 2003. Antioxidant activity of carotenoids. Mol. Aspects Med. 24,
345-351.
Stampfer, M.J., Hennekens, C.H., Manson, J.E., Colditz, G.A., Rosner, B., Willett,
W.C., 1993. Vitamin E consumption and the risk of coronary disease in women. New
Engl. J. Med. 328, 1444-1449.
Steinmetz, K.A., Potter, J.D., 1996. Vegetables, fruit, and cancer prevention: a
review. J. Am. Diet. Assoc. 96, 1027-1039.
Page 155
143
Stewart, D., Reineke, K., Ulaszek, J., Fu, T., Tortorello, M., 2001. Growth of
Escherichia coli O157: H7 during sprouting of alfalfa seeds. Lett. Appl. Microbiol.
33, 95-99.
Stommel, J.R., 1992. Enzymic components of sucrose accumulation in the wild
tomato species Lycopersicon peruvianum. Plant Physiol. 99, 324-328.
Takeshita, K., Shibato, J., Sameshima, T., Fukunaga, S., Isobe, S., Arihara, K., Itoh,
M., 2003. Damage of yeast cells induced by pulsed light irradiation. Int. J. Food
Microbiol. 85, 151-158.
Tan, B., 1989. Palm Carotenoids, tocopherols and tocotrienols. J. Am. Oil Chem. Soc.
66, 770-776.
Taormina, P.J., Beuchat, L.R., Slutsker, L., 1999. Infections associated with eating
seed sprouts: an international concern. Emerging Infect. Dis. 5, 626-634.
Tieman, D., Bliss, P., McIntyre, L.M., Blandon-Ubeda, A., Bies, D., Odabasi, A.Z.,
Rodríguez, G.R., van der Knaap, E., Taylor, M.G., Goulet, C., 2012. The chemical
interactions underlying tomato flavor preferences. Curr. Biol. 22, 1035-1039.
Tomás-Barberán, F.A., Espin, J.C., 2001. Phenolic compounds and related enzymes
as determinants of quality in fruits and vegetables. J. Sci. Food Agr. 81, 853-876.
Treadwell, D., Hochmuth, R., Landrum, L., Laughlin, W., 2010. Microgreens: a new
specialty crop. University of Florida IFAS Extension HS1164.
Tsujimura, M., Higasa, S., Nakayama, K., Yanagisawa, Y., Iwamoto, S., Kagawa, Y.,
2008. Vitamin C activity of dehydroascorbic acid in humans - association between
changes in the blood vitamin C concentration or urinary excretion after oral loading.
J. Nutr. Sci. Vitaminol. 54, 315-320.
Page 156
144
Turkmen, N., Sari, F., Velioglu, Y.S., 2005. The effect of cooking methods on total
phenolics and antioxidant activity of selected green vegetables. Food Chem. 93, 713-
718.
Uphoff, H., Hedrich, B., Strotmann, I., Arvand, M., Bettge-Weller, G., Hauri, A.,
2014. A prolonged investigation of an STEC-O104 cluster in Hesse, Germany, 2011
and implications for outbreak management. J. Public Health 22, 41-48.
USDA, 2011. National Nutrient Database for Standard Reference, Release 24.
http://www.ars.usda.gov/Services/docs.htm?docid=22113.
Wang, H., Feng, H., Luo, Y., 2004. Microbial reduction and storage quality of fresh-
cut cilantro washed with acidic electrolyzed water and aqueous ozone. Food Res. Int.
37, 949-956.
Weissinger, W., Beuchat, L., 2000. Comparison of aqueous chemical treatments to
eliminate Salmonella on alfalfa seeds. J. Food Protect. 63, 1475-1482.
Wills, R.B., Wong, A.W., Scriven, F.M., Greenfield, H., 1984. Nutrient composition
of Chinese vegetables. J. Agr. Food Chem. 32, 413-416.
Xiao, Z., Lester, G.E., Luo, Y., Wang, Q., 2012. Assessment of vitamin and
carotenoid concentrations of emerging food products: edible microgreens. J. Agr.
Food Chem. 60, 7644-7651.
Xiao, Z., Lester, G.E., Luo, Y., Xie, Z., Yu, L., Wang, Q., 2014. Effect of light
exposure on sensorial quality, concentrations of bioactive compounds and antioxidant
capacity of radish microgreens during low temperature storage. Food Chem. 151,
472-479.
Page 157
145
Xiao, Z., Luo, Y., Lester, G.E., Kou, L., Yang, T., Wang, Q., 2014. Postharvest
quality and shelf life of radish microgreens as impacted by storage temperature,
packaging film, and chlorine wash treatment. LWT-Food Sci. Technol. 55, 551-558.
Yamauchi, R., 2007. Addition products of alpha-tocopherol with lipid-derived free
radicals. Vitam. Horm. 76, 309-327.
Zhan, L.J., Li, Y., Hu, J.Q., Pang, L.Y., Fan, H.P., 2012. Browning inhibition and
quality preservation of fresh-cut romaine lettuce exposed to high intensity light.
Innov. Food Sci. Emerg. 14, 70-76.
Zhang, D., Hamauzu, Y., 2004. Phenolics, ascorbic acid, carotenoids and antioxidant
activity of broccoli and their changes during conventional and microwave cooking.
Food Chem. 88, 503-509.