ELECTRICAL & COMPUTER ENGINEERING DEPARTMENT UNIVERSITY OF UTAH ABSTRACTS OF STUDENT PRESENTATIONS March 26, 2009 ELECTRICAL & COMPUTER ENGINEERING DEPARTMENT UNIVERSITY OF UTAH ABSTRACTS OF STUDENT PRESENTATIONS March 26, 2009
Transcript
ELECTRICAL & COMPUTERENGINEERING DEPARTMENT
UNIVERSITY OF UTAH
ABSTRACTSOF
STUDENTPRESENTATIONS
March 26, 2009
ELECTRICAL & COMPUTERENGINEERING DEPARTMENT
UNIVERSITY OF UTAH
ABSTRACTSOF
STUDENTPRESENTATIONS
March 26, 2009
SESSION 1 L-3 COMMUNICATIONS CLINIC (AOA)2:45-4:25 p.m. Officer’s Club South
Brandt HammerChinh Dam
Eliza CrandallYi Xu
Brian Matthews
SESSION 2 L-3 COMMUNICATIONS CLINIC (TOOLS)12:45-2:25 p.m. Officer’s Club West
Jacob TateokaRohit PathakBeau Lund
Eric SeaburyBrian Rolfe
SESSION 3 MICRON TECHNOLOGY, INC. CLINIC12:45-2:25 p.m. Officer’s Club North
Raheem AlhamdaniBryson KentJordan Kemp
M. Lucas LoeroBen Meakin
SESSION 4 ROCKY MOUNTAIN POWER CLINIC12:25-2:05 p.m. Officer’s Club South
Stephen ManriqueCalvin Yan
Lance WaymentJack Dam
Jason Wayment
SESSION 5 SANDIA NATIONAL LABORATORIES CLINIC3:05-4:45 p.m. Officer’s Club North
Rashin BolkamehChris Chadwick
Michael B. StevensDaniel Rolfe
Eric Hsu
SESSION 6 ON SEMICONDUCTOR CLINIC2:45-3:45 p.m. Officer’s Club West
Mike BombardierNikhil HandaJay Walston
SESSION 7 RICHARD W. GROW PROJECT4:05-5:25 p.m. Officer’s Club West
Seaver W. CauchPaul Beard
Doug A. TuckerStephen Pendrey
SESSION 8 ELECTRICAL ENGINEERING PROJECTS12:25-4:45 p.m. Guest House Meeting Room B
David ChickBryce GardinerJacob MattsonMichael J. BeckJason R. SaberinFernando NelsonBrian M. Wynn
SESSION 1: L-3 Communications Clinic #1AOA-Enabled Active Localization and Tracking inBuildings
Officer’s Club SouthSession Chairman: Brandt Hammer
2:45 Brandt Hammer“Localization without GPS: Hardware Development”
3:05 Chinh Dam“Introduction to Data Collection”
3:25 Eliza Crandall“Data Analysis and Further Design Requirements”
3:45 Yi Xu“Fourier Transform Algorithm and Angle Error Calculation”
4:05 Brian Matthews“Localization Algorithm”
Industrial Liaison:Osama Haddadin
Faculty Advisor: Neal Patwari
SESSION 1 2:45 p.m. Officer’s Club South
LOCALIZATION WITHOUT GPS: HARDWARE DEVELOPMENT
Brandt Hammer, Chinh Dam, Eliza Crandall, Yi Xu, Brian Matthews(Neal Patwari), Department of Electrical and Computer Engineering,University of Utah, Salt Lake City, UT 84112
In order to improve upon a non-GPS localization system, anglesfrom a known position are incorporated into a received signalstrength-based node network that estimates position. Motes, thenodes of the network, calculate their angle from a known position.The round-robin turn based network then sends all of the receivedsignal strength measurements from each network link back to thecomputer for position analysis.
The iterative design process to create the stated system containsthree different stages: hardware design, data collection, and dataanalysis. The hardware design determines the bound of accuracyobtainable by any position algorithm. The final product consisted ofa servo controlled rotating parabolic antenna which was chosen overa three element phased array.
SESSION 1 3:05 p.m. Officer’s Club South
INTRODUCTION TO DATA COLLECTION
Chinh Dam, Eliza Crandall, Yi Xu, Brian Matthews, BrandtHammer (Neal Patwari), Department of Electrical and ComputerEngineering, University of Utah, Salt Lake City, UT 84112
The importance of data collection and how can data be analyzedwill be discussed. The purpose of collecting received signal strength(RSS) is to understand the characteristic of the directional antenna’sradiation pattern. It is important since the antenna system canautomate a mass of data collection to design an angle algorithm. Theresult from the algorithm using the collected data will let us know ifthe antenna is perfect or the antenna system needs to be redesignedfor the better result.
SESSION 1 3:25 p.m. Officer’s Club South
DATA ANALYSIS AND FURTHER DESIGN REQUIREMENTS
Eliza Crandall, Yi Xu, Brian Matthews, Brandt Hammer, ChinhDam (Neal Patwari), Department of Electrical and ComputerEngineering, University of Utah, Salt Lake City, UT 84112
This clinic project is advancing wireless sensor networks byimproving localization estimation algorithms for in-buildingenvironments. Estimation of sensor location is important inapplications in which a large number of sensors are deployed acrossa large area for monitoring applications. For a sensor network tofunction efficiently, the sensors must be able to accurately locatethemselves relative to other sensors in the network. The goal of thisclinic is to provide accurate localization and real-time tracking in 3-Dusing a phased array software radio. In order to develop an accurateangle of arrival (AOA) algorithm, test data is gathered to model thereceived signal strength (RSS) of a receiver at varying angles relative toa transmitter in an in-building environment.
SESSION 1 3:45 p.m. Officer’s Club South
FOURIER TRANSFORM ALGORITHM AND ANGLE ERRORCALCULATION
Yi Xu, Brian Matthews, Brandt Hammer, Chinh Dam, ElizaCrandall (Neal Patwari), Department of Electrical and ComputerEngineering, University of Utah, Salt Lake City, UT 84112
There are varying tracking systems used right now. The mostfamous and commonly used one is the GPS (global positioningsystem), which localizes objects by using satellites. The GPS systemis very precise but it cannot be used in special areas isolated fromgeneral satellite signals. In this case, an antenna array is the bestsolution. Right now, many tracking systems use received signalstrength (RSS) to measure the distance and position of the objects.The shortcoming of RSS is it will not be precise when there isinterference and big reflections. However, the angle of arrival (AOA)can avoid the reflections so that we can get an accurate localization.
We propose a tracking and localization system that candetermine the location of the object by using the RSS and AOAbetween the object and the antenna. An algorithm which was based onFourier series was created and is used to analyze the RSS duringmeasurement. The plot of RSS values should match the plot of thefirst harmonic of the Discrete Fourier series. AOA is calculated basedon the Fourier Transform, and the angle error between calculated andactual AOA will be calculated and shown.
SESSION 1 4:05 p.m. Officer’s Club South
LOCALIZATION ALGORITHM
Brian Matthews, Brandt Hammer, Chinh Dam, Eliza Crandall, Yi Xu(Neal Patwari), Department of Electrical and Computer Engineering,University of Utah, Salt Lake City, UT 84112
Algorithms were developed that were heavily based on hillclimbing, a minimization procedure. The localization part of thesystem took the received signal strength (RSS) to and from everymote, and the angle from every mote to the directed antenna, toextrapolate a position for motes with unknown positions. Thepresentation will be concluded with a summary of concepts and ateam demo of the entire system in real time to locate motes.
12:45 Jacob Tateoka“Introduction, and Theory of the Split Post Cavity”
1:05 Rohit Pathak“Split Post Measurements and Results”
1:25 Beau Lund“Resonant Cavity Redesign and Theory”
1:45 Eric Seabury“Resonant Cavity Testing Procedure and MeasurementResults”
2:05 Brian Rolfe“Resonant Cavity Design and Analysis Software”
Industrial Liaison:Trevis Anderson
Faculty Advisor: J. Mark Baird
SESSION 2 12:45 p.m. Officer’s Club West
INTRODUCTION, AND THEORY OF THE SPLIT POSTCAVITY
Jacob Tateoka, Rohit Pathak, Beau Lund, Eric Seabury, Brian Rolfe(J. Mark Baird), Department of Electrical and Computer Engineering,University of Utah, Salt Lake City, UT 84112
Cavities and resonators offer high accuracy measurements fordielectric materials because the resonant frequency changes when thedielectric material is introduced into the cavity. A commercial cavitycalled a “Split Post Resonator” has been established as a reliablemethod for measuring thin sheets of material. Two such cavitiesoperating at 10 GHz and 13.5 GHz were used to measure materialswith a range of relative permittivities from 2.1 to 9.5, and these dataare compared to those taken with cavities operating in the circular TE(0,1,3) mode. In this presentation, the Split Post Resonator theorywill be reviewed and covered.
SESSION 2 1:05 p.m. Officer’s Club West
SPLIT POST MEASUREMENTS AND RESULTS
Rohit Pathak, Beau Lund, Eric Seabury, Brian Rolfe, JacobTateoka (J. Mark Baird), Department of Electrical and ComputerEngineering, University of Utah, Salt Lake City, UT 84112
The purpose of our portion of this clinic is to measure thepermittivity of different dielectric samples using Split Post cavities.Split-post are primarily chosen for this project because they arefaster, accurate, and have the ability to measure low loss materials.We will measure several dielectric samples repeatedly to obtainconsistent and reliable measurements. These measurements arecompared with the dielectric constants measured by the TE modecavities. The main purpose behind the comparison is to verify theaccuracy of the dielectric constants and provide easy accessibility ofaccurate dielectric constants for the engineers at L-3Communications.
SESSION 2 1:25 p.m. Officer’s Club West
RESONANT CAVITY REDESIGN AND THEORY
Beau Lund, Eric Seabury, Brian Rolfe, Jacob Tateoka, RohitPathak (J. Mark Baird), Department of Electrical and ComputerEngineering, University of Utah, Salt Lake City, UT 84112
The dielectric constant is essential in predicting and designingcircuit boards and radomes that are used in RF applications. Withvalues that are different than expected they will not perform aspredicted. The TE01 mode was used because it has low loss and ishigh Q, which helps make measurements more accurate. The originalclinic designed the cavity around Maxwell’s Equations andexplanations of circular cavities in Microwave Equations (DavidPozar) and Advanced Engineering Electromagnetics (ConstantineBalanis). We made slight design modifications that allow bettercontrol of the TE01 mode coupling that were discussed in an article inIEEE Transactions on Microwave Theory and Techniques. The RFsignal was coupled into the cavity and the transmission coefficientS21 data was measured. The dielectric constant was calculated bycomparing the S21 data from the cavity when it was empty to theS21 data when the cavity was loaded.
SESSION 2 1:25 p.m. Officer’s Club West
RESONANT CAVITY REDESIGN AND THEORY
Beau Lund, Eric Seabury, Brian Rolfe, Jacob Tateoka, RohitPathak (J. Mark Baird), Department of Electrical and ComputerEngineering, University of Utah, Salt Lake City, UT 84112
The dielectric constant is essential in predicting and designingcircuit boards and radomes that are used in RF applications. Withvalues that are different than expected they will not perform aspredicted. The TE0 1 mode was used because it has low loss and ishigh Q, which helps make measurements more accurate. The originalclinic designed the cavity around Maxwell’s Equations andexplanations of circular cavities in Microwave Equations (DavidPozar) and Advanced Engineering Electromagnetics (ConstantineBalanis). We made slight design modifications that allow bettercontrol of the TE0 1 mode coupling that were discussed in an article inIEEE Transactions on Microwave Theory and Techniques. The RFsignal was coupled into the cavity and the transmission coefficientS21 data was measured. The dielectric constant was calculated bycomparing the S21 data from the cavity when it was empty to theS21 data when the cavity was loaded.
Eric Seabury, Brian Rolfe, Jacob Tateoka, Rohit Pathak, BeauLund (J. Mark Baird), Department of Electrical and ComputerEngineering, University of Utah, Salt Lake City, UT 84112
Since the redesign of the TE01 resonant cavities, two methods ofmeasuring the dielectric constant were available. The first is a methodthat was used by previous clinics and was recreated by our clinic toverify that the redesign operated as effectively as the original cavity.It is done by fixing the length of the cavities and locating the TE01mode at a desired frequency. Then a sample is inserted, relocating theTE01 mode by shifting the frequency. The second method is done byfixing the frequency and adjusting the length of the cavities andlocating the TE01 mode. A MATLABTM simulation was used topredict the behavior of the cavities and to aid in isolating the TE01mode. Samples of common dielectrics used for RF circuit boardfabrication were acquired and tested in the resonant cavities. Thevalues obtained from this analysis were then compared against theknown dielectric values and the obtained values from the Split-PostCavities to verify the validity of the resonant cavities.
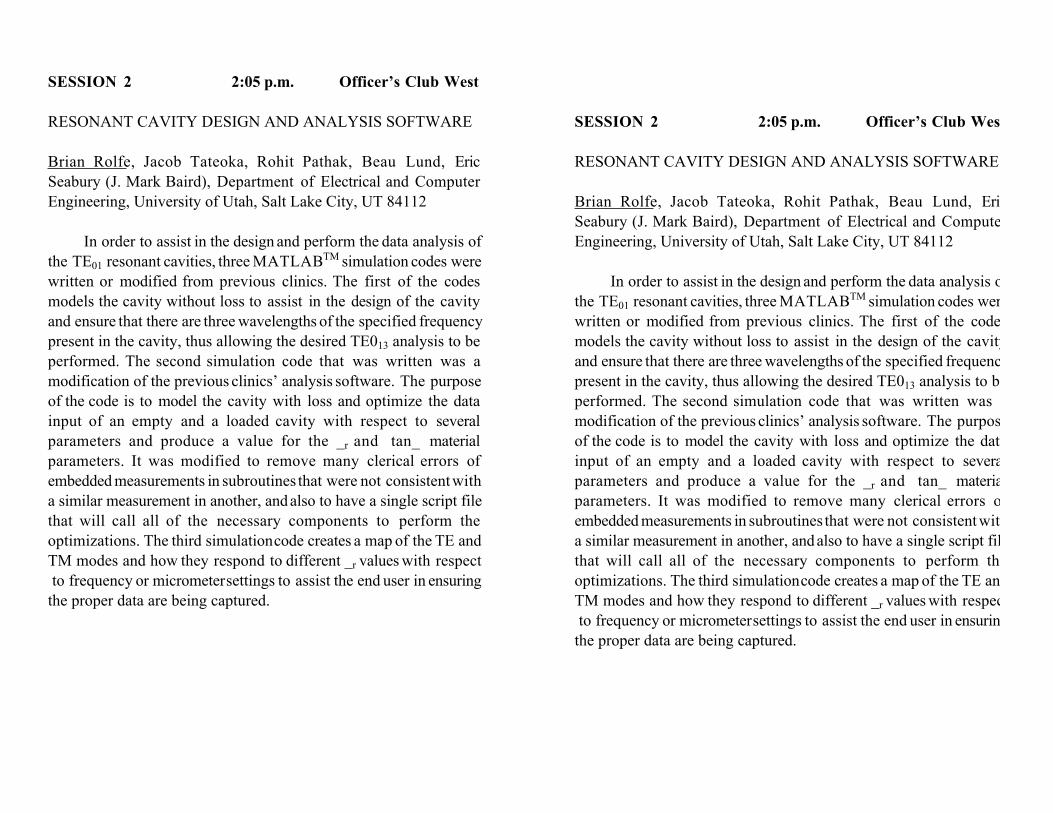
SESSION 2 2:05 p.m. Officer’s Club West
RESONANT CAVITY DESIGN AND ANALYSIS SOFTWARE
Brian Rolfe, Jacob Tateoka, Rohit Pathak, Beau Lund, EricSeabury (J. Mark Baird), Department of Electrical and ComputerEngineering, University of Utah, Salt Lake City, UT 84112
In order to assist in the design and perform the data analysis ofthe TE01 resonant cavities, three MATLABTM simulation codes werewritten or modified from previous clinics. The first of the codesmodels the cavity without loss to assist in the design of the cavityand ensure that there are three wavelengths of the specified frequencypresent in the cavity, thus allowing the desired TE013 analysis to beperformed. The second simulation code that was written was amodification of the previous clinics’ analysis software. The purposeof the code is to model the cavity with loss and optimize the datainput of an empty and a loaded cavity with respect to severalparameters and produce a value for the _r and tan_ materialparameters. It was modified to remove many clerical errors ofembedded measurements in subroutines that were not consistent witha similar measurement in another, and also to have a single script filethat will call all of the necessary components to perform theoptimizations. The third simulation code creates a map of the TE andTM modes and how they respond to different _r values with respect to frequency or micrometer settings to assist the end user in ensuringthe proper data are being captured.
SESSION 3: Micron Technology, Inc. ClinicAnalysis and Optimization of Multi Gb/sChip-to-Chip Communication
Officer’s Club NorthSession Chairman: Ben Meakin
12:45 Raheem Alhamdani“Introduction and Motivation for Modeling andVerification of Interconnects”
1:05 Bryson Kent“Worst Case Verification of High Speed Interconnects”
1:25 Jordan Kemp“Statistical Analysis of Electrical Signaling”
1:45 M. Lucas Loero“Modeling Jitter in Chip-to-Chip Communication”
2:05 Ben Meakin“Project Software Engineering, Development, and Results”
Industrial Liaison:Tim Hollis
Faculty Advisor: Ken Stevens
SESSION 3 12:45 p.m. Officer’s Club North
INTRODUCTION AND MOTIVATION FOR MODELING ANDVERIFICATION OF INTERCONNECTS
Raheem Alhamdani, Bryson Kent, Jordan Kemp, M. Lucas Loero,Ben Meakin (Ken Stevens), Department of Electrical and ComputerEngineering, University of Utah, Salt Lake City, UT 84112
As the semiconductor technology continues the aggressivelyscaling of transistors, and as on-chip processing speeds go into themultigiga hertz range, off-chip (I/O) bandwidth, however, has notscaled as aggressively, which in turn limits the performance of high-speed chip-to-chip based communication by the limit of the I/Obandwidth. Increasing data rates through transmission lines introducessignal degradation and limits the maximum achievable data-rates. Someof the issues encountered are jitter, signal noise, and reference voltagenoise. We propose a cost-effective and accurate statistical analysis ofa high-speed chip-to-chip communication link tool. This tool,implemented in graphical user interface, will read data from an outsidesource and output the resulting performance diagram, pass/fail, andbit error rate on a user-defined simulation data.
This presentation will cover the introduction of the project, theimportance and the reason behind the motivation, and who the stakeholders are. Roles and responsibilities as a member of this group willbe outlined in the presentation and include documentation, graphicaluser interface design (GUI), and tool development.
SESSION 3 1:05 p.m. Officer’s Club North
WORST CASE VERIFICATION OF HIGH SPEEDINTERCONNECTS
Bryson Kent, Jordan Kemp, M. Lucas Loero, Ben Meakin, RaheemAlhamdani (Ken Stevens), Department of Electrical and ComputerEngineering, University of Utah, Salt Lake City, UT 84112
In modern high performance computing systems it is necessaryto validate the link to off-chip memory. Current methods of validatinga link require the simulation of a trillion bits to find the bit error rateper trillion. This presentation deals with the computation of linkperformance to validate error-free transmission. Using a pulsed basedanalysis it is possible to calculate and add the negative effects of intersymbol interference (isi), co-channel interference, and timing jitter.The project makes use of an intuitive graphical user interface design(GUI) that is able to output an eye diagram of the link performanceand a pass/fail notification. This allows the user to validate linkperformance without extensive simulation.
SESSION 3 1:25 p.m. Officer’s Club North
STATISTICAL ANALYSIS OF ELECTRICAL SIGNALING
Jordan Kemp, M. Lucas Loero, Ben Meakin, Raheem Alhamdani,Bryson Kent (Ken Stevens), Department of Electrical and ComputerEngineering, University of Utah, Salt Lake City, UT 84112
As the speed and capacity of chip-to-chip communicationincrease, the integrity of the signals being communicated decreases.This project presents an implementation of a graphical user interface(GUI) that shows worst-case and statistical analysis eye-diagrams ofpeak distortion and jitter in chip-to-chip signals. The worst-case eye-diagram shows the user a pass/fail mask for the bit-error rate, whilethe statistical analysis eye-diagram allows the user to determinewhether or not the bit-error rate is within a user-defined specification.The statistical analysis eye-diagram is formed from the probabilitydensity function of a pulse convolved with the impulse response ofthe channel. This analysis allows the user to view the probabilisticeye-diagram from one single set of data without running millions oftime-consuming and hardware-intensive simulations.
SESSION 3 1:45 p.m. Officer’s Club North
MODELING JITTER IN CHIP-TO-CHIP COMMUNICATION
M. Lucas Loero, Ben Meakin, Raheem Alhamdani, Bryson Kent,Jordan Kemp (Ken Stevens), Department of Electrical and ComputerEngineering, University of Utah, Salt Lake City, UT 84112
High-frequency chip-to-chip communication introduces signaldegradation and limits the maximum achievable data-rates. Some ofthe issues encountered are jitter, signal noise, and reference voltagenoise. The problem is introduced from timing uncertainty in clocking,causing clock jitter, which makes sampling correct bit values moredifficult. There are several methods used for modeling clock jitter. Amethod was used to analyze the signal degradation caused bytransmitter jitter and receiver jitter autonomously from each other.This model allows the analysis of the clock jitter in an acceptablesimulation time.
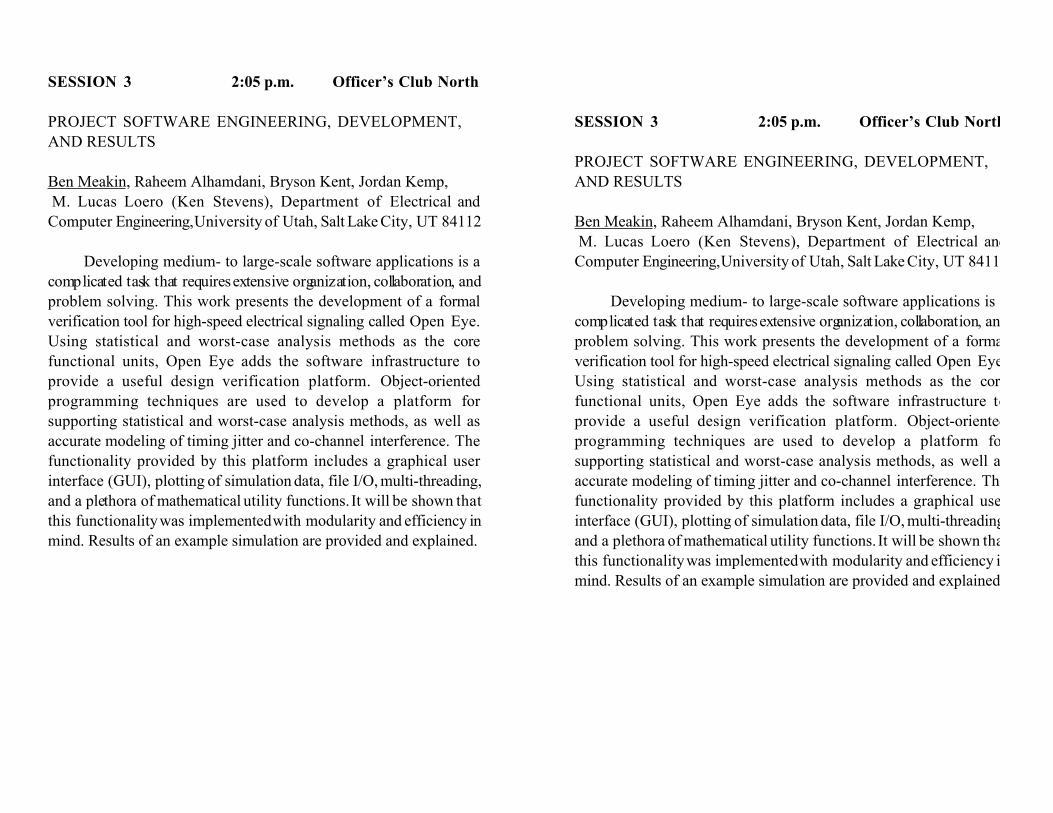
SESSION 3 2:05 p.m. Officer’s Club North
PROJECT SOFTWARE ENGINEERING, DEVELOPMENT, AND RESULTS
Ben Meakin, Raheem Alhamdani, Bryson Kent, Jordan Kemp, M. Lucas Loero (Ken Stevens), Department of Electrical andComputer Engineering, University of Utah, Salt Lake City, UT 84112
Developing medium- to large-scale software applications is acomplicated task that requires extensive organization, collaboration, andproblem solving. This work presents the development of a formalverification tool for high-speed electrical signaling called Open Eye.Using statistical and worst-case analysis methods as the corefunctional units, Open Eye adds the software infrastructure toprovide a useful design verification platform. Object-orientedprogramming techniques are used to develop a platform forsupporting statistical and worst-case analysis methods, as well asaccurate modeling of timing jitter and co-channel interference. Thefunctionality provided by this platform includes a graphical userinterface (GUI), plotting of simulation data, file I/O, multi-threading,and a plethora of mathematical utility functions. It will be shown thatthis functionality was implemented with modularity and efficiency inmind. Results of an example simulation are provided and explained.