Guild of Healthcare Pharmacists and United Kingdom Clinical Pharmacy Association 11 th Joint National Conference Lifting the Lid: Facing the difficulties of maintaining and enhancing standards ABSTRACTS The Queens Hotel, Leeds Friday 15 th to Sunday 17 th May 2015
Transcript
Guild of Healthcare Pharmacists and United Kingdom Clinical Pharmacy Association
11th Joint National Conference Lifting the Lid: Facing the difficulties of maintaining
and enhancing standards
ABSTRACTS
The Queens Hotel, Leeds Friday 15th to Sunday 17th May 2015
Poster Presentations index
Poster Number
Poster Presentations
1 An evaluation of the quality of acute hospital prescribing - Agnew E, Allen S, Armstrong C, Gavin C, Hanvidge A,
Kirkpatrick L, Stalker S, Coll A, Souter C. NHS Lothian Pharmacy Service, Edinburgh
2 The Role of an Independent Prescribing Clinical Pharmacist in Rationalising Medications Prescribed to Frail Elderly Patients Admitted to the Acute Frailty Unit at Chesterfield Royal Hospital - Agus R, Braithwaite A, Duffin C, Pharmacy Department, Chesterfield Royal Hospital NHS Foundation Trust, Chesterfield
3 Safe and secure handling of medicines in community services clinics – can unannounced ‘spot checks’ help? - Asiain N, Central Manchester University Hospitals NHS Foundation Trust (CMFT), Manchester
4 A quality improvement programme reducing infusion duration of eptifibatide in primary percutaneous coronary angioplasty at a teaching trust - Bashir N, Robinson G, Cooper P, Duggan S, Chahal J, Ghandi B, Hamedi N, Wright P, Antoniou S., Barts Health NHS Trust, London
5 An evaluation of the impact of a multidisciplinary review of medication in care homes on hospital admissions, out-of-hours and GP visits - Barrett S, Baqir W, Learmouth M, Hughes J, Desai N, Copeland R, Campbell D, Laverty A., Northumbria Healthcare NHS Foundation Trust.
6 Successful implementation of ‘Sepsis 6’ bundle in the maternity unit; a multi-disciplinary quality improvement project Benn, C; Stapleton C; Lanzman, M; Royal Free London NHS Foundation Trust, London
7 The Introduction of Pharmacist-Led Peri-operative Anticoagulation Bridging Clinics at St James’ Hospital, Leeds - Blow, S. E, Akbar, R., Pharmacy Department, Leeds Teaching Hospitals NHS Trust, Leeds
8 An Audit Assessing the Compliance with National Guidance for extended Venous Thromboembolism Prophylaxis in Patients Undergoing Major Abdominal Cancer Surgery at University Hospital Aintree NHS Foundation Trust - Brady A., Brennan C. and Arthur J. Aintree University Hospital NHS Foundation Trust, Liverpool.
9 Service Evaluation to Assess the Quality of Communication on Discharge Letters regarding Changes to Medication and make Recommendations for Improvement - Croft M.T, Cavill K., Pharmacy Department, Harrogate District Hospital NHS Foundation Trust. Harrogate
10 Formulation of a pharmacy support staff development strategy. Facilitating workforce planning and development opportunities within Brighton & Sussex University Hospitals - Allen, C. Clarke, M. Conway, A. Murray, A. Perilli, N. Stevens, J. Sturgeon, T. Wilkins, S. Brighton & Sussex University Hospitals NHS Trust
11 Appropriateness of prescribing of potent oral antiplatelet therapy in Acute Coronary Syndrome (ACS) patients at a London Heart Attack Centre (HAC) - Cooper, P, Bashir, N, Duggan, S, Chahal, J, Gandhi, B, Hamedi, N, Robinson, G, Wright, P, Antoniou, S., Barts Health NHS Trust, London
12 Adherence to preventative measures for Never Events: wrong route medication - Dhadwal E, Aguado V, Oborne CA., Guy’s and St. Thomas’ NHS Foundation Trust, London
13 A pilot study of hospital prescribing error feedback by pharmacist - Dickson F1, Kinnear M1, Coll A1, Weidmann AE2, 1. NHS Lothian Pharmacy Service, Royal Infirmary of Edinburgh,2. Weidmann AE2, Pharmacy Faculty, Robert Gordon University, Aberdeen
14 Adherence of Pharmacists to the Lithium Standard Operating Procedure: A clinical Audit - Mader Eloff, Emma Gray. Norfolk and Norwich University Hospital
15 What is the effect on pre-registration pharmacist OSCE pass/fail scores when a specific and weighted communication skills assessment is used? - L.J McEwen-Smith, G.S Fleming, Health Education Kent Surrey Sussex, Haywards Heath
16 An audit of hypersensitivity reactions following subcutaneous trastuzumab (Herceptin®) injection - Foreman E*, Waters C#, *Brighton & Sussex University Hospitals NHS Trust (BSUH), #East Kent Hospitals University NHS Foundation Trust
17 A retrospective audit of the prescribing of oral iron against recommended standards in a small acute hospital over a 4 month period - Mc Garry, N, Galway, M., Mater Infirmorum Hospital, Belfast Health & Social Care Trust
18 Winter pressures add a clinical pharmacist to the emergency department (ED) - Gotel U1, Henderson K2, Hill J2, 1Pharmacy Department, 2Emergency Department Guy’s and St Thomas’ NHS Foundation Trust
19 Implementation of a Clinical Pharmacy Service and Near-Patient Dispensing to a Chemotherapy Day Ward - Purcell, S., Allen, R., Hale, K. Pharmacy Department, Wirral University Teaching Hospital NHS Foundation Trust, Wirral
20 An Audit of missed doses of medications at Newham Centre for Mental Health (NCfMH) - Halliday,E , East London NHS Foundation Trust, London
21 Community Pharmacist: Making an impact on stroke prevention - Hamedi N1,2, Levitan M3, Begley A2, Antoniou S1,2, 1Barts Health NHS Trust, 2UCLPartners, 3Middlesex Group of Local Pharmaceutical Committees
22 Development and Implementation of an All Wales Medication Safety Indicators Reporting System - 1Harries J, 1Townsend M, 2Williams R, 1Cwm Taf University Health Board (CTUHB), Llantrisant, 2Abertawe Bro Morgannwg University Health Board (ABMUHB), Swansea
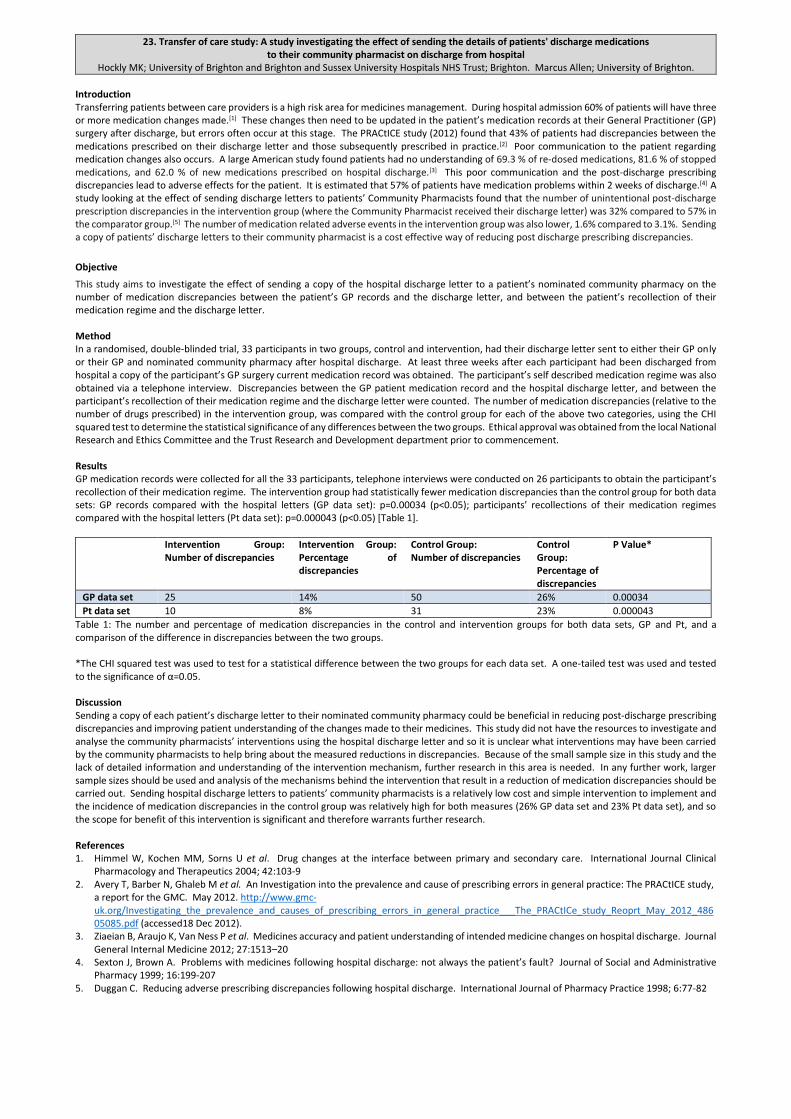
23 Transfer of care study: A study investigating the effect of sending the details of patients' discharge medications to their community pharmacist on discharge from hospital - Hockly MK; University of Brighton and Brighton and Sussex University Hospitals NHS Trust; Brighton. Marcus Allen; University of Brighton.
24 Preventing hospital admissions: Evaluation of the Pharmacy Reablement Service - Howard RL1, Honeywell G1, Warner JG2, Noble KA2., 1. Isle of Wight NHS Trust, Newport, Isle of Wight. 2. Pinnacle Health Partnership, East Cowes, Isle of Wight.
25 Review of Pharmacist independent prescribing in a secondary care setting - Al-Modaris I, Ioannides C., Pharmacy Department, Chesterfield Royal NHS Foundation Trust. Chesterfield
26 Learning to lead in hospital pharmacy - Ireland, H. South West Medicines Information and Training, Bristol.
27 Identifying the learning and development needs of registered pharmacists across different hospital settings – Kapadia, T, and Singal, R, Barts Health NHS Trust, London
28 An evaluation of practicalities and options available for delivering the self-administration of insulin agenda: Action beyond the NPSA - Kavanagh S, Thomas N, Sheffield Teaching Hospitals NHS Foundation Trust. Sheffield, South Yorkshire
29 A retrospective audit on the prescribing of aclidinium at The University Hospitals of Leicester (UHL) NHS Trust - Mandane B. Murphy A. University Hospitals of Leicester NHS Trust, Leicester.
30 Improving Medicines Management for Anaesthetists working in Pre-Hospital Emergency Medicine (PHEM) – Marson V*, Bevan F*, Bednall R*, Thomson S* and Nash M#, Departments of Pharmacy*, Anaesthesia#, University Hospital of North Midlands (UHNM) NHS Trust, Stoke-on-Trent
31 Foundation Doctor - Pharmacist Buddy Scheme: Evaluation of a Successful Programme - McCartney C BSc(Hons) MSc MRPharmS. Sadasivam S MBBS MRCGP MClinEd., Shaw F Mpharm(Hons). Henry A BSc(Hons) MPhil MRPharmS., County Durham and Darlington NHS Foundation Trust
32 Do Foundation 1 doctors value training sessions delivered by Pharmacists? - McFarlane F, Hodgkinson R, Duffy M. Wirral University Teaching Hospitals NHS Foundation Trust
33 Cost and Benefit of Providing a Clinical Pharmacy Service - Miller G, Imperial College Healthcare NHS Trust, London
34 An audit of prescribing, storage and administration of insulin at UCLH NHS Foundation Trust - Mistry, K. and Jani, Y. University College London Hospitals, London
35 Improving transfer of medicines and medicines information between hospital and care homes - Moore S#, Sweeney S* and Alldred A#, # Harrogate and District NHS Foundation Trust (HDFT), Harrogate, * Yorkshire and Humber Commissioning Support Unit, Harrogate
36 Accuracy of Chemotherapy Prescribing on Haematopoietic Stem Cell Transplant Prescriptions - Musallam, A.L., Kirschke, S., Imperial College Healthcare NHS Trust, London
37 Using the Guardrail "smart" infusion devices in Critical Care: What are the views of the users? - Negandhi P; Shah S; Fischer A., Royal Brompton and Harefield Hospital NHS Foundation Trust, London, United Kingdom.
38 The use of Always Events in a survey of inpatients’ experiences with their medication and the clinical pharmacy service - Onatade R, Gujral S, Phul N, Pamanathan K, Torku A, Sawieres S and Oputu T
39 Multi-Drug Resistant Tuberculosis Monitoring Guidance: Are we following the national guidelines? - Parmar S, Singal R, and Khachi H., Respiratory Pharmacy Department, Barts Health NHS Trust, London
40 An audit of adherence to NPSA (National Patient Safety Agency) report alerts on insulin prescribing and administration - Patacconi, K and Purcell, J; Norfolk and Norwich University Hospital (NNUH), Norwich
41 An audit of the number and types of medication-related interventions made by pharmacists when clinically screening inpatient prescriptions at Northwick Park Hospital - Patel G, Jivraj M, Sanghera I. London North West Healthcare NHS Trust
42 Evaluation of a Medication Review Project in Care Homes in Sefton - Ramsbottom H, Prescott B. Southport and Formby/South Sefton Clinical Commissioning Group
43 Evaluation of pharmacist contributions to the care of inpatients in Community Hospitals - Rogers T, Livingstone C, Nicholls J, Wolper S. NHS Specialist Pharmacy Service, England.
44 The LAST NHS Pharmacy Staffing Establishment and Vacancy Survey What trends have occurred over the last seven years? - Sanders, S, Bollington, L and Sharott, P, on behalf of the NHS Pharmacy Education and Development Committee
45 ‘Clinipharms’- A User Evaluation for Medicines Information - I. Scott, C. Heywood, K. Want- Norfolk and Norwich University Hospital
46 An audit reviewing wastage of adult parenteral nutrition bags at King’s College Hospital NHS Foundation Trust – Shah, S*; Callaby, H*; Vincent, R*; Dubois, P*; Hoey, S*, *Kings College Hospital NHS Foundation Trust, London
47 Uptake and impact of smart infusion pump technology in a cardiothoracic intensive care unit three years on from its implementation - Shah S1; Fischer A1 ; Hunter D2, 1 Pharmacy Dept, Royal Brompton and Harefield Hospital NHS Foundation Trust, London,2 Anaesthetics and Adult Intensive Care, Royal Brompton and Harefield Hospital NHS Foundation Trust, London
48 Impact of Introducing Smart Infusion Pump Technology on Intravenous Medication Errors in Critical Care Areas – Shah S; Hanna C; Fischer A. Pharmacy Dept, Royal Brompton and Harefield Hospital NHS Foundation Trust, London, United Kingdom
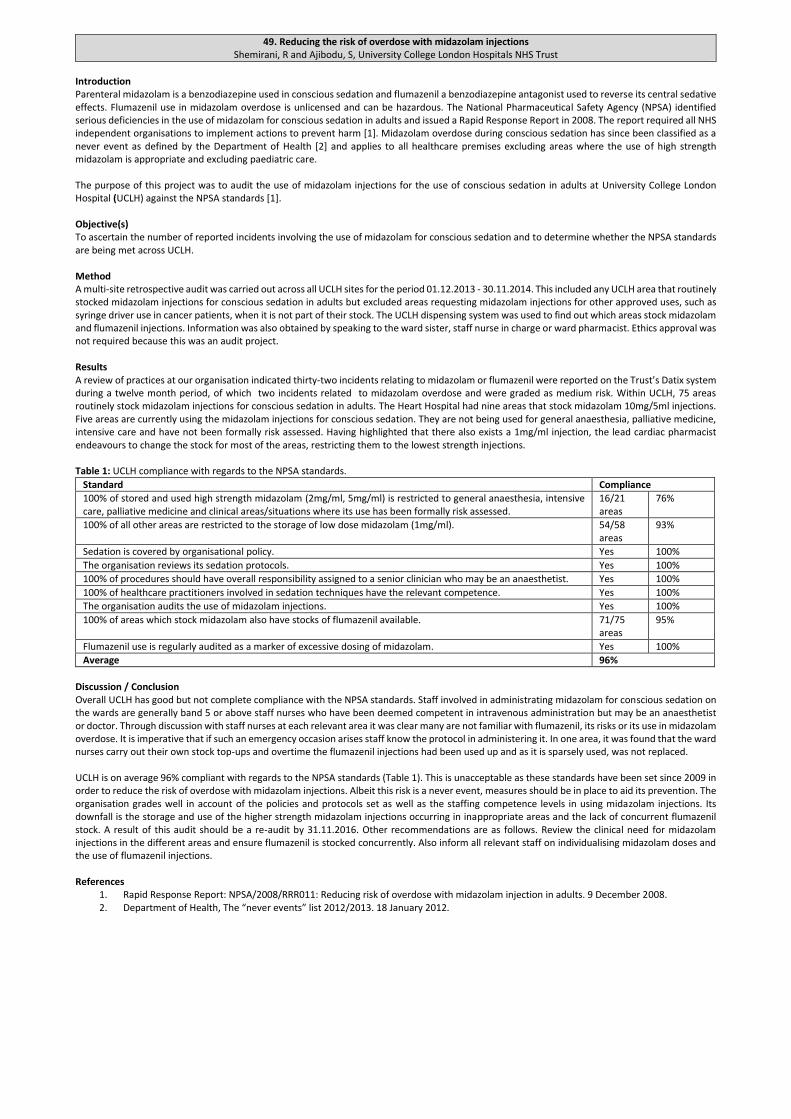
49 Reducing the risk of overdose with midazolam injections - Shemirani, R and Ajibodu, S, University College London Hospitals NHS Trust
50 Care by Optimising Medicines for Elderly patients on care Transfer (COMET) - Smith H, Tweed J, Skitt S, Fox G, Leeds Teaching Hospitals NHS Trust (LTHT), Leeds
51 Enhancing patient care through total integration of pharmaceutical care into the multidisciplinary team in an acute trust - St. Clair Jones A1, Hills E 2, Smith M3, (1Lead Pharmacist Gastroentrology, 2 Inflammatory bowel disease (IBD) Nurse Specialist, 3 Gastroenterologist, IBD lead), Brighton and Sussex University Hospitals (BSUH) NHS Trust, Brighton
52 Can You Read the Label? How a pharmacy department improved access and adherence to medication for individual patients - Lim, E and Storey, L, Pharmacy Department, Newcastle Upon Tyne Hospitals NHS Foundation Trust, Newcastle
53 Implementation of a referral tool for screening patients for pharmaceutical care by pharmacy technicians in a paediatric medical acute receiving unit – a pilot - Stuart ZE1, Kinnear M1, 2 and Mullen AB2, 1NHS Lothian Pharmacy Service, Royal Hospital for Sick Children, Edinburgh and 2University of Strathclyde, Glasgow.
54 Improving the service to outpatients attending the main dispensary at the University Hospital of Wales (UHW) - Turner, H1, Way, C1 and Browne, C2., 1Pharmacy Directorate, Cardiff and Vale University Health Board, 2School of Pharmacy and Pharmaceutical Sciences, Cardiff University, Cardiff.
55 The role of the pharmacy team in reducing readmissions: general medical patients eligible for NMS not found to be at increased risk of readmission - Upton, S a, b., Culshaw, M b., Stephenson, J b. a Calderdale and Huddersfield NHS Foundation Trust, West Yorkshire, b University of Huddersfield, West Yorkshire
56 From Classroom to Consultation–The Impact of Patient Centred Consultation Skills Training on practice - Varia, S. Middleton, H. London Pharmacy Education and Training, London
57 An Audit to Assess the Quality of Rivaroxaban Prescribing at Medway NHS Foundation Trust - Wallis E, Austin A, Medway NHS Foundation Trust
58 A randomised controlled trial comparing the East of England Unified Drug Chart (EE UDC) with the Royal College of Physicians (RCP) recommended Drug Chart - Willimott H a, Wright D b, Farrow C a, Brett B c, a Norfolk & Norwich University Hospitals NHS Foundation Trust, UK. b School of Pharmacy, University of East Anglia, UK. c James Paget University Hospital NHS Trust
59 An audit on the use of MaPPs (Medicines: A patient profile summary) leaflets on discharge from hospital - Zamir. A, Pharmacy department, Surrey and Sussex NHS Healthcare Trust
1. An evaluation of the quality of acute hospital prescribing. Agnew E, Allen S, Armstrong C, Gavin C, Hanvidge A, Kirkpatrick L, Stalker S, Coll A, Souter C. NHS Lothian Pharmacy Service, Edinburgh
Introduction Prescribing errors are a priority for improving patient safety. Foundation doctors (FY doctors) undertake the majority of prescribing and are responsible for more errors than senior colleagues.1,2 The Health Board’s Golden Rules for Prescription Writing (Golden Rules) specify criteria, or Golden Rules, to ensure safe prescribing in secondary care. Objectives To measure the impact of an educational intervention on adherence to the Golden Rules. Method Audit criteria were informed by the Golden Rules, validated by the Lead Pharmacist Medical Education and piloted in 40 patients. Prior to the intervention (Nov 2014), the tool was applied to a convenience sample of 394 patients across 40 wards with FY doctors at three teaching hospitals. Data was analysed using Microsoft Excel® and the results incorporated into an interactive education session delivered to FY doctors at each hospital (Dec 2014). To reinforce the session and increase exposure to good practice, a memorandum with a summary of the session content was emailed to all FY doctors. Approximately four weeks after the intervention, the criteria were applied to 5-10 patients in the same 40 wards (Jan 2015). The audit standard was 100% for all criteria except those relating to antimicrobial therapy which was 95% as per the national prescribing indicator. ‘Prescription chart completed in full’ was defined as meeting all of the Golden Rules (patient details, allergy status and prescribing requirements for all medicines). Subgroup analysis was performed on medicines with documented verification by a pharmacist and high risk medicines.3 Data was compared using Chi-square test. Research Ethics approval was not required. Results Table 1 details adherence to audit criteria pre-intervention (394 patients, 3443 medicines) and post-intervention (235 patients, 2342 medicines).
Audit criteria Pre-intervention Post-intervention P value n % n %
Prescription chart 394 235 Patient details completed in full 2 0.5 1 0.4 1.000 Allergy status completed in full 83 21.1 69 29.4 0.024
All medicines 3443 2342 Drug spelled correctly 3365 97.7 2311 98.7 0.013 Drug prescribed generically 3270 95.0 2204 94.1 0.169 Drug dose written clearly 3251 94.4 2223 94.9 0.447 Route abbreviation acceptable 2907 84.4 1911 81.6 0.005 Prescription signed 3424 99.4 2309 98.6 0.001 Prescriber’s name printed legibly 1816 52.7 1417 60.5 <0.001 Start date stated 3347 97.2 2313 98.8 <0.001 Prescription not altered 2810 81.6 2248 96.0 <0.001 Black pen used 3390 98.5 2325 99.3 0.008 Block capitals 2802 81.4 1932 82.5 0.299
Table 1: Adherence to Audit Criteria Pre-intervention, no prescription charts were completed in full and 915 (26.6%) medicines met all applicable audit criteria. Post-intervention, one (0.4%) prescription chart was completed in full and 853 (36.4%) medicines met all applicable audit criteria (p<0.001). Of high risk medicines, 142/482 (29.5%) met all applicable criteria pre-intervention increasing to 98/263 (37.3%) post-intervention (p=0.036). Pre-intervention, 206/771 (26.7%) medicines with documented verification by a pharmacist met all applicable criteria compared to 711/2672 (26.6%) which were not signed by the pharmacist (p=1.000). Post-intervention, 174/353 (49.3%) medicines with documented verification by a pharmacist met all applicable criteria compared to 643/1989 (32.3%) which were not signed by the pharmacist (p<0.001). Discussion during the education session indicated FY doctors were aware of their common Golden Rule breaches; citing contributing factors of workload, pressure from nursing staff, prescription chart design and disagreement with some Golden Rules on principle. FY doctors preferred face to face training to email communication. Discussion/Conclusion Post intervention overall adherence to the Golden Rules improved although this cannot be wholly attributed to the educational intervention. The current prescription chart used within the Health Board has limited space for printing names and the extra information required with ‘as required’ and antimicrobial therapy. Unacceptable route abbreviations were common with oral therapy and doctors felt short cuts increased efficiency without necessarily being aware of potential administration errors. Prescribers often did not print their name, making it difficult to identify the prescriber and provide effective feedback - a recommendation would be to consider name stamps. Pressure from nursing staff to prescribe by multiple routes, particularly with ‘as required’ analgesics and anti-emetics, suggests educational interventions should be delivered wider than the medical team. Current systems across all healthcare settings for clinical documentation of allergy status are suboptimal. Those prescribing and administering medicines need to know allergy status and recording should be standardised. Progression of a national paper prescription chart may be superseded by electronic prescribing which will avoid errors such as incomplete patient details and unclear handwriting but introduce different types of errors. The low adherence of pharmacist-verified prescriptions may result from prioritising resolution of errors considered to be higher severity than Golden Rules deviances. Limitations included not delivering face-to-face educational interventions to all FY doctors due to shift patterns and the sample of prescriptions not being exclusive to FY doctors. The study findings will be disseminated to multidisciplinary stakeholders and a multifaceted toolkit developed for further evaluation. References 1. Dornan T, Ashcroft D, Heathfield H, et al. An in depth investigation into causes of prescribing errors by foundation trainees in relation to their medical education. EQUIP study. Manchester, England. General Medical Council; 2009 2. Ryan C, Ross S, Davey P, et al. Prevalence and Causes of Prescribing Errors: The PRescribing Outcomes for Trainee Doctors Engaged in Clinical Training (PROTECT) Study. PLoS One. 2014;9(1):e79802 3. Healthcare Improvement Scotland and NHS Scotland. Scottish Patient Safety Programme. http://www.scottishpatientsafetyprogramme.scot.nhs.uk/ (Accessed 30 Mar 2015)
2. The Role of an Independent Prescribing Clinical Pharmacist in Rationalising Medications Prescribed to Frail Elderly Patients Admitted to the Acute Frailty Unit at Chesterfield Royal Hospital
Agus R, Braithwaite A, Duffin C, Pharmacy Department, Chesterfield Royal Hospital NHS Foundation Trust, Chesterfield
Introduction Polypharmacy is an almost inevitable consequence of ageing. Elderly people tend to have several co-existing medical problems and are prescribed multiple medications1. Older age is associated with changes in pharmacokinetics and pharmacodynamics, placing this patient group particularly at risk of adverse drug reactions2. There is also a link between polypharmacy and falls3. The “Silver Book”, Quality Care for Older People with Urgent and Emergency Care Needs (2012), states that an acute crisis in a frail, older person should trigger a structured medication review, with a focus on identifying inappropriate prescribing, as well as drug omissions.
Objectives To ensure that every patient admitted to the Acute Frailty Unit has a medication review led by an Independent Prescribing Pharmacist working closely with physicians to optimise and rationalise drug treatment. This includes stopping any medication deemed to be inappropriate or contributing to the reason for hospital admission, as well as starting medication appropriate to the patient’s current clinical need. Method The Acute Frailty Unit was newly opened in January 2014. Prior to this, frail elderly patients were seen on general medical wards with traditional ward pharmacy input (approx. 2.5 hours per day). From inception, our Acute Frailty Unit has had a dedicated Clinical Independent Pharmacist Prescriber. The pharmacist is an integral part of the multidisciplinary team, attending daily ward rounds, undertaking medication reviews, prescribing and facilitating medicines optimisation. This involves rationalisation and optimisation of drug treatment using STOPP START principles4. It also involves enhanced communication with primary care and rapid processing of discharge prescriptions to allow timely discharge. Data was collected by analysis of discharge prescriptions for each patient post discharge over the period of 1 month. Ethics approval was not required. Results In the first full month of implementation, every patient had an in-depth medication review (total number of patients 69). A mean 2.1 short-term drugs per patient were started (total 146 drugs, of which 55 (38%) were analgesics, and 36 (25%) laxatives), and 1.5 long-term drugs were started (total 92 drugs, of which 29 (32%) were bone protection, and 15 (16%) anaemia). A mean 0.88 medications per patient were stopped (total 61 drugs, of which 20 (33%) were antihypertensives, and 6 (10%) were benzodiazepines/hypnotics). See Table 1 for numbers of medications started, both short-term and long-term, and medications stopped. Table 1 – Numbers of medications started and stopped following medication review involving the Independent Prescribing Pharmacist
Discussion The model described allows the provision of a patient-centred approach to medications management for frail elderly patients, stopping inappropriate medication and initiating drug treatment appropriate to their current clinical presentation. Prior to undertaking this work, it was envisaged that more drugs would be stopped rather than started; in fact the opposite was true, with more medication started than stopped. The majority of medication started was for short-term use only, in particular opioid analgesics following falls, alongside which laxatives and antiemetics were prescribed for side-effect management. Medication started by the team included vitamin D supplementation. This proved to be contentious with GPs, whose feedback indicated that correcting a low vitamin D level was thought to have little impact on clinical outcomes. However, due to risk factors for vitamin D deficiency and a high incidence of falls, we feel that vitamin D testing and supplementation is justifiable in our patient population. Competing demands on the time of the pharmacist between ward rounds and processing discharge prescriptions can be a challenge; initially part time, the 20-bedded unit now requires full time input. Larger units would require more pharmacy time. Close collaborative working between the pharmacist and the physician is vital for success. No baseline measurements were made prior to implementation. If the process were to be repeated, this would enhance the assessment of the resulting change. References 1. Milton JC, Hill-Smith I, Jackson SHD. Prescribing for Older People. BMJ 2008; 336: 606-609 2. Routledge PA, O'Mahony MS, Woodhouse KW. Adverse drug reactions in elderly patients. British Journal of Clinical Pharmacology 2004; 57: 121-126 3. Ziere G, Dieleman JP, Hofman A et al. Polypharmacy and falls in the middle age and elderly population. British Journal of Clinical Pharmacology 2008; 61: 218–223 4. O’Mahony D, Gallagher P, Ryan C et al. STOPP & START criteria: A new approach to detecting potentially inappropriate prescribing in old age. European Geriatric Medicine 2010; 1: 45 - 51
3. Safe and secure handling of medicines in community services clinics – can unannounced ‘spot checks’ help? Asiain N, Central Manchester University Hospitals NHS Foundation Trust (CMFT), Manchester
Background The diverse nature and geographical spread of community services clinics presents a particular challenge to pharmacy teams working to support the safe and secure handling of medicines. Risks to patients and staff can be managed by implementing local policies in line with legislation, Care Quality Commission (CQC) standards1 and national guidance. The Safe and Secure Handling of Medicines: a team approach2 published by the Royal Pharmaceutical Society in 2005 remains the most comprehensive guidance issued to the NHS to date and together with more recent legislation forms the basis of our Medicines Policy. In addition to an ongoing staff education programme and formal self-assessment audit of services, we introduced a system of ‘spot checks’ on community services clinic settings in April 2014 and examined the results for evidence of compliance with our standards. Ethics approval was not required as this was an audit project. Objectives
Assess compliance with the key standards for safe and secure handling of medicines listed in Table 1.
Identify any areas of non-compliance and recommend improvements to manage medicines-related risks. Method Pharmacy technicians from the Community Medicines Optimisation Team carried out two waves of unannounced visits to a total of 55 clinics from 11 different services. Wave 1 visits took place over the period April to July 2014 and wave 2 visits took place over the period September to November 2014. Reception staff at health centres were informed of the visits in advance in order to ensure that staff were available to show the technicians to the clinics. Clinic staff did not have advance warning. The pharmacy technicians used a checklist of medicines storage and security questions to assess key standards for safe and secure handling of medicines and provided feedback to staff on any areas for improvement. Data was then entered onto an Excel™ spreadsheet and analysed by the Medicines Optimisation Governance Pharmacist. Results See Table 1. Table 1 Audit results
Standard % of clinics meeting standard – wave 1
% of clinics meeting standard – wave 2
Doors to rooms where medicines are stored are access-controlled
100% 100%
Key or code to medicines storage cupboards/fridges is kept secure at all times
100% 100%
Medicines are segregated, e.g. internal, external etc. 100% 100% All medicines are kept in lockable cupboards or lockable fridges
91% 99%
No medicines are stored in cupboards under sinks 100% 100% The medicines cupboard is locked 95% 98% All medicines are stored in their original container 100% 99% All medicines are within expiry date 93% 99% The fridge is locked 79% 95% The fridge only contains medicines 100% 100% All medicines in the fridge need refrigeration 100% 100% Fridge maximum/minimum temperatures are checked and recorded daily during working days (Monday-Friday)
78% 100%
There is a record of action taken if the temperature deviated from range
100% 100%
FP10 prescriptions are kept securely 100% 100%
Discussion The audit provided useful additional assurance to the trust that processes for important elements of safe and secure handling of medicines are being followed in practice. Clinic staff did not have advance warning of the visits. While this was felt to give a more accurate picture of how medicines are handled it did mean that staff from the relevant service were not always available to answer questions and provide evidence. The visits presented another opportunity for medicines optimisation staff to give feedback and reinforce messages on safe handling of medicines, particularly where a standard was not met. Percentage compliance with all but one standard either improved or remained at 100% in wave 2 compared to wave 1. Some clinics had previously struggled to meet the standard for daily checking and recording of fridge temperatures but compliance improved from 78% to 100% of clinics visited in wave 2. Another three waves of visits are planned over the next 12 months. These will remain unannounced but better co-ordination with reception staff should ensure that clinic staff are always available to answer questions. This will also mean that a signed copy of any recommendations made can be left with clinic staff to pass on to their service lead. The spot checks will also be expanded to include any health centre rooms used by CMFT staff at any time (not just those where medicines are known to be stocked) to ensure that no medicines have been left unsecured. References
1. Care Quality Commission. Essential standards of quality and safety: guidance about compliance. 2010. www.cqc.org.uk/sites/default/files/documents/gac_-_dec_2011_update.pdf (accessed 25 February 2015)
2. Royal Pharmaceutical Society. The Safe and Secure Handling of Medicines: a team approach. 2005. www.rpharms.com/support-pdfs/safsechandmeds.pdf (accessed 25 February 2015)
4. A quality improvement programme reducing infusion duration of eptifibatide in primary percutaneous coronary angioplasty at a teaching trust
Bashir N, Robinson G, Cooper P, Duggan S, Chahal J, Ghandi B, Hamedi N, Wright P, Antoniou S., Barts Health NHS Trust, London
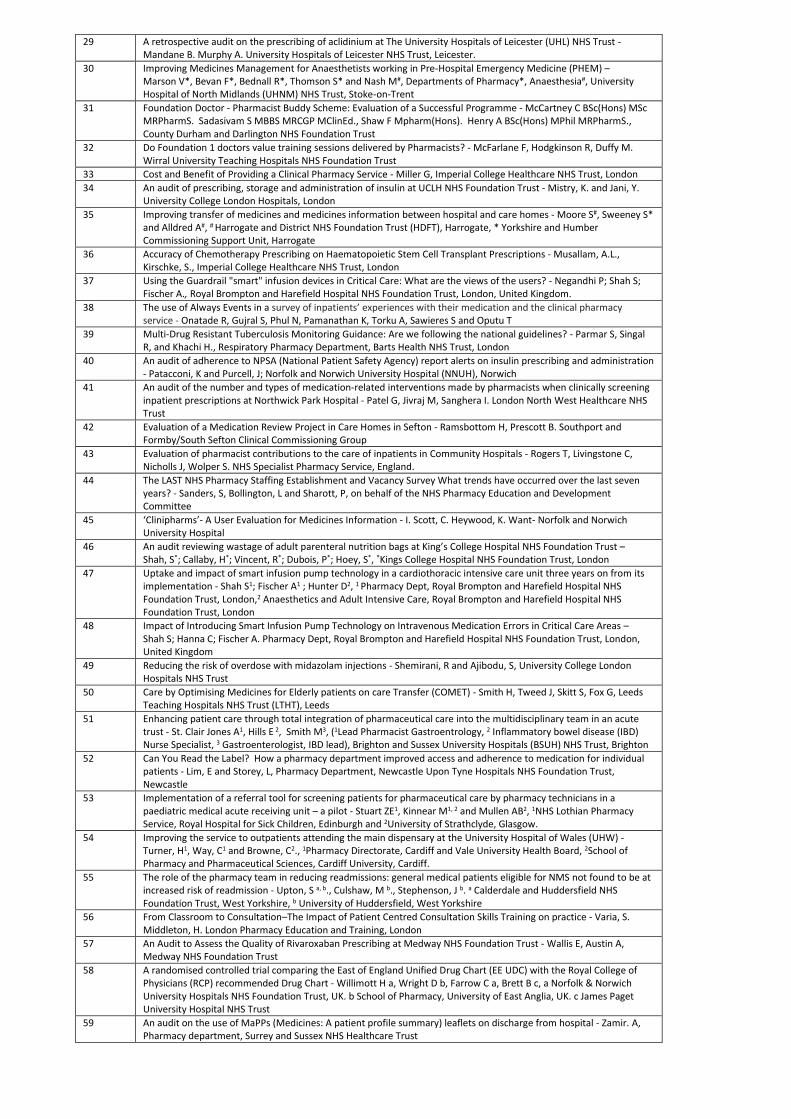
Introduction Activation of the platelet glycoprotein IIb/IIIa (GPIIb/IIIa) receptor is the final common pathway leading to platelet aggregation, coronary thrombus formation, and myocardial ischemia. GPIIb/IIIa inhibitors (GPI) are indicated for coronary angioplasty and for initial management of high risk acute coronary syndromes. Eptifibatide is one of three available GPI in the UK. It is used at a large tertiary referral centre (Heart Attack Centre [HAC]) for primary percutaneous coronary intervention (PPCI) in STEMI as an off label indication. Eptifibatide is administered as two bolus doses separated by 10 minutes with a continuous infusion continued for up to 24hr1 although locally it is usually stopped after 12 hours. This allows sufficient time for oral antiplatelet absorption and activation to occur. Fabolus PRO2 demonstrated an optimal antiplatelet treatment regimen minimised the need for prolonged GPI infusion time in combination with more potent oral antiplatelet agents, this reduced the risk of major bleeding with good residual inhibition of platelet activity. We report an analysis of a quality improvement initiative to introduce a more potent antiplatelet (ticagrelor) for patients undergoing percutaneous coronary intervention (PPCI) with reduced eptifibatide infusion to just 6 hours thereby offering an optimal antiplatelet strategy in accordance with the Fabulous PRO study. Aim To review the impact of an updated antiplatelet and GPI strategy through the introduction of a more potent oral antiplatelet agent (ticagrelor) and a shortened infusion of eptifibatide for 6 hours with an assessment of short term outcomes and the implications financially. Method As a service quality improvement initiative, ethics approval was not required. Data was collected prospectively on the coronary care unit (CCU) in April 2014 to collect 50 consecutive patients admitted with acute myocardial infarction (AMI) following the quality improvement initiative. Information was collected from documentation in the integrated care pathway, drug chart and cath lab report. Results A review of 50 STEMI patients undergoing PPCI3 revealed no complications either ischaemically (in stent thrombosis) or safety (major bleeds). A review of the financial implications suggest financial savings of approximately £3,000 per month from the lack of extended infusion of GPI (see figure 1). Discussion Major bleeding is a significant driver for mortality following acute coronary syndrome (ACS) particularly within 30 days of ACS event4. A recent in house audit3 reviewing the acute management in patients admitted with STEMI (n=43) undergoing primary PPCI showed that 40 (93%) patients with STEMI received eptifibatide. All 40 had a double bolus and infusion. 36 (90%) patients had their infusion running for 12 hours, 2 (5%) stopped early due to GI bleed and 2 (5%) received infusions for 24 hours at consultant requests due to complex lesions / procedures. Since the switch to ticagrelor and implementation of reduced infusion GPI, we have had no bleeding complications in the 50 patients audited nor ischaemic complications due to insufficient antiplatelet effect. Figure 1: Chart showing financial impact of introducing a loading dose of ticagrelor allowing reduction of eptifibatide infusion.
A pharmacy led initiative reviewing peri-procedural prescribing in an area where pharmacy doesn’t routinely have presence has led to both an improvement in outcome for patients as demonstrated from the lack of major bleeding albeit in a small sample and released financial savings for the trust. Financially, this translates to approximately £20,000 saving financially when the reduction of eptifibatide and increase in ticagrelor spend is taken into account. Conclusion Reducing the infusion of GPI after 6 hours with a caveat that it can be extended (or not given in the first instance) under direction of the consultant physician if needed for complex lesions is a safe and effective cost improvement strategy that has delivered rapid savings and optimised the antiplatelet strategy for a cohort of PCI patients. References
1. Gurbel PA, Bliden KP, Butler K et al. Randomized Double-Blind Assessment of the ONSET and OFFSET of the Antiplatelet Effects of Ticagrelor Versus Clopidorel in Patients with Stable Coronary Artery Disease. Circulation 2009; 120:2577-85. ONSET OFF SET
2. Valgimigli M et al Fabolus PRO study, J Am Coll Cardiol Intv 2012;5:268-771. 3. In-house audit: A review on the use of glycoprotein inhibitor usage for PPCI at the London Chest Hospital (April 2014) 4. Eikelboom JW, Mehta SR, Anand SS et al. Adverse Impact of Bleeding on Prognosis in Patients With Acute Coronary Syndromes registry
Circulation. 2006;114:774-782
5. An evaluation of the impact of a multidisciplinary review of medication in care homes on hospital admissions, out-of-hours and GP visits Barrett S, Baqir W, Learmouth M, Hughes J, Desai N, Copeland R, Campbell D, Laverty A., Northumbria Healthcare NHS Foundation Trust.
Introduction The Care Homes Use of Medicines Study (CHUMS) study1 and the Making Care Safer2 report highlighted medicines use in care homes as an area of concern: medication errors, excess medicines, lack of medication review and lack of resident involvement in medicines decisions. The Shine care home project developed a pragmatic framework for pharmacist-led medication reviews in care homes where residents and/or family were involved in all decisions about medicines.3 Reviews were carried out by clinical pharmacists across 20 care homes working in multidisciplinary teams involving the pharmacist, care home nurse or senior carer and the general practitioner (GP) where available.3 Intervention data was collected throughout the Shine project but the impact of the medication review intervention on resident admissions to hospital or GP callouts was unknown. Objectives To quantify the impact of the Shine intervention over a 12 month period following reviews on:
hospital admissions
out-of-hours (OOH) urgent visits
GP visits Method The evaluation was conducted in four general practices covering fifteen care homes involved in the Shine project. Outcome measures were emergency admissions to hospital (excluding outpatient visits or planned care), OOH urgent visits and practice GP visits (care home visits or telephone advice by clinical practice team). Subjects were sampled from the 422 residents involved in the Shine project. Electronic GP records were reviewed to determine the frequency of each outcome measure. Residents were excluded from the evaluation where primary care records did not cover a period of 12 months prior to and 12 months after the Shine intervention. IBM® SPSS® Statistics (Version 21) was used to test for normal distribution and determine statistical differences in the matched pairs of data. The null hypothesis stated there would be no difference in medians of admissions, OOH visits and GP visits before, and after the Shine intervention. A probability of <0.05 was chosen to demonstrate statistical significance. Ethics approval was not required as this was a retrospective evaluation of a quality improvement project. Results Of the 271 residents reviewed, 157 residents were included in the evaluation. 114 were excluded as 12 month records pre- and post-intervention were unavailable. There were 173 hospital admissions, 120 OOH calls and 2,011 GP visits prior to the Shine intervention and 110 admissions, 48 OOH calls and 2064 GP visits post-intervention. All three data sets demonstrated non-parametric distribution. Statistical analysis was performed using Wilcoxon Signed Rank. A 2-tailed test was chosen to allow for both increases and decreases in each outcome following the Shine intervention. We demonstrated a statistically significant reduction in hospital admissions (p=0.002) and OOH visits (p<0.001) and a non-significant difference in GP visits (p=0.608) (see Table 1). Table 1: Hospital admissions, OOH and GP visits before and after Shine review for 157 residents
Admissions OOH GP
Pre-Shine Review Total 173 120 2011 Mean (S.D.) 1.1 (1.7) 0.8 (1.4) 12.8 (10.7)
Post-Shine Review Total 110 48 2064 Mean (S.D) 0.7 (1.5) 0.3 (0.8) 13.1 (10.6)
Mean difference (95% C.I.)
-0.4 (-0.66 , -0.15)
-0.46 (-0.68 , -0.24)
0.34 (-1.25 , 1.93)
Sig. a 0.002 <0.001 0.608
a. Difference following intervention based on Wilcoxon signed rank (2-tailed) Discussion/Conclusion This evaluation provides evidence to indicate that a multidisciplinary review of medication in care homes incorporating shared decision making can reduce emergency hospital admissions and urgent OOH calls whilst making no difference to GP calls. A limitation of this study is that it did not explore the reasons for these differences. Further analysis of the admission details would also be needed to estimate the costs of secondary care utilisation. However it is assumed that any reduction in admissions and out-of-hours calls will reduce healthcare costs. References 1. Barber ND, Alldred DP, Raynor DK, et al. Care homes’ use of medicines study: prevalence, causes and potential harm of medication errors in
care homes for older people. Quality and Safety in Health Care 2009;18:341-346. 2. The Health Foundation and Age UK. Learning report: Making care safer. June 2011. http://www.health.org.uk/publications/making-care-safer/
(accessed 30 January 2015). 3. Baqir W, Barrett S, Desai N, et al. A clinic-ethical framework for multidisciplinary review of medication in nursing homes. BMJ Qual Improv Report
2014;3:doi:10.1136/bmjquality. u203261.w2538.http://qir.bmj.com/content/3/1/u203261.w2538.short?g=w_qir_recent_tab (accessed 30 January 2015).
6. Successful implementation of ‘Sepsis 6’ bundle in the maternity unit; a multi-disciplinary quality improvement project Benn, C; Stapleton C; Lanzman, M; Royal Free London NHS Foundation Trust, London
Introduction Sepsis is one of the leading causes of maternal death in the UK. The immunological changes of pregnancy leave otherwise young and healthy women at risk of sudden, rapid deterioration with severe sepsis. Use of sepsis management care bundles e.g. the ‘Sepsis 6’1 is recommended2, 3, however they need to be administered fast and reliably; delay or omission of antibiotics, IV fluid administration or serum lactate measurement in particular have been reported in cases of maternal death from sepsis2. At the Royal Free London NHS Trust the Sepsis 6 bundle had been successfully implemented in several clinical areas with the support of a Patient Safety Facilitator and Sepsis workstream beginning in 2010. In these pilot areas overall compliance is between 85-90% accompanied by a 10% reduction in mortality and 50% reduction in length of stay. Concern about maternal sepsis due to national reports3, 4 and local incidents lead the maternity unit to approach the Trust Sepsis workstream for support in the autumn of 2013.
Objective Consistent use of a Sepsis 6 care bundle to improve the identification and management of severely septic pregnant, labouring, or post-partum women. Measure: 95% compliance with all 6 bundle interventions within 1 hour in all women with 2 or more severe sepsis triggers and potential/ confirmed infection.
Method An obstetric ‘Sepsis 6’ protocol was implemented in the maternity unit via a quality improvement process using small tests of change; (Plan, Do, Study, Act cycles), continual measurement, regular feedback from the Patient Safety Facilitator (PSF) and staff education.
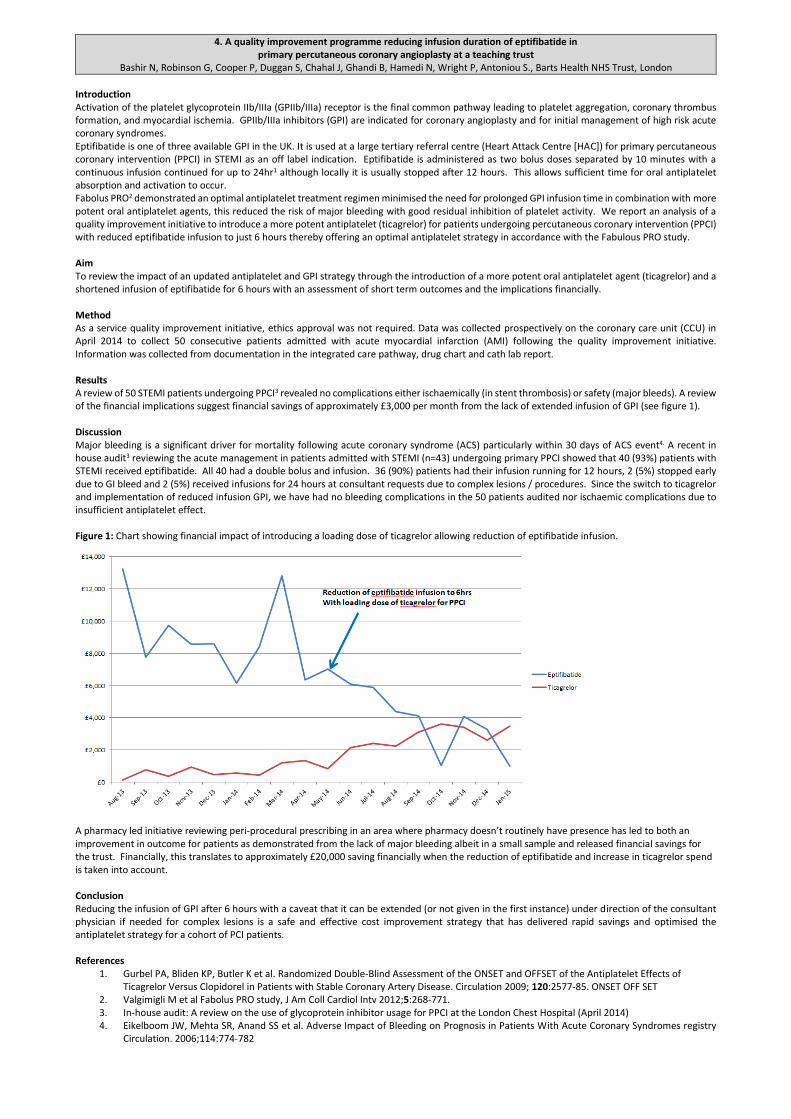
Results To date (October 13- December 2014) 27 women have been commenced on the pathway; 1 required ITU admission; all others were discharged home & there have been no deaths. 44% were in labour, 19% less than 3 hours after delivery, 19% were postnatal inpatients, 11% were antenatal, 7% were postnatal readmissions. 78% of cases reviewed were commenced on the bundle within 1 hour of identifying 2 or more trigger signs of severe sepsis. Compliance with all 6 interventions within 1 hour in all women has been achieved in 10/15 months overall and 7 of the past 8 months. Compliance with the 6 individual interventions of the care bundle is shown in Figure 1. Support and resources to deliver these results:
August - September 2013- Improvement pilot planning; including PSF, anaesthetists, obstetricians, midwives & pharmacist. Sepsis 6 pathway proforma developed
October - November 2013: Pilot began: Sepsis Grab bags provided (equipment, antibiotic guideline, no antibiotics). Compliance measured, notes review & feedback; Midwife ‘Champion’ recruited. Mandatory training for Drs and Midwives
May 2014- Maternity Sepsis 1st line antibiotic ‘quick reference guide’ sheet developed- antibiotics by source of sepsis; pregnant or post natal & colour coded for drug allergies. Available on intranet & in ‘grab bags’, drug room & ward sepsis folder.
September 2014 - ‘International Sepsis Awareness Day’ celebrated
October – November 2014 Sepsis 6 protocol sticker for maternity notes developed. Sepsis Trolley launch with guidance, stickers, antibiotics, equipment, swabs. Obstetric sepsis bundle interventions added to Sepsis 6 Smartphone app
Discussion The implementation of a sepsis 6 bundle has improved & simplified the management of severely septic women in the maternity service. Achieving reliability of care through the care bundle requires intensive support to embed the behaviour change; Compliance fluctuates and needs to be measured in order to feedback to staff and maintain the positive changes. A multidisciplinary approach is essential to ensure all members of the care team actively support the change. Pharmacists can contribute to the development of antibiotic guidance ensuring options and doses meet the different needs of both pregnant and breastfeeding women; and making these guidelines simple, consistent, and easily accessible. Future developments planned:
Audit appropriate choice of antibiotic for suspected source of infection
Review all Sepsis in labour cases for more detailed data analysis.
Maternity sepsis Antibiotic options added to Trust antibiotic smartphone app
References 1. Daniels R. Surviving the first hours in sepsis- getting the basics right! Journal of Antimicrobial Chemotherapy 2011; 66 Suppl 2: ii11–ii23 2. Knight M, Kenyon S, Brocklehurst P, et al (Eds.) on behalf of MBRRACEUK. Saving Lives, Improving Mothers’ Care - Lessons learned to inform future maternity care
from the UK and Ireland Confidential Enquiries into Maternal Deaths and Morbidity 2009–12. Oxford: National Perinatal Epidemiology Unit, University of Oxford; 2014.
3. Gwyneth L (Ed); Centre for Maternal and Child Enquiries (CMACE). Saving Mothers’ Lives: reviewing maternal deaths to make motherhood safer: 2006–08. The Eighth Report on Confidential Enquiries into Maternal Deaths in the United Kingdom. BJOG 2011;118 (Suppl. 1):1–203.
4. Sepsis in Pregnancy, Bacterial (Green-top Guideline No. 64a) 2012 Royal College of Obstetricians and Gynaecologists Ethics approval was not required for this service evaluation / audit. Acknowledgements: Sepsis Workstream Group & Labour ward Champions; Royal Free NHS Foundation Trust
7. The Introduction of Pharmacist-Led Peri-operative Anticoagulation Bridging Clinics at St James’ Hospital, Leeds Blow, S. E, Akbar, R., Pharmacy Department, Leeds Teaching Hospitals NHS Trust, Leeds
Introduction The perioperative management of patients receiving anticoagulant therapy requires the assessment, awareness and balancing of an individual’s thromboembolic risk versus the associated bleeding risk1. An established method of doing this is through conversion of oral warfarin to intravenous heparin2. The overall perceived risk to the patient of a thromboembolic event whilst off anticoagulation needs to drive the decision whether bridging therapy is appropriate3. This has even greater importance when considering that the associated surgical bleeding risk differs by procedure but also dependent on each surgeon’s perception of bleeding risk3. In order to safely manage the bleeding risks associated with any surgery, warfarin needs to be discontinued in time to allow a pre-operative INR of 1.5 or less4. A pharmacist-led peri-operative anticoagulant bridging clinic was piloted within the pre-operative assessment clinic at St James’ University Hospital, Leeds. The project was launched following a review of the number of patients being admitted pre-operatively for intravenous heparin, and the number of patients whose surgery was cancelled for reasons relating to anticoagulation management. This amounted to between 6 and 15 admissions per month, with each patient admitted three days prior to surgery. Historical data shows that the cancellation rate of surgeries owing to inappropriate anticoagulation management was between 6 and 20 surgeries per month. Objective(s) To evaluate the service we determined
Number of patients whose anticoagulation was safely managed by the bridging clinic.
Number of patients whose surgery was cancelled because of unstable anticoagulation
The patient experience of the pharmacist led bridging clinic
Does the pre-operative anticoagulant bridging clinic reduce patient’s length of stay? Method The implementation of the bridging clinic was led by a specialist surgical pharmacist working within a wider team of healthcare professionals. The clinic is situated within surgical pre-assessment. When patients attend for a pre-operative assessment they are reviewed by the nursing team, who identify those taking anticoagulants. Patients who are taking warfarin, and who are assessed as moderate or high risk of VTE are referred to the pharmacist. For complex cases a treatment plan is made in conjunction with the consultant surgeon, anaesthetist and, where appropriate the cardiologist managing their condition. Patients who require bridging therapy are tracked by the pre-assessment team, and once a surgical date known booked to attend a clinic appointment with the pharmacist. At this appointment the pharmacist manages the conversion from oral warfarin (and other anticoagulant agents) to sub-cutaneous injections of tinzaparin. The clinic pharmacist prescribes the necessary bridging therapy and pre-packs supplied from clinic. Clinic pharmacists teach patients and carers how to administer a sub-cutaneous injection at home, alternatively a referral to district nurses is made. This enables patients who would previously have been admitted three days before procedure to be admitted on the day of surgery. The management of all patients referred to the bridging clinic between January 2013 and January 2014 was recorded (see table one) and reviewed. To assess patient experience, a questionnaire was sent to all patients who attended the clinic. Ethics committee approval was not required. Results Results as follows for the first year of the pilot;
127 patients received medicines management advice and anticoagulant bridging therapy.
Of the 127 patients who received anticoagulant bridging therapy, six were cancelled on the day of procedure for reasons other than anticoagulant management.
1 patient was cancelled due poor anticoagulation management (INR>1.5)
Assuming all 127 patients would have previously been admitted for intravenous heparin therapy (3 days pre-operatively), this service made an additional 381 bed-days available for elective surgical admissions.
Since introduction of the clinic no patient has experienced a clotting or bleeding episode. Feedback from the patient experience questionnaire was very positive, with all patients stating that they would recommend the service to their friends and family. However, two patients raised the issue of having to return to the hospital for an additional clinic appointment. Discussion The addition of this clinic has seen benefits such as reducing the number of cancelled surgeries due to poor anticoagulation management, increasing the number of beds available for elective surgical admissions, and improved patient experience regarding the improved peri-operative management of their anticoagulation. There has also been an unexpected anecdotal improvement in the multi-disciplinary working between the pharmacist, surgeons, matrons and operational managers. There has only been one patient whose procedure was cancelled due to an INR>1.5. The patient’s sensitivity to warfarin had not been identified and subsequently it took longer than the expected five days for an INR safe for surgery to be achieved The success of this clinic is felt also to be due to the involvement of the operating surgeons. When patients are identified as needing surgery, surgeons have been asked to identify those patients they feel would benefit from bridging therapy and where bridging therapy may need to be adjusted to prevent any impact on surgical bleeding risk. This multidisciplinary approach to care has been a major feature of the project A limitation of this work was that patients taking other anticoagulant or antiplatelet agents were excluded, future work ought to consider this patient group for inclusion. In addition further work is needed to ascertain changes to patient’s length of stay as a result of this service. Such was the success of this clinic, trust wide clinics are being introduced. References 1. Jaffer, AK. Perioperative Management of warfarin and antiplatelet therapy. Cleveland Clinic Journal of Medicine. 2009;76(4):537-544 2. Douketis, J. The Thrombosis Interest Group of Canada: Perioperative Management of Patients who are Receiving Warfarin or Antiplatelet Therapy
(TIGC Guideline). 2009 3. Douketis JD. Perioperative management of patients who are receiving warfarin therapy: an evidence-based approach. Blood 2011;117(19):5044-
5049 4. Douketis JD, Spyropoulos AC, Spencer FA, et al. Perioperative management of antithrombotic therapy. American College of Chest Physicians
Evidence-Based Clinical Practice Guidance (8th edition). CHEST 2008;133:2995-3395
8. An Audit Assessing the Compliance with National Guidance for extended Venous Thromboembolism Prophylaxis in Patients Undergoing Major Abdominal Cancer Surgery at University Hospital Aintree NHS Foundation Trust.
Brady A., Brennan C. and Arthur J. Aintree University Hospital NHS Foundation Trust, Liverpool.
Introduction Patients undergoing major abdominal surgery are at risk of developing postoperative venous thromboembolism (VTE). Previous prospective cohort studies have documented the incidence of postoperative deep vein thrombosis (DVT) to be as high as 25%1, and an incidence of pulmonary embolism (PE) ranging from 0.13% to 0.63% in the proceeding 4–6 weeks after surgery2. National Institute of Health and Clinical Excellence (NICE) clinical guideline 92 3 and University Hospital Aintree (UHA) Trust guidelines 4 advocates the use of 28 days extended VTE prophylaxis postoperatively for those patients who have had major cancer surgery in the abdomen or pelvis. A previous audit undertaken by D. Hamill 5 in University Hospital Aintree (UHA) looked at 87 patients over a three month period in 2011. This audit showed UHA was non-compliant with the NICE guidelines, with only 1 of these 87 patients having the recommended 28 days post-operative VTE prophylaxis prescribed. The audit further showed 3 of these 87 patients suffered a VTE within 12 weeks of operation. Aim This audit aims to assess if UHA is compliant with NICE CG 92 and Trust guidelines, with respect to the prescribing of extended VTE prophylaxis (28 days) in those patients undergoing major cancer surgery in the abdomen and pelvis. This audit also aims to assess the prevalence of VTE incidents within 12 weeks post surgery. Objectives For these major abdominal cancer surgery patients: 1. Quantify the percentage of patients who had mechanical VTE prophylaxis prescribed and compare this to figures in 2011. 2. Quantify the percentage of patients who had a pre-operative dose of pharmacological prophylaxis prescribed. 3. Quantify the percentage of patients who had 28 days of VTE prophylaxis prescribed and compare this to figures in 2011. 4. Quantify the percentage of patients who suffered a PE or DVT within 12 weeks post surgery. Methods A database of information was obtained from UHA coding department of those patients who underwent major abdominal cancer surgery between 1st January 2013 and 30th July 2013 at UHA. The EPMA system (electronic prescribing and medicines administration) and any paper prescriptions were used to identify how many days each patient had mechanical and pharmacological VTE prophylaxis prescribed as an inpatient. EPMA was also used to identify the number of days each patient had pharmacological VTE prophylaxis prescribed on discharge. All UHA clinic letters written 12 weeks post surgery were checked and the GP surgery was contacted to enquire if each patient had any VTE event within 12 weeks of surgery. Ethics approval was not required for this retrospective audit. Results Table 1: VTE prophylaxis prescribing and incidence of VTE in 2013 compared with 2011
2011 2013 Standard
Objective 1 Compliance with mechanical prophylaxis
prescribing 43.70% (n=87)
71.40% (n=98)
100%
Objective 2 Compliance with the prescribing of the pre-
operative dose Not documented
66.30% (n=98)
100%
Objective 3 Compliance with the prescribing of
pharmacological prophylaxis for >28days 1.15% (n=87)
56.80% (n=88)
100%
Objective 4 Patients who incurred a VTE within 12 weeks post
operatively 3.45% (n=87)
0% (n=98)
0%
The 56.8% (n=88) of patients who met the required course length of pharmacological VTE prophylaxis prescribing either had an inpatient stay of this length or had an appropriate course prescribed on discharge. 18.1% of patients (n=88) had only 27 days of VTE prophylaxis prescribed in total and this was as a result of an insufficient number of days prescribed on the discharge prescription. The remaining 25% of patients failed to have any pharmacological VTE prophylaxis prescribed on discharge when it was required. Discussion The results displayed in table 1 illustrate the standard of 100% compliance to NICE CG 92 was not met by UHA in 2013. Despite not meeting the standards of 100% in this audit no patient incurred a VTE event within 12 weeks of surgery. Table 1 also highlights the dramatic improvement in compliance of VTE prophylaxis prescribing since 2011, both mechanical and pharmacological. The 18.1% of patients who received an incomplete course length of VTE prophylaxis was most likely due to a lack of communication on the inpatient prescription as to the exact operation date. One recommendation from the audit is therefore to improve documentation of operation dates on the prescription charts of these patients. The 25% of patients who failed to receive any VTE prophylaxis on discharge were found to be of similar surgery types and therefore probable reasons for the overall poor compliance are consultant preference and a lack of education amongst junior doctors. At present NICE guidelines and the Trust guidelines fail to elaborate or describe the surgery types which are considered 'major'. Subsequently, a further recommendation of this audit is for the Trust to introduce more formal guidelines and education as to what surgery types are considered major and therefore should have extended VTE prophylaxis prescribed. Conclusion Compliance with the NICE clinical guideline 92 has dramatically improved since 2011. However there is scope for this to further improve. This could be achieved with improved education and the introduction of more specific Trust guidelines regarding the definition of 'major' abdominal surgery. References 1. Clarke-Pearson DL, Synan IS, Colemen RE et al. The natural history of postoperative venous thromboemboli in gynecologic oncology: a prospective study of 382
patients. Journal of Obstetrics and Gynecology. 1984; 148: 1051–4. 2. Huber O, Bounameaux H, Borst F et al. Postoperative pulmonary embolism after hospital discharge. An underestimated risk. Archives of Surgery 1992; 127: 310–3. 3. National Institute of Health and Clinical Excellence. NICE CG92. Venous Thromboembolism: Reducing the Risk. London. NICE. 4. Warburton J. University Hospital Aintree Venous Thromboembolism Policy; 2011. 5. Hamill D. A retrospective audit to assess the prevalence of venous thromboembolism in cancer patients undergoing Major Abdominal Surgery at Aintree University
9. Service Evaluation to Assess the Quality of Communication on Discharge Letters regarding Changes to Medication and make Recommendations for Improvement
Croft M.T, Cavill K., Pharmacy Department, Harrogate District Hospital NHS Foundation Trust. Harrogate
Introduction The discharge letter is the summary document which describes what has happened during a patients’ hospital stay. Medication on discharge can vary from the medication taken at admission and may require follow-up in primary care. One purpose of the discharge letter is to communicate these changes during the transfer of care from secondary to primary care and ensure that the GP is aware of any medicines that have been stopped, started or changed to avoid any unintentional harm to patients. In 2005 the RPSGB produced ‘Moving patients, Moving Medicines, Moving Safely’ which highlighted that 84% of GPs “occasionally” or “never” received information about why medicines had been altered in hospital.1 Recently, the Royal College of Physicians have published new guidelines for the structure and content of hospital discharge records.2 They state that two subheadings should be included; changes to medication and reasons for medication changes. The guidelines imply that all discharge letters should comply with these requirements but there are standards for what percentage of changes should be communicated on discharge or type of changes should be included/excluded. Aims To assess the quality of discharge letters by examining the completeness of communication of medication changes to primary care Objectives
To compare sampled discharge letters against the following standard: All discharge letters should have all medication changes with reasons recorded.
To make recommendations to improve the service provided. Method Ethical approval was not required due to the nature of this service evaluation. During the study period (1-14 February 2013) 496 discharge letters were completed. 67 letters were excluded and random sampling continued until 100 letters were evaluated. The medication listed on the sampled letters was compared with the pharmacists’ drug history documented on admission. Any changes to medicines during admission that were not documented on the discharge letters were recorded as either stopped, started or changed and classified by BNF subgroup. The inclusion criteria were; patients >18 year and drug history documented by a pharmacist. The exclusion criteria were; deceased during admission, day-case ward attenders, discharge letters with no medication and multiple admissions during the study period. A limitation for this evaluation is that the assumption has been made that the pharmacists’ drug history is 100% accurate. A potential bias for this method is that this was an internal audit conducted by pharmacy staff. Results 95% of the sampled letters had changes to admission medications with an average of 4.3 changes per letter. These changes were comprised of 143 medicines stopped, 263 medicines started and 20 medicines doses changed. 49% of all medicines changes were not documented on the discharge letters. 17% of letters had both the medicines changes and the reasons for changes communicated on the discharge letters. Table 1 shows the percentage of medication changes that were communicated on the discharge letters, categorised as medicines stopped, started or changed. Communicated, indicates that all medication changes during admission were communicated on the discharge letter. Not communicated: that none of the changes during admission were communicated and partially communicated: that some of the changes were communicated on the discharge letters Table 1 Percentage of discharge letters communicating medicines changes
Communicated Partially Communicated Not Communicated
The 207 medication changes, missing from discharge letters, were categorised into 43 BNF second-level classes of medicines. 45% of these were three BNF classes; analgesics, laxatives and antibiotics. Some BNF classes were considered ‘higher risk’. These were antibiotics, anticoagulants, corticosteroids, antidiabetics and cardiology medications. 17% of missing medicines changes were in these ‘high risk’ classes of medicines. The information about changes to medication on discharge letters was predominantly written by doctors, 71% with pharmacists completing 10% of letters and 19% as a combination of both. Discussion The results obtained reflect the report ‘Keeping patients Safe when they Transfer between Care Providers’3 in that 28-40% patients have medicines stopped and 45% have medicines started. 17% of discharge letters sampled complied with the standard set which mirrors the RPSGB document ‘Moving patients, Moving Medicines, Moving Safely’1. From the data collected, dose changes made to medication taken on admission is more likely to be communicated on discharge letters than medicines started or stopped. The conclude may be that it is obvious from the medication list supplied which medications have been stopped or started but changes to current medication are specified to avoid inadvertent confusion in primary care. The fact that information about medication changes are only partially made may indicate that the doctors perception regarding the clinical importance of changes may influence what is communicated; for example, a new antihypertensive is communicated but a new laxative is not. 45% of non-communicated medicines changes comprised of analgesics, laxatives and antibiotics. Analgesics were highest, predominantly due to paracetamol and codeine being started on surgical wards. Similarly, laxatives are often co-prescribed but are generally not included as a ‘medicine started’. Finally, antibiotics came third due to many acute GP prescriptions being switched to more appropriate antibiotics during admission, which were not consistently documented as stopped on the discharge letters. Following this evaluation recommendations and strategies were put forward and implemented: The discharge letter template was altered to have a mandatory section on medication changes and education was provided to medical staff and pharmacists on the importance of communicating changes to medication. A similar evaluation (November 2014) showed that 81% of discharge letters record changes made to medication during the hospital stay. Anecdotally we have not heard any complaints from medical or pharmacy staff regarding additional time required to complete discharge letters however this has not been fully evaluated. The impact of this change in practice across the interface with primary care is a possibility for a future piece of work. References 1. RPSGB, Moving patients, Moving Medicines, Moving Safely: Guidance on Discharge and Transfer Planning; London; 2005 2. Royal College of Physicians, Standards for the clinical structure and content of patient records; Leeds; 2013 3. Picton C, Wright H. Keeping Patients Safe when they Transfer between Care Providers-Getting the Medicines Right-Final Report; Royal Pharmaceutical Society; London; 2012
10. Formulation of a pharmacy support staff development strategy. Facilitating workforce planning and development opportunities within Brighton & Sussex University Hospitals
Allen, C. Clarke, M. Conway, A. Murray, A. Perilli, N. Stevens, J. Sturgeon, T. Wilkins, S. Brighton & Sussex University Hospitals NHS Trust
Background The Pharmacy Department collaboratively agreed objectives1 for the next three years. One of the 6 objectives was to “support, nurture, motivate and invest in our staff”. Within the department, pharmacy support staff (administration, assistants & Pharmacy Technicians) make up 51% (n=84) of the overall Pharmacy workforce. Traditionally, effort and resources of development is directed to junior pharmacists and the pharmacy support staff tends to be undervalued and their development needs insufficiently recognised. It was agreed by the Pharmacy Senior Management Team to review and assimilate current job descriptions of Pharmacy Support Staff and identify training strategies to ensure staff are able to carry out their roles competently. The developed strategies should provide consistency and transparency of training opportunities for each staff group.
Objective(s) 1. Identify training opportunities for this staff groups locally and in accordance with national publications (NHSPEDC) 2. Assess the Job Specifications of all Pharmacy Support staff within the department to identify consistent themes for education and training
opportunities across each staff group. 3. Assemble a working group to review identified requirements and themes 4. Develop written development strategies from collated themes
Method In 2013, following approval of Pharmacy Department objectives, a working group consisting of the Chief and Principal Pharmacy Technicians within the department was established. Initial work involved an initial scoping exercise utilising HEKSS EPD peers within the region being approached to identify any existing internal strategies being created/used in practice that could be shared for reference and benchmarking. The NHS Pharmacy Education & Development Committee (NHSPEDC) Education and Training Programmes to Support Foundation, Advanced and Extended roles of Pharmacy Technicians2 document was also consulted to align with national job profile remits (Agenda for Change - AfC). Ethics approval not required. The Chief & Principal Pharmacy Technician forum was inclusive of each sector within the Pharmacy Department. Staff development strategies were included as a standing agenda item to imbed the development of this work into this forum. Pharmacy Support Staff Job Descriptions were collated ensuring all roles were included by cross referencing recently reviewed management structures, triangulating this data for completeness. Assessment of job role person specifications was undertaken. The job descriptions informed the relevant training requirements for each band and speciality (linked to AfC role profiles). This included generic Trust wide training such as sickness absence management, recruitment & selection and appraisal training. Initial drafts of the strategies were presented for comment and authorisation at the Chief & Principal Pharmacy Technician group.
Results The initial scoping process identified there were no other strategies in place within the region being used. The NHSPEDC career pathway document proved a useful point of reference, although specifically aimed at Pharmacy Technician roles. There were no identified progressive objectives facilitating the transition from one band to the next (band 2 to 3 for Pharmacy admin and assistants or bands 4 to 5 and upwards for Pharmacy Technicians). Job descriptions were reviewed, taking onto account existing specifications and the duties required of the role in practice. This information was then cross referenced to the AfC job profiles (to ensure consistency) and also identify distinguishing duties of senior roles in each group. The forum developed a training strategy to align with training opportunities provided in-house. Table One below illustrates application to band 2 to 5 Pharmacy Support staff roles (ATO and Pharmacy Technician) Table One – Band 2 and 5 progression (ATO to Medicines Management Technician)
AfC band
Example of Job Role
Period of time in role
Essential Requirements Competencies
Dept. offered developmental
training
Additional roles within
dept
Accreditations/ Awards
Trust offered developmental
training
2
Assistant Technical Officer (ATO)
NVQ & BTEC Level 2 Oral Chemotherapy training Reception training
NVQ Witness Fire Warden First Aid
HEKSS Medicines Management Accreditation Module 1 – Patient’s Own Drugs
3 Senior Assistant Technical Officer (SATO)
NVQ & BTEC Level 2 Oral chemotherapy training JAC monthly reporting Patient Tracker System (PTS) reporting
As above NVQ witness Shadow placement experience (B6 Tech)
MM Assessor MM or ACPT Education Supervisor
HEKSS Accredited Checking Pharmacy Technician, Medicines Management Accreditation Practice Supervisor A1/AQA Award
The final versions of the strategies were presented for approval by the Senior Pharmacy Managers group.
Discussion/Conclusion This is a novel and structured approach to ensure competency of pharmacy support staff and provides clear support for their development. This makes the appraisal process consistent and transparent within staff groups. It is envisaged this will be used to imbed development strategies into appraisal process and promote on-going development in role to avoid potential stagnation and demotivation of staff. Future work is to undertake a gap analysis to direct resources and managing capacity within the Pharmacy Department as currently as this is a limitation on this part of the audit. The identified training opportunities outlined in the strategies are all delivered either free of charge or under a Service Level Agreement with HEKSS, enabling cost effective education in the workplace.
References 1) Pharmacy Objectives 2012-2015, Pharmacy Department 2) Signposting to Education & Training Programmes to Support Foundation, Advanced and Extended Roles for Pharmacy Technicians, NHSPEDC Pharmacy
Technician and Support Staff Group, October 2014.
11. Appropriateness of prescribing of potent oral antiplatelet therapy in Acute Coronary Syndrome (ACS) patients at a London Heart Attack Centre (HAC)
Cooper, P, Bashir, N, Duggan, S, Chahal, J, Gandhi, B, Hamedi, N, Robinson, G, Wright, P, Antoniou, S., Barts Health NHS Trust, London
Introduction National Institute for Health and Care Excellence (NICE) recommend ticagrelor in combination with low-dose aspirin for up to 12 months as a treatment option in adults with acute coronary syndrome (ACS).1 Ticagrelor has shown greater benefit in preventing cardiovascular events in ACS patients compared with clopidogrel, however this was at the expense of an increase of major bleeding1. Utilising GRACE2 (ischaemic risk) and CRUSADE3 (bleeding risk) scores, patients can be globally risk stratified to guide suitability for most benefit from treatment with ticagrelor vs clopidogrel. Barts Health NHS Trust cardiology board recently approved guidance where specialist cardiac pharmacists support antiplatelet choice based on individual patients GRACE and CRUSADE scores. Objectives Determine compliance with the following standards based on Trust guidance: 1. 100% of ACS patients with lowest/low GRACE risk score (≤ 88) or high/very high CRUSADE bleeding score (≥ 41) to receive clopidogrel (in combination with low-dose aspirin) for up to 12 months as maintenance antiplatelet therapy. 2. 100% of ACS patients with intermediate/high GRACE risk score (≥ 89) and not high/very high CRUSADE bleeding score (≤ 40) to receive ticagrelor (in combination with low-dose aspirin) for up to 12 months as maintenance antiplatelet therapy. Method As an audit, ethics approval was not required. A prospective audit assessing all patients admitted to a London Heart Attack Centre (HAC) with a diagnosis of ACS from 15 July 2014 until 19 January 2015 excluding those with unstable angina, receiving prasugrel; or in whom ticagrelor was considered inappropriate such as those with a previous stroke, considered high risk of bleeding despite GRACE risk score e.g. elderly (>75 years old), receiving anticoagulation for alternative indications such as atrial fibrillation (AF), where clopidogrel is preferred due to increased risk of bleeding in those patients awaiting coronary artery bypass graft (CABG) or other reasons e.g. overseas patients. Patients were identified by specialist cardiac pharmacists covering inpatient cardiology wards. Pharmacists completed the patient information and diagnosis; and calculated the GRACE and CRUSADE scores using a data collection tool. The remainder of the data collection tool was completed retrospectively following discharge using heart attack centre (HAC) integrated care pathway (ICP), medication chart and discharge medications on electronic patient record (EPR) to collate the data. The data collection tool was piloted prior to the data collection period with minor amendments made to help ensure patient information and diagnosis were recorded accurately by specialist cardiac pharmacists. Data were inputted and analysed using Microsoft Excel. Results Of 327 patients admitted with ACS who met the inclusion criteria 223 (68%) had a diagnosis of ST-segment elevation myocardial infarction (STEMI) and 104 (32%) non ST-segment elevation myocardial infarction (NSTEMI). Standards were met with the same consistency (89%). Diagram 1 highlights the assessment of antiplatelet prescribing in accordance with individuals GRACE and CRUSADE scores.
Diagram1. Calculated GRACE and CRUSADE scores and assessment of prescribing of antiplatelet therapy. Discussion Compliance with standard 1 was excellent from a safety perspective with 53/53 (100%) ACS patients with high/very high CRUSADE bleeding score receiving clopidogrel. Non-compliance with standard 1 was mainly due to 15/59 (25%) STEMI patients with lowest/low GRACE risk score receiving ticagrelor. Age is a limiting factor of the GRACE score, therefore for STEMI patients the determinant factor for choice of antiplatelet is the risk of bleeding. Compliance with standard 2 157/177 (89%) was very good with non-compliance possibly due to a lack of understanding of GRACE and CRUSADE scores, inexperienced staff, time constraints particularly at weekends or inadequate documentation as to why Trust guidance was not followed. Limitations of this audit include the possibility of missing patients due to the prospective nature of the audit and the Hawthorne effect. Utilising a specialist cardiac pharmacist reviewing individual’s ischaemic and bleeding risk ensures safe and effective use of more potent antiplatelet therapy which could offer the opportunity to maximise patient care. A controlled case cohort will be evaluated later in the year to assess outcomes of this pharmacist led intervention. References
1. National Institute for Health and Care Excellence (2011) Ticagrelor for the treatment of acute coronary syndromes. TA236. London: National Institute for Health and Care Excellence.
2. Fox KA, Dabbous OH, Goldberg RJ et al. Prediction of risk of death and myocardial infarction in the six months after presentation with acute coronary syndrome: prospective multinational observational study (GRACE). BMJ. 2006; 333(7578):1091.
3. Subherwal S, Bach RG, Chen AY et al. Baseline Risk of Major Bleeding in Non-ST-Segment-Elevation Myocardial Infarction: The CRUSADE (Can Rapid risk stratification of Unstable angina patients Suppress ADverse outcomes with Early implementation of the ACC/AHA guidelines) Bleeding Score. Circulation. 2009;119: 1873-1882.
High Clopidogrel Ticagrelor Clopidogrel Ticagrelor Clopidogrel Ticagrelor
2 (100%) 0 (0%) 6 (100%) 0 (0%) 25 (100%) 0 (0%)
Very HighClopidogrel Ticagrelor Clopidogrel Ticagrelor Clopidogrel Ticagrelor
1 (100%) 0 (0%) 1 (100%) 0 (0%) 18 (100%) 0 (0%)
N=1 N=1
N=42
N=6
N=2 N=6 N=25
N=18
Low/Very
low
N=16 N=31
GRACE
C
R
U
S
A
D
E
Low/Lowest Intermediate High
N=91 N=88
12. Adherence to preventative measures for Never Events: wrong route medication Dhadwal E, Aguado V, Oborne CA., Guy’s and St. Thomas’ NHS Foundation Trust, London
Introduction Never events (NE) are defined by NHS England as ‘serious, largely preventable patient safety incidents that should not occur if the available preventative measures have been implemented’. The current NE list and the proposed NE list for 2015-16 considers administration of epidural and oral/enteral medications via the intravenous route as NEs ‘wrong route medication’1. Objective The objective of this work was to measure the Trust’s adherence to both local and National Patient Safety Agency (NPSA) recommendations2-4 to prevent a) wrong route administration of oral/enteral treatment and b) wrong route administration of epidural medication. Method Two hospital sites in a large acute teaching Trust were included. Paediatric and community wards were excluded, leaving 36 clinical areas. Trust audit approval was received. Audit criteria and standards were defined (Table 1). Two data collection forms (oral/enteral syringe use, criteria one to four, and safe epidural use, criteria five and six) were designed and piloted on two wards. A questionnaire was designed which assessed visual appearance of epidural administration equipment and staff training (criteria seven to nine). The questionnaire was assessed by supervisors for face validity then piloted on three nurses. All data were collected by the investigator over two weeks (16th January to 2nd February 2015) using the following methods: A. Stock, design, labelling and proximity to medication preparation locations of oral/enteral syringes were noted. B. Up to five oral/enteral administrations of liquid medication were observed on each clinical area and the method of measurement of the liquid
dose was noted. C. Epidural infusion storage was inspected. The labelling of five epidural infusions from ward stock was examined. D. Nurses and midwives working on a recovery ward, a critical care unit, a gastrointestinal surgical unit and the obstetrician-led birth centre were
questioned. Results Almost all clinical areas stocked oral syringes (Table 1). All syringes seen were appropriately marked as ‘oral/enteral use’ by syringe manufacturers. Syringes were inconveniently stored distant from drug preparation location in some clinical areas. A total of 108 administrations of liquid medications were observed: 31 (29%) via an enteral route and 77 (71%) via the oral route. The storage and labelling of epidural infusions met recommendations (Table 1). Of 33 nurses and midwives interviewed, all reported that epidural equipment was easily distinguishable from equipment for other routes of injection. However 11 (33%) nurses reported that epidural training did not include competency based assessments. Table 1. Audit Results
Number Criteria Standard (%) Result (%) 1 Clinical areas that may need to measure and administer oral liquid medicines in a syringe hold
stock of oral/enteral syringes* 100 97 2 Only syringes labelled ‘oral/enteral’ are used to measure and administer oral liquid
medicines* 100 100 3 Nurses and midwives do not use intravenous syringes to measure and administer oral liquid
medicines* 100 99 4 Liquid medications administered via enteraI feeding tubes are administered using 60ml
enteral syringe** 100 83 5 Clinical areas store epidural infusions separately from infusions for intravenous
administration* 100 100 6 Epidural infusion bags are labelled with ‘for epidural use only’ in large font* 100 100 7 Infusion pumps are easily distinguishable from those used for other types of infusion* 100 100 8 Epidural administration sets and catheters are easily distinguishable from those used for
other routes* 100 100 9 Nursing staff involved in epidural therapy have had training where competency has been
assessed* 100 67
* = based on NPSA recommendations2, 3 **= based on local policy4 Discussion/Conclusion There was a single observation of oral liquid being drawn up in an intravenous syringe and was a result of the clinical area not stocking 10ml and 20ml oral/enteral syringes. This is a system failure that does not support nurses and midwives to avoid wrong route administration errors as described in National Reporting and Learning System reports2. The fourth criterion failed as nursing staff were reluctant to use 60ml syringes when administering small volumes as they cannot be accurately measured. Nurses working on the surgical unit were familiar with epidural training competency assessment, however those in other clinical areas did not have the same awareness of epidural training, which indicates that training for nurses and midwives involved in epidural therapy is not standardised across the Trust. Possible limitations include adjustment of practice as a result of being observed and the questions about training being interpreted differently by nurses and midwives. Recommendations for improvement were to ensure that all wards store oral/enteral syringes in medication preparation areas and maintain stocks of several sizes of the syringes. The procedure for administering small volumes of liquid medications through enteral feeding tubes must be reviewed to account for current practice. Epidural administration training should be standardised and staff should also be provided with regular updates and competency assessments. This work should be re-audited in one year to assess adherence to recommendations. References 1. NHS England. Patient Safety Domain. Draft revised Never Events policy framework for consultation. October 2014 www.engage.england.nhs.uk
(accessed 4 December 2014) 2. National Patient Safety Agency. Promoting safer measurement and administration of liquid medicines via oral and other enteral routes. Patient
Safety Alert 19. March 2007 www.nrls.npsa.nhs.uk (accessed 4 December 2014) 3. National Patient Safety Agency. Safer practice with epidural injections and infusions. Patient Safety Alert 21.March 2007 www.nrls.npsa.nhs.uk
(accessed 4 December 2014) 4. Guy’s and St. Thomas NHS Foundation Trust. Code of Practice for Administration. January 2015
13. A pilot study of hospital prescribing error feedback by pharmacist Dickson F1, Kinnear M1, Coll A1, Weidmann AE2, 1. NHS Lothian Pharmacy Service, Royal Infirmary of Edinburgh,
2. Weidmann AE2, Pharmacy Faculty, Robert Gordon University, Aberdeen
Introduction The National Patient Safety Association (NPSA) receive 150,000 annual reports of patient harm through prescribing errors(1) many of which occur in hospital(2). Prescribers are often unaware of their error(s) and it is suggested individualized feedback may reduce overall prescribing error rates. Processes to deliver this feedback in hospital practice are not yet established. The aim of this study was to agree and test a feedback process from pharmacists to hospital prescribers. Objectives Establish multidisciplinary consensus on process(es) used to deliver feedback to prescribers. Agree on tools used to prioritise errors for feedback. Test and evaluate the implementation of this process. Method The study was conducted in a medical ward of a teaching hospital from January 2014 to July 2014. A mix method approach using a focus group (qualitative) and a survey questionnaire (quantitative) evaluated the process. Study participants were purposively selected and recruited. Out of the five acute medicine physician teams only three would participate in the study. It was agreed to test two processes (figure 1). For the ‘team’ group, weekly reports were emailed to the consultant for dissemination to individual prescribers illustrating errors and their severity. For the ‘individual’ group, prescribers were informed directly by the pharmacist by email. Both study groups received feedback only on prescribing errors rated ‘red’ or ‘amber’. Figure 1 Overview of project methodology
The proposed tools for piloting the processes were agreed by the focus group. The severity error tool was developed by amalgamation of published guidance from United Kingdom Medicine Information (UKMi)/ (NPSA) and Medicines Health and Regulatory Agency (MHRA)(3,4) by the project team. It categorises error severity into risk; ‘red’ serious, ‘amber’ moderate and ‘green’ negligible. An online survey questionnaire, to establish the views of the study participants on the piloted prescribing error feedback process, was developed and validated for face and content validity by the project team. The online survey was piloted in junior doctors (n=2) and resulted in minor modifications. The survey was sent to all 19 study participants (Team group (n=4), individual group (n=11), Consultant (n=2), Pharmacist (n=2)) involved in either receiving or delivering feedback. NHS research ethics approval was not necessary. Results Error feedback: Thirty seven prescribing errors by 16 prescribers were documented over 6 weeks. Red and amber errors (n=29) were fed back to prescribers. Survey response rate was 58% (n=11) (figure 1) with opinions from pharmacists (n =2) and doctors (n=17). Doctors views: Doctors (n=4) were receptive to the email feedback method, (D1) ‘easier to reflect on an error outside the busy ward environment’. Three prescribers preferred alternative feedback methods.Consultants (n=2) perceived the email feedback method as having ‘a strong impact on patient safety (C1)’ but recognized its limitations, ‘face to face feedback has more impact but I appreciate the potential time restraints in relation to this (C1)’. Pharmacists (n=2) views: Pharmacists preferred verbal one to one feedback methods. Opinion on delivery of feedback was mixed with no definitive preference for the ‘team’ or ‘individual’ approach. Discussion/Conclusion The pharmacists preferred method of providing feedback to prescribers was one to one verbal. The study confirmed that prescribers were receptive to a range of feedback methods to learn from their prescribing errors. Where one to one verbal feedback was reported as a preferred method, resource limitation to implement this was acknowledged. Future considerations should aim to combine individual and team based feedback in a multifaceted toolkit to allow acceptability among hospital prescribers, pharmacists and specialities. Strengths of the study were the inclusion of a broad range of prescribers and the lack of potential bias from the project investigator (who was not involved in data collection). Study limitations include small numbers of participants at a single hospital site, no direct comparison of methods as prescribers were not exposed to both. References 1. National Patient Safety Agency. 'National Reporting and Learning System Quarterly Data workbook up to Dec 2013'. [homepage on the Internet]. London: NHS; 2014 [updated 2014 April29;cited2014Oct4th].Availablefrom;http://www.nrls.npsa.nhs.uk/resources/collections/quarterly-data-summaries/?entryid45=135253 2. Dornan T, Ashcroft D, Heathfield H, Lewis P, Miles J, Taylor D, et al. An in depth investigation into causes of prescribing errors by foundation trainees in relation to their medical education—EQUIP study. London: General Medical Council. 2009; 1-215. 3. National Patient Safety Agency, UK Medicines Information. 'NPSA Rapid Response Report: Reducing harm from omitted and delayed medicines in hospital. A tool to support implementation.'. [homepage on the Internet]. London: UKMi; 2014 [updated August; cited 2014 Feb]. Available from: http://www.ukmi.nhs.uk/filestore/ukmiaps/RRR09-UKMItool.pdf. 4. Medicines and Healthcare Products Regulatory Agency. ‘A Guide to Defective Medicinal Products'. [homepage on the Internet]. London: Medicines and Healthcare Products Regulatory Agency; 2014 [updated March 6th; cited 2014 Feb 2nd]. Available from: http://www.mhra.gov.uk/home/groups/is-
lic/documents/publication/con007572.pdf.
Focus Group Doctors & Pharmacists
(n=4) (n=4)
‘Team’ group (n=5) Errors fed back (n = 8)
Weekly reports emailed to the consultant by the pharmacist for dissemination to individual prescribers
illustrating errors and their severity
‘Individual’ group (n =11), Errors fed back (n=21) Prescribers were informed of their errors directly by the
14. Adherence of Pharmacists to the Lithium Standard Operating Procedure: A clinical Audit Mader Eloff, Emma Gray. Norfolk and Norwich University Hospital
Some patients taking lithium have been harmed because they have not had their dosage adjusted based on recommended regular blood tests. If patients are not informed of the known side effects or symptoms of toxicity, they cannot manage their lithium therapy safely. The National Patient Safety Agency (NPSA) received 567 incident reports (October 2003 to December 2008) relating to lithium use. Two reports were of severe harm, 34 moderate and 531 low or no harm. The most common error was ‘wrong or unclear dose or strength’ (124 incidents). The NHS Litigation Authority dealt with two fatal and 12 severe harm incidents (between 1995 - 2004) involving lithium therapy and the Medical Defence Union has been involved with 15 incidents directly related to lithium toxicity and monitoring. In December 2009 the National Patient Safety Agency published a Patient Safety Alert relating to the safer use of lithium therapy1 following 36 reports of death and severe harm related to the use of lithium therapy. An audit in 20092 found that only 42 per cent of patients on initiation of lithium therapy were documented to have been informed of risk factors for toxicity. For patients maintained on lithium therapy in the previous year, the audit found:
• one in 10 patients had no documented lithium blood level. (NICE standard: one blood level measurement every three months. Not met for 70 per cent of patients); • one in five patients had no renal function tests documented (NICE standard: assessment every six months. Not met for 46 per cent of patients); • one in six patients had no thyroid function tests documented (NICE standard: assessment every six months. Not met for 51 per cent of patients).
In response to the NPSA Safety Update the NNUH released a Medications Briefing (2011) where it stipulated that pharmacists will review prescriptions for lithium in accordance with the SOP. Aim To determine the quality of adherence to the Norfolk and Norwich University Hospital’s Standard Operating Procedure for Lithium. Objectives In patients who are admitted on lithium therapy, ascertain the:
o level of adherence to NICE guidelines on the management of bipolar4
o level of pharmacist adherence to the lithium NNUH SOP3
o level at which the recommendations of the NPSA1 are adhered to
Method The audit was registered with the trust audit department. Ethics approval was not required as it is an audit project. A data collection form (see appendix 2) was developed and piloted on 5 patients (13-17 January 2014) and adjustments were made to the form prior to commencing full data collection (3 February – 9 June 2014). Data was collected in order to assess adherence to the standards (see appendix 1). Patient confidentiality was maintained throughout the process. Trace report was generated from JAC (dispensing system) of all lithium issued to patients between 1 February 2013 and 21 November 2013. Method was by retrospective data collection using patient’s medical notes and network system (ICETM). Appropriate descriptive statistical analysis will be undertaken. Results 30 patients were included in the audit of which 100% were deemed appropriate for inclusion. Adherence to audit standards can be seen in table 1 and level of adherence to standard 2a (dose in mg, brand, form, route, frequency are endorsed if not already present) is shown in figure 1. 50% of lithium prescriptions clinically checked by pharmacist did not have the form (salt) endorsed and 20% did not have the brand endorsed. Of the 2 patients admitted for renal reasons 100% had their lithium levels checked upon admission. Only 3% of noticeboards had the full endorsement according to the SOP.
Table 1 –Adherence to Audit Standards Discussion Adherence to standard 1 was generally very good with the recommended NICE guidance monitoring being followed. I would have expected 100% adherence to all three subsections of standard 1 but not all the information was available on ICETM as the monitoring of lithium is primarily done in community or under Hellesdon Hospital. The overall level of adherence to Standard 2 (Trust SOP) is less than ideal with only 3% of drug chart noticeboards having all the required information. This may be because the remaining information (dose, brand, form, frequency and route) has already been clarified on the prescription itself, as shown by figure 1. Perhaps only the most relevant information, such as, stable renal function, recent lithium level and checked interactions are necessary to be documented on the noticeboard. Due to the audit being retrospectively carried out it was not possible to check whether the patient had a lithium card and hence it is unknown whether the Trust complies with standard 3a from the NPSA. Another limitation of the audit was the quality of the medical notes, as some drug charts where missing it limits the ability to confirm adherence. Recommendations The first step to improving the adherence to standards has been made by carrying out this audit, but it is important that the relevant people are made aware of its outcome and undertake a future audit to re-evaluate adherence. To improve prescribing of lithium and in particular clarification of the brand of lithium, it is suggested that the SOP is circulated to pharmacist with a list to sign once it has been read. To improve accountability and to facilitate communication, a sticker could be produced that includes renal function, lithium level, name, date and bleep along with a check box to say the dose, brand, form, route frequency and interactions have been verified. References 1. National Patient Safety Agency. Patient Safety Alert 005: Safer Use of Lithium Therapy. 1st December 2009. 2. Prescribing Observatory for Mental Health. Topic 7 baseline report. Monitoring of patient prescribed lithium: baseline. Prescribing Observatory for
Mental Health, CRTUO69 (data on file), 2009. 3. Pharmacy Services, Department Standard Operating Procedure: Procedure for Clinical Checking by Pharmacists of Lithium Prescriptions.
4. Bipolar disorder: The management of bipolar disorder in adults, children and adolescents, in primary and secondary care. NICE Guideline 38. July 2006
No. Percentage adherence (%)
1a. 93%
1b. 86%
1c. 100%
2a. See figure 1
2b. No data
2c. 100%
2d. 3%
3a. N/A
3b. 100% 0 20 40 60 80 100
DoseBrand
Form (salt)Route
Frequency
Percentage adherence (%)
Figure 1 - Percentage Adherence to Standard 2a
15. What is the effect on pre-registration pharmacist OSCE pass/fail scores when a specific and weighted communication skills assessment is used?
L.J McEwen-Smith, G.S Fleming, Health Education Kent Surrey Sussex, Haywards Heath
Introduction UK pharmacy practice is being driven by competency-based practice and the expanding roles of pharmacy practitioners. Competency-based learning and assessment in the form of Objective Structured Clinical Examination (OSCE) has long been advocated by pharmacy professional and regulatory bodies as a method of assessing competence against the necessary high standards of professional pharmacy practice [1]. A method of OSCE assessment, as described by Austin [2], is attracting national interest within medical and pharmacy schools in the UK. This method is used widely for high-stakes OSCE’s in Canadian pharmacy schools and for professional revalidation and comprises a specific and weighted assessment of communication and interpersonal skills. Objective The objective of this study was to examine the effect on pre-registration pharmacist OSCE pass/fail scores trialling this assessment method. Method Data were gathered on the performance of a regional cohort of 62 NHS pre-registration trainee pharmacists, sitting 7 formative OSCE stations in the latter stages of their training programme. This study involved testing within normal education requirements and was exempt from the requirement for regional ethics committee (REC) approval. Informed consent was obtained from all participants. Two assessment instruments were used concurrently for data collection. The first used borderline regression methodology, comprising a marking grid of case specific performance elements with global judgment of holistic competence. The second comprised an analytical checklist and a communication and interpersonal skills checklist, individually weighted dependant on the station context. Standard setting for the analytical checklists was carried out using Ebel’s method. Feedback and results from the borderline regression assessment were distributed to the trainees as normal, with comparison of results carried out afterwards using anonymised data. A two-sided Fishers exact test was performed to evaluate whether or not the two assessment methods gave similar or differing results. Results Statistical analysis identified three stations with significant difference in outcome; Station 1 (p <0.05), Station 3 (p=0.001) and Station 6 (p<0.05). These stations had been allocated a higher weighting of 70% against the analytical or the communication/interpersonal checklist by the Exam Board, dependant on their context i.e. medicines reconciliation, consultation. The results indicate that, where the differences are significant i.e. not due to chance alone, that a 'Pass' outcome is more likely with the borderline regression assessment method. Discussion/ Conclusion A specific and weighted assessment of communication and interpersonal skills has the potential to provide a case or content specific indication of performance that might be difficult to capture in other areas of training. However, closer scrutiny of these two distinct assessment areas by the examiners, combined with the absence of an overall global rating, appears to have resulted in a higher trainee fail rate for the questions allocated a higher weighting against either checklist. These findings have important implications if this method is to be utilised for high-stakes assessment i.e. undergraduate, rather than the formative nature of the current preregistration pharmacist OSCEs. Further work is needed around standard setting and weighting to improve reliability of this assessment and to determine whether it is valuable in the assessment of overall performance. References
1. Wright D, Loftus M, Christou M, Eggleton A. RPSGB – Healthcare professional education and training: how does pharmacy in Great Britain compare? Royal Pharmaceutical Society of Great Britain 2006
2. Austin Z, O’Byme C, Pugsley J et al. Development and Validation Processes for an Objective Structured Clinical Examination (OSCE) for Entry-to-Practice Certification in Pharmacy: The Canadian Experience. American Journal of Pharmaceutical Education 2003; 67 (3) Article 76.
16. An audit of hypersensitivity reactions following subcutaneous trastuzumab (Herceptin®) injection Foreman E*, Waters C#, *Brighton & Sussex University Hospitals NHS Trust (BSUH), #East Kent Hospitals University NHS Foundation Trust
Introduction/background/context Trastuzumab (Herceptin®) is an established treatment for HER2 positive breast cancer, both in early breast cancer where its use in the adjuvant setting has been shown to reduce the risk of disease recurrence, and in advanced disease where it can prolong life1,2. Trastuzumab is a humanised monoclonal antibody, and like other drugs of this type, carries a risk of hypersensitivity reactions including anaphylaxis. The original formulation of trastuzumab was licensed for intravenous (IV) infusion only. IV trastuzumab is given as an initial 8mg/kg loading dose infused over 90 minutes. If the loading dose is well tolerated, subsequent 3-weekly maintenance doses of 6mg/kg can be infused over 30 minutes. There is also a requirement to undertake an observation period post administration; patients should be observed for at least six hours after the start of the first infusion and for two hours after the start of subsequent infusions for symptoms like fever and chills or other infusion-related symptoms. A survey sent to all NHS England area team cancer pharmacists indicated that in practice, observation times for subsequent cycles are often reduced. In September 2013 a subcutaneous (SC) formulation, Herceptin® SC was launched. The SC preparation has several advantages: it is less invasive for patients; it can be administered in a much shorter period of time (2-5 minutes); it does not require pharmacy aseptic preparation; and it is a fixed dose, independent of patient size or weight which helps to minimise waste and reduce overall drug costs compared with equivalent use of IV trastuzumab. Unfortunately, although noting that ‘serious administration related reactions, including dyspnoea, hypotension, wheezing, bronchospasm, tachycardia, reduced oxygen saturation and respiratory distress, were not reported in the clinical trial with the Herceptin subcutaneous formulation’ the summary of product characteristics (SPC) for SC Herceptin® still states that patients should be observed for 6 hours after the first dose and 2 hours after subsequent doses3. This means that patients still have to spend over 2 hours in the chemotherapy unit, and little extra capacity is released in terms of chair time. Objectives To undertake an audit hypersensitivity reactions following subcutaneous trastuzumab injection to assess the safety of a reduced observation time and to determine what that time should be. Method The audit took place in 6 Trusts within the Kent, Surrey, Sussex and Medway area – 3 in Sussex and 3 in Kent and Medway. A data collection form was designed, which was completed by chemotherapy nurses each time a dose of SC trastuzumab was given. The patients were identified from the chemotherapy day unit diary each day. Details were collected on the treatment setting (adjuvant or metastatic), cycle number, whether the patient had previously received IV trastuzumab, and whether a reaction occurred. If a reaction occurred, the nurses recorded when the reaction occurred and the Common Toxicity Criteria (CTC) grading of the reaction4 Results A total of 142 administrations (85 patients) were audited across the 6 Trusts:
25(17.6%) for metastatic disease, 109(76.8%) in the adjuvant setting and 8(5.6%) where the treatment intent was not stated.
41(28.9%) administrations were first cycles, 32(22.5%) were second cycles, 56(39.4%) were subsequent cycles and in 13 cases (9.1%) the cycle number was not recorded.
8 reactions were reported (5.6% of cycles): o 6 grade 1 reactions (4%) o 2 grade 2 reactions (1%) o 1 answer ‘yes’ to reaction, but reaction not graded o 3 answer ‘no’ to reaction, but an injection site reaction was noted o There were no grade 3 or 4 reactions reported.
Of the 6 grade 1 reactions that were reported, 3 were injection site reactions, 1 had no explanation, and 1 was documented on the e-prescribing system as ‘administered without incident’. These reactions do not meet the criteria for a grade 1 reaction according to the CTC grading system. The ungraded reaction was noted as ‘a tingling sensation on the lips for 10mins which then settled’. One further grade 1 reaction was reported: a patient complained of feeling shivery 5 hours post injection. Paracetamol was given and the symptoms resolved. The two grade 2 reactions both involved the same patient, who had previously received 9 cycles of IV trastuzumab without incident. Cycle 1 of SC trastuzumab had been well tolerated, but on cycle 2 the patient experienced a grade 2 reaction within 5-10 minutes of the injection. A similar reaction occurred 5-10 minutes after cycle 3 and the patient stopped treatment (a return to the IV preparation had been considered but as treatment was adjuvant and 12 out of 18 cycles had been completed, the decision was made to stop). Discussion/Conclusion No grade 3 or 4 reactions during the audit period, and only 1 patient experienced a grade 2 reaction (1.2% of patients). This indicates that SC trastuzumab is a well-tolerated treatment. No new reaction occurred after cycle 2 and no significant reaction occurred after 10 minutes post-injection. This data supports a shorter observation period than that recommended in the SPC, and as such, protocols in Kent, Surrey and Sussex have been modified to allow a lesser observation period, particularly for patients who have already received 2 cycles without incident. We would recommend that chemotherapy nurses continue to report any hypersensitivity reactions so that the policy can be reviewed if necessary. References
1. NICE Clinical Guidelines CG80 Breast cancer (early & locally advanced) Issued: February 2009 Available at http://www.nice.org.uk/cg80(accessed 9 February 2015)
2. NICE Clinical Guidelines CG81 Breast cancer (advanced) Issued: February 2009 Available at http://www.nice.org.uk/cg81(accessed 9 February 2015)
3. Trastuzumab (Herceptin®) Summary of Product Characteristics Available at http://www.medicines.org.uk/emc/medicine/3567(accessed 9 February 2015)
4. Common Terminology Criteria for Adverse Events (CTCAE) version 4.03 14 June 2010. Available at http://evs.nci.nih.gov/ftp1/CTCAE/CTCAE_4.03_2010-06-14_QuickReference_5x7.pdf (accessed 27 February 2015)
17. A retrospective audit of the prescribing of oral iron against recommended standards in a small acute hospital over a 4 month period. Mc Garry, N, Galway, M., Mater Infirmorum Hospital, Belfast Health & Social Care Trust.
Introduction The British Society of Gastroenterology (BSG) has published guidelines for the management of iron deficient anaemia (IDA)1. The Belfast Health & Social Care Trust (BHSCT) guidelines for the management of anaemia are based on these and the NICE (National Institute for Health and Care Excellence) Clinical Knowledge Summary guidelines2,3. Anaemia is defined by the World Health Organisation4 as:
Haemoglobin below 13g/dl in men over 15 years.
Haemoglobin below 12g/dl in non-pregnant women over 15 years.
Haemoglobin below 11g/dl in pregnant women.
According to the BHSCT guidelines, diagnosis of anaemia due to iron deficiency (IDA) is confirmed with a red blood cell Mean Corpuscular Volume (MCV) less than 76fl, a Mean Haemoglobin Concentration (MCH) less than 27pg, Haemoglobin less than 130g/L in male patients and less than 120g/L in non-pregnant female patients and an iron profile study consistent with iron deficiency anaemia. We have a perception that oral iron therapy is being prescribed for patients who have a low haemoglobin but may not be iron deficient. This has been further substantiated by feedback on potentially inappropriate requests for intravenous iron from primary care and secondary care in BHSCT for patients who do not have IDA. We want to reduce the risk of patients being started on oral iron inappropriately. In order to assert whether our perceptions are valid and then take action to improve on this, we first of all need to do a baseline audit to capture our current performance against BHSCT guidelines2. Aim To undertake an audit to establish our current level of performance in prescribing oral iron for patients who have IDA according to best practise guidelines1. The results will be used to review and reflect on our current practise in prescribing oral iron. We will make a realistic, agreed positive intervention after discussion with our medical lead and then re-audit this next year. Objective To assess whether all patients between November 2014 and February 2015 newly started on oral iron have IDA in accordance with the BHSCT policy2. To feedback our findings to medical and pharmacy staff and decide on a positive intervention that will improve our performance and plan a re-audit. To use this as a foundation for a further audit on establishing how effective oral iron therapy was in restoring iron stores and haemoglobin within 3 months. Method We registered our audit with the audit department. We did not require ethics approval as this is an audit. We reviewed all discharge prescriptions over a 4 month period to select all patients who had been newly started on oral iron. We confirmed that the oral iron had been newly started whilst in hospital by investigating each patient’s medication history using GP Electronic Care Records (ECR). We established our exclusion criteria – pregnancy and chronic renal disease. We piloted our audit form on our first 2 patients then tailored it further to suit our required data. We collected data on each patient and collected data on Haemoglobin, MCV, MCH, iron profile measures and other parameters such as patient identifiers, age, C-Reactive Protein, liver function (if known) and renal function. We evaluated whether each patient had IDA by comparing their laboratory results against the criteria in the BHSCT policy2. Results Our results (see Table 1) have shown so far that 5 out of 18 patients did not have IDA consistent with the BHSCT policy2. Two of these patients had a degree of renal impairment. One of these patients had a very complex medical background which makes it difficult to compare to the BHSCT guidelines. Table 1: Initial audit results
Month Discharge Prescriptions Number of patients started on oral iron.
Number of patients who met the IDA criteria as per BHSCT policy.
January 2015 465 5 5
February 2015 430 13 8
Total number of new oral iron cases: 18
Total number with a IDA diagnosis as per policy: 13
Total number (%) who did not fulfil the policy criteria for IDA.
5 (28%)
Discussion Our audit results demonstrate that we are adhering to the BHSCT policy2 in starting oral iron therapy in patients who have IDA according to best practice guidelines in 72% cases. However, this is not 100% compliance and we have potentially started oral iron therapy in patients who do not have IDA in 5 (28%) patients. Our next step is to present these results to our medical and pharmacy staff across BHSCT and consider our next step in improving practise. It may be necessary to have more guidance and explanation for the management of IDA, to look at how it is presented in the laboratory results and to consider our results in the next BHSCT policy review. It is recognised that there are limitations of the guidelines and they may not be applicable in very complex cases, in renal impairment or in borderline cases. The limitations in the data collection are the retrospective design and that we are not able to witness the discussion held when iron was prescribed. It is possible that some patients were already taking iron before admission and it was not on their ECR but our experience to date would not be consistent with having drugs omitted from the ECR. Prescriptions are free of charge in Northern Ireland and most patients were of retirement age in this audit so it is unlikely that they were purchasing iron tablets. We will address these limitations again when we conduct our re-audit. References
1. Goddard et al. (British Society of Gastroenterology) Guidelines for the management of iron deficient anaemia. Gut 2011; 60: 1309-1316. (Also from the BSG website.)
2. BHSCT Guideline- Detection, investigation and Management of Anaemia in Adult Patients. Ref no: SG 23/12. December 2013 3. NHS Clinical Knowledge Summaries. 2011; Anaemia- iron deficiency anaemia. www.cks.nice.org.uk/anaemia-iron-deficiency. 4. World Health Organisation. Worldwide prevalence of Anaemia 1993-2005. WHO 2008.
18. Winter pressures add a clinical pharmacist to the emergency department (ED) Gotel U1, Henderson K2, Hill J2, 1Pharmacy Department, 2Emergency Department Guy’s and St Thomas’ NHS Foundation Trust
Introduction UK urgent and emergency care (UEC) services are facing significant increased patient demand. The final two weeks of 2014 vs. 2013 saw 849,000 ED attendances, ~70,000 increase and 4-hour target performance fell for all attendances to 89.6% vs. 95.9%1. In November £700 million additional funding was announced to support winter pressures2. Increased demand is occurring alongside shortages of staff trained in UEC. Trust ED service pressures reflect the UK picture and agency staff are a significant unplanned cost. Pharmacy services are developing to support ED provision with similar roles to in-patient clinical pharmacists3 but clinical pharmacist’s skills are underutilised in UEC. Pilot work has outlined benefits pharmacists bring to UEC patients, this work is being rolled out as a national pilot4. Locally there was potential to optimise ED skill mix, support medicines management and add value for money as no operational clinical pharmacy service existed direct to the ED. Such a service would ensure medicines reconciliation (MR), drug chart transcription in ED, increase use of patients own drugs (PODs), provide review for medication changes and direct support for transfer of changed medication and medicines information on discharge from the ED. Medicines advice could be provided directly to patients/carers freeing nursing time and reducing reattendance due to non-adherence. Pharmacy bid and secured funding for one WTE clinical pharmacist on the ED shop floor. The clinical pharmacy service will run from 29.09.14 - 31.03.15. It is staffed by AfC B7 and B6 (3 years qualified) pharmacists rostered 1-9.30pm Fri/Sat/Sun, 12-6pm Monday plus 6-9.30pm Mon-Fri. This review aims to demonstrate the impact of a clinical pharmacist in the ED. Objectives: 1) Quantify operational workload undertaken in the ED by the clinical pharmacist 2) Identify drugs ED staff request support/information for and main reason for request 3) Measure ED clinical pharmacy service impact on medical post-take ward round (PTWR) Methods Activity and specific drug data were collected for every shift. A standard operational data collection proforma was piloted and amended for use. Pharmacists tasks were identified as drug history (DH) fully completed, MR fully completed, identification of patients with own drugs (PODs), patients/relatives asked to bring PODs, patients counselled, drug charts transcribed, items supplied from dispensary, out-patient prescriptions screened, allergy status confirmed, staff information/resource provision, antibiotic prescription clarification, referral to doctor or healthcare professional, contact with GP or Community pharmacist. PTWR data collected using standard data collection forms for 29/09 – 09/02 in 13/14 and 14/15: DH completion by PTWR pharmacist or admission team (AT), including ED pharmacist, and no. of pharmacist contributions. Results A total of 149 shifts (802hrs) were completed to 9.02.15. Ten patients were seen on average per shift, each having five pharmacist tasks completed in 32minutes (see table 1). Staff requested support/information for 388 individual drugs. The most common reason was safety to prevent an ADR 60% (233/388) followed by efficacy 32% (123/388), length of stay 10% (39/388), compliance/concordance 16% (62/388). Six percent (24/388) were for safety in relation to an ADR. Most requests where for medicines acting on the CNS 26% (101/388), CVS 23% (88/388) or to treat infection 21% (81/388). Completed MR on PTWR 13-14 / 14-15: PTWR pharmacists 7.1 vs. 5.7, AT 2.1 vs. 4.7. Pharmacist contributions on PTWR 13-14 / 14-15, 25.4 vs. 24.9. Table 1: Tasks completed by pharmacist
Patients seen by pharmacist 1492
Drug History fully completed 75% (1124/1492)
Medicine reconciliation fully completed 49% (733/1492)
Allergy status confirmed 50% (749/1492)
Drug chart transcribed by a pharmacist 43% (641/1492)
No. of patients who brought POD 33% (496/1492)
PODs checked and suitable for use 1623 (4.9/pt checked, 3.3/pt suitable)
No. of patients where pharmacists requests POD to come in 19% (284/1492)
Patients who had their medicines in a compliance aid 15% (221/1492)
Out patient Rx screened 27
Staff information/resource provision 233
Referral to Dr / HCP 103 / 33
Contact with GP / Community Pharmacist 72 / 64
Specific medicine queries 388
Time taken per patient (mins) 32
Discussion This is the first UK review describing a clinical pharmacy service on the ED shop-floor. The main aims were to enhance patient safety and free-up clinician time. Key pharmacist safety inputs were 1) allergy confirmation, providing a medicines safety barrier supporting safer prescribing in a high risk environment 2) reduction in missed or delayed doses through early DH identification and supply of non-stock medicines 3) avoidance of ADRs and 4) provision of specific, timely drug advice. The ED pharmacist also ensured medicines quality and safety through review of individual treatment and confirmation of antibiotic indications/durations, supporting CQUIN target achievement. Admitting teams and ED clinician time was released from DH, MR and transcribing, supporting skill mix, improving workflow and allowing clinicians to focus on patient’s history and examination. Pharmacists PTWR input was also altered. Current processes require pharmacist confirmation of DH and MR whilst on the round. With 2.6 more MRs/round complete prior to the PTWR, pharmacists could clinically review patient care with full information. Interestingly, PTWR contributions only fell by 2% (0.5/pt) demonstrating alternative contributions are made when MR is already completed. An additional value cost saving is use of PODs. Patients presenting in an emergency context are unlikely to have medicines with them but the ED pharmacist asked relatives/carers to bring these on return. A further 929 usable PODs were anticipated as a result. PODs also enhance quality DH, MR and facilitate discharge. Direct pharmacist provision of medicines information supported discharge through GP and community pharmacist liaison, highlighting the need for referrals into new medicines schemes. New clinical pharmacy services must be efficient and add value. Further work will evaluate patient and service savings, staff costs, impact on length of stay and medication errors. Ethical approval was not sought. References 1. A&E attendances and emergency admissions (accessed 30.3.15) http://www.england.nhs.uk/statistics/statistical-work-areas/ae-waiting-times-and-
activity/ 2. Government response NHS Accident and Emergency figures (accessed 30.3.15) https://www.gov.uk/government/news/nhs-accident-and-emergency-
figures 3. Collignon U, Oborne CA, Kostrzewski A. Pharmacy Services to UK Emergency Departments: a descriptive study Pharm World Sci 2010;32:90-96.
4. Health Education England. National ED Pharmacy Pilot Project. Expressions of interest Letter Jan 2015
19. Implementation of a Clinical Pharmacy Service and Near-Patient Dispensing to a Chemotherapy Day Ward Purcell, S., Allen, R., Hale, K. Pharmacy Department, Wirral University Teaching Hospital NHS Foundation Trust, Wirral
Background Chemotherapy is a high-risk area for prescribing & administration of medicines, requiring specialist pharmacy input to ensure patient safety and compliance with national guidance. Chemotherapy drugs are often high-cost and optimising their use offers opportunity for cost improvement. The haematology day ward at Wirral University Teaching Hospital NHS Foundation Trust (WUTH) treats approximately 40-50 patients per week with intravenous/oral chemotherapy and drug spend for this area has increased by approximately 15% year on year since 2008. This increase is due to the increase in chemotherapy delivery, the increased complexity of chemotherapy prescribed, as well as an increase in the number of drugs and regimens available for the treatment of cancer. The National Chemotherapy Advisory Group (NCAG) report1, NHS Cancer Plan2, the Manual of Cancer Quality Measures3, National Confidential Enquiry into Patient Outcome and Death (NCEPOD) report4, and National Patient Safety Agency (NPSA) oral chemotherapy alert5 require competent and suitably trained pharmacists to clinically verify all chemotherapy prescriptions. There is also a requirement that all patients receive suitable education and counselling prior to initiating oral chemotherapy. This has resulted in the need to increase the pharmacy input into haematology services. Approximately 18 months ago the clinical verification of chemotherapy prescriptions transferred from taking place in the dispensary or aseptic unit to being undertaken alongside the prescribers in the clinic. Objectives To reduce waiting times for patients prescribed oral chemotherapy or take-home medicines. To offer a dedicated pharmacy consultation to patients who are prescribed chemotherapy. To reduce waste of high cost chemotherapy and supportive medications. To reduce dispensing errors by allowing only trained staff to dispense chemotherapy Method A 6-week pilot of near-patient dispensing was conducted in September to October 2013. A 0.5 whole-time equivalent (WTE) band 5 medicines management technician was seconded into the haematology team to facilitate this. A portable medicine dispensing trolley was loaned from Medstrom. Throughout the trial data on dispensing turnaround times were recorded using the pharmacy prescription tracking system. All patients were offered additional consultation on their medication from a member of the haematology pharmacy team, including a review of their existing medicines, counselling on new medicines and checking adherence. A pre-piloted questionnaire was distributed to all patients and staff following the trial. Ethics approval was not required for this service development project. Results See Table 1. Waiting times were reduced from 39 mins to 13 mins. All patients were offered a consultation from a member of the haematology pharmacy team. Medicines wastage was avoided since patients were able to inform pharmacy staff which medicines they had enough supply of already (savings approx. £1k/year). Patient and staff satisfaction with the trial was high, as displayed in the written and verbal comments received from patients (see below) in the evaluation questionnaire (responses 11/30). A chemotherapy training pack was developed and implemented. No dispensing errors occurred during the trial. Table 1. Comparison of dispensing times for outpatient oral chemotherapy prescriptions
Near Patient Dispensing (6-week trial) Main Pharmacy Dispensary (6-weeks preceding trial)
Number of prescriptions 104 75 Average time to process prescription (mins) 13 39 Total time (mins) 1354 2908 Range (mins) 1 to 68 12 to 166
Positive comments received from patients included:
“Good. Better service now that drugs are offered from day ward. Less waiting time”
“The new service of prescription delivery to the day ward is marvellous”
“Good to be able to discuss medication with pharmacy staff. Carry on.” Discussion In line with the national QUIPP agenda the introduction of a clinical pharmacy service and near-patient dispensing to the haematology day ward at WUTH both improved the service offered to patients and demonstrated cost and time efficiencies. By introducing a dedicated technician into the haematology team effective skill-mix was achieved and increased familiarity and knowledge with complex regimes will hopefully lead to a safer service. An evaluation of the trial showed that it improved patients’ quality of care, improved productivity, and prevented medicines wastage. In addition, by removing complex chemotherapy prescriptions from the main pharmacy dispensary the pilot has supported a reduced turnaround time for ‘to-take home’ (TTH’s) and other medicines for the rest of the hospital. The trial has shown how efficiencies can be delivered through an innovative approach to improving patient care and a business case is now being developed to continue the service. Limitations to the trial and subsequent evaluation include an approximate response rate of 30% (n=11) for the patient questionnaire. References 1. Chemotherapy services in England: ensuring quality and safety. A report from the National Chemotherapy Advisory Group (NCAG) August
2009. (www.nelm.nhs.uk)
2. The NHS cancer plan and the new NHS – providing a patient-centred service, DOH 2004 (www.dh.gov.uk under cancer section)
3. The Manual of Cancer Quality Measures, Department of Health, 2004. (www.dh.gov.uk under cancer section)
4. National Confidential Enquiry into Patient Outcomes and Death (NCEPOD) Report, November 2008. (www.ncepod.org.uk)
5. NPSA-RRR 2008/001 Risks of incorrect dosing of oral anti-cancer medicines, January 2008. (www.npsa.nhs.uk)
20. An Audit of missed doses of medications at Newham Centre for Mental Health (NCfMH) Halliday,E , East London NHS Foundation Trust, London
Introduction When medications are prescribed for patients, it is expected that they should be administered to enable the recovery process and subsequently reduce the length of stay in hospital. However, it has been recently observed that there have been increased reports of incidents where there are unsigned boxes or Code 4 endorsed on the administration chart for prescribed medications. In East London NHS foundation trust (ELFT), Code 4 means that the medication was not available at the time. Missed medication doses has been highlighted as national priority for the NHS after a review of medication incidents in 20101 revealed that omitted and delayed medicines was the second largest cause of medication incidents. The report found that for some kinds of medicines such as antibiotics, anticoagulants and insulin, an omitted or delayed dose can have serious or even fatal consequences1. Hence, the current system, where there are omissions of medicines doses with inadequate justification, needs to be revised. Aim To check the percentage of omitted doses on all the medication charts at Newham Centre for Mental Health (NCfMH) end to establish possible causes of these omission(s). Objective To audit against the following standards and to make recommendations on how to minimise missed doses at NCfMH and revise the culture of endorsing Code 4 or omission of doses without justification. Standards 1. Omitted doses should account for less than 4% of the total number of doses administered. 2. There should be zero omitted doses of critical medicines (antibiotics, anticoagulants, clozapine, antidiabetics, lithium, L-dopa preparations,
methylphenidate, opioid analgesics, paroxetine, venlafaxine and resuscitation medicines). 3. 100% of medicine charts have no Code 4 endorsed. 4. For 100% of cases where Code 4 is used, the DSN is contacted and an entry is made on Rio with reasons for the Code 4 endorsement.
Method A spreadsheet was devised in Microsoft Excel 2010 to record the total number of doses for each patient and the total number of missed doses with a further form to record details of any omitted doses. This audit tool was piloted on Ward 1 on 02/12/2014 by the auditor after which no changes were made to it. Data was then collected and recorded from 03/12/2014 using patients’ medication charts, patients’ progress notes and interviews of staff members administering medication. There were no exclusions made for blank boxes or endorsing Code 4 on administration charts. An ethics approval was not required as this was an audit project. Results In total there were 45 (0.50%) missed doses recorded at NCfMH, of which 34 (0.38%) were blank boxes and 11 (0.12%) were Code 4s on the chart. Every ward passed Standard 1 as missed doses did not count for more than 4% of all the doses administered.
Ward Total Missed Doses Total Number of Missed Critical Medicines Unsigned Boxed Number 4s
Wards 1,2,4,6 and 7 failed on Standard 2, as they missed at least one dose of a critical medicine. In total, 11 code 4s were endorsed on wards 1,2 and 7. Therefore, these wards failed to meet Standard 3. No ward passed Standard 4 as no ward contacted the DSN and recorded this on Rio 100% of the time, although Ward 2 did contact the DSN on 100% of occasions and Ward 7 recorded a reason for missing a dose on one occasion. Ward 1 did not contact the DSN or record on Rio for any of their Code 4 endorsements. Discussion There may be a number of reasons many of the wards missed medications. Firstly, it was found that boxes were left unsigned when a patient was transferred between wards during medication rounds. The breakdown in communication during transfer could be a cause of further omitted doses and therefore needs to be addressed. I speculate that this may be due to inadequate use of the ward handover checklist, which aims to reduce communication errors such as this. On Wards 1,2,4 and 6 failure of Standard 2 was due to the omission of an oral antidiabetic medication, which made up a total of 13% of all medication omissions. This could be because oral antidiabetics are written on a separate diabetes chart, which may not always be checked during medication rounds or that antidiabetic doses are given at different times to other doses, which may make them more difficult to administer. There was a moderate correlation between the wards with a large number of doses per day and a large number of omitted doses. I believe this is due to an increased workload increasing the number of mistakes made, and hence the number of medication omissions. Despite this, Ward 5 had the lowest number of missed doses, despite having the second largest number of doses per day. This is due to increased datix reporting regarding medication errors on Ward 5 which has helped to increase awareness of the importance of missed doses. Despite this finding on Ward 5, the data trend suggests that if we want to reduce the number of medication omissions then we need to reconsider the amount of doses that a patient is taking per day. Not only can medicines rationalisation help to reduce the number of medication omissions but it can also help to reduce side effects and interactions between medications and improve patients’ quality of life as a result. References
1. Rapid Response Report NPSA/2010/RRR009: Reducing harm from omitted and delayed medicine in hospital, February 2010 http://www.nrls.npsa.nhs.uk/EasySiteWed/getresourse.axd?.AssetID=66780& accessed 25/11/14
Table 1: The number of missed doses of all medicines and critical medicines
21. Community Pharmacist: Making an impact on stroke prevention Hamedi N1,2, Levitan M3, Begley A2, Antoniou S1,2, 1Barts Health NHS Trust, 2UCLPartners, 3Middlesex Group of Local Pharmaceutical Committees
Introduction Stroke prevention in patients with Atrial Fibrillation (AF) is a national priority and has been revolutionised with evidence demonstrating the value of oral anticoagulation over aspirin. Most recently, the National Institute of Health and Care Excellence (NICE) guidelines have recommended the use of warfarin or Non-vitamin K antagonist Oral Anticoagulants (NOACs) as equal first line therapy with the choice based on patients’ clinical features and preferences1. Unlike warfarin, patients prescribed NOACs do not have a designated anticoagulation clinic and thus may not have the same support and interaction with healthcare professionals. Community pharmacists have the opportunity to support adherence in patients initiated on NOACs through their New Medicine Service (NMS). However, to date the learning requirements of community pharmacists to provide a NMS to patients initiated on oral anticoagulant has not been formally assessed2,3. Aim and objectives Determine the baseline training, support and resources used by community pharmacist to deliver a NMS consultation on oral anticoagulants for stroke prevention in patients with AF. Method An online survey questionnaire was designed and modified in response to the pilot feedback then sent by e-mail to community pharmacists in London through their Local Pharmaceutical Committees and the Royal Pharmaceutical Society local practice forum. The survey questionnaire was live and accessible by London community pharmacists for a period of 2 months (4th December 2014 to 31st January 2015). Statistical analysis of the results was also performed using Wilcoxon paired test and p<0.05 was considered significant for analysis. Ethical approval was not required. Results 269 community pharmacists responded over a two month period and 4% (12/269) were excluded due to non-completion of the questionnaire. The post qualification experience of those included in the analysis was an average of 21 years (range 1 to 50 years) with 31% (79/257) having completed a further qualification ranging from a postgraduate certificate to PhD. 39%(99/257) were also proprietor pharmacists. In a three month period, 87%(224/257) of community pharmacists completed one or more NMS consultations, with proprietor pharmacists undertaken fewer consultations (p=0.043). 68%(174/257) of pharmacist completed a NMS for oral anticoagulation and those with extra qualification were shown statistically to undertake more consultations (p=0.012). The NMS consultations for NOACs was completed by 35%(91/257) of community pharmacists. The confidence of community pharmacists in dealing with NOACs is highlighted in figure 1 and 51%(131/257) confirmed they utilised a resource for reference when undertaking a NMS consultation, of which 72% (94/131) used the British National Formulary.
Figure 1. Community Pharmacist confidence and experience with NOACs Discussion This evaluation is the first of its kind to determine the current level of knowledge and experience community pharmacists have in delivering NMS for oral anticoagulation for stroke prevention in patients with AF. Our data confirms community pharmacists are undertaking NMS consultation on oral anticoagulants including NOACs. Furthermore it is clear, there is an opportunity to support pharmacists with knowledge and skills to improve their confidence in providing effective consultation to patients prescribed NOACs. A competency based training programme that encompasses clinical and patient engagement skills for NMS consultation on oral anticoagulants with appropriate resources and on-going support may improve pharmacist confidence and service delivery. A limitation of the study is the small sample size(n=257) that could potentially limit the generalizability of the study. It was not feasible to statistically compare the NMS consultation results to national data. Following the delivery of the training programme:
Repeat the survey with a larger sample size to establish effectiveness
Qualitatively analyse the impact of NMS consultation on adherence, patients’ quality of life and the National Health Service economy and
Feedback from community pharmacist and patients on their experience is also essential. References
1. National Institute for Health and Care Excellence. Atrial fibrillation: Management of atrial fibrillation. June 2014 [online]. Available from www.nice.org.uk/guidance/cg180 (accessed 14 January 2015).
2. Fowels. A. Darzi Fellowship accepts pharmacy-led project to improve care of AF patients. The Pharmaceutical Journal 2014; 292 (7811/7812): 531-533.
3. Elliott R, Boyd M, Waring J et al. Understanding and appraising the new medicines service in the NHS in England. Available from: http://www.nottingham.ac.uk/~pazmjb/nms/downloads/report/files/assets/basic-html/index.html#1 (accessed 14 January 2015).
21
25
19
33
15
22
114
127
113
130
65
72
69
64
78
42
68
59
27
14
21
26
72
67
3
4
3
3
14
14
23
23
23
23
23
23
0% 10% 20% 30% 40% 50% 60% 70% 80% 90% 100%
I feel confident my knowledge is suitable to undertake an NMS forNOACs
I am confident in counselling the benefits of NOACs to patients
I am confident in addressing patients concerns about NOACs
I have access to resources that contain information on counsellingpatients on NOACs
I use a counselling checklist to counsel patients on NOACs
I routinely check whether patients hold a patient alert card for theNOACs
Strongly agree Agree Uncertain Disagree Strongly disagree No response
22. Development and Implementation of an All Wales Medication Safety Indicators Reporting System 1Harries J, 1Townsend M, 2Williams R, 1Cwm Taf University Health Board (CTUHB), Llantrisant,
2Abertawe Bro Morgannwg University Health Board (ABMUHB), Swansea
Introduction An all Wales, multi-professional approach to monitoring a number of medication safety indicators was developed and implemented. The “Trusted to Care”1 report highlighted that medication safety issues, particularly omitted doses, were key areas for improvement for hospitals in Wales. The Welsh Government’s Quality Delivery Plan identifies the need to develop quality and safety indicators in the Welsh NHS. This project builds on work undertaken in Wales in response to guidance from the National Institute for Health and Clinical Excellence (NICE) 2, the National Patient Safety Agency (NPSA) 3 and the Francis Inquiry4. Previous initiatives have included the revision of the All Wales In-patient Medication Administration Record (the “drug chart”) to include Venous Thromboembolism (VTE) risk assessment and Medicines Reconciliation sections. A nursing care metrics dashboard, Fundamentals of Care (FoC), was already established across Wales and being developed further as a multi-professional care indicator system. An ideal opportunity existed to blend two systems to produce an integrated professions approach to medication safety. Until now there has been no coordinated, standard approach to measuring missed and delayed doses of medicines in Welsh hospitals. This quality improvement project rationalized the variety of audits and measures already in place across Wales. It filled gaps, produced consistency and enabled benchmarking. Objectives The objectives of this project were: 1. To agree and develop All Wales Medication Safety Indicators 2. To develop and implement a standard method of data collection 3. To utilise technology to input data directly into the All Wales Fundamentals of Care System 4. To promote collaborative working and ownership of medication safety Method In December 2013, the All Wales Quality and Patient Safety (AWQPS) sub-group of the Welsh Chief Pharmacists Committee agreed a set of Medication Safety Indicators. The key principles and medication safety measures of the Medication Safety Thermometer5, developed in NHS England, were used. Four indicators were agreed: Allergy status, VTE risk assessment, Medicines Reconciliation and Omitted Doses. All these indicators could easily be collected by reviewing the relevant sections of the inpatient drug chart. A commercial software product, TeleForm® desktop, was purchased for the seven Welsh Health Boards. This was resourced by a Welsh Government modernisation fund. A standard data collection form was designed in the Teleform system. The Welsh national FoC steering group approved the inclusion of the Medication Safety Indicators into the system. An importing tool was developed to automatically populate the FoC system. Collated data sets were generated from monthly audits of inpatient drug charts. The “model for improvement” methodology was adopted for this project; no ethics approval was required. It was agreed that a sample of ten inpatient charts per ward per month would be audited to achieve a balance between the practicalities of collecting information and having sufficient data to demonstrate changing trends over time. The forms and data collection methods were tested and refined using “Plan, Do, Study, Act (PDSA) cycles in two health boards (CTUHB and ABMUHB) from February to June 2014. A standard operating procedure was developed to accompany the data collection forms. The audit was spread to all Welsh Health Boards by February 2015. In contrast to the English model data was collected once a month by medicines management technicians and pharmacists as part of their routine work. Prior to starting the project approval was obtained from the All Wales Heads of Nursing Committee. This was the first time audit data would be collected and input into the FoC system by non-nursing healthcare professionals. Ward managers are required to sign off the data for their wards. Through the PDSA cycles, the procedure evolved to include immediate feedback by the pharmacy teams to ward managers at the time of data collection to ensure ownership and allow any clarification of the data prior to submission. Results All Wales Medication Safety Indicators, standard data collection form and method of data collection were agreed by AWQPS group. The number of patients included in the audit per month ranged from 1526 in June 2014 to 1704 in January 2015. A standard suite of reports was developed in the FoC system. These can provide ward, directorate, health board and national level reports. Discussion This quality improvement initiative has delivered an integrated approach to medication safety. It uses technology to improve the efficiency of data collection and reporting. The involvement of pharmacy teams in measuring and recording care indicators has been received positively, promoting shared ownership of medicines safety. It has changed the focus of nursing staff from data collection to using information for improvement. Utilization of the TeleForm® software and development of the FoC importing process has paved the way for efficiencies in the way other care metrics are measured and reported in Wales. A baseline for the indicators has been established. Trends will be monitored and the impact of national or local interventions on medication safety will be assessed. For example a pilot has demonstrated improved patient outcomes (increased compliance with VTE risk assessment and reduction in number of hospital associated thromboses) through implementation of a combined VTE risk assessment and prescription on the drug chart. Future developments could include the use of triggers of possible error or harm from high risk medicines. References
1. Andrews J, Butler M, Trusted to Care An independent Review of the Princess of Wales Hospital and Neath Port Talbot Hospital at Abertawe Bro Morgannwg University Health Board, Welsh Government, May 2014
2. NICE patient safety guidance PSG 001, 2007: Medicines reconciliation on admission of adults to hospitals https://www.nice.org.uk/guidance/psg001/resources (accessed 23/2/15)
3. National Patient Safety Agency Rapid Response Report NPSA/2010/RRR09, February 2010: Reducing harm from omitted and delayed medicines in hospitals
4. Francis R, Report of the Mid Staffordshire NHS Foundation Trust Public Inquiry February 2013, ISBN: 9780 102981476, http://www.midstaffspublicinquiry.com (accessed 23/2/15)
5. NHS England Medication Safety Thermometer: http://www.safetythermometer.nhs.uk (accessed 23/2/15)
23. Transfer of care study: A study investigating the effect of sending the details of patients' discharge medications to their community pharmacist on discharge from hospital
Hockly MK; University of Brighton and Brighton and Sussex University Hospitals NHS Trust; Brighton. Marcus Allen; University of Brighton.
Introduction Transferring patients between care providers is a high risk area for medicines management. During hospital admission 60% of patients will have three or more medication changes made.[1] These changes then need to be updated in the patient’s medication records at their General Practitioner (GP) surgery after discharge, but errors often occur at this stage. The PRACtICE study (2012) found that 43% of patients had discrepancies between the medications prescribed on their discharge letter and those subsequently prescribed in practice.[2] Poor communication to the patient regarding medication changes also occurs. A large American study found patients had no understanding of 69.3 % of re-dosed medications, 81.6 % of stopped medications, and 62.0 % of new medications prescribed on hospital discharge.[3] This poor communication and the post-discharge prescribing discrepancies lead to adverse effects for the patient. It is estimated that 57% of patients have medication problems within 2 weeks of discharge.[4] A study looking at the effect of sending discharge letters to patients’ Community Pharmacists found that the number of unintentional post-discharge prescription discrepancies in the intervention group (where the Community Pharmacist received their discharge letter) was 32% compared to 57% in the comparator group.[5] The number of medication related adverse events in the intervention group was also lower, 1.6% compared to 3.1%. Sending a copy of patients’ discharge letters to their community pharmacist is a cost effective way of reducing post discharge prescribing discrepancies.
Objective
This study aims to investigate the effect of sending a copy of the hospital discharge letter to a patient’s nominated community pharmacy on the number of medication discrepancies between the patient’s GP records and the discharge letter, and between the patient’s recollection of their medication regime and the discharge letter. Method In a randomised, double-blinded trial, 33 participants in two groups, control and intervention, had their discharge letter sent to either their GP only or their GP and nominated community pharmacy after hospital discharge. At least three weeks after each participant had been discharged from hospital a copy of the participant’s GP surgery current medication record was obtained. The participant’s self described medication regime was also obtained via a telephone interview. Discrepancies between the GP patient medication record and the hospital discharge letter, and between the participant’s recollection of their medication regime and the discharge letter were counted. The number of medication discrepancies (relative to the number of drugs prescribed) in the intervention group, was compared with the control group for each of the above two categories, using the CHI squared test to determine the statistical significance of any differences between the two groups. Ethical approval was obtained from the local National Research and Ethics Committee and the Trust Research and Development department prior to commencement. Results GP medication records were collected for all the 33 participants, telephone interviews were conducted on 26 participants to obtain the participant’s recollection of their medication regime. The intervention group had statistically fewer medication discrepancies than the control group for both data sets: GP records compared with the hospital letters (GP data set): p=0.00034 (p<0.05); participants’ recollections of their medication regimes compared with the hospital letters (Pt data set): p=0.000043 (p<0.05) [Table 1].
Intervention Group: Number of discrepancies
Intervention Group: Percentage of discrepancies
Control Group: Number of discrepancies
Control Group: Percentage of discrepancies
P Value*
GP data set 25 14% 50 26% 0.00034
Pt data set 10 8% 31 23% 0.000043
Table 1: The number and percentage of medication discrepancies in the control and intervention groups for both data sets, GP and Pt, and a comparison of the difference in discrepancies between the two groups. *The CHI squared test was used to test for a statistical difference between the two groups for each data set. A one-tailed test was used and tested to the significance of α=0.05. Discussion Sending a copy of each patient’s discharge letter to their nominated community pharmacy could be beneficial in reducing post-discharge prescribing discrepancies and improving patient understanding of the changes made to their medicines. This study did not have the resources to investigate and analyse the community pharmacists’ interventions using the hospital discharge letter and so it is unclear what interventions may have been carried by the community pharmacists to help bring about the measured reductions in discrepancies. Because of the small sample size in this study and the lack of detailed information and understanding of the intervention mechanism, further research in this area is needed. In any further work, larger sample sizes should be used and analysis of the mechanisms behind the intervention that result in a reduction of medication discrepancies should be carried out. Sending hospital discharge letters to patients’ community pharmacists is a relatively low cost and simple intervention to implement and the incidence of medication discrepancies in the control group was relatively high for both measures (26% GP data set and 23% Pt data set), and so the scope for benefit of this intervention is significant and therefore warrants further research. References 1. Himmel W, Kochen MM, Sorns U et al. Drug changes at the interface between primary and secondary care. International Journal Clinical
Pharmacology and Therapeutics 2004; 42:103-9 2. Avery T, Barber N, Ghaleb M et al. An Investigation into the prevalence and cause of prescribing errors in general practice: The PRACtICE study,
a report for the GMC. May 2012. http://www.gmc-uk.org/Investigating_the_prevalence_and_causes_of_prescribing_errors_in_general_practice___The_PRACtICe_study_Reoprt_May_2012_48605085.pdf (accessed18 Dec 2012).
3. Ziaeian B, Araujo K, Van Ness P et al. Medicines accuracy and patient understanding of intended medicine changes on hospital discharge. Journal General Internal Medicine 2012; 27:1513–20
4. Sexton J, Brown A. Problems with medicines following hospital discharge: not always the patient’s fault? Journal of Social and Administrative Pharmacy 1999; 16:199-207
5. Duggan C. Reducing adverse prescribing discrepancies following hospital discharge. International Journal of Pharmacy Practice 1998; 6:77-82
24. Preventing hospital admissions: Evaluation of the Pharmacy Reablement Service Howard RL1, Honeywell G1, Warner JG2, Noble KA2., 1. Isle of Wight NHS Trust, Newport, Isle of Wight.
2. Pinnacle Health Partnership, East Cowes, Isle of Wight.
Introduction Around 6% of hospital admissions are caused by problems with medication, one-third associated with poor adherence, and two-thirds considered preventable.1 Patients recently discharged to home are at a high risk of readmission,2 therefore services should be targeted to support patients following discharge. As part of a broader reablement service (including physiotherapy and occupational therapy and intensive support for 6 weeks) the Isle of Wight offered the pharmacy reablement service (PRS) to help prevent readmissions to hospital between 2011 and 2014. The PRS involved assessing high risk patients (as identified by social services) in hospital and referring them to community pharmacists for support following discharge. This retrospective evaluation aimed to describe the service provided by community pharmacists and explore its effect on hospital admissions. Objectives 1. To describe the problems identified and activities undertaken by community pharmacists as part of the PRS. 2. To evaluate the effect of the community pharmacist review on patients' admissions, lengths of stay, 30-day readmissions, excess bed days and
deaths. Method Link-anonymised data on the PRS from 2011 to 2014 were obtained from the Electronic Services Monitoring and Quality (ESMAQ) system (now PharmOutcomes).3 These data detailed the referral process and activity undertaken by the community pharmacists. Link-anonymised patient data (age, gender, primary diagnosis for reablement admission, number of admissions, lengths of stay, excess bed days and 30-day readmissions) were obtained from the hospital information department. All databases used the hospital number as a pseudonymous patient identifier. Databases were cleaned (duplicates removed, social services numbers converted to hospital numbers), imported into Excel 2007 and merged based on the hospital number. Patients were retrospectively grouped according to whether they had received hospital assessment only (HA Only) or assessment and community pharmacist review (CP Review). This helped determine whether the effect on health service usage was due to the wider reablement programme or the pharmacy reablement service. Demographic data (age, gender, primary diagnosis) were summarised using descriptive statistics. Baseline data were calculated for the two years preceding the PRS start date for each patient (reablement date): number of hospital admissions/patient/year, total number of bed days/patient/year, total number of excess bed days/patient/year, number of 30-day readmissions/patient/year. Baseline data were compared between the two patient groups using t-test for continuous data (outliers were removed prior to analysis) and Pearson's chi square for categorical data. The contribution in months for each patient post-reablement was calculated based on the date of death or the date of data extraction. From this, the post-reablement number of hospital admissions/patient/year, total number of bed days/patient/year, and total number of excess bed days/patient/year were calculated. The change from baseline to post-reablement was calculated for number of hospital admissions/patient/year, total number of bed days/patient/year, and total number of excess bed days/patient/year and compared between the two patient groups using t-test; the number of deaths and 30-day readmissions were compared using Pearson's chi-square. The time from reablement date to community pharmacist review was summarised using descriptive statistics. The problems identified and activities undertaken were recorded by community pharmacists using drop-down lists and free text. Free-text descriptions were coded and summarised as number (%). Ethical approval was not required for this service evaluation. Results Community Pharmacist Review: 435 patients were referred into the PRS, hospital episode data was available for 433 patients. 208/435 (48%; 95%CI 43, 53) patients received a community pharmacist review; 182/208 (88%; 95%CI 82, 91) "CP review" hospital numbers could be linked to the hospital statistics data. The median time from reablement to contact by a community pharmacist was 13 days (IQR 13). 108/208 (52%; 95%CI 45, 59) patients received one domiciliary visit, 50/208 (24%; 95%CI 19, 30) two visits and 50/208 (24%; 95%CI 19, 30) three visits. Pharmacists identified 517 needs/problems in 208 patients (mean 2.5 per patient; range 0,6) and provided 1191 services (mean 5.7 per patient). Baseline data: Patients referred into the PRS had a median age of 81 years (minimum 36 years, maximum 99 years). Sixty percent of patients were female, and patients with a broad range of primary diagnoses were referred into the PRS. At baseline patients had a median of 1.0 (interquartile range (IQR) 1.0) admissions/year, 13.8 bed days/year (IQR 18.0), 0.0 (IQR 0.0) excess bed days/year (only 97/433 (22.4%; 95%CI 18.7, 26.6) patients had excess bed days) and 0.5 (IQR 0.5) 30-day readmissions/year in the two years pre-reablement. Comparison of the "HA Only" and "CP Review" groups showed no statistically significant differences in baseline characteristics. Effect of CP Review: Compared to the “HA Only” group, the “CP Review” group showed greater reductions from baseline in admissions (-1.5 admissions/patient/year, p=0.003), 30-day readmissions (odds ratio (OR) 0.45, p=0.004) length of stay (-11.6 days/patient/year, p=0.006), excess bed days (-4.5 days/patient/year, p=0.600) and deaths within 1 year of reablement (OR 0.72, p=0.156). These reductions were statistically significant for all measures except excess bed days and deaths. Conclusions Patients at very high risk of medicines-related problems receiving domiciliary community pharmacist reviews as part of a wider reablement service experienced statistically significantly reduced numbers of admissions, 30-day readmissions and lengths of stay compared to patients receiving hospital assessment only. This model of care is to be incorporated into a broader referral to community pharmacy service providing medicines optimisation to vulnerable people on discharge to home (MOTIVE) to be introduced on the Isle of Wight. References 1. Howard RL, Avery AJ, Slavenburg S, et al. Which drugs cause preventable admissions to hospital? A systematic review. Br J Clin Pharmacol
2007; 63: 136–7. 2. Donnan PT, Doward PW, Mutch B, et al. Development and Validation of a Model for Predicting Emergency Admissions Over the Next Year
(PEONY): A UK Historical Cohort Study. Arch Intern Med 2008; 168: 1416-22. 3. PharmOutcomes Clinical Service Management System, Pinnacle Health Partnership LLP [email protected]
25. Review of Pharmacist independent prescribing in a secondary care setting Al-Modaris I, Ioannides C., Pharmacy Department, Chesterfield Royal NHS Foundation Trust. Chesterfield
Introduction Since April 2012, pharmacists, as well as nurses, who have qualified as independent prescribers, have been able to legally prescribe any medication, with a small number of exceptions.1 Independent prescribing has expanded the role of the clinical pharmacist. Pharmacist independent prescribers (PIPs) at Chesterfield Royal Hospital NHS Foundation Trust (CRHFT) contribute to a variety of areas, including: outpatient clinics, admission units, multidisciplinary ward rounds and inpatient wards in a variety of specialties including haematology and oncology, surgery, critical care, medicine, adult and paediatric parenteral nutrition, anticoagulation and antibiotics. As CRHFT has an unusually high proportion of PIPs working across a broad range of specialties we decided to explore the views of healthcare professionals of PIPs working at CRHFT in order to assess their impact. Objectives To explore healthcare professionals’ opinions of pharmacist independent prescribing at CRHFT. Method A questionnaire was developed to produce anonymous data from healthcare professionals. The questionnaire was sent to pharmacists, technicians, junior doctors, consultants, nurses, dieticians, physiotherapists and occupational therapists. Ethics approval was not required. The questions were designed to assess the perception of pharmacist prescribing and identify areas for improvement. Results See table.
Strongly agree
Agree Neither agree nor disagree
Disagree Strongly disagree
Unsure
Pharmacists make good prescribers 76% (23) 20% (6) 3% (1) 0% (0) 0% (0) 0% (0)
Pharmacist prescribers are a useful addition to the MDT 76% (23) 20% (6) 0% (0) 0% (0) 0% (0) 3% (1)
Having a pharmacist prescriber in the MDT improves patient safety 83% (25) 13% (4) 3% (1) 0% (0) 0% (0) 0% (0)
There are enough pharmacist prescribers at CRHFT
0% (0) 30% (9) 27% (8) 27% (8) 10% (3) 7% (2)
The questionnaire included an option for the respondents to add qualitative comments regarding the impact of pharmacists as independent prescribers. Advantages included improved efficiency in working practices, improved patient safety from fewer prescribing incidents and frees up doctors time to focus more on patient care. A high proportion of responses did not give any disadvantages to pharmacist prescribers. A number of responses suggested pharmacist prescribing de-skills doctors and a lack of a second check for pharmacist prescribed items was a disadvantage. Discussion The results demonstrate an overall positive response to pharmacist prescribing at CRHFT. The majority of healthcare professionals surveyed either strongly agreed or agreed with the statements that pharmacist prescribers are good prescribers, beneficial to MDT working and improve patient safety. None of those surveyed responded negatively to these statements which is encouraging and suggests that the pharmacist prescriber roles are valued at CRHFT. However, it must be noted that of the 30 respondents most of those were pharmacists, both independent prescribers and non-independent prescribers, which introduces significant bias to the results. 5 doctors responded, F1 to consultant, none of whom responded negatively, which provides validity to this opinion. One reason for the poor response rate amongst doctors was the short return date for the questionnaire. Only 30% of responses agreed that there are currently enough pharmacist prescribers, and none strongly agreed with this. This demonstrates that although CRHFT has a high proportion of pharmacist prescribers there is a need to expand this role. The current plan is to increase the proportion of pharmacist prescribers from 43% of all pharmacists currently to 60% by 2016. There was concern that pharmacist prescribing de-skills doctors. This is a valid concern however it should be noted that the vast amount of prescribing at CRHFT is still undertaken by junior doctors. Concerns could be reduced by promoting and educating medical staff on the role and impact of pharmacist prescribing, both on reducing pressures on junior medical staff and being a useful addition to the multi-professional team leading to improvements in patient safety. Respondents also expressed concerns regarding checking pharmacist prescribing. Pharmacist prescribing on wards at CRHFT may not get a check by a second pharmacist. Restructuring of non-prescribing pharmacists job roles to allow second checks on wards covered by prescribing pharmacists may address these potential issues. Furthermore the GPhC is considering introducing guidance for pharmacist prescribers which may help define the tackle some of the issues highlighted.2 One limitation of the study was the low numbers of respondents outside of pharmacists. In future the study could be repeated with a longer response time and to include the option of a paper questionnaire. Anecdotally many junior doctor, nursing and technician staff do not regularly access their NHS email accounts, more often use their home email accounts. The response rate from these staff was particularly disappointing as these staff groups are the healthcare professionals who most commonly liaise with junior doctors regarding prescribing issues and who therefore may have strong views on the impact of pharmacists as independent prescribers. It would also be interesting to also include the views of patients as to how they perceive the role of pharmacists as prescribers. References
1. Department of Health. Nurse and pharmacist independent prescribing changes announced. April 2012. www.gov.uk (accessed 15 February 2015)
2. Pharmaceutical Journal; GPhC set to develop guidance for prescribers; Pharmaceutical Journal 2015;294:198
26. Learning to lead in hospital pharmacy Ireland, H. South West Medicines Information and Training, Bristol.
Context Good leadership within healthcare staff has been linked with high quality care (1). Within hospitals, the pharmacy team will be led by a Chief pharmacist. The General Pharmaceutical Council does not specify any regulatory standards specific to this role. The professional body has developed competency frameworks and professional standards to support pharmacists wanting to develop their leadership skills (2,3). This exploratory study is needed to discover how pharmacists prepare for a chief pharmacist post and learned to lead. Objectives
Explore if there is difference in role between a senior and chief pharmacist
Find out how chief pharmacists knew when they were ready for a chief post
Establish what learning could be carried out in preparation to becoming a chief pharmacist
Describe what learning needs do chief pharmacists have whilst in post
Discover if a ‘successful’ transition to chief pharmacists can be measured Method An interpretative paradigm approach was adopted. Ethics approval was not needed as the University Hospitals Bristol research team reported the study was service evaluation. All chief pharmacists from South West hospitals were invited to take part. Participation was voluntary and any power differential is in the chief pharmacists favour. An initial literature review and study objectives informed the semi-structured interview outline to help direct the interview. However, the interview structure was flexible depending on the discussion. Interviews were recorded and fully transcribed. A confidential lettering system was used for any names mentioned. Transcripts were stored on an NHS server via a password controlled and encrypted computer. Interviews were carried out in October-November 2014. A thematic interpretative analysis approach was used to identify and evaluate patterns and meaning across the data set. Results 11 chief pharmacists volunteered to take part. By purposeful sampling, four pharmacists were chosen based on gender and experience to ensure a mix of perspectives. Three themes were identified; Hospital pharmacy context: The role and responsibilities of chief pharmacists have changed with chief pharmacists charged with potentiating commercial viability of the department and hospital, as well as medicines safety and optimisation. “I think the NHS has to go for a commercial footing.” D. Some chief pharmacists do not feel leadership was shared within the pharmacy team, they report greater personal accountability than they experienced as senior pharmacists and more isolation. “It’s quite clear to you that actually the buck does stop with you” C. The chief pharmacists gave differing perspectives about how a successful transition to a chief pharmacist post could be measured. Career pathways: All those interviewed said becoming a chief pharmacist was not on their career pathway. Two pharmacists said another person encouraged them to apply for the post. (In appraisal - line manager said) “Forget that, I think you need to be looking for a chief pharmacist role’... I had never really thought about it like that” B. The chief pharmacists reported there was a significant ‘step-up’ between senior and chief pharmacist roles. “You don’t realise that gap until you are a chief pharmacist” C. This study raised an unexpected finding around the lack of ‘succession’ transfer or handover between a leaving and new chief pharmacist. “In terms of handover, no, I did not have anything in terms of really” B. Learning to lead: The chief pharmacists reported courses or learning experiences which had helped prepare them for their role. The chief pharmacists wanted to learn with other members of the multi-professional team to gain a wider healthcare or management view. “They weren't from a pharmacy background. Hugely refreshing and different....great when became chief and go to divisional meetings” C. The study identified that learning solely with other pharmacists was seen as not helpful, and even potentially harmful. “I didn’t want pharmacy. It’s got to be wider, in the wider context” D. Identification of further knowledge or skills chief pharmacists may lack and how to address these needs was acknowledged as a challenge. “I think part of the problem is people don’t know what they don’t know” B. Discussion The study discovered a significant step-up in the role between a senior and chief pharmacist. This, together with the greater responsibility and expectations being placed on the chief pharmacist, has implications on how a pharmacist can get ready for this transition. Suggestions to prepare oneself centred on formal learning opportunities regarding financial and commercial leadership. Importantly this study found pharmacists would like to learn alongside other professions and, surprisingly, identified that learning with pharmacists alone may be harmful. This has important implications for curriculum design and delivery. This study adds to our understanding of career progression by highlighting a chief pharmacist role was not a career aspiration for those interviewed and therefore progression was unplanned. This finding has consequences for how to inspire and prepare future chief pharmacists to enable succession planning and successful recruitment. This study found a reliable measure of success as a chief pharmacist is elusive. The consequence being chief pharmacists are unsure how they are performing. It was discovered some chief pharmacists find it difficult to identify learning needs and ask questions about what they do not know. This contributes to the chief pharmacist being under prepared for the demands of the role, particularly if newly appointed. The study identified the succession between chief pharmacists could be improved. This study is a reflection on the current understanding and experiences of four chief pharmacists. The chief pharmacists involved were white British in ethnicity and included one female. This may not represent the pharmacist registrant demographics. Further investigations should include more chief pharmacists and pharmacists at other points of the career pathway. References
(1) Francis, R. The Mid Staffordshire NHS Foundation Trust public inquiry. 2013. London. Stationery Office. (2) Royal Pharmaceutical Society. Leadership competency framework for pharmacy professionals. London. Royal Pharmaceutical Society. 2010 (3) Royal Pharmaceutical Society. Professional Standards for Hospital Pharmacy Services. London. Royal Pharmaceutical Society. 2014
27. Identifying the learning and development needs of registered pharmacists across different hospital settings. Kapadia, T, and Singal, R, Barts Health NHS Trust, London
Introduction/ Background/ Context The development and training of the pharmacy workforce is a professional and statutory requirement. However, we need to move beyond a “minimum standard” culture towards the provision of quality care to patients as outlined recently by the London Pharmacy Workforce Group (LPWG).1, 2 It is consequently essential to consider the level of support registered pharmacists are receiving from within the workplace and from professional organisations, and to identify and address professional development needs. Objective(s)
To comparatively analyse the learning and development needs of the registered pharmacist workforce between teaching and district general hospital (DGH) settings.
To explore learning and development needs across hospital bands (as per agenda for change).
To make recommendations based on analysis of findings. . Method An online questionnaire survey was conducted across the entire pharmacy department of a multi-site NHS Trust. All registered pharmacists were asked to respond over a four-week timeframe. Analysis was conducted by descriptive and comparative statistical method. Ethics approval was not required. Results A response rate of >70% was achieved, based on the most current listing of registered pharmacists within the Trust. Results showed that 68 of the 96 (71%) participants indicated they required more learning and development support in the areas illustrated in Table 1. Table 1. Learning and development support requirements
Nature of Support Required
Hospital Band (AFC) Hospital Setting
Band 6 Band 7 Band 8a Band 8b and above
Total District General Hospital
Teaching Hospital
Total
Evidence-based medicine
Count 20 9 9 1 39 16 23 39
Percentage 83.3% 47.4% 50.0% 14.3% 72.7% 50.0%
Clinical knowledge
Count 18 10 10 2 40 15 25 40
Percentage 75.0% 52.6% 55.6% 28.6% 68.2% 54.3%
Management Count 11 15 13 2 41 14 27 41
Percentage 45.8% 78.9% 72.2% 28.6% 63.6% 58.7%
Leadership Count 11 13 15 4 43 15 28 43
Percentage 45.8% 68.4% 83.3% 57.1% 68.2% 60.9%
Research Count 13 11 9 3 36 11 25 36
Percentage 54.2% 57.9% 50.0% 42.9% 50.0% 54.3%
Mapping against competencies
Count 11 10 9 4 34 13 21 34
Percentage 45.8% 52.6% 50.0% 57.1% 59.1% 45.7%
Total Count 24 19 18 7 68 22 46 68
Total sample: n=96 Percentages are based on respondents. Discussion/ Conclusion The findings demonstrate there is a learning and development support need across all bands of registered pharmacists, demonstrating no significant difference within both teaching and district general hospitals. There is a trend towards pharmacists in earlier years of practice requiring more development in areas of evidence-based medicine and clinical knowledge, shifting towards management and leadership needs from Band 7 roles upwards. Interestingly the results show that there is ≥75% proportion of each band that indicates a need towards a particular area of support, with the exception of senior pharmacists of Band 8b and above. Senior pharmacists (band 8b and above) amount to 10% of all respondents who indicated a need for support. Although this is representative of the proportion from the entire pharmacy workforce, further research across other organisations would allow significant conclusions to be drawn on learning and development support requirements for this cohort as well as allow for consolidating findings across the entire hospital pharmacy workforce. Those who are not members of professional leadership organisations indicated greater needs for development (chi2 5.1, p= 0.024). Strategies to address support needs have been identified. References 1. London Pharmacy Workforce Group. LPWG advocates membership of professional bodies by registered pharmacists and pharmacy technicians
[Internet]. London: 2015. Available from: http://www.lpet.nhs.uk/WorkforceDevelopment/London.aspx. (accessed 12.02.2015) 2. General Pharmaceutical Council. Standards of conduct, ethics and performance [Internet]. London: GPhC; 2012. Available from:
28. An evaluation of practicalities and options available for delivering the self-administration of insulin agenda: Action beyond the NPSA Kavanagh S, Thomas N, Sheffield Teaching Hospitals NHS Foundation Trust. Sheffield, South Yorkshire
Introduction Insulin is cited as one of the medicines most commonly associated with incidents leading to severe harm or death1. An analysis of insulin reports by National Reporting and Learning System (NRLS) showed over 15,000 incidents, the top 3 errors accounting for 60% were: wrong dose, strength, frequency (26%), omitted/delayed medicine (20%), and wrong insulin product (14%). Incidents occurred at all stages of prescribing, supply and administration, but 61% occurred during administration. Incorrect dosing, omission and delay were commonly reported from an inpatient environment where insulin is administered by health care staff2. In March 2011 the NPSA released the patient safety alert requesting systems be put into place enabling appropriate hospital inpatients to self-administer insulin. The Trust has met the NPSA requirement to have a policy for self-administration in place. The current policy permits the self-administration of insulin when the ‘current insulin vial, pen or cartridge must be stored in a locked receptacle approved by pharmacy, which only contains insulin for that patient, to which the patient holds the key’. This presents significant barriers to implementation, as throughout the trust there are various different patient lockers styles in use, and many do not fit the specific policy requirements. Where individual lockers are not available, medicines including insulin will be stored in a locked cabinet or medicines trolley accessed by nursing staff. This presents other risks to the patients including picking errors and delayed doses. Objectives To undertake a risk assessment and options appraisal for the available medication storage options suitable for self-administration of insulin. Method The incident reporting system (DATIX) was reviewed for all reported insulin incidents within the Trust for the period of 1 year, to compare the incidence of omitted and delayed insulin doses against unintended administration or misappropriation of insulin. A set of criteria that must be assessed when choosing an appropriate storage solution were defined:
Security: portability, type of lock
Infection control: easy to clean with standard procedures for high touch items
Suitable for use in all areas: size, one per bed space or a set number per ward
Nurse accessibility: available at all bed spaces, portable product that can be stored on ward in easily accessible area
Patient accessibility: poor mobility, neuropathy, poor eye sight A review of the NHS supplies catalogues was manually reviewed in July 2014 to identify commercially medication storage options. An internet based search was undertaken during the same time period (July 2014), using search terms medication lockers, self-administration lockers, medication storage, secure personal storage. Ethical approval was not required for this service review and improvement project. Results Datix reports for a 1 year (July 2013- June 2014) period identified 51 insulin incidents; omitted dose 20%, patient self-administered correct dose but prescription was wrong 4%, incidents preventable if patient had been self-administering 40%, duplicate administration (nurse and patient) 4%, patient self-administered wrong dose 8%, unintended administration (wrong patient) 0% , misappropriation of insulin 0%. Review of commercially available products identified that numerous products are available, each with advantages and disadvantages as detailed in table 1. Table 1: Options appraisal summary
Security
Nurse accessibility
Patient accessibility
Storage option Ward secure Lockable Infection control
All bedsides Easy storage Close to bedside
Locker
Extra locker
Cabinet x x
Cashier box x x
Locked bag x x x
Patient retains x x
Medical box x
Drug return box
Plastic unit
Ward trolley x x
Discussion The data shows that a total of 43% of errors could be prevented if the patient was self-administering their insulin. There are no incidents of misappropriation of insulin or administration to the wrong patient despite insulin not always being locked away, but the prevalence of this practice is unknown. Patient access to their own insulin resulted in 6 incidents. It is not clear whether these patients had been assessed to self-administer their own insulin. Many of the commercially available products were not suitable, and others were too expensive to provide one for every bed space. A previous pilot on a diabetes ward with engaged staff, demonstrated a failure to allocate the storage facilities appropriately if there were only a couple available on the ward. Given that there is not an ideal storage solution and there are no reported incidents we must consider, is it reasonable to accept the risks associated with insulin not being locked away for patients who are self-administering? If so what control measures are required, and if not which storage option to recommend. Conclusion Due to disparities in pharmacy ward cover and medication systems in place it is desirable that a single model approach is taken to ensure consistent service to patients with diabetes across the trust. On review of the incidents and options appraisal the decision has been agreed to allow patients to maintain possession of their insulin. The trust policy is to be reviewed and individual wards are to undertake local risk assessments. References
1) National patient Safety Agency (NPSA) publishes ‘safety in doses: medication safety incidents in the NHS’ (2007). 2) National Reporting and Learning service between 2003 and 2009. http://www.nrls.nhs.uk/alerts/?entryid45=74287 Accessed 22/8/14.
29. A retrospective audit on the prescribing of aclidinium at The University Hospitals of Leicester (UHL) NHS Trust Mandane B. Murphy A. University Hospitals of Leicester NHS Trust, Leicester.
Background Aclidinium bromide (Eklira Genuair®) is a long-acting muscarinic antagonist (LAMA) licensed for use in chronic obstructive pulmonary disease (COPD). It received a European marketing authorisation in July 2012 and was launched in the UK in September 2012.1 In May 2013, the Therapeutic Advisory Service (TAS) approved its use as an alternative to tiotropium HandiHaler® in those patients who have any contra-indications, or cannot manage the HandiHaler® device, but not due to a lack of response.2, 3 The primary aim of this retrospective audit was therefore to assess the prescribing practice of this new inhaler in line with the latest TAS, Leicestershire Medicines Strategy Group (LMSG) and National Institute for Health and Clinical Excellence (NICE) COPD Guidance.1-3 Objectives: – To audit against the following standards:
1. One hundred percent of patients must have a diagnosis of COPD. 2. Ninety percent or more of patients must have previously been prescribed tiotropium. 3. One hundred percent of patients must be prescribed aclidinium according to the licensed dosing.
Method The inclusion criteria were all patients prescribed aclidinium from May 2013 to end of October 2014 across all three hospital sites within the Trust; these were identified using the JAC Medicines Management Programme (n=27). An exclusion criteria did not apply and ethics approval was not required. Initially, total population sampling (a type of purposive sampling technique) was used as the target population identified was small and hence all the patients’ case notes were requested from the medical records team. Unfortunately, due to the high demand of case notes in wards and clinics only sixteen (n=16) arrived within the two months’ timeframe allocated for data collection, therefore only these were used in the audit (convenience sampling). At the outset, a pilot stage was conducted to assess the suitability of the preliminary data collection form (n=4), after which further improvements were made to its design. A clinical project planner and registration form was also filled in and sent to the clinical audit team for the purposes of registration. Each patient was anonymised by means of a unique audit number for confidentiality purposes. Lastly, the data collected were statistically analysed using Microsoft Office Excel. Results Overall, of the sixteen patients sampled 25% were males and 75% females with an average age of 70 years and a predominant White British ethnic background (94%). In relation to standard one, evidence shows that only 81% (n=13) of the patients prescribed aclidinium had a diagnosis of COPD in contrast to the expected 100%. Similarly, the findings for standard two did not meet the initial expectations either with only 69% (n=11) having previously been prescribed tiotropium as opposed to the ≥90% anticipated (see Fig. 1 for more details). Finally, in relation to standard three only approximately 56% (n=9) of patients were prescribed aclidinium according to its licensed dosing (322µg twice daily). Figure 1 – Explanations as to why tiotropium was stopped (n=11)
No therapeutic benefit 18.2 (n=2) Unable to use device 27.2 (n=3)
Not specified 36.4 (n=4)
Discussion Findings for standard one revealed that a significant proportion of asthmatic patients (19%) were prescribed aclidinium. Two potential reasons for this off-licensed use include unawareness of aclidinium’s licensed indication or expert clinicians using it for more severe stages of asthma. Overall, it should be reinforced to prescribers that comprehensive clinical trials of aclidinium in asthma have not yet been conclusive in its evidence and this type of prescribing certainly carries additional responsibilities. Secondly, the original mark allocated to standard two was ≥90%, as it is recognized that in practice patients with manual dexterity problems or reduced renal function (creatinine clearance <50ml/min) may not be able to have tiotropium first. This audit highlighted that only 69% of the total sample population had previously tried tiotropium (19% never did and 12% were unknown). Of the total sample, it was also confirmed that 19% had a renal function classification at stage 3a or below, which further helps to rationalize why a significant proportion of patients may not have been suitable for a trial of tiotropium first. In relation to standard three, the obtained data highlights some confusion around the prescribing dose of aclidinium as only approximately 56% of its prescribing was in line with the latest guidelines.2, 3 Examples of unclear prescribing found included 332µg, 375µg and 400µg. It was also noted from the patients’ drug histories that primary care prescribers were more likely to write the dose as 375µg as opposed to 322µg in hospitals. On further investigation, it was recognized that there are differences in the dose settings between the various computer prescribing systems. This important issue was subsequently followed-up with the Trust’s consultant respiratory and interface pharmacists in view of standardizing the dose to 322µg across all the systems. Respiratory teaching sessions for staff must also raise awareness of the fact that each delivered dose contains 375µg of aclidinium bromide equivalent to 322µg of aclidinium; the corresponding metered dose is 400µg of aclidinium bromide equivalent to 343µg of aclidinium respectively. Many secondary issues were also identified as a result of this audit, such as incorrect recording of tiotropium devices (HandiHaler® and Respimat®) and their respective doses in the notes. Similarly, common misunderstandings were prominent around renal function and LAMAs prescribing; it should be clarified that only tiotropium needs dose adjustment in renal impairment, aclidinium does not. Last but not least, some of the limitations of this audit mainly revolved around the small number of patients’ case notes available and poor documentation around outcome data upon starting aclidinium. In conclusion, clinical guidance and dose standardization across all the prescribing systems are currently under review to further improve clinical practice. Additionally, Trust wide respiratory medicine posters, e-learning modules, mobile phone apps and “Inhaler Devices Champion” initiatives are all presently being development as a follow-on from this audit; they are expected to be launched early this summer. Re-auditing to measure the effectiveness of these initiatives should be carried out again after their enactment into practice. References 1 NICE. Chronic obstructive pulmonary disease: aclidinium bromide. [Online] January 2013. Available from: http://www.nice.org.uk/advice/esnm8 [Date accessed: 27/10/2014] 2 TAS. Drug information: aclidinium bromide. [Online] May 2013. Available from: http://www.tas-leicester.org/drug_info.php?drug_id=1113# [Date accessed: 27/10/2014] 3 LMSG. Medicines Management of Stable COPD. [Online] January 2014. Available from: http://www.lmsg.nhs.uk/LMSGDocs/Guidelines/COPD_review_January2014v2.pdf [Date accessed: 27/10/2014]
30. Improving Medicines Management for Anaesthetists working in Pre-Hospital Emergency Medicine (PHEM) Marson V*, Bevan F*, Bednall R*, Thomson S* and Nash M#, Departments of Pharmacy*, Anaesthesia#, University Hospital of North Midlands
(UHNM) NHS Trust, Stoke-on-Trent
Introduction Trauma remains the fourth leading cause of death in western Countries. However many emergency departments deal with severely injured patients less often than once per week. This lead to the recommendation that trauma services should be planned regionally and that high quality pre-hospital care is fundamental in its provision1. Pre-hospital anaesthesia is the standard of care for trauma patients with airway compromise, to avoid death or hypoxic brain injury2. In March 2012 UHNM became a major trauma centre and services were re-engineered to support the major trauma status. This included a review of the delivery of care provided by our anaesthetists working in PHEM. Previously this care was delivered by UHNM anaesthetists, responding from home on a charitable basis, supported by North Staffordshire BASICS (NSB), a local pre-hospital care charity. This was under the operational control of West Midlands Ambulance Service (WMAS). Medicines needed for treating patients in this field included a range of anaesthetic and controlled drugs (CDs) not routinely stocked on ambulances. Individual anaesthetists purchased their own supplies directly from independent wholesalers or ‘borrowed’ from UHNM stock. Stock was distributed amongst anaesthetists with little or no record of stock management and CD use. In 2012 the service became recognised formally as a partnership arrangement, funded by UHNM. Consequently improved governance arrangements were required to ensure the safe, cost-effective and legal use of medicines whilst maintaining high standards of patient care. Objective To introduce a new system, with improved governance arrangements, ensuring the safe, cost-effective and legal use of medicines utilised by anaesthetists responding in PHEM. Method This service evaluation required no ethics approval. Following an options appraisal the best solution identified to support patient care and meet legal requirements, was for each anaesthetist to have and store their own standard anaesthetic drug kits and controlled drug kit. These would be provided by UHNM pharmacy and be stored within the anaesthetists’ own homes, or vehicles when responding to an incident. The range of drugs required was identified along with their legal status, storage requirements and the quantity required sufficient to attend two incidents. Suitable pouches were sourced to be filled by the Technical Services (TS) team, ensuring traceability of products in case of re-call and management of expiry dates. A standard operating procedure was developed and trained out for the ordering, storage, use and audit of CDs from pharmacy by the PHEM team. A cost centre was established to monitor expenditure. The process was then discussed at the Local Intelligence Network, approval gained from UHNM Trust Safe Medicines and signed off by the Accountable Officer for CDs and Associate Medical Director. This facilitated the legal agreement between the organisations. This system was piloted for six months with three approved anaesthetists from September 2014 - February 2015. Due to the informal nature of previous arrangements, no pre-implementation data was available. Data was gathered on the number of kits produced and issued during this time, the associated cost, the number and type of incidents attended and if there was any adverse medication incidents reported. Feedback from the anaesthetists was obtained, any areas for improvement noted and changes implemented at the end of the pilot. Results Table 1 describes the impact to the organisation, staff and patients in the first 6 months. Table 1: PHEM Anaesthetic Kits – Service Impact (Sept 14 – Feb 15)
No. of Anaesthetists involved 3 No. of Kits produced by TS 7 standard kits; 8 fridge kits No. of Kits issued to PHEM team 6 standard kits; 7 fridge kits No. of CD Kits supplied & refilled 9
Cost of Kits issued £496.25* includes purchase of pouches (expired stock £3.36)
Adverse incidents with medicines/ discrepancies in CD use
Nil
Number of incidents attended 7
Examples of patients treated RTCs/traumatic fall, low GCS; horse riding accident; severe crush injuries. Special case – planned transfer of psychiatric patient fully sedated
*NB this represents 0.002% of Emergency Department (ED) expenditure over same period. Feedback from the anaesthetists includes that the old system was ‘at best erratic’, CDs were being held in ‘large quantities in less than ideal conditions’ and with a chain of movements considered ‘less than optimal’. ‘Ordering of CDs was ad hoc; a lot expired or wasted’. In comparison, ‘the new CD system works very well’, ‘governance has massively improved’ particularly with ‘improved storage and accounting of CDs’. Discussion This innovation has ensured patients have received timely administration of medicines, including procedural sedation and rapid sequence induction anaesthesia at the site of major incidents. This was done with legal compliance and strong governance. Were such drugs not made available to anaesthetists, this would be detrimental to patient morbidity and mortality. Following a review of the pilot at six months, minor modifications have been made to the standard operating procedure and the range and quantity of medicines provided. The process has now been formally accepted following the success of the pilot and further anaesthetists will shortly join the team as the service expands. The arrangement of anaesthetists being called from home 24/7 to PHEM work, in a partnership arrangement, may be unique to Staffordshire. However we believe this novel approach to medication supply is reproducible at other major trauma centres where anaesthetists are similarly responding to calls from sites other than their Trust base. Recent focus on the ED pharmacist role has concentrated particularly around management of minor illness and pre-discharge medicines optimisation. This innovative PHEM process demonstrates the value of an alternative enhanced ED pharmacist role, as an integral part of the ED team, to improve governance and benefit patient care. References 1. National Confidential Enquiry into Patient Outcome and Death. Trauma: Who cares? 2007. http://www.ncepod.org.uk/2007report2/Downloads/SIP_summary.pdf (accessed 24 February 2015) 2. Lockey DJ, Crewdson K, Lossius HM. Pre-hospital anaesthesia: the same but different. British Journal of Anaesthesia 2014:113(2):211-219.
31. Foundation Doctor - Pharmacist Buddy Scheme: Evaluation of a Successful Programme McCartney C BSc(Hons) MSc MRPharmS. Sadasivam S MBBS MRCGP MClinEd., Shaw F Mpharm(Hons). Henry A BSc(Hons) MPhil MRPharmS
County Durham and Darlington NHS Foundation Trust
Introduction Slips and knowledge-based mistakes are the most common type prescribing error seen amongst F1 doctors when commencing a new job or rotation.1,2 Pharmacists are ideally placed to prevent and correct such errors. Indeed, although F1 doctors in the EQUIP study were found to have a prescribing error rate of 8.4% almost all of these were detected and corrected by the pharmacist.2 F1 doctors report that they often feel inadequately supported when prescribing, and support by pharmacists is valued.2 Studies have shown that 1 to 1 education and feedback can lead to prescribing improvements.3 A positive environment and relationships are necessary conditions for the giving and receiving of feedback. We sought to foster the pharmacist F1 relationship within this acute Trust by increasing the contact with pharmacists during the induction period and adding structure to the initial meeting between the ward based pharmacist and F1 doctor. Aims and Objectives • To evaluate the perceived usefulness of a pharmacist buddy scheme for F1 doctors. • To evaluate perceptions of the impact of the scheme on medication errors Methods Pharmacists have several slots on the Trust taught induction programme with 6 of 23 hours of teaching provided by pharmacists. Following the taught component F1 doctors spent a four day shadowing period in the hospital prior to starting work. All F1 doctors were assigned a pharmacist buddy, where possible this was the pharmacist assigned to their first ward. Names of the pharmacists and buddies were circulated by the Trust foundation team thereby making this a Trust led initiative. Pharmacists were asked to contact their buddy prior to their first shadowing day on the ward. On their first ward day, F1’s were timetabled to spend time with their pharmacist buddy at 9am. To facilitate the meeting, a prescribing fact sheet was produced along with a checklist of essential information to be covered during the meeting. Pharmacists also added to the fact sheet specific advice for their wards. The buddy scheme was evaluated from August to November 2014 by means of a paper questionnaire distributed to all F1 doctors and pharmacists taking part in the scheme. The questionnaires both contained statements with a five point Likert scale to indicate agreement or disagreement. There was also a free text section to record any comments about the scheme. Questionnaire Likert responses were analysed and graphed and the free text comments underwent thematic analysis to record any cited themes. Results Out of a possible 54 F1 doctors, 46 returned their questionnaires. One questionnaire was discarded as the free text comments did not match the multiple choice responses and it appears highly likely that the responses were misread. Out of 31 pharmacists assigned as buddies, 29 completed their questionnaires. For F1 doctors the scheme appeared to result in increased confidence with prescribing (82% in agreement), a perceived reduced likelihood of prescribing error (78% in agreement). More than half of pharmacists felt that the scheme had reduced prescribing errors on the ward (59%) and the majority felt that it had improved the relationship between foundation doctors and pharmacists (83%). Both groups felt strongly that the buddy scheme had been a valuable exercise (93% of F1 in agreement and 86% of pharmacists) with 25 of the 29 pharmacist responders stating that they continued to regularly interact with their buddies. The individual break down of results is displayed in table 1 below. Table 1 Summary of Questionnaire results
F1 Strongly Agree
Agree Neutral Disagree Strongly Disagree
Information provided by the pharmacist gave me increased confidence in prescribing 22 15 8 0 0
I feel that information provided reduced the likelihood of me making a mistake on the ward
19 16 9 1 0
This was a valuable exercise 25 17 2 1 0
Pharmacist
I feel that the scheme has reduced prescribing errors on the ward 3 14 6 5 1
The buddy scheme has improved the relationship between foundation doctors and pharmacists
8 16 3 2 0
This was a valuable exercise 10 15 4 0 0
Additional feedback was collated via free text. Analysis revealed several common themes amongst F1’s: Ward pharmacists being approachable or helpful (eight doctors), good advice provided (four Doctors). Other themes included help with prescribing policies (three), knowing who to seek help from (three) and the fact that the scheme was a good idea (Four). Pharmacists fed back that they felt that doctors learnt a lot through the scheme and this led to improved communication and confidence. Problems with the scheme included difficulties contacting the pharmacist (four) and not being based on the same ward (Four F1’s and Five Pharmacists). Conclusions The majority of foundation doctors and pharmacists felt that the pharmacy buddy scheme was a valuable exercise and we believe that this model could be replicated in other trusts across the UK Subjectively, F1 doctors reported increased confidence and felt less likely to make mistakes whilst pharmacists felt that the exercise improved their working relationship with junior doctors and 59% of pharmacists felt that having an early opportunity to discuss prescribing and ward based issues had reduced prescribing errors on the ward. For the scheme to be effective, it appears important to have a pharmacist based on the same ward as their buddy and to ensure that the activity is timetabled. References 1. Ryan C, Ross S, Davey P et al Prevalence and Causes of Prescribing Errors: The PRescribing Outcomes for Trainee Doctors Engaged in Clinical Training (PROTECT) Study PLoS One. 2014; 9(1): e79802. Published online 2014 January 3. 2. Dornan T, Ashcroft D, Heathfield, et al. (2009) An in-depth investigation into causes of prescribing errors by foundation trainees in relation to their medical education: EQUIP study. Final report to the General Medical Council. University of Manchester: www.gmc-uk.org Accessed 27 Jan 2015. 3. The health Foundation Reducing Prescribing Errors 2012. www.health.org.uk Accessed 27 Jan 2015
32. Do Foundation 1 doctors value training sessions delivered by Pharmacists? McFarlane F, Hodgkinson R, Duffy M. Wirral University Teaching Hospitals NHS Foundation Trust
Introduction It is well recognised that involving clinical pharmacists in training junior doctors is beneficial to both the doctors and Pharmacy department. It can improve prescribing practice and encourages closer working relationships1. Each year the Pharmacy department at Wirral Hospitals NHS Trust delivers training sessions to Foundation 1(F1) doctors. The content of the sessions is based on Foundation Programme Curriculum competences, common therapeutic areas, advice around high risk medicines and recent significant medication errors in the Trust. The programme has expanded gradually over the years but never been formally evaluated. The training sessions are developed by specialist pharmacists with the support of the Pharmacy Education team. Sessions usually include a presentation and some interactive real life patient scenarios to facilitate discussion. Clear objectives are set for all sessions and the sessions are quality assured by the Pharmacy Education team to ensure the syllabus criteria above are followed. The content of sessions are checked where possible with other training programmes running to avoid unnecessary duplication.
Objectives
Evaluate F1 doctors’ opinions on the Pharmacy –led training sessions they attend
Identify any potential improvement to the teaching delivered
Method Between August 2013 and July 2014 thirty Pharmacy-led training sessions were delivered to F1 doctors. Feedback forms were completed anonymously at the end of all of the sessions to determine doctors’ views on the quality and value of teaching delivered. Likert scales (scores 1-5) were used for questions asking doctors to rate the usefulness of sessions, rate the quality of visual aids and speakers and whether aims were made clear and met. Average scores were calculated for each response and then a total average calculated for all responses for each session to give a % satisfaction score. There were additional open questions to allow for comments. Ethical approval was not deemed to be necessary since this was a service evaluation.
Results There were 47 F1 doctors in the Trust from August 2013 to July 2014. Attendance at the training sessions was an average of 81% (range from 47 to 100%). Figures were calculated on the numbers of doctors available to attend taking into consideration on call commitments and sickness. Completion rates for feedback forms averaged 88% per session. Table 1 summarises the overall satisfaction score as a percentage for each session. Scores ranged from 79% to 97%. Some of the additional comments about sessions included:
Found sessions very relevant to their current ward work
Sessions improved their day-to-day prescribing on wards
Would recommend these sessions to future F1 doctors
Would consider these sessions to have made them a safer prescriber Suggested improvements for future teaching programmes include to change the running order of topics delivered; give further advice on how to use the hospital ‘intranet’ effectively to access the protocols and policies and cover how to manage an agitated or aggressive patient.
Discussion Overall the 30 training sessions were well received and considered to be of great value to the F1s. The diabetes cases session received the lowest score as the aims were not made completely clear and it had less structure than the other sessions. This session interestingly was jointly presented by the pharmacist and two specialist diabetes nurses and the pharmacist fedback it was more difficult to co-present than present alone. The diabetes specialist nurses added their own case on the day that did not fit with the objectives of the session. This was the only session where other healthcare professionals were involved. For future programmes the running order of topics has now been changed and more practical teaching around use of hospital ‘intranet’ and accessing guidelines has been added. There were a few limitations to this study. The F1 doctors work very closely with the pharmacists on the wards so may have given them favourable feedback as they may have felt negative feedback might affect their future working relationships. The completion rate for feedback forms was not 100% so the results do not fully represent the opinions of all the doctors attending.
Table 1 Summary of Satisfaction Scores for Pharmacy –led Training sessions for F1 doctors
Topic % completed forms completed % satisfaction score
Injectable medicines 87 86
Medicines reconciliation 100 87
Safe Use of Insulin 87 86
Prescribing in Chronic Kidney Disease 82 82
Electronic Prescribing 100 85
Managing Electrolyte Abnormalities 90 90
Managing Acute Coronary Syndrome 97 89
Managing Hypo- and Hyperglycaemia 100 84
Managing Common Medical Conditions 95 93
Managing Oral Anticoagulants Safely 92 95
Analgesia and Pain Control 95 89
Opioid Awareness 92 91
Antibiotics 92 92
Starters for Surgery 97 92
Management of Stroke and Dementia 47 96
Prescribing in Acute Kidney Injury 66 80
Diabetic ketoacidosis 94 94
Diabetes Cases 79 79
Palliative Care 91 83
Pharmacokinetics 59 91
Adverse Drug Reactions 81 90
Heart Failure 75 93
Seamless Care Post Intensive Care Unit 63 95
Practical Prescribing in Respiratory Disease 72 93
Risk Management – Key Incidents 84 97
Prescribing in the Elderly (Falls) 88 94
Prescribing in Liver Disease 91 92
Anticoagulation Scenarios 94 92
Insulin therapy 91 88
Antibiotic Scenarios 84 89
Reference: Williamson A. Raising Prescribing Standards through doctor training. British Journal of Clinical Pharmacy 2009: 1:123-124.
33. Cost and Benefit of Providing a Clinical Pharmacy Service Miller G, Imperial College Healthcare NHS Trust, London
Introduction Ward pharmacy plays an essential role in optimising patient care and ensuring the safe use of medicines within hospitals. The pharmacy department of Imperial College Healthcare NHS Trust, which comprises of three teaching hospitals, has not collected activity data for ward pharmacy since the London region annual prescription monitoring survey of the 1990s. Ward based pharmacy activity data is required to provide information on the contribution of pharmacy to patient care; identify areas to help improve prescribing; provide data as evidence for various requirements including the Care Quality Commission; and provide information to support business cases. Objectives • Develop and implement an appropriate method to collect ward pharmacy activity data. • Develop reports to disseminate the data within the trust. Method Data collection tool & explanatory notes were developed and piloted. Training sessions were held on each site to highlight the importance of this work and explain the data to be collected. Data were collected for one week (Monday to Friday) on pharmacy contributions, which was defined as all activities undertaken by a pharmacist during their ward visit. A few weeks later, this was followed by data collected for one week (Monday to Friday) on clinical interventions made by pharmacists during their ward visit. An intervention was defined as “an action which will, or is intended to, result in a change in an individual patient’s care.” All interventions were graded by a pharmacist and validated by a senior pharmacist, using a 7 point scale1,2. The cost of potential harm avoided by the pharmacy contributions and interventions was calculated using published data1,2. Cost of pharmacists providing the ward pharmacy service was based on the mid-point of their agenda for change (A4C) band, including the on-costs (income tax and NI contributions). The trust approved this study as a service evaluation project, therefore ethical approval was not required. Results Pharmacy Contributions 15,702 activities were recorded by ward pharmacists in 665 hours over 5 working days. Each pharmacist spent a median of 100 minutes on a ward each day and saw 13 patients for which they undertook a clinical screen. Pharmacists undertook a drug history for 647 patients (mean of 1.9/pharmacist/ward/day), of which 354 (55%) required a second source, and clarified or corrected the allergy status for 688 patients (mean of 2.0/pharmacist/ward/day). Patients' blood tests were checked 1533 times (mean of 4.5/pharmacist/ward/day) and 823 calculations were performed (mean of 2.4/pharmacist/ward/day). Pharmacists recorded that they endorsed 3369 prescribed medication for safety or clarity (mean of 9.9/pharmacist/ward/day), assessed 1159 sets of medical notes for information (mean of 3.4/pharmacist/ward/day) and made 1324 changes to prescribed medication following the clinical review (mean of 3.9/pharmacist/ward/day). During the clinical pharmacy visits, pharmacists screened 412 discharge prescriptions (mean of 1.2/pharmacist/ward/day), of which 198 (48%) required at least one change to the discharge prescription. Of these screened discharge prescriptions, 138 (33%) were made up on the ward without the need for pharmacy to dispense them. Pharmacist Clinical Interventions 2,270 interventions were made during the week on 295 ward visits. Data were not collected from 54 (15%) ward visits. The clinical significance & cost avoidance of the interventions are detailed in table 1. Total cost avoidance of these interventions for one week were £345,590. Table 1: Clinical significance and cost avoidance of interventions
Clinical Significance Rating of Intervention (Cost avoidance for each type of intervention1,2)
Number of interventions (%) Cost avoidance (min-max)
I: Good practice implemented (£0) 219 (9.6%) £0
II: Minor benefit, preventing minimal harm or extra observation (£0 - £6) 939 (41.3%) £2,817 (£0-£5,634)
IIIa: Preventing increased length of stay (£150) 271 (11.9%) £40,650
IIIb: Ensure evidence based standards of treatment or clinical protocols followed (£65 - £150)
458 (20.2%) £49,235 (£29,770-£68,700)
IV: Preventing potential readmission, transfer to increased level of care or reversible organ failure (£713 - £1,484)
220 (9.7%) £241,670 (£156,860-£326,480)
V: Preventing permanent organ damage, severe or fatal harm (£1,085 - £2,120) 7 (0.3%) £11,218 (£7,595-£14,840)
NA: Information or enquiry answering (£0) 156 (6.9%) £0
Total 2270 £345,590 (£234,875-£456,304)
Cost of Clinical Pharmacy Service Pharmacists spent 135 hours per day on wards. The cost for ward based work based on the midpoint A4C band (including on costs, annual leave & time off in lieu) is £19,991 per week.
Discussion The cost of providing a clinical ward pharmacy service is £19,991 per week. The associated cost avoidance from the interventions made by pharmacists in one week was £345,590, which is in addition to all the other patient care activities undertaken that does not currently have an associated cost benefit or cost avoidance. Trust reports on the contributions and interventions audits have been disseminated. Data is being used to build business cases, develop ward based KPIs and identify training needs. The main limitation of this study was that the data was only collected for one week and only included work undertaken by pharmacists. Future data collection will involve collecting data each quarter by all ward based pharmacy staff. Another limitation was that the cost avoidance was based on 2007 data, which although is the most recent data, is likely to be an underestimate of current costings, as healthcare costs have increased over this time Work is ongoing at benchmarking the clinical pharmacy service, by comparing data from seven different acute hospitals in three large trusts.
References 1. Karnon J et al. Modelling the expected net benefits of interventions to reduce the burden of medication errors. Journal of Health Services Research & Policy 2008 13: 85 DOI: 10.1258/jhsrp.2007.007011 2. Campbell F et al. A systematic review of the effectiveness and cost-effectiveness of interventions aimed at preventing medication error (medicines reconciliation) at hospital admission. The University of Sheffield, School of Health and Related Research (ScHARR), Sep 07. Available from http://www.nice.org.uk/nicemedia/pdf/patientsafetymedssystematicreview.pdf Accessed 1/2/14
34. An audit of prescribing, storage and administration of insulin at UCLH NHS Foundation Trust. Mistry, K. and Jani, Y. University College London Hospitals, London
Introduction Insulin is a high risk medicine which has been identified as a cause of hospital admissions1.The National Patient Safety Agency (NPSA) received 3,881 dosing error reports between August 2003 – 2009 relating to Insulin, where one death and one severe harm was caused by a 10 fold dosing error, due to the word ‘unit’ abbreviated as ‘U’2. As a result, a rapid response report was published in June 2010. This report recommended the term “units” written in full and for all policies for Insulin to be reviewed. UCLH have a specific policies, which incorporate the national standards for the prescribing, administration and storage of insulin. Additionally a number of changes, such as pre-printed sections on the inpatient chart, and stickers for insulin infusions were implemented to improve the prescribing of insulin. The aim of this project was to assess compliance to the Trust standards for the management of insulin. Objectives To assess if insulin prescriptions written on inpatient prescription charts met the Trust standards as outlined in the Medicines Management policy.
To determine if the storage of insulin in ward areas complied with the recommendations in the UCLH Self-administration of Medicines in Adults Policy and the UCLH Medicines Management Policy.
To assess if administration records for patients on insulin therapy complied with Trust standards. Method This audit was conducted over eight days (from 27.08.2014 to 05.09.2014 – excluding the weekend) at the three main inpatient sites by a pre-registration pharmacist with the aid of a senior pharmacist. The surgical and medical admission wards at the main site were audited once daily, due to high patient turnover; all other wards were audited on a point prevalent basis. An audit tool was designed based on the standards set in the Trust policies and piloted in August 2014. Insulin therapy patients were identified; by contacting pharmacists, nurses, doctors, by reviewing handover sheets, prescription charts and patients notes. All patients on Insulin therapy were included in the audit and data was collected using the audit tool by one pre-registration pharmacist to reduce bias. Data was entered and analysed using Microsoft Excel ®. Results 53 patients were included in the audit (n=53). A third of the patients (18/53) were self-administering their insulin. Table 1: Audit Results
Discussion Overall the compliance to prescribing standards was high; however, in four cases the pre-printed charts and stickers had not been used, resulting in the abbreviation of the term units. Compliance of storage requirements was also high, with only one instance of insulin being stored in an unlocked bedside medication cabinet. See table 1 for results. Nearly a third of the patients were self-administering; which aligns with national recommendations that promote this as a strategy to minimise insulin dose omissions1. The majority of patients who were self-administering their insulin did not have a formal assessment document in their medical records. Generally, the nurses noted they were not aware of such forms and others reported they were aware but thought it was the pharmacist and doctors who complete these forms. This shows a lack of awareness amongst staff of the documentation process involved, ultimately putting both patients and staff at risk. In addition, a limitation of this audit is that it was point prevalent, and does not reflect wider practice. Insulin prescribing, storage and administration within the trust seems to be satisfactory; however, in order to improve standards, clinical staff should be reminded of the policies and also the dangers of insulin if not prescribed, stored or administered as recommended. Further work is required to promote assessment for and application of the Trust self-administration policy. Recommendation: To produce a document of the risks with Insulin therapy and reminders of the procedures in the policy to reduce these risk, which then should be distributed to all staff. References
1. NPSA/2011/PSA003 The adult patient’s passport to safer use of Insulin. 2. NPSA/2010/RRR013 Rapid Response Report, Safer Administration of Insulin
Criteria Standard Compliance
All drug chart prescriptions for Insulin must specify the following: - approved medicine name (Brand only) - dose - frequency of administration (only applicable to regular prescribed
medicines) - route of administration.
100% 52/53 (98.1%)
The letter “U” must not be used to abbreviate the word “UNIT”. (*n < 53 as only handwritten prescriptions were assessed for compliance).
0% 2/15* (13.3%)
Insulin must be kept in a suitable locked area e.g. locked medicine refrigerator or locked bedside medication cabinet
100% 52/53 (98.1%)
The prescription chart must always be signed to indicate administration or an appropriate code recorded if not administered.
100% 53/53 (100%)
All patients that are self-administering insulin must be assessed by a doctor, pharmacist and nurse and a self -administration assessment form must be completed.
100% 2/18 (11.1%)
All patients that are self-administering insulin must indicate their agreement of participation in and understanding of the self-administration scheme.
100% 2/18 (11.1%)
35. Improving transfer of medicines and medicines information between hospital and care homes. Moore S#, Sweeney S* and Alldred A#,
# Harrogate and District NHS Foundation Trust (HDFT), Harrogate, * Yorkshire and Humber Commissioning Support Unit, Harrogate Introduction The Royal Pharmaceutical Society (RPS) links improving medicine information transfer between care settings to a reduction in incidents of avoidable harm, improved patient safety and a reduction in avoidable medicines related admissions and readmissions to hospital.1 It has been recognised that provider organisations must have systems in place to ensure that medicines information is transferred accurately and that those taking over the care of the patient check that they receive, record and act upon this information. Discharge letters (TTOs) at Harrogate and District NHS Foundation Trust (HDFT) are generated electronically and are reviewed by pharmacists to ensure accuracy of prescription and inclusion of drug monitoring requirements and information regarding medicine changes. However, even with these safeguards, discharge from secondary care was identified by Harrogate and Rural District Commissioning Group (HaRD CCG) and care home colleagues as requiring further review. The feedback from listening exercises between HaRD CCG, local care homes and HDFT provided the basis for audit, implementation of changes to the discharge process and re-audit. Aim To undertake an audit to determine the clarity of medicines information included on TTOs and to implement changes to the TTO if necessary. Ethics approval was not required for this audit. Objectives
Audit TTOs for patients discharged to care homes against the following standards o Care home address is documented on the TTO. o Administration times for all medicines are clearly documented on the TTO (e.g. ‘morning’ rather than ‘daily’). o All medicines prescribed less frequently than daily (weekly, 72hrly) have the date of next administration clearly documented. o Area for topical administration is clearly documented. o All ‘when required’ medicines have the time of last dose clearly documented.
Review audit results, carry out intervention and re-audit.
Method 60 patients that were discharged to care homes were identified through clinical coding and their TTOs included in the initial audit. 76 patients were identified in the same way for re-audit 6 months later. The initial audit identified a number of areas for improvement, prompting implementation of changes to the TTO pro forma. A mandatory field for destination on discharge was included and administration time selection was altered to remove ‘daily’; prescribers must select, for example, ‘morning’. Pharmacists were briefed to ensure time of next administration was included for medicines not given daily and that site of application was included for topical treatments. A standard operating procedure (SOP) was developed for pharmacy staff to follow when discharging a patient to a care home. Results See Table 1. All audit criteria improved after intervention with the exception of documentation of last dose of ‘when required’ medication. No direct intervention was identified to address this issue. The criteria that resulted in an ‘electronic’ intervention such as amendment of the TTO pro forma, had greater impact at re-audit than those that required direct pharmacist intervention such as adding the site topical application. Table 1: Audit and Re-audit results
Criteria Initial Audit Re-audit
Care Home address documented 23% 89% Administration times for all medicines are clearly documented on the TTO 15% 98% All medicines prescribed less frequently than daily (weekly, 72hrly) have the date of next administration clearly documented
53% 83%
Site for topical administration documented 42% 76% All ‘when required’ medicines have the time of last dose clearly documented 0% 0%
Discussion The RPS1 and NICE2 both recommend a core content of records for medicines when patients transfer care providers. This is supported by the Professional Standards for Hospital Pharmacy Services and suggests that the healthcare team taking over patient care should receive accurate and timely information about the patient’s medicines.3 Inclusion of place of transfer information as a mandatory field has led to a marked improvement in General Practitioners being informed that their patients have been admitted to care homes. Electronic discharge letters have also been amended to remove ‘once daily’ as an administration choice. Prescribers must now detail what time of the day the dose is due, reducing the ambiguity that was found on the previous audit. Only one of the discharges audited did not include this information. There are many medicines that are administered less often than daily (e.g. weekly bisphosphonates or Fentanyl patches changed every 72 hours) and so clarity of next dose due is paramount to continue appropriate administration. There was a 30% rise in the number of TTOs that included this information, from 53 to 83%. There was also a similar rise in details of non-oral medicine administration (e.g. site of application for creams). In order to ensure continuity of care, Care Home staff should know when next doses of medicines prescribed ‘when required’ can be given. None of the 52 TTOs with ‘when required’ medicines prescribed included this information. This is the only area audited that did not show any improvement since previous audit. Due to the time between pharmacy staff viewing the TTO and the time of discharge, it is not feasible for pharmacy staff to document this information on the letter. Further work is required to establish the best way to facilitate the transfer of this information. The SOP developed alongside this work ensured that care home staff were contacted by pharmacy staff at the point of discharge. This encouraged good communication between care providers, reiterating the written advice included in the TTO. Although not directly identified through this audit, anecdotal feedback from care home staff has shown an improvement in communication at discharge and has empowered care home staff to contact the pharmacy for advice. References 1 Royal Pharmaceutical Society. Keeping patients safe when they transfer between care providers – getting the medicines right. Final report. June 2012. 2 National Institute for Health and Care Excellence. Managing medicines in care homes. March 2014. 3 Royal Pharmaceutical Society. Professional Standards for Hospital Pharmacy Services. Optimising patient outcomes from medicines. July 2012.
36. Accuracy of Chemotherapy Prescribing on Haematopoietic Stem Cell Transplant Prescriptions Musallam, A.L., Kirschke, S., Imperial College Healthcare NHS Trust, London
Introduction National guidance advocates the use of chemotherapy prescription proformas and policies to reduce risks associated with prescribing. As such patients undergoing haematopoietic stem cell transplantations (HSCT) at Imperial College Healthcare NHS Trust (ICHNT) have an individual HSCT protocol written in line with the conditioning regimen prior to admission. This is approved and circulated to ensure that all involved teams are informed. The final HSCT prescription, screened and processed in the Aseptic unit, is generated from the HSCT protocol and is expected to reflect those anticipated drugs and doses. The Adult Stem Cell Transplantation (ASCT) unit was scheduled for re-accreditation by the Joint Accreditation Committee-ISCT Europe (JACIE) in February 2014. One of the assessed standards was the verification of chemotherapy drug and dose against the HSCT prescriptions and its protocol. This audit aimed to determine the accuracy of prescribed chemotherapy drug and dose on HSCT prescriptions in line with HSCT protocols and whether documentation was in place if deviations occurred. Objectives (will be referred to as audit standards throughout) 1. From 1st June 2013 to 30th November 2013, 100% of all chemotherapy drugs on HSCT
prescriptions are in line with the HSCT protocol for the respective patient.
2. From 1st June 2013 to 30th November 2013, 100% of all chemotherapy doses on HSCT prescriptions are in line with the HSCT protocol for the respective patient (Within +/- 5% of the dose as per the ICHNT Clinical Chemotherapy Services Operational Policies).
3. From 1st June 2013 to 30th November 2013, where a chemotherapy drug or dose on a HSCT prescription deviates from the HSCT protocol for the respective patient, a reason will be documented in 100% of occurrences (HSCT prescription dose deviations are defined as >5% of the dose on the HSCT protocol).
Method Chemotherapy records were retrospectively analysed in Aseptics at ICHNT for patients who underwent HSCTs between 1st June 2013 and 30th November 2013. Patients were identified on the 2013 Pharmacy HSCT database and the chemotherapy drug and dose on HSCT prescriptions was compared against the HSCT protocol. The data collection tool was not piloted as the prescriptions and protocols were accessible from within Pharmacy and data was input into an Excel Spread-sheet simultaneously. The dispensing patient medication record and medical notes were accessed where paper copies of the HSCT prescription were unavailable. A Clinical Pharmacist accredited to screen chemotherapy collected data and formed tallies using Microsoft Excel functions to report results. Ethical approval was sought to access medical notes. The conditioning protocols included in the audit were for Chronic Myeloid Leukaemia (CML), Acute Leukaemia, Multiple Myeloma (MM), Lymphoma, Haplo-Identical Transplantation, Reduced Intensity Conditioning (RIC) Allograft for non-Hodgkin's and Hodgkin's Lymphoma, RIC-HSCT-CML and MM and Germ Cell Tumours. The Cutaneous T-Cell Lymphoma conditioning protocol was excluded because it was undergoing review during this audit. Results Audit standard 1 was met but standards 2 and 3 were not:
Audit Standards Result
1. Percentage of chemotherapy drugs on HSCT prescriptions in line with the HSCT protocol for the respective patient
100% (55/55)
2. Percentage of chemotherapy doses on HSCT prescriptions in line with the HSCT protocol for the respective patient
91% (50/55)
3. Percentage of documented dose deviations on HSCT prescriptions 60% (3/5)
Of these, 3 were due to renal function and 2 for patient weight:
2 chemotherapy doses were reduced for deteriorated renal function and 1 was increased as renal function improved during the period leading up to the conditioning. All the dose changes regarding renal function were instigated by the screening Pharmacist and documented on the prescription.
2 doses were reduced due to weight loss. Despite the doses being appropriate at the time of prescribing, these deviated by >5% from the HSCT protocol dose and were not documented on the prescription.
Discussion & Conclusion Although standards 2 and 3 were not met, the majority of prescriptions were accurate. In 5 instances it was necessary to adjust the dose to the patient’s physiological or biochemical profile at the time of the procedure. These 5 HSCT protocols were not updated to reflect chemotherapy dose changes. National guidance is clear in stating that any deviations from the HSCT protocol must be explicit, unambiguous and recorded. Documentation must be improved in the designated sections of the HSCT prescription proforma. Direct feedback was given to the screening Pharmacists and the audit report was disseminated to all chemotherapy accredited screening Pharmacists at ICHNT to reiterate the principles of the ICHNT Clinical Chemotherapy Services Operational Policies. The results were discussed with prescribers at the monthly JACIE Quality Meeting prior to the JACIE reaccreditation. Practice will be audited annually. References 1. Imperial Hospitals NHS Trust Clinical Chemotherapy Services Operational Policies Version 2.08, 25th June 2012, p40 of 99 2. FACT-JACIE International Standards for Cellular Therapy Product Collection, Processing, and Administration Fifth Edition, Version 5.3, March 2012 3. NPSA Guidance from “A themed review of patient safety incidents involving anti-cancer medicines 1 November 2003 – 30 June 2008”. Published October 2010 4. JACIE Conditioning Protocols accessed via the Imperial Intranet for Haematology, Division B: Surgery, Cancer and Cardiovascular (accessed November 2013)
37. Using the Guardrail "smart" infusion devices in Critical Care: What are the views of the users? Negandhi P; Shah S; Fischer A., Royal Brompton and Harefield Hospital NHS Foundation Trust, London, United Kingdom.
Introduction Infusion pumps offering smart software technology was introduced to all adult critical care areas in our specialist tertiary hospital in 2011. Smart infusion pumps (SPs) incorporate software which allows specific pre-installed drugs to be chosen from a library. Each drug is associated with a pre-set standard concentration plus a soft and hard infusion rate limit. The pumps have 3 modes that can be chosen by the user at set-up: “DRUG” mode (smart software) provides alerts based on pre-set limits in the drug library, “DOSING” mode supports the operator by taking a patient’s weight and dose units into account and calculating the rate, and “ml/hr” mode which does not provide additional support but allows the pump to be set up faster. If a prescribed drug is not included in the drug library, either the “DOSING” or “ml/hr” modes must be used. Where a user attempts to programme a pump outside of the pre-set limits in DRUG mode, a “Guardrail” event is logged by the software. Data obtained from the pumps three years after implementation showed encouraging results; There were in excess of 5000 “Guardrail” events, of which 457 (8.8%) were hard limit alerts. A substantial portion (23%) of these hard limits involved users attempting to set an infusion rate more than twice that of the maximum hard limit1. The software may have been a valuable asset in preventing significant infusion related errors. In spite of the clear clinical benefit that the software demonstrates, current uptake of the DRUG mode stands at an average of 75%1. Aims and Objectives In order to achieve an increased usage of DRUG mode, this study set out to identify the factors that influence medical and nursing staff to select infusion modes other than the DRUG mode when administrating intravenous (IV) infusions. Method An online questionnaire (via Survey Monkey) was designed and trialled between 29/10/14 - 31/10/14 to the band 7 Practice Nurse Educator and a Consultant Anaesthetist. Modifications were made according to the feedback provided. The survey was distributed as a paper copy of the Survey Monkey questionnaire or as an online link over a period of two weeks. The inclusion criteria were critical care staff across the Trust. Staff selection was at convenience; with both day and night shift SPs operators across all critical care units invited to participate over the observation period. The responses of the survey were collated onto an excel spreadsheet and analysed to identify any trends between responses. Ethical approval was not required as this was a quality improvement project. Results 60 participants (5 doctors, 44 nurses and 11 who did not disclose their occupation) in six critical care units completed the questionnaire between 3/11/14 and 14/11/14. Figure 1 shows the responses to the factors that influence nursing and medical staff when selecting the DRUG mode. 80% (39/49) felt that the software reduced medication errors, 86% (45/52) deemed the software simple to use, 76% (37/49) positively agreed that the desired drug was available in the drug library, 69% (35/51) were of the opinion that the prescribed drug was within the pre-set configuration of the drug library, 87% (45/52) considered the time to set up the infusion using DRUG mode to be reasonable and 84% (42/50) thought that the frequency of alarms did not dissuade them from using the DRUG mode. When asked what additional drugs should be added to the existing drug library, common responses were magnesium, piperacillin/tazobactam and levosimendan. 85% (45/59) of respondents believed that the smart software should be rolled out to the volumetric pumps. With regards to the training provided on how to use the software, 64% (28/44) felt that they had sufficient training to use the devices. Of the 16 participants who felt that training was insufficient, 12 (75%) were junior nurses at band 5 and 6 level (with 7 out of the 12 nurses having between 0-2 years of experience.) Figure 1: Responses to the question “Please indicate the degree to which the following factors influence you when selecting the DRUG mode.”
Discussion and Conclusion The survey has shed light on views that the critical care staff hold regarding smart software, which essentially influences its use when administrating IV infusions. The results described in Figure 1 show that the nursing and medical staff found DRUG mode to be a useful feature on the devices as it was simple to use and perceived to be associated with a reduction in medication errors. Positive comments by respondents included “It makes drug administration easy and reduces drug error”, and “very useful.” Constructive criticism examples included “more training for junior staff.” Limitations of this survey were a relatively small cohort of participants and a number of partially completed responses on the paper copies. Although the response rate was lower than expected, the authors feel that the mix of participants was representative of the critical care workforce. To improve the uptake of the smart software feature, focus should be on training new and junior staff on the devices, updating the existing drug library to incorporate the additional drug suggestions made and rolling out the software to volumetric pumps. The authors propose a follow-up review to ascertain the impact of implementing such improvements. A more favourable staff perception towards DRUG mode and an increased uptake outcome would indicate that the findings of this quality improvement project have been successfully addressed. References 1) Shah S, Fischer A, Hunter D. Uptake and impact of smart infusion pump technology in a cardiothoracic intensive care unit three years on from its
implementation. The Royal Brompton and Harefield NHS Foundation Trust. Report number: 1, 2014.
05
101520253035
Reduction inmedication
errors
Simplicity inuse
Drug notavailable
Prescribedrate of
infusionoutside
preset range
Too long toset up
Frequentalarms
Always
Often
Seldom
Never
Blank
38. The use of Always Events in a survey of inpatients’ experiences with their medication and the clinical pharmacy service Onatade R, Gujral S, Phul N, Pamanathan K, Torku A, Sawieres S and Oputu T
Background The Royal Pharmaceutical Society’s Professional Standards for Hospital Pharmacy Services1 provide guidance on best practices for hospital pharmacy. At this Trust, our clinical pharmacy service’s lowest level of compliance was with two standards – (3.1) Patients are given information about their medicines and have expressed needs for information met and (8.2) Feedback from patients informs the development of the service. We recognised that we did not know enough about the experiences patients were having with their medicines and the pharmacy service. ‘Always Events’ are aspects of the patient experience that are so important to patients and families that health care providers must perform them consistently for every patient, every time2. The use of Always Events supports continuous improvement of the patient experience and service delivery. Asking patients about Always Events is another method of gaining feedback about a service. Currently there are no defined pharmacy or medicines-related Always Events in the literature. Objectives 1. To derive a list of Always Events relevant to inpatients’ experiences with their medication and the pharmacy service 2. To develop and conduct a simple survey to measure the occurrence of Always Events and improve our ability to meet RPS standards
Methods A literature search was carried out using PubMed and EMBASE. Short interviews with doctors, nurses and pharmacists were also conducted. Questions asked were -‘List 5 important points that an inpatient should always be told about their medication’; ‘If you were an inpatient in this hospital what 3 things would you want to experience with your medicines?’ and ‘If you were an inpatient in this hospital what 3 things would you NOT want to experience?’ Responses were combined with the information from the literature to produce a list of possible Always Events which were incorporated into a patient survey. Approval to approach patients was obtained from the Patient and Public Involvement (PPI) department. Issues assessed during the pilot phase included - time taken to complete the questionnaire, patients’ interpretations of the questions, the quality of answers, and how to administer the survey. Pilot responses were also used to compile a list of common answers which could be included as prompts in the final survey. Three pilot rounds were needed. The final questionnaire was approved by the PPI department. 100 patients (50 from cardiac and acute medicine wards on one site and 50 from all wards on the second site) and were approached for the final survey, which took place over 5 days in 2014. Inclusion criteria were - over the age of 18, in hospital for more than two days, understood English, and had the capacity and capability to answer the survey questions. Ethics approval was not required as this was a service evaluation.
Results Eleven potential Always Events were identified. Three deemed most easily measured and within the control of ward pharmacy staff were chosen as the focus for the survey. 1. Patients should always be aware of common side effects of their medication 2. Patients should receive enough information* about their medication from their pharmacist 3. Patients should always be told about any update to their medication; any new medication or if medication has been stopped *’Enough information’ as defined by the patient. Piloting showed that all patients should be offered help to complete the questionnaire, although not all would need it. On average, the questionnaire took 8 minutes to complete. The final questionnaire had five sections. Some sections asked patients to tick the applicable statements, whilst others where Y/N questions. Table 1 shows the main results.
Table 1. Key results of the patient survey
Questions Replies (n= 100)
Information about your medicines
I received information on my medication without request*
The side effects of my medication were not explained to me*
My questions were answered adequately
My questions were not answered at all
The reasons for my medication changes were not explained to me
I received enough information about my medication*
Someone from the pharmacy team gave me the information about my medication*
57% 40% 50% 7% 20% 70% 34%
Improvements you would like to see in the medication service provided
I would like to receive more information on the side effects of my medication*
I want more information about the reason for my medication
I want someone to check with me if my medication is effective and adequate
The pharmacist should spend more time consulting with the patient
41% 35% 31% 25%
Have you experienced problems with your medication during your stay?
I have experienced problems with my medication during my stay o I spoke to a nurse about my problem o I spoke to a doctor about my problem
I have not had a problem with my medication o If I did have a problem, I would speak with a pharmacist
Did not answer
22% 19/22 3/22 65% 10/65 13%
*relates to Always Events
Discussion/Conclusions This study shows that it is possible to develop and measure Always Events, to obtain information on needed improvements in a clinical pharmacy service. The use of Always Events is not common within the NHS. Yet they provide a simple and effective way of defining important aspects of the patient experience and then improving on them. Limitations – Patients who did not understand English could not be surveyed. There are likely to be differences in their experiences and needs and therefore we are assessing appropriate mechanisms to ensure we do not continue to exclude this patient group (e.g. translating the survey). Our results show that we are not meeting the medicines information needs of many of our patients. This is therefore one of our main areas of focus. We have now defined some standards for the way pharmacy team members interact with patients on the wards. Staff should always identify themselves to patients by name and role, and at least twice during their stay, patients should be asked if they have any questions. Appropriate written and verbal medicines information should also be provided proactively. All staff have access to a website which provides customisable patient information leaflets. All clinical staff are required to undertake the CPPE consultation skills training. These actions will increase pharmacy contact, and our visibility, with patients, and give patients the opportunity to ask questions and provide feedback. Introducing these actions is not expected to increase staff workload, instead, it will focus our efforts on providing a patient-focussed service. The patient questionnaire has been refined and we plan to introduce regular (monthly/bimonthly) surveys of a small sample of patients and feeding back to staff on our performance against the Always Events.
References 1. Royal Pharmaceutical Society (2012). Professional Standards for Hospital Pharmacy Services: optimising patient outcomes from medicines. RPS, London:
39. Multi-Drug Resistant Tuberculosis Monitoring Guidance: Are we following the national guidelines? Parmar S, Singal R, and Khachi H., Respiratory Pharmacy Department, Barts Health NHS Trust, London
Introduction Multi-Drug Resistant Tuberculosis (MDR-TB) is a form of TB that is resistant to the two most powerful first-line anti-tuberculosis antibiotics available, rifampicin and isoniazid. Between 2004 and 2011, the proportion of cases with MDR-TB increased from 1.2% to 1.6%, of which it has remained stable over the past 3 years. Due to the complexity of treatment regimens used for MDR-TB, national monitoring guidelines have been developed by the British Thoracic Society (BTS) to aid monitoring for adverse effects during treatment 1, 2. A previous study identified that prior to the development of these monitoring guidelines the incidence of adverse effects associated with MDR TB medicines was high, with 38.9% reporting nausea and vomiting, 27.8% hearing loss, 27.8% tinnitus, 11.1% hepatic impairment and 5.6% renal impairment amongst others3. In a tertiary centre for MDR TB, an audit was undertaken to assess the adherence to these guidelines. Objectives Assess the level of adherence to national monitoring guidelines at a large MDR TB centre. Standards 100% of all baseline and on-going monitoring parameters must be carried out throughout treatment in accordance with the guidelines for each drug prescribed. Method Ethics approval was not required as part of this audit. MDR-TB patients currently on treatment were identified from the TB clinic. A data collection form was designed and piloted over two days prior to undertaking the audit. The data collection form included all aspects as specified by the BTS MDR TB monitoring guidelines, including baseline monitoring and ongoing monitoring as per each individual drug used. The frequency of monitoring was also carried out for each parameter discussed in the guidelines. Patient notes and clinical records were used to establish patient’s MDR-TB regimen and reviewed as part of data collection. Frequency of monitoring from initiation date until present date was recorded. Results were analysed by comparing frequency of monitoring carried out by the clinic in relation to the frequency recommended in the guidelines. Data collection took place within a two week period in November 2014. Results 9 patients with MDR-TB were included. The findings (see Table 1) show that baseline monitoring was not undertaken in the majority of patients.
Whilst on-going monitoring was predominantly undertaken in over 80% of occasions, the audit standard was not met.
Table 1: Percentage adherence of monitoring against UK MDR-TB guidelines.
Drug Number of patients taking drug [n=9]
Baseline monitoring carried out (%)
On-going monitoring carried out (%)
Drug specific monitoring carried out (%)
Amikacin 6 58% 85% 91%
Capreomycin 1 81% 85% 100%
Clofazamine 3 71% 90% 55%
Co-amoxiclav 3 38% 77% N/A*
Cycloserine 9 61% 82% 91%
Ethambutol 4 64% 84% 52%
Linezolid 4 66% 82% 48%
Moxifloxacin 6 72% 84% 17%
PAS 4 53% 82% 94%
Prothionamide 8 60% 83% 53%
Pyrazinamide 3 46% 71% N/A*
Rifampicin 1 69% 72% N/A*
*Drugs did not require specific monitoring, according to drug monographs RED = <80% AMBER = 80 - 99% GREEN = 100%
Discussion/Conclusion Despite the presence of national guidance to support the monitoring of complex regimens for MDR-TB, this audit shows that monitoring of these in a tertiary centre is below the audit standard. Whilst adherence to on-going monitoring parameters were usually undertaken in over 80% of instances, it is of particular concern that baseline monitoring was significantly below the audit standard. Specific parameters that were poorly monitored included uric acid levels, G6PD deficiency screening and nutritional assessments. Recommendation of an educational training session to all personnel involved in the monitoring of patient drug treatment would be a suitable approach to enhance the service currently in place. This would be of particular value within hospital settings where patients are often admitted at initiation of their drug regimens. Whilst patients are in an in-patient setting, it would be of particular importance that all ward staff and healthcare professionals involved in the care of the patient are aware of the impact of suboptimal monitoring. Furthermore, the development of electronic systems that can flag up which monitoring parameters are required at a given time point could also significantly improve the adherence to these guidelines. As the experts of drug therapy, pharmacists are ideally placed to support the safe and effective monitoring of these toxic medicines. The development of a pharmacist to support the TB clinics and the monitoring of patients with MDR-TB could significantly improve this adherence and reduce the risk of adverse effects owing to sub-optimal monitoring. References: 1. Lalor MK, Pedrazzoli D, Davidson J, et al; Tuberculosis in the UK: 2014 Report; Published by Public Health England; 2014. 2. Potter JL and Capstick T; A UK based resource to support the monitoring and safe use of anti-tuberculosis drugs and second line treatment of
multi-drug resistant tuberculosis; First published May 2014, Latest update January 2015. 3. Keal JL, Khachi H, Hanzaree E, et al; Treatment of multidrug resistant tuberculosis: where are the guidelines for monitoring?; Thorax; 2011; 66;
Suppl 4 A91.
40. An audit of adherence to NPSA (National Patient Safety Agency) report alerts on insulin prescribing and administration Patacconi, K and Purcell, J; Norfolk and Norwich University Hospital (NNUH), Norwich
Introduction Insulin is frequently included in the list of top 10 high-alert medicines1. Errors involving the wrong insulin product, omitted, delayed or incorrect insulin dose accounts for 60% of insulin-related adverse drug events reported in the UK2. The NPSA has issued a number of insulin-related alerts within the last 4 years; their scope is to ensure that the insulin products that patients use are correct, that the dose is right and that, where appropriate, patients self-administer their insulin in hospital. The National Diabetes Inpatient Audit (NaDIA) provides both a local and national picture of inpatient diabetes management3. Data collected over the past 3 years has highlighted that 40% of patients with diabetes experience medication errors during their hospital stay3. The aim of this audit was to determine the safety of insulin prescribing on medical and surgical wards at NNUH.
Objectives To ascertain the level of adherence to NPSA alerts in patients receiving insulin and the quality of insulin prescribing within the Trust.
Standards 100% of patients have prescribed: (1) correct insulin, (2) correct device, (3) insulin at the correct time/ frequency, (4) units in full, (5) insulin on admission. 100% of patients: (6) do not miss any doses of insulin, (7) have any dose changes clearly made. Additionally the audit tried to determine how many patients self-administer their insulin whilst in hospital, how many have an insulin passport or any other documentation detailing their insulin, and where the patient’s insulin is stored on the ward. The use of an insulin passport is not supported by our Trust therefore it was not deemed to be recognised as a standard.
Method The ethics approval was required and obtained. A data collection form was designed and piloted on 5 patients. After the pilot some changes were made to the collection sheet. Data collection was carried out by the author over a 5 day period between 25th and 29th of August 2014 (Monday to Friday) by visiting different wards every day. The patients treated with insulin were identified from nursing handovers or by approaching nursing staff where handovers were unavailable. 10 medical and 8 surgical wards were audited and data was extracted from patients’ charts and through the consultation with the patients. The inclusion criteria were adult patients who were on regular insulin treatment.
Results 36 patients were included in the audit data. 25 patients (69%) were male and 11 (31%) were female. The mean age was 68, (SD 17.8). 19 (53%) of patients were present on a surgical ward whereas 17 (47%) were present on a medical ward. 28 (77%) of patients brought their insulin into the hospital and 18 (50%) of them self-administered insulin whilst inpatient. 21 (58%) confirmed as having an insulin passport or similar document which states what dose of insulin they are taking, but only 6 patients (28%) brought the document with them. The insulin in use was stored in equal proportion in the ward fridge, POD locker or on the bedside table. The adherence to the audit standards is presented in figure1.
Figure 1: Percentage adherence to the audit standards by different type of ward.
Discussion The results showed that the compliance with standards 1 and 4 was very good on both types of wards. 77% of patients brought their insulin to the hospital allowing for the correct name of insulin to be confirmed during clerking. However, this did not always mean that the correct device was prescribed (standard 2). The timing and accuracy of insulin dosing (standard 3) was poor. Possible reasons for this could be the lack of a reliable source of the patient's usual dose, or that the patient’s condition on admission required a dose change. There was a lower adherence to standard 5 (insulin prescribed on admission) and 6 (no missed doses) on surgical wards. This is likely due to more surgical patients being prescribed continuous variable rate infusions whilst in the peri-operative period. There is persistently inaccurate and unclear prescribing when dose changes are made (standard 7); this weakness should be addressed. There were a number of limitations such as: the small sample size due to inability to cover the whole hospital during the audit collection, the fact that data collection relied on accuracy of nursing handover or reliability of nursing staff and that there was no particular order in which different wards were visited over the 5 days.
Recommendations: To produce an additional paragraph in the local medicines policy on how to amend the insulin prescription on the chart in order to avoid unclear prescriptions. To include advice on insulin prescribing and dose changes in the e-training for junior doctors. To reach local consensus regarding an insulin card or a monitoring book which each patient would use and be recommended to bring with them to the hospital. To encourage more patients to be in charge of their insulin treatment by including more patients in the self-administration scheme. To utilise the available posters with pictures of different insulin devices available and attach it on wards where doctors clerk patients.
References: (1) Rapid Response Report “Safer administration of insulin” NPSA/2010/RRR013 Supporting information June 2010 (2) Patient Safety alert NPSA “The adult patient’s passport to safer use of insulin” NPSA/2011/PSA003 Supporting information March 2011 (3) “National Diabetes Inpatient Audit 2012” in partnership with HQIP and Diabetes UK at http://www.diabetes.org.uk/Documents/Reports/NaDIA-annual-report-
2012-0613.pdf (accessed 20/8/14)
0 20 40 60 80 100
(1) insulin type correct(2) device correct
(3) time and dose correct(4) units in full
(5) insulin prescribed on admission(6) no missed doses
41. An audit of the number and types of medication-related interventions made by pharmacists when clinically screening inpatient prescriptions at Northwick Park Hospital. Patel G, Jivraj M, Sanghera I. London North West Healthcare NHS Trust
Introduction Pharmacists routinely make clinical interventions as part of their daily duties on the wards and in the dispensary when clinically screening prescriptions. Often this involves identifying medication-related errors where there has been an error in the process of prescribing, preparing, dispensing, administering, monitoring or providing advice on medicines.1 These errors cost the NHS approximately £200 – 400 million per year.3 Results of a previous collaborative audit looking at the quality of written hospital discharge prescriptions showed that only one third of prescriptions were safe requiring no pharmacist intervention.2 This highlights the importance of a pharmacist’s role during the clinical screening process. Aim To audit the number and type of medication-related interventions being made by pharmacists when clinically screening inpatient prescriptions, and to assess their clinical significance. Objectives
To identify the number and types of interventions being made by Pharmacists when screening in-patient drugs charts and discharge prescriptions.
To assess the clinical significance of these interventions – using the NPSA Grade of Patient Safety Incident.4 Method A snapshot audit was conducted by Pharmacists on 32 wards over one day at Northwick Park Hospital site. 650 inpatient drug charts were screened on the wards and in the dispensary. Details of each intervention were recorded on a specifically designed “Pharmacy Clinical Intervention Form”. Each intervention was then graded by the pharmacist making the intervention, using the NPSA Grade of Patient Safety Incident definitions.4
Results From analysis of the data, a total of 346 medication-related interventions were recorded. Table 1 below shows that 27 pharmacists spent over 55 hours making these interventions, with an average time of 10 minutes being spent per intervention. On average, 1 in 2 patients (53%) required some form of pharmacist intervention. Table 1: Audit results
Total number of interventions 346 Total time spent making interventions (minutes) 3314 Total number of patients 650 Total number of wards 32 Total number of audit pharmacists 27 Average time spent making one intervention (minutes) 9.6 Average number of interventions per patient 0.5 Average number of interventions per 25 beds 13.3 Average number of interventions per pharmacist 12.8
Discussion The majority of these interventions were made on the wards where a pharmacist provides a full day service, compared to the traditional one-hour service. The highest numbers have been recorded on the admissions, critical care and high dependency wards, where pharmacists are making an average of at least one intervention for every patient seen. Pharmacists are also making more clinical interventions when screening prescriptions on the ward (96.5%) compared to in the dispensary (3.5%) – this reflects the findings of a previously reported collaborative audit.4 In terms of the types of interventions being made, the majority (29.8%) were related to the patient’s drug history medication, of which 71% were omitted drugs. Pharmacists are also contributing by asking the prescribing team to review the dose and/or frequency of medication (15.3%), to clarify inpatient prescriptions (12.7%) and to review the need for drug therapy (21%). In order to give the interventions clinical significance, each pharmacist scored their interventions using the NPSA Grade of Patient Safety Incident definitions.2 Although this is a subjective method of scoring, it was used to show the level of harm prevented due to pharmacist contribution and to determine how different pharmacists view the significance of their interventions. Data shows that interventions were judged to have averted low (25.1%), moderate (9%) or severe (1.7%) patient harm due to pharmacist intervention. Conclusion Pharmacist contribution on the wards is having a significant impact on the number of medication-related errors that are avoided. Over half of audited inpatient drug charts required some form of pharmacist intervention in order to improve the clinical quality of prescriptions and increase patient safety. Pharmacists are making more contributions on wards receiving an all-day pharmacy service, in particular on the admissions and high dependency wards. The move to have more pharmacists on the wards for the majority of the day can only help to improve this. In addition, by integrating pharmacists into the multidisciplinary team (MDT), for example by attending ward rounds and MDT meetings, will create further opportunities for intervention, increase the level of clinical input and subsequently reduce the potential for medication-related prescribing errors. Limitations of the audit included time, staff shortages, subjective pharmacist scoring, and incomplete data collection forms. Therefore, the data collected may not be a true reflection of the number of clinical interventions actually made by pharmacists on a daily basis. Proposed future work: To validate results by re-grading interventions retrospectively by a multidisciplinary team. To repeat the audit to allow for comparison of data. This abstract describes an audit, therefore ethics approval was not required. References 1. MHRA Patient Safety Alert. Improving medication error incident reporting and learning. Supporting information. 20 March 2014 (accessed 18
January 2015). 2. Medicines Use and Safety Division, SPS. Executive Summary: Improving safe and accurate transfer of medicines-related written discharge
information: A pharmacy-led collaborative audit and service evaluation. Dodds, L. May 2013 (aaccessed 4 December 2014). 3. Department of Health. Building a safer NHS for patients: Improving medication safety. January 2004 (accessed 19 January 2015). 4. National Patient Safety Agency. Being Open. Communicating patient safety incidents with patients, their families and carers. Appendix B: NRLS
terms and definitions for grading patient safety incidents. November 2009 (accessed 4 December 2014).
42. Evaluation of a Medication Review Project in Care Homes in Sefton Ramsbottom H, Prescott B. Southport and Formby/South Sefton Clinical Commissioning Group
Introduction Around 352,700 people live in care homes in England and Wales, or 6.1 per 1000 population. Of these, 82.5% are aged 65 or older, compared to 16% of the general population.1 Age related changes in pharmacokinetics and pharmacodynamics make older people particularly susceptible to the adverse effects of medicines. The Care Homes Use of Medicines study (CHUMS) found that care home residents take an average of 8 different medicines each day.2 This compares to an average of 4.4 drugs per patient in one general population study.3 Care home residents appear to be more at risk of medication error than other groups: 70% of patients in CHUMS had at least one error.3 This compares to 47% of patient receiving 10 or more items (ie an even higher number of medicines) in general practice.3 Inappropriate prescribing may occur in 50–90% of care home residents.4 Despite this, a survey of UK care homes found that 44% of residents did not have a regular planned review of their medicines.4 NICE states that medication review in care homes should be led by a dedicated care home pharmacist and should take place at least annually for all residents.4
In light of this evidence, and the density of the local care home population (approximately 10.5 per 1000) two Clinical Commissioning Groups (CCGs) invested in more practice pharmacist time to commit to a “care home review service”. This reflected on the pharmacist being a trusted expert within primary care, with flexibility to meet the needs of patients and work with busy primary care colleagues. Objectives To evaluate the effect of clinical medication reviews on prescribing quality, safety and cost for patients within residential and nursing homes across the two CCGs. Methods Medication reviews were carried out by clinical primary care pharmacists. The pharmacists visited GP surgeries to gather background information about the patients and their medication, then visited the care homes to conduct a review of all medicines taken by the patients with a senior member of care staff and the patient and/or their family where appropriate. Any interventions that could not be made directly during the visit were taken back to the patient’s general practitioner (GP) for their input. The six-month period from 1st June to 30th November 2014 was used for this analysis. Details of actions undertaken during the reviews were entered onto a confidential web-based ‘sharepoint’ by the pharmacists. Any significant events identified were logged separately. As this was a service evaluation, ethics approval was not required. Results Six hundred and ninety one medication reviews were recorded during the analysis period, leading to 2132 interventions (mean three per patient). Of these, 1795 (84%) were accepted by the patient’s GP. Following these reviews, 599 medications were stopped, 450 medicines were changed (eg dosage change) and 142 new medicines were started. Three hundred patients (43%) required monitoring carrying out for one or more medicines. The average prescribing cost saving made per patient was £138 (calculated using annualised drug cost using the Drug Tariff). This gave a total saving of £81,771 across the two CCGs for the six month period studied. Fifty seven significant events were recorded during the six-month period, and 63 admissions were potentially avoided as evaluated subjectively using the pharmacists’ own clinical judgement. These interventions involved a total of 94 patients, so whilst in some cases the same intervention may have been classed as both an avoided admission and a significant event, this was not usually the case. Examples of significant events included:
Hyperkalaemia/renal failure with Ramipril (routine monitoring not completed).
Patient with past medical history of oesophageal ulcer unable to take alendronic acid properly (patient does not mobilise unaided so was at low fracture risk).
Incorrect discharge information from hospital leading to patients missing medication or having incorrect doses.
Patient at risk of falls able to mobilise unaided following review of antihypertensives. Discussion The results of this service evaluation add to evidence that a significant number of interventions can be made when pharmacists, GPs and care home staff conduct a medication review together. The reviews conducted during this project generally resulted in a reduction in the number of medications prescribed (net decrease of 457 medicines or 0.66 per patient). As the likelihood of adverse events increases with the number of medicines prescribed3 this could be expected to improve safety for the patients reviewed. Safety was also improved by ensuring outstanding monitoring was completed appropriately. In addition, prescribing costs were reduced by the review process. Most interventions proposed by the pharmacists were accepted by their GP; some of those that were not were rejected after a consideration of the risks and benefits of that course of action by the GP, the pharmacist and the patient or their carer. Thus the percentage of ‘concordant’ decisions reached would have been higher than 84%. Completing the medication reviews was more time consuming than originally anticipated. A review involved background research, visiting the home, formulating recommendations for the patients’ GP, collecting feedback from the GP and implementing any changes. Although most recommendations were accepted by GPs, considerable flexibility was needed by the pharmacists to present their interventions in a format suitable for each GP. Pharmacist prescribing is one possible solution which might reduce the burden of this on both the pharmacists and the GPs. However it is likely that a high proportion of clinical interventions (eg the decision to stop long term medication where a risk:benefit analysis is needed) would still require discussion with the patient’s GP. To quantify the time taken per review more accurately, the pharmacists will be recording the time spent on each review going forwards. As the evaluation of admissions avoided due to the project was subjective, a peer review of the interventions logged as significant events is planned. This, along with reflections to be gathered from care home staff, managers and GPs will help to confirm the benefits of the service on quality of patient care. References 1. Office for National Statistics. Changes in the Older Resident Care Home Population between 2001 and 2011. London. 2014 2. Barber ND, Alldred DP, Raynor DK et al. Care homes use of medicines study: prevalence, causes and potential harm of medication errors in
care homes for older people. Quality and Safety in Health Care 2009; 18(5): 341-346 3. Duerden M, Avery T, Payne R. Polypharmacy and Medicines Optimisation: Making it Safe and Sound. The King’s Fund. London. 2013. 4. National Institute for health and Care Excellence. NICE SC1. Managing medicines in care homes. London. 2014
43. Evaluation of pharmacist contributions to the care of inpatients in Community Hospitals Rogers T, Livingstone C, Nicholls J, Wolper S. NHS Specialist Pharmacy Service, England.
Background Community Hospitals with inpatient facilities provide an alternative to acute hospital care and the level of dependency of their inpatients has increased over the last ten years. The provision of a prescription review service by pharmacists to these type of beds is often resourced according to historical patterns of service and may not reflect the severity and morbidity of the current patient population. Pharmacist interventions in the care of patients in acute hospitals have been shown to reduce the risks associated with medicines,1,2 but the contribution by pharmacists to patient care in community hospitals has not been published previously. Objectives This collaborative evaluation aimed to quantify the types of pharmacy interventions and their potential impact on the care of inpatients in community hospitals. Method Fifteen organisations with community hospitals within East and South East England registered to take part in the collaborative evaluation. Pharmacists providing a prescription review service to inpatients in community hospitals were asked to record interventions made to inpatient care every time they reviewed an inpatient medication chart over a 14 day period during November 2013. A pharmacy intervention was defined as: ‘An intervention which results in the correction of a prescribing/transcribing error or the provision of pharmaceutical advice which optimises the patient’s care’. 3 Participants were asked to record the type of care, the stage in the patient’s care, the number of medicines prescribed, whether the allergy status was recorded and where the pharmacist made an intervention they we asked to record the name of the drug, record the type of intervention and then self-assess the clinical impact of their intervention according to a framework similar to that used by Dodds,3 adapted from the National Reporting and Learning System (NRLS).4 Data were submitted on the frequency of pharmacy visits. Ethics approval was not sought as the study was a service evaluation. Organisations remained anonymous and patients were not identifiable from the data collected. Results 4077 medication charts (equating to 52,033 medication orders) were screened by pharmacists, an intervention by a pharmacist was made on 1 in 3 (37.7% (1537)) of these charts for one of more medications. A total of 2782 pharmacy interventions were made. The majority of interventions made were categorised as a prescribing error (67%, 1872/2782). The remainder (33%, 910/2782) included administration issues and of these, omitted and delayed medicine administration was the most common intervention (11%; 298/2782). The clinical impact of these interventions, as self-assessed by the pharmacists, is given in Table 1. Table 1. Clinical Impact of Interventions (n=2782)
Level 1 - None/Insignificant 681 (24.5%)
Level 2 – Low/Minor 1225 (44.0%)
Level 3 – Moderate 769 (27.6%)
Level 4 – Severe/Major 107 (3.9%)
The number of regular medicines being taken ranged from 0 to 25 (mode 8). When ‘as required’ medicines were included the range went from 1 to 29 medicines (mode 11). The frequency of pharmacy clinical visits ranged from 1 to 5 times a week with a median of 2 visits per week. 30% (839/2782) of interventions were made at the point of admission; the majority of interventions (62%, 1717/2782) were made at a subsequent point during the patient’s stay and the remainder at the point of discharge. When interventions were considered by the pharmacist to be Level 4 the most frequently involved medicines belonged to the following five groups: antibacterials, anticoagulants, bisphosphonates, insulins and opioid analgesics. Discussion Pharmacists reported intervening to improve the care provided to over a third of the patients within this study. Of these a third, if left undetected, might have led to moderate or severe harm to the patient and an associated increased length of stay or other detrimental sequelae. 62% of the pharmaceutical interventions were made during the patient’s stay, rather than on admission (30%). This may be because pharmacy-led medicines reconciliation was not undertaken within 24 hours of admission due to the infrequency of the clinical pharmacy visit. Typically a community hospital would receive a pharmacist visit on 2 days a week. However it may also be due to the fact that medication changes were made during the admission which subsequently required a pharmaceutical intervention to optimise patient care. Organisations need to be aware that medication changes happen throughout the patient’s stay and the clinical pharmacy service needs to respond to this. The patients in this study were receiving, on average, 11 (range 1 – 29) medicines. When the patients return home they may have to manage these medicines themselves. It is known that adherence can be an issue for patients who are prescribed many medicines. An admission to a community hospital is an opportunity to review with the patient their entire medication. Pharmacists would be ideally placed to contribute to this process. This evaluation demonstrated that the contribution made by pharmacists to the care of inpatients in community hospitals was considerable. It is important that current pharmacy services to these units respond to patient severity and morbidity. Where access to a pharmacist is limited, consideration should be given to targeting those on high risk medicines. References 1. Dornan T, Ashcroft D, Heathfield H. et al. An in depth investigation into causes of prescribing errors by foundation trainees in relation to their
medical education. EQUIP study. General Medical Council. Final Report 2009. http://www.gmc-uk.org/FINAL_Report_prevalence_and_causes_of_prescribing_errors.pdf_28935150.pdf (Accessed 21 January 2014).
2. Campbell F, Karnon J, Czoski-Murray C et al. A systematic review of the effectiveness and cost-effectiveness of interventions aimed at preventing medication error (medicines reconciliation) at hospital admission. The University of Sheffield, School of Health and Related Research (ScHARR). September 2007. www.nice.org.uk (Accessed 21 January 2014).
3. Dodds, L. Pharmacist contributions to ensuring safe and accurate transfer of written medicines-related discharge information: lessons from a collaborative audit and service evaluation involving 45 hospitals in England. European Journal of Hospital Pharmacy 2014; 21: 95-101
4. National Patient Safety Agency. Seven steps to patient safety. The full reference guide. 2004 www.nrls.npsa.nhs.uk (Accessed 3 October 2013).
44. The LAST NHS Pharmacy Staffing Establishment and Vacancy Survey What trends have occurred over the last seven years ? Sanders, S, Bollington, L and Sharott, P, on behalf of the NHS Pharmacy Education and Development Committee
Introduction The NHS Pharmacy Education and Development Committee (NHS PEDC) has undertaken research to survey NHS pharmacy staffing establishments and vacancies for several years. In each year since 2008, a 100% response rate has been achieved from all NHS service providers, and Clinical Commissioning Groups (CCGs) / Clinical Support Units (CSUs) and NHS England Area Teams across England (or their predecessors), enabling useful trend data about numbers of posts and vacancy rates to be noted. This abstract presents the English data; other UK countries’ data are available. Objectives To collect and collate complete and accurate data on pharmacy staffing establishments, head count and vacancy rates for all NHS organisations across
the UK on 31 May 2014. To compare these data with those collected in previous years. To consider trends and vacancy rates to inform patterns of activity and growth. To identify issues from the data with implications for workforce planning purposes, including consideration of the numbers of trainees required. Method The National NHS Pharmacy Staffing Establishment and Vacancy Survey (NHS PSEVS) 2014 included all NHS acute and mental health trusts and providers of NHS services, and Clinical Commissioning Groups (CCGs) / Clinical Support Units (CSUs) and NHS England Area Teams across England. The methodology was similar to previous surveys. A spreadsheet template, covering all pharmacy staff, was sent to the Chief Pharmacist in each NHS organisation. Non-responders were followed-up repeatedly. Ethics Committee approval was not obtained. The survey asked for point prevalence data on 31 May 2014, and is therefore comparable with similar data collected on 31 May in previous years, enabling comparison and trends to be observed. Results 246 NHS service providers and 405 commissioning organisations in England were identified and surveyed on 31st May 2014. A 100% response rate was achieved every year since 2008, allowing comparisons to be made and trend data to be noted. Number of posts / Staffing Establishment (Table 1). Note: FTE = Full Time Equivalent i.e. 37.5hrs per week. The number of pharmacist posts has risen by 20% from 2008 and 2014. The number of pharmacy technician posts has risen by 14.5% from 2008 to 2014. Post numbers have risen by 3.9% for pharmacists and 1.6% for pharmacy technicians between 2013 and 2014.
Vacancy Rates Pharmacists In 2008, 22.2% Band 6 posts, 16.9% Band 7 posts and 10.2% of Band 8a posts were vacant, threatening service provision. Vacancy rates have dropped significantly over the years. In 2014 Band 7 and Band 6 vacancy rates are still in double figures. Pharmacy Technicians Vacancy rates for pharmacy technicians have similarly dropped over the years, but have risen again between 2013 and 2014. Discussion
There has been a steady increase in both pharmacist ad pharmacy technician posts over the years, suggesting that pharmacy input into a range of NHS services is valued.
For pharmacists, there has been a greater number of Band 7 posts than Band 6 posts throughout the years surveyed, reflecting the importance of considering all ‘training grade’ posts when planning for training numbers at both pre-registration and Foundation Years training.
Similarly for pharmacy technicians, there has been a greater number of Band 5 posts than Band 4 posts throughout the years surveyed, reflecting a similar issue.
Workforce Analysis and Planning 2015 and beyond.
The National NHS Pharmacy Staffing Establishment and Vacancy Survey will no longer be carried out; the 2014 survey was the last one funded by Health Education England.
Health Education England is undertaking a cleansing of the Electronic Staff Record (ESR) in collaboration with NHS organisations and Chief Pharmacists. In future, the ESR data will be used to analyse workforce patterns in NHS organisations in the same way as for other groups of NHS staff.
HEE is also working on assessment of the community pharmacy workforce in order to facilitate a more holistic approach to pharmacy workforce planning. This is important in the light of current activity considering pharmacists’ and pharmacy technicians’ roles in GP Practices, Emergency Departments, Healthy Living Pharmacies, the Pharmacy Urgent Repeat Medicines Services, NHS 111, etc..
Limitations The survey is limited to NHS organisations. All known organisations were identified and surveyed. Some organisations providing NHS services since the PCT purchaser/provider split and NHS transition may have been inadvertently omitted. References NHS Pharmacy Education & Development Committee. NHS Pharmacy Staffing Establishment and Vacancy Surveys. http://www.nhspedc.nhs.uk/surveys.htm (accessed 26 February 2015).
45. ‘Clinipharms’- A User Evaluation for Medicines Information I. Scott, C. Heywood, K. Want- Norfolk and Norwich University Hospital
The Medicines Information (MI) department at this hospital receives around 2600 calls a year. This pharmacy led service contributes to achieving the governments’ target to improve patient safety in hospitals and primary care1, and the Trust’s own strategic aims to reduce prescribing errors2. UKMI (UK Medicines Information) states its core value is to ‘apply evidence-based principles in the provision of impartial, evaluated, accurate and timely information in a suitable format to promote the safe and effective use of medicines’3. To this end, the MI department at the NNUH produces short evidence based bulletins, ‘Clinipharms’, which are available in both written and electronic format. They provide readily accessible information on relevant medicine related topics to prescribers, pharmacists and nursing staff, and have the benefit of being accessible out of hours. They are written and distributed when required; frequency varies from monthly to yearly. Studies indicate that health professionals value an enquiry-answering service4, but the MI department has not previously evaluated the Clinipharm bulletins. A Cochrane review has advised that issuing clinical guidelines to health-care professionals may reduce variations in practice and improve patient care5; however to be effective they must be presented in a simple, accessible format. Aim To evaluate the use and acceptability of Clinipharms by staff. Objectives To determine:
The method of access/ reasons for use of Clinipharms by staff
Satisfaction with current Clinipharms
Staff opinion on usefulness of Clinipharms compared to other sources of information
Staff opinion on subject areas for future Clinipharms Method A questionnaire was produced using ‘SurveyMonkey’, a web based survey programme. This was piloted on 9 medical, nursing and pharmacy staff and a small number of amendments made. The survey was sent to all doctors, nurses and pharmacists within the NNUH via e-mail. The link to the survey was accompanied by an explanation of purpose and an example Clinipharm bulletin for reference. The questionnaire was composed of 15 questions, separated into the three sections:
Section 1: To evaluate if responders knew about Clinipharms, the purpose they were used for, which were accessed most regularly and what further topics may be useful.
Section 2: To evaluate satisfaction levels with appearance, accessibility, clarity, and ability of Clinipharms to advise on drug dosing, monitoring and administration of medicines.
Section 3: To determine what other sources of information are used within the Trust to access information about medication dosing, monitoring and administration, comparing this to the information provided by Clinipharms and identify suggestions on how to improve them.
The survey was sent to a total of 932 staff. Sisters and charge nurses were asked to forward the survey to nurses on their wards, and the link was uploaded to the communication bulletin. The link was made available for a period of 2 weeks. Results A total of 114 responses were received. Of those who responded 100% of pharmacists knew what Clinipharms were, compared to 46% of nurses (95% CI 26.4-65.6) and 28% of doctors (95% CI 14.9-40.5). Those that were aware of the Clinipharms use them as a basis for drug monitoring (47.4 % (95%CI) 34.4-60.4), and prescribing (28.1% (95% CI) 16.4-36.7). 59.6% of the respondents (95% CI 46.9-72.3) used them ‘around 1 to 2 times monthly’ and 70.2% (95% CI 58.3-82.1) of respondents described them as ‘as useful as’ or ‘better’ than other sources of information. The most frequently accessed Clinipharms were ‘Administration of Vitamin K’, ‘Digoxin’, ‘Hypomagnesaemia/ Hypophosphatemia Treatment’ and ‘Sudden Withdrawal and Missed doses of Corticosteroids’. Figure 1 illustrates those respondents rating Clinipharms as ‘good’, ‘very good’ or ‘excellent’.
The additional comments recorded were generally positive, including ‘useful when pointed out’, ‘look extremely helpful’, ‘guidance provided, please make more’. A number of respondents stated awareness and accessibility could be improved. There was also one comment noting that these are not relevant to all sectors, and one senior doctor expressed concern that they may circumvent full guidelines. Discussion The results indicate that those using Clinipharms find them useful, using them on a regular basis. Accessibility and awareness of them needs improving; the MI department intends to email staff reminding them which Clinipharms are available and where to access them. They will be discussed at junior doctors teaching sessions, and it has been suggested that a link to Clinipharms could be posted on the main intranet page. Some suggestions for future Clinipharms are unsuitable, due to complex topics needing individual patient dosing (eg: IV iron administration), or being already available as full NNUH guidelines (eg: vancomycin, hyperkalaemia). Clinipharms are not designed to replace full, evaluated guidelines, though these suggestions may indicate poor access. Other topics include administration of epilepsy and Parkinson’s medicines when no oral route is available. There are limitations to this study, as it is not possible to determine exact numbers receiving the survey. Some respondents answered only a selection of questions, and some did not disclose their profession. Although they cannot be proven to reduce prescribing errors, having Clinipharms available may improve the quality of prescribing, medicines management and administration, and therefore patient safety. Future surveys should look at staff beliefs, evaluating if Clinipharms are seen to improve practice in the Trust. References 1: Pharmacy in England: Building on Strength-delivering the future. April 2008 2: The Trust's strategy. Accessed 16/04/14 3: http://www.ukmi.nhs.uk/ Accessed 22/07/14 4: Utility and value of a medicines information service provided by pharmacists: a survey of health professionals.iJ.E. McEnteea, S.L. Hendersona, P.M. Rutterb, J.Ruttera and H.J. Davisa IJPP 2010, 18: 353–361 5: Guidelines in professions allied to medicine (Cochrane Review 2009) Thomas LH, Cullum NA, McColl E, Rousseau N, Soutter J, Steen N
0 10 20 30 40 50 60 70 80 90 100
The appearance and professional presentation of Clinipharms
The accessibility of Clinipharms within the trust
The clarity of information in the Clinipharms
The ability of Clinipharms to advise you on drug dosing/ monitoring/administration
%Doctor Nurse Pharmacist
Figure 1: Percentage of respondents rating Clinipharms as ‘Good’, ‘Very Good’, or ‘Excellent’
46. An audit reviewing wastage of adult parenteral nutrition bags at King’s College Hospital NHS Foundation Trust Shah, S*; Callaby, H*; Vincent, R*; Dubois, P*; Hoey, S*, *Kings College Hospital NHS Foundation Trust, London
Introduction/Background/Context A service evaluation was undertaken in April 2014 following a restructure of the multi-disciplinary nutrition team (MDT) to review if this led to less wastage of parenteral nutrition bags (PN) and financial savings1. This evaluation highlighted that 3.4% (n=42/1227) of bags manufactured were wasted and that with careful monitoring of PN bag use it is possible to make financial savings of at least £5,644 per annum through the reallocation of PN bags. Prior to April 2014, patients commenced on PN were reviewed on a daily basis by the chemical pathology registrar. PN was prescribed and manufactured in advance where possible to aid capacity within the pharmacy aseptic unit. In April 2014 the trust recruited a specialist nutrition support nurse and introduced twice weekly consultant led MDT ward rounds2. In addition an active patient management nutrition support team was formed with daily reviews of all patients receiving or referred for PN by the specialist nutrition support nurse, pharmacist and chemical pathology registrar2,3. In June 2014 adult parenteral nutrition was formally outsourced to an external provider in order to increase unit capacity. There are strict order deadlines associated with the outsourced PN provider meaning efficient ordering is required to facilitate timely receipt of PN. The purpose of this audit is to establish if there is a continued reduction in wastage post prescribing and procurement changes and the financial implications of these changes. Objectives Standards were set in order to measure the extent to which the objectives were met. These were set as follows:
1) 90% of adult PN bags must be used for the intended patient. 2) 90% of adult PN bags not used for the intended patient must be reallocated.
The standards were not set to 100%, due to the unpredictability of changes to clinical conditions which require wastage of bags and specifically tailored PN bags that cannot be reallocated to another patient. Method Following approval of the project proposal by the local research and audit committee, a pilot study was conducted over a two week period in September 2014. Prospective data was collected on adult PN bags allocated for waste disposal and those that were reallocated to other patients at King’s College Hospital. Data was collected over a 3 month period between October and December 2014 by PN pharmacists covering the adult nutrition ward rounds. Collected data was recorded using Microsoft® Excel for analysis. Information captured included: total number of adult PN bags, financial cost of the PN bag, type of PN bag, reasons for wastage or return, why the bag could not be reallocated (if applicable) and the number of bags reallocated. Results were compared to data collected during a previous service evaluation conducted between April and July 2014 and conclusions drawn. Ethical approval was not required for completion of this project. Results Table 1: Summary of the percentage and number of adult PN bags, used, wasted and reallocated compared to results obtained from the service evaluation undertaken in April 2014.
Nu
mb
er
of
adu
lt P
N b
ags
Use
d f
or
inte
nd
ed
pat
ien
t
No
t u
sed
fo
r in
ten
de
d
pat
ien
t
Re
allo
cate
d
Was
ted
Esti
mat
ed
Fi
nan
cial
Co
st
of
PN
R
eal
loca
ted
Esti
mat
ed
Fin
anci
al C
ost
o
f P
N W
aste
d
Co
st s
avin
g p
er
ann
um
Current audit 1/10/2014-31/12/2014
627 568 (91%) 59 (9%) 41 (69% (n=59))
18 (2.9%) £15,143
per annum £6217 per
annum £8926
Service evaluation 07/04/2014-04/07/2014
1227 1109 (90%)
118 (10%) 76 (64% (n=118))
42 (3.4%) £22,080
per annum £16,436
per annum £5644
Comparison - ↑ 1% ↓ 1% ↑ 5% ↓ 0.5% - - -
Discussion/Conclusion 91% (n=568/627) of PN bags were used for the intended patient, compared to 90% (n=1109/1227) recorded previously, showing that a change in procurement did not negatively impact this. 55.9% (n=33/59) of PN bags were not administered to the intended patient as they were fully established on oral/enteral feed and thus PN was prematurely stopped. Other reasons for bags not being used included: no central access, palliative care /mortality and requirement changes. Ordering PN on a daily basis, reduced the number of bags not used for the intended patient by 1% (n=117/1854). 69% (n=41/59) of unused bags were able to be reallocated, an improvement from 64% (n=76/118) recorded previously. The reallocation levels noted in this audit financially produce a projected cost saving of £8926 per annum. The number reassigned fell below the set target of 90% PN bags being reallocated. 44% (n=8/18) were not reallocated due to electrolyte additions, 33% (n=6/18) as there was no suitable patient and 22% (n=4/18) were not used as due to lack of documented availability of these bags. The number of wasted bags as a whole reduced by 0.5%, due to daily review and prescribing of PN and use standard bags with no additions where appropriate. This audit highlights the need to continue to order adult PN bags on a daily basis to maintain the low number of wasted bags and associated financial costs. The reallocation of PN bags should be improved which can be established with well-organised ordering and documentation of PN bags available for use. To increase the reallocation of wasted PN bags, it is essential to highlight that ordering standard bags and correcting electrolytes outside of the bag where appropriate will help to reduce wastage. A limitation of this audit was when less experienced pharmacists covered the adult nutrition ward round, some data may not have been collected, and less reallocation of PN bags may have occurred. In addition, bags reallocated to the same patient for a different day were not recorded thus underestimating estimated savings. A system to highlight which PN bags are available for reallocation should be introduced locally to avoid available bags not being utilized. The adherence to ordering deadlines and the associated cost to the trust in staff overtime for non-adherence and late delivery and release of PN was not considered in this audit but should be for future audits to further assess financial costs incurred. References 1. Hackett A, Vincent R, Dubois P, et al. A service evaluation reviewing the wastage of adult parenteral nutrition bags from within King’s College
Hospital NHS Foundation Trust prior to and after a change in the nutrition multidisciplinary team (July 2014) 2. National Institute for Health and Clinical Excellence. Nutrition support in adults: Oral nutrition support, enteral tube feeding, and parenteral
nutrition February 2006 3. Kings College Hospital NHS Foundation Trust. Guideline for Parenteral Nutrition in Adults. Version 4 May 2014 4. Kings College Hospital standard operating procedure for monthly PbR excluded PN reporting for aseptic services pr 561 version 1 (September
2013).
47. Uptake and impact of smart infusion pump technology in a cardiothoracic intensive care unit three years on from its implementation Shah S1; Fischer A1 ; Hunter D2, 1 Pharmacy Dept, Royal Brompton and Harefield Hospital NHS Foundation Trust, London
2 Anaesthetics and Adult Intensive Care, Royal Brompton and Harefield Hospital NHS Foundation Trust, London
Introduction The 2007 National Patient Safety Alert (NPSA) report showed that injectable medicines account for a quarter of the total medication incidents reported1. Many errors occur during medication administration with calculating infusion rates and programming pumps highlighted as high-risk steps. Smart infusion pumps (SPs) include software which allows standard concentrations of specific drugs to be chosen from a menu, with both hard and soft dose limits preset. They can reduce administration errors associated with: rate, unit, concentration, calculation and push button errors2. None of these would be detected or prevented by standard infusion pumps. Smart technology is thought to reduce drug errors in critical care (CC) but the impact of their introduction has not yet been quantified3-4. Smart software records all programming steps taken and this data can be downloaded for subsequent analysis. A local review of self-reported medication incidents from the Hospital Incident Reporting System revealed 109 errors relating to wrong infusion rates reported in a 3 year period (January 2008-December 2010). Of those relating to syringe pumps, it was estimated that 69% might have been prevented by using SPs within CC5. The aim of this project was to analyse from the downloaded data, the uptake of the software and the impact it has had on infusion related errors since its implementation. Methods Standard concentrations and hard and soft infusion limits for a drug library of common drugs used in CC were compiled by CC consultants and pharmacy staff, and uploaded to the devices (Alaris® CC Syringe Pump). These pumps have 3 modes which can be chosen by the user at set-up: “DRUG” mode provides alerts based on the set limits in drug library, “DOSING” mode provides guidance taking weight and dose units into account and calculates the rate, “ml/hr” mode provides no support but allows the pump to be set up quickly. For drugs not in the library, either the DOSING or ml/hr modes must be used. Where a user attempts to programme a pump outside of the preset limits in DRUG mode a “Guardrail” event is logged by the software. After staff training, SPs were introduced in CC areas in January 2011. Data from all accessible devices were downloaded from Jan 2011 to Dec 2013, analysed & reviewed by a pharmacist & CC consultant. Ethics approval was not required as this is a quality improvement project. Results An average of 7000 (71.9%) infusions were set up per month in DRUGs mode compare to 1000 (12%) in DOSING and 1400 (15%) in ml/hr mode. Over the 3 year study period there was a total of 5210 (2%) Guardrail events. Of these 457 (8.8%) were hard limit events. The user re-programmed the pump after 374 of these events. The table below shows the number of hard limits generated for the drug classes most commonly used in CC (table 1). Of these 106 (23%) involved setting a rate >2 times higher than the hard limit. Of concern, cardiology drugs (such as GTN, amiodarone and furosemide) were the class with highest recorded errors. Table 1: No of times infusion rates set above the hard limits for drug classes commonly used in CC
Discussion The use of the smart software increased over the study period. The recorded error rate was 1 event every 50 infusions set up and 1 hard limit event every 550 infusions. This is much higher than the self-reported rate in our retrospective audit. As 81% of the hard limits were reprogrammed it is assumed that these were true errors recognised by the user. Moreover, 23% of infusion rate errors involved rates at least 2 times the preset limit. We conclude that the software may well have prevented major drug errors & believe that this data suggests that smart software improves patient safety. References
1. National Patient Safety Alert (NPSA) Patient safety alert 20: Promoting safer use of injectable medicines March 2007 (accessed via http://www.nrls.npsa.nhs.uk/resources/?entryid45=59812 on 15th Feb 2015)
2. Murdoch L, Cameron V. Smart infusion technology: a minimum safety standard for intensive care? British Journal of Nursing 2008; 17(10): 630-636
3. Antononov J, Smith A, Silver M. Medication error reporting: a survey of nursing staff. Journal of Nursing Care Quality. 2000;15:42-48 4. Rothschild JM, Keohane CA, Cook EF, Orav J, Burdick E, Thompson S, Hayes J, Bates DW. A controlled trial of smart infusion pumps to
improve medication safety in critically ill patients. Critical Care Medicine 2005;33(3) 533-540 5. Fischer A. Implementation of CadinalHealth Guardrail Software for Infusion Devices. The Royal Brompton and Harefield NHS Foundation
48. Impact of Introducing Smart Infusion Pump Technology on Intravenous Medication Errors in Critical Care Areas Shah S; Hanna C; Fischer A. Pharmacy Dept, Royal Brompton and Harefield Hospital NHS Foundation Trust, London, United Kingdom
Introduction Injectable medicines account for a quarter of the total medication incidents reported1. Many errors occur during medication administration and the risk is higher when medications are administered via an infusion pump. Programmable infusion pumps with safety software (“smart pumps”) have been designed to intercept such errors by supporting the set-up of device, displaying alerts if infusion rates exceed hospital-defined ranges or concentrations are set incorrectly. The use of smart pumps has therefore been recommended as one intervention to reduce these errors in the National Patient Safety Agency alert1. Smart pump technology was rolled out on syringe pumps in adult critical areas in the Trust in January 2011. Although smart pump technology can reduce administration errors associated with: rate, unit, concentration and calculation errors they don’t prevent all infusion related errors (such as user set up errors eg. where a user inputs an incorrect weight of the patient or selects an incorrect concentration from the drug library). The aim of the project was to compare the impact of smart pumps on the occurrence, type and severity of infusion related incidences pre and post implementation of the smart software. Methods The Datix® (clinical incident reporting system) database was queried and all infusion related medication reports were retrieved that had the word ‘Infusion’ included in the description text of the incident between January 2008 and December 2013 (3 years pre and post implementation). The incidents were downloaded to an excel spreadsheet and were categorised by the pharmacist according to clinical area, the stage of error and the type of medication error. All incidents relating to administration of medication via syringe pumps were further analysed and categorised to type of errors (i.e. concentration, rate, unit, weight), the factor by which the rate set was above the rate prescribed and whether they should have been ‘preventable’ by the smart software. The severity of an incident (green, yellow or red) was obtained from the original Datix® entry (green relates to minor injury requiring minor intervention; yellow relate to moderate injury requiring medical attention; red relate to major incidents leading to death). Results A total number of 715 reports were identified from the search. 267 (37%) were ‘Administration’ incidents that occurred on adults wards, infusion pump incidences accounted for 117 (43.8%) with 80 (68.4%) of these related to drugs given by a syringe pump. 44 of these occurred within critical care, 33 pre-introduction of smart software (Jan 2008- Dec 2010) and 11 post-implementation (Jan 2011-Dec 2013). As shown in table 1 post implementation the type of incidents that the smart software can help prevent (such as rate and unit errors) have decreased. In relation to potential harm, all of the documented infusion pump incidents fall under the green and yellow category. We observed a fall in the number of yellow incidents reported post implementation of the software. Over 50% of incidents reported prior to implementation involved infusion rates set 5 times the prescribed rate (table 1) compare to 18% post implementation. Table 1 – impact of smart software on the occurrence, type, severity and factor rate above the prescribed rate of infusion related incidences pre and post implementation
Pre-implementation Post-implementation
Type of incidents Incorrect concentration selected Incorrect rate set Incorrect units set Incorrect weight
7 (21.2%) 20 (61%) 4 (12%) 2 (6.1%)
3 (27%) 4 (36%) 1 (9%) 3 (27%)
Severity of incidents: Green Yellow Red
18 (55%) 15 (45%) 0
9 (82%) 2 (18%) 0
Factor rate set > prescribed rate >1-1.9 >2-4.9 >5-9.9 >10-49.9 >50-100 Inadequate data
4 (12%) 8 (24%) 7 (21.2%) 11 (33%) 1 (3%) 1 (3%)
4 (36%) 5 (45%) 1 (9%) 1 (9%) 0 0
Discussion Wrong infusion rate incidents account for 44% of all reported infusion related administration errors in the Trust. Approximately 50% of these errors were reported within critical care, which most likely relate to high usage of infusions in this area. It is well known that incidents are under-reported in health care settings and that the data generated from the Datix reports is not a true reflection of the occurrence of infusion related incidents making it difficult to make definitive decisions about the impact of the implementation. However an interesting pattern has emerged in relation to the type of incidents, severity of incidents and the magnitude of the factor the rate has been set above the prescribed rate. Of the 11 incidents that occurred post implementation, 3 could have been prevented by the smart software had the user selected the smart software mode. The other 8 were considered unpreventable as the user selected the incorrect concentration in 3 cases involving morphine, milrinone and noradrenaline (where more than one concentration exists in the drug library) and the user input the incorrect weight for the patient in 3 cases. Finally, 2 involved heparin whereby the patient received 1.1 and 2.5 times more heparin respectively. The pump did not alarm as the heparin dose administered was within the pre-set range. This is consistent with what the results have shown with regards to a reduction in >5 fold dosing errors factor rate set above the prescribed rate. In conclusion, although the reported number of incidents is small, we believe the software has helped to prevent errors associated with rate and unit settings and reduced the severity of incidents since implementation. The software does not prevent all infusion related incidents and may depend on the drug and user set-up of the pump. References 1. National Patient Safety Alert (NPSA) Patient safety alert 20: Promoting safer use of injectable medicines March 2007
49. Reducing the risk of overdose with midazolam injections Shemirani, R and Ajibodu, S, University College London Hospitals NHS Trust
Introduction Parenteral midazolam is a benzodiazepine used in conscious sedation and flumazenil a benzodiazepine antagonist used to reverse its central sedative effects. Flumazenil use in midazolam overdose is unlicensed and can be hazardous. The National Pharmaceutical Safety Agency (NPSA) identified serious deficiencies in the use of midazolam for conscious sedation in adults and issued a Rapid Response Report in 2008. The report required all NHS independent organisations to implement actions to prevent harm [1]. Midazolam overdose during conscious sedation has since been classified as a never event as defined by the Department of Health [2] and applies to all healthcare premises excluding areas where the use of high strength midazolam is appropriate and excluding paediatric care. The purpose of this project was to audit the use of midazolam injections for the use of conscious sedation in adults at University College London Hospital (UCLH) against the NPSA standards [1]. Objective(s) To ascertain the number of reported incidents involving the use of midazolam for conscious sedation and to determine whether the NPSA standards are being met across UCLH.
Method A multi-site retrospective audit was carried out across all UCLH sites for the period 01.12.2013 - 30.11.2014. This included any UCLH area that routinely stocked midazolam injections for conscious sedation in adults but excluded areas requesting midazolam injections for other approved uses, such as syringe driver use in cancer patients, when it is not part of their stock. The UCLH dispensing system was used to find out which areas stock midazolam and flumazenil injections. Information was also obtained by speaking to the ward sister, staff nurse in charge or ward pharmacist. Ethics approval was not required because this was an audit project. Results A review of practices at our organisation indicated thirty-two incidents relating to midazolam or flumazenil were reported on the Trust’s Datix system during a twelve month period, of which two incidents related to midazolam overdose and were graded as medium risk. Within UCLH, 75 areas routinely stock midazolam injections for conscious sedation in adults. The Heart Hospital had nine areas that stock midazolam 10mg/5ml injections. Five areas are currently using the midazolam injections for conscious sedation. They are not being used for general anaesthesia, palliative medicine, intensive care and have not been formally risk assessed. Having highlighted that there also exists a 1mg/ml injection, the lead cardiac pharmacist endeavours to change the stock for most of the areas, restricting them to the lowest strength injections. Table 1: UCLH compliance with regards to the NPSA standards.
Standard Compliance
100% of stored and used high strength midazolam (2mg/ml, 5mg/ml) is restricted to general anaesthesia, intensive care, palliative medicine and clinical areas/situations where its use has been formally risk assessed.
16/21 areas
76%
100% of all other areas are restricted to the storage of low dose midazolam (1mg/ml). 54/58 areas
93%
Sedation is covered by organisational policy. Yes 100%
The organisation reviews its sedation protocols. Yes 100%
100% of procedures should have overall responsibility assigned to a senior clinician who may be an anaesthetist. Yes 100%
100% of healthcare practitioners involved in sedation techniques have the relevant competence. Yes 100%
The organisation audits the use of midazolam injections. Yes 100%
100% of areas which stock midazolam also have stocks of flumazenil available. 71/75 areas
95%
Flumazenil use is regularly audited as a marker of excessive dosing of midazolam. Yes 100%
Average 96%
Discussion / Conclusion Overall UCLH has good but not complete compliance with the NPSA standards. Staff involved in administrating midazolam for conscious sedation on the wards are generally band 5 or above staff nurses who have been deemed competent in intravenous administration but may be an anaesthetist or doctor. Through discussion with staff nurses at each relevant area it was clear many are not familiar with flumazenil, its risks or its use in midazolam overdose. It is imperative that if such an emergency occasion arises staff know the protocol in administering it. In one area, it was found that the ward nurses carry out their own stock top-ups and overtime the flumazenil injections had been used up and as it is sparsely used, was not replaced. UCLH is on average 96% compliant with regards to the NPSA standards (Table 1). This is unacceptable as these standards have been set since 2009 in order to reduce the risk of overdose with midazolam injections. Albeit this risk is a never event, measures should be in place to aid its prevention. The organisation grades well in account of the policies and protocols set as well as the staffing competence levels in using midazolam injections. Its downfall is the storage and use of the higher strength midazolam injections occurring in inappropriate areas and the lack of concurrent flumazenil stock. A result of this audit should be a re-audit by 31.11.2016. Other recommendations are as follows. Review the clinical need for midazolam injections in the different areas and ensure flumazenil is stocked concurrently. Also inform all relevant staff on individualising midazolam doses and the use of flumazenil injections.
References
1. Rapid Response Report: NPSA/2008/RRR011: Reducing risk of overdose with midazolam injection in adults. 9 December 2008. 2. Department of Health, The “never events” list 2012/2013. 18 January 2012.
50. Care by Optimising Medicines for Elderly patients on care Transfer (COMET) Smith H, Tweed J, Skitt S, Fox G, Leeds Teaching Hospitals NHS Trust (LTHT), Leeds
Introduction Older people are at increased risk of medicines-related problems including medicines-related admissions to hospital. In a large study in the North West of England, medicines-related admissions accounted for 6.5% of all admissions to hospital1 but this could be as high as 30% in older people.2 Previous project work in Leeds, The Integrated Medicines oPtimisAtion on Care Transfer (IMPACT) project, supported patients with their medicines after discharge from the older people admission wards. This showed a 6% absolute reduction in 30-day re-admissions for the project patients versus the average re-admission rate for the wards3. Subsequently, further project work was undertaken to roll this work out to all the older people’s wards at LTHT. Objectives The aim of the project was to optimise medicines and to reduce medicines-related re-admissions through improved communication and support for patients and carers and improved communication across the whole heath economy. The key objectives were to:
Measure the re-admission rate for patients who were discharged with a medicines management plan (MMP) in their discharge communication
Measure the re-admission rate for all the older people’s wards and compare this to the patients with a MMP Methods Patients admitted to the older people’s wards at LTHT had their medicines optimised during admission by the multidisciplinary team. Examples included medicines stopped or adjusted to reduce side-effects, medicines support put in place to improve adherence such as simplifying regimens and medicines changed in response to patient preferences. Patients were also assessed by clinical pharmacists and pharmacy technicians to determine if they had a medicines-related need post-discharge. Where a need was identified, a medicines management plan (MMP) was added to the patient’s discharge advice note, which was sent electronically to the GP within 24 hours of discharge. Patients were signposted to healthcare professionals in primary care for follow-up action where appropriate. These included community pharmacists, primary care pharmacists, pharmacy technicians, community matrons, GPs, practice nurses and district nurses. Examples of signposting included referrals to community pharmacists for the new medicine service and post-discharge medicine use reviews, to primary care pharmacists for clinical medication reviews, to community pharmacy technicians for medicines support assessments and interventions and to practice nurses for review of inhaler technique. The multidisciplinary team in the community was responsible for completing the actions requested in the MMP. A retrospective case review of all MMP patients who were re-admitted within 30 days was carried out by a Consultant Pharmacist for Older People and a Consultant Geriatrician to determine if the re-admission was medicines-related. We were advised that Ethics Committee approval was not required for this project. Results Re-admissions for COMET project patients versus Older People Ward Average
Nov 13 Dec 13 Jan 14 Feb 14 Mar 14
Discharges Elderly Medicine 600 655 728 630 623
Number of re-admissions (%)
123 (20.5) 123 (18.8)
140 (19.2)
125 (19.8)
114 (18.3)
Number of COMET patients with MMP 39 39 41 39 43
COMET patients with MMP re-admitted within 30 days
12 6 6 6 8
% COMET patients with MMP re-admitted within 30 days
30.8 15.4 14.6 15.4 18.6
261 patients were identified as being at high-risk of medicines-related problems post-discharge by pharmacists and pharmacy technicians. 201 patients (76%) were discharged with a medication management plan on their electronic discharge advice note. The remainder were lost to follow up usually because they became more unwell or were discharged from other speciality areas e.g. Surgery. There were a total of 251 clinical actions and 67 medicines support actions documented on the medication management plans. Some patients had more than one action. All 38 COMET patients with a MMP who were re-admitted were reviewed. 3 (8%) of these patients were identified as having a medicines-related problem contributing to their re-admission. Discussion/ Conclusion The COMET project highlighted that a number of older people admitted to LTHT older people’s wards were at risk of medicines-related problems post-discharge which could increase their risk of re-admission to hospital. This was a service development and not designed or powered to be a research project. Unlike the IMPACT project there was no statistically significant difference in the 30-day re-admission rate for the patients with a MMP compared to the average 30-day re-admission rate for all the older people wards. It is unclear why re-admissions in November were higher than usual for the COMET patients but this did not appear to be related to issues with medicines. Although the 30-day re-admission rate was not reduced, there were additional benefits from this project, including improved quality especially in relation to medicines optimisation, improved communication with the multidisciplinary team across the interface and identification of future work that could further improve the medicines pathways for this patient cohort. References
1. Pirmohamed M, James S, Meak S et al. Adverse drug reactions as cause of admission to hospital: prospective analysis of 18,820 patients. BMJ 2004; 329:15-19
2. Hamilton HJ, Gallagher PF, O’Mahony D. Inappropriate prescribing and adverse drug events in older people. BMC Geriatrics 2009; 9(5): 1-4
3. Acomb C, Laverty U, Smith H et al. Medicines optimisation on discharge. The Integrated Medicines oPtimisAtion on Care Transfer (IMPACT) project. Int J Pharm Pract 2013; 21(Suppl 2):123-124
51. Enhancing patient care through total integration of pharmaceutical care into the multidisciplinary team in an acute trust St. Clair Jones A1, Hills E 2, Smith M3, (1Lead Pharmacist Gastroentrology, 2 Inflammatory bowel disease (IBD) Nurse Specialist,
3 Gastroenterologist, IBD lead), Brighton and Sussex University Hospitals (BSUH) NHS Trust, Brighton
Introduction A multidisciplinary team approach is essential to ensure high quality and compassionate care for patients with chronic diseases and provide an encompassing patient experience. A holistic care model for the inflammatory bowel disease (IBD) service was established using a multidisciplinary team (MDT) approach to provide optimal long term support through easy access to the relevant members of the team and flexible pathways providing tailored care according to the patient’s need. Brighton had a nurse led service with one nurse providing support to patients on one site only with minimal input into the infusion clinics. When she retired no succession was in place and pharmacy proposed a pharmacist led service integrating it into the nursing team once two IBD nurses were appointed. The business case for the comprehensive IBD team was accepted by the trust fully integrating pharmacy services. In addition to medical and nursing staff a full time post for a specialist pharmacist was incorporated into the IBD specialist team. The pharmacist complemented the nursing and medical team with emphasis on the total integration of medical, nursing and pharmacy roles. Multidisciplinary services are widely reported1 but having nursing and pharmacy staff sharing responsibility for patients long term care is innovative and new ways of working were explored in the redesigning of the IBD service. Aim Integrate a pharmacy led comprehensive medication optimisation service for Gastroenterology into the specialist MDT. Objectives
1. Provide an independent prescribing service initiating and monitoring drug therapies 2. Provide a therapeutic drug monitoring (TDM) service to individualise therapy 3. Strategically and clinically manage the biologics infusion clinic to optimise capacity 4. Provide an access point for patients to the IBD service 5. Develop pathways to standardise therapeutic decision making 6. Assess workload impact, financial benefits and acceptability of service
Method
1. A weekly pharmacist outpatient clinic was established, to initiate immunomodulating drugs and undertake biochemical monitoring. The pharmacist optimised therapy according to blood levels, adverse drug reactions (ADRs) & concordance2.
2. A new blood & TDM service for immunomodulators & biologics was introduced to optimise therapy decisions2. 3. Strategic and operational management of the biologics infusion clinic was transferred to the pharmacist. 4. The rapid access (helpline) service was reviewed to see whether the pharmacist could add value. 5. Pathways to access the IBD service integrating the pharmaceutical skills were developed and the pharmacist facilitated MDT-approved
pathways to initiate and review immunomodulators. 6. A workload and prescription audit was conducted over four months with financial impact assessment. Patient & anonymous colleague
feedback was sought. Results
1. In a four months period 14 pharmacist clinics were held. Clinical governance was ensured by monitoring bloods of 382 patients of which 138 patients were seen during clinic appointments during that time and the reminder monitored remotely.
2. The biologics infusion clinic expanded to include a cross-speciality services serving IBD and dermatology patient, iron deficiency anaemia patients and providing nutritional supplementation.
3. 65 patients had their immunosupressant therapy adjusted in the TDM service. The pharmacist was the gatekeeper for testing and was responsible for optimising therapies as a non-medical prescriber.
4. The advice sought from the rapid access service was primarily nurse-orientated and the service remains nurse-lead, with pharmacist deputising to maximise resources. In a four months period 142 of 1032 queries were answered by the pharmacist.
5. Pathways were developed for:
Newly diagnosis patients triaged to attend either the medical or the clinical nurse specialist clinics.
Established patients seen for follow ups by the clinical nurse specialist and providing rapid access to the service for patients with exacerbation of their disease.
Referrals to pharmacist clinic for patients needing initiation and optimisation of immunomodulating therapies, experiences ADRs or with perceived concordance issues.
The pharmacist facilitated MDT-approved pathways to initiate and review immunomodulators. 6. In a four months period the MDT reviewed 42 patients on biologics according to the new pathways. The TDM service resulted in a minimum
of £60,000 savings for the health economy. Six of six peer-assessors returned overwhelmingly positive reviews of the service and patient feedback was favourable.
Conclusions No data prior to the establishment of the IBD specialist team was available for comparison. As a highly specialised pharmacist it was possible to maintain a safe service whilst the trust took 18 months to appoint two new nurses. Involving the pharmacist in all aspects of the long-term care of patients with IBD enhanced patient safety and standardised treatment & monitoring protocols, whilst individualising therapy. The focus of the MDT shifted to early medicines optimisation, realising considerable cost savings and inter-professional relationships profited from working closely together and deputising for each other. In view of future challenges facing the health service barriers separating professions need to be questioned. Embedding pharmaceutical skills into the multidisciplinary team influenced therapeutic decision making, ensuring that services incorporated good medicine management and medicine optimisation principles at conception to guarantee high-quality, compassionate care and strong governance. This model of total integrated pharmaceutical care beyond clinics is applicable to any speciality and can be used as a model for other professions involved in the multidisciplinary team. Evidence of specialist competencies that pharmacists acquire through undertaking non-traditional roles can be used to support Royal Pharmaceutical Society faculty submissions. References 1. Department of Health. Improving Chronic Disease Management. London: Department of Health; 2004. 2. St. Clair Jones A. Optimising therapy for inflammatory bowel disease. Clinical Pharmacist, November 2014, Vol 6, No 9, online
52. Can You Read the Label? How a pharmacy department improved access and adherence to medication for individual patients Lim, E and Storey, L, Pharmacy Department, Newcastle Upon Tyne Hospitals NHS Foundation Trust, Newcastle
Introduction Poor dexterity, poor co-ordination, and the inability to understand instructions about the use of their medication are only a few reasons why some patients are unable to take medication effectively1. In 2007, 58 of the reported medication errors to the NPSA involved blind and partially sighted patients; several incidents highlighted the lack of medicinal aids or assistance as a cause of the error1. According to the Disability Discrimination Act 19952, the pharmacy service should provide medicinal aids to enable patients to use their medication and understand the information provided. These aids include prompt charts and physical devices, for example an Opticare® to enable self-administration of eye drops. Improving medication adherence will allow patients to use their medication more effectively, subsequently improving
disease management3. During a pharmacy-led Trust Medication Safety Week, the Eye Clinic Liaison Officer highlighted a lack of medicinal aids for patients with visual impairment. This raised the need for clearer guidance on identifying and delivering the support needed for patients to use and take their medications. A project team was set up to improve how to identify the support needs of patients and ensure solutions can be offered to help these patients. Objectives
Review the current pharmacy Medicines Support Needs Assessment Tool (MSNA) to establish if any patient needs would not be identified in its current form and update accordingly.
Review available medicinal aids incorporating: o Available medicinal aids in the Trust, and there suitability for use. o The need for new or replacement medicinal aids, ensuring support of a wider range of medicinal needs. o Procurement of medicinal aids.
Develop and implement a standard operating procedure (SOP) for the supply of medicinal aids.
Raise awareness within the Trust, at both staff and patient level, regarding the availability of support and medicinal aids. Method Clinical pharmacists met to discuss the patient medication support needs. The most common support needs were grouped by impairment into four categories. Support strategies and medicinal aids were then sought to address those needs. A list of commercially available medicinal aids was compiled using the Royal National Institute of the Blind product catalogue and by contacting specialist providers of compliance aids. Samples were obtained and ease of use and suitability was assessed. Formulary approval was then sought for these aids. The MSNA tool was then updated to incorporate clearer guidance linking the identified patient needs with the support and/or medicinal aids obtainable. This formed the basis for the development of the medicinal aids SOP. The updated MSNA tool was trialled within Older Peoples’ Medicine (OPM) before roll out to the rest of the Trust. Early promotion included presentations to pharmacy staff, targeted wards, posters and leaflets placed around the hospital. Results The MSNA tool now has clear recommendations related to specific patient needs: Eyesight, Dexterity/Swallowing, Understanding/Memory, and Access. Of the medicinal support that was available at the time, there was a clear lack of support for patients with visual impairment, patients struggling to use eye drops or who have a poor understanding of English. The hospital pharmacies now stock a wide range of eye drop delivery devices, inhaler delivery devices, a Braille labeller, and the option for large-print labels. The SOP was written and implemented within the dispensary and training was provided to the dispensary staff. Presentations were targeted to OPM and Ophthalmology. The table below reflects the increased uptake of medicinal aids within the Trust before and after promotion.
Haleraid® 120 and 200 Opticare® (formulary)
Autodrop® (non-formulary)
Last financial year 17 4 5
Year to date (April 2014 to February 2015) 28 12 1
Discussion Ethics approval was not required as no patient identifiable data was collected. Review of the medicinal aids provided many challenges. Ease of use, cost implications, and availability in primary care all had to be considered. Compatibility of eye drop bottles into the delivery devices was another challenge; an eye drop compatibility chart was drawn up to aid selection of the correct device. However, this requires regular updates due to formulary changes and as new generics appear on the market. As several medicinal aids are non-NHS prescribable, this has resulted in a commitment from the Trust to provide replacement devices. Therefore, patient information leaflets were produced to advise patients how to obtain replacements. The medicinal aids project is ongoing as new medicinal aids and support options are identified, therefore further work is planned. For example, a picture label programme for patients who can’t read English has been sourced; however IT issues have prevented its use as yet. There are also medicinal aids that have not gained formulary approval that may be of benefit to patients such as the Pill Glide® for patients with swallowing difficulties. Improving staff confidence in recommendations and the use of the medicinal aids has improved, but the process has been labour intensive as most staff report that group sessions were more useful than promotional material. So far work has been focused on Ophthalmology and OPM; promotion of this project in other areas is planned over the coming year. The Trust is working towards a patient-centred culture, where individual needs are identified and linked to patient-specific interventions, encouraging informed medication adherence3. There has been an increase in uptake of medicinal aids being dispensed and hopefully this trend will continue. References 1. National Patient Safety Agency. Freedom of Information Act request: Blind and partially sighted patients. London 2007. http://www.npsa.nhs.uk/corporate/about-us/foi/informationlog/?EntryId51=65919 (Accessed 12 July 2014) 2. Disability Discrimination Act 1995. http://www.legislation.gov.uk/ukpga/1995/50/contents (Accessed 10 July 2014) 3. National Institute for Health and Care Excellence. Clinical Guideline 76. Medicines adherence: Involving patients in decisions about their prescribed medicines and supporting adherence. London 2009.
53. Implementation of a referral tool for screening patients for pharmaceutical care by pharmacy technicians in a paediatric medical acute receiving unit – a pilot
Stuart ZE1, Kinnear M1, 2 and Mullen AB2, 1NHS Lothian Pharmacy Service, Royal Hospital for Sick Children, Edinburgh and 2University of Strathclyde, Glasgow.
Introduction The key target within paediatric care set by the Scottish Patient Safety Programme (SPSP) is a 30% reduction in avoidable harm by December 20151. To achieve this, pharmacy departments have examined staff skill mix and efficient, safe systems of work. The Scottish Government strategy, Prescription for Excellence proposes that all patients receive a high level of pharmaceutical care using the skills of their pharmacists to their full potential2. In order to do that, the pharmacist must be able to prioritise patients and focus on high priority, complex patients with pharmacy technicians providing professional support by performing medication histories, assessment of patient’s own drugs and addressing supply issues. One model of working includes screening patients by the pharmacy technician and referral to the pharmacist of patients who meet agreed criteria. This study aimed to test agreed referral criteria in a paediatric population.
Objectives
To evaluate a referral tool, agreed through focus group consensus, for safety and effectiveness in screening patients who should be targeted for pharmacist review and delivery of pharmaceutical care.
Obtain feedback from pharmacist and technician users of the tool.
Method Approval was granted from the South East Scotland Research Ethics Committee. A referral tool used in a local adult population, which is fully validated and used extensively, formed the basis of a draft tool informed by reported medication incidents in the paediatric population. Referral criteria were discussed and agreed at a meeting of national paediatric pharmacists. A pharmacy technician (16 years qualified) was trained in the use of the agreed tool (22 criteria) which was piloted in 93 admissions to the medical acute receiving unit during two one week data collection periods. Patient recruitment was based solely on the date of their admission to the ward. Those who did not consent or had already been screened by a pharmacist were excluded from data collection. The pharmacy technician applied the tool to each patient and criteria met (one or more) were documented prior to notifying the pharmacist (2.75 years qualified) that a patient required clinical review. The patients were then reviewed by the pharmacist as per normal practice and the appropriateness of the referral evaluated using the code justified or unjustified and was dependent on the information available to the pharmacy technician. The tool was further evaluated through sending four anonymised scenarios from the data collection to 5 technicians and 5 pharmacists with no prior experience or training of using the tool. Technicians were asked to apply the tool and state if they would refer the patients and pharmacists were asked if they would expect the patients to be referred. Responses were compared to the action the pharmacy technician actually took in the pilot. Verbal feedback about the tool was invited.
Results Of the 93 patients, 45 were referred to the pharmacist as they met one or more of the referral criteria. A total number of 109 referral criteria were triggered with five of the criteria accounting for 80.0% of referrals made to the pharmacist. Of the total number of patients referred, 40/45 (89.0%) were justified. Of those not referred 6/48 (12.5%) were unjustified. Non-referral was subsequently identified to be caused by the pharmacy technician not comprehensively checking all sides of the medicines chart. Inclusion of the 6 unjustified non-referrals increased the sensitivity of the tool to 100% as shown in table 1.
Table 1 Showing the sensitivity and specificity of criteria
Discussion of the four scenarios by both technicians and pharmacists raised similar issues such as clarity on course length of antibiotics and at what point should the patient be referred to the pharmacist and should patients be referred if they are prescribed oral steroids for longer than five days? Feedback received included clarity on special products and suggested amendments to the tool to make it more effective. Both groups documented that the tool was well laid out, clear and easy to follow and would be happy to use in their clinical areas.
Discussion The pilot of the referral tool showed that five criteria accounted for 80% of referrals when reviewing the other criteria it was decided that due to the high risk nature of the drugs included they should remain. The sensitivity and specificity of the referral tool was also increased when all criteria were applied rather than the top five, taking into account the unjustified non-referrals. Piloting of the referral tool suggests almost half of the admissions to the ward during the data collection periods require pharmacist review. Those patients not referred to the pharmacist did not have any pharmaceutical care issues which could not be dealt with by the pharmacy technician. Roles traditionally carried out by a clinical pharmacist were able to be delegated to a trained pharmacy technician such as assessing patient’s own medication and patient counselling. The unjustified referrals highlighted the need for some further training to help avoid human error. Limitations of the pilot include only one technician and pharmacist piloted the tool, further pilots with other members of staff are required and in other clinical areas to fully validate tool. Under reporting of medication incidents will have affected the criteria chosen. The referral tool is only of use on admission, does not identify patient’s who’s pharmaceutical care needs change during inpatient stay. The findings of this pilot is also confirmed by published research which showed the pharmacy technician at ward level reduces risks and can have a positive impact on the amount of clinical time the pharmacist spent on the ward3,4. Overall this pilot has shown that through the introduction of a pharmacy technician to the ward there is potential to direct clinical pharmacist resource to those who require intensive pharmaceutical care without compromising the overall level of care.
References 1. Scottish Patient Safety Programme [online], [last accessed 01/06/14] available: http://www.scottishpatientsafetyprogramme.scot.nhs.uk/programmes/mcqic/paediatric-care 2. The Scottish Government. Prescription for Excellence - A Vision and Action Plan for the right pharmaceutical care through integrated partnerships and innovation. September 2013. 3. Shane R. Advancing technician roles: an essential step in pharmacy practice model reform. American Journal of Health System Pharmacy. 2011; 68:1834-5 4. Audit to Evaluate the Role of a Clinical Pharmacy Technician in providing Pharmaceutical Care at Ward Level at Aberdeen Royal Infirmary. June 2004. NHS Grampian
54. Improving the service to outpatients attending the main dispensary at the University Hospital of Wales (UHW) Turner, H1, Way, C1 and Browne, C2., 1Pharmacy Directorate, Cardiff and Vale University Health Board,
2School of Pharmacy and Pharmaceutical Sciences, Cardiff University, Cardiff.
Introduction There is a drive within the National Health Service (NHS) in Wales to improve the safe and effective delivery of healthcare and medicines to patients. All departments providing healthcare services within the NHS, including pharmacy, are facing financial deficits and reductions in staffing levels. It is therefore vital that the systems in place are efficient and robust in order to maintain a high level of care for all patients that use healthcare services. Lean is a concept based on being able to improve patient care with existing resources1 The NHS Institute for Innovation and Improvement describes how Lean thinking can be used within the NHS to introduce new concepts, tools and methods to improve process flow 2. The number of outpatient prescription items dispensed by Cardiff and Vale University Health Board (CVUHB) hospital pharmacies has increased by 25% over the last three years, whilst pharmacy staff numbers have decreased by 17% over this period. This has resulted in increasing waiting times for outpatient prescriptions; the average waiting time for outpatient prescriptions at the University Hospital of Wales (UHW) is currently 66 minutes (01/04/14 – 30/06/14). The results of a CVUHB Outpatient Satisfaction Survey showed that the majority of patients (approx. 95%) using the service at UHW would expect to wait less than 20 minutes for their prescription3. As there is a mismatch between the expected time and reality, it was decided to undertake a service improvement project in this area.
Aim and Objectives The aim of this project was to reduce outpatient prescription waiting times so that 100% of outpatients wait no more than 45 minutes for their prescription from UHW pharmacy. This was considered a realistic target to achieve by September 2014. The objectives of the project were:
To review and improve the overall dispensing process for outpatient prescriptions at UHW pharmacy department.
To increase/maintain adequate staff levels working in UHW outpatient dispensary.
To improve the ease of finding completed outpatient prescriptions for patients who have come to collect them.
Method Ethics approval was not required for this project as it was classed service improvement. Various service improvement methodologies were used to help identify problems in the overall dispensing process. Methods included a spaghetti diagram, Pareto analysis and process mapping. The use of a Driver diagram helped to summarise problems identified with the overall dispensing process and potential interventions that could help to reduce outpatient prescription waiting times. The potential interventions were presented to dispensary staff for feedback and three feasible interventions were finalised. The interventions were put in place from the 30th June 2014 at separate times using ‘Plan-Do-Study-Act’ (PDSA) cycles (see figure 1). The first PDSA cycle was to ensure dispensary staff complete their ward top-ups before 9.30am or in the afternoon, to maximise staffing levels at peak prescription times. A problem repeatedly highlighted by service improvement methodologies was difficulty finding completed outpatient prescriptions in the dispensary, taking staff away from the dispensing process. PDSA cycle 2 involved the implementation of an alternative outpatient prescription collection system and PDSA cycle 3 was to return dispensed outpatient prescriptions to stock if not collected within 7 days. The percentage (%) of outpatient prescriptions completed within 45 minutes each day was collected continuously over a five-month period (01/04/14 – 28/08/14). Data was plotted onto a control chart using Microsoft Excel® and the SPC XL statistics programme. Results Between 1st April and 30th June 2014, 33.8% of prescriptions were completed within 45 minutes each day. After PDSA cycle 1 and 2 were initiated, there was a steady improvement in outpatient prescription waiting times and the average percentage of prescriptions completed within 45 minutes each day increased to 43.5%. After PDSA cycle 2 was put into place, the average time to find an outpatient prescription in UHW dispensary was reduced from 2.5 minutes to 32 seconds. After PDSA cycle 3 was initiated, the proportion of outpatient prescriptions completed within 45 minutes continued to rise. Since all three PDSA cycles have been implemented, the average percentage of outpatient prescriptions dispensed within 45 minutes each day was increased from 33.8% to 60.8%.
Figure 1: Control chart of the percentage (%) of outpatient prescriptions completed within 45 minutes each day.
Discussion/Conclusion After all three PDSA cycles were implemented, the average percentage of outpatient prescriptions completed within 45 minutes increased from 33.8% to 60.8%. There was also a reduction variation between the upper and lower control limits, illustrating standardisation of the dispensing process. Although not all outpatient prescriptions dispensed were completed within 45 minutes after the three interventions were made, the results show that overall there has been an improvement in outpatient prescription waiting times. The aim to complete 100% of outpatient prescriptions within 45 minutes (by September 2014) has not been met during this project and it is clear that further improvements need to be implemented to achieve this target. A service improvement project will be taken forward in 2015, focusing on the work flow and layout of the outpatient dispensary. References 1. Jones D and Mitchell A. Lean thinking for the NHS. London: NHS Confederation; 2006. 2. NHS Institute for Innovation and Improvement. Lean Thinking. 2013 [accessed 30 April 2014] available from:
http://www.institute.nhs.uk/building_capability/general/lean_thinking.html 3. Chaumeau V. Survey to evaluate patient satisfaction with the outpatient pharmacy service provided at the University Hospital of Wales and
Llandough. Cardiff: Cardiff University; 2012.
Date Pre
scri
pti
on
s co
mp
lete
d w
ith
in 4
5 m
inu
tes
(%)
PDSA 1 PDSA 2 PDSA 3
55. The role of the pharmacy team in reducing readmissions: general medical patients eligible for NMS not found to be at increased risk of readmission
Upton, S a, b., Culshaw, M b., Stephenson, J b. a Calderdale and Huddersfield NHS Foundation Trust, West Yorkshire, b University of Huddersfield, West Yorkshire
Introduction It has been estimated that around five per cent of hospital admissions are due to preventable adverse drug reactions (1), there is however, little evidence of which medicines are specifically associated with readmission. Prescription of cardiovascular medication at discharge has previously been identified as associated with readmission (2), and because over half of New Medicines Service (NMS) consultations are provided for patients newly prescribed medicines for hypertension, anticoagulants and antiplatelets (3), it could be anticipated that patients whose prescriptions met the NMS criteria may be at increased risk of readmission. The NMS is designed to improve adherence in patients taking medicines to manage specific long term conditions (LTCs) by involving them in decisions about their treatment and optimising the use of medicines. The NMS is targeted to LTCs that contribute to ongoing demand on the National Health Service (NHS), and that are expected to have potential for significant improvements in medicines adherence, health and quality-of-life (4). It has been proven that the NMS improves adherence, and it is consequently thought to improve patient outcomes and reduce medicines-related hospital admissions (3). Medicines started in hospital that meet the NMS criteria require referral for the patient to receive the service, and the Royal Pharmaceutical Society’s Professional Standards for Hospital Pharmacy Services recommend that patients are referred or signposted to appropriate follow-up or support at transitions in care (5). In light of increasing financial pressures and the need to make unprecedented efficiency savings, evidence of readmission reduction, a key quality and financial priority for the NHS, could provide valuable motivation to hospital teams to make referrals to the NMS. Objectives Whilst acknowledging that adherence is governed by many factors, some of which will be outside the professional’s control, this study used prescription data to determine whether prescription of new medicines on discharge, particularly prescriptions meeting the NMS criteria, were associated with an increased risk of readmission. Method Data were collected retrospectively from discharge notes (TTOs) for all patients over 18 years of age discharged from Calderdale and Huddersfield NHS Foundation Trust’s (the Trust’s) Medical Short Stay Units (SSUs) between August 2013 and March 2014. Referrals to the NMS were not routinely made by the Trust. Data collected included demographic and prescription information, as well as whether the patient was readmitted or died within 30 days. All newly prescribed medicines were categorised according to whether they met the NMS criteria (3, 4) or not, and each patient was thereby identified as either potentially eligible, or ineligible for the NMS at the point of discharge. Capacity to consent for and willingness to participate in the NMS were not assessed. Data were analysed by Pearson’s chi-square test and phi coefficient using IBM SPSS Statistics version 22. Ethical approval has been granted for the study. Results TTOs were completed for 1407 patients discharged home from the Trust’s SSUs during the study period. Two hundred thirty-three patients were readmitted and 42 patients died within 30 days. Three-quarters (77%, 1078/1407) of patients were prescribed at least one new medicine (mean 2.5, range 1-13), and 12% (174/1407) were potentially eligible for the NMS on discharge. A small but statistically significant association with readmission (φ=0.071, p=0.009, χ2=6.83) was identified for patients prescribed at least one new medicine (19%, 193/1040) compared with patients not prescribed any new medicine (12%, 40/325). However, a significant association with readmission (p>0.05, χ2=0.006) was not identified for patients whose discharge prescriptions met the NMS criteria (17%, 29/172) compared with patients who were not eligible for the NMS (17%, 204/1193). Discussion/conclusion The association of newly prescribed medicines with readmission demonstrates that pharmacists are ideally placed to identify patients at increased risk of readmission at the point of discharge, if not before. However, the finding that patients whose discharge prescriptions met the NMS criteria were not at increased risk of readmission indicates that they are not necessarily the patients secondary care need to prioritise in order to reduce readmissions. The NMS has been proven to be effective in improving adherence, and there is no evidence to say that the readmission rate for NMS-eligible patients would not have reduced had they received the service. It is noted, however, that the significant improvement in adherence achieved by the NMS after ten weeks was not apparent at week six (3), and the consequences of non-adherence in LTCs may take much longer to develop. Considering that an association with readmission has previously been identified for those prescribed cardiovascular medicines on discharge (2), and over half of NMS consultations are provided for patients receiving medicines for hypertension, anticoagulants and antiplatelets (3), it is surprising that patients whose discharge prescriptions met the NMS criteria were not found to be at increased risk of readmission. It is possible that the inclusion of medicines for asthma, chronic obstructive pulmonary disease and type 2 diabetes, and the exclusion of other cardiovascular medicines from the NMS criteria weakened the association of cardiovascular medicines with readmission. Alternatively, perhaps patients newly started on cardiovascular medicines do not carry the same increased risk as those prescribed cardiovascular medicines in general. It is acknowledged that the group identified as associated with readmission accounted for the majority of patients, and as such further work is being undertaken to identify risk factors for patients not prescribed a new medicine, as well as to further refine the association for those who were. Data are being analysed according to therapeutic class with a view to identifying ‘high-risk’ medicines specific to readmission, it is intended this will be useful to clinical pharmacists for identifying patients at increased risk of readmission in their routine practice. References 1. Pirmohamed M, James S, Meakin S, et al. Adverse drug reactions as cause of admission to hospital: prospective analysis of 18 820 patients. BMJ. 2004;329:15-9. 2. Health Services Research and Pharmacy Practice 2015. A preliminary study identifying prescription factors associated with readmission (accepted). Forthcoming. 3. Elliott RA, Boyd MJ, Waring J, et al. Understanding & Appraising the New Medicines Service in the NHS in England (029/0124). 2014. 4. Department of Health. Introduction of the New Medicine Service Impact Assessment. 2011. 5. Royal Pharmaceutical Society. Professional Standards for Hospital Pharmacy Services. 2014.
56. From Classroom to Consultation–The Impact of Patient Centred Consultation Skills Training on practice Varia, S. Middleton, H. London Pharmacy Education and Training, London
Context Enhancing consultation skills within pharmacy was identified as a key priority to support medicines optimisation as part of the review of post registration development of pharmacy professionals by Modernising Pharmacy Careers (MPC) in 20121. Additionally, the Royal Pharmaceutical Society (RPS) has made patient centred care the focus of the four key principles of medicines optimisation2. This has led to new standards and a national programme for enhancing patient centred consultation skills, developed by the Centre for Pharmacy Postgraduate Education (CPPE) on behalf of Health Education England (HEE)3 - [superseding the MPC]. Pharmacy professionals need to change their interactions with patients and adopt a patient centred approach to improve medicines optimisation. Employers and training providers are encouraged to develop consultation skills training aligned to the new standards to support the delivery of the national programme. But does this facilitate the change in approach required? The aim of this study was to explore the opinions of pre-registration trainee pharmacists (trainees) on their ability to adopt a patient centred approach to consultations following a half-day training intervention by a regional NHS education and training provider. Objectives (between November 2014 and January 2015) - Design evaluation form and collect data on trainees’ opinions about the quality of the training and the extent to which learning outcomes were met - Conduct focus groups to explore trainees’ opinions on the impact of consultation skills training to their practice - Analyse findings from course evaluation and focus groups and evaluate against original aim Method A half-day training session was developed and delivered to 227 trainees working in NHS organisations in London and Midlands and East (East of England, Beds, Essex and Herts). An evaluation form was designed and used post course to collect quantitative data on trainees’ opinions on the extent to which the learning outcomes were met, using a 4-point Likert scale. Open questions were used to gather opinions on training quality. A self-selected sample of trainees participated in a focus group nine weeks post training. Open questions were used to explore trainees’ opinions on the impact of consultation skills training to their practice. Quantitative data was collated and reported as percentages and qualitative data was themed to support quantitative analysis. Ethics approval was not required as this was an evaluative study of opinions of NHS pharmacy staff on impact of training upon their practice. Results Course Evaluation: 91.2% (n=207/227) of trainees completed an evaluation form. The majority of trainees thought that the learning outcomes for the session had been met. See table 1.0. Qualitative data: Trainees believed the training enabled the application of learning and a desire to change practice: “The role plays helped in putting the theory, knowledge and skills into practice.” “..has changed the way I will ...deal with patients.” “..ready to adopt a more patient centred approach...” Limitations of the training included: “Showing how it could be done within the time pressures…would be very useful.” Table 1.0: Extent to which Learning Outcomes Met
Learning Outcome: Trainees should be able to:
Strongly agree
Agree Disagree Strongly disagree
describe the meaning of patient centred consultations 137/206 66.5%
68/206 33%
1/206 0.5%
0 0%
summarise the reasons for non-adherence to medicines 115/207 55.5%
90/207 43.5%
2/207 1%
0 0%
describe the steps of the Calgary-Cambridge guide to structure a patient centred consultation
119/203 58.5%
81/203 40%
2/203 1%
1/203 0.5%
identify the skills, knowledge and behaviours necessary to conduct an effective patient centred consultation
127/204 62%
71/204 35%
5/204 2.5%
1/204 0.5%
list questions that can be used during a structured patient centred consultation
126/204 61.8%
77/204 37.7%
1/204 0.5%
0 0%
conduct a structured patient centred consultation 125/205 61%
77/205 37.5%
2/205 1%
1/205 0.5%
Focus Groups: 9.3% (n = 21/227) of trainees who had attended the training took part. Themes describing trainees’ opinions of how they had applied their learning included; rapport: “I always make a point of doing this now. Patients seem more friendly and helpful.”; listening and asking [rather than telling]: “..I have found out information from the patient that was very relevant as to why their treatment had failed and no-one else had listened or asked any questions that had got to that.”; treating the patient as an equal expert: “..had a patient who preferred..herbal medicines. I had to understand her perspective..”; encouraging patient responsibility for decisions: “I now ask - Is there anything you could do to help you remember to take your medicines?” Trainees said they needed more support to manage complex consultations e.g. mental health patients [beyond the scope of the original session]. Discussion and Conclusions The majority of trainees believed the learning outcomes for the session were met. Qualitative data from the evaluation form supported this finding with trainees giving examples of applying their learning during the session and being ready to adopt a patient centred approach to consultations. Focus group discussions demonstrated that trainees had started adopting a patient centred approach with potential for delivering improvements in medicines optimisation. A limitation is potential bias towards positive examples of application of the learning due to the use of a self selected sample for the focus groups. Additional training could address challenges to patient centred approaches e.g. short consultations and managing patients with complex needs and conditions. References 1. Modernising Pharmacy Careers programme; Review of post-registration career development: Next Steps; Medical Education England; July 2012; p25-27. 2. Royal Pharmaceutical Society; Medicines optimisation: helping patients to make the most of medicines: Good practice guidance for healthcare professionals in England; May 2013; London; RPS; 2013. 3. Centre for Pharmacy Postgraduate Education (CPPE) on behalf of Health Education England (HEE); Consultation Skills for Pharmacy Practice; http://www.consultationskillsforpharmacy.com/ Accessed 11 February 2015.
57. An Audit to Assess the Quality of Rivaroxaban Prescribing at Medway NHS Foundation Trust Wallis E, Austin A, Medway NHS Foundation Trust
Introduction There has been a multitude of prescribing errors1 involving the New Oral Anticoagulants (NOACs) at Medway NHS Foundation Trust (MFT) from October 2013 to May 2014. Between 1 and 5 errors were reported each month. Many were potentially serious and a patient fatality occurred which may have been attributed to the co-prescribing of dabigatran with dalteparin and an antiplatelet. Consequently, it was decided that rivaroxaban would be the only NOAC available on MFT’s formulary2 and from May 2014 rivaroxaban prescribing would be consultant initiated only. Rivaroxaban was also removed from ward stock. The pharmacy department embarked on a major educational programme for medical and nursing staff to improve their knowledge on rivaroxaban prescribing. Aim To assess whether any rivaroxaban prescribing errors occurred in July 2014 and to ascertain the type of errors made. To identify if NOAC training has reduced the number of rivaroxaban prescribing errors at MFT. Objectives
All patients newly prescribed rivaroxaban should have been consultant initiated and this documented in the medical notes.
All patients should have the correct dose of rivaroxaban prescribed for the indication for treatment as per the Summary of Product Characteristics (SPC)3.
All patients converted from dalteparin to rivaroxaban should have a 24 hour gap between the last dose of dalteparin administered and the first dose of rivaroxaban.
All patients prescribed rivaroxaban should not have any concomitant anticoagulants prescribed.
All patients prescribed rivaroxaban should not have any doses omitted unless there is a clinically significant reason. Method The audit was conducted from 1st to 31st July 2014. A data collection table was designed and distributed to ward pharmacists. Pharmacists were asked to complete the table for any patient prescribed rivaroxaban. Information was recorded on:
whether or not the patient was newly initiated
doses prescribed
concomitant anticoagulants or antiplatelets prescribed
conversion of dalteparin to rivaroxaban
omitted doses. The usage of rivaroxaban from the pharmacy emergency drug cupboard (EDC) and the number of Datix incidents were also monitored. Ethics approval was not required.
Results 19 patients were audited. There was an approximate equal split between new and existing patients with the majority (89%) being medical patients. Out of 10 newly initiated patients only 1 (10%) was not initiated by a consultant. One patient (5%) out of 19 had an incorrect dose of rivaroxaban prescribed. 8 newly initiated patients were converted from dalteparin to rivaroxaban. Of these 8 patients, 3 (38%) were not given a 24 hour gap between the last dose of dalteparin administered and the first dose of rivaroxaban. One patient (5%) out of 19 had a concomitant anticoagulant (fondaparinux) prescribed. 1 patient (5%) was co-prescribed an antiplatelet. The combination of rivaroxaban with aspirin was appropriate and was not classed as a prescribing error. Two patients (11%) had doses of rivaroxaban omitted. One was prescribed rivaroxaban for atrial fibrillation (AF) and had 7 doses omitted with no documented reason as to why. The other patient was prescribed rivaroxaban for a previous pulmonary embolism (PE) and missed one dose due to awaiting pharmacy to order. Only one Datix incident report relating to rivaroxaban prescribing was filed in July. The incident related to an omitted dose of rivaroxaban for a patient with a venous thromboembolism (VTE) as no administration time had been documented on the drug chart. Discussion Only a small number of patients were audited. Possible reasons for this included a reduction in the prescribing of rivaroxaban following increased awareness amongst clinicians of prescribing errors that had occurred, and lack of reporting by pharmacists. No audit data was submitted from the stroke ward which frequently uses rivaroxaban. The majority of patients’ therapy was consultant initiated illustrating that clinicians were familiar with MFT’s prescribing guidelines. One incorrect dose was recorded for a patient transferred from warfarin to rivaroxaban. The patient was prescribed 15mg twice daily for 21 days despite the VTE occurring a year ago. It is unclear from the SPC3 that a loading dose is only necessary for 21 days post diagnosis, therefore this is not a significant error. Many Datix1 incidents prior to rivaroxaban training involved patients prescribed incorrect doses for their indications e.g. 15mg daily instead of twice daily, for PE. Thus this audit shows a vast improvement in terms of correct doses prescribed. However, the audit identifies that further learning is required around converting patients from dalteparin to rivaroxaban. All patients involved were prescribed rivaroxaban for AF. The dose of dalteparin was not documented on the data collection form and therefore the bleeding risk cannot be determined. For future audits this data should be collated as well as the exact time lag between the last dose of dalteparin and the first dose of rivaroxaban. The error rate of anticoagulant co-prescribing was low. This was significant as a number of Datix1 reports had involved the co-prescribing of dalteparin with rivaroxaban. Further guidance is required for clinicians managing patients with acute coronary syndromes who are prescribed rivaroxaban prior to admission. A small number of patients had omitted doses of rivaroxaban. No dose of rivaroxaban should be missed especially if prescribed for DVT or PE. All strengths of rivaroxaban are stocked in the pharmacy EDC. No stock of rivaroxaban was taken from the pharmacy EDC during July 2014.
The prescribing of rivaroxaban at Medway NHS Foundation Trust has markedly improved most likely due to the education of medical and nursing staff. This will be enhanced further when simulation training involving NOACs and the bleeding patient will be delivered at F1 and F2 teaching sessions in September 2014. The 2 main areas that need further improvement are the need for a 24 hour gap between dalteparin and rivaroxaban and omitted doses. References 1. Medway NHS Foundation Trust Datix Incident Reports October 2013-May 2014 2. Medway and Swale Joint Formulary www.medwayswaleformulary.co.uk (accessed 31 March 2014) 3. Xarelto™ (Rivaroxaban) Summary of Product Characteristics, Bayer Plc
58. A randomised controlled trial comparing the East of England Unified Drug Chart (EE UDC) with the Royal College of Physicians (RCP) recommended Drug Chart
Willimott H a, Wright D b, Farrow C a, Brett B c, a Norfolk & Norwich University Hospitals NHS Foundation Trust, UK. b School of Pharmacy, University of East Anglia, UK. c James Paget University Hospital NHS Trust
Introduction A substantial proportion of medication errors reported to the National Patient Safety Agency are related to prescribing1, in the UK a recent study in acute hospitals the rate of prescribing errors was found to be 8.9%2. The use of different prescription charts and therefore the need to learn a new set of rules for their completion in every hospital has been cited as a factor contributing to these errors3. This is supported by a study in Queensland Australia where implementation of a standard drug chart led to a reduction in prescribing errors4. In 2014 a multidisciplinary team from hospitals across the East of England began a project to produce a unified chart that could be used in acute Trusts but also in mental health and community hospitals. The EE UDC drug chart was developed following consultation of over 1000 healthcare staff from 20 Trusts across the East of England. Over 30 drug charts from the UK along with some international examples were reviewed during the process. Part way through development of the EE UDC the RCP made a recommendation for an existing UK chart to become the standard chart for all UK hospitals. Objectives To compare use of the EE UDC against the RCP recommended chart among a naive population of junior Doctors with respect to;
Accuracy of chart completion
Appropriate location of information
Appropriateness of information recorded
Usability with respect to amount of space available for completion and user opinions
Completion time Method Two matched sets of two prescribing scenarios were developed, the first set were based on an admission clerking, the second set based on amending or stopping medicines on an existing chart. High-risk areas of prescribing were incorporated throughout the scenarios. Twenty-six newly qualified Doctors were randomly allocated to complete four scenarios each (two using the EE UDC and two using the RCP chart). To reduce any effects of familiarity and fatigue the order each Doctor completed the scenarios and on which chart were varied. Each completed chart was assessed according to the study objectives. Consistency in marking was achieved by using model answers and independent double-checking. A percentage correct score was calculated by dividing the number of criteria achieved by the total number of criteria which could have been met and multiplying by 100. 95% confidence intervals were calculated and where no overlap was identified the two sets of results were deemed to be significantly different. Qualitative feedback regarding use of the two charts was collected at the end of the session. Ethics approval was deemed to not be required as the project was considered to be part of a service development. Results 26 doctors competed the user testing. The percentage correct score for each of the initial objectives by chart and scenario type are shown in figure 1. Completion times for each scenario were not statistically different between the two charts. In the associated qualitative feedback 100% of testers thought the EE chart supported safer documentation of prescriptions and 88% found it easier to use than the RCP chart. Figure 1: % Correct Scores: EE UDC Vs RCP recommended chart, (*significant difference)
Discussion Quality of completion was found to be high for both charts when used by naïve Doctors. Importantly the EE UDC was not found to be inferior to the RCP recommended chart with respect to safe and accurate prescribing or completion times. User Feedback relating to usability and perceived safety favoured the EE UDC. Detailed analysis of scenario completion has shown the main advantage of the EE UDC to be a layout that allows sufficient space for all the required information to be clearly documented. Compromised space to write key information such as drug name or dose may encourage use of made up or unsafe abbreviations such as ‘IU’ instead of ‘units’. Extra small or squashed handwriting is also likely to be more difficult to read, again with the potential to lead to administration and/or dispensing errors. The EE UDC also appeared to be superior with respect to promoting all the required information being present. This was however only significant for the scenarios focusing on amending an existing prescription and was likely to be due to poor completion of the dose amendment feature of the RCP chart. Significant limitations that should be noted include small sample size, the fact that it is impossible to recreate real life pressures in classroom-based scenarios and that by providing scenarios the testers had to be given all the required information. The benefit of set fields in the EE chart to prompt for required information (e.g. indications and stop / review dates for antimicrobials) may therefore have been diluted. As scenario testing has discovered no significant design flaws it is recommended that the EE chart is now piloted in a real life environment. References 1. Cousins DH, Gerrett D, Warner B. A review of medication incidents reported to the National Reporting and Learning System in England and Wales over 6
years (2005–2010). Br J Clin Pharmacol 2012;74(4):597–604. 2. Dornan T, Ashcroft D, Heathfield H Lewis P, Miles J, et al. (2009) An in-depth investigation into causes of prescribing errors by foundation trainees in
relation to their medical education: EQUIP study. (accessed 12/1/15) http://www.gmc-uk.org/FINAL_Report_prevalence_and_causes_of_prescribing_errors.pdf_28935150.pdf
3. Franklin B, Reynolds M, Shebl NA, et al. Prescribing errors in hospital inpatients: a three-centre study of their prevalence, types and causes. Postgrad Med J 2011;87:739–45.
4. Coombes ID, Stowasser DA, Reid C, Mitchell CA. Impact of a standard medication chart on prescribing errors: a before-and-after audit. Qual Saf Health Care 2009;18:478–485.
5. Academy of Medical Royal Collages. Standards for the design of in-patient prescription charts. 2012. Acknowledgement: Development of a unified drug chart was sponsored by a grant from the Eastern Academic Health Science Network (EAHSN).
0 10 20 30 40 50 60 70 80 90 100
Appropriate information (Amendments to existing chart scenario)
Appropriate information (Chart initiation scenario)
Correct place (Amendments to existing chart scenario)
Correct place (Chart initiation scenario)
Sufficient space (Amendments to existing chart scenario) *
Sufficient space (Chart initiation scenario) *
Required info present (Amendments to existing chart scenario) *
59. An audit on the use of MaPPs (Medicines: A patient profile summary) leaflets on discharge from hospital Zamir. A, Pharmacy department, Surrey and Sussex NHS Healthcare Trust
Introduction: In 2012 a local inpatient survey found that only 40% of patients received information on new medication in an accessible format at discharge, (supported by 45% in the Empathica survey1.) As a result of this a local CQUIN (Commissioning for Quality and Innovation) payment framework was set up. This stated that 95% of patients should receive verbal/written information, where appropriate, from staff (medical, nursing, pharmacy) at discharge if any changes to their medication has taken place during their admission to hospital. This included medication type, dose, side effects, regime, route and frequency. This led to the business proposal of implementing MaPPs leaflets and supplying on discharge2. In 2014 the MaPPs programme was launched to help meet our local CQUIN target as limited medicines information was available to patients in an accessible format. The MaPPs system contains concise information for over 5000 medicines, providing a summary of the type of drug, use of drug, main side effects and major cautions and contraindications. It uses patient friendly language and summarises each drug in about 150 words. The new process implemented in the discharge process involved issuing a MaPPs leaflet to each patient discharged on new medicines. The utilisation of this new service needed to be audited to ensure patients were gaining benefit and the hospital was utilising this new resource efficiently. It is a high priority for the Trust, especially the pharmacy department, to ensure the system is optimising patients’ use of their medicines and will contribute in meeting our CQUIN target. Objectives: The standards set for the audit were as follows: 1. 100% of patients/carers should receive a discharge letter 2. 100% of patients started on a new medication should be issued with a MaPPs leaflet on discharge 3. 100% of patients should have new medication explained to them on discharge using the MaPPs leaflet 4. 100% of patients/carers should understand the purpose of new medications and side effects from the MaPPs leaflet on assessment, 2 weeks post
discharge. 5. 100% of patients find the MaPPs leaflet contains beneficial information on both medication use and side effects
Method: A data collection form was designed to collect all the relevant data. A pilot was conducted on AMU (acute medical unit) as well as completed by the discharge team for 2 days. Data was then collected for one week from 7th July 2014 to 11th July 2014 for all patients discharged on new medication during pharmacy working hours. The following exclusions were applied: patients for whom there was a medication dose change, patients commenced on an unlicensed medication, palliative care patients, children and adults subject to safeguarding concerns, and patients cared for on the Intensive care (ITU), high dependence unit (HDU) and neonatal unit (NNU.). Data was collected by ward pharmacists and summer students using the amended collection tool. 90 patients were captured during data collection, which exceeded the intended 50. Results were then analysed. From the patients issued a MaPPs leaflet a minimum of 30 were to be randomly selected and contacted 2 weeks post discharge for a follow up telephone questionnaire using the designed form. Consent did not need to be obtained at this point for the follow up, and all patients randomly selected were screened by the audit department for appropriateness before contacting. Patient consent was gained when speaking to patients on the phone. Ethics approval was not needed for this audit.
Results: 90 patient discharges were recorded during the 1 week data collection period from which only 73% (66) of patients received a MaPPs leaflet. Leaflets were not issued due to time constraints and the MaPPs system not working or containing inappropriate indications for the medications. From the 66 patients issued a MaPPs leaflet 30 (45%) were counselled by the pharmacist and 36 (55%) by the nurse. 40 patients were randomly selected for a follow up questionnaire and only 30 responded. (Response rate=75%.) 0% of patients found the MaPPS leaflet to be ‘not useful or ‘slightly useful.’ 30% of patients found it to be ‘useful’, 40% found it ‘somewhat useful’ and 30% found it to be ‘very useful’. Further results from the telephone questionnaire are shown in Table 1 below.
Table 1: Questions and responses to the telephone questionnaire 2 weeks post discharge (n=30)
Discussion and conclusion: Only 97% (29/30) of patients received a discharge letter which indicates the discharge process needs to be reviewed. This may be due to poor communication on discharge, as letters may be handed to patients in the bag without notifying them. 73% (66/90) of patients started on new medication were issued out a MaPPs leaflet on discharge. This did not meet the second standard and reasons included time constraints and the IT system not working or having the correct information. This shows the MaPPs system needs to be assessed to ensure all indications of medications are listed and it is easily accessible from all areas of the hospital. Training the nursing staff to produce and issue MaPPs leaflets on discharge may help meet our 100% standard. Response rate for the questionnaire was good at 75% (30/40), however due to a small sample size the validity of the results may not be significant and may not provide a true reflection of the impact the MaPPs leaflet is having on discharge. Another limitation was the narrow time scale for this audit and undertaking a telephone questionnaire, only a small sample of patients could be contacted as it was time consuming, thus a postal questionnaire could be done in the future to provide a better scope and obtain feedback from a larger patient group. 100% of patients were explained their medication on discharge. Only93% (28/30) of patients understood the purpose of the new medications and side effects 2 weeks post discharge. This may have been due to patients not being able to recall a member of staff going through it with them or staff not counselling. All patients followed up thought that the MaPPs leaflet was ‘useful’ to ‘very useful’, thus showing the new system is beneficial as scores for medication counselling improved. Overall the audit results showed that when MaPPs leaflets are provided on discharge, they help patients understand the new medication they were prescribed and they found it to be beneficial for the discharge service. A yearly re-audit should be undertaken to ensure continual compliance and improvement, with this system.
http://www.cqc.org.uk/sites/default/files/inpatient_survey_national_summary.pdf accessed: 1/8/2014 2. Recording Medicines Information for patients with new/ changed medicines at discharge. Surrey and Sussex Healthcare NHS Trust. Pharmacy
Department guidelines. March 2014
Number Question asked Response (%)
Yes No
1 Did you receive a discharge letter 97 (n=29) 3 (n=1)
2 Were you given a MaPPs leaflet on discharge 93 (n=28) 7 (n=2)
3 Did a staff member go through the MaPPs leaflet with you 83 (n=25) 17 (n=5)
4 Do you think the MaPPs leaflet explained new medication clearly 93 (n=28) 7 (n=2)
5 Do you think the MaPPs leaflet explained side effects clearly 93 (n=28) 7 (n=2)