CoA|OLbDD 1 Abu Qir Fertilizers (ABUK.CA) Initiation of Coverage May 2019 Stock Data Name: Abu Qir Fertilizers Reuters Code ABUK.EY Sector: Fertilizers Industry: Petrochemicals Number of Stocks 1,261,875,720 Issued Capital (EGP mn) 1,893 Market Cap (EGP mn) 30,462 52 week High/Low (EGP) 33.94/ 22.59 Free Float 30.02% Recommendation BUY Fair value 28.46 Market Price (As of May 22,2019) 24.14 Potential 17.9% Source: Investing& AOLb Research Amal Nada Equity Analyst [email protected]A Sensitive Stock to probable Catalysts We Initiated a coverage on one of Egypt’s largest producers of fertilizers, Abu Qir Fertilizers co (ABUK.CA) with a FV of EGP28.46/share with a recommendation of BUY. However, we view that the stock has four main catalysts that would upsurge the TP of ABUK. These catalysts are: 1) the current negotiations regarding changing subsidized fertilizers mechanism and floating prices 2) the recent natural gas discoveries that would support the companies appeals to reduce the natural gas pricing for fertilizers companies 3) Upgrading NPK unit project and Methanol and Calcium Ammonium Nitrite (CAN) Project that would increase the company sellable products from 3.2mn ton/year as the CAN project would increase the company’s sellable capacity by 2mn ton of both methanol and CAN 4) the governmental endeavors to reclaim 1.5mn feddan that would enhance the local demand for fertilizers. An Undervalued Stock We valued ABUK using a DCF with a TP of EGP28.46/share, with a BUY recommendation on the back of a 17% upside potential. We used a WACC of 19% and a terminal growth rate of 4%. ABUK is trading at a P/E EV/EBITDA of 12.59x and 15x respectively that comes a little bit below the international peers’ averages of 16.14x and 16.65x. ABUK’s share is expected to offer a divided yield of 8% in FY2020 at a payout ratio of 57%. However, we foresee a probable decline within the payout ratio if the company decided to pursue the announced understudying projects of Upgrading NPK unit project and calcium Ammonium Nitrate Project. Financial Indicators FY2019e FY2020f FY2021f FY2022f FY2023f Revenues (EGP bn) 9.21 10.51 11.24 13.25 16.84 Net Profit (EGP bn) 3.95 4.33 4.69 6.04 8.49 EPS (EGP) 3.13 3.43 3.72 4.79 6.73 RoA 34% 34% 34% 37% 41% RoE 72% 71% 68% 77% 93% P/E (x) 7.72 7.03 6.49 5.04 3.59 EV/EBITDA (x) 5.65 4.33 3.71 2.45 1.30 Divided Yield 7.4% 8.1% 8.8% 11.3% 15.9% Based on closing price of May 22, 2019. Source: ABUK & AOLb Research 5 15 25 35 45 Apr-18 May-18 Jun-18 Jul-18 Aug-18 Sep-18 Oct-18 Nov-18 Dec-18 Jan-19 Feb-19 Mar-19 ABUK & EGX30 Rebased ABUK EGX30
Transcript
CoA|OLbDD
1
Abu Qir Fertilizers (ABUK.CA) Initiation of Coverage May 2019
Stock Data Name: Abu Qir Fertilizers Reuters Code ABUK.EY Sector: Fertilizers Industry: Petrochemicals Number of Stocks 1,261,875,720 Issued Capital (EGP mn) 1,893 Market Cap (EGP mn) 30,462
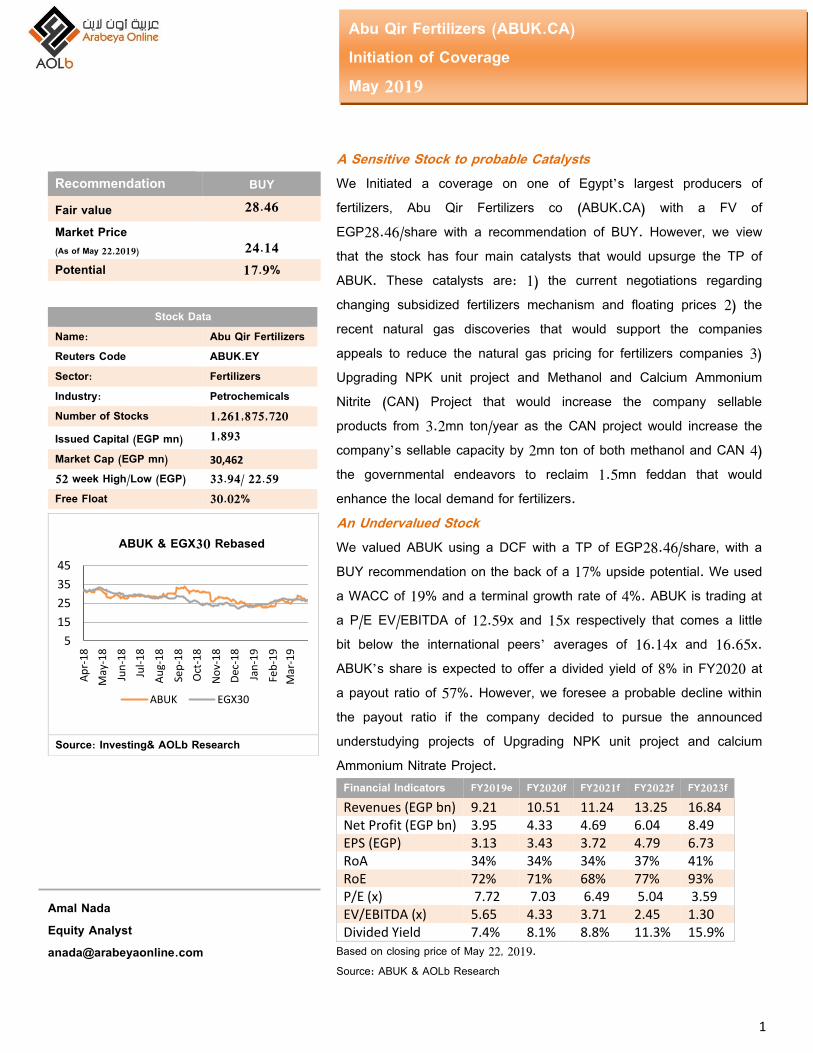
A Sensitive Stock to probable Catalysts We Initiated a coverage on one of Egypt’s largest producers of fertilizers, Abu Qir Fertilizers co (ABUK.CA) with a FV of EGP28.46/share with a recommendation of BUY. However, we view that the stock has four main catalysts that would upsurge the TP of ABUK. These catalysts are: 1) the current negotiations regarding changing subsidized fertilizers mechanism and floating prices 2) the recent natural gas discoveries that would support the companies appeals to reduce the natural gas pricing for fertilizers companies 3) Upgrading NPK unit project and Methanol and Calcium Ammonium Nitrite (CAN) Project that would increase the company sellable products from 3.2mn ton/year as the CAN project would increase the company’s sellable capacity by 2mn ton of both methanol and CAN 4) the governmental endeavors to reclaim 1.5mn feddan that would enhance the local demand for fertilizers. An Undervalued Stock We valued ABUK using a DCF with a TP of EGP28.46/share, with a BUY recommendation on the back of a 17% upside potential. We used a WACC of 19% and a terminal growth rate of 4%. ABUK is trading at a P/E EV/EBITDA of 12.59x and 15x respectively that comes a little bit below the international peers’ averages of 16.14x and 16.65x. ABUK’s share is expected to offer a divided yield of 8% in FY2020 at a payout ratio of 57%. However, we foresee a probable decline within the payout ratio if the company decided to pursue the announced understudying projects of Upgrading NPK unit project and calcium Ammonium Nitrate Project. Financial Indicators FY2019e FY2020f FY2021f FY2022f FY2023f Revenues (EGP bn) 9.21 10.51 11.24 13.25 16.84 Net Profit (EGP bn) 3.95 4.33 4.69 6.04 8.49 EPS (EGP) 3.13 3.43 3.72 4.79 6.73 RoA 34% 34% 34% 37% 41% RoE 72% 71% 68% 77% 93% P/E (x) 7.72 7.03 6.49 5.04 3.59 EV/EBITDA (x) 5.65 4.33 3.71 2.45 1.30 Divided Yield 7.4% 8.1% 8.8% 11.3% 15.9%
Based on closing price of May 22, 2019. Source: ABUK & AOLb Research
5
15
25
35
45
Ap
r-1
8
May
-18
Jun
-18
Jul-
18
Au
g-1
8
Sep
-18
Oct
-18
No
v-1
8
Dec
-18
Jan
-19
Feb
-19
Mar
-19
ABUK & EGX30 Rebased
ABUK EGX30
CoA|OLbDD
2
Abu Qir Fertilizers (ABUK.CA) Initiation of Coverage May 2019
Table of Contents
Global Fertilizers Industry Overview ............................................................................................................ 2
The Fertilizers Exemplify a Necessity for The World Agriculture .................................................................... 2
World Records A Surplus in Nitrogen Fertilizers ................................................................................................ 4
China as a Major Player in the International Fertilizers Market .................................................................. 5
Arab Countries Dominates A Significant Share of the Global Production ....................................................... 6
Egyptian Market outlook ......................................................................................................... 7
Fertilizers Segment to Get More Significant Within the Egyptian Economy ..................................................... 7
The local capacity to surge within the coming years ......................................................................................... 7
Egypt’s further steps in 1.5mn-feddan: An Impulse to the Fertilizers Sector ................................................... 8
Ministry Of Agriculture to Regulate the Egyptian Market through an Inefficient Way ..................................... 8
Abu Qir Fertilizers Company ........................................................................................................................ 9
Company Overview ............................................................................................................................................ 9
Capital Increases to Fit the Expansions .............................................................................................................. 9
Market Regulations Came in Favor of ABUK .................................................................................................... 10
ABUK Dominates a Solid Market Share ............................................................................................................ 10
Abu Qir Fertilizers (ABUK.CA) Initiation of Coverage May 2019
The Fertilizers Exemplify a Necessity for The World Agriculture
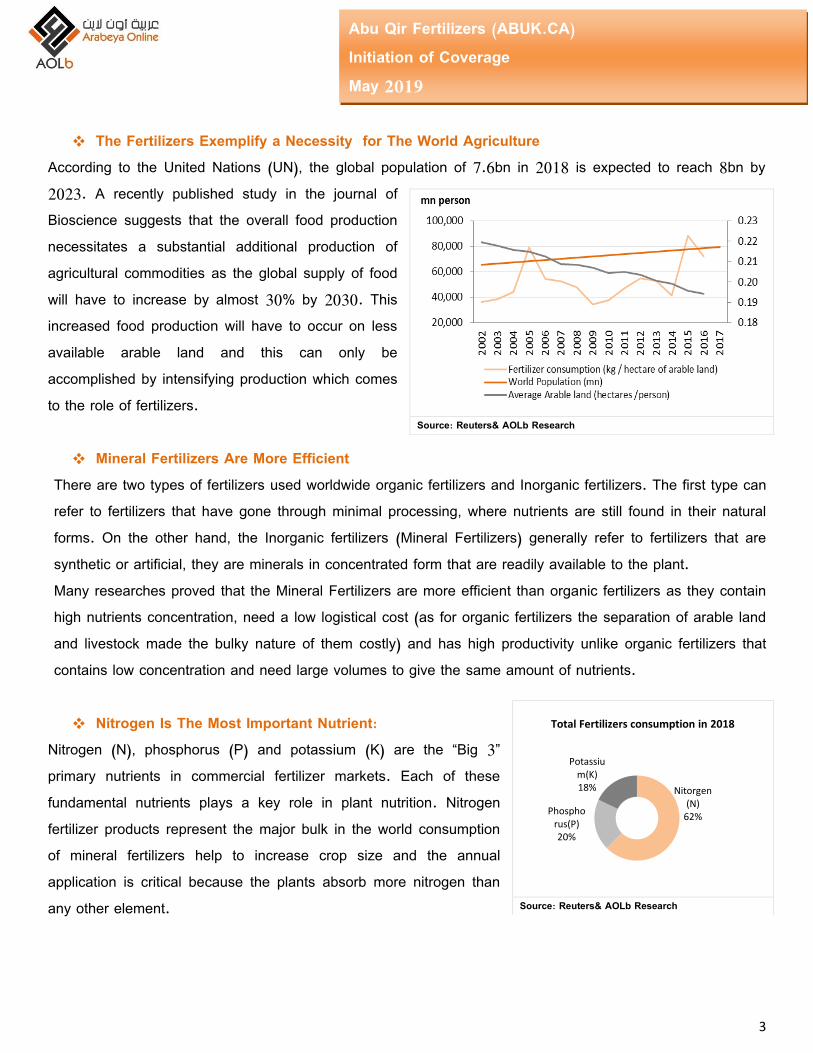
According to the United Nations (UN), the global population of 7.6bn in 2018 is expected to reach 8bn by 2023. A recently published study in the journal of Bioscience suggests that the overall food production necessitates a substantial additional production of agricultural commodities as the global supply of food will have to increase by almost 30% by 2030. This increased food production will have to occur on less available arable land and this can only be accomplished by intensifying production which comes to the role of fertilizers.
Mineral Fertilizers Are More Efficient There are two types of fertilizers used worldwide organic fertilizers and Inorganic fertilizers. The first type can refer to fertilizers that have gone through minimal processing, where nutrients are still found in their natural forms. On the other hand, the Inorganic fertilizers (Mineral Fertilizers) generally refer to fertilizers that are synthetic or artificial, they are minerals in concentrated form that are readily available to the plant. Many researches proved that the Mineral Fertilizers are more efficient than organic fertilizers as they contain high nutrients concentration, need a low logistical cost (as for organic fertilizers the separation of arable land and livestock made the bulky nature of them costly) and has high productivity unlike organic fertilizers that contains low concentration and need large volumes to give the same amount of nutrients.
Nitrogen Is The Most Important Nutrient:
Nitrogen (N), phosphorus (P) and potassium (K) are the “Big 3” primary nutrients in commercial fertilizer markets. Each of these fundamental nutrients plays a key role in plant nutrition. Nitrogen fertilizer products represent the major bulk in the world consumption of mineral fertilizers help to increase crop size and the annual application is critical because the plants absorb more nitrogen than any other element.
Abu Qir Fertilizers (ABUK.CA) Initiation of Coverage May 2019
There are various nitrogen fertilizer products such as anhydrous ammonia, urea, Ammonium nitrate and other
multiple nutrient products while the most commonly used nitrogen fertilizer is urea with the highest nitrogen
content (about 46%).
World Records A Surplus in Nitrogen Fertilizers
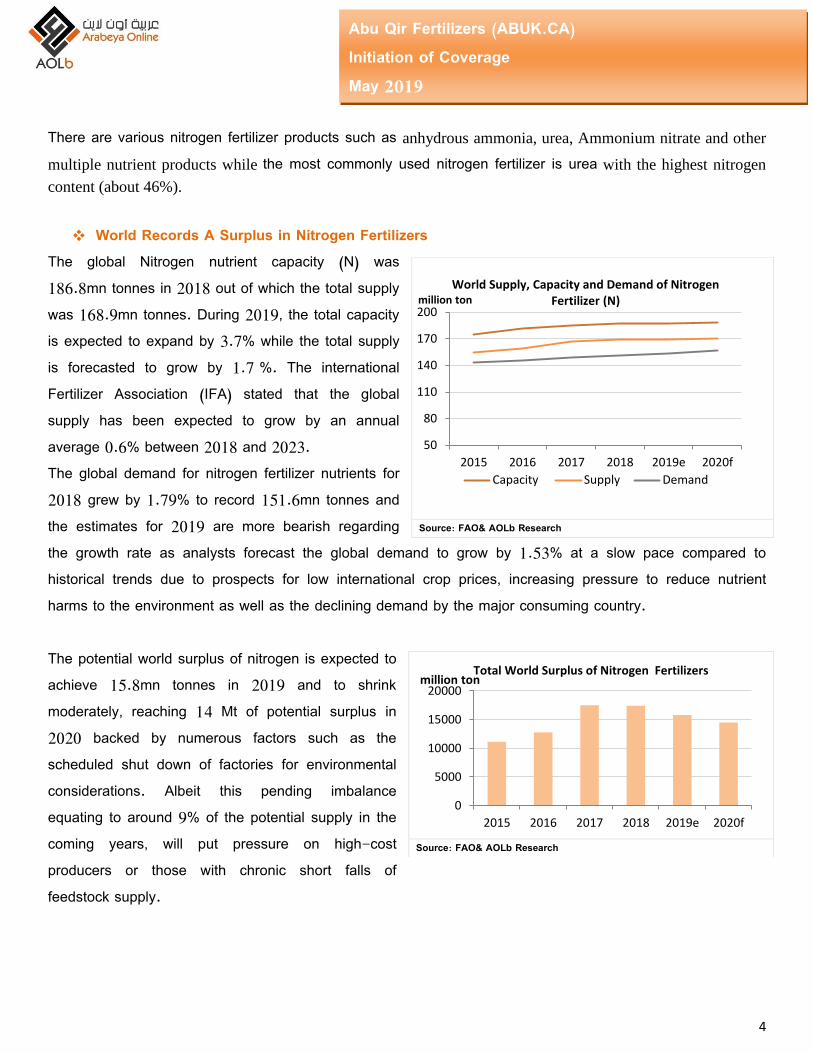
The global Nitrogen nutrient capacity (N) was 186.8mn tonnes in 2018 out of which the total supply was 168.9mn tonnes. During 2019, the total capacity is expected to expand by 3.7% while the total supply is forecasted to grow by 1.7 %. The international Fertilizer Association (IFA) stated that the global supply has been expected to grow by an annual average 0.6% between 2018 and 2023. The global demand for nitrogen fertilizer nutrients for 2018 grew by 1.79% to record 151.6mn tonnes and the estimates for 2019 are more bearish regarding the growth rate as analysts forecast the global demand to grow by 1.53% at a slow pace compared to historical trends due to prospects for low international crop prices, increasing pressure to reduce nutrient harms to the environment as well as the declining demand by the major consuming country. The potential world surplus of nitrogen is expected to achieve 15.8mn tonnes in 2019 and to shrink moderately, reaching 14 Mt of potential surplus in 2020 backed by numerous factors such as the scheduled shut down of factories for environmental considerations. Albeit this pending imbalance equating to around 9% of the potential supply in the coming years, will put pressure on high-cost producers or those with chronic short falls of feedstock supply.
Source: FAO& AOLb Research
Source: FAO& AOLb Research
0
5000
10000
15000
20000
2015 2016 2017 2018 2019e 2020f
million ton Total World Surplus of Nitrogen Fertilizers
50
80
110
140
170
200
2015 2016 2017 2018 2019e 2020f
million ton World Supply, Capacity and Demand of Nitrogen
Fertilizer (N)
Capacity Supply Demand
CoA|OLbDD
5
Abu Qir Fertilizers (ABUK.CA) Initiation of Coverage May 2019
China as a Major Player in the International Fertilizers Market
China is the world’s largest producer and exporter of nitrogen fertilizers. The Chinese government crackdown on heavy polluters, starting in June 2016, has led to temporary closures of fertilizer plants as the majority of china’s fertilizers factories are using coal extensively that have much larger emissions than gas based manufactories. On the demand side, Asia Pacific is the most important region for fertilizer consumption, accounting for over 60% of global demand for nitrogen fertilizers due to the large population and suitability of urea for the climate in the region. Demand growth in Asia Pacific is mainly driven by demand growth in China and India, the two most populous countries in the region. China is the largest urea consuming country in the world, with one third of total global urea production consumed in the People’s Republic China’s demand for nitrogen fertilizer is expected to have a declining trend as the Chinese Ministry of Agriculture (MOA) announced that they would launch a campaign on zero growth of the fertilizer consumption by 2020. After China, India is the second largest ammonia consumer in the world, with a demand of about 17.7mt in 2018. With little consumption in industrial applications or biofuel fertilizer, 99% of urea in the country is used for direct application for growing food crops. Farmers in India tend to heavily favor urea but this has resulted in the overuse of urea which in turn has adversely affected soil quality and crop yield in many regions. Concerns over the effect of the over application of fertilizers and its environmental implications is slowing down future urea consumption in India.
Source: FAO& AOLb Research
Source: FAO& AOLb Research
0
10,000
20,000
30,000
40,000
China India USA Brazil Pakistan
million ton N Consumption in 2017/18
0
20,000
40,000
60,000
80,000
China Russia USA India Indonisia
million ton
Top Nitrogen Procducing Countries in 2017/2018
CoA|OLbDD
6
Abu Qir Fertilizers (ABUK.CA) Initiation of Coverage May 2019
International Fertilizers to Rise in 2019 on Supportive Fundamentals
Fertilizers industry is affected by economic prospects, crop prices, rising market competition and volatile energy prices. The World Bank’s Fertilizer Price Index is expected to rise by 2% in 2019, following an increase of 9% in 2018 on high-energy costs, tight supplies in some areas and a projected food commodities marginal increase in 2019.
Arab Countries Region Dominates a Significant Share of the Global Production According to Arab Fertilizers Association (AFA), Arab Countries dominates the global production and world trade of ammonia with 11% and 25% respectively. The Arab Countries also have significant stake in the international urea market with 41% of the global trade and 15% of the global production. Egypt is considered a leading producer in the field of fertilizers among the Arab countries in the production of nitrogen fertilizers including ammonia and urea with a market share of 24% and 23% respectively among Arab producing countries.
Egyptian Fertilizers Market Outlook There are 8 companies in Egypt working within nitrogen fertilizers production totaling at 22mt while the annual local consumption has recorded 12mt in 2018. The Eight producing companies are Abu Qir Fertilizers (ABUK.CA), Egyptian Chemical Industries (EGCH.CA), Misr Fertilizers Production (Mopco) (MFPC.CA), Delta Company for Fertilizers, Helwan Fertilizers Co, Alexandria Fertilizer Co. (ALEXFERT), El Nasr Co. for Fertilizer & Chemical Industries (SEMADCO) and Egyptian Fertilizer Company. These mentioned companies use the remaining production in exporting to around 20 Arab, European countries as well as the United States.
Source: FAO& AOLb Research
0
1000
2000
3000
4000
5000
6000
Egypt SaudiArabia
Qatar Algeria Oman UAE kuwait Bahrain
000' tons Arab Production of Ammonia in 2018
CoA|OLbDD
7
Abu Qir Fertilizers (ABUK.CA) Initiation of Coverage May 2019
Fertilizers Segment to Get More Significant Within the Egyptian Economy
Egyptian exports of fertilizers are back to pop up after a plunge in 2015 as fertilizers exports grew at a CAGR of 35% since 2015 to record USD1,374mn in 2018 compared to USD410mn in 2015. Through the flourishing exports Abu Qir dominates the first place of fertilizers exporters list in Egypt as shown in the following graphs:
Source:CBE
The local capacity to surge within the coming years The local capacities is expected to witness a surge in the coming years based mainly on KIMA 2 project of Egyptian Chemical Industries (EGCH.CA) that has a projected annual capacity of 396k ton of ammonia , 530k ton of urea and 240k ton of ammonium nitrates and the operation is expected to begin in by June 2019. In addition Delta Company for Fertilizers is planning for expansions that would increase the annual capacities by 396k ton of ammonia and 650k ton urea but the company is still preparing for the project studies and financing. ABUK hasn’t stand detached from these expansions as the company is studying and proceeding multiple projects such as ammonium nitrate project of annual capacity of 200k ton, 330k ton to produce Diammonium phosphate (DAP), calcium ammonium nitrate(CAN) and Mono ammonium phosphate (MAP)according to market needs.
Source: The Chemical Export Council (CEC)
0
500
1000
1500
2000
2009 2010 2011 2012 2013 2014 2015 2016 2017 2018
USD mn Egypt Exports of Fertilizers
226.02
0
50
100
150
200
250
Abu Qir Agruim Egyptianfertilizers Co.
Alexfert Helwan
USD mn Top Fertilizers Exporting Companies in
10M2018
CoA|OLbDD
8
Abu Qir Fertilizers (ABUK.CA) Initiation of Coverage May 2019
Egypt’s further steps in 1.5mn-feddan: An Impulse to the Fertilizers Sector
The Egyptian Authorities have announced short and medium-term plans of reclamation of massive areas of desert land in order to increase the cultivated lands and meet the increasing food demand for a further self-sufficiency objective. The government has assigned the Egyptian country side development company to manage the allocation and organizing of the project. The long term plans targets reclaiming around 3.4mn feddans by 2030. We view that this strategy would enhance the fertilizers industry in Egypt specially the Slow-Release Fertilizers such as the NPK fertilizer that is a complex fertilizer comprised primarily of the three primary nutrients. We foresee also that Abo Qir Fertilizers Company may return to produce this type of fertilizer in order to meet the expected increasing local demand.
Ministry Of Agriculture to Regulate the Egyptian Market through an Inefficient Way The Ministry of Agriculture has obligated the fertilizers companies to provide a certain amount of their production for the local market in subsidized prices. For ABUK, the ministry has set 55% of the company production to be supplied in subsidized prices to Agricultural Bank of Egypt (ABE) while exporting the remaining 45%. The Ministry made this decision to stabilize amount of subsidized fertilizers and reduce the traded amounts in the black markets. After the Egyptian pound floatation the ministry defined a subsidized prices equation based on and exchange rate and other fixed costs besides freight charges in order to stop the fertilizers company’s losses. Undeniably, this ministry set mechanism hasn’t been seriously followed by the fertilizers companies as they record a higher margins from exporting, as a result the ministry decided to increase exports tariff from EGP125 to EGP500 per ton of exports or to deliver the total required quantity to Bank for Development and Agricultural Credit in order to get an export certificate. We foresee that this policy is inefficient as farmers are still suffering from shortage of subsidized fertilizers and high prices of black market nutrients. In addition, the recently imposed exports tariff increase will not hinder the companies from exports as there is still a gap between the local and exports prices, for instance the ton of exported urea is sold at EGP4470/ton while the local price is EGP3290/ton in 2018. New suggestions to change the subsidy policy to a cash subsidy would in role boost the fertilizers sector, as the companies would be able to sell fertilizers at the international prices.
CoA|OLbDD
9
Abu Qir Fertilizers (ABUK.CA) Initiation of Coverage May 2019
Company Overview
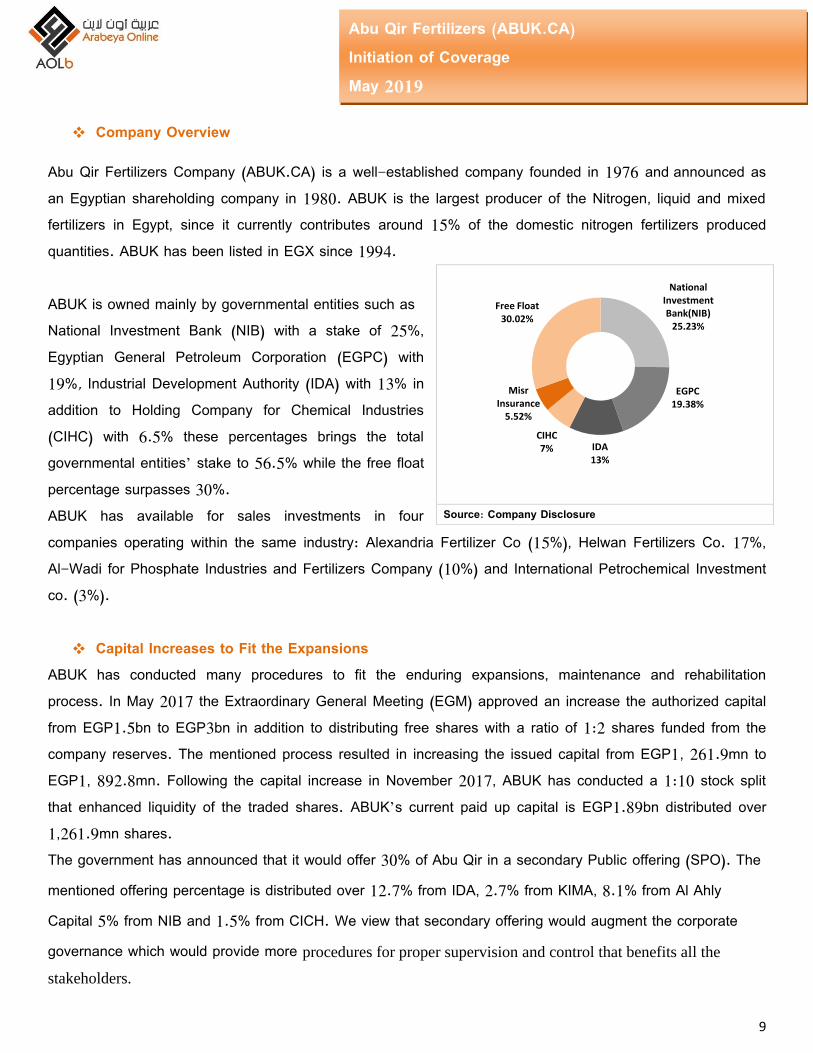
Abu Qir Fertilizers Company (ABUK.CA) is a well-established company founded in 1976 and announced as an Egyptian shareholding company in 1980. ABUK is the largest producer of the Nitrogen, liquid and mixed fertilizers in Egypt, since it currently contributes around 15% of the domestic nitrogen fertilizers produced quantities. ABUK has been listed in EGX since 1994. ABUK is owned mainly by governmental entities such as National Investment Bank (NIB) with a stake of 25%, Egyptian General Petroleum Corporation (EGPC) with 19%, Industrial Development Authority (IDA) with 13% in addition to Holding Company for Chemical Industries (CIHC) with 6.5% these percentages brings the total governmental entities’ stake to 56.5% while the free float percentage surpasses 30%. ABUK has available for sales investments in four companies operating within the same industry: Alexandria Fertilizer Co (15%), Helwan Fertilizers Co. 17%, Al-Wadi for Phosphate Industries and Fertilizers Company (10%) and International Petrochemical Investment co. (3%).
Capital Increases to Fit the Expansions ABUK has conducted many procedures to fit the enduring expansions, maintenance and rehabilitation process. In May 2017 the Extraordinary General Meeting (EGM) approved an increase the authorized capital from EGP1.5bn to EGP3bn in addition to distributing free shares with a ratio of 1:2 shares funded from the company reserves. The mentioned process resulted in increasing the issued capital from EGP1, 261.9mn to EGP1, 892.8mn. Following the capital increase in November 2017, ABUK has conducted a 1:10 stock split that enhanced liquidity of the traded shares. ABUK’s current paid up capital is EGP1.89bn distributed over 1,261.9mn shares. The government has announced that it would offer 30% of Abu Qir in a secondary Public offering (SPO). The mentioned offering percentage is distributed over 12.7% from IDA, 2.7% from KIMA, 8.1% from Al Ahly Capital 5% from NIB and 1.5% from CICH. We view that secondary offering would augment the corporate governance which would provide more procedures for proper supervision and control that benefits all the
stakeholders.
Source: Company Disclosure
National Investment Bank(NIB)
25.23%
EGPC 19.38%
IDA 13%
CIHC 7%
Misr Insurance
5.52%
Free Float 30.02%
CoA|OLbDD
10
Abu Qir Fertilizers (ABUK.CA) Initiation of Coverage May 2019
Operational Overview ABUK has three main Factories: ABUK I that has a designed capacity of Ammonia (1.15ton/ day) and Urea (1.55ton/day), ABUK II with a designed capacity of Ammonia (1k ton/ day) and Urea (2.4k ton/ day) in addition to ABUK III that has a capacity of ammonia (1.2k ton / day) and Granular Urea (1.75 ton / day). ABUK produces these types of nitrogen fertilizers, their byproducts in addition to other secondary products such as Liquid urea-ammonium nitrate (UAN) and NPK (nitrogen-phosphorus-potassium) compound fertilizer.
Market Regulations Came in Favor of ABUK Since March 2016, the Ministry of Agriculture has issued a decree allowing ABUK to export 45% of the company production while the remaining 55% to be supplied to Agricultural Bank of Egypt (ABE). Since that decree ABUK’s revenues and margins has soared backed by the exports of ammonia, Urea, Granulated Urea and liquid fertilizer although exports of the latter product have been shortened as the international prices of the UAN has shown a declining trend since 2015. Abu Qir like other companies in the market hasn’t stopped reducing local market stake of production in favor of exporting as the difference between subsidized prices and international prices still has a large gap.
ABUK Dominates a Solid Market Share ABUK has a market share near 60% of nitrogen fertilizers of ammonium nitrates, Urea and Granular urea in the local market. ABUK also dominates a significant stake in Egypt exports of fertilizers as Egypt exports of fertilizers recorded USD964.8mn while ABUK’s exports recoded EGP3bn in FY2017/2018. ABUK’s total production volume recorded 2321k ton in FY2017/2018 while the total ABE supplied amounted 17.2mn bag totaling at 861k ton, a 37% of the total production. According to ABUK Chairman the company provides ABE with around 77k ton of fertilizers on a monthly basis by the cost of production sacrificing the profit margin of these sales. It is worth noting that the variance in prices between the subsidized ton of urea and the exported ton has reached EGP1500/ton in FY2017/2018.
CoA|OLbDD
11
Abu Qir Fertilizers (ABUK.CA) Initiation of Coverage May 2019
Interim Financial Analysis
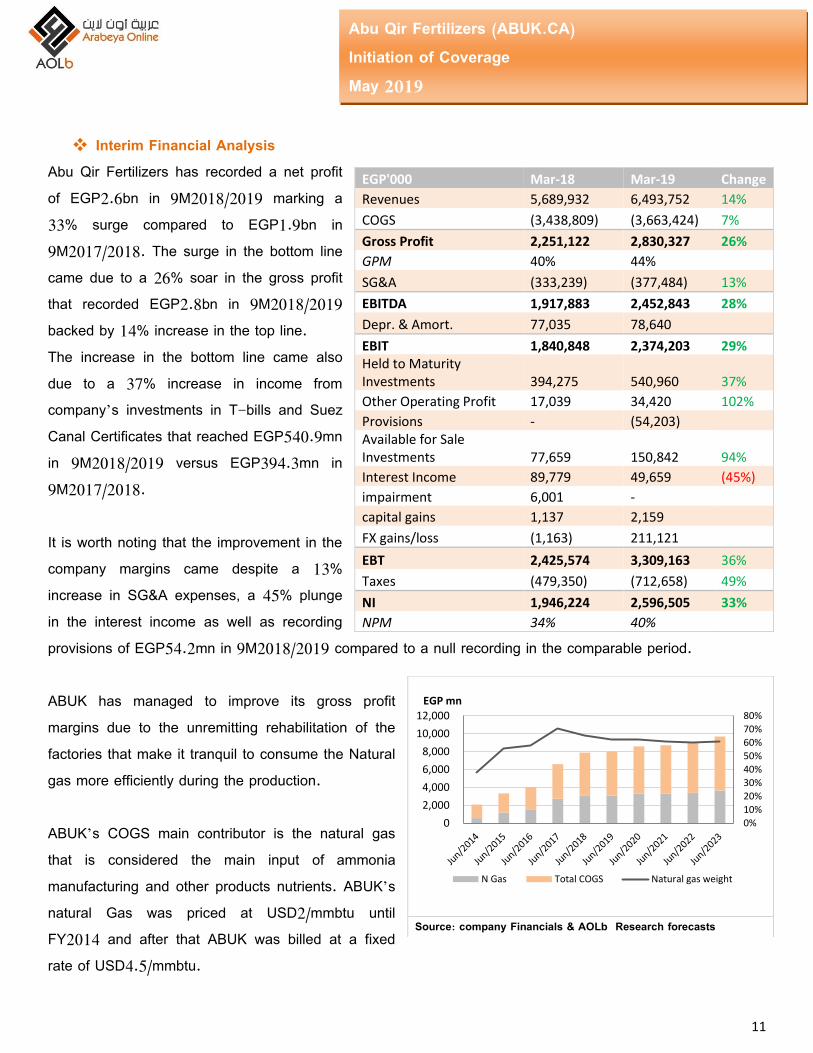
Abu Qir Fertilizers has recorded a net profit of EGP2.6bn in 9M2018/2019 marking a 33% surge compared to EGP1.9bn in 9M2017/2018. The surge in the bottom line came due to a 26% soar in the gross profit that recorded EGP2.8bn in 9M2018/2019 backed by 14% increase in the top line. The increase in the bottom line came also due to a 37% increase in income from company’s investments in T-bills and Suez Canal Certificates that reached EGP540.9mn in 9M2018/2019 versus EGP394.3mn in 9M2017/2018. It is worth noting that the improvement in the company margins came despite a 13% increase in SG&A expenses, a 45% plunge in the interest income as well as recording provisions of EGP54.2mn in 9M2018/2019 compared to a null recording in the comparable period. ABUK has managed to improve its gross profit margins due to the unremitting rehabilitation of the factories that make it tranquil to consume the Natural gas more efficiently during the production. ABUK’s COGS main contributor is the natural gas that is considered the main input of ammonia manufacturing and other products nutrients. ABUK’s natural Gas was priced at USD2/mmbtu until FY2014 and after that ABUK was billed at a fixed rate of USD4.5/mmbtu.
capital gains 1,137 2,159 FX gains/loss (1,163) 211,121 EBT 2,425,574 3,309,163 36%
Taxes (479,350) (712,658) 49%
NI 1,946,224 2,596,505 33%
NPM 34% 40%
Source: company Financials & AOLb Research forecasts
0%
10%
20%
30%
40%
50%
60%
70%
80%
0
2,000
4,000
6,000
8,000
10,000
12,000EGP mn
N Gas Total COGS Natural gas weight
CoA|OLbDD
12
Abu Qir Fertilizers (ABUK.CA) Initiation of Coverage May 2019
ABUK Exports as a Redeemer
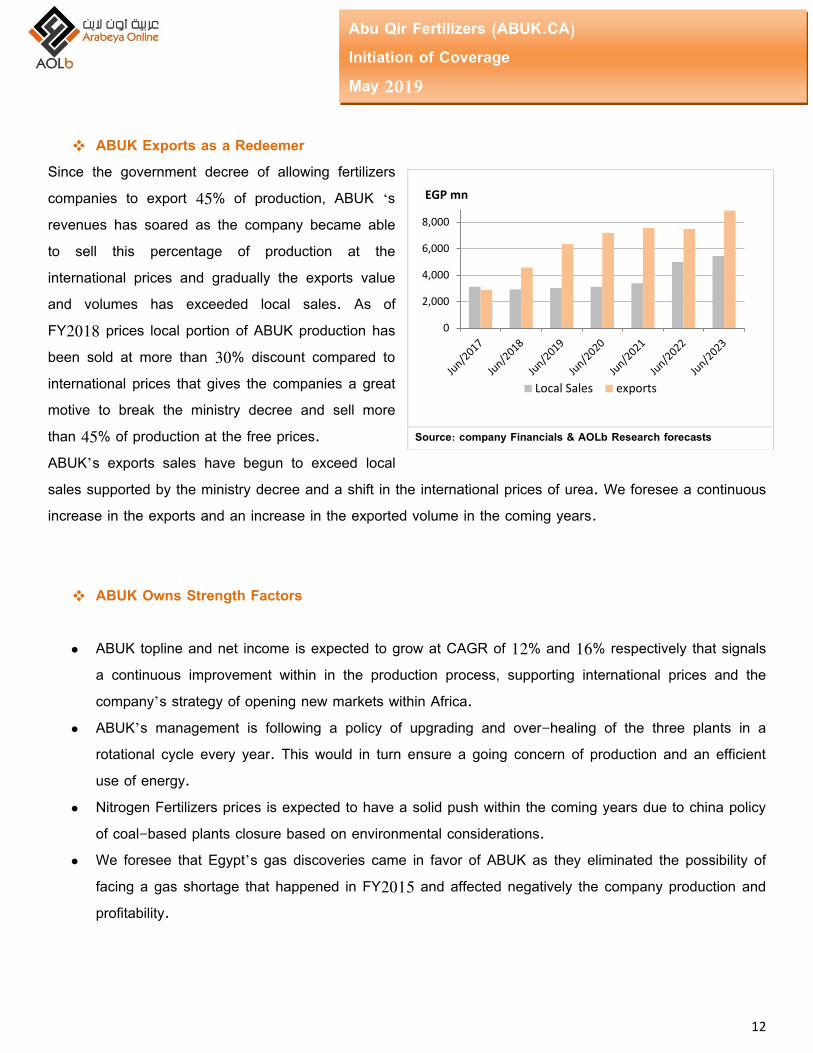
Since the government decree of allowing fertilizers companies to export 45% of production, ABUK ‘s revenues has soared as the company became able to sell this percentage of production at the international prices and gradually the exports value and volumes has exceeded local sales. As of FY2018 prices local portion of ABUK production has been sold at more than 30% discount compared to international prices that gives the companies a great motive to break the ministry decree and sell more than 45% of production at the free prices. ABUK’s exports sales have begun to exceed local sales supported by the ministry decree and a shift in the international prices of urea. We foresee a continuous increase in the exports and an increase in the exported volume in the coming years.
ABUK Owns Strength Factors
ABUK topline and net income is expected to grow at CAGR of 12% and 16% respectively that signals a continuous improvement within in the production process, supporting international prices and the company’s strategy of opening new markets within Africa.
ABUK’s management is following a policy of upgrading and over-healing of the three plants in a rotational cycle every year. This would in turn ensure a going concern of production and an efficient use of energy.
Nitrogen Fertilizers prices is expected to have a solid push within the coming years due to china policy of coal-based plants closure based on environmental considerations.
We foresee that Egypt’s gas discoveries came in favor of ABUK as they eliminated the possibility of facing a gas shortage that happened in FY2015 and affected negatively the company production and profitability.
Source: company Financials & AOLb Research forecasts
0
2,000
4,000
6,000
8,000
EGP mn
Local Sales exports
CoA|OLbDD
13
Abu Qir Fertilizers (ABUK.CA) Initiation of Coverage May 2019
Significant Catalysts of Abu Qir
1-ABUK’s Fluttering Projects: ABUK has undergoing projects that would bring the stock’s FV to an upside trend supported by the additional capacities and exports-oriented projects such as:
Upgrading NPK unit project: We didn’t include in our valuation upgrading NPK unit project with estimated investments of EUR80mn as there is no enough information regarding projected capacity and weight of debt and equity. However, we foresee supporting factors for this project including the land reclamation project of 4.5mn acres, with a first phase of 1.5mn acres of desert land that would increase local demand for NPK nutrients as the desert land doesn’t fit with the ordinary fertilizers (Ammonia and Nitrates). According to the feasibility studies done on this project foreign markets are also thirsty for this type of fertilizers especially south east –Asia markets.
CAN Project: Methanol and Calcium Ammonium Nitrite (CAN) project’s feasibility studies process is undergoing with an expected investment cost of USD2bn. We didn’t also include this project in our valuation until more details are disclosed. The estimated capacity of the project from Methanol and CAN is 1mn ton for each per annum. ABUK announced that the production of this project is directed mainly for exports. This project would bring the stock’s FV to an unreached level before value.
Water-Desalination Project: the project’s expected resulting water is estimated at 100k cubic meter that would support the company needs from water especially within the water shortage problems that Egypt is expected to face in the coming decades.
2-Fertilizers Companies are Billed for Natural Gas at Different Prices
The local manufacturing companies are charged different prices for natural gas that is considered as a back bone of Fertilizers industry in Egypt. ABUK is among the highly charged companies as it gets the natural gas at USD4.5/mmbtu while Misr Fertilizers Production Company (Mobco) is billed at a rate of USD3.6/mmbtu that is considered the lowest among fertilizers companies.
Since 2014 the Ngas is taking a downward slide to levels away from the charged Ngas price. The new gas discoveries enhanced the optimistic anticipations regarding Ngas prices floatation and a continuous supply of the industry backbone in Egypt. A continues supply of Ngas helps the factories to benefit from the economies of scales.
Source: Reuters & AOLb Research
CoA|OLbDD
14
Abu Qir Fertilizers (ABUK.CA) Initiation of Coverage May 2019
Sensitivity Analysis for Natural Gas prices
For ABUK the natural gas prices have a significant upshot over the company’s fair value. We hold a sensitivity analysis to the stock which led to deducing that a USD1/mmbtu reduction in the supplied natural gas prices would boost the company’s TP by 7% to EGP30.9/share.
3-Fertilizers’ Prices Floating The government and the parliament are studying demands of floating the local subsidized prices of fertilizers supplied to farmers. There are two main reasons for discussing this step 1) the inefficient distribution of subsidized fertilizers and black market of fertilizers where the uncultivated land owners receive their share of subsidized fertilizer and resell it in the black market to benefit from the discount afforded by the government 2) the perquisites of EU to organize the organic fertilizers market and increase the dependency on that type of fertilizer away from the synthetic fertilizers and pesticides in order to begin importing agricultural products by 2020. In case that the government has taken serious steps in this decree that would in turn give a surge to ABUK’s FV to EGP29.5/share with an upside potential of 5% backed by the 30% discount given to local sales compared to international prices. The supporters of this suggestion negotiate that the cash subsidy for the farmers would be more efficient than the current applied methodology.
Natural Gas Prices
Term
inal
G
row
th R
ate
5 4.5 3.5 3
3% 26.53 27.54 29.55 30.56
4% 27.76 28.81 30.90 31.95
5% 29.15 30.25 32.44 33.54
CoA|OLbDD
15
Abu Qir Fertilizers (ABUK.CA) Initiation of Coverage May 2019
Valuation
We valued ABUK with a combined 5-year DCF valuation that indicated a fair value of EGP28.46/share, a 16.6% upside potential. Our DCF valuation is based on five years of explicit forecasts and a terminal value using a 4% terminal growth rate and a WACC of 19%. We use our calculated beta at 0.84.
ABUK forward 2019f P/E is at 7.72x that comes below EGX chemicals Sector P/E of 11.28x and International peers median forward P/E of 16.14. ABUK’s P/E multiple valuation gives a FV of EGP32/share, with FY2019f EPS at EGP3.13/share.
ABUK has an average dividends payout ratio of 57%, with projected dividend yield 7.3% for FY2019f. We forecast the payout ratio throughout the projection period at an average equivalent to the previous two years. The EGX sector average DY is at 7.67%. We project 2019f-22f DPS to grow at a CAGR of 16.5%.
Enterprise Value 35,205,160 (-) Debt (124,566) (+) Cash 831,016 Equity Value 35,911,610 Fair Value / Share 28.46
CoA|OLbDD
16
Abu Qir Fertilizers (ABUK.CA) Initiation of Coverage May 2019
Recommendation Rating
BUY HOLD SELL Above 15% From 5% - 15% Below 5%
This report is based on publicly available information. It is not intended as an offer to buy or sell, nor is it a solicitation of an offer to buy or sell the securities mentioned. The information and opinions in this report were prepared by the AOLB Research Department from sources it believed to be reliable at the time of publication. AOLB accepts no liability or legal responsibility for losses or damages incurred from the use of this publication or its contents. AOLB has the right to change opinions expressed in this report without prior notice.
CoA|OLbDD
17
Abu Qir Fertilizers (ABUK.CA) Initiation of Coverage May 2019