+ All Categories
Home > Documents > ABUNDANCE AND SURVIVAL · abundance and survival of juvenile chinook salmon in the sacramento-san...

ABUNDANCE AND SURVIVAL · abundance and survival of juvenile chinook salmon in the sacramento-san...

Date post: 21-Apr-2018
Category:
Upload: vuongkhanh
View: 217 times
Download: 0 times
Share this document with a friend
131
ABUNDANCE AND SURVIVAL OF JUVENILE CHINOOK SALMON IN THE SACRAMENTO-SAN JOAQUIN ESTUARY 1997 and 1998 ANNUAL PROGRESS REPORTS SACRAMENTO-SAN JOAQUIN ESTUARY FISHERY RESOURCE OFFICE, U.S. FISH AND WILDLIFE SERVICE STOCKTON, CALIFORNIA DECEMBER 2001
Transcript

ABUNDANCE AND SURVIVAL

OF

JUVENILE CHINOOK SALMON

IN THE

SACRAMENTO-SAN JOAQUIN ESTUARY

1997 and 1998 ANNUAL PROGRESS REPORTSSACRAMENTO-SAN JOAQUIN ESTUARY

FISHERY RESOURCE OFFICE,U.S. FISH AND WILDLIFE SERVICE

STOCKTON, CALIFORNIA

DECEMBER 2001

i

Table of Contents

Acknowledgments................................................................................................................... ii

Introduction............................................................................................................................. 1

Methods ................................................................................................................................. 5

Lower Sacramento River Beach Seine................................................................................... 14

Lower San Joaquin River Seine ............................................................................................. 19

Delta Juvenile Sampling

Delta Beach Seine..................................................................................................... 21

Kodiak and Midwater Trawl at Sacramento............................................................... 25

Kodiak Trawl at Mossdale......................................................................................... 32

Midwater Trawl at Chipps Island................................................................................ 34

Bay Seine................................................................................................................................ 40

Absolute Abundance Estimates.............................................................................................. 42

1997 Mark and Recapture Studies......................................................................................... 47

1998 Mark and Recapture Studies......................................................................................... 50

References ............................................................................................................................ 54

Appendix 1 .............................................................................................................................. 56

Appendix 2 ............................................................................................................................. 77

ii

Acknowledgments

This sampling was conducted for and funded by the Interagency Ecological Program (IEP) for theSacramento-San Joaquin Estuary. Members of the IEP include three state and six federal agencies:California Department of Water Resources, California Department of Fish and Game, State WaterResources Control Board, U.S. Bureau of Reclamation, U.S. Geological Survey, U.S. Fish and WildlifeService, National Marine Fisheries Service, U.S. Army Corps of Engineers, and the U.S. EnvironmentalProtection Agency.

1

Introduction

Work in 1997 and 1998 by the Sacramento-San Joaquin Estuary Fishery Resource Office (SSJEFRO -changed to the Stockton Fish and Wildlife Office in 2001) was conducted to update and refine ourknowledge of the factors influencing juvenile salmon abundance, distribution, and survival in theSacramento-San Joaquin Estuary. Field sampling and special studies were conducted between August1, 1996, and July 31, 1998, (referred to as the 1997 and 1998 field seasons) with various sampling gearsas juveniles rear and migrate through the lower Sacramento and San Joaquin Rivers, Delta, and the SanFrancisco - San Pablo Bay.

Objectives of the 1997 and 1998 Interagency Salmon Study were to:

! Monitor the relative abundance, distribution, and timing of juvenile chinook salmon rearing andmigrating through the lower Sacramento River, the Delta, and portions of the San Francisco Bay.

! Determine relative survival (using fall and late-fall hatchery smolts) of juvenile salmon released inthe upper river and Delta, and identify potential factors influencing survival.

Midwater trawling, Kodiak trawling, and beach seining were employed at varying times and locations inthe Delta, lower Sacramento and San Joaquin rivers, and parts of the San Francisco Bay. Different sizedjuveniles of the various races of chinook salmon presumably have distinct spatial and temporaldistributions making them vulnerable to different gear types. Although the largest juveniles (greater than150 mm) probably are not effectively sampled using the gears employed by this office, the salvagefacilities in the South Delta catch larger sized juveniles helping us to further understand the abundance,and distribution of juvenile salmon.

Water Conditions During Study

The 1997 and 1998 water years were classified as wet years, but each exhibited completely differentoutflow patterns. The 1997 water year included an extremely large flood event associated with two warm weather storms inlate-December and early-January (Knowles et al. 1997). After several smaller storms in January therainfall dropped off considerably resulting in one of the driest February and March rainfalls on record. Asa result, Delta outflow between December 30 and February 9, 1997, was nearly four times the meanvolume of the bay (Knowles et al. 1997), producing highly turbid, debris riddled water. Rainfall during the1998 water year provided above average precipitation between January and June. In addition, cooltemperatures delayed peak snowmelt until early July keeping streamflows above normal well into thesummer (Knowles et al. 1998).

Race Designation by Size

The SSJEFRO uses size and date of capture to determine juvenile chinook salmon race in the lowerSacramento River and Delta. At this time it is the only tool used to determine race of juvenile salmon inthe field. Several problems exist regarding the validity of this method that have been discussed in pastreports (USFWS, 1995). For these reasons, the race designations used in this report should only beused as a rough approximation and not interpreted as definitive. Genetic differentiation of races ispromising and may help determine true race of Central Valley salmon juveniles in the future.

Although all four races are designated in the field using the size criteria, for this report the fall and springrun categories have been combined into a group identified as fall/spring run, since there is a question asto whether spring run are true spring run chinook or faster growing fall run.

Life Stage Delineation

2

Because designations of the various life stages of juvenile chinook depend on the physiological state ofthe fish, the use of fork length does not clearly define these stages but can be a rough estimate of thisclassification. For this report fry is defined as being less than 70 mm fork length. Juveniles larger thanfry are likely starting to undergo behavioral and physiological changes to prepare them for the transitionto salt water, and are defined as smolts (70 to 200 mm). Yearlings are defined as juveniles residing infreshwater approximately one year.

Escapement

To help understand the changes in abundance of the juvenile salmon populations in the Delta, graphs ofthe annual number of returning adults of each race passing Red Bluff Diversion Dam (RBDD) in the upperSacramento River, and returns to the Coleman National Fish Hatchery are shown in Figure 1. Forescapement estimates to be properly obtained, the RBDD gates must be in the closed position. Since1993, this has not occurred during late-fall upstream migration.

To estimate late-fall run escapement, carcass surveys began in 1998. Between 1993 and 1998, returnsto the Coleman National Fish Hatchery were used for the estimate. Fall/spring run returns in 1997 werethe highest since 1969, while 1998 returns were the lowest since 1952. Winter run escapementcontinued to be low during 1997 and 1998 (Figure 1).

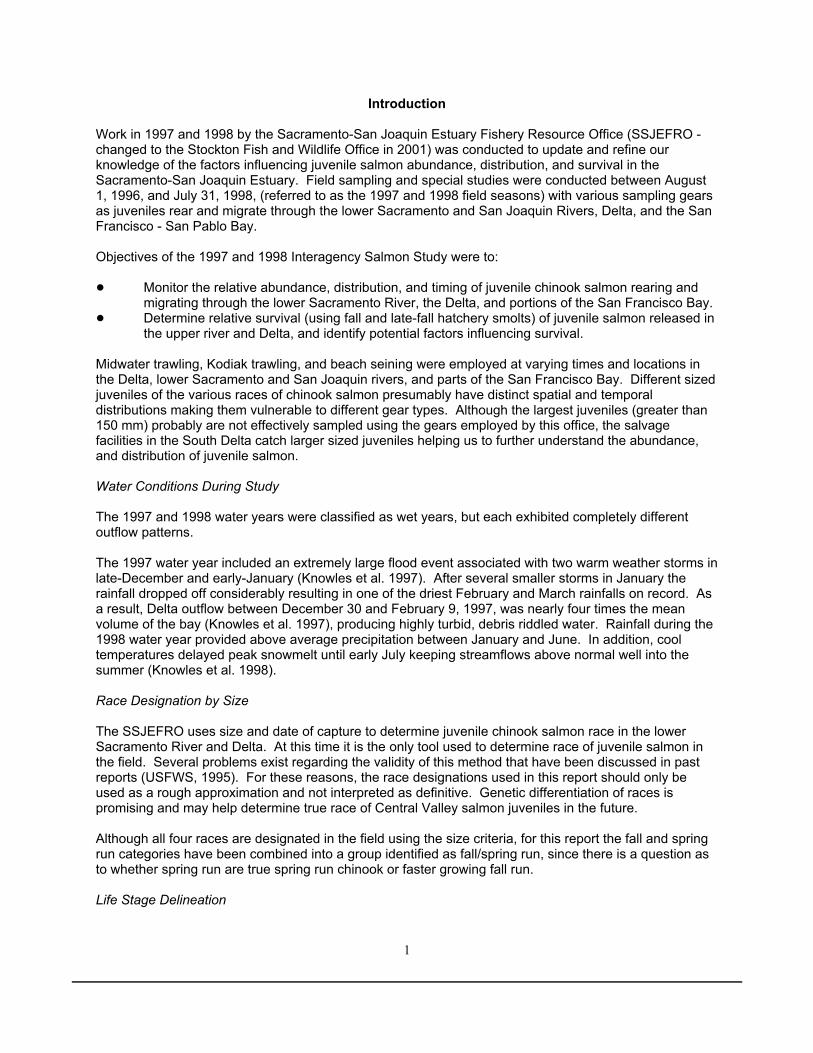
Fall run escapement in the American River was the sixth highest in 1997 and third highest in 1998 since1978. Feather River fall run escapement was the third highest in 1997 since 1978, however, only FeatherRiver hatchery escapements were available for 1998 (Figure 2).

Compared with escapement during the 1980's, the Stanislaus, Tuolumne and Merced River returnsthrough the 1990's have been low (Figure 2).

3

0

20,000

40,000

60,000

80,000

100,000

78 79 80 81 82 83 84 85 86 87 88 89 90 91 92 93 94 95 96 97 98

Num

ber o

f sal

mon

0

5,000

10,000

15,000

20,000

25,000

30,000

78 79 80 81 82 83 84 85 86 87 88 89 90 91 92 93 94 95 96 97 98

Num

ber o

f sal

mon

Fall/spring

Winter

Figure 1. Red Bluff Diversion Dam yearly escapement estimates of adult winter, late-fall, and fall/spring run chinook for the upper Sacramento River. Years 1986 through 1998 are preliminary. Source: Department of Fish and Game, Inland Fisheries Division, Red bluff.

Totals for each year are the sum both in-river and hatchery totals.

0

5,000

10,000

15,000

20,000

78 79 80 81 82 83 84 85 86 87 88 89 90 91 92 93 94 95 96 97 98

Late-fall

1997

no

data

ava

ilabl

e

n = 48 for 1996N

umbe

r of s

alm

on

n = 142for 1994

4

0

20,000

40,000

60,000

80,000

100,000

78 79 80 81 82 83 84 85 86 87 88 89 90 91 92 93 94 95 96 97 98

Num

ber o

f sal

mon

Feather River

0

20,000

40,000

60,000

80,000

100,000

78 79 80 81 82 83 84 85 86 87 88 89 90 91 92 93 94 95 96 97 98

Num

ber o

f sal

mon

American River

0

20,000

40,000

60,000

80,000

78 79 80 81 82 83 84 85 86 87 88 89 90 91 92 93 94 95 96 97 98

Num

ber o

f sal

mon

StanislausTuolumneMerced Rivers

Figure 2. Spawner population estimates of fall run chinook salmon between 1978 and 1998 on the Feather and American Rivers, and the Stanislaus, Tuolumne, and Merced Rivers combined. Totals for each year are the sum of both in-river and hatchery totals.

1998, hatchery only

5

MethodsBeach Seine

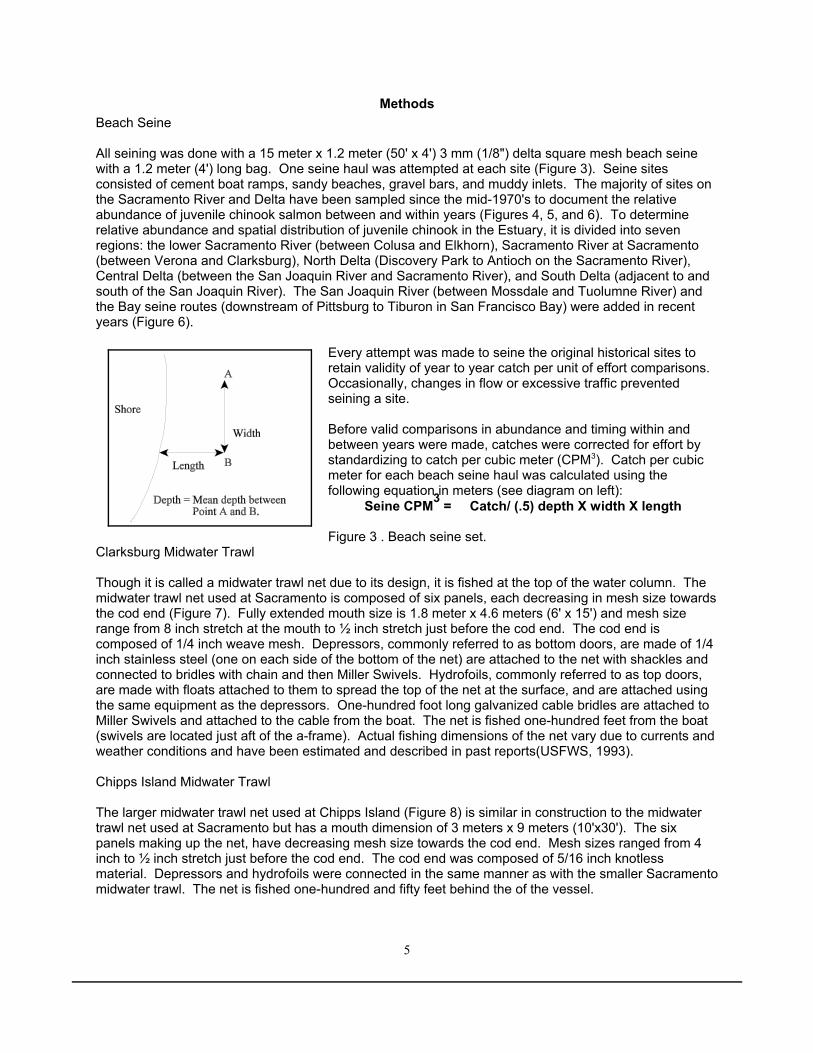
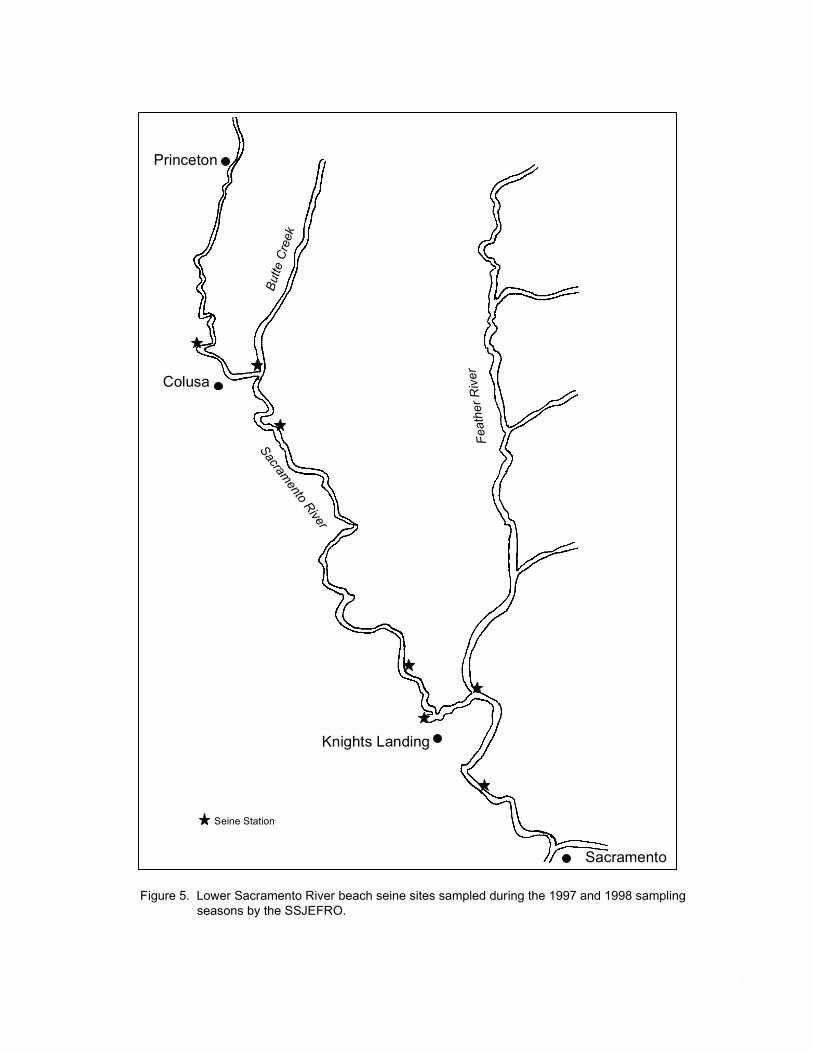
All seining was done with a 15 meter x 1.2 meter (50' x 4') 3 mm (1/8") delta square mesh beach seinewith a 1.2 meter (4') long bag. One seine haul was attempted at each site (Figure 3). Seine sitesconsisted of cement boat ramps, sandy beaches, gravel bars, and muddy inlets. The majority of sites onthe Sacramento River and Delta have been sampled since the mid-1970's to document the relativeabundance of juvenile chinook salmon between and within years (Figures 4, 5, and 6). To determinerelative abundance and spatial distribution of juvenile chinook in the Estuary, it is divided into sevenregions: the lower Sacramento River (between Colusa and Elkhorn), Sacramento River at Sacramento(between Verona and Clarksburg), North Delta (Discovery Park to Antioch on the Sacramento River),Central Delta (between the San Joaquin River and Sacramento River), and South Delta (adjacent to andsouth of the San Joaquin River). The San Joaquin River (between Mossdale and Tuolumne River) andthe Bay seine routes (downstream of Pittsburg to Tiburon in San Francisco Bay) were added in recentyears (Figure 6).

Every attempt was made to seine the original historical sites toretain validity of year to year catch per unit of effort comparisons. Occasionally, changes in flow or excessive traffic preventedseining a site.

Before valid comparisons in abundance and timing within andbetween years were made, catches were corrected for effort bystandardizing to catch per cubic meter (CPM3). Catch per cubicmeter for each beach seine haul was calculated using thefollowing equation in meters (see diagram on left):

Seine CPM3 = Catch/ (.5) depth X width X length Figure 3 . Beach seine set.

Clarksburg Midwater Trawl

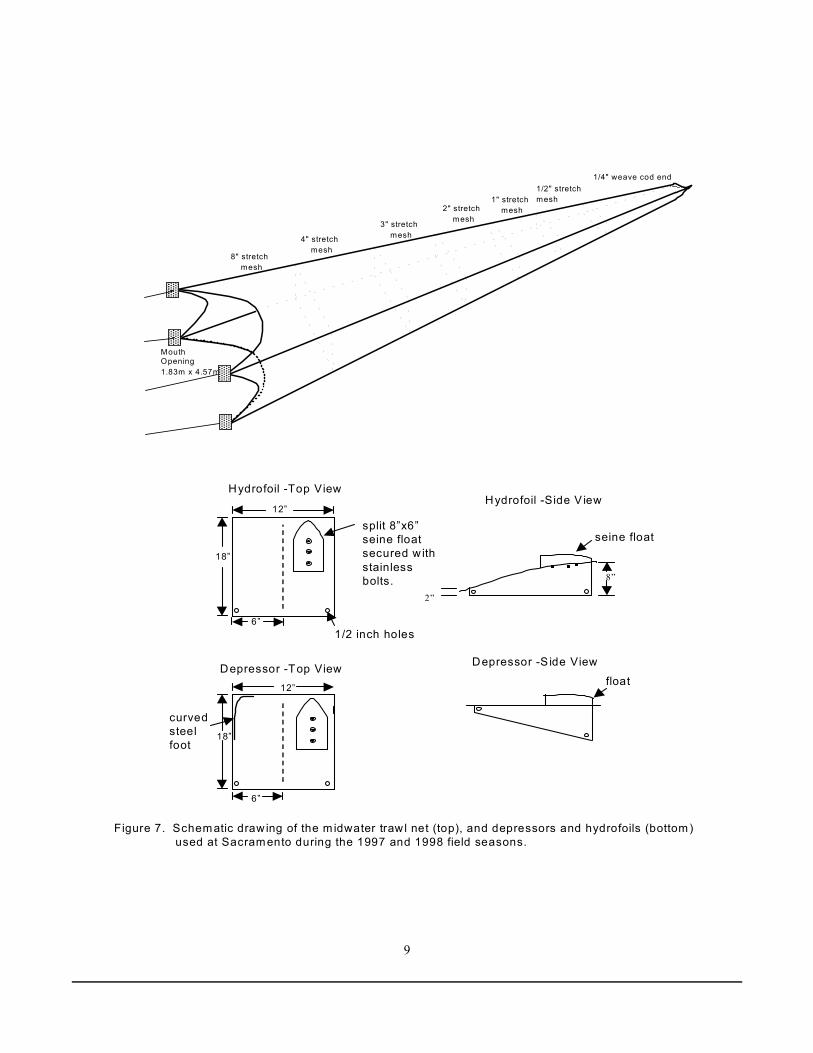
Though it is called a midwater trawl net due to its design, it is fished at the top of the water column. Themidwater trawl net used at Sacramento is composed of six panels, each decreasing in mesh size towardsthe cod end (Figure 7). Fully extended mouth size is 1.8 meter x 4.6 meters (6' x 15') and mesh sizerange from 8 inch stretch at the mouth to ½ inch stretch just before the cod end. The cod end iscomposed of 1/4 inch weave mesh. Depressors, commonly referred to as bottom doors, are made of 1/4inch stainless steel (one on each side of the bottom of the net) are attached to the net with shackles andconnected to bridles with chain and then Miller Swivels. Hydrofoils, commonly referred to as top doors,are made with floats attached to them to spread the top of the net at the surface, and are attached usingthe same equipment as the depressors. One-hundred foot long galvanized cable bridles are attached toMiller Swivels and attached to the cable from the boat. The net is fished one-hundred feet from the boat(swivels are located just aft of the a-frame). Actual fishing dimensions of the net vary due to currents andweather conditions and have been estimated and described in past reports(USFWS, 1993).

Chipps Island Midwater Trawl

The larger midwater trawl net used at Chipps Island (Figure 8) is similar in construction to the midwatertrawl net used at Sacramento but has a mouth dimension of 3 meters x 9 meters (10'x30'). The sixpanels making up the net, have decreasing mesh size towards the cod end. Mesh sizes ranged from 4inch to ½ inch stretch just before the cod end. The cod end was composed of 5/16 inch knotlessmaterial. Depressors and hydrofoils were connected in the same manner as with the smaller Sacramentomidwater trawl. The net is fished one-hundred and fifty feet behind the of the vessel.

6

MapArea

Sacramento-San JoaquinEstuary

122

38

Kilometers

0 2 4 6 8 10

San Francisco

Berkeley

San PabloBay

San Francisco Bay

SuisunBay

Vernalis

Sacramento

Sacramento R

iver

Central Delta

Stockton

Pittsburg

North

Rio Vista

WesternDelta

NorthernDelta

Trawl Station

Seine Station

DeltaCrossChannel

Clarksburg

Hood

Figure 4. Sampling sites used during the 1997 and 1998 field seasons in the Sacramento-San Joaquin Estuary. Beach seine and trawl recovery locations are marked with stars and squares respectively. The bordered areas show each beach seine region. Note: not all of the seine sites are shown within each region.

Sacramentotrawl

Chipps Islandtrawl

Mossdaletrawl

Bay seine

San Joaquin seine

South Delta seine

Central Delta seine

North Delta seine

Sacramento seine

Lower Sacramento River seine

San Joaquin River

7

Figure 5. Lower Sacramento River beach seine sites sampled during the 1997 and 1998 sampling seasons by the SSJEFRO.

Sacramento

Colusa

Butte

Cre

ek

Sacramento River

Knights Landing

Feat

her R

iver

Seine Station

Princeton

8

Lower Sacramento River Seine North Delta SeineSR144W Colusa State Park SR060E Discovery ParkSR138E Ward’s Landing SR049E Garcia BendSR130E South Meridian SR043E ClarksburgSR094E Reels Beach SS011N Steamboat Sl.SR090W Knights Landing SR024E KoketSR080E Verona SR017E IsletonSR071E Elkhorn SR014W Rio Vista

AM001S American RiverCentral Delta Seine SR012E Stump BeachLP003ETerminous MS001N Sherman IslandXC001N Delta Cross ChannelGS010E Georgiana Slough South Delta Seine SF014E Wimpy’s TC002E Turner CutMK004W B&W Marina SJ032S Lost IsleDS002S King’s Island OR003W Franks TractSJ005NEddo’s SJ026NVenice IslandTM001N Brannon Island WD002W Veale TractSJ001S Antioch Dunes (Antioch Dunes National OR014W Crusier Haven

Wildlife Refuge) OR019E Old RiverSan Joaquin Seine MR010W Woodward Island

SJ041NDad’s PointSJ051E Dos Reis Sacramento SeineSJ056E Mossdale SR080E VeronaSJ058W Wetherbee SR071E ElkhornSJ063W Big Beach SR062E Sand CoveSJ068W Durham SR060E Discovery ParkSJ074W Sturgeon Bend SR057E Miller ParkSJ077E Route 132 SR055E Sherwood HarborSJ083W North of Tuolumne River SR049E Garcia BendSJ086W Grayson SR043E Clarksburg

Bay Seine (West) Bay Seine (East) TrawlsSA010W San Quentin SA001M Treasure Island SB018 Chipps Island SA004W Tiburon SA007E Berkeley Frontage SJ054M MossdaleSA008W Paradise Beach SP000E Pt. Molate SR055M SacramentoSP001W China Camp SA009E Keller BeachSP000W McNear’s Beach SP003E Point Pinole East

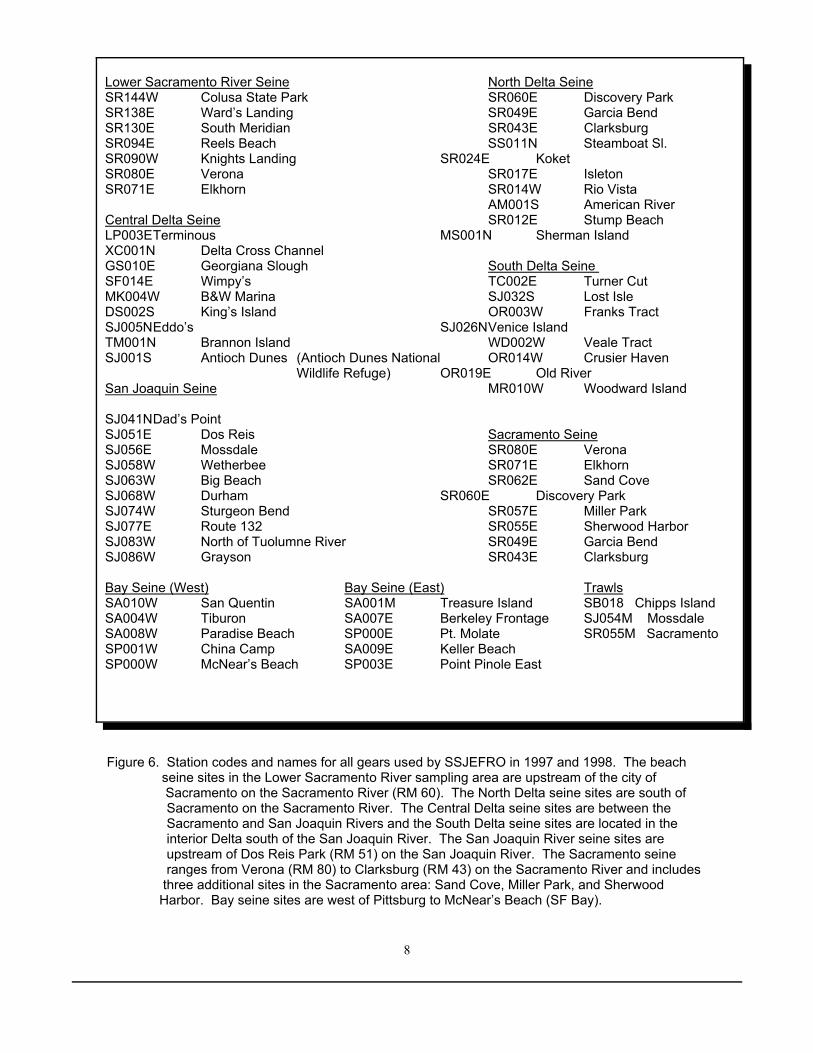
Figure 6. Station codes and names for all gears used by SSJEFRO in 1997 and 1998. The beach seine sites in the Lower Sacramento River sampling area are upstream of the city of Sacramento on the Sacramento River (RM 60). The North Delta seine sites are south of

Sacramento on the Sacramento River. The Central Delta seine sites are between the Sacramento and San Joaquin Rivers and the South Delta seine sites are located in the interior Delta south of the San Joaquin River. The San Joaquin River seine sites are upstream of Dos Reis Park (RM 51) on the San Joaquin River. The Sacramento seine ranges from Verona (RM 80) to Clarksburg (RM 43) on the Sacramento River and includes three additional sites in the Sacramento area: Sand Cove, Miller Park, and Sherwood Harbor. Bay seine sites are west of Pittsburg to McNear’s Beach (SF Bay).

9

8" stretch mesh

4" stretch mesh

3" stretch mesh

2" stretch mesh

1" stretch mesh

1/2" stretchmesh

1/4" weave cod end

Mouth Opening1.83m x 4.57m

����������

������������

����������

������������

Figure 7. Schematic draw ing of the m idwater traw l net (top), and depressors and hydrofoils (bottom) used at Sacramento during the 1997 and 1998 field seasons.

12”

18”

split 8”x6”seine floatsecured w ith stainlessbolts.

6”

Hydrofoil -Top ViewHydrofoil -Side V iew

seine float

Depressor -Top View Depressor -S ide View

12”

18”

6”

8”

2”

curvedsteelfoot

1/2 inch holes

float

10

4" stretch mesh

3" stretch mesh

2" stretch mesh

1.5" stretch mesh

1" stretch mesh

1/2" stretchmesh

1/4" mesh cod end

Mouth Opening3.05m x 9.14m

������������

������������

������������

������������

18”

24”

split 15”x6”seine floatsecured w ith stain lessbolts.

9”

H ydrofoil -Top ViewH ydrofoil -Side V iew

seine float

D epressor -Top View D epressor -S ide View

18”

24”

9”

9”2.5”

curvedsteelfoot

1/2 inch holes

float

Figure 8. Schem atic draw ing of the m idwater traw l net (top), and depressors and hydrofoils (bottom ) used at C hipps Island during the 1997 and 1998 fie ld seasons.

11

2" stretch mesh

1.5" stretch mesh

1" stretch mesh .5" stretch

mesh.25" stretch mesh

live boxgoes hereMouth opening

1.83m x 7.62m

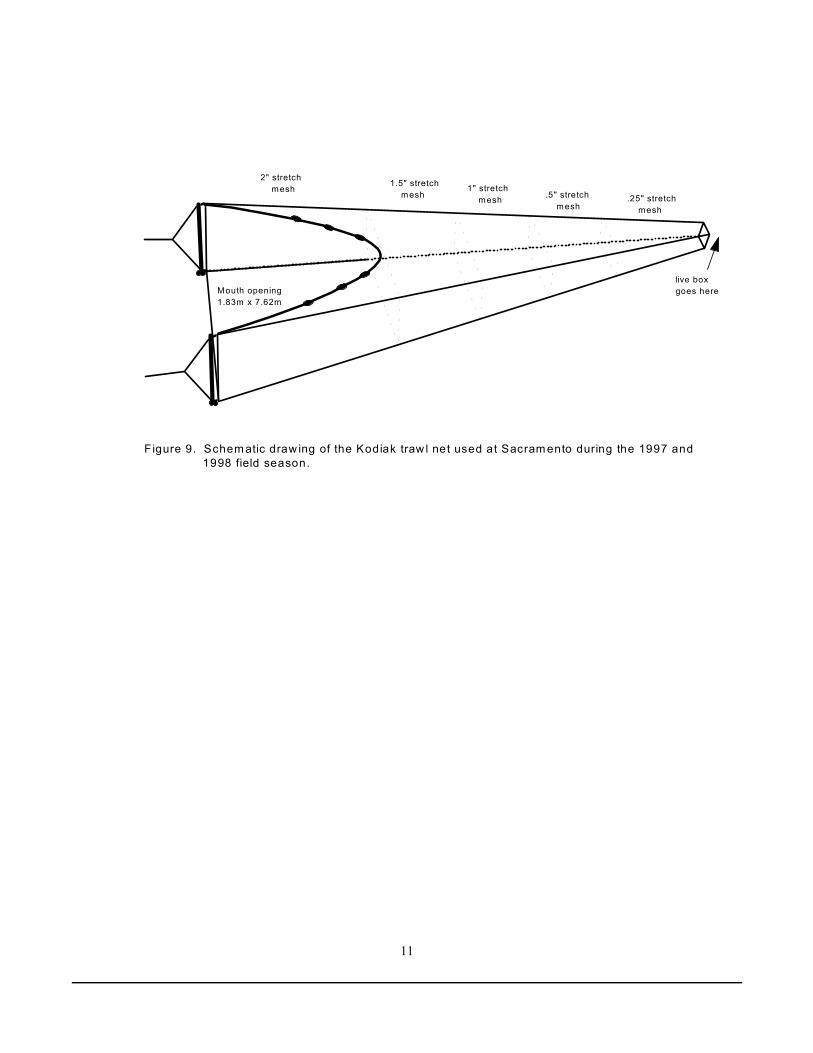
Figure 9. Schem atic draw ing of the Kodiak traw l net used at Sacram ento during the 1997 and 1998 field season.

Rick Burmester

12

Ten twenty minute trawls were done per sample day at both locations. All trawling at Sacramento wasdone in the middle of the channel facing upstream against the current within 1.5 kilometers of the samplesite. Trawling at Chipps Island also was done within 1.5 kilometers from the sample site in bothdirections depending on the tide, and in three channel locations: north, south, and middle. Occasionally,inclement weather, mechanical problems, or excessive fish catches required reducing tow times or thenumber of tows per day.

The net mouth area in the small and large midwater trawl nets used for calculations were estimated netmouth fishing areas. Previous studies showed that the midwater trawl nets don’t typically opencompletely while under tow (USFWS, 1993) and that mouth dimensions vary within and between tows. Catch by cubic meter (CPM3) per tow in the midwater trawl was calculated with the following formula:

catch per townet mouth area (m2) X distance net passes through water column(m)

Estimated net mouth areas used in this report were the mean mouth openings calculated from thesestudies. The estimated net mouth areas while fishing were 5.1 square meters for the small midwatertrawl used at Sacramento and 18.6 square meters for the large midwater trawl used at Chipps Island. The distance the net passes through the water column defined in meters was measured during each towwith a General Oceanics mechanical flow meter (model 2030). Total revolutions per tow were counted bythe flow meter and converted to linear distance using standard equations as described by GeneralOceanics reference manual. This is a measurement of the distance the net travels through the water andis not related to distance traveled relative to land which can be effected by tides and currents.

Sacramento and Mossdale Kodiak trawl

The Kodiak trawl net also is variable mesh with a fully expanded mouth opening of 1.8 x 7.6 meters (6 x25 feet) and is shown in Figure 9. The estimated fishing net mouth area, extrapolated from midwatertrawl studies (USFWS, 1993), is 12.5 square meters for the Kodiak trawl. A float line and lead line enablethe net to fish the top 1.8 meters of the water column. At the front of each wing is a 1.8 meter barkeeping this depth constant. The Kodiak trawl is fished with an aluminum live box as a cod end to avoidexcessive fish mortality. Two boats tow the Kodiak net through the water at the surface, one pulling eachwing. At the end of each tow, the boats come together, the tow rope from the work boat is passed to thenet boat, then the work boat retrieves the live box from the cod end of the net and removes the fish. Themethod used to calculate CPM3 per tow is the same as the midwater trawl.

Daily, weekly, and monthly CPUE calculations

Data was summarized using monthly CPM 3 values. The average monthly CPM 3 , unless otherwisespecified, was calculated based on the daily and weekly averages as shown in the following formulas.

3 (site/tow CPM3) i=1

Average Daily CPM3 = # sites/tows sampled in each day

3 (daily CPM3)

i=1Average Daily by Week CPM3 =

# days sampled in each week

13

3 (weekly CPM3) i=1

Average Daily by Month CPM3 = # weeks sampled in each month

The monthly CPM3 was the sum of weekly CPM3 divided by the number of weeks sampled per month. Weeks were designated as Monday-Sunday and weeks which overlap months were split and included intheir respective months. Each average weekly CPM3 was calculated by averaging all daily means withinthe week. The daily CPM3 was the average of all tows for trawl and all sites for seine for each day.

14

Lower Sacramento River Beach Seine

To estimate the relative abundance of juvenile chinook salmon in the lower Sacramento River, beachseining was conducted at nine sites once per week from August 1, 1996, through July 31, 1998. Thearea sampled was from Colusa (rm 144) downstream to Elkhorn (rm 71). The substrates sampled weresand and paved boat ramps.

1997 Field Season

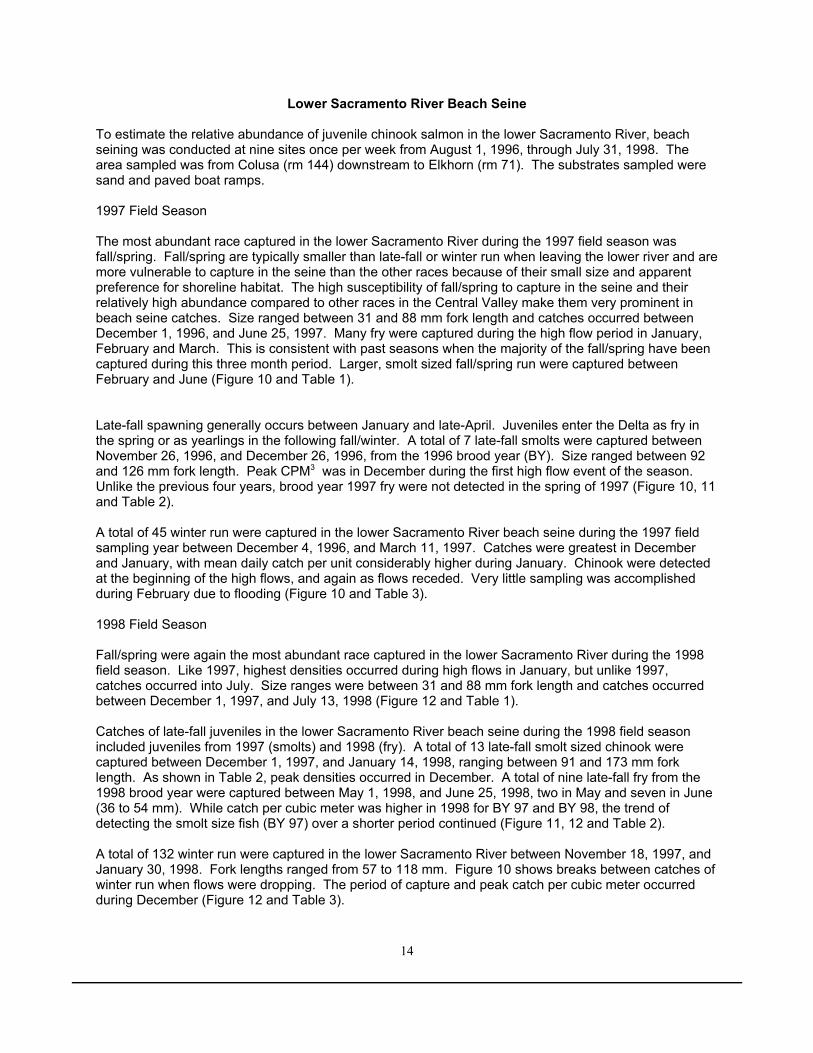
The most abundant race captured in the lower Sacramento River during the 1997 field season wasfall/spring. Fall/spring are typically smaller than late-fall or winter run when leaving the lower river and aremore vulnerable to capture in the seine than the other races because of their small size and apparentpreference for shoreline habitat. The high susceptibility of fall/spring to capture in the seine and theirrelatively high abundance compared to other races in the Central Valley make them very prominent inbeach seine catches. Size ranged between 31 and 88 mm fork length and catches occurred betweenDecember 1, 1996, and June 25, 1997. Many fry were captured during the high flow period in January,February and March. This is consistent with past seasons when the majority of the fall/spring have beencaptured during this three month period. Larger, smolt sized fall/spring run were captured betweenFebruary and June (Figure 10 and Table 1).

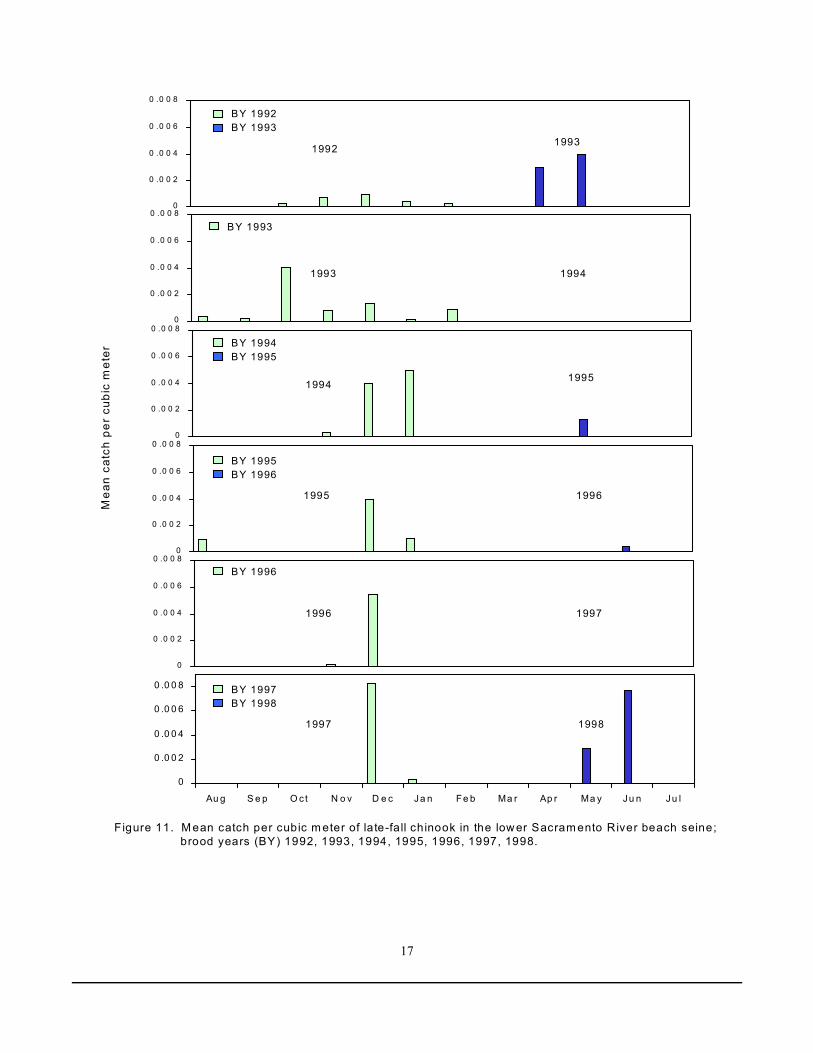
Late-fall spawning generally occurs between January and late-April. Juveniles enter the Delta as fry inthe spring or as yearlings in the following fall/winter. A total of 7 late-fall smolts were captured betweenNovember 26, 1996, and December 26, 1996, from the 1996 brood year (BY). Size ranged between 92and 126 mm fork length. Peak CPM3 was in December during the first high flow event of the season. Unlike the previous four years, brood year 1997 fry were not detected in the spring of 1997 (Figure 10, 11and Table 2).

A total of 45 winter run were captured in the lower Sacramento River beach seine during the 1997 fieldsampling year between December 4, 1996, and March 11, 1997. Catches were greatest in Decemberand January, with mean daily catch per unit considerably higher during January. Chinook were detectedat the beginning of the high flows, and again as flows receded. Very little sampling was accomplishedduring February due to flooding (Figure 10 and Table 3).

1998 Field Season

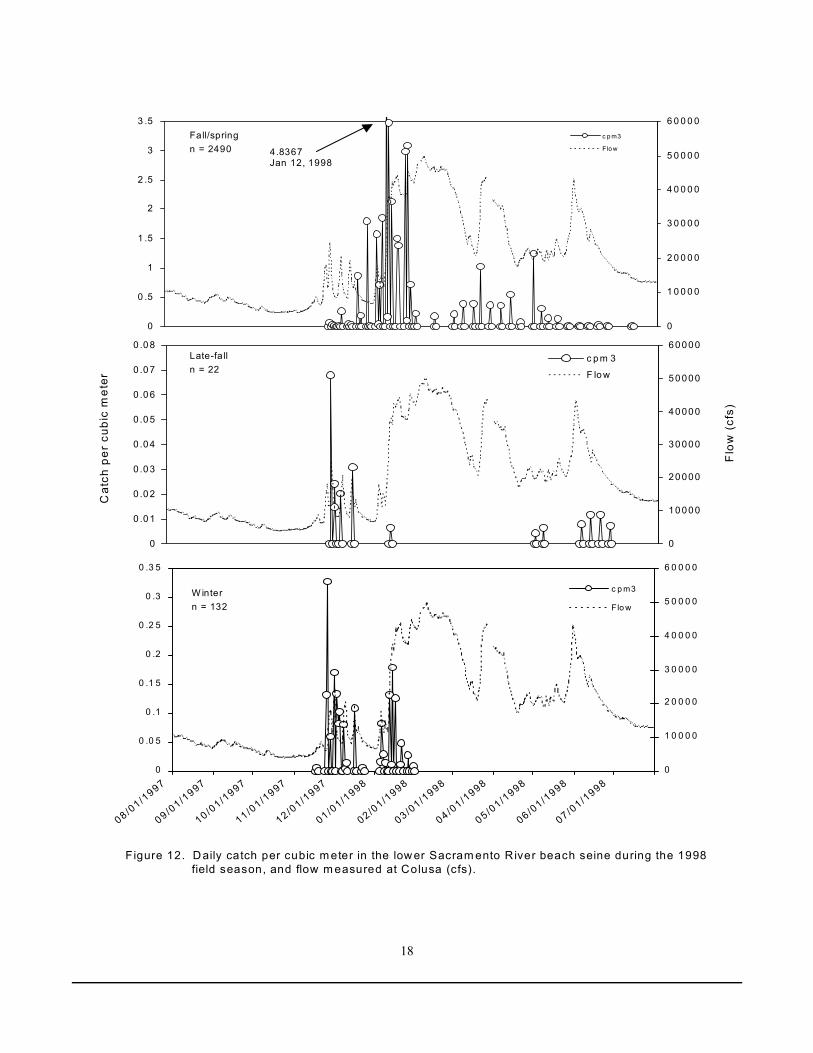
Fall/spring were again the most abundant race captured in the lower Sacramento River during the 1998field season. Like 1997, highest densities occurred during high flows in January, but unlike 1997,catches occurred into July. Size ranges were between 31 and 88 mm fork length and catches occurredbetween December 1, 1997, and July 13, 1998 (Figure 12 and Table 1).

Catches of late-fall juveniles in the lower Sacramento River beach seine during the 1998 field seasonincluded juveniles from 1997 (smolts) and 1998 (fry). A total of 13 late-fall smolt sized chinook werecaptured between December 1, 1997, and January 14, 1998, ranging between 91 and 173 mm forklength. As shown in Table 2, peak densities occurred in December. A total of nine late-fall fry from the1998 brood year were captured between May 1, 1998, and June 25, 1998, two in May and seven in June(36 to 54 mm). While catch per cubic meter was higher in 1998 for BY 97 and BY 98, the trend ofdetecting the smolt size fish (BY 97) over a shorter period continued (Figure 11, 12 and Table 2).

A total of 132 winter run were captured in the lower Sacramento River between November 18, 1997, andJanuary 30, 1998. Fork lengths ranged from 57 to 118 mm. Figure 10 shows breaks between catches ofwinter run when flows were dropping. The period of capture and peak catch per cubic meter occurredduring December (Figure 12 and Table 3).

15

0

0 .0 1

0 .0 2

0 .0 3

0 .0 4

0 .0 5

0 .0 6

0 .0 7

0 .0 8

0 .0 9

0

1 0 0 0 0

2 0 0 0 0

3 0 0 0 0

4 0 0 0 0

5 0 0 0 0

6 0 0 0 0

c pm3

Flow

Late-falln = 8

Cat

ch p

er c

ubic

met

er

Flo

w (

cfs)

F igure 10. Daily catch per cubic meter in the lower Sacramento River beach seine during the 1997 field season, and flow measured at Colusa (cfs).

0

0 .0 5

0 .1

0 .1 5

0 .2

0 .2 5

0 .3

0 .3 5

08 /01 /1

996

0 9 /01 /1

996

1 0 /01 /1

996

1 1 /01 /1

996

1 2 /01 /1

996

0 1 /01 /1

997

0 2 /01 /1

997

0 3 /01 /1

997

0 4 /01 /1

997

0 5 /01 /1

997

0 6 /01 /1

997

0 7 /01 /1

9970

1 0 0 0 0

2 0 0 0 0

3 0 0 0 0

4 0 0 0 0

5 0 0 0 0

6 0 0 0 0

c pm 3

F low

Wintern = 45

0

0 .5

1

1 .5

2

2 .5

3

3 .5

0

10000

20000

30000

40000

50000

60000

c p m 3

F lo w

Fall/springn = 1985 4.0889

Jan. 15, 1997

16

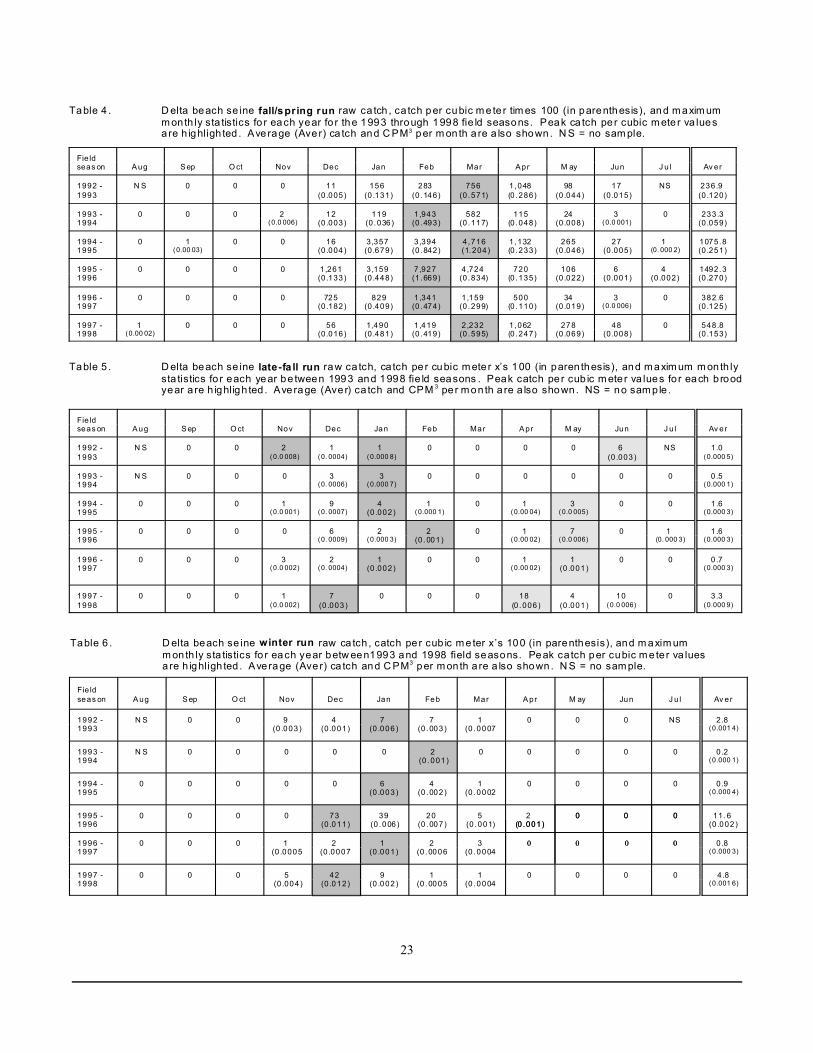
Ta ble 1 . L ow er S acram en to Rive r b ea ch seine fa ll/s pring run ra w ca tch , catch pe r cub ic m e ter tim e s 10 0 (in pa ren thes is ), a nd m a xim um m on thly s ta tis tics fo r ea ch ye ar fo r th e 1 99 3 th rou gh 19 98 field seaso ns. Pe ak ca tch per cu bic m e te r va lues are high ligh ted . Ave ra ge (A ve r) catch an d C P M3 pe r m on th a re a lso sho wn . N S = n o sam p le.

Fie ld seas on A ug S ep O ct Nov Dec Jan Feb Mar A pr M ay Jun J u l Av er

1992 -1993

N S 0 0 0 25 (0 .157)

307 (0 .228)

327 (0 .413 )

549 (0 .332)

162 (0 .055 )

4 (0 .006 )

0 0 125 (0 .108)

1993 -1994

2 (0 .007 )

0 0 0 146 (0 .064 )

571 (0 .121)

888 (0 .639 )

594 (0.485 )

97 (0 .017 )

0 0 0 191.5 (0 .111)

1994 -1995

0 0 0 0 15 (0 .009)

1 ,641 (2 .193)

1 ,716 (1 .837 )

1 ,321 (1.511 )

279 (0 .369 )

186 (0 .191 )

18 (0 .022 )

1 (0 .005 )

431 .4(0 .511 )

1995 -1996

2 (0.00 04)

0 0 0 1 ,028 (0 .437 )

2 ,345 (1 .588)

3 ,854 (2 .744 )

2 ,043 (1.908 )

282 (0 .225 )

46 (0 .139 )

0 1 (0. 000 2)

800 .1 (0 .587)

1996 -1997

0 0 0 0 289 (0 .200)

500 (1 .624)

711 (0 .945 )

354 (0 .566)

121 (0 .076 )

9 (0 .006 )

1 (0 .004)

0 165 .4(0 .284 )

1997 -1998

0 0 0 0 100 (0 .219)

1 ,649 (1 .371)

44 (0 .139 )

377 (0 .457)

161 (0 .326 )

140 (0 .366 )

17 (0 .018)

2 (0 .055)

207 .5 (0 .246)

Ta ble 2 . L ow er S acram en to Rive r b ea ch seine la te-fa ll run raw catch , ca tch p er cub ic m e ter tim es 1 00 (in pa ren the s is ), a nd m a xim um m on thly s ta tis tics fo r ea ch ye ar fo r th e 1 99 3 th rou gh 19 98 field seaso ns. Pe ak ca tch per cu bic m e ter va lu es fo r ea ch b roo d ye ar p er ye a r are high lig hte d. A ve rag e (A ve r) ca tch a nd CP M3 pe r m o nth are also sh own . NS = n o sam p le .

Fie ldseas on A ug S ep O ct Nov Dec Jan Feb Mar A pr M ay Jun J u l Av er

1992 -1993

N S 0 1 (0 .030 )

1 (0 .070)

1 (0 .090 )

1 (0 .040)

1 (0 .030 )

0 2 (0 .260 )

10 (0 .370 )

0 0 1 .5(0 .081 )

1993 -1994

1 (0 .034 )

2 (0 .021 )

29 (0 .405 )

10 (0 .079 )

9 (0 .128 )

1 (0 .013)

1 (0 .085 )

0 0 0 0 0 4 .4 (0 .064)

1994 -1995

0 0 0 2 (0 .027)

10 (0 .438)

7 (0 .502)

0 0 0 2 (0 .126 )

0 0 1 .8 (0 .091)

1995 -1996

4 (0 .091 )

0 0 0 14 (0 .403)

2 (0 .105)

0 0 0 0 1 (0 .038 )

0 1 .8 (0 .053)

1996 -1997

0 0 0 1 (0 .014)

6 (0 .545)

0 0 0 0 0 0 0 0 .6(0 .047 )

1997 -1998

0 0 0 0 12 (0 .825)

1 (0 .032)

0 0 0 2 (0 .300 )

7 (0 .769)

0 1 .8 (0 .161)

Ta ble 3 . L ow er S acram en to Rive r b ea ch seine w inte r run ra w ca tch , ca tch p er cu bic m e te r tim es 10 0 (in p are nth es is ), a nd m a xim um m on thly s ta tis tics fo r ea ch ye ar fo r th e 1 99 3 th rou gh 19 98 field seaso ns . Pe ak ca tch per cu bic m e ter va lu es a re h ig hlig hte d . A ve rag e (Ave r) ca tch a nd CP M 3 pe r m o nth a re a lso sho wn . NS = n o sam p le .

Fie ldseas on A u g S ep O ct No v De c Jan Feb Mar A p r M ay Jun J u l Av e r

1992 -1993

N S 2 (0 . 110 )

0 15 (1 .87 0 )

18 (0 .65 0 )

52 (2 .30 0 )

30 (2 . 300 )

0 0 0 0 0 10 .6(0 .65 7 )

1993 -1994

0 0 2 (0.01 6 )

0 5 (0 .05 2 )

7 (0 . 369 )

12 (0 . 853 )

0 0 0 0 0 2 .2 (0 . 108)

1994 -1995

0 0 0 7 (0 .01 9 )

2 (0 .06 4 )

53 (1 . 626 )

4 (0 . 140 )

12 (0 . 157)

0 0 0 0 6 .5 (0 . 167)

1995 -1996

0 0 0 0 119 (3 .04 6 )

45 (1 . 365 )

14 (0 . 662 )

4 (0. 305 )

1 (0 .03 1 )

0 0 0 15 .3 (0 . 451)

1996 -1997

0 0 0 0 34 (3 .51 5 )

0 7 (0 . 428 )

4 (0. 255 )

0 0 0 0 3 .8 (0 . 350)

1997 -1998

0 0 0 36 (3 .30 0 )

48 (3 .71 0 )

48 (3 . 724 )

0 0 0 0 0 0 11 .0 (0 . 895)

17

0

0 .0 0 2

0 .0 0 4

0 .0 0 6

0 .0 0 8

0

0 .0 0 2

0 .0 0 4

0 .0 0 6

0 .0 0 8

0

0 .0 0 2

0 .0 0 4

0 .0 0 6

0 .0 0 8

0

0 .0 0 2

0 .0 0 4

0 .0 0 6

0 .0 0 8

0

0 .0 0 2

0 .0 0 4

0 .0 0 6

0 .0 0 8

0

0 .0 0 2

0 .0 0 4

0 .0 0 6

0 .0 0 8

Au g S e p O c t N o v D e c Ja n Fe b Ma r Ap r Ma y Ju n Ju l

BY 1992BY 1993

BY 1995BY 1996

BY 1993

BY 1994BY 1995

BY 1996

BY 1997BY 1998

19921993

1993 1994

19941995

1995 1996

1996 1997

1997 1998

Mea

n ca

tch

per

cubi

c m

eter

F igure 11. M ean catch per cubic m eter of late-fall chinook in the lower Sacram ento River beach seine; brood years (BY) 1992, 1993, 1994, 1995, 1996, 1997, 1998.

18

0

0 .0 1

0 .0 2

0 .0 3

0 .0 4

0 .0 5

0 .0 6

0 .0 7

0 .0 8

0

10 000

20 000

30 000

40 000

50 000

60 000c p m 3

F lo w

Cat

ch p

er c

ubic

met

er

Flo

w (

cfs)

Late-fall

F igure 12. Daily catch per cubic m eter in the low er Sacram ento R iver beach seine during the 1998 field season, and flow m easured at Colusa (cfs).

n = 22

0

0 .0 5

0 .1

0 .1 5

0 .2

0 .2 5

0 .3

0 .3 5

08 /01 /1

997

09 /01 /1

997

10 /01 /1

997

11 /01 /1

997

12 /01 /1

997

01 /01 /1

998

02 /01 /1

998

03 /01 /1

998

04 /01 /1

998

05 /01 /1

998

06 /01 /1

998

07 /01 /1

9980

1 0 0 0 0

2 0 0 0 0

3 0 0 0 0

4 0 0 0 0

5 0 0 0 0

6 0 0 0 0

c p m3

Flo w

W intern = 132

0

0 .5

1

1 .5

2

2 .5

3

3 .5

0

1 0 0 0 0

2 0 0 0 0

3 0 0 0 0

4 0 0 0 0

5 0 0 0 0

6 0 0 0 0c p m3

Flo w

Fall/springn = 2490 4.8367

Jan 12, 1998

19

Lower San Joaquin River Beach Seine

The lower San Joaquin River beach seine was started in 1994, to document the relative abundance anddistribution of San Joaquin River chinook salmon. Seining was conducted once per week, betweenJanuary and June, each year.

1997 field season

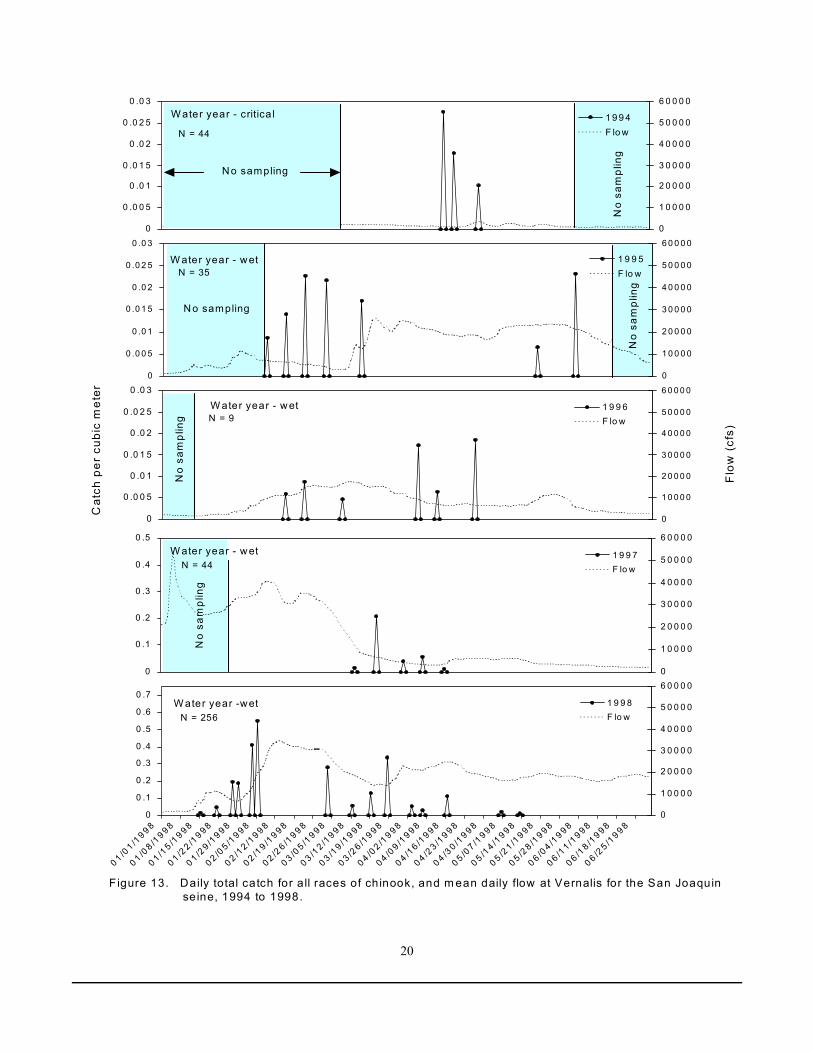
In 1997, sampling was conducted from January 27 through June 24. As a result of flooding, only thefurthest downstream site was accessible until March 31 when all of the sites were seined. A total of 44chinook were captured between March and April. Highest CPM3 (6.594) occurred in March (Figure 13).

1998 field season

In 1998, seining was conducted between January 2 and June 25. Due to high flows, many sites could notbe seined.

A total of 256 fall run were captured in 1998, with the highest CPM3 (55.0) occurring in February (Figure13).

Figure 13 shows the relationship between flows and CPM3 between 1994 and 1998. In 1994 a criticallydry water year, 57 chinook were captured in April and May. In 1995, a wet year, 51 chinook werecaptured between February and June. Although the lowest number of chinook captured was in 1996, awet year, the lowest CPM3 occurred in 1997. In January 1997, as flows reached flood stages, most of theseine sites were inaccessible, and no chinook were captured until March, during a period of decreasingflows. Chinook were sampled from January through May of 1998, a wet year, when the first large numberof chinook were captured just prior to a period of increased flows. While there appeared to be littlerelationship between flows and juvenile emigration, the 1994 and 1997 juvenile emigration are similar, asare the 1995 and 1998.

20

0

0 .0 0 5

0 .0 1

0 .0 1 5

0 .0 2

0 .0 2 5

0 .0 3

0

1 0 0 0 0

2 0 0 0 0

3 0 0 0 0

4 0 0 0 0

5 0 0 0 0

6 0 0 0 0

1 9 9 4F lo w

0

0 .0 0 5

0 .0 1

0 .0 1 5

0 .0 2

0 .0 2 5

0 .0 3

0

1 0 0 0 0

2 0 0 0 0

3 0 0 0 0

4 0 0 0 0

5 0 0 0 0

6 0 0 0 0

1 9 9 5F lo w

0

0 .0 0 5

0 .0 1

0 .0 1 5

0 .0 2

0 .0 2 5

0 .0 3

0

1 0 0 0 0

2 0 0 0 0

3 0 0 0 0

4 0 0 0 0

5 0 0 0 0

6 0 0 0 0

1 9 9 6F lo w

0

0 .1

0 .2

0 .3

0 .4

0 .5

0

1 0 0 0 0

2 0 0 0 0

3 0 0 0 0

4 0 0 0 0

5 0 0 0 0

6 0 0 0 0

1 9 9 7F lo w

Cat

ch p

er c

ubic

met

er

Flo

w (

cfs)

F igure 13. Daily total catch for a ll races of chinook, and m ean daily flow at Vernalis for the San Joaquin seine, 1994 to 1998.

0

0 .1

0 .2

0 .3

0 .4

0 .5

0 .6

0 .7

0 1 /01 /1

9 9 8

0 1 /08 /1

9 9 8

0 1 /15 /1

9 9 8

0 1 /22 /1

9 9 8

0 1 /29 /1

9 9 8

0 2 /05 /1

9 9 8

0 2 /12 /1

9 9 8

0 2 /19 /1

9 9 8

0 2 /26 /1

9 9 8

0 3 /05 /1

9 9 8

0 3 /12 /1

9 9 8

0 3 /19 /1

9 9 8

0 3 /26 /1

9 9 8

0 4 /02 /1

9 9 8

0 4 /09 /1

9 9 8

0 4 /16 /1

9 9 8

0 4 /23 /1

9 9 8

0 4 /30 /1

9 9 8

0 5 /07 /1

9 9 8

0 5 /14 /1

9 9 8

0 5 /21 /1

9 9 8

0 5 /28 /1

9 9 8

0 6 /04 /1

9 9 8

0 6 /11 /1

9 9 8

0 6 /18 /1

9 9 8

0 6 /25 /1

9 9 80

1 0 0 0 0

2 0 0 0 0

3 0 0 0 0

4 0 0 0 0

5 0 0 0 0

6 0 0 0 0

1 9 9 8F lo w

N = 44

N = 35

N = 9

N = 44

N = 256

W ater year - wet

W ater year - critica l

W ater year - wet

W ater year - wet

W ater year -wet

No sampling

No

sam

plin

gN

o sa

mpl

ing

N o sampling

No

sam

plin

g

No

sam

plin

g

21

Delta Beach Seine (North, Central, and South Delta)

Delta beach seining was conducted from August 1, 1996, to July 31, 1998. A total of ten North Deltasites were sampled weekly, and ten Central and nine South Delta sites were sampled between two andfour times per month (Figures 4 and 5). Between October and April, an additional set of seine sites weresampled five days per week concentrating efforts in the Sacramento area. The additional seine sitesconsisted of two sites on the lower Sacramento River, three new sites, and three sites in the North Delta. This seining was done in addition to normal sampling to capture winter run juveniles and spring runyearlings as they enter the Delta.

1997 Field Season

Fry fall/spring run catches began at the onset of the first significant flow event of the season in Decemberand continued through February. Smolts began dominating the catches in March and trailed off towardsthe end of June. The maximum CPM3 = 0.474 was in February, the lowest observed since 1993 (Figure14 and Table 4).

Catches of late-fall juveniles during the 1997 field season occurred between November 26, 1996, andMay 13, 1997. While peak catches occurred during January, they were too low to determine temporaltiming. A total of six yearlings from the 1996 brood year were captured and two from the 1997 brood yearwere captured (fry). Catches of late-fall fry during the spring weren’t as low since 1994, a critically drywater year (Figure 14 and Table 5).

Winter run catches during 1997 appeared to occur at the beginning of flow events or directly followingthem. Catches were very low in the Delta, occurring between November and March. Similar to late-fallfry catches, catches of winter run were the lowest observed since 1994 (Figure 14 and Table 6).

1998 Field Season

Fall/spring run catches were dominated by fry between December and March and smolts between Apriland June. A total of 6,586 fall/spring run were captured between August 12, 1997, and June 23, 1998. Incontrast with the 1997 field season, catches were much more prolific particularly during the spring (Figure15 and Tables 4).

Late-fall 1997 brood year catches during the winter were very low, however, 1998 brood year fry catchesin the spring were the highest on record since 1993. Catches for the 1998 field season occurred betweenNovember 28, 1997, and June 23, 1998 (Figure 15 and Tables 5).

A total of 58 winter run were captured in the Delta between November 28, 1997, and March 25, 1998. Highest densities were observed in December, and 1998 monthly CPM3 was the highest of the last sixyears. As in past years, catches were observed directly after or during significant flow events (Figure 15and Table 6).

22

Cat

ch p

er c

ubic

met

er

Flo

w (

cfs)

F igure 14. Daily catch per cubic meter (CPM 3)in the Delta area beach seine during the 1997 field season, and flow on the Sacram ento River at Freeport.

0

0 .0 1

0 .0 2

0 .0 3

0 .0 4

0 .0 5

0 .0 6

0 .0 7

0

2 0 0 0 0

4 0 0 0 0

6 0 0 0 0

8 0 0 0 0

1 0 0 0 0 0

1 2 0 0 0 0

C P U E

F lo w sLate-falln = 8

0

0 .002

0 .004

0 .006

0 .008

0 .01

0 .012

0 .014

0 8 /01 /9

6

0 9 /01 /9

6

1 0 /01 /9

6

1 1 /01 /9

6

1 2 /01 /9

6

0 1 /01 /9

7

0 2 /01 /9

7

0 3 /01 /9

7

0 4 /01 /9

7

0 5 /01 /9

7

0 6 /01 /9

7

0 7 /01 /9

7

0

20 000

40 000

60 000

80 000

10 0000

12 0000

CPUE

Flo w

W intern = 9

0

0 .5

1

1 .5

2

2 .5

3

3 .5

0

20000

40000

60000

80000

100000

120000

C P U E

F lo w

Fall/springn = 4591

23

Table 5 . D elta beach se ine late -fa ll run raw ca tch, ca tch per cubic mete r x’s 100 (in paren thesis), and maxim um m onth ly sta tistics fo r each year be tween 1993 and 1998 fie ld seasons . Peak catch per cub ic m eter va lues fo r each b roodyear a re h ighligh ted . Average (Aver) ca tch and CPM 3 per month a re a lso shown. NS = no sam p le .

Fie ldseas on Aug Sep O ct Nov Dec Jan Feb Mar Apr M ay Jun J u l Av er

1992 -1993

N S 0 0 2 (0.0 008)

1 (0. 0004)

1 (0.000 8)

0 0 0 0 6 (0 .003)

NS 1.0 (0.000 5)

1993 -1994

N S 0 0 0 3 (0. 0006)

3(0.000 7)

0 0 0 0 0 0 0.5 (0.000 1)

1994 -1995

0 0 0 1 (0.0 001)

9 (0. 0007)

4 (0 .002)

1 (0.000 1)

0 1 (0.00 04)

3 (0.0 005)

0 0 1.6 (0.000 3)

1995 -1996

0 0 0 0 6 (0. 0009)

2 (0.000 3)

2 (0 .001)

0 1 (0.00 02)

7 (0.0 006)

0 1 (0. 000 3)

1 .6 (0.000 3)

1996 -1997

0 0 0 3 (0.0 002)

2 (0. 0004)

1 (0 .002)

0 0 1 (0.00 02)

1 (0 .001)

0 0 0.7 (0.000 3)

1997 -1998

0 0 0 1 (0.0 002)

7 (0 .003)

0 0 0 18 (0 .006)

4 (0 .001)

10 (0.0 006)

0 3.3 (0.000 9)

Table 6 . D elta beach se ine winter run raw ca tch , catch pe r cub ic m e ter x’s 100 (in parenthesis), and m axim um m on th ly sta tistics fo r each year betw een1993 and 1998 field seasons. Peak ca tch per cubic m e ter va lues a re h ighligh ted . Ave rage (Ave r) ca tch and C PM3 per m onth a re a lso shown . N S = no sam ple.

Fie ldseas on A ug S ep O ct Nov Dec Jan Feb Mar A pr M ay Jun J u l Av er

1992 -1993

N S 0 0 9 (0 .003)

4 (0 .001)

7 (0 .006)

7 (0 .003)

1 (0 .0007

0 0 0 NS 2.8 (0.001 4)

1993 -1994

N S 0 0 0 0 0 2 (0 .001)

0 0 0 0 0 0.2 (0.000 1)

1994 -1995

0 0 0 0 0 6 (0 .003)

4 (0 .002)

1 (0 .0002

0 0 0 0 0.9 (0.000 4)

1995 -1996

0 0 0 0 73 (0 .011)

39 (0 .006)

20 (0 .007)

5 (0 .001)

2 (0 .001)

0 0 0 11.6 (0 .002)

1996 -1997

0 0 0 1 (0 .0005

2 (0 .0007

1 (0 .001)

2 (0 .0006

3 (0 .0004

0 0 0 0 0.8 (0.000 3)

1997 -1998

0 0 0 5 (0 .004)

42 (0 .012)

9 (0 .002)

1 (0 .0005

1 (0 .0004

0 0 0 0 4.8(0.001 6)

(0 .001)0 0 0

0 0 0 0

Table 4 . D elta beach se ine fall/spring run raw ca tch , ca tch per cubic m e te r tim es 100 (in parenthesis), and m axim um m onth ly sta tistics fo r each year fo r the 1993 through 1998 fie ld seasons. Peak ca tch pe r cubic m ete r va lues a re h ighligh ted . Ave rage (Ave r) ca tch and C PM3 per m on th a re a lso shown . N S = no sam ple.

Fie ld seas on Aug Sep O ct Nov Dec Jan Feb Mar Apr M ay Jun J ul Av er

1992 -1993

N S 0 0 0 11 (0 .005)

156 (0 .131)

283 (0 .146)

756 (0 .571)

1,048 (0 .286)

98 (0 .044)

17 (0 .015)

NS 236.9 (0 .120)

1993 -1994

0 0 0 2 (0.0 006)

12 (0 .003)

119 (0 .036)

1,943 (0 .493)

582 (0 .117)

115 (0 .048)

24 (0 .008)

3 (0.0 001)

0 233.3(0.059)

1994 -1995

0 1(0.00 03)

0 0 16 (0 .004)

3,357 (0 .679)

3,394 (0 .842)

4,716 (1.204)

1,132 (0 .233)

265 (0 .046)

27 (0 .005)

1 (0. 000 2)

1075.8(0.251)

1995 -1996

0 0 0 0 1,261 (0 .133)

3,159 (0 .448)

7,927 (1 .669)

4,724 (0 .834)

720 (0 .135)

106 (0 .022)

6 (0 .001)

4 (0 .002)

1492.3(0.270)

1996 -1997

0 0 0 0 725 (0 .182)

829(0.409)

1,341 (0 .474)

1,159 (0 .299)

500 (0 .110)

34 (0 .019)

3 (0.0 006)

0 382.6(0.125)

1997 -1998

1 (0.00 02)

0 0 0 56 (0 .016)

1,490 (0 .481)

1,419 (0 .419)

2,232 (0 .595)

1,062 (0 .247)

278 (0 .069)

48 (0 .008)

0 548.8(0.153)

24

0

0 .0 1

0 .0 2

0 .0 3

0 .0 4

0 .0 5

0 .0 6

0 .0 7

0 .0 8

0 .0 9

0

1 0 0 0 0

2 0 0 0 0

3 0 0 0 0

4 0 0 0 0

5 0 0 0 0

6 0 0 0 0

7 0 0 0 0

8 0 0 0 0

9 0 0 0 0

1 0 0 0 0 0

C P U E

F lo w

Late-falln = 40

Cat

ch p

er c

ubic

met

er

Flo

w (

cfs)

F igure 15. D aily catch per cubic m eter (CPM 3) in the D elta area beach seine during the 1998 fie ld season, and flow on the Sacram ento R iver at F reeport.

0

0 .0 2

0 .0 4

0 .0 6

0 .0 8

0 .1

0 .1 2

0 .1 4

0 .1 6

08 /01 /1

997

09 /01 /1

997

10 /01 /1

997

11 /01 /1

997

12 /01 /1

997

01 /01 /1

998

02 /01 /1

998

03 /01 /1

998

04 /01 /1

998

05 /01 /1

998

06 /01 /1

998

07 /01 /1

9980

1 0 0 0 0

2 0 0 0 0

3 0 0 0 0

4 0 0 0 0

5 0 0 0 0

6 0 0 0 0

7 0 0 0 0

8 0 0 0 0

9 0 0 0 0

1 0 0 0 0 0

CPUE

Flo w

W intern = 58

0

0 .5

1

1 .5

2

2 .5

3

3 .5

0

1 0 0 0 0

2 0 0 0 0

3 0 0 0 0

4 0 0 0 0

5 0 0 0 0

6 0 0 0 0

7 0 0 0 0

8 0 0 0 0

9 0 0 0 0

1 0 0 0 0 0

C P U E

F lo w

Fall/springn = 6586

25

Kodiak and Midwater Trawl at Sacramento

Beginning in 1995 and continuing to the present, two types of gears have been used for trawling nearSacramento, the Kodiak and midwater trawl. Kodiak trawling has normally occurred from mid-Octoberthrough March, and midwater trawling from April through September. The larger Kodiak trawl targetedthe scarcer and larger races of chinook (late-fall and winter run), while the midwater trawl was used for fryabundance and historical documentation for consistency. All trawling was done approximately 6.4kilometers (four miles) downstream of Sacramento to estimate the relative abundance and timing ofjuvenile salmon entering the Delta. The same site has been sampled since 1988, except 1990, whensampling was done near the town of Courtland approximately 34 kilometers (21 miles) downstream of thepresent site. As in the past, 10 twenty minute tows were conducted between three and seven days aweek depending on the need to index the relative abundance of juvenile salmon entering the Delta.

The Kodiak and midwater trawls have been used interchangeably between January and March whenhigh flows occur. During these high flow periods when large debris fields were moving down the river,Kodiak trawling became hazardous. Changing over to the midwater trawl allowed sampling to continue.

1997 field season

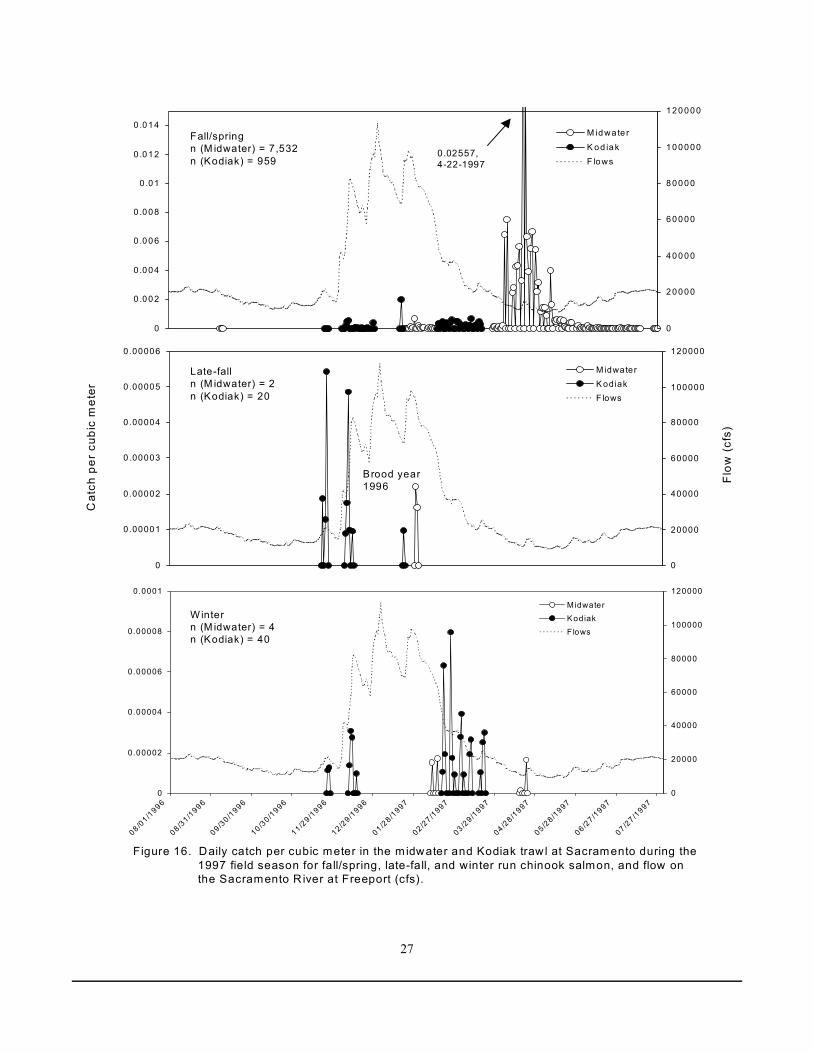
In January, sampling was curtailed for 21 days due to flows that were near flood stage. Daily catch percubic meter and the associated flows are shown in Figures 16.

Most fall/spring were captured between April and May using the midwater trawl. These fish werecaptured well after peak flows, and during a period of hatchery releases (Figure 16 and Table 7).

A total of 959 fall/spring were captured by the Kodiak trawl, while the midwater trawl captured 7,532fall/spring. The Kodiak trawl numbers were low due to the high flows during the winter months and thesuspension of trawling for safety reasons.

Catches of late-fall run chinook were highest in November and December (n = 16), and coincided withincreasing flows. Four late-fall were captured between January and February. Only 1996 brood yearchinook were captured, and their size range was 98 - 221 mm. The midwater trawl captured two late-fallon January 30 and 31, 1997, (165 - 218 mm) during one of the periods when Kodiak trawling wassuspended (Figure 16 and Table 8).

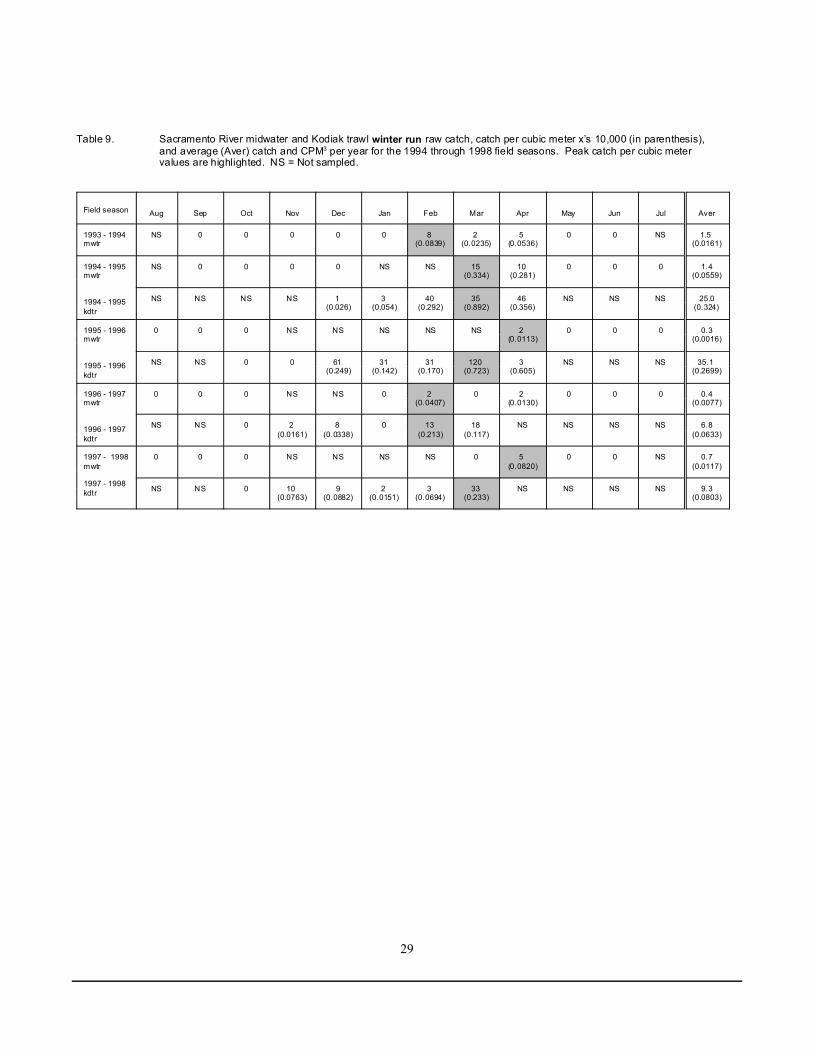
Winter run catches occurred during a period of increasing flows, and again as the flows were receding,however sampling was suspended for 21 days during high flows. Winter run fry ranged in size from 52mm on December 16, 1996, to 142 mm on March 3, 1996. Of the 44 winter run captured, only four werecaptured by the midwater trawl (Figure 16 and Table 9).

1998 field season

Between January 2, 1998, and February 23, 1998, 10 of 25 sampling days were not conducted due tohigh flows. Daily catch per cubic meter and the associated flows are shown in Figure 17.

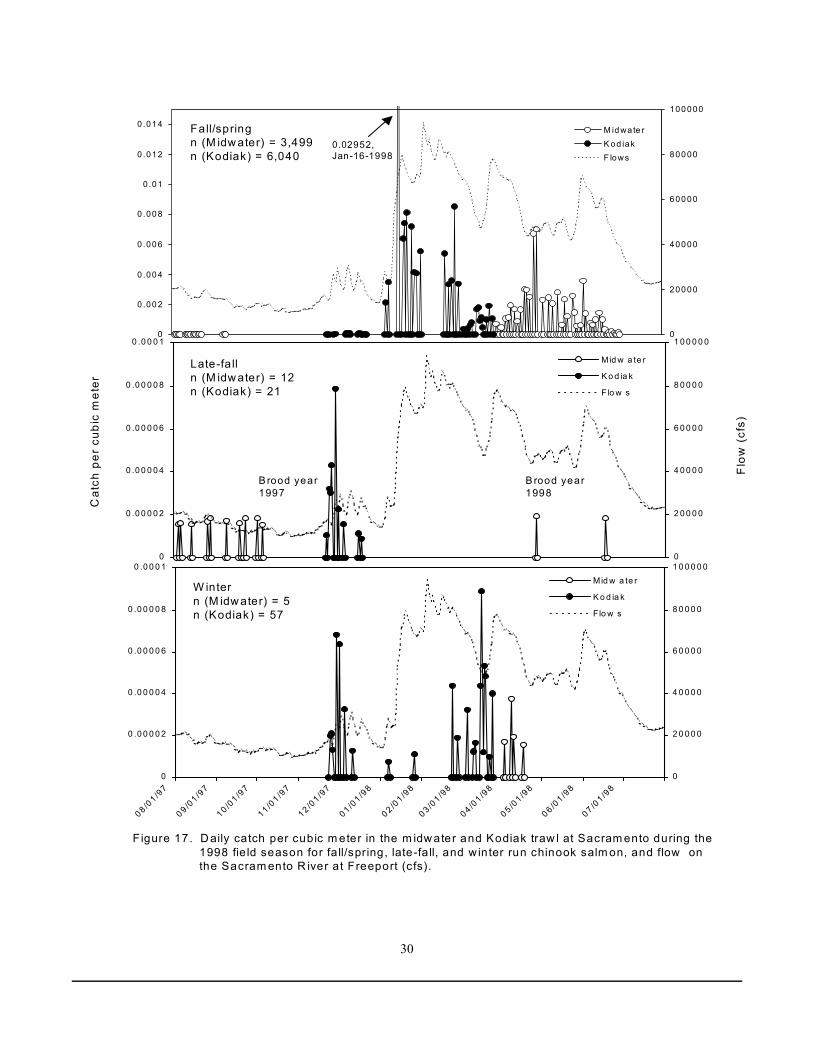
In January, at the beginning of high flows, a large group of fall/spring run chinook were captured. Therewas a second period of increased catches from the end of April through June, which may likely havebeen the result of hatchery releases from Coleman National Fish Hatchery. Unlike 1997, when Kodiaktrawling was periodically suspended during the winter months, in 1998, Kodiak trawling was conductedthroughout the scheduled period (excluding the above period when no sampling was conducted). TheKodiak trawl captured 6,040 fall/spring, nearly twice as many of this race as the midwater trawl (n =3,499) (Figure 17 and Table 7). Brood year 1997 late-fall run catches began August 4, 1996, and continued through December 1996 with

26

a fork length range of 68 - 127 mm. A relatively large group was captured as flows increased duringDecember. Two brood year 1998 late-fall were captured in the midwater trawl (April 27, 1998, at 36 mm,and June 15, 1998, at 51 mm) (Figure 17 and Table 8).

Catches of winter run chinook during 1998 were similar to 1997 catches. Peak catches occurred duringincreasing flows (fork lengths 52-96 mm), and again during high flows (fork lengths 92-145 mm). A highcatch per cubic meter occurred during a short period of decreasing flows in March. The majority of thewinter run were captured by the Kodiak trawl, which was operated during the peak emigration period (n =57 for the Kodiak trawl, and n = 5 for the midwater trawl) (Figure 17 and Table 9).

Figure 18 shows midwater trawl mean catch per cubic meter between 1988 and 1998 for April, May, andJune. Although catches have continued to decline, the reason may be that the fry move out earlier duringwet years such as the period from 1995 through 1998.

27

0

0.00002

0.00004

0.00006

0.00008

0.0001

08 /01 /1

996

08 /31 /1

996

09 /30 /1

996

10 /30 /1

996

11 /29 /1

996

12 /29 /1

996

01 /28 /1

997

02 /27 /1

997

03 /29 /1

997

04 /28 /1

997

05 /28 /1

997

06 /27 /1

997

07 /27 /1

9970

20000

40000

60000

80000

100000

120000

MidwaterKodiakF lows

Cat

ch p

er c

ubic

met

er

Flo

w (

cfs)

0

0 .002

0 .004

0 .006

0 .008

0 .01

0 .012

0 .014

0

20000

40000

60000

80000

100000

120000

M idwa te rK od iakF lows

0.02557,4-22-1997

Fall/springn (M idwater) = 7,532n (Kodiak) = 959

0

0.00001

0.00002

0.00003

0.00004

0.00005

0.00006

0

20000

40000

60000

80000

100000

120000

MidwaterK odiakF lows

Brood year1996

Figure 16. Daily catch per cubic meter in the m idwater and Kodiak traw l at Sacramento during the 1997 field season for fall/spring, late-fall, and winter run chinook salmon, and flow on the Sacramento R iver at Freeport (cfs).

Late-falln (M idwater) = 2n (Kodiak) = 20

Winter n (M idwater) = 4n (Kodiak) = 40

28

Table 7 . Sacram ento Rive r m idwa ter and Kod ia k traw ling fa ll/spring run raw ca tch , catch pe r cub ic m e ter X ’s 10 ,000 (in pare nthesis), an d average (Ave r) ca tch and C PM3 per ye a r fo r the 1 994 th rough 19 98 field seasons. Pe ak ca tch per u nit e ffo rt va lues a re h ig hlig hted . NS = N ot sam p le d .

Fie ld s eason Aug Sep O ct Nov D ec Jan Feb Mar Apr M ay Jun J ul Av er

1993 - 1994 m wtr

N S 1 (0.042)

0 1 (0.007)

4 (0.075)

192 (1.994)

1,036 (10.95)

69 (0.850)

6,588 (109.4)

2,425 (27.45)

73 (1.648)

NS 1,038.9 (15.24)

1994 -1995 m wtr

1994 - 1995 kdt r

N S 0 0 0 6 (0.069)

NS N S 1,020 (23.03)

648 (14.78)

2,312 (13.88)

289 (4.382)

20 (0.261)

477.2 (6.267)

N S N S N S NS 0 1,132 (18.88)

1,168 (7.581)

2,324 (58.79)

1,366 (9.675)

NS NS NS 1,198 (18.99)

1995 - 1996m wtr

1995 - 1996kdt r

6 (0.073)

0 0 NS NS NS N S N S 5,767 (44.18)

5,493 (31.52)

62 (2.344)

13 (0.229)

1,620.1 (11.19)

N S N S 0 0 669 (2.529)

7,456 (35.26)

21,044 (122.6)

2,802 (168.2)

2,111 (512.4)

NS NS NS 6,816.4 (168.2)

1996 - 1997 m wtr

1996 - 1997kdt r

0 1 (0.013)

0 NS NS 46 (1.726)

47 (0.935)

9 (1.674)

5,886 (51.84)

1,451 (13.56)

59 (0.881)

30 (0.576)

752.9 (7.121)

N S N S 0 2 (0.014)

191 (1.599)

117 (20.36)

242 (4.18)

407 (2.711)

N S NS NS NS 159.8 (4.811)

1997 - 1998m wtr

1997 - 1998 kdt r

10 (0.161)

1 (0.019)

0 NS NS NS N S 22 (7.347)

1,734 (25.49)

1,061 (15.53)

671 (7.78)

NS 499.9 (8.047)

N S N S 0 2 (0.012)

37 (0.274)

3,211 (89.64)

1,530 (53.79)

1,260 (12.73)

N S NS NS NS 1,006.7 (26.09)

Table 8 . Sacramento River m idwater and Kodiak traw l late -fa ll run raw catch, ca tch per cubic meter X’s 10,000 (in parenthesis), and average (Aver) catch and C PM3 per year for the 1994 th rough 1998 field seasons. Peak catch per cubic meter va lues are high lighted . NS = Not sampled . * = partial effort during December and Ja nuary .

Field s eason Aug Sep Oc t Nov D ec Jan Feb Mar Apr M ay Jun Jul Av er

1993 - 1994 m wtr

N S 4 (0.155)

19 (0.207)

1 (0.0049)

4 (0.0476)

1 (0.0104)

2 (0.0197)

0 0 0 0 N S 3.1(0.0445)

1994 - 1995 m wtr*

1994 - 1995 kdt r*

N S 0 0 1 (0.011)

30 (0.332)

NS N S 0 0 0 0 1 (0.016)

3.6(0.0399)

N S NS N S NS 2 (0.048)

8 (0.153)

0 0 0 N S NS N S 2.0(0.0402)

1995 - 1996 m wtr

1995 - 1996kdt r

1 (0.0159)

1 (0.0125)

0 NS N S NS N S NS 1 (0.0057)

0 0 0 0.43(0.0049)

N S NS 0 0 17 (0.0704)

10 (0.0427)

0 0 0 N S NS N S 3.9(0.0162)

1996 - 1997m wtr

1996 - 1997kdt r

0 0 0 NS N S 2 (0.0639)

0 0 0 0 0 0 0.2(0.0064)

N S NS 0 8 (0.0453)

8 (0.0388)

1 (0.150)

1 (0.0162)

0 NS N S NS N S 3.0(0.0417)

1997 - 1998m wtr

1997 - 1998kdt r

5 (0.0901)

3 (0.0689)

2 (0.0783)

NS N S NS N S 0 1 (0.0193)

0 1 (0.0122)

N S 1.7(0.0384)

N S NS 0 16 (0.096)

5 (0.0441)

0 0 0 NS N S NS N S 3.5(0.0234)

1994 - 1995 m wtr*

29

Table 9. Sacramento River midwater and Kodiak trawl winter run raw catch, catch per cubic meter x’s 10,000 (in parenthesis), and average (Aver) catch and CPM3 per year for the 1994 through 1998 field seasons. Peak catch per cubic meter values are highlighted. NS = Not sampled.

Field season Aug Sep Oct Nov Dec Jan Feb Mar Apr May Jun Jul Aver

1993 - 1994mwtr

NS 0 0 0 0 0 8 (0.0839)

2 (0.0235)

5 (0.0536)

0 0 NS 1.5 (0.0161)

1994 - 1995 mwtr

1994 - 1995kdtr

NS 0 0 0 0 NS NS 15 (0.334)

10 (0.281)

0 0 0 1.4(0.0559)

NS NS NS NS 1 (0.026)

3 (0.054)

40 (0.292)

35 (0.892)

46 (0.356)

NS NS NS 25.0(0.324)

1995 - 1996mwtr

1995 - 1996 kdtr

0 0 0 NS NS NS NS NS 2 (0.0113)

0 0 0 0.3(0.0016)

NS NS 0 0 61 (0.249)

31 (0.142)

31 (0.170)

120 (0.723)

3 (0.605)

NS NS NS 35.1 (0.2699)

1996 - 1997 mwtr

1996 - 1997kdtr

0 0 0 NS NS 0 2 (0.0407)

0 2 (0.0130)

0 0 0 0.4(0.0077)

NS NS 0 2 (0.0161)

8 (0.0338)

0 13 (0.213)

18 (0.117)

NS NS NS NS 6.8(0.0633)

1997 - 1998 mwtr

1997 - 1998 kdtr

0 0 0 NS NS NS NS 0 5 (0.0820)

0 0 NS 0.7(0.0117)

NS NS 0 10 (0.0763)

9 (0.0882)

2 (0.0151)

3 (0.0694)

33 (0.233)

NS NS NS NS 9.3(0.0803)

30

0

0 .00 2

0 .00 4

0 .00 6

0 .00 8

0 .01

0 .01 2

0 .01 4

0

200 00

400 00

600 00

800 00

100 000

M id wa te rK od iakF lows

0

0 .0 0 0 0 2

0 .0 0 0 0 4

0 .0 0 0 0 6

0 .0 0 0 0 8

0 .0 0 0 1

0

2 0 0 0 0

4 0 0 0 0

6 0 0 0 0

8 0 0 0 0

1 0 0 0 0 0

Mid w a te r

K o d ia k

Flo w s

Cat

ch p

er c

ubic

met

er

Flo

w (

cfs)

0 .02952,Jan-16-1998

0

0 .0 0 0 0 2

0 .0 0 0 0 4

0 .0 0 0 0 6

0 .0 0 0 0 8

0 .0 0 0 1

08 /01 /9

7

09 /01 /9

7

10 /01 /9

7

11 /01 /9

7

12 /01 /9

7

01 /01 /9

8

02 /01 /9

8

03 /01 /9

8

04 /01 /9

8

05 /01 /9

8

06 /01 /9

8

07 /01 /9

80

2 0 0 0 0

4 0 0 0 0

6 0 0 0 0

8 0 0 0 0

1 0 0 0 0 0Mid w a te r

K o d ia k

Flo w s

B rood year1997

Brood year1998

Figure 17. D aily catch per cubic m eter in the m idw ater and Kodiak traw l at Sacram ento during the 1998 fie ld season for fa ll/spring, late-fa ll, and winter run chinook salm on, and flow on the Sacram ento R iver at Freeport (cfs).

Fall/springn (M idw ater) = 3,499n (Kodiak) = 6,040

Late-fa lln (M idw ater) = 12n (Kodiak) = 21

W intern (M idw ater) = 5n (Kodiak) = 57

31

0

0.01

0.02

0.03

0.04

0.05

0.06

0.07

1988 1989 1990 1991 1992 1993 1994 1995 1996 1997 1998

June

M ay

A pril

F igure 18. M ean catch per cubic m eter of salm on sm olts per 20 m inute tow w ith Sacram ento m idwater traw l in April, M ay, and June from 1988 to 1998. There was no sam pling in April of 1992. W = wet year, AN = above norm al year, D = dry year, and C = critical year.

Cat

ch p

er c

ubic

met

er

C

C

C

C

C

D

WW W W

AN

32

Kodiak Trawl at Mossdale

Trawling at Mossdale began on September 4, 1996, to index juvenile salmon moving into the Delta fromthe San Joaquin basin.

All San Joaquin River chinook have been classified as fall run because it is presently the only recognizedrace in the San Joaquin tributaries. Spring run chinook were eliminated from the three San Joaquin Rivertributaries (Stanislaus, Tuolumne, and Merced) by 1930 and from the mainstem by 1947 as a result ofdam construction (USFWS, May 9, 1995).

1997 field season

The sampling season was from September 1996 to July 1997, however sampling was suspendedbetween December 31, 1996, and March 20, 1997, due to flows that reached flood stage, andmechanical problems. When trawling resumed on March 21, 1997, juvenile chinook were captured, andcontinued to be captured until the end of the season. A total of 1,596 chinook were captured from Aprilthrough June (Figure 18).

1998 field season

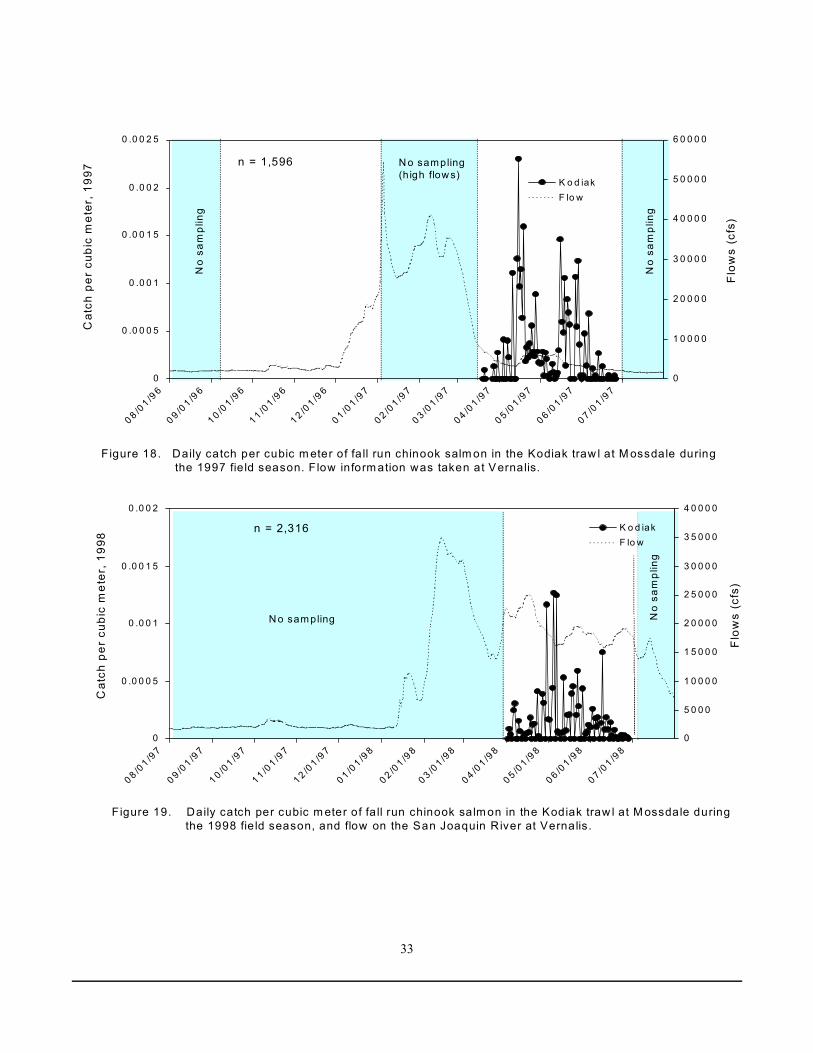
The 1998 sampling season did not begin until April 3 due to a lack of available boats during the fallmonths, and then high flows starting in January. Juvenile chinook were captured when sampling beganin April. A total of 2,316 juvenile chinook were captured from April through June. Highest catch per cubicmeter occurred on May 5. There were two fry chinook captured on June 2 at 46 and 47 mm while allother chinook, ranged in size from 82 mm to 108 mm (Figure 19).

33

Cat

ch p

er c

ubic

met

er, 1

997

Flo

ws

(cfs

)

F igure 18. Daily catch per cubic m eter of fa ll run chinook salm on in the Kodiak traw l at M ossdale during the 1997 fie ld season. Flow inform ation was taken at Vernalis.

Figure 19. Daily catch per cubic m eter of fa ll run chinook salm on in the Kodiak traw l at M ossdale during the 1998 fie ld season, and flow on the San Joaquin River at Vernalis.

0

0 .0 0 0 5

0 .0 0 1

0 .0 0 1 5

0 .0 0 2

0 8 /01 /9

7

0 9 /01 /9

7

1 0 /01 /9

7

1 1 /01 /9

7

1 2 /01 /9

7

0 1 /01 /9

8

0 2 /01 /9

8

0 3 /01 /9

8

0 4 /01 /9

8

0 5 /01 /9

8

0 6 /01 /9

8

0 7 /01 /9

80

5 0 0 0

1 0 0 0 0

1 5 0 0 0

2 0 0 0 0

2 5 0 0 0

3 0 0 0 0

3 5 0 0 0

4 0 0 0 0

K o d iakF lo w

No

sam

plin

g

N o sampling

Flo

ws

(cfs

)

Cat

ch p

er c

ubic

met

er, 1

998

0

0 .0 0 0 5

0 .0 0 1

0 .0 0 1 5

0 .0 0 2

0 .0 0 2 5

0 8 /01 /9

6

0 9 /01 /9

6

1 0 /01 /9

6

1 1 /01 /9

6

1 2 /01 /9

6

0 1 /01 /9

7

0 2 /01 /9

7

0 3 /01 /9

7

0 4 /01 /9

7

0 5 /01 /9

7

0 6 /01 /9

7

0 7 /01 /9

70

1 0 0 0 0

2 0 0 0 0

3 0 0 0 0

4 0 0 0 0

5 0 0 0 0

6 0 0 0 0

K o d iakF lo w

N o sampling(h igh flow s)

No

sam

plin

g

No

sam

plin

g

n = 1,596

n = 2,316

34

Midwater Trawling at Chipps Island

Trawling at Chipps Island was conducted to document baseline fall/spring, winter, and late-fall runabundance trends, and to recover marked salmon from survival studies. Ten 20 minute tows wereconducted between three and seven days a week depending on the need to recover coded wire taggedsalmon for survival studies.

1997 field season

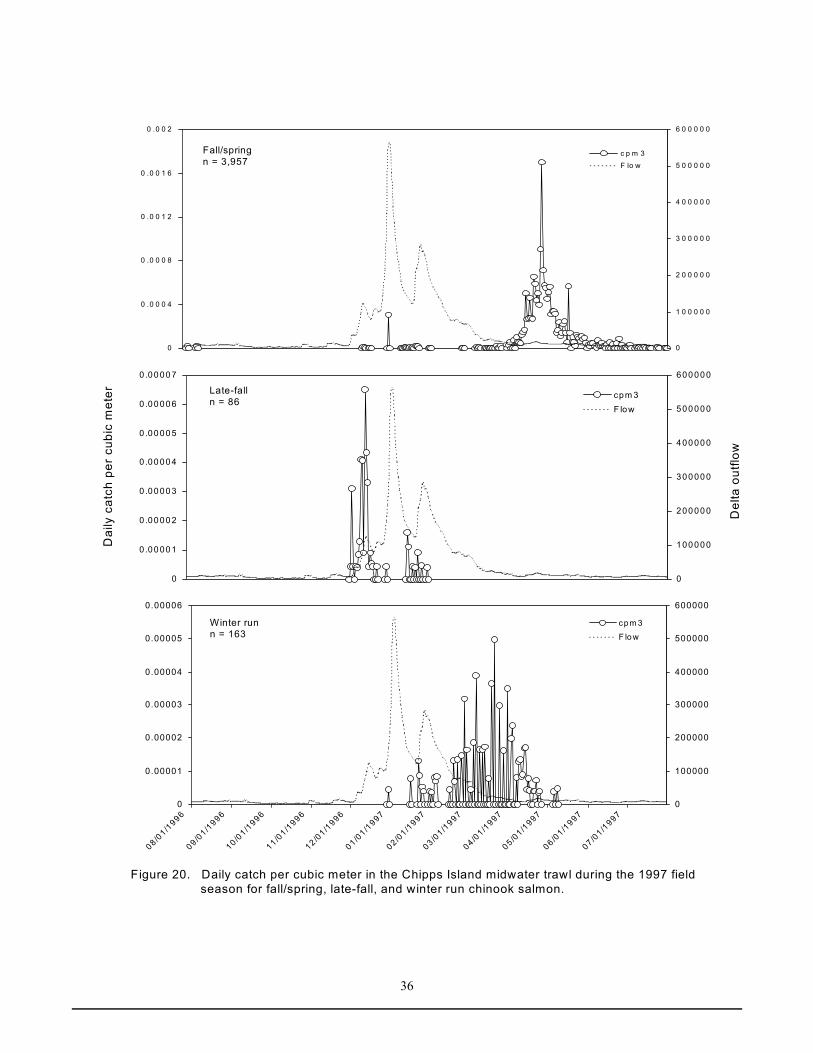
Fall/spring catches for 1997 were relatively low with only 3,957 chinook captured. Although abundancewas highest during April and May, a period when hatchery released chinook have historically made up alarge portion of the catch, the numbers were the lowest for the five years shown in Table 10. A reason forthe overall low abundance in 1997 might have been the large storm event in January, which melted muchof the snow pack, bringing the rivers to flood stage. From January 4 through January 12, trawling wassuspended due to a moratorium on boating in the Delta. During this period many of the fish may havebeen pushed out of the system (Figure 20).

A total of 86 late-fall were captured in 1997. Brood year 1996 catches occurred from December 3, 1996,through January 30, 1997, and size ranges were 99 - 231 mm. Peak catches occurred on January 16,1997. No brood year 1997 fry were captured between April and July, a period when yong-of-the-yearemigrate (Figure 20 and Table 11).

Winter run chinook catches for 1997 totaled 163. Catches were from December through May, with thepeak occurring on March 21, 1997 (Figure 20 and Table 12). Sizes ranged from 84 mm to 141 mm.

1998 field season

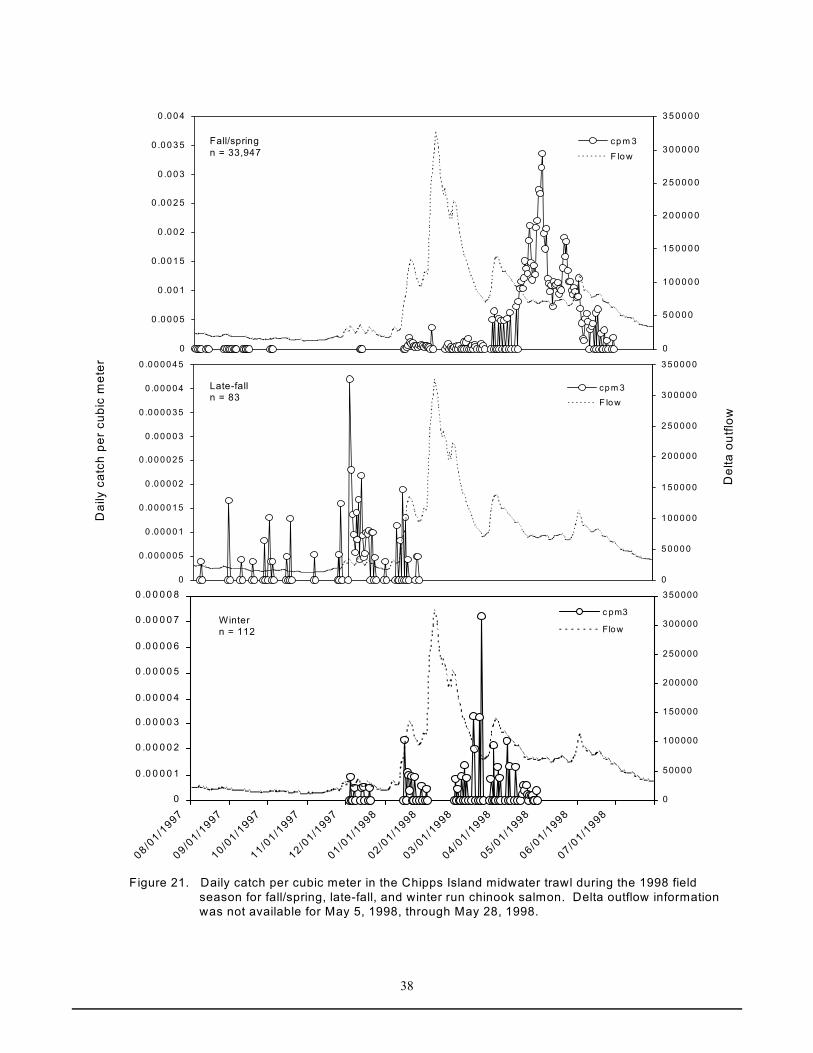
A total of 33,947 fall/spring were captured in 1998 at Chipps Island. One reason for the high raw catchesin 1998 was a doubling of effort during the spring. During this period of sampling, 20 twenty minute towswere conducted per day, 10 in the morning and 10 in the late afternoon, seven days per week, from April16 through May 30 to increase recovery of CWT smolts (Figure 21 and Table 10). Even during monthsoutside the period of double effort, CPM3 was generally higher in 1998 than 1997, and catches in 1997were higher only during November and December (Table 10).

Late-fall catches and peak CPM3 were slightly higher in 1997 than in 1998 (n = 83). Sizes rangedbetween 73 and 193 mm, and peak catches occurred on December 3, 1997. Like 1997, no young-of-the-year fish were captured in 1998 (Figure 21 and Table 11).

There were 112 winter run chinook captured between December and May. Peak catches occurred onMarch 18, 1998 (Figure 21 and Table 12). Sizes ranged from 80 mm to 146 mm.

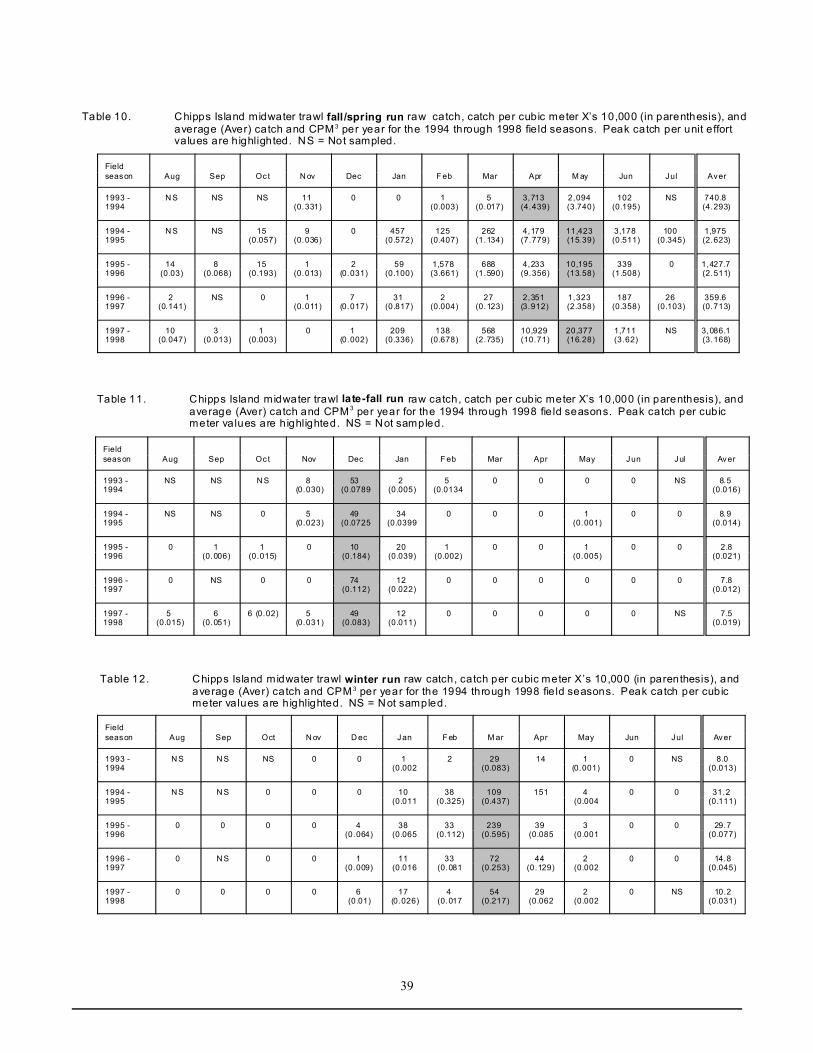
During the five year period shown in Table 10, 11, and 12, peak CPM3 for fall/spring occurred in April orMay, for late-fall in December, and for winter run in March. Average CPM3 in 1997 was the lowest forfall/spring and late-fall, while 1998 was the second highest for both races. Winter run average CPM3 wasthe third and forth lowest for 1997 and 1998 respectively.

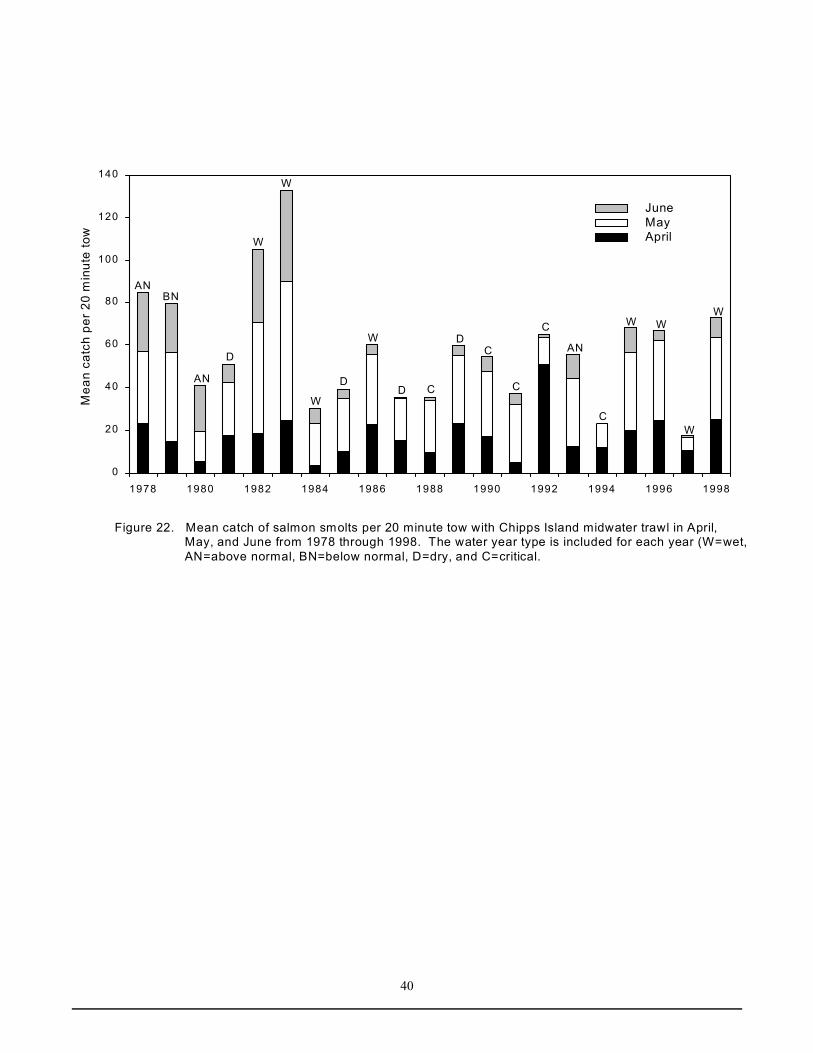
As in past years, most of the smolts in 1997 and 1998 migrated through the Delta in April and May,reflecting the high numbers of fall/spring run chinook, and the influence of hatchery releases fromColeman National Fish Hatchery. The mean juvenile chinook abundance in 1997 for April, May, andJune was the lowest on record at 5.9. Only one other year since 1978 has had a mean abundance lowerthan 10.0; that year was 1994 (7.8). The mean abundance of juvenile chinook for 1998 was 24.3, whichwas above the 20 year average of 19.3. Starting with 1978, catches every third year have been higher

35

than the previous two years, with the exception of 1980. For a 10 year period beginning in 1989, therehas been one year of low catches for every two years of higher catches. It is interesting that whileaverage catches per year were 27.4 for 1978 through 1983, during the successive 10 years, the yearlyaverage catch was 17.1 between 1988 and 1998 (Figure 22).

36

Dai

ly c

atch

per

cub

ic m

eter

0

0 .00001

0 .00002

0 .00003

0 .00004

0 .00005

0 .00006

0 .00007

0

100000

200000

300000

400000

500000

600000

cpm 3F low

Late-falln = 86

0

0.00001

0.00002

0.00003

0.00004

0.00005

0.00006

08 /01 /1

996

09 /01 /1

996

10 /01 /1

996

11 /01 /1

996

12 /01 /1

996

01 /01 /1

997

02 /01 /1

997

03 /01 /1

997

04 /01 /1

997

05 /01 /1

997

06 /01 /1

997

07 /01 /1

9970

100000

200000

300000

400000

500000

600000

cpm 3F low

Winter runn = 163

0

0 .0 0 0 4

0 .0 0 0 8

0 .0 0 1 2

0 .0 0 1 6

0 .0 0 2

0

1 0 0 0 0 0

2 0 0 0 0 0

3 0 0 0 0 0

4 0 0 0 0 0

5 0 0 0 0 0

6 0 0 0 0 0

c p m 3F lo w

Fall/springn = 3,957

Del

ta o

utflo

w

F igure 20. Daily catch per cubic meter in the Chipps Island midwater trawl during the 1997 field season for fall/spring, late-fall, and winter run chinook salmon.

37

Dai

ly c

atch

per

cub

ic m

eter

0

0 .00001

0 .00002

0 .00003

0 .00004

0 .00005

0 .00006

0 .00007

0

100000

200000

300000

400000

500000

600000

cpm 3F low

Late-falln = 86

0

0.00001

0.00002

0.00003

0.00004

0.00005

0.00006

08 /01 /1

996

09 /01 /1

996

10 /01 /1

996

11 /01 /1

996

12 /01 /1

996

01 /01 /1

997

02 /01 /1

997

03 /01 /1

997

04 /01 /1

997

05 /01 /1

997

06 /01 /1

997

07 /01 /1

9970

100000

200000

300000

400000

500000

600000

cpm 3F low

Winter runn = 163

0

0 .0 0 0 4

0 .0 0 0 8

0 .0 0 1 2

0 .0 0 1 6

0 .0 0 2

0

1 0 0 0 0 0

2 0 0 0 0 0

3 0 0 0 0 0

4 0 0 0 0 0

5 0 0 0 0 0

6 0 0 0 0 0

c p m 3F lo w

Fall/springn = 3,957

Del

ta o

utflo

w

F igure 20. Daily catch per cubic meter in the Chipps Island midwater trawl during the 1997 field season for fall/spring, late-fall, and winter run chinook salmon.

38

Dai

ly c

atch

per

cub

ic m

eter

0

0 .0 0 0 0 1

0 .0 0 0 0 2

0 .0 0 0 0 3

0 .0 0 0 0 4

0 .0 0 0 0 5

0 .0 0 0 0 6

0 .0 0 0 0 7

0 .0 0 0 0 8

08/01/1

997

09/01/1

997

10/01/1

997

11/01/1

997

12/01/1

997

01/01/1

998

02/01/1

998

03/01/1

998

04/01/1

998

05/01/1

998

06/01/1

998

07/01/1

9980

50000

100000

150000

200000

250000

300000

350000

c pm3

FlowWintern = 112

0

0 .0 0 0 0 05

0 .0 0 0 0 1

0 .0 0 0 0 15

0 .0 0 0 0 2

0 .0 0 0 0 25

0 .0 0 0 0 3

0 .0 0 0 0 35

0 .0 0 0 0 4

0 .0 0 0 0 45

0

5 0 00 0

1 0 00 0 0

1 5 00 0 0

2 0 00 0 0

2 5 00 0 0

3 0 00 0 0

3 5 00 0 0

cp m 3F lo w

Late-falln = 83

0

0 .0 0 0 5

0 .0 0 1

0 .0 0 1 5

0 .0 0 2

0 .0 0 2 5

0 .0 0 3

0 .0 0 3 5

0 .0 0 4

0

5 0 0 0 0

1 0 0 0 0 0

1 5 0 0 0 0

2 0 0 0 0 0

2 5 0 0 0 0

3 0 0 0 0 0

3 5 0 0 0 0

cp m 3F lo w

Fall/springn = 33,947

Del

ta o

utflo

w

F igure 21. Daily catch per cubic meter in the Chipps Island midwater trawl during the 1998 field season for fall/spring, late-fall, and winter run chinook salmon. Delta outflow information was not available for May 5, 1998, through May 28, 1998.

39

Table 10. Chipps Island midwater trawl fall /spring run raw catch, catch per cubic meter X’s 10,000 (in parenthesis), and average (Aver) catch and CPM3 per year for the 1994 through 1998 field seasons. Peak catch per unit effort values are highlighted. NS = Not sampled.

Fieldseason Aug Sep Oct N ov Dec Jan F eb Mar Apr M ay Jun Jul Aver

1993 -1994

N S NS NS 11 (0.331)

0 0 1 (0.003)

5 (0.017)

3,713 (4.439)

2,094 (3.740)

102 (0.195)

NS 740.8 (4.293)

1994 -1995

N S NS 15 (0.057)

9 (0.036)

0 457 (0.572)

125 (0.407)

262 (1.134)

4,179 (7.779)

11,423 (15.39)

3,178 (0.511)

100 (0.345)

1,975 (2.623)

1995 -1996

14 (0.03)

8 (0.068)

15 (0.193)

1 (0.013)

2(0.031)

59(0.100)

1,578 (3.661)

688 (1.590)

4,233 (9.356)

10,195 (13.58)

339 (1.508)

0 1,427.7 (2.511)

1996 -1997

2 (0.141)

NS 0 1 (0.011)

7 (0.017)

31 (0.817)

2 (0.004)

27 (0.123)

2,351 (3.912)

1,323 (2.358)

187 (0.358)

26 (0.103)

359.6 (0.713)

1997 -1998

10 (0.047)

3 (0.013)

1 (0.003)

0 1 (0.002)

209 (0.336)

138 (0.678)

568 (2.735)

10,929 (10.71)

20,377 (16.28)

1,711 (3.62)

NS 3,086.1 (3.168)

Table 11. Chipps Island midwater trawl late-fall run raw catch, catch per cubic meter X’s 10,000 (in parenthesis), and average (Aver) catch and CPM 3 per year for the 1994 through 1998 fie ld seasons. Peak catch per cubic meter values are highlighted. NS = Not sampled.

Fieldseason Aug Sep Oct Nov Dec Jan F eb Mar Apr May Jun Jul Aver

1993 -1994

NS NS N S 8 (0.030)

53 (0.0789

2 (0.005)

5 (0.0134

0 0 0 0 NS 8.5 (0.016)

1994 -1995

NS NS 0 5 (0.023)

49 (0.0725

34 (0.0399

0 0 0 1 (0.001)

0 0 8.9 (0.014)

1995 -1996

0 1 (0.006)

1 (0.015)

0 10 (0.184)

20 (0.039)

1 (0.002)

0 0 1 (0.005)

0 0 2.8(0.021)

1996 -1997

0 NS 0 0 74 (0.112)

12 (0.022)

0 0 0 0 0 0 7.8(0.012)

1997 -1998

5 (0.015)

6 (0.051)

6 (0.02) 5 (0.031)

49 (0.083)

12 (0.011)

0 0 0 0 0 NS 7.5(0.019)

Table 12. Chipps Island midwater trawl winter run raw catch, catch per cubic meter X’s 10,000 (in parenthesis), andaverage (Aver) catch and CPM3 per year for the 1994 through 1998 fie ld seasons. Peak catch per cubic meter values are highlighted. NS = Not sampled.

Fieldseason Aug Sep Oct N ov D ec Jan F eb M ar Apr May Jun Jul Aver

1993 -1994

N S N S NS 0 0 1 (0.002

2 29 (0.083)

14 1 (0.001)

0 NS 8.0(0.013)

1994 -1995

N S N S 0 0 0 10 (0.011

38 (0.325)

109 (0.437)

151 4 (0.004

0 0 31.2 (0.111)

1995 -1996

0 0 0 0 4 (0.064)

38 (0.065

33 (0.112)

239 (0.595)

39 (0.085

3 (0.001

0 0 29.7(0.077)

1996 -1997

0 N S 0 0 1 (0.009)

11 (0.016

33 (0.081

72 (0.253)

44 (0.129)

2 (0.002

0 0 14.8(0.045)

1997 -1998

0 0 0 0 6 (0.01)

17 (0.026)

4 (0.017

54 (0.217)

29 (0.062

2 (0.002

0 NS 10.2(0.031)

40

Figure 22. Mean catch of salmon smolts per 20 minute tow with Chipps Island midwater trawl in April, May, and June from 1978 through 1998. The water year type is included for each year (W=wet, AN=above normal, BN=below normal, D=dry, and C=critical.

JuneMayApril

0

20

40

60

80

100

120

140

1978 1980 1982 1984 1986 1988 1990 1992 1994 1996 1998

ANBN

AN

D

W

W

W

D

W

D C

DC

C

C

AN

CW

W WW

Mea

n ca

tch

per 2

0 m

inut

e to

w

41

Bay Seine

1997 field season

On January 28, 1997, using a subset of historical seine sites from the 1980's, the office began the BaySeine, to determine if fry were present in the San Francisco Bay. Seining was conducted betweenJanuary and March. Ten seine sites were separated into two seine routes of five sites sampled per week. During the 1997 season, 23 fall/spring run chinook were captured with a fork length range between 35and 64 mm; four in January, 17 in February, and two in March.

1998 field season

In 1998, seining was conducted from January through March. A total of 118 fall/spring were captured,five times the number of chinook captured in 1997. The size range of the 1998 fall/spring was alsogreater than in 1997 (33 - 81 mm).

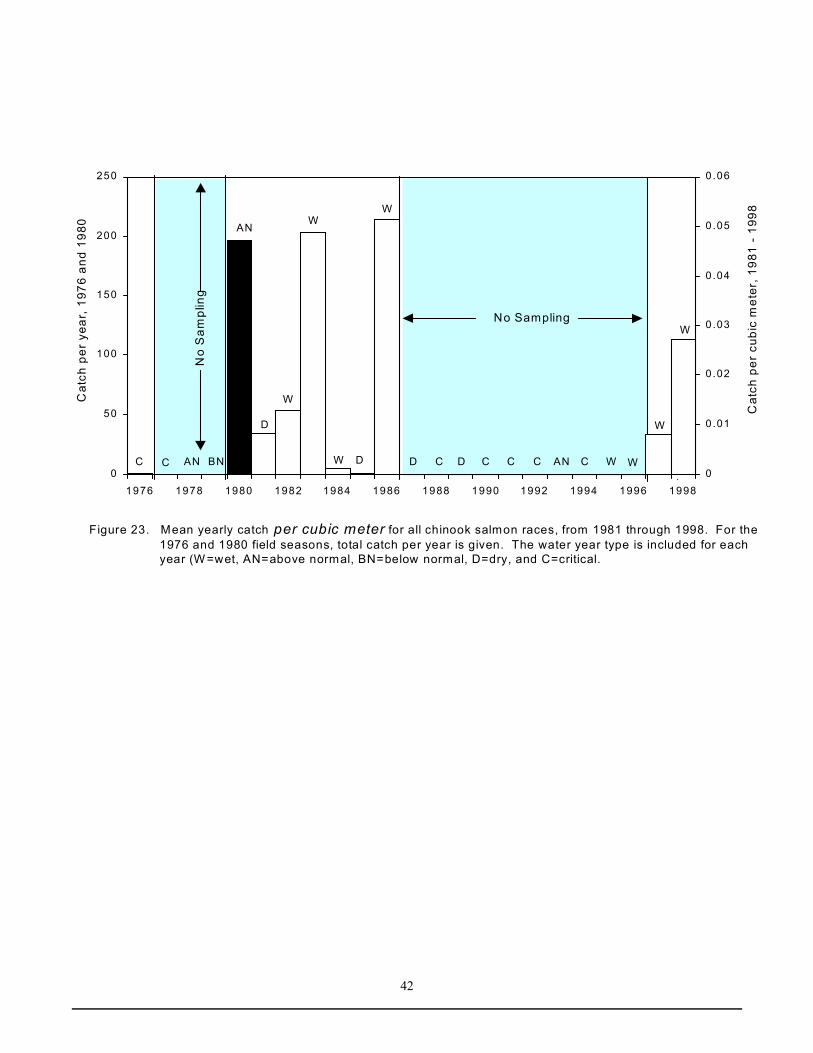
Figure 23 shows catch per year for 1976 and 1980, CPM3 for 1981 through 1998, and the associateddelta outflow. The graph shows some relationship between wet years and use of the bays for rearing. Itis thought that during high flow years more fry are pushed downstream into the bay, and converselyduring lower flow years, fewer fry are found in the bays. The 1976 field season, a critically dry yearproduced one juvenile chinook, while the 1980 season was an above average rainfall year, and 197juveniles were captured. In 1981, CPM3 was low during a dry year. The next two year CPM3 increasedduring wet years, but the third wet year, 1984, produced a lower CPM3 than 1981. Then during thefollowing two years, 1985 and 1986, dry and wet years respectively, the associated CPM3 were low andthen the highest recorded. When the Bay seine restarted in 1997, a wet year, CPM3 was as low as 1981,but 1998, also a wet year a higher CPM3 was recorded.

42

Figure 23. Mean yearly catch per cubic meter for all chinook salmon races, from 1981 through 1998. For the 1976 and 1980 field seasons, total catch per year is given. The water year type is included for each year (W =wet, AN=above normal, BN=below normal, D=dry, and C=critical.

AN BN

AN

D

W

W

W

D

W

D C D C C CANC WW

W

W

Cat

ch p

er y

ear,

197

6 an

d 19

80

No Sampling

No

Sam

plin

g

Cat

ch p

er c

ubic

met

er, 1

981

- 19

98

CC0

50

100

150

200

250

1976 1978 1980 1982 1984 1986 1988 1990 1992 1994 1996 19980

0.01

0.02

0.03

0.04

0.05

0.06

43

Absolute Abundance Estimates

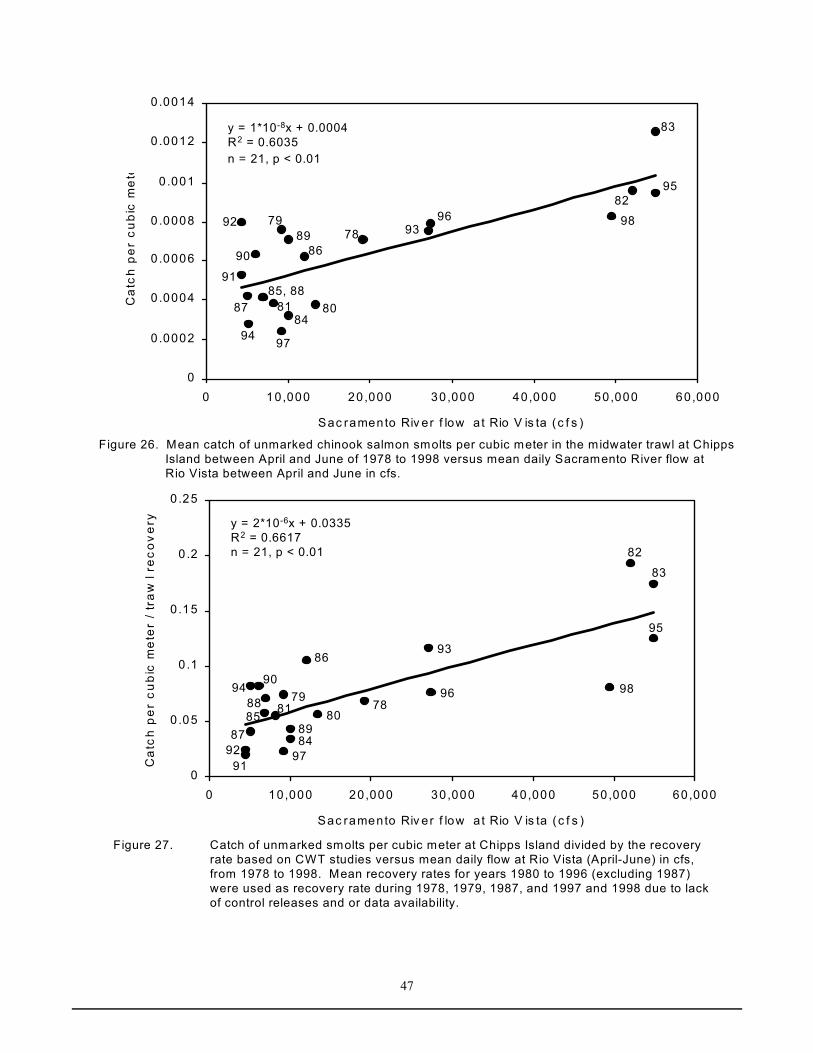
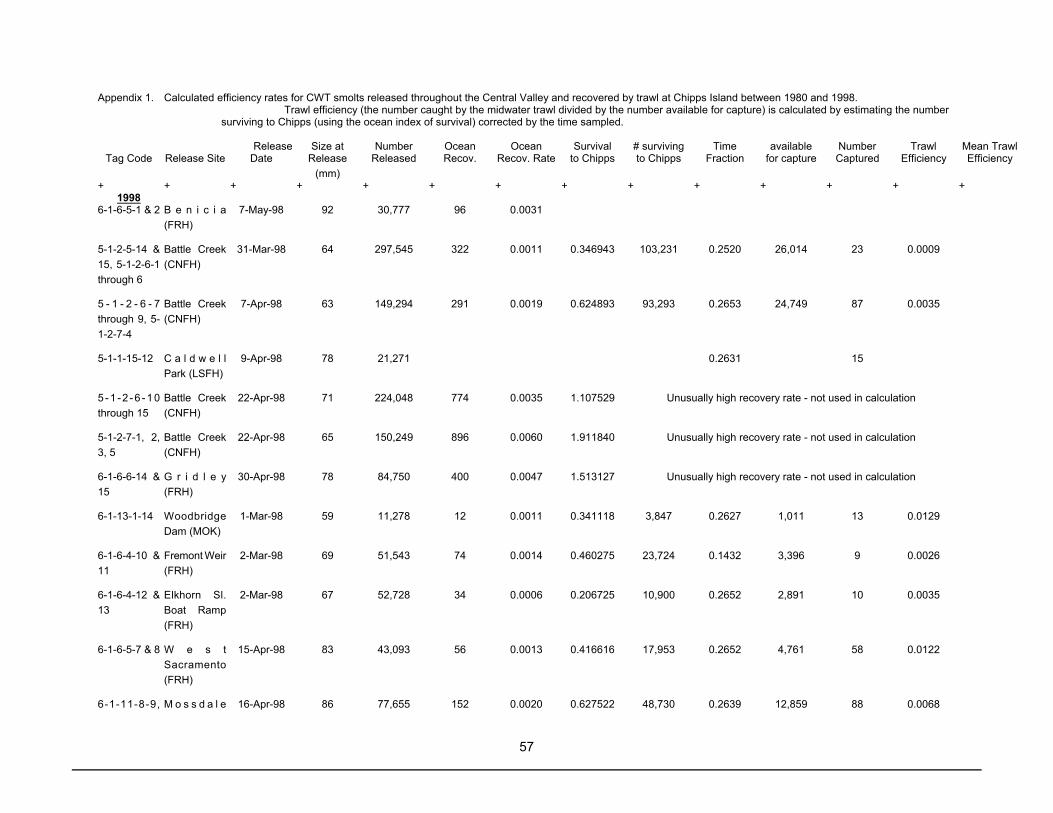
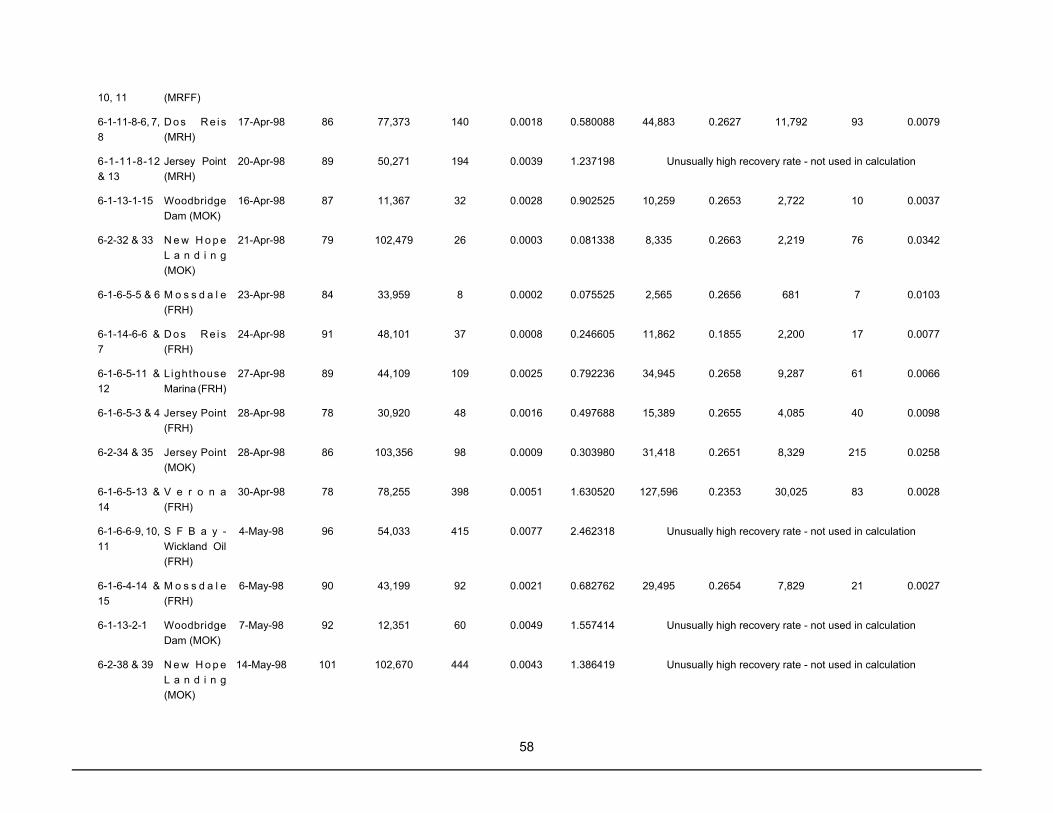
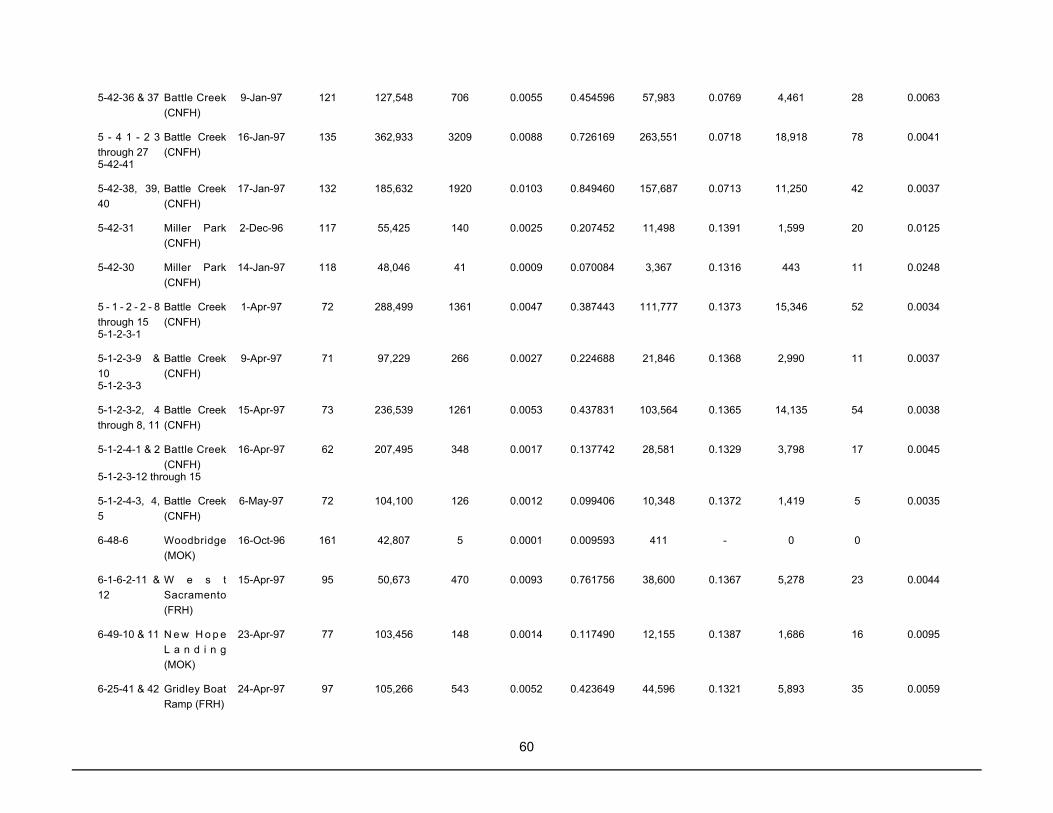
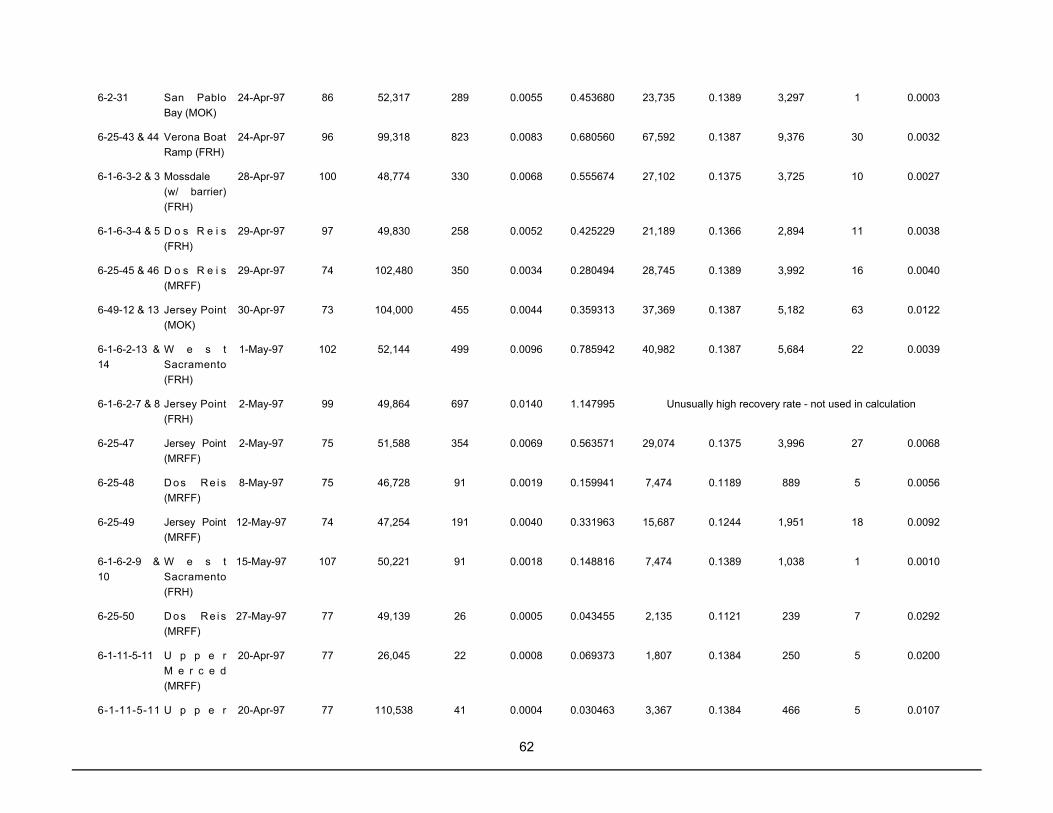
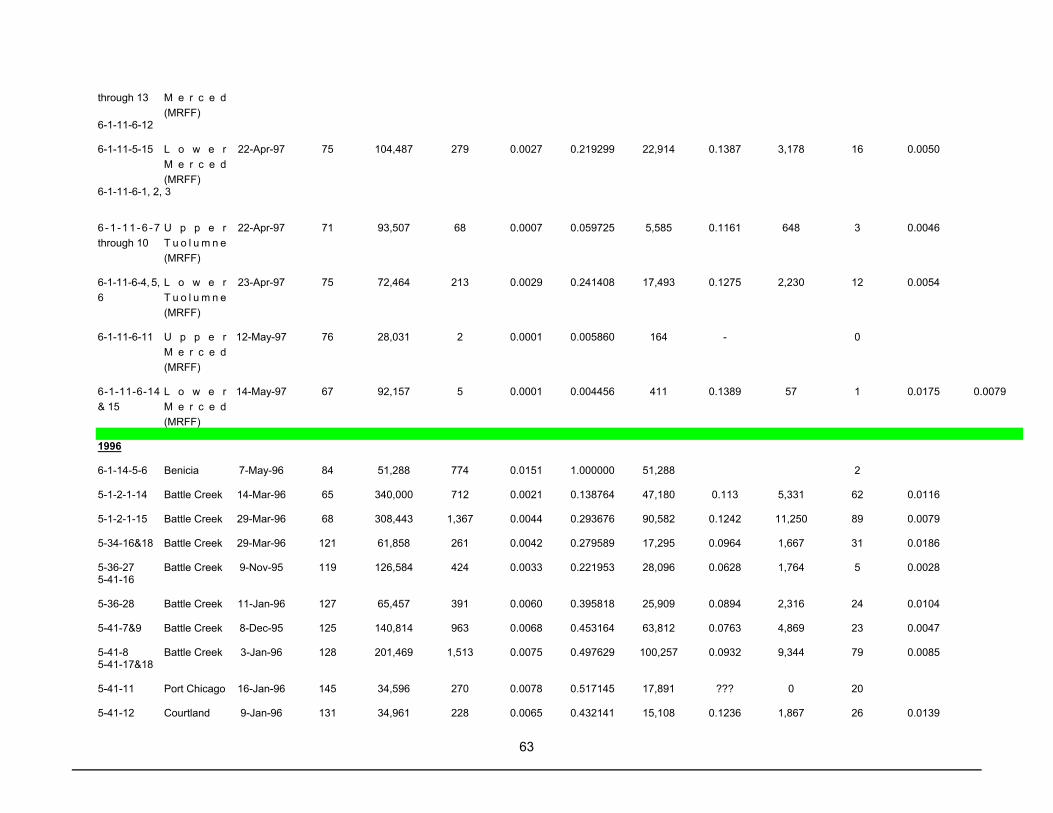
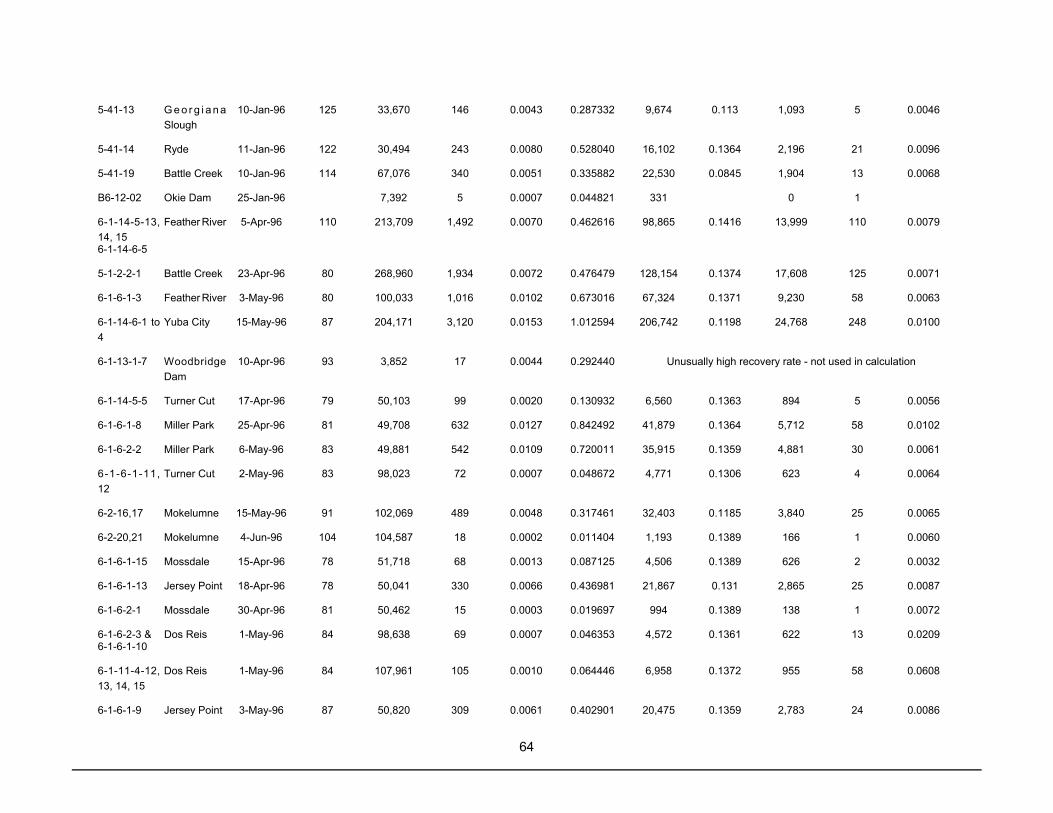
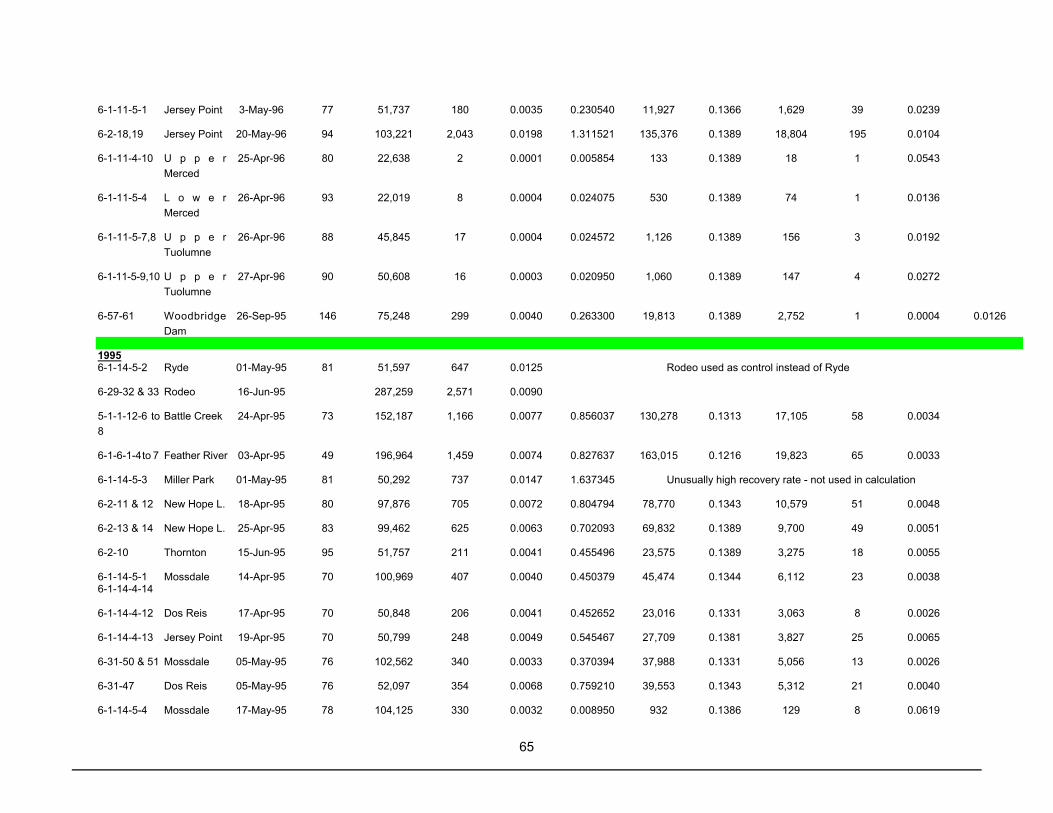
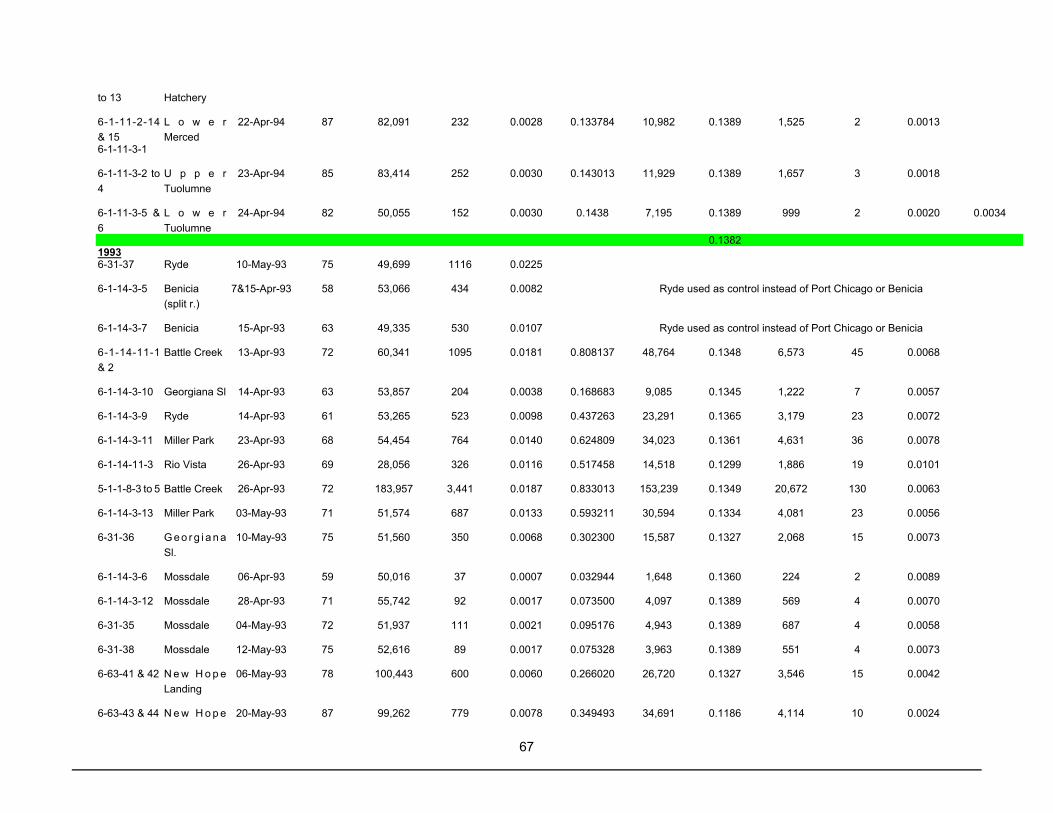
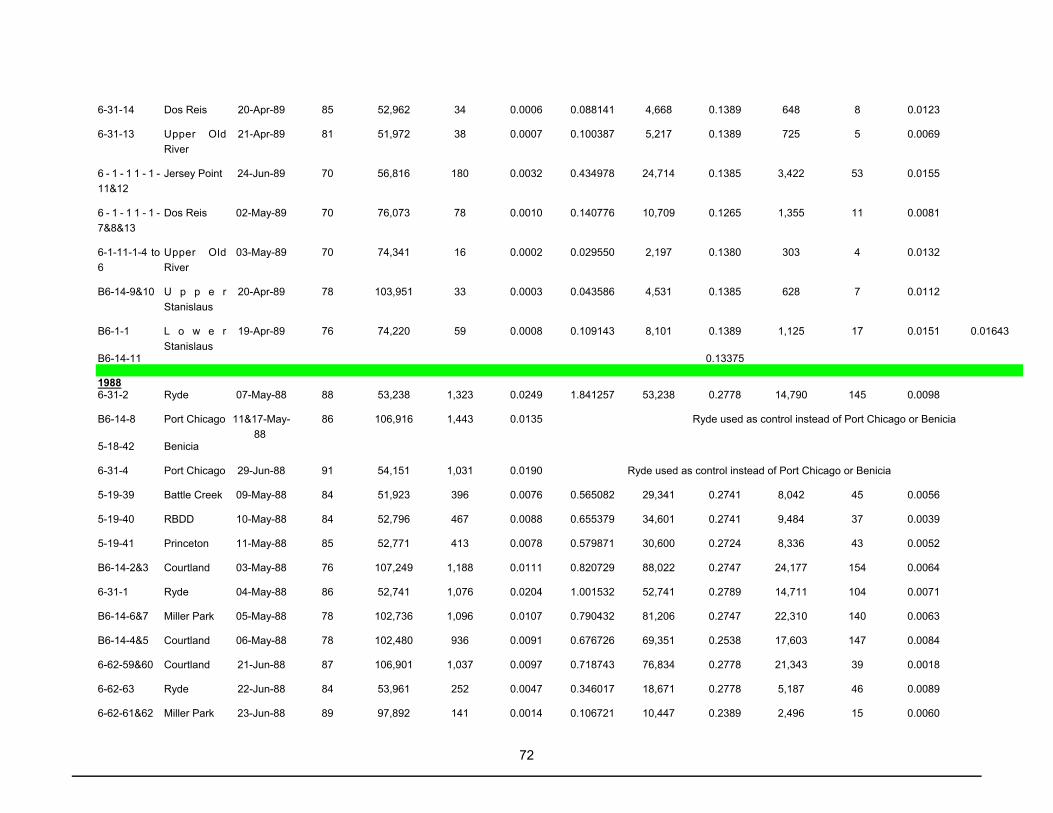
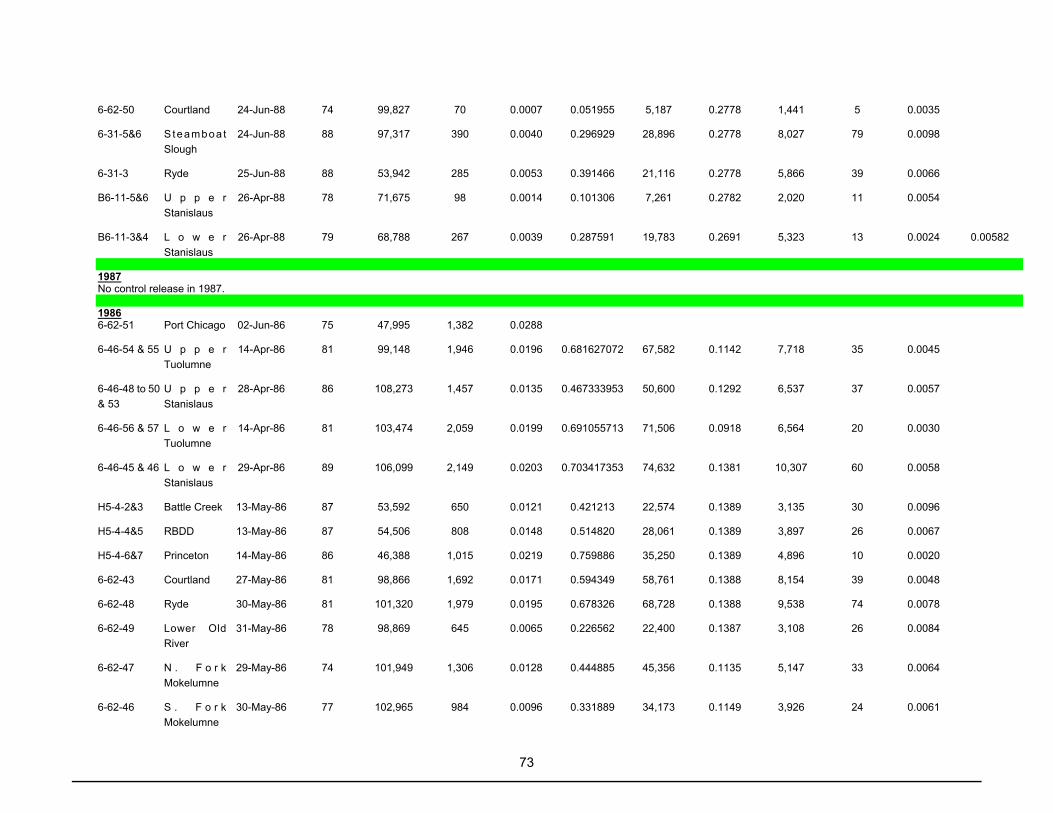
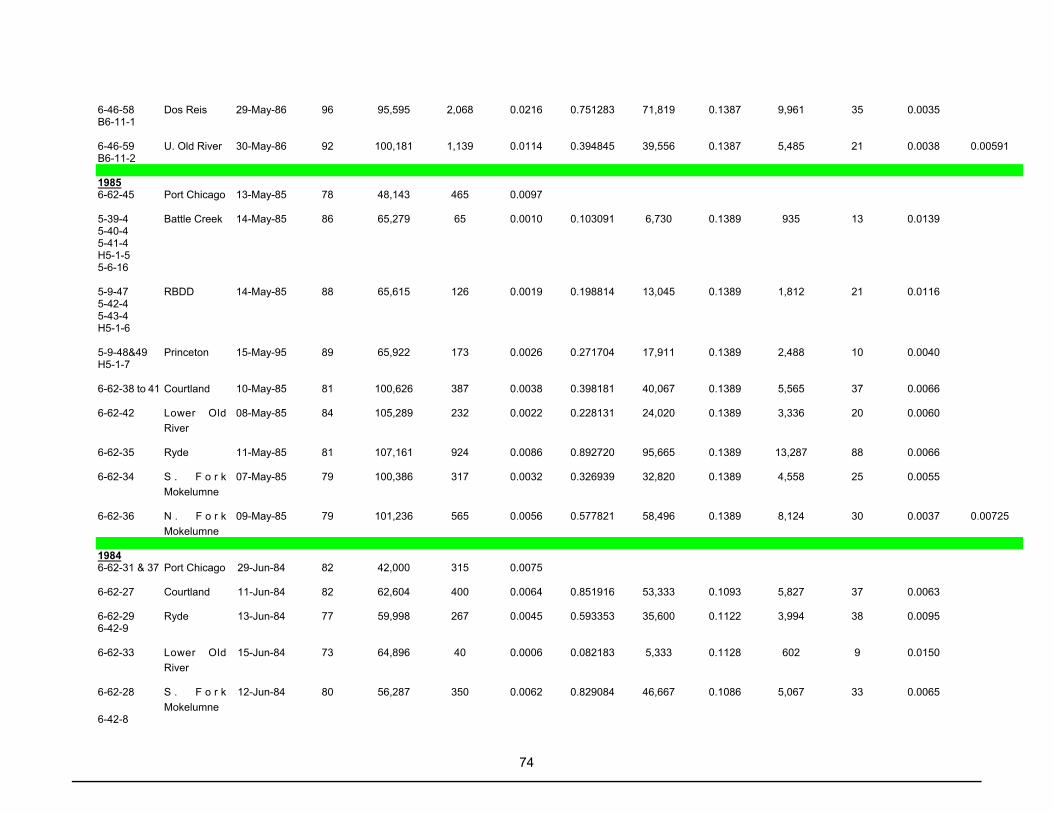
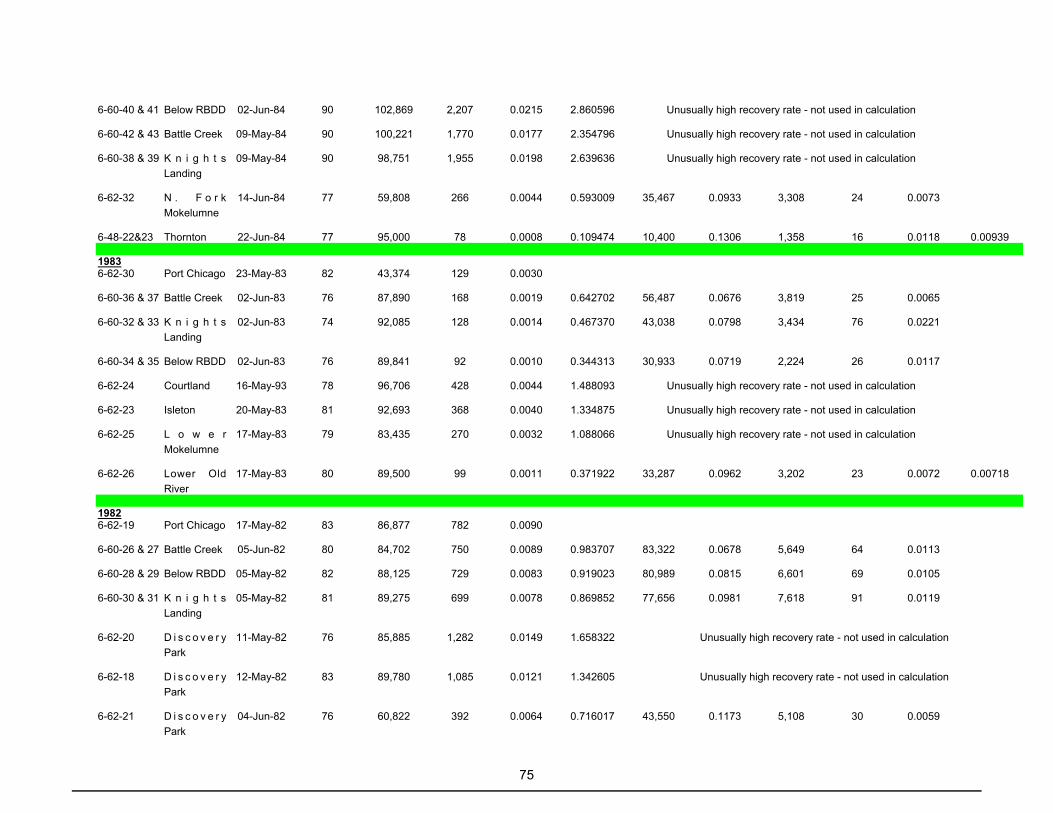
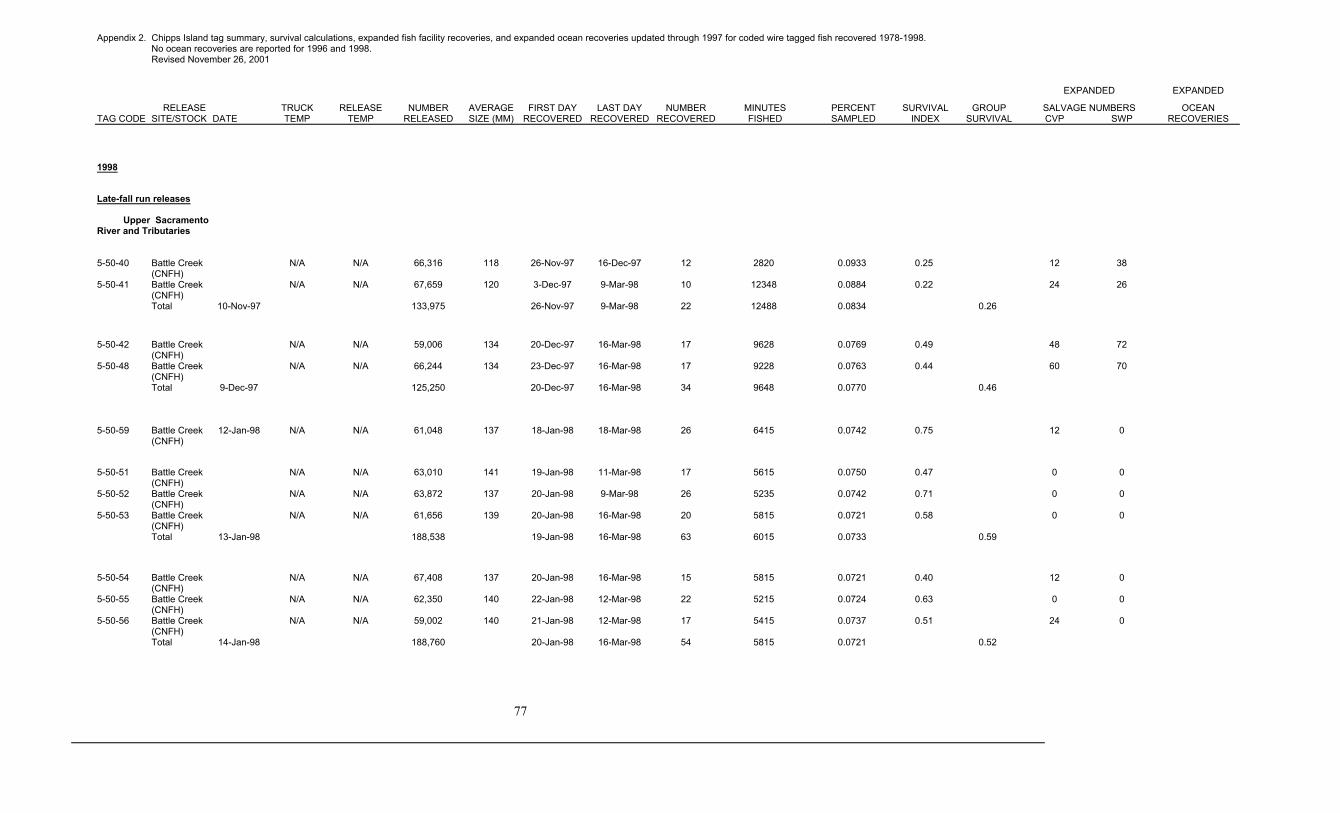
To estimate the absolute abundance of out migrating juveniles in 1997 and 1998, catches were expandedbased on estimates of Chipps Island trawl recovery rates. The trawl recovery rate for each year wascalculated using information from tagged fish recovered at Chipps Island and in the ocean fishery. The yearly mean trawl recovery rate was calculated by averaging trawl recovery rates for each tag groupwithin a year.

The trawl recovery rate at Chipps Island was estimated based on the following formulas:Trawl recovery rate = # captured at Chipps Island/ # available for capture at Chipps Island,adjusted for time,

where the # captured = the number of a particular tag code recovered at Chipps Island, the # available for capture at Chipps Island adjusted for time = (# surviving Chipps

Island)(fraction of time sampled), survival to Chipps Island = recovery rate in the ocean fishery of the upstream

tag group / recovery rate in the ocean fishery of the control group (Benicia, Port Chicago,or Ryde),

the # surviving to Chipps Island = (#surviving to Chipps Island)(# released),the fraction of time sampled = minutes sampled during the recovery period / (total minutes

during the recovery period)(1440 minutes / day),and

the recovery rate in the ocean fishery = expanded # of a of particular tag code recovered in ocean fishery/number released.

If the control groups (Port Chicago or Benicia) had unusually low ocean recovery rates relative to theupstream groups, the resulting trawl recovery estimate would be greater than 1.0. Ryde, approximately25 miles upstream was used as a control group when recovery estimates were greater than 1.0. Meantrawl recovery values between 1980 and 1998 (excluding 1987) ranged between 0.0034 and 0.0329 andaveraged 0.0101 (Figure 24 and Appendix 1). There were no control releases in 1987 thus no estimate of trawl recovery rate was obtained for that year.Groups with survival greater than 1.0 were not used in the calculation of trawl recovery rates becausethey were outside the boundaries of reasonable estimates. Survival values equal to 0.0 were not used aswell, because recovery rates could not be estimated using null values. Although there were manyassumptions associated with these estimates of trawl recovery, they did provide a general assessment oftrawl recovery at Chipps Island.

Because some of the downstream recovery rates compared to the upstream rates for 1998 exceeded 1.0,they were excluded from the mean trawl efficiency.

Juvenile fall\spring run chinook estimates for the season shown in Table 13, consist of fry and smoltcaptures between August 1, and July 31 of the next year. Estimates during 1998 were similar to 1994and 1996, and over twice that of 1997. A reason for the higher estimates during 1998 could be the

44

increased effort over a six week period.

Absolute abundance of fall run for all years was also estimated by expanding the juvenile catch at ChippsIsland using the mean trawl recovery rate. Past expansions using the fraction of time and channel widthsampled using coded wire tagged fish recovered at Chipps Island have estimated survival to be greaterthan 1.0 at times. This may indicate that due to the tidal flux at Chipps Island, the same group of fish wasbeing sampled repeatedly (fish may be moving past Chipps Island more than once due to tidal effect). This would overestimate survival. Sampling was also done during the day which typically yielded highercatches than at night (Wickwire and Stevens, 1966) which would also have biased the survival estimateshigh. It was assumed for expansion that the coded wire tagged smolts passing Chipps Island wereequally distributed in both space (across the channel) and time.

The juvenile winter run estimate was 233,931 caught between December 30, 1996 and May 8, 1997, and156,195 caught between December 4, 1997 and May 2, 1998. The 1997 estimate was consistent withtrends seen in escapement (Figure 1), however, the 1998 estimate was surprisingly low. A reason forthis has not been established.

A total of 86 late-fall yearlings were captured at Chipps Island between August 1996 and January of the1997 field season representing the 1996 brood stock. One 1996 brood year late-fall fry was capturedduring May of the 1996 field season. Combining these two seasons catches yielded an estimatedabundance of 90,606 late-fall for the 1996 brood year. This low estimate correlated well with theunusually low escapement estimate observed at Red Bluff during 1996 (Figure 1).

Appendix 1 shows total catch, fraction of time sampled, and the corresponding abundance estimatesbased on the overall trawl recovery for the years 1980 to 1998 (excluding 1987). It is likely thatefficiencies during the wet years such as 1998 are relatively low due to high outflow. Ocean data infuture years will provide information to evaluate this possibility.

Figure 25 shows yearly abundance estimates at Chipps Island between April 1 and June 30 from 1978through 1998 using the trawl recovery rate for each year. This graph provides a general index of theabsolute production of chinook passing Chipps Island between April and June from 1978 to 1998.

Catch per cubic meter at Chipps Island of smolts between April and June is significantly correlated withmean flow at Rio Vista (cfs) between 1978 and 1998 (Figure 26). This relationship shows that salmonsmolt density increases during higher outflow.

If the mean density of smolts captured between April and June is divided by the trawl recovery rate foreach year and plotted with flow, the relationship is improved (Figure 27), indicating that trawl recoveryrates likely vary between years. Correcting for these differences in recovery rates improves the observedrelationship and validates the use of this methodology.

Table 13. Fall/spring, late-fall, and winter run chinook abundance estimates for 1994 through 1998.

45

Year/race Catch Trawl Recovery Rate Estimated Abundance

1993 - 1994 Fall/spring 5,898 0.0034 14,776,389

1994 - 1995 Fall/spring 19,700 0.0075 22,724,486

1995 - 1996 Fall/spring 17,092 0.0126 15,980,777

1996 - 1997 Fall/spring 3,957 0.0079 7,072,818

1997 - 1998 Fall/spring 33,947 0.0085 17,890,467

1993 - 1994 Winter 47 0.0034 201,613

1994 - 1995 Winter 312 0.0075 623,103

1995 - 1996 Winter 356 0.0106 466,860

1996 - 1997 Winter 163 0.0079 233,931

1997 - 1998 Winter 112 0.0085 156,195

1994 Brood YearLate-fall

0 (fry)88 (yearling)

0.00340.0075

0106,950

1995 Brood YearLate-fall

1 (fry)33 (yearling)

0.00750.0104

989119,673120,662

1996 Brood YearLate-fall

1 (fry)86 (yearling)

0.01060.0103

72689,88090,606

1997 Brood YearLate-fall

0 (fry)83 (yearling)

0.00790.0079

0101,788

1998 Brood YearLate-fall*

0 (fry) 0.0085 0

* This estimate only includes fry captures during the 1998 field season.

46

0

5

1 0

1 5

2 0

2 5

3 0

3 5

4 0

4 5

7 8 7 9 8 0 8 1 8 2 8 3 8 4 8 5 8 6 8 7 8 8 8 9 9 0 9 1 9 2 9 3 9 4 9 5 9 6 9 7 9 8

0

0 .005

0 .01

0 .015

0 .02

0 .025

0 .03

0 .035

19801981

19821983

19841985

19861987

19881989

19901991

19921993

19941995

19961997

1998

0

20000

40000

60000

80000

100000

120000

rec ove ry ra te

flow

Del

ta o

utflo

w (

cfs)

Rec

over

y ra

te

F igure 24. Recovery rate of fall run chinook in the midwater trawl at Chipps Island between 1980 and 1998 with Delta outflow. No control releases were conducted during 1987. The mean rate of recovery between 1980 and 1996 (excluding 1987) was used for 1987.

Sm

olts

in m

illio

ns

F igure 25. Absolute estimates of sm olt abundance at Chipps Island between April 1 and June 30, from 1978 to 1998 using trawl recovery rates calculated from ocean recoveries. (*) = m ean trawl recovery between 1980 and 1996 (excluding 1987).

**

*

47

Figure 26. Mean catch of unmarked chinook salmon smolts per cubic meter in the midwater trawl at Chipps Island between April and June of 1978 to 1998 versus mean daily Sacramento River flow at Rio Vista between April and June in cfs.

0

0 .0002

0.0004

0.0006

0.0008

0.001

0.0012

0.0014

0 10,000 20,000 30,000 40,000 50,000 60,000

Sac ramento Riv er f low at Rio V is ta (c f s )

Cat

ch p

er c

ubic

me

te83

8295

939679

9484

87 80

8689

92

90

91

78

85, 88

y = 1*10-8x + 0.0004R2 = 0.6035n = 21, p < 0.01

98

97

81

79

0

0.05

0.1

0 .15

0.2

0 .25

0 10,000 20,000 30,000 40,000 50,000 60,000

Sac ramento Riv er f low at Rio V is ta (c f s )

Cat

ch p

er

cub

ic m

eter

/ tr

awl r

ec

ove

ry

88

84

8382

95

93

9694

87

81 80

86

89

92

90

91

7885

98

97

Figure 27. Catch of unmarked smolts per cubic meter at Chipps Island divided by the recoveryrate based on CWT studies versus mean daily flow at Rio Vista (April-June) in cfs,from 1978 to 1998. Mean recovery rates for years 1980 to 1996 (excluding 1987)were used as recovery rate during 1978, 1979, 1987, and 1997 and 1998 due to lackof control releases and or data availability.

y = 2*10-6x + 0.0335R2 = 0.6617n = 21, p < 0.01

48

1997 Mark and Recapture Studies

Three separate mark and recapture experiments were conducted in 1997. Recoveries of all markedgroups were made via a mid-water trawl at Chipps Island. Relative survival at Chipps Island wascalculated using the following equation: ×=(#fish recovered / # fish released) * (Fraction of time sampled) * (percent of channel sampled).

Late Fall-Run Experiments (Delta Action 8)

Two groups of Coleman NFH late-fall chinook (Table 1) were released on December 2 and January 14 atMiller Park on the Sacramento River with a third group released December 30 at Benicia as a control.The delta cross channel gates were closed throughout these experiments. The study was intended toevaluate survival over two different Export/Inflow (E/I) ratios, 50-65% in December and a 35% E/I ratio inJanuary. Unregulated flows from storm runoff resulted in lower E/I ratios than were originally planned. Actual E/I ratio varied from date of release to date of last catch of marked salmon from 5% to 49% (avg.20%) for the December 2 release and from 0% to 2% (avg. 0.06%) for the January 14 release.

Table 1. Survival indices and expanded SWP and CVP salvage numbers for late fall run releases madein the Sacramento / San Joaquin River Delta in 1997.

ReleaseDate

Release Site NumberReleased

Average FLof Fish(mm)

TruckTemp. (°F)

RiverTemp. (°F)

SurvivalIndex

ExpandedSWP

Salvage

ExpandedCVP

Salvage

% ofReleaseSalvaged

12/02/96 Miller Park 55,425 117 52 54 0.34 6 0 0.01%12/30/96 Benicia 51,049 118 56 57 N/A 0 0 0.0%01/14/97 Miller Park 48,046 118 41 45 0.23 0 0 0.0%

Sacramento River Fall-Run Survival Index

In 1997 three sets of CWT fish from Feather River Fish Hatchery were released from the Broderick boatramp in West Sacramento (Table 2) to estimate survival over the peak period of outmigration of naturalfall run chinook salmon. One control group was released at Port Chicago (Concord Naval WeaponsStation). Previous releases were made at Miller Park in Sacramento but ramp construction prompted achange to the West Sacramento Broderick boat ramp in 1997. The Broderick releases occurred on April15, May 1 and May 15, and the control group was released May 5. Table 2. Survival indices and expanded SWP and CVP salvage numbers for fall run releases made in

the Sacramento / San Joaquin River Delta in 1997.

ReleaseDate

ReleaseSite

NumberReleased

Average FLof Fish(mm)

TruckTemp. (°F)

RiverTemp. (°F)

SurvivalIndex

ExpandedSWP

Salvage

ExpandedCVP

Salvage

% ofReleaseSalvaged

04/15/97 WestSacramento

50,673 95 48 63 0.43 0 0 0.0%

05/01/97 WestSacramento

52,144 102 48 63 0.40 0 0 0.0%

05/05/97 PortChicago

48,488 99 58 64 N/A 0 0 0.0%

05/15/97 WestSacramento

50,221 107 52 72 0.02 0 0 0.0%

In previous wet years survival indices ranged between 0.58 and 1.11 compared with 1997 indices ofbetween 0.02 and 0.43. It is important to note in Table 3 the large difference between truck temperature

49

and river temperature. Even though one expects higher survival in wet years, the 15 to 20 degreetemperature difference helps to explain the lower survival indices in 1997 (Table 3).

Table 3. Historical releases at Miller Park (Sacramento) 1988-1996 and Broderick Boat Ramp (West Sacramento) 1997-1998, water year type, truck water and river water temperature at release, temperature difference and survival index. Prior to 1998 temperatures were measured in °F,for 1998 temperatures were measured in °C and a conversion to °F is provided.

Release Date Water Year Type TruckTemperature °F

unless noted

RiverTemperature

°F unless noted

TemperatureDifference

°F unless noted

Survival Index

05/05/88 critical 54 62 +8 0.6506/23/88 critical 55 74 +19 0.0806/01/89 dry 51 67 +16 0.1606/14/89 dry 58 70 +12 0.2005/07/90 critical 56 70 +14 1.0604/25/91 critical 54 62 +8 0.7804/29/91 critical 59 62 +3 0.4904/23/93 above normal 53 61 +8 0.6305/03/93 above normal 56 62 +6 0.4305/21/93 above normal 51 65 +14 0.3505/28/93 above normal 55 64 +9 0.7505/03/94 critical 52 67 +15 0.0705/24/94 critical 49 71 +22 0.0005/01/95 wet 59.5 58.5 -1 0.6304/25/96 wet 48 57 +9 1.1105/06/96 wet 48 65 +7 0.5804/15/97 wet 48 63 +15 0.4305/01/97 wet 48 63 +15 0.4005/15/97 wet 52 72 +20 0.0204/15/98 wet 10°C (50°F) 13°C (55.4°F) +3°C (+5.4°F) 0.6604/27/98 wet 15°C (59°F) 16°C (60.8°F) +1°C (+1.8°F) 0.6705/15/98 wet 12°C (53.6°F) 14°C (57.2°F) +2°C (+3.6°F) 0.93

VAMP Releases

The 1997 Vernalis Adaptive Management Plan (VAMP) study involved releases of CWT chinook at threelocations along the San Joaquin River, Mossdale, Dos Reis, and Jersey Point. Tagged chinook salmonwere released to evaluate flow and export conditions, as set by the VAMP agreement and the placementof a temporary barrier at the head of Old River. Releases occurred April 28 and 29 at Mossdale and DosReis respectively with releases following May 2 at Jersey Point, May 8 at Dos Reis, May 12 at JerseyPoint. A final release was made May 27 at Dos Reis after the VAMP period had ended. Flows for tendays after release averaged between 4,529 to 5,962 cubic feet per second (cfs), and average exportsvaried from 2,082 to 2,591 cfs. Post VAMP flows averaged 3,302 cfs with exports averaging 6,786 cfs. For 1997, both Merced River Fish Hatchery and Feather River Fish Hatchery fish were released at DosReis on April 29 and at Jersey Point on May 2 in order to evaluate potential differences in survival of thestocks. It appeared that Feather River stock survived at a higher rate than Merced River stock but thismay be due in part to the comparatively larger size of the Feather River stock. It also appeared thatinstallation of the temporary barrier at Head of Old River increased survival from past years when nobarrier was present. For full write up and analysis on the VAMP results see (Brandes and Pierce 1998).Table 4. Survival indices and expanded SWP and CVP salvage numbers for fall run releases made inthe Sacramento / San Joaquin River Delta in 1997.

50

ReleaseDate

ReleaseSite

NumberReleased

Average FLof Fish(mm)

TruckTemp. (°F)

RiverTemp. (°F)

SurvivalIndex

ExpandedSWP

Salvage

ExpandedCVP

Salvage

% ofReleaseSalvaged

04/28/97 Mossdale 48,774 100 50 60 0.19 34 192 0.46%04/29/97 Dos Reis 102,480 74 56 60 0.15 130 264 0.38%04/29/97 Dos Reis * 49,830 97 51 60 0.19 29 96 0.25%05/02/97 Jersey

Point51,588 75 55 64 0.50 12 12 0.05%

05/02/97 JerseyPoint *

49,864 99 48 63 1.03 0 0 0.0%

05/08/97 Dos Reis 46,728 75 57 66 0.12 54 24 0.17%05/12/97 Jersey

Point47,254 74 58 67 0.40 2 12 0.03%

05/27/97 Dos Reis 49,139 77 55 68 0.17 36 312 0.71%* Feather River Fish Hatchery stock, note the difference in size between FRFH and MRFH

51

1998 Mark and Recapture Studies

Three separate experiments were conducted in 1998. Survival indices are based on recoveries of eachmarked group with a mid-water trawl net at Chipps Island.

Late Fall Experiments (Delta Action 8)

Five groups of Coleman NFH late-fall chinook were released as two paired releases and one controlgroup. The first paired release occurred on December 4 and 5 at Georgiana Slough and Ryde. Thecontrol group was released December 29 and the final pair was released January 13 and 14, 1998. These releases are meant to show differences in survival between mainstem Sacramento River (Ryde)and the interior delta (Georgiana Slough). Table 5 shows release dates, locations and survival indexcalculated by using recovery numbers from Chipps Island. The second set of releases shows a highersurvival index than the first pair coinciding with a lower average E/I ratio for the period from release todate of last capture.

Table 5. Survival indices and expanded SWP and CVP salvage numbers for late fall run releases madein the Sacramento / San Joaquin River Delta in 1997.

ReleaseDate

Release Site NumberReleased

Average FLof Fish(mm)

TruckTemp.(°C)*

RiverTemp.(°C)*

SurvivalIndex

ExpandedSWP

Salvage

ExpandedCVP

Salvage

% ofReleaseSalvaged

12/04/97 GeorgianaSlough

61,276 127 12 11 0.03 101 52 0.25%

12/05/97 Ryde 46,756 123 12 11 0.67 18 8 0.06%12/29/97 Port

Chicago48,080 127 11 9 N/A 0 0 0.0%

01/13/98 GeorgianaSlough

66,893 140 11 10 0.26 0 24 0.04%

01/14/98 Ryde 49,059 142 10 10 0.94 0 0 0.0%* 1998 marks the first year that Celsius scale is usedThe export inflow (E/I) ratio varied from date of release to date of last catch of marked salmon from 2% to 63% (avg 30%) for theDecember 4-5 releases and from 1% to 18% (avg 4%) for the January 13-14 releases.

Sacramento River Fall Survival Index

In 1998 two sets of experimental fish were released from the Broderick boat ramp in West Sacramento,and one control group was released at Benicia. All releases were made with Feather River Fish Hatcheryfish, (Table 6). This experiment is an ongoing annual index of survival of Sacramento River fall run. Thereleases are spaced apart in an attempt to approximate survival over the period of peak naturaloutmigration. In wet years such as 1998 survival is expected to be higher than in dry or critical years,Table 3 shows higher survival indices over dry years and similar numbers for wet years with lowdifferences truck and river temperatures. Figure 1 shows the strong relationship between rivertemperature and survival to Chipps Island. As river temperature increases, survival decreases (r2=0.40,p=0.0016). The Miller Park release in 1990 was an outlier (indicated in figure) however, when the datapoint was removed the relationship did not change significantly.

52

Table 6. Survival indices and expanded SWP and CVP salvage numbers for fall run releases made inthe Sacramento / San Joaquin River Delta in 1997.

ReleaseDate

ReleaseSite

NumberReleased

Average FLof Fish(mm)

TruckTemp.(°C)*

RiverTemp.(°C)*

SurvivalIndex

ExpandedSWP

Salvage

ExpandedCVP

Salvage

% ofReleaseSalvaged

04/15/98 WestSacramento

21,402 83 10 13 0.73 0 0 0.0%

WestSacramento

21,691 83 10 13 0.59 0 0 0.0%

Group 43,093 0.66 0 0 0.0%05/07/98 Benicia 30,777 92 11 18 N/A 0 0 0.0%05/15/98 West

Sacramento17,940 99 12 14 1.01 0 0 0.0%

WestSacramento

16,600 99 12 14 0.86 0 0 0.0%

Group 34,540 0.93 0 0 0.0%* 1998 marks the first year that degree Celsius is used

VAMP Releases

The Vernalis Adaptive Management (VAMP) study is meant to evaluate the survival of CWT salmonsmolts with the head of Old River barrier (HORB) in place. In 1998 flows on the San Joaquin River weretoo high to allow the installation of the HORB, so south delta survival was measured without the barrier. The first set of release (Table 7) show very high survival and little difference between Dos Reis andMossdale release survival. This may be explained by the extremely high flows which allow a smallerpercentage of water and fish to be diverted into Old River along with the possibility of increased survivalof the fish that are diverted from the San Joaquin River. The second set of releases included a groupreleased at Lighthouse Marina on the Mokelumne River this release was used as a downstream controlgroup for the trawling done at Jersey Point. The second release showed markedly lower survival underslightly changed but still favorable hydrologic conditions. These lowered survival indices may be partlyexplained by an outbreak of Infectious Hematopoietic Necrosis (IHN) at the Feather River hatchery whichled to higher than usual mortality for these groups at the hatchery. For full write up and analysis on theVAMP results see Pierce and Brandes, 1999. Flows for both sets of experiments were high averaging22,000 cfs for the first set and 18,500 cfs for the second set. Combined exports averaged 1,500 cfs forthe first set and 1,800 cfs for the second set.

53

Table 7. Survival indices and expanded SWP and CVP salvage numbers for fall run releases made inthe Sacramento / San Joaquin River Delta in 1998. Note that the first set of releases weremade with Merced River stock and the second set of releases were made with FeatherRiver stock.

ReleaseDate

ReleaseSite

NumberReleased

Average FLof Fish(mm)

TruckTemp.(°C)

RiverTemp.(°C)

SurvivalIndex

ExpandedSWP

Salvage

ExpandedCVP

Salvage

% ofReleaseSalvaged

04/16/98 Mossdale 26,465 86 12 14 0.47 0 12 0.05%Mossdale 25,264 86 12 14 0.60 0 24 0.09%Mossdale 25,926 86 12 14 0.61 0 12 0.05%

Group 77,655 0.56 0 48 0.06%04/17/98 Dos Reis 26,215 86 12 15 0.65 0 0 0.0%

Dos Reis 26,366 86 12 15 0.47 0 0 0.0%Dos Reis 24,792 86 12 15 0.67 0 0 0.0%

Group 77,373 0.59 0 0 0.0%04/20/98 Jersey

Point24,598 89 15 17 0 0 0.0%

JerseyPoint

25,673 89 15 17 0 0 0.0%

Group 50,271 1.84 0 0 0.0%04/23/98 Mossdale 15,553 84 12 19 0.06 0 72 0.46%

Mossdale 18,400 84 12 19 0.13 0 120 0.65%Group 33,959 0.10 0 192 0.57%

04/24/98 Dos Reis 23,849 91 13 19 0.16 0 0 0.0%Dos Reis 24,252 91 13 19 .019 0 0 0.0%

Group 48,101 0.13 0 0 0.0%04/27/98 Lighthouse

Marina21,288 89 15 16 0.78 0 0 0.0%

LighthouseMarina

22,821 89 15 16 0.58 0 0 0.0%

Group 44,109 0.67 0 0 0.0%04/28/98 Jersey

Point15,139 78 15 19 0.46 0 0 0.0%

JerseyPoint

16,141 78 15 19 0.79 0 0 0.0%

Group 31,280 0.93 0 0 0.0%05/06/98 Mossdale 21,600 90 11 18 0.34 0 372 1.72%

Mossdale 21,599 90 11 18 0.13 0 252 1.16%Group 43,199 0.24 0 624 1.44%

54

Figure 1. Survival and temperature relationships for Sacramento area salmon releases from 1988through 1998.

Miller Park / West Sacramento Releases

y = -0.0427x + 3.2372r2 = 0.4446

p = 0.000736

0

0.2

0.4

0.6

0.8

1

1.2

55 57 59 61 63 65 67 69 71 73 75

River Temperature (F)

Surv

ival

Inde

x

1990

55

References

Brandes, P.L., Pierce,M. 1998. 1997 Salmon Smolt Survival Studies in the South Delta. I.E.P.Newsletter. 11:1.

Brandes, P.L., Pierce,M. 1999. 1997 Salmon Smolt Survival Studies in the South Delta. I.E.P.Newsletter. 11:1.

Dauble, D.D., Page, T.L., Hanf, W.R. Jr. 1989. Spatial Distribution of Juvenile Salmonids in the HanfordReach, Columbia River. Fishery Bulletin. 87:4.

Healy, M.C. 1991. Life history of chinook salmon (Oncorhynchus tshawytscha). P 311- 394. In: Groot, C., and L. Margolis (eds.). Pacific Salmon Life Histories. UBC Press, Vancouver.

Fisher, F.W. 1994. Past and present status of Central Valley chinook salmon. Conservation. Biol. 8(3): 870-873.

Knowles, N., Cayan, D., Uncles, R., Ingram, L., and Peterson, D. 1997. Diagnosing the flood of 1997 in San Francisco Bay with observations and model results. Interagency Ecological Program Newsletter. 10(3): 28-31.

Knowles, N., Cayan, D.R., Peterson, D.H., and Uncles, R.J. 1998. Simulated effects of Delta outflow on the Bay - 1998 compared to other years. Interagency Ecological Program Newsletter. 10(3): 28-31.

United States Fish and Wildlife Service. 1981. Distribution and food habits of juvenile salmonids in the Duwamish Estuary, Washington 1980. USFWS Fisheries Assistance Office OlympiaWashington.

Reimers, P. E. 1968. Social behavior among juvenile fall chinook salmon. Journal of Fisheries Research Board of Canada. 25: 2005-2008.

Slater, D.W. 1963. Winter-run chinook salmon in the Sacramento River, California with notes onwater temperature requirements for spawning. U.S. Fish and Wildlife Special Science Report461. Washington D.C.

Thomas et al. 1969. Effect of yolk sac absorption on the swimming ability of fall chinook salmon. Trans. Amer. Fish. Soc. 3:406-410.

United States Fish and Wildlife Service, 1993. Annual progress report “Abundance and survival of juvenile chinook salmon in the Sacramento-San Joaquin Estuary”.

United States Fish and Wildlife Service, 1994. Annual progress report “Abundance and survival of juvenile chinook salmon in the Sacramento-San Joaquin Estuary”.

56

United States Fish and Wildlife Service, 1995. Annual progress report “Abundance and survival of juvenile chinook salmon in the Sacramento-San Joaquin Estuary”.

United States Fish and Wildlife Service, 1995. “Working Paper on Restoration Needs. HabitatRestoration Actions to Double Natural Production of Anadromous Fish in the Central Valley ofCalifornia”. Volume 2.

United States Geological Survey, 1997. Water Resources data -- California water year 1996, Volume 4, Northern Central Valley basins and the Great Basin from Honey Lake Basin to Oregon StateLine. Sacramento, CA.

United States Fish and Wildlife Service. 1987. Exhibit 31: The needs of chinook salmon, Oncorhynchus tshawytscha in the Sacramento-San Joaquin Estuary.

United States Geological Survey. 1995. California Data Exchange Center.

Wickwire, R.H., Stevens, D.E. 1966. Migration and distribution of young king salmon, Oncorhynchus tshawytscha, in the Sacramento River near Collinsville. Anadromous Fisheries BranchAdministrative Report No. 71-4. California Department of Fish and Game.

Personal Communications

Colleen Harvey, California Department of Fish and Game, Red Bluff.

57

Appendix 1. Calculated efficiency rates for CWT smolts released throughout the Central Valley and recovered by trawl at Chipps Island between 1980 and 1998.Trawl efficiency (the number caught by the midwater trawl divided by the number available for capture) is calculated by estimating the number

surviving to Chipps (using the ocean index of survival) corrected by the time sampled.

Release Size at Number Ocean Ocean Survival # surviving Time available Number Trawl Mean TrawlTag Code Release Site Date Release

(mm)Released Recov. Recov. Rate to Chipps to Chipps Fraction for capture Captured Efficiency Efficiency

+ + + + + + + + + + + + + +1998

6-1-6-5-1 & 2 B e n i c i a(FRH)

7-May-98 92 30,777 96 0.0031

5-1-2-5-14 &15, 5-1-2-6-1through 6

Battle Creek(CNFH)

31-Mar-98 64 297,545 322 0.0011 0.346943 103,231 0.2520 26,014 23 0.0009

5 - 1 - 2 - 6 - 7through 9, 5-1-2-7-4

Battle Creek(CNFH)

7-Apr-98 63 149,294 291 0.0019 0.624893 93,293 0.2653 24,749 87 0.0035

5-1-1-15-12 C a l d w e l lPark (LSFH)

9-Apr-98 78 21,271 0.2631 15

5 -1 -2 -6 -10through 15

Battle Creek(CNFH)

22-Apr-98 71 224,048 774 0.0035 1.107529 Unusually high recovery rate - not used in calculation

5-1-2-7-1, 2,3, 5

Battle Creek(CNFH)

22-Apr-98 65 150,249 896 0.0060 1.911840 Unusually high recovery rate - not used in calculation

6-1-6-6-14 &15

G r i d l e y(FRH)

30-Apr-98 78 84,750 400 0.0047 1.513127 Unusually high recovery rate - not used in calculation

6-1-13-1-14 WoodbridgeDam (MOK)

1-Mar-98 59 11,278 12 0.0011 0.341118 3,847 0.2627 1,011 13 0.0129

6-1-6-4-10 &11

Fremont Weir(FRH)

2-Mar-98 69 51,543 74 0.0014 0.460275 23,724 0.1432 3,396 9 0.0026

6-1-6-4-12 &13

Elkhorn Sl.Boat Ramp(FRH)

2-Mar-98 67 52,728 34 0.0006 0.206725 10,900 0.2652 2,891 10 0.0035

6-1-6-5-7 & 8 W e s tSacramento(FRH)

15-Apr-98 83 43,093 56 0.0013 0.416616 17,953 0.2652 4,761 58 0.0122

6-1-11-8-9, M o s s d a l e 16-Apr-98 86 77,655 152 0.0020 0.627522 48,730 0.2639 12,859 88 0.0068

58

10, 11 (MRFF)

6-1-11-8-6, 7,8

Dos R e i s(MRH)

17-Apr-98 86 77,373 140 0.0018 0.580088 44,883 0.2627 11,792 93 0.0079

6-1-11-8-12& 13

Jersey Point(MRH)

20-Apr-98 89 50,271 194 0.0039 1.237198 Unusually high recovery rate - not used in calculation

6-1-13-1-15 WoodbridgeDam (MOK)

16-Apr-98 87 11,367 32 0.0028 0.902525 10,259 0.2653 2,722 10 0.0037

6-2-32 & 33 N e w H o p eL a n d i n g(MOK)

21-Apr-98 79 102,479 26 0.0003 0.081338 8,335 0.2663 2,219 76 0.0342

6-1-6-5-5 & 6 M o s s d a l e(FRH)

23-Apr-98 84 33,959 8 0.0002 0.075525 2,565 0.2656 681 7 0.0103

6-1-14-6-6 &7

D os Re i s(FRH)

24-Apr-98 91 48,101 37 0.0008 0.246605 11,862 0.1855 2,200 17 0.0077

6-1-6-5-11 &12

LighthouseMarina (FRH)

27-Apr-98 89 44,109 109 0.0025 0.792236 34,945 0.2658 9,287 61 0.0066

6-1-6-5-3 & 4 Jersey Point(FRH)

28-Apr-98 78 30,920 48 0.0016 0.497688 15,389 0.2655 4,085 40 0.0098

6-2-34 & 35 Jersey Point(MOK)

28-Apr-98 86 103,356 98 0.0009 0.303980 31,418 0.2651 8,329 215 0.0258

6-1-6-5-13 &14

V e r o n a(FRH)

30-Apr-98 78 78,255 398 0.0051 1.630520 127,596 0.2353 30,025 83 0.0028

6-1-6-6-9, 10,11

S F B a y -Wickland Oil(FRH)

4-May-98 96 54,033 415 0.0077 2.462318 Unusually high recovery rate - not used in calculation

6-1-6-4-14 &15

M o s s d a l e(FRH)

6-May-98 90 43,199 92 0.0021 0.682762 29,495 0.2654 7,829 21 0.0027

6-1-13-2-1 WoodbridgeDam (MOK)

7-May-98 92 12,351 60 0.0049 1.557414 Unusually high recovery rate - not used in calculation

6-2-38 & 39 N e w H o p eL a n d i n g(MOK)

14-May-98 101 102,670 444 0.0043 1.386419 Unusually high recovery rate - not used in calculation

59

6-1-6-5-9 &10

W e s tSacramento(FRH)

15-May-98 99 34,540 223 0.0065 2.069844 Unusually high recovery rate - not used in calculation

6-1-13-2-2 WoodbridgeDam (MOK)

20-May-98 97 10,414 43 0.0041 1.323750 Unusually high recovery rate - not used in calculation

6-25-20, 24 U p p e rM e r c e d(MRFF)

12-Apr-98 83 100,062 515 0.0051 1.650035 Unusually high recovery rate - not used in calculation

6-45-23

6-25-21, 22,23

L o w e rM e r c e d(MRFF)

14-Apr-98 85 74,109 115 0.0016 0.497487 36,868 0.2667 9,832 41 0.0042

6-1 -11 -7 -3through 6

U p p e rT u o l u m n e(MRFF)

15-Apr-98 83 94,058 313 0.0033 1.066851 Unusually high recovery rate - not used in calculation

6-1-11-7-7 Downstreamof Tuol. R.(MRFF)

16-Apr-98 86 25,754 44 0.0017 0.547726 14,106 0.2632 3,713 18 0.0048

6-1-11-7-8 Downstreamof Tuol. R.(MRFF)

17-Apr-98 83 22,006 41 0.0019 0.597307 13,144 0.2654 3,488 20 0.0057

6 -1 -11 -7 -9through 12

U p p e rM e r c e d(MRH)

3-May-98 85 103,996 348 0.0033 1.072797 Unusually high recovery rate - not used in calculation

6-1-11-5-2 &13

L o w e rM e r c e d(MRH)

5-May-98 89 75,187 206 0.0027 0.878374 66,042 0.2673 17,651 34 0.0019 0.0085

19976-1-6-3-1 Port Chicago

(FRH)5-May-97 99 48,538 591 0.0122

6-1-6-2-15

5-42-32 & 33 Battle Creek(CNFH)

7-Nov-96 108 127,460 152 0.0012 0.097941 12,484 0.0802 1,001 20 0.0200

5-42-34 & 35 Battle Creek(CNFH)

10-Dec-96 132 123,015 1008 0.0082 0.672972 82,786 0.0738 6,112 35 0.0057

60

5-42-36 & 37 Battle Creek(CNFH)

9-Jan-97 121 127,548 706 0.0055 0.454596 57,983 0.0769 4,461 28 0.0063

5 - 4 1 - 2 3through 27

Battle Creek(CNFH)

16-Jan-97 135 362,933 3209 0.0088 0.726169 263,551 0.0718 18,918 78 0.0041

5-42-41

5-42-38, 39,40

Battle Creek(CNFH)

17-Jan-97 132 185,632 1920 0.0103 0.849460 157,687 0.0713 11,250 42 0.0037

5-42-31 Miller Park(CNFH)

2-Dec-96 117 55,425 140 0.0025 0.207452 11,498 0.1391 1,599 20 0.0125

5-42-30 Miller Park(CNFH)

14-Jan-97 118 48,046 41 0.0009 0.070084 3,367 0.1316 443 11 0.0248

5 - 1 - 2 - 2 - 8through 15

Battle Creek(CNFH)

1-Apr-97 72 288,499 1361 0.0047 0.387443 111,777 0.1373 15,346 52 0.0034

5-1-2-3-1

5-1-2-3-9 &10

Battle Creek(CNFH)

9-Apr-97 71 97,229 266 0.0027 0.224688 21,846 0.1368 2,990 11 0.0037

5-1-2-3-3

5-1-2-3-2, 4through 8, 11

Battle Creek(CNFH)

15-Apr-97 73 236,539 1261 0.0053 0.437831 103,564 0.1365 14,135 54 0.0038

5-1-2-4-1 & 2 Battle Creek(CNFH)

16-Apr-97 62 207,495 348 0.0017 0.137742 28,581 0.1329 3,798 17 0.0045

5-1-2-3-12 through 15

5-1-2-4-3, 4,5

Battle Creek(CNFH)

6-May-97 72 104,100 126 0.0012 0.099406 10,348 0.1372 1,419 5 0.0035

6-48-6 Woodbridge(MOK)

16-Oct-96 161 42,807 5 0.0001 0.009593 411 - 0 0

6-1-6-2-11 &12

W e s tSacramento(FRH)

15-Apr-97 95 50,673 470 0.0093 0.761756 38,600 0.1367 5,278 23 0.0044

6-49-10 & 11 N e w H o p eL a n d i n g(MOK)

23-Apr-97 77 103,456 148 0.0014 0.117490 12,155 0.1387 1,686 16 0.0095

6-25-41 & 42 Gridley BoatRamp (FRH)

24-Apr-97 97 105,266 543 0.0052 0.423649 44,596 0.1321 5,893 35 0.0059

62

6-2-31 San PabloBay (MOK)

24-Apr-97 86 52,317 289 0.0055 0.453680 23,735 0.1389 3,297 1 0.0003

6-25-43 & 44 Verona BoatRamp (FRH)

24-Apr-97 96 99,318 823 0.0083 0.680560 67,592 0.1387 9,376 30 0.0032

6-1-6-3-2 & 3 Mossdale (w/ barrier)(FRH)

28-Apr-97 100 48,774 330 0.0068 0.555674 27,102 0.1375 3,725 10 0.0027

6-1-6-3-4 & 5 D o s R e i s(FRH)

29-Apr-97 97 49,830 258 0.0052 0.425229 21,189 0.1366 2,894 11 0.0038

6-25-45 & 46 D o s R e i s(MRFF)

29-Apr-97 74 102,480 350 0.0034 0.280494 28,745 0.1389 3,992 16 0.0040

6-49-12 & 13 Jersey Point(MOK)

30-Apr-97 73 104,000 455 0.0044 0.359313 37,369 0.1387 5,182 63 0.0122

6-1-6-2-13 &14

W e s tSacramento(FRH)

1-May-97 102 52,144 499 0.0096 0.785942 40,982 0.1387 5,684 22 0.0039

6-1-6-2-7 & 8 Jersey Point(FRH)

2-May-97 99 49,864 697 0.0140 1.147995 Unusually high recovery rate - not used in calculation

6-25-47 Jersey Point(MRFF)

2-May-97 75 51,588 354 0.0069 0.563571 29,074 0.1375 3,996 27 0.0068

6-25-48 D os Re i s(MRFF)

8-May-97 75 46,728 91 0.0019 0.159941 7,474 0.1189 889 5 0.0056

6-25-49 Jersey Point(MRFF)

12-May-97 74 47,254 191 0.0040 0.331963 15,687 0.1244 1,951 18 0.0092

6-1-6-2-9 &10

W e s tSacramento(FRH)

15-May-97 107 50,221 91 0.0018 0.148816 7,474 0.1389 1,038 1 0.0010

6-25-50 D os Re i s(MRFF)

27-May-97 77 49,139 26 0.0005 0.043455 2,135 0.1121 239 7 0.0292

6-1-11-5-11 U p p e rM e r c e d(MRFF)

20-Apr-97 77 26,045 22 0.0008 0.069373 1,807 0.1384 250 5 0.0200

6-1-11-5-11 U p p e r 20-Apr-97 77 110,538 41 0.0004 0.030463 3,367 0.1384 466 5 0.0107

63

through 13 M e r c e d(MRFF)

6-1-11-6-12

6-1-11-5-15 L o w e rM e r c e d(MRFF)

22-Apr-97 75 104,487 279 0.0027 0.219299 22,914 0.1387 3,178 16 0.0050

6-1-11-6-1, 2, 3

6 -1 -11 -6 -7through 10

U p p e rT u o l u m n e(MRFF)

22-Apr-97 71 93,507 68 0.0007 0.059725 5,585 0.1161 648 3 0.0046

6-1-11-6-4, 5,6

L o w e rT u o l u m n e(MRFF)

23-Apr-97 75 72,464 213 0.0029 0.241408 17,493 0.1275 2,230 12 0.0054

6-1-11-6-11 U p p e rM e r c e d(MRFF)

12-May-97 76 28,031 2 0.0001 0.005860 164 - 0

6-1-11-6-14& 15

L o w e rM e r c e d(MRFF)

14-May-97 67 92,157 5 0.0001 0.004456 411 0.1389 57 1 0.0175 0.0079

1996

6-1-14-5-6 Benicia 7-May-96 84 51,288 774 0.0151 1.000000 51,288 2

5-1-2-1-14 Battle Creek 14-Mar-96 65 340,000 712 0.0021 0.138764 47,180 0.113 5,331 62 0.0116

5-1-2-1-15 Battle Creek 29-Mar-96 68 308,443 1,367 0.0044 0.293676 90,582 0.1242 11,250 89 0.0079

5-34-16&18 Battle Creek 29-Mar-96 121 61,858 261 0.0042 0.279589 17,295 0.0964 1,667 31 0.0186

5-36-27 Battle Creek 9-Nov-95 119 126,584 424 0.0033 0.221953 28,096 0.0628 1,764 5 0.00285-41-16

5-36-28 Battle Creek 11-Jan-96 127 65,457 391 0.0060 0.395818 25,909 0.0894 2,316 24 0.0104

5-41-7&9 Battle Creek 8-Dec-95 125 140,814 963 0.0068 0.453164 63,812 0.0763 4,869 23 0.0047

5-41-8 Battle Creek 3-Jan-96 128 201,469 1,513 0.0075 0.497629 100,257 0.0932 9,344 79 0.00855-41-17&18

5-41-11 Port Chicago 16-Jan-96 145 34,596 270 0.0078 0.517145 17,891 ??? 0 20

5-41-12 Courtland 9-Jan-96 131 34,961 228 0.0065 0.432141 15,108 0.1236 1,867 26 0.0139

64

5-41-13 G e o r g i a n aSlough

10-Jan-96 125 33,670 146 0.0043 0.287332 9,674 0.113 1,093 5 0.0046

5-41-14 Ryde 11-Jan-96 122 30,494 243 0.0080 0.528040 16,102 0.1364 2,196 21 0.0096

5-41-19 Battle Creek 10-Jan-96 114 67,076 340 0.0051 0.335882 22,530 0.0845 1,904 13 0.0068

B6-12-02 Okie Dam 25-Jan-96 7,392 5 0.0007 0.044821 331 0 1

6-1-14-5-13,14, 15

Feather River 5-Apr-96 110 213,709 1,492 0.0070 0.462616 98,865 0.1416 13,999 110 0.0079

6-1-14-6-5

5-1-2-2-1 Battle Creek 23-Apr-96 80 268,960 1,934 0.0072 0.476479 128,154 0.1374 17,608 125 0.0071

6-1-6-1-3 Feather River 3-May-96 80 100,033 1,016 0.0102 0.673016 67,324 0.1371 9,230 58 0.0063

6-1-14-6-1 to4

Yuba City 15-May-96 87 204,171 3,120 0.0153 1.012594 206,742 0.1198 24,768 248 0.0100

6-1-13-1-7 WoodbridgeDam

10-Apr-96 93 3,852 17 0.0044 0.292440 Unusually high recovery rate - not used in calculation

6-1-14-5-5 Turner Cut 17-Apr-96 79 50,103 99 0.0020 0.130932 6,560 0.1363 894 5 0.0056

6-1-6-1-8 Miller Park 25-Apr-96 81 49,708 632 0.0127 0.842492 41,879 0.1364 5,712 58 0.0102

6-1-6-2-2 Miller Park 6-May-96 83 49,881 542 0.0109 0.720011 35,915 0.1359 4,881 30 0.0061

6-1-6-1-11,12

Turner Cut 2-May-96 83 98,023 72 0.0007 0.048672 4,771 0.1306 623 4 0.0064

6-2-16,17 Mokelumne 15-May-96 91 102,069 489 0.0048 0.317461 32,403 0.1185 3,840 25 0.0065

6-2-20,21 Mokelumne 4-Jun-96 104 104,587 18 0.0002 0.011404 1,193 0.1389 166 1 0.0060

6-1-6-1-15 Mossdale 15-Apr-96 78 51,718 68 0.0013 0.087125 4,506 0.1389 626 2 0.0032

6-1-6-1-13 Jersey Point 18-Apr-96 78 50,041 330 0.0066 0.436981 21,867 0.131 2,865 25 0.0087

6-1-6-2-1 Mossdale 30-Apr-96 81 50,462 15 0.0003 0.019697 994 0.1389 138 1 0.0072

6-1-6-2-3 & Dos Reis 1-May-96 84 98,638 69 0.0007 0.046353 4,572 0.1361 622 13 0.02096-1-6-1-10

6-1-11-4-12,13, 14, 15

Dos Reis 1-May-96 84 107,961 105 0.0010 0.064446 6,958 0.1372 955 58 0.0608

6-1-6-1-9 Jersey Point 3-May-96 87 50,820 309 0.0061 0.402901 20,475 0.1359 2,783 24 0.0086

65

6-1-11-5-1 Jersey Point 3-May-96 77 51,737 180 0.0035 0.230540 11,927 0.1366 1,629 39 0.0239

6-2-18,19 Jersey Point 20-May-96 94 103,221 2,043 0.0198 1.311521 135,376 0.1389 18,804 195 0.0104

6-1-11-4-10 U p p e rMerced

25-Apr-96 80 22,638 2 0.0001 0.005854 133 0.1389 18 1 0.0543

6-1-11-5-4 L o w e rMerced

26-Apr-96 93 22,019 8 0.0004 0.024075 530 0.1389 74 1 0.0136

6-1-11-5-7,8 U p p e rTuolumne

26-Apr-96 88 45,845 17 0.0004 0.024572 1,126 0.1389 156 3 0.0192

6-1-11-5-9,10 U p p e rTuolumne

27-Apr-96 90 50,608 16 0.0003 0.020950 1,060 0.1389 147 4 0.0272

6-57-61 WoodbridgeDam

26-Sep-95 146 75,248 299 0.0040 0.263300 19,813 0.1389 2,752 1 0.0004 0.0126

19956-1-14-5-2 Ryde 01-May-95 81 51,597 647 0.0125 Rodeo used as control instead of Ryde

6-29-32 & 33 Rodeo 16-Jun-95 287,259 2,571 0.0090

5-1-1-12-6 to8

Battle Creek 24-Apr-95 73 152,187 1,166 0.0077 0.856037 130,278 0.1313 17,105 58 0.0034

6-1-6-1-4 to 7 Feather River 03-Apr-95 49 196,964 1,459 0.0074 0.827637 163,015 0.1216 19,823 65 0.0033

6-1-14-5-3 Miller Park 01-May-95 81 50,292 737 0.0147 1.637345 Unusually high recovery rate - not used in calculation

6-2-11 & 12 New Hope L. 18-Apr-95 80 97,876 705 0.0072 0.804794 78,770 0.1343 10,579 51 0.0048

6-2-13 & 14 New Hope L. 25-Apr-95 83 99,462 625 0.0063 0.702093 69,832 0.1389 9,700 49 0.0051

6-2-10 Thornton 15-Jun-95 95 51,757 211 0.0041 0.455496 23,575 0.1389 3,275 18 0.0055

6-1-14-5-1 Mossdale 14-Apr-95 70 100,969 407 0.0040 0.450379 45,474 0.1344 6,112 23 0.00386-1-14-4-14

6-1-14-4-12 Dos Reis 17-Apr-95 70 50,848 206 0.0041 0.452652 23,016 0.1331 3,063 8 0.0026

6-1-14-4-13 Jersey Point 19-Apr-95 70 50,799 248 0.0049 0.545467 27,709 0.1381 3,827 25 0.0065

6-31-50 & 51 Mossdale 05-May-95 76 102,562 340 0.0033 0.370394 37,988 0.1331 5,056 13 0.0026

6-31-47 Dos Reis 05-May-95 76 52,097 354 0.0068 0.759210 39,553 0.1343 5,312 21 0.0040

6-1-14-5-4 Mossdale 17-May-95 78 104,125 330 0.0032 0.008950 932 0.1386 129 8 0.0619

66

6-31-48

6-31-49 Dos Reis 17-May-95 77 51,665 221 0.0043 0.477933 24,692 0.1386 3,422 9 0.0026

6-1-11-4-1 to4

U p p e rMerced

03-May-95 84 111,288 655 0.0059 0.657604 73,183 0.1354 9,909 18 0.0018

6-1-11-4-5 to7

L o w e rMerced

04-May-95 82 83,016 213 0.0026 0.286675 23,799 0.1388 3,303 18 0.0054

6-1-11-3-11to 13

U p p e rTuolumne

04-May-95 86 83,539 942 0.0113 1.259892 105,250 0.1311 13,798 21 0.0015

6-1-11-3-14& 15

L o w e rTuolumne

05-May-95 89 53,539 583 0.0109 1.216662 65,139 0.1319 8,592 12 0.0014 0.0073

0.134519946-31-44 Benicia 10-May-94 54,297 1,147 0.0211

6-1-14-4-1 Ryde 12-Apr-94 76 51,819 376 0.0073 0.343488 17,799 0.1389 2,472 11 0.0044

5-34-27 to 29 Battle Creek 14-Apr-94 70 160,805 795 0.0049 0.234035 37,634 0.1389 5,227 22 0.0042

6-1-6-1-1 Feather River 16-Mar-94 61 103,558 189 0.0018 0.086395 8,947 0.1362 1,219 6 0.0049

6-1-14-4-2 G e o r g i a n aSl.

12-Apr-94 77 51,485 214 0.0042 0.196764 10,130 0.1389 1,407 3 0.0021

6-1-14-4-3 Jersey Point 13-Apr-94 72 50,689 421 0.0083 0.393170 19,929 0.1389 2,768 10 0.0036

6-1-14-4-6 Ryde 25-Apr-94 76 56,139 663 0.0118 0.559064 31,385 0.1389 4,359 11 0.0025

6-1-14-4-7 G e o r g i a n aSl.

25-Apr-94 73 50,235 151 0.0030 0.142293 7,148 0.1389 993 6 0.0060

6-1-14-4-8 Jersey Point 27-Apr-94 78 53,810 748 0.0139 0.658038 35,409 0.1389 4,918 16 0.0033

6-1-6-1-2 Feather River 02-May-94 81 100,377 102 0.0010 0.048104 4,829 0.1389 671 1 0.0015

6-31-42 Miller Park 03-May-94 83 53,232 222 0.0042 0.197421 10,509 0.1389 1,460 4 0.0027

6-1-14-4-4 Mossdale 26-Apr-94 77 50,726 87 0.0017 0.081190 4,118 0.1389 572 2 0.0035

6-31-43 Mossdale 09-May-94 89 53,880 31 0.0006 0.027236 1,467 0.1389 204 1 0.0049

6-48-1 & 2 New Hope L. 23-May-94 96 102,732 742 0.0072 0.341909 35,125 0.1389 4,879 19 0.0039

6-48-3 & 4 New Hope L. 10-May-94 90 103,470 304 0.0029 0.139082 14,391 0.1291 1,858 11 0.0059

6-1-11-2-10 M e r c e d 22-Apr-94 89 99,565 338 0.0034 0.160702 16,000 0.1389 2,222 6 0.0027

67

to 13 Hatchery

6-1-11-2-14& 15

L o w e rMerced

22-Apr-94 87 82,091 232 0.0028 0.133784 10,982 0.1389 1,525 2 0.0013

6-1-11-3-1

6-1-11-3-2 to4

U p p e rTuolumne

23-Apr-94 85 83,414 252 0.0030 0.143013 11,929 0.1389 1,657 3 0.0018

6-1-11-3-5 &6

L o w e rTuolumne

24-Apr-94 82 50,055 152 0.0030 0.1438 7,195 0.1389 999 2 0.0020 0.0034

0.138219936-31-37 Ryde 10-May-93 75 49,699 1116 0.0225

6-1-14-3-5 Benicia (split r.)

7&15-Apr-93 58 53,066 434 0.0082 Ryde used as control instead of Port Chicago or Benicia

6-1-14-3-7 Benicia 15-Apr-93 63 49,335 530 0.0107 Ryde used as control instead of Port Chicago or Benicia

6-1-14-11-1& 2

Battle Creek 13-Apr-93 72 60,341 1095 0.0181 0.808137 48,764 0.1348 6,573 45 0.0068

6-1-14-3-10 Georgiana Sl 14-Apr-93 63 53,857 204 0.0038 0.168683 9,085 0.1345 1,222 7 0.0057

6-1-14-3-9 Ryde 14-Apr-93 61 53,265 523 0.0098 0.437263 23,291 0.1365 3,179 23 0.0072

6-1-14-3-11 Miller Park 23-Apr-93 68 54,454 764 0.0140 0.624809 34,023 0.1361 4,631 36 0.0078

6-1-14-11-3 Rio Vista 26-Apr-93 69 28,056 326 0.0116 0.517458 14,518 0.1299 1,886 19 0.0101

5-1-1-8-3 to 5 Battle Creek 26-Apr-93 72 183,957 3,441 0.0187 0.833013 153,239 0.1349 20,672 130 0.0063

6-1-14-3-13 Miller Park 03-May-93 71 51,574 687 0.0133 0.593211 30,594 0.1334 4,081 23 0.0056

6-31-36 G e o r g i a n aSl.

10-May-93 75 51,560 350 0.0068 0.302300 15,587 0.1327 2,068 15 0.0073

6-1-14-3-6 Mossdale 06-Apr-93 59 50,016 37 0.0007 0.032944 1,648 0.1360 224 2 0.0089

6-1-14-3-12 Mossdale 28-Apr-93 71 55,742 92 0.0017 0.073500 4,097 0.1389 569 4 0.0070

6-31-35 Mossdale 04-May-93 72 51,937 111 0.0021 0.095176 4,943 0.1389 687 4 0.0058

6-31-38 Mossdale 12-May-93 75 52,616 89 0.0017 0.075328 3,963 0.1389 551 4 0.0073

6-63-41 & 42 N e w H o p eLanding

06-May-93 78 100,443 600 0.0060 0.266020 26,720 0.1327 3,546 15 0.0042

6-63-43 & 44 N e w H o p e 20-May-93 87 99,262 779 0.0078 0.349493 34,691 0.1186 4,114 10 0.0024

68

Landing

6-31-39 Miller Park 21-May-93 80 49,786 559 0.0112 0.500021 24,894 0.1329 3,308 18 0.0054

6-31-40 Miller Park 26-May-93 82 50,116 1,179 0.0235 1.047661 50,116 0.1386 6,946 40 0.0058 0.00650.1343

19925-28-30 Benicia 28-Apr-92 80 54,055 859 0.0159

5-28-12 to 14 Battle Creek 14-Apr-92 71 157,826 98 0.0006 0.039074 6,167 0.1368 844 21 0.0249

5-28-18 RBDD 15-Apr-92 71 49,373 35 0.0007 0.044609 2,202 0.137 302 18 0.0597

5-28-19 Princeton 17-Apr-92 73 53,332 154 0.0029 0.181709 9,691 0.1389 1,346 24 0.0178

6-1-14-2-11 Ryde 06-Apr-92 77 53,630 360 0.0067 0.422413 22,654 0.1389 3,147 78 0.0248

6-1-14-2-10 G e o r g i a n aSlough

06-Apr-92 74 51,846 144 0.0028 0.174779 9,062 0.1389 1,259 23 0.0183

6-1-14-3-1 Ryde 14-Apr-92 82 42,534 498 0.0117 0.736777 31,338 0.1389 4,353 97 0.0223

6-1-14-3-2 G e o r g i a n aSlough

14-Apr-92 81 52,374 240 0.0046 0.288362 15,103 0.1385 2,092 41 0.0196

6-31-29 Ryde 27-Apr-92 81 53,099 218 0.0041 0.258353 13,718 0.1364 1,871 93 0.0497

6-31-30 G e o r g i a n aSlough

27-Apr-92 83 51,914 34 0.0007 0.041213 2,140 0.1347 288 11 0.0382

6-1-14-2-12& 13

Mossdale 07-Apr-92 78 107,103 75 0.0007 0.044066 4,720 0.1389 656 20 0.0305

6-1-14-2-14& 15

Mossdale 13-Apr-92 82 103,712 20 0.0002 0.012135 1,259 0.1389 175 13 0.0744

6-1-14-3-3 &4

Mossdale 24-Apr-92 84 104,739 44 0.0004 0.026435 2,769 0.1364 378 8 0.0212

6-31-33 & 34 Mossdale 12-May-92 86 105,385 9 0.0001 0.005374 566 0.1362 77 2 0.0259 0.03290.1376

19915-1-1-1-4 Benicia 13-May-91 88 43,750 742 0.0170

5-1-1-1-13 Battle Creek 30-Apr-91 78 64,373 273 0.0042 0.246227 15,850 0.1368 2,168 14 0.0065

5-1-1-1-12 RBDD 01-May-91 77 64,118 375 0.0058 0.338449 21,701 0.1368 2,969 24 0.0081

5-18-45, 47&48

Princeton 03-May-91 80 51,979 173 0.0033 0.179298 9,320 0.1356 1,264 24 0.0190

70

6-1-14-2-7&8 Miller Park 25-Apr-91 82 102,664 629 0.0061 0.353176 36,259 0.1389 5,036 85 0.0169

6-1-14-2-9 Miller Park 29-Apr-91 80 104,516 465 0.0044 0.264931 27,690 0.1371 3,797 55 0.01456-31-24

6-1-14-2-6 Jersey Point 19-Apr-91 82 52,139 358 0.0069 0.404850 21,108 0.1375 2,902 94 0.0324

6-1-14-2-3 &4

Empire Tract 17-Apr-91 78 95,602 156 0.0016 0.096213 9,198 0.1370 1,260 54 0.0429

6-1-14-1-14& 15

Dos Reis 15-Apr-91 80 102,999 88 0.0009 0.050376 5,189 0.1374 713 17 0.0238

6-1-14-2-1&2 B u c k l e yCove

16-Apr-91 79 99,341 116 0.0012 0.053838 5,348 0.1368 732 26 0.0355

6-31-25 & 26 B u c k l e yCove

09-May-91 85 99,820 105 0.0011 0.062022 6,191 0.1368 847 20 0.0236

6-31-28 Jersey Point 13-May-91 87 49,184 275 0.0056 0.344396 16,939 0.1389 2,353 89 0.0378

6-31-27 L o w e rMokelumne

09-May-91 84 45,706 229 0.0050 0.269394 12,313 0.1378 1,697 31 0.0183

6-1-14-2-5 L o w e rMokelumne

18-Apr-91 79 47,289 143 0.0030 0.178299 8,432 0.1389 1,171 79 0.0675 0.02667

0.1268819905-20-58 Benicia 22-May-90 84 52,446 243 0.0046

5-20-55 Battle Creek 11-May-90 83 51,069 39 0.0008 0.164821 8,417 0.1073 903 7 0.0078

5-20-56 Red Bluff 12-May-90 82 51,533 33 0.0006 0.138208 7,122 0.0982 700 3 0.0043

5-20-57 Princeton 14-May-90 84 52,077 12 0.0002 0.049733 2,590 0.1389 360 5 0.0139

6-31-18 Miller Park 07-May-90 74 48,390 115 0.0024 0.512918 24,820 0.1351 3,353 43 0.0128

6-31-20 Ryde 09-May-90 79 51,878 173 0.0033 0.719729 37,338 0.1347 5,030 87 0.0173

6-31-21 Steamboa tSlough

30-May-90 86 52,010 318 0.0061 Unusually high recovery rate - not used in calculation

6-31-23 Sutter Slough 29-May-90 83 49,324 221 0.0045 0.967030 47,698 0.1369 6,530 39 0.0060

6-31-22 Ryde 31-May-90 84 50,837 218 0.0043 0.925513 47,050 0.1375 6,469 67 0.0104

6 - 1 - 1 4 - 1 -10&11

Dos Reis 02-May-90 74 103,533 34 0.0003 0.070877 7,338 0.1389 1,019 4 0.0039

71

6 - 1 - 1 4 -1,12&13

Upper OldRiver

03-May-90 77 103,595 11 0.0001 0.022917 2,374 0.1389 330 1 0.0030

6-31-19 Jersey Point 04-May-90 77 50,143 208 0.0041 0.895280 44,892 0.1271 5,705 56 0.0098

6 - 1 - 1 1 - 1 -14&15

U p p e rTuolumne

30-Apr-90 83 93,653 18 0.0002 0.041482 3,885 0.1343 522 4 0.0077

6-1-11-2-1&2

6-1-14-1-5 &6

Upper OldRiver

17-Apr-90 72 106,267 14 0.0001 0.028434 3,022 0.1163 351 2 0.0057

6-1-14-1-9 Jersey Point 18-Apr-90 71 52,962 224 0.0042 0.912830 48,345 0.1296 6,266 32 0.0051

6-1-14-1-7 &8

Dos Reis 16-Apr-90 72 105,742 23 0.0002 0.046945 4,964 0.1285 638 4 0.0063

6-1-11-2-3 to5

L o w e rTuolumne

01-May-90 72 80,235 18 0.0002 0.048419 3,885 0.1389 540 1 0.0019 0.00772

0.1309819896-1-14-1-4 Port Chicago 19-Jun-89 92 48,329 352 0.0073

5-20-37 Battle Creek 08-May-89 69 51,074 83 0.0016 0.223122 11,396 0.1261 1,438 13 0.0090

5-20-38 RBDD 09-May-89 70 52,677 92 0.0017 0.239790 12,631 0.1267 1,600 18 0.0112

5-20-39 Princeton 10-May-89 72 50,842 90 0.0018 0.243044 12,357 0.1124 1,389 27 0.0194

6-31-11 Courtland 02-May-89 87 51,211 246 0.0048 0.659534 33,775 0.1383 4,671 46 0.0098

6-31-12 Ryde 03-May-89 86 51,046 417 0.0082 1.121604 Unusually high recovery rate - not used in calculation

6-31-10 Miller Park 01-Jun-89 88 52,612 80 0.0015 0.208771 10,984 0.1389 1,526 9 0.0059

6-31-8 Courtland 02-Jun-89 92 50,659 41 0.0008 0.111120 5,629 0.1389 782 19 0.0243

6-31-7 Ryde 02-Jun-89 88 50,601 82 0.0016 0.222495 11,258 0.1389 1,564 26 0.0166

6-31-15&17 Miller Park 14-Jun-89 89 94,604 68 0.0007 0.098688 9,336 0.1235 1,153 20 0.0174

6-1-14-1-3 Courtland 15-Jun-89 91 90,720 84 0.0009 0.127128 11,533 0.1389 1,602 21 0.01316-58-5

6-1-14-1-1 S teamboa tSlough

13-Jun-89 88 51,237 71 0.0014 0.190257 9,748 0.1389 1,354 50 0.0369

6-31-16 Sutter Slough 13-Jun-89 90 49,762 151 0.0030 0.416624 20,732 0.1331 2,759 57 0.0207

6-1-14-1-2 Ryde 16-Jun-89 89 51,134 10 0.0002 0.026851 1,373 0.1285 176 8 0.0454

72

6-31-14 Dos Reis 20-Apr-89 85 52,962 34 0.0006 0.088141 4,668 0.1389 648 8 0.0123

6-31-13 Upper OldRiver

21-Apr-89 81 51,972 38 0.0007 0.100387 5,217 0.1389 725 5 0.0069

6 - 1 - 1 1 - 1 -11&12

Jersey Point 24-Jun-89 70 56,816 180 0.0032 0.434978 24,714 0.1385 3,422 53 0.0155

6 - 1 - 1 1 - 1 -7&8&13

Dos Reis 02-May-89 70 76,073 78 0.0010 0.140776 10,709 0.1265 1,355 11 0.0081

6-1-11-1-4 to6

Upper OldRiver

03-May-89 70 74,341 16 0.0002 0.029550 2,197 0.1380 303 4 0.0132

B6-14-9&10 U p p e rStanislaus

20-Apr-89 78 103,951 33 0.0003 0.043586 4,531 0.1385 628 7 0.0112

B6-1-1 L o w e rStanislaus

19-Apr-89 76 74,220 59 0.0008 0.109143 8,101 0.1389 1,125 17 0.0151 0.01643

B6-14-11 0.13375

19886-31-2 Ryde 07-May-88 88 53,238 1,323 0.0249 1.841257 53,238 0.2778 14,790 145 0.0098

B6-14-8 Port Chicago 11&17-May-88

86 106,916 1,443 0.0135 Ryde used as control instead of Port Chicago or Benicia

5-18-42 Benicia

6-31-4 Port Chicago 29-Jun-88 91 54,151 1,031 0.0190 Ryde used as control instead of Port Chicago or Benicia

5-19-39 Battle Creek 09-May-88 84 51,923 396 0.0076 0.565082 29,341 0.2741 8,042 45 0.0056

5-19-40 RBDD 10-May-88 84 52,796 467 0.0088 0.655379 34,601 0.2741 9,484 37 0.0039

5-19-41 Princeton 11-May-88 85 52,771 413 0.0078 0.579871 30,600 0.2724 8,336 43 0.0052

B6-14-2&3 Courtland 03-May-88 76 107,249 1,188 0.0111 0.820729 88,022 0.2747 24,177 154 0.0064

6-31-1 Ryde 04-May-88 86 52,741 1,076 0.0204 1.001532 52,741 0.2789 14,711 104 0.0071

B6-14-6&7 Miller Park 05-May-88 78 102,736 1,096 0.0107 0.790432 81,206 0.2747 22,310 140 0.0063

B6-14-4&5 Courtland 06-May-88 78 102,480 936 0.0091 0.676726 69,351 0.2538 17,603 147 0.0084

6-62-59&60 Courtland 21-Jun-88 87 106,901 1,037 0.0097 0.718743 76,834 0.2778 21,343 39 0.0018

6-62-63 Ryde 22-Jun-88 84 53,961 252 0.0047 0.346017 18,671 0.2778 5,187 46 0.0089

6-62-61&62 Miller Park 23-Jun-88 89 97,892 141 0.0014 0.106721 10,447 0.2389 2,496 15 0.0060

73

6-62-50 Courtland 24-Jun-88 74 99,827 70 0.0007 0.051955 5,187 0.2778 1,441 5 0.0035

6-31-5&6 Steamboa tSlough

24-Jun-88 88 97,317 390 0.0040 0.296929 28,896 0.2778 8,027 79 0.0098

6-31-3 Ryde 25-Jun-88 88 53,942 285 0.0053 0.391466 21,116 0.2778 5,866 39 0.0066

B6-11-5&6 U p p e rStanislaus

26-Apr-88 78 71,675 98 0.0014 0.101306 7,261 0.2782 2,020 11 0.0054

B6-11-3&4 L o w e rStanislaus

26-Apr-88 79 68,788 267 0.0039 0.287591 19,783 0.2691 5,323 13 0.0024 0.00582

1987No control release in 1987.

19866-62-51 Port Chicago 02-Jun-86 75 47,995 1,382 0.0288

6-46-54 & 55 U p p e rTuolumne

14-Apr-86 81 99,148 1,946 0.0196 0.681627072 67,582 0.1142 7,718 35 0.0045

6-46-48 to 50& 53

U p p e rStanislaus

28-Apr-86 86 108,273 1,457 0.0135 0.467333953 50,600 0.1292 6,537 37 0.0057

6-46-56 & 57 L o w e rTuolumne

14-Apr-86 81 103,474 2,059 0.0199 0.691055713 71,506 0.0918 6,564 20 0.0030

6-46-45 & 46 L o w e rStanislaus

29-Apr-86 89 106,099 2,149 0.0203 0.703417353 74,632 0.1381 10,307 60 0.0058

H5-4-2&3 Battle Creek 13-May-86 87 53,592 650 0.0121 0.421213 22,574 0.1389 3,135 30 0.0096

H5-4-4&5 RBDD 13-May-86 87 54,506 808 0.0148 0.514820 28,061 0.1389 3,897 26 0.0067

H5-4-6&7 Princeton 14-May-86 86 46,388 1,015 0.0219 0.759886 35,250 0.1389 4,896 10 0.0020

6-62-43 Courtland 27-May-86 81 98,866 1,692 0.0171 0.594349 58,761 0.1388 8,154 39 0.0048

6-62-48 Ryde 30-May-86 81 101,320 1,979 0.0195 0.678326 68,728 0.1388 9,538 74 0.0078

6-62-49 Lower OldRiver

31-May-86 78 98,869 645 0.0065 0.226562 22,400 0.1387 3,108 26 0.0084

6-62-47 N . F o r kMokelumne

29-May-86 74 101,949 1,306 0.0128 0.444885 45,356 0.1135 5,147 33 0.0064

6-62-46 S . F o r kMokelumne

30-May-86 77 102,965 984 0.0096 0.331889 34,173 0.1149 3,926 24 0.0061

74

6-46-58 Dos Reis 29-May-86 96 95,595 2,068 0.0216 0.751283 71,819 0.1387 9,961 35 0.0035B6-11-1

6-46-59 U. Old River 30-May-86 92 100,181 1,139 0.0114 0.394845 39,556 0.1387 5,485 21 0.0038 0.00591B6-11-2

19856-62-45 Port Chicago 13-May-85 78 48,143 465 0.0097

5-39-4 Battle Creek 14-May-85 86 65,279 65 0.0010 0.103091 6,730 0.1389 935 13 0.01395-40-45-41-4H5-1-55-6-16

5-9-47 RBDD 14-May-85 88 65,615 126 0.0019 0.198814 13,045 0.1389 1,812 21 0.01165-42-45-43-4H5-1-6

5-9-48&49 Princeton 15-May-95 89 65,922 173 0.0026 0.271704 17,911 0.1389 2,488 10 0.0040H5-1-7

6-62-38 to 41 Courtland 10-May-85 81 100,626 387 0.0038 0.398181 40,067 0.1389 5,565 37 0.0066

6-62-42 Lower OldRiver

08-May-85 84 105,289 232 0.0022 0.228131 24,020 0.1389 3,336 20 0.0060

6-62-35 Ryde 11-May-85 81 107,161 924 0.0086 0.892720 95,665 0.1389 13,287 88 0.0066

6-62-34 S . F o r kMokelumne

07-May-85 79 100,386 317 0.0032 0.326939 32,820 0.1389 4,558 25 0.0055

6-62-36 N . F o r kMokelumne

09-May-85 79 101,236 565 0.0056 0.577821 58,496 0.1389 8,124 30 0.0037 0.00725

19846-62-31 & 37 Port Chicago 29-Jun-84 82 42,000 315 0.0075

6-62-27 Courtland 11-Jun-84 82 62,604 400 0.0064 0.851916 53,333 0.1093 5,827 37 0.0063

6-62-29 Ryde 13-Jun-84 77 59,998 267 0.0045 0.593353 35,600 0.1122 3,994 38 0.00956-42-9

6-62-33 Lower OldRiver

15-Jun-84 73 64,896 40 0.0006 0.082183 5,333 0.1128 602 9 0.0150

6-62-28 S . F o r kMokelumne

12-Jun-84 80 56,287 350 0.0062 0.829084 46,667 0.1086 5,067 33 0.0065

6-42-8

75

6-60-40 & 41 Below RBDD 02-Jun-84 90 102,869 2,207 0.0215 2.860596 Unusually high recovery rate - not used in calculation

6-60-42 & 43 Battle Creek 09-May-84 90 100,221 1,770 0.0177 2.354796 Unusually high recovery rate - not used in calculation

6-60-38 & 39 K n i g h t sLanding

09-May-84 90 98,751 1,955 0.0198 2.639636 Unusually high recovery rate - not used in calculation

6-62-32 N . F o r kMokelumne

14-Jun-84 77 59,808 266 0.0044 0.593009 35,467 0.0933 3,308 24 0.0073

6-48-22&23 Thornton 22-Jun-84 77 95,000 78 0.0008 0.109474 10,400 0.1306 1,358 16 0.0118 0.00939

19836-62-30 Port Chicago 23-May-83 82 43,374 129 0.0030

6-60-36 & 37 Battle Creek 02-Jun-83 76 87,890 168 0.0019 0.642702 56,487 0.0676 3,819 25 0.0065

6-60-32 & 33 K n i g h t sLanding

02-Jun-83 74 92,085 128 0.0014 0.467370 43,038 0.0798 3,434 76 0.0221

6-60-34 & 35 Below RBDD 02-Jun-83 76 89,841 92 0.0010 0.344313 30,933 0.0719 2,224 26 0.0117

6-62-24 Courtland 16-May-93 78 96,706 428 0.0044 1.488093 Unusually high recovery rate - not used in calculation

6-62-23 Isleton 20-May-83 81 92,693 368 0.0040 1.334875 Unusually high recovery rate - not used in calculation

6-62-25 L o w e rMokelumne

17-May-83 79 83,435 270 0.0032 1.088066 Unusually high recovery rate - not used in calculation

6-62-26 Lower OldRiver

17-May-83 80 89,500 99 0.0011 0.371922 33,287 0.0962 3,202 23 0.0072 0.00718

19826-62-19 Port Chicago 17-May-82 83 86,877 782 0.0090

6-60-26 & 27 Battle Creek 05-Jun-82 80 84,702 750 0.0089 0.983707 83,322 0.0678 5,649 64 0.0113

6-60-28 & 29 Below RBDD 05-May-82 82 88,125 729 0.0083 0.919023 80,989 0.0815 6,601 69 0.0105

6-60-30 & 31 K n i g h t sLanding

05-May-82 81 89,275 699 0.0078 0.869852 77,656 0.0981 7,618 91 0.0119

6-62-20 D i s c o v e r yPark

11-May-82 76 85,885 1,282 0.0149 1.658322 Unusually high recovery rate - not used in calculation

6-62-18 D i s c o v e r yPark

12-May-82 83 89,780 1,085 0.0121 1.342605 Unusually high recovery rate - not used in calculation

6-62-21 D i s c o v e r yPark

04-Jun-82 76 60,822 392 0.0064 0.716017 43,550 0.1173 5,108 30 0.0059

76

6-46-28 Dos Reis 24-Apr-82 67 48,227 552 0.0114 1.271589 Unusually high recovery rate - not used in calculation

6-46-17 U. MercedRiver

22-Apr-82 68 49,217 428 0.0087 0.966110 47,549 0.0806 3,830 19 0.0050 0.00496

19816-62-15 Port Chicago 08-Jun-81 90 78,339 2,196 0.0280

5-5-58 C a y o t eCreek

08-May-81 82 11,031 155 0.0141 0.501259 5,529 0.1389 768 1 0.0013

5-5-57 C a y o t eCreek

13-May-81 86 10,823 177 0.0164 0.583407 6,314 0.1389 877 3 0.0034

6-60-20 K n i g h t sLanding

18-Jun-81 77 43,059 175 0.0041 0.144984 6,243 0.1111 694 3 0.0043

6-60-21 K n i g h t sLanding

18-Jun-81 77 43,562 246 0.0056 0.201453 8,776 0.0417 366 2 0.0055

6-60-16 Battle Creek 18-May-81 80 86,213 281 0.0033 0.116273 10,024 0.0833 835 5 0.0060

6-60-17 RBDD 18-May-81 79 84,967 394 0.0046 0.165421 14,055 0.0833 1,171 8 0.0068

6-62-14&17 D i s c o v e r yPark

04-Jun-81 90 140,250 47 0.0003 0.011955 1,677 0.1111 186 1 0.0054

6-58-23 Rio Vista 02-Jun-81 84 8,864 219 0.0247 0.881374 7,812 0.1194 933 9 0.0096 0.00696

19806-62-9 & 12 Port Chicago 10 & 13-Jun-

8092 168,143 3,669 0.0218

6-62-7 Feather R.Hatchery

03-Jun-80 91 88,335 292 0.0033 0.151489 13,382 0.1356 1,814 15 0.0083

6-62-8 D i s c o v e r yPark

03-Jun-80 88 98,586 951 0.0096 0.442075 43,582 0.1362 5,936 34 0.0057

6-62-10 Feather R.Hatchery

05-Jun-80 90 88,516 497 0.0056 0.257315 22,777 0.1374 3,129 15 0.0048

6-62-11 D i s c o v e r yPark

05-Jun-80 90 84,643 678 0.0080 0.367088 31,071 0.1361 4,228 33 0.0078 0.00665

77

Appendix 2. Chipps Island tag summary, survival calculations, expanded fish facility recoveries, and expanded ocean recoveries updated through 1997 for coded wire tagged fish recovered 1978-1998.No ocean recoveries are reported for 1996 and 1998. Revised November 26, 2001

EXPANDED EXPANDED

RELEASE TRUCK RELEASE NUMBER AVERAGE FIRST DAY LAST DAY NUMBER MINUTES PERCENT SURVIVAL GROUP SALVAGE NUMBERS OCEANTAG CODE SITE/STOCK DATE TEMP TEMP RELEASED SIZE (MM) RECOVERED RECOVERED RECOVERED FISHED SAMPLED INDEX SURVIVAL CVP SWP RECOVERIES

1998

Late-fall run releases

Upper SacramentoRiver and Tributaries

5-50-40 Battle Creek(CNFH)

N/A N/A 66,316 118 26-Nov-97 16-Dec-97 12 2820 0.0933 0.25 12 38

5-50-41 Battle Creek(CNFH)

N/A N/A 67,659 120 3-Dec-97 9-Mar-98 10 12348 0.0884 0.22 24 26

Total 10-Nov-97 133,975 26-Nov-97 9-Mar-98 22 12488 0.0834 0.26

5-50-42 Battle Creek(CNFH)

N/A N/A 59,006 134 20-Dec-97 16-Mar-98 17 9628 0.0769 0.49 48 72

5-50-48 Battle Creek(CNFH)

N/A N/A 66,244 134 23-Dec-97 16-Mar-98 17 9228 0.0763 0.44 60 70

Total 9-Dec-97 125,250 20-Dec-97 16-Mar-98 34 9648 0.0770 0.46

5-50-59 Battle Creek(CNFH)

12-Jan-98 N/A N/A 61,048 137 18-Jan-98 18-Mar-98 26 6415 0.0742 0.75 12 0

5-50-51 Battle Creek(CNFH)

N/A N/A 63,010 141 19-Jan-98 11-Mar-98 17 5615 0.0750 0.47 0 0

5-50-52 Battle Creek(CNFH)

N/A N/A 63,872 137 20-Jan-98 9-Mar-98 26 5235 0.0742 0.71 0 0

5-50-53 Battle Creek(CNFH)

N/A N/A 61,656 139 20-Jan-98 16-Mar-98 20 5815 0.0721 0.58 0 0

Total 13-Jan-98 188,538 19-Jan-98 16-Mar-98 63 6015 0.0733 0.59

5-50-54 Battle Creek(CNFH)

N/A N/A 67,408 137 20-Jan-98 16-Mar-98 15 5815 0.0721 0.40 12 0

5-50-55 Battle Creek(CNFH)

N/A N/A 62,350 140 22-Jan-98 12-Mar-98 22 5215 0.0724 0.63 0 0

5-50-56 Battle Creek(CNFH)

N/A N/A 59,002 140 21-Jan-98 12-Mar-98 17 5415 0.0737 0.51 24 0

Total 14-Jan-98 188,760 20-Jan-98 16-Mar-98 54 5815 0.0721 0.52

78

5-50-57 Battle Creek(CNFH)

N/A N/A 57,045 138 27-Jan-98 18-Mar-98 18 4715 0.0642 0.64 24 0

5-50-58 Battle Creek(CNFH)

N/A N/A 60,144 141 28-Jan-98 18-Mar-98 13 4515 0.0627 0.45 12 0

Total 22-Jan-98 117,189 27-Jan-98 18-Mar-98 31 4715 0.0642 0.54

Sacramento-SanJoaquin Estuary

5-50-50 GeorgianaSlough(CNFH)

12/04/97 54 52 61,276 127 17-Jan-98 1-Feb-98 2 3100 0.1345 0.03 52 101

5-50-60 Ryde (CNFH) 12/04/97 54 52 46,756 123 11-Dec-97 14-Jan-98 22 4573 0.0907 0.67 0 18

5-50-49 GeorgianaSlough(CNFH)

01/13/98 52 50 66,893 140 18-Jan-98 3-Feb-98 18 3300 0.1348 0.26 24 0

5-50-62 Ryde (CNFH) 01/13/98 52 50 49,059 142 16-Jan-98 1-Feb-98 48 3280 0.1340 0.95 0 0

5-50-61 Port Chicago(CNFH)

29-Dec-97 52 48 48,080 127 3-Jan-98 9-Jan-98 5 - - 0 0

Fall run releases

Upper SacramentoRiver and Tributaries

6-1-6-4-5 Feather River(DWRRO)

25-Jan-98 N/A N/A 13,595 37 20-Apr-98 9-May-98 4 7580 0.2632 0.15 0 0

6-1-6-4-7 Feather River(DWRRO)

22-Feb-98 N/A N/A 10,840 37 19-May-98 15-Jun-98 5 7167 0.1778 0.34 0 0

5-1-2-5-8 Battle Creek(CNFH)

N/A N/A 37,880 58 13-Apr-98 15-May-98 7 11875 0.2499 0.10 0 0

5-1-2-5-9 Battle Creek(CNFH)

N/A N/A 37,595 59 16-Apr-98 7-May-98 12 8380 0.2645 0.16 0 0

5-1-2-5-13 Battle Creek(CNFH)

N/A N/A 36,701 53 16-Apr-98 25-Apr-98 5 3780 0.2625 0.07 0 0

Total 4-Mar-98 112,176 13-Apr-98 15-May-98 24 11875 0.2499 0.11

5-1-2-5-10 Battle Creek(CNFH)

N/A N/A 37,883 58 15-Apr-98 7-May-98 13 8580 0.2591 0.17 0 0

5-1-2-5-11 Battle Creek(CNFH)

N/A N/A 37,766 59 27-Mar-98 11-May-98 10 11500 0.1736 0.20 0 0

79

5-1-2-5-12 Battle Creek(CNFH)

N/A N/A 29,708 56 25-Mar-98 1-May-98 10 7870 0.1438 0.30 0 0

Total 6-Mar-98 105,357 25-Mar-98 11-May-98 33 11690 0.1691 0.24

6-1-6-4-9 Feather River(DWRRO)

6-Mar-98 N/A N/A 12,573 37 22-May-98 12-Jun-98 3 5592 0.1765 0.18 0 0

5-1-2-5-14 Battle Creek(CNFH)

N/A N/A 36,432 68 18-Apr-98 14-May-98 23 10320 0.2654 0.31 0 0

5-1-2-5-15 Battle Creek(CNFH)

N/A N/A 37,374 64 20-Apr-98 22-May-98 14 12545 0.2640 0.18 0 0

5-1-2-6-1 Battle Creek(CNFH)

N/A N/A 37,441 64 16-Apr-98 21-May-98 23 13790 0.2660 0.30 0 0

5-1-2-6-2 Battle Creek(CNFH)

N/A N/A 37,369 65 19-Apr-98 3-Jun-98 31 11435 0.1726 0.62 0 0

5-1-2-6-3 Battle Creek(CNFH)

N/A N/A 36,631 66 17-Apr-98 14-May-98 20 10280 0.2550 0.28 0 0

5-1-2-6-4 Battle Creek(CNFH)

N/A N/A 37,403 65 18-Apr-98 22-May-98 24 13325 0.2644 0.32 0 0

5-1-2-6-5 Battle Creek(CNFH)

N/A N/A 37,769 61 16-Apr-98 29-May-98 14 11815 0.1865 0.26 0 0

5-1-2-6-6 Battle Creek(CNFH)

N/A N/A 37,126 62 23-Apr-98 14-May-98 13 8835 0.2789 0.16 0 0

Total 31-Mar-98 297,545 16-Apr-98 3-Jun-98 162 17782 0.2520 0.28

5-1-2-6-7 Battle Creek(CNFH)

N/A N/A 37,519 65 19-Apr-98 13-May-98 20 9520 0.2644 0.26 0 0

5-1-2-6-8 Battle Creek(CNFH)

N/A N/A 37,217 66 20-Apr-98 19-May-98 25 11435 0.2647 0.33 0 0

5-1-2-6-9 Battle Creek(CNFH)

N/A N/A 37,154 64 20-Apr-98 18-May-98 27 11055 0.2647 0.36 0 0

5-1-2-7-4 Battle Creek(CNFH)

N/A N/A 37,404 55 3-May-98 29-May-98 15 10322 0.2655 0.20 0 0

Total 7-Apr-98 149,294 19-Apr-98 29-May-98 87 15662 0.2653 0.29

5-1-1-15-12 Caldwell Park(LSFH)

9-Apr-98 N/A N/A 21,271 78 20-Apr-98 6-May-98 15 6440 0.2631 0.35 0 0

5-1-2-6-10 Battle Creek(CNFH)

22-Apr-98 N/A N/A 37,091 72 29-Apr-98 28-May-98 31 11442 0.2649 0.41 0 0

5-1-2-6-11 Battle Creek(CNFH)

22-Apr-98 N/A N/A 36,291 73 29-Apr-98 24-May-98 39 9925 0.2651 0.53 0 0

5-1-2-6-12 Battle Creek(CNFH)

22-Apr-98 N/A N/A 37,612 72 28-Apr-98 29-May-98 45 12242 0.2657 0.59 0 0

5-1-2-6-13 Battle Creek(CNFH)

22-Apr-98 N/A N/A 37,740 71 29-Apr-98 28-May-98 41 11442 0.2649 0.53 0 0

5-1-2-6-14 Battle Creek(CNFH)

22-Apr-98 N/A N/A 37,489 70 29-Apr-98 31-May-98 47 12442 0.2618 0.62 0 0

5-1-2-6-15 Battle Creek(CNFH)

22-Apr-98 N/A N/A 37,825 68 30-Apr-98 30-May-98 47 11842 0.2653 0.61 0 0

5-1-2-7-1 Battle Creek(CNFH)

22-Apr-98 N/A N/A 37,669 69 30-Apr-98 30-May-98 40 11842 0.2653 0.52 0 0

5-1-2-7-2 Battle Creek(CNFH)

22-Apr-98 N/A N/A 37,812 67 29-Apr-98 3-Jun-98 46 12802 0.2470 0.64 0 0

80

5-1-2-7-3 Battle Creek(CNFH)

23-Apr-98 N/A N/A 37,217 66 1-May-98 30-May-98 38 11502 0.2663 0.50 0 0

5-1-2-7-5 Battle Creek(CNFH)

23-Apr-98 N/A N/A 37,551 57 3-May-98 3-Jun-98 15 11282 0.2448 0.21 0 0

Total 374,297 28-Apr-98 3-Jun-98 389 13202 0.2478 0.55

6-1-6-6-14 Gridley(FRH)

N/A N/A 43,519 78 3-May-98 8-Jun-98 45 12242 0.2298 0.59 0 0

6-1-6-6-15 Gridley(FRH)

N/A N/A 41,231 78 4-May-98 1-Jun-98 49 10622 0.2544 0.61 0 0

Total 30-Apr-98 84,750 3-May-98 8-Jun-98 94 12242 0.2298 0.63

Sacramento-SanJoaquin Estuary

6-1-13-1-14 WoodbridgeDam (MOK)

1-Mar-98 N/A N/A 11,278 59 17-Apr-98 31-May-98 13 17022 0.2627 0.57 0 0

6-1-6-4-10 Fremont Weir(FRH)

N/A N/A 25,835 69 1-Apr-98 16-Apr-98 2 1580 0.0686 0.15 0 0

6-1-6-4-11 Fremont Weir(FRH)

N/A N/A 25,708 69 15-Apr-98 26-Apr-98 7 4380 0.2535 0.14 0 0

Total 2-Mar-98 51,543 1-Apr-98 26-Apr-98 9 5360 0.1432 0.16

6-1-6-4-12 Elkhorn Sl.Boat Ramp(FRH)

N/A N/A 25,701 67 17-Apr-98 15-May-98 4 11075 0.2652 0.08 0 0

6-1-6-4-13 Elkhorn Sl.Boat Ramp(FRH)

N/A N/A 27,027 67 17-Apr-98 12-May-98 6 9920 0.2650 0.11 0 0

Total 2-Mar-98 52,728 17-Apr-98 15-May-98 10 11075 0.2652 0.09

6-1-6-5-7 WestSacramento(FRH)

51 54 21,402 83 19-Apr-98 15-May-98 32 10315 0.2653 0.73 0 0

6-1-6-5-8 WestSacramento(FRH)

51 54 21,691 83 17-Apr-98 9-May-98 26 8740 0.2639 0.59 0 0

Total 15-Apr-98 43,093 17-Apr-98 15-May-98 58 11075 0.2652 0.66

6-1-11-8-9 Mossdale(MRFF)

16-Apr-98 54 57 26,465 86 21-Apr-98 2-May-98 25 4540 0.2627 0.47 12 0

6-1-11-8-10 Mossdale(MRFF)

16-Apr-98 54 57 25,264 86 20-Apr-98 2-May-98 31 4940 0.2639 0.60 24 0

6-1-11-8-11 Mossdale(MRFF)

16-Apr-98 54 57 25,926 86 20-Apr-98 1-May-98 32 4540 0.2627 0.61 12 0

Total 77,655 20-Apr-98 2-May-98 88 4940 0.2639 0.56

6-1-11-8-6 Dos Reis 54 59 26,215 86 21-Apr-98 1-May-98 34 4140 0.2614 0.65 0 0

81

(MRH)6-1-11-8-7 Dos Reis

(MRH)54 59 26,366 86 21-Apr-98 1-May-98 25 4140 0.2614 0.47 0 0

6-1-11-8-8 Dos Reis(MRH)

54 59 24,792 86 20-Apr-98 29-Apr-98 34 3820 0.2653 0.67 0 0

Total 17-Apr-98 77,373 20-Apr-98 1-May-98 93 4540 0.2627 0.59

6-1-11-8-12 Jersey Point(MRH)

58 62 24,598 89 21-Apr-98 3-May-98 87 4920 0.2628 1.75 0 0

6-1-11-8-13 Jersey Point(MRH)

58 62 25,673 89 21-Apr-98 1-May-98 100 4140 0.2614 1.94 0 0

Total 20-Apr-98 50,271 21-Apr-98 3-May-98 187 4920 0.2628 1.84

6-1-13-1-15 WoodbridgeDam (MOK)

16-Apr-98 N/A N/A 11,367 87 1-May-98 17-May-98 10 6495 0.2653 0.43 0 0

6-2-32 New HopeLanding(MOK)

N/A N/A 51,107 81 26-Apr-98 17-May-98 46 8435 0.2663 0.44 0 0

6-2-33 New HopeLanding(MOK)

N/A N/A 51,372 77 26-Apr-98 15-May-98 30 7695 0.2672 0.28 0 0

Total 21-Apr-98 102,479 26-Apr-98 17-May-98 76 8435 0.2663 0.36

6-1-6-5-5 Mossdale(FRH)

54 66 15,559 84 8-May-98 9-May-98 2 760 0.2639 0.06 72 0

6-1-6-5-6 Mossdale(FRH)

54 66 18,400 84 25-Apr-98 16-May-98 5 8415 0.2656 0.13 120 0

Total 23-Apr-98 33,959 25-Apr-98 16-May-98 7 8415 0.2656 0.10

6-1-14-6-6 Dos Reis(FRH)

54 65 23,849 91 2-May-98 17-May-98 8 6115 0.2654 0.16 0 0

6-1-14-6-7 Dos Reis(FRH)

54 65 24,252 91 1-May-98 13-May-98 9 4960 0.2650 0.18 0 0

Total 24-Apr-98 48,101 1-May-98 17-May-98 17 4540 0.1855 0.25

6-1-6-5-11 LighthouseMarina (FRH)

58 61 21,288 89 1-May-98 24-May-98 34 9185 0.2658 0.78 0 0

6-1-6-5-12 LighthouseMarina (FRH)

58 61 22,821 89 1-May-98 13-May-98 27 4960 0.2650 0.58 0 0

Total 27-Apr-98 44,109 1-May-98 24-May-98 61 9185 0.2658 0.68

6-1-6-5-3 Jersey Point(FRH)

59 66 15,139 78 3-May-98 21-May-98 14 7290 0.2664 0.45 0 0

6-1-6-5-4 Jersey Point(FRH)

59 66 15,781 78 30-Apr-98 12-May-98 26 4940 0.2639 0.81 0 0

Total 28-Apr-98 30,920 30-Apr-98 21-May-98 40 8410 0.2655 0.63

82

6-2-34 Jersey Point(MOK)

28-Apr-98 N/A N/A 51,228 86 29-Apr-98 14-May-98 110 6100 0.2648 1.05 0 0

6-2-35 Jersey Point(MOK)

28-Apr-98 N/A N/A 52,128 84 29-Apr-98 18-May-98 105 7635 0.2651 0.99 0 0

Total 103,356 29-Apr-98 18-May-98 215 7635 0.2651 1.02

6-1-6-5-13 Verona(FRH)

N/A N/A 38,955 78 5-May-98 30-May-98 38 10022 0.2677 0.47 0 0

6-1-6-5-14 Verona(FRH)

N/A N/A 39,300 78 5-May-98 6-Jun-98 45 11182 0.2353 0.63 0 0

Total 30-Apr-98 78,255 5-May-98 6-Jun-98 83 11182 0.2353 0.59

6-1-6-6-9 SFBay-Wickland Oil(FRH)

N/A N/A 17,737 96 19-May-98 19-May-98 1 - -

6-1-6-6-10 SFBay-Wickland Oil(FRH)

N/A N/A 18,052 96 18-May-98 18-May-98 1 - -

6-1-6-6-11 SFBay-Wickland Oil(FRH)

N/A N/A 18,244 96 24-May-98 24-May-98 1 - -

Total 4-May-98 54,033 18-May-98 24-May-98 3

6-1-6-4-14 Mossdale(FRH)

51 64 21,600 90 8-May-98 26-May-98 15 7262 0.2654 0.34 372 0

6-1-6-4-15 Mossdale(FRH)

51 64 21,599 90 11-May-98 21-May-98 6 4270 0.2696 0.13 252 0

Total 6-May-98 43,199 8-May-98 26-May-98 21 7262 0.2654 0.24

6-1-13-2-1 WoodbridgeDam (MOK)

7-May-98 N/A N/A 12,351 92 17-May-98 26-May-98 9 3827 0.2658 0.36 0 0

6-1-6-5-1 Benicia(FRH)

N/A N/A 15,429 92 18-May-98 25-May-98 2 - - 0 0

6-1-6-5-2 Benicia(FRH)

N/A N/A 15,348 92 - - 0 0

Total 7-May-98 30,777 18-May-98 25-May-98 2 - -

6-2-38 New HopeLanding(MOK)

N/A N/A 51,046 101 19-May-98 2-Jun-98 52 4967 0.2300 0.58 0 0

6-2-39 New HopeLanding(MOK)

N/A N/A 51,624 101 17-May-98 7-Jun-98 63 6767 0.2136 0.74 0 0

Total 14-May-98 102,670 17-May-98 7-Jun-98 115 6767 0.2136 0.68

6-1-6-5-9 WestSacramento(FRH)

54 57 17,940 99 19-May-98 30-May-98 37 4607 0.2666 1.01 0 0

6-1-6-5-10 WestSacramento

54 57 16,600 99 18-May-98 26-May-98 29 3427 0.2644 0.86 0 0

83

(FRH)Total 15-May-98 34,540 18-May-98 30-May-98 66 5007 0.2675 0.93

6-1-13-2-2 WoodbridgeDam (MOK)

20-May-98 N/A N/A 10,414 97 8-Jun-98 8-Jun-98 1 160 0.1111 0.11 0 0

Upper San JoaquinRiver and Tributaries

6-25-20 UpperMerced(MRFF)

N/A N/A 27,973 83 26-Apr-98 29-May-98 15 13042 0.2664 0.26 276 4

6-45-23 UpperMerced(MRFF)

N/A N/A 35,800 83 26-Apr-98 30-May-98 25 13442 0.2667 0.34 224 4

6-45-24 UpperMerced(MRFF)

N/A N/A 36,289 83 23-Apr-98 21-May-98 24 11150 0.2670 0.32 364 0

Total 12-Apr-98 100,062 23-Apr-98 30-May-98 64 14582 0.2665 0.31

6-25-21 LowerMerced(MRFF)

49 50 34,805 85 27-Apr-98 11-May-98 21 5740 0.2657 0.30 512 0

6-25-22 LowerMerced(MRFF)

49 50 30,857 85 23-Apr-98 12-May-98 18 7680 0.2667 0.28 280 0

6-25-23 LowerMerced(MRFF)

49 50 8,447 85 28-Apr-98 2-May-98 2 1920 0.2667 0.12 76 0

Total 14-Apr-98 74,109 23-Apr-98 12-May-98 41 7680 0.2667 0.27

6-1-11-7-3 UpperTuolumne(MRFF)

50 51 32,787 83 21-Apr-98 29-May-98 28 14862 0.2646 0.42 284 6

6-1-11-7-4 UpperTuolumne(MRFF)

50 51 26,633 83 23-Apr-98 9-May-98 5 6500 0.2655 0.09 280 0

6-1-11-7-5 UpperTuolumne(MRFF)

50 51 27,404 83 29-Apr-98 2-Jun-98 19 12602 0.2500 0.36 312 6

6-1-11-7-6 UpperTuolumne(MRFF)

50 51 7,234 83 13-May-98 20-May-98 2 3075 0.2669 0.13 84 10

Total 15-Apr-98 94,058 21-Apr-98 2-Jun-98 54 15622 0.2523 0.30

6-1-11-7-7 Downstreamof Tuol. R.(MRFF)

16-Apr-98 N/A 59 25,754 86 21-Apr-98 16-May-98 18 9855 0.2632 0.35 212 0

6-1-11-7-8 Downstreamof Tuol. R.(MRFF)

17-Apr-98 N/A 59 22,006 83 23-Apr-98 22-May-98 20 11465 0.2654 0.45 220 0

Total 47,760 21-Apr-98 22-May-98 38 12145 0.2636 0.39

6-1-11-7-9 Upper N/A 52 28,248 85 13-May-98 4-Jun-98 8 7662 0.2313 0.16 228 6

84

Merced(MRH)

6-1-11-7-10 UpperMerced(MRH)

N/A 52 25,482 85 18-May-98 30-May-98 6 5007 0.2675 0.11 180 0

6-1-11-7-11 UpperMerced(MRH)

N/A 52 25,220 85 25-May-98 30-May-98 5 2317 0.2682 0.10 192 30

6-1-11-7-12 UpperMerced(MRH)

N/A 52 25,046 85 15-May-98 27-May-98 10 4942 0.2640 0.20 240 18

Total 3-May-98 103,996 13-May-98 4-Jun-98 29 7662 0.2313 0.16

6-1-11-5-2 LowerMerced(MRH)

53 59 49,873 89 10-May-98 29-May-98 18 7682 0.2667 0.18 852 17

6-1-11-7-13 LowerMerced(MRH)

53 59 25,314 89 10-May-98 30-May-98 16 8082 0.2673 0.31 396 32

Total 5-May-98 75,187 10-May-98 30-May-98 34 8082 0.2673 0.22

1997

Late-fall run releases

Upper SacramentoRiver and Tributaries

5-42-32 Battle Creek(CNFH)

N/A N/A 65,281 98 4-Dec-96 4-Feb-97 8 8242 0.0909 0.18 0 0

5-42-33 Battle Creek(CNFH)

N/A N/A 62,179 118 25-Nov-96 19-Feb-97 12 10042 0.0802 0.31 0 0

Total 7-Nov-96 127,460 25-Nov-96 19-Feb-97 20 10042 0.0802 0.25

5-42-34 Battle Creek(CNFH)

N/A N/A 63,276 132 15-Dec-96 28-Feb-97 19 8239 0.0753 0.52 0 0

5-42-35 Battle Creek(CNFH)

N/A N/A 59,739 131 15-Dec-96 7-Mar-97 16 8824 0.0738 0.47 0 0

Total 10-Dec-96 123,015 15-Dec-96 7-Mar-97 35 8824 0.0738 0.50

5-42-36 Battle Creek(CNFH)

N/A N/A 62,269 121 16-Jan-97 28-Mar-97 11 8064 0.0778 0.30 0 0

5-42-37 Battle Creek(CNFH)

N/A N/A 65,279 117 15-Jan-97 4-Apr-97 17 8864 0.0769 0.44 0 0

Total 9-Jan-97 127,548 15-Jan-97 4-Apr-97 28 8864 0.0769 0.37

5-41-23 Battle Creek(CNFH)

N/A N/A 64,219 147 21-Jan-97 3-Mar-97 12 5124 0.0847 0.29 0 0

5-41-24 Battle Creek(CNFH)

N/A N/A 58,095 132 22-Jan-97 25-Mar-97 18 6689 0.0737 0.55 0 0

5-41-25 Battle Creek(CNFH)

N/A N/A 62,760 153 21-Jan-97 26-Feb-97 17 4764 0.0894 0.39 0 0

5-41-26 Battle Creek N/A N/A 59,170 115 5-Feb-97 10-Apr-97 16 5505 0.0588 0.60 0 0

85

(CNFH)5-41-27 Battle Creek

(CNFH)N/A N/A 60,288 114 22-Jan-97 28-Mar-97 9 6889 0.0725 0.27 0 1

5-42-41 Battle Creek(CNFH)

N/A N/A 58,401 150 22-Jan-97 21-Feb-97 6 4184 0.0937 0.14 0 6

Total 16-Jan-97 362,933 21-Jan-97 10-Apr-97 78 8269 0.0718 0.39

5-42-38 Battle Creek(CNFH)

N/A N/A 60,524 125 23-Jan-97 21-Mar-97 8 6289 0.0753 0.23 0 0

5-42-39 Battle Creek(CNFH)

N/A N/A 61,291 149 22-Jan-97 31-Mar-97 15 7089 0.0713 0.45 0 0

5-42-40 Battle Creek(CNFH)

N/A N/A 63,817 121 22-Jan-97 21-Mar-97 19 6489 0.0764 0.51 0 0

Total 17-Jan-97 185,632 22-Jan-97 31-Mar-97 42 7089 0.0713 0.41

Sacramento-SanJoaquin Estuary

5-42-31 Miller Park(CNFH)

2-Dec-96 52 54 55,425 117 8-Dec-96 17-Dec-96 20 2003 0.1391 0.34 0 6

5-42-30 Miller Park(CNFH)

14-Jan-97 41 45 48,046 118 16-Jan-97 7-Feb-97 11 4359 0.1316 0.23 0 0

Fall run releases

Upper SacramentoRiver and Tributaries

5-1-2-2-8 Battle Creek(CNFH)

N/A N/A 30,589 72 15-Apr-97 23-Apr-97 2 1800 0.1389 0.06 0 0

5-1-2-2-9 Battle Creek(CNFH)

N/A N/A 32,018 73 16-Apr-97 23-Apr-97 7 1600 0.1389 0.20 0 0

5-1-2-2-10 Battle Creek(CNFH)

N/A N/A 33,307 73 17-Apr-97 22-Apr-97 3 1200 0.1389 0.08 0 0

5-1-2-2-11 Battle Creek(CNFH)

N/A N/A 30,962 71 22-Apr-97 3-May-97 5 2350 0.1360 0.15 0 0

5-1-2-2-12 Battle Creek(CNFH)

N/A N/A 32,813 69 18-Apr-97 3-May-97 6 3150 0.1367 0.17 0 0

5-1-2-2-13 Battle Creek(CNFH)

N/A N/A 28,501 70 17-Apr-97 2-May-97 8 3150 0.1367 0.27 0 0

5-1-2-2-14 Battle Creek(CNFH)

N/A N/A 32,178 72 16-Apr-97 29-Apr-97 9 2750 0.1364 0.27 0 0

5-1-2-2-15 Battle Creek(CNFH)

N/A N/A 34,936 69 24-Apr-97 7-May-97 5 2747 0.1363 0.14 0 0

5-1-2-3-1 Battle Creek(CNFH)

N/A N/A 33,195 71 18-Apr-97 3-May-97 7 3150 0.1367 0.20 0 3

Total 1-Apr-97 288,499 15-Apr-97 7-May-97 52 4547 0.1373 0.17

5-1-2-3-9 Battle Creek(CNFH)

N/A N/A 33,626 69 21-Apr-97 7-May-97 5 3347 0.1367 0.14 0 0

5-1-2-3-10 Battle Creek(CNFH)

N/A N/A 31,777 67 5-May-97 8-May-97 2 797 0.1384 0.06 0 0

5-1-2-3-3 Battle Creek(CNFH)

N/A N/A 31,826 72 21-Apr-97 28-Apr-97 4 1550 0.1345 0.12 0 0

86

Total 9-Apr-97 97,229 21-Apr-97 8-May-97 11 3547 0.1368 0.11

5-1-2-3-6 Battle Creek(CNFH)

N/A N/A 34,492 73 26-Apr-97 18-May-97 11 4517 0.1364 0.30 0 0

5-1-2-3-7 Battle Creek(CNFH)

N/A N/A 34,829 73 26-Apr-97 15-May-97 12 3947 0.1370 0.33 0 0

5-1-2-3-8 Battle Creek(CNFH)

N/A N/A 35,473 72 29-Apr-97 4-May-97 6 1200 0.1389 0.16 0 0

5-1-2-3-11 Battle Creek(CNFH)

N/A N/A 35,198 68 30-Apr-97 8-May-97 4 1797 0.1387 0.11 0 0

5-1-2-3-2 Battle Creek(CNFH)

N/A N/A 30,618 75 26-Apr-97 1-May-97 11 1150 0.1331 0.35 0 0

5-1-2-3-4 Battle Creek(CNFH)

N/A N/A 31,413 73 25-Apr-97 7-May-97 4 2547 0.1361 0.12 0 0

5-1-2-3-5 Battle Creek(CNFH)

N/A N/A 34,516 74 26-Apr-97 30-Apr-97 6 950 0.1319 0.17 0 0

Total 15-Apr-97 236,539 25-Apr-97 18-May-97 54 4717 0.1365 0.22

5-1-2-4-1 Battle Creek(CNFH)

N/A N/A 34,417 56 24-May-97 24-May-97 1 200 0.1389 0.03 0 0

5-1-2-4-2 Battle Creek(CNFH)

N/A N/A 34,416 56 - - 0 - - 0 0

5-1-2-3-12 Battle Creek(CNFH)

N/A N/A 35,045 68 30-Apr-97 8-May-97 6 1797 0.1387 0.16 0 0

5-1-2-3-13 Battle Creek(CNFH)

N/A N/A 34,256 67 1-May-97 7-May-97 5 1397 0.1386 0.14 0 0

5-1-2-3-14 Battle Creek(CNFH)

N/A N/A 34,681 61 28-Apr-97 28-Apr-97 1 200 0.1389 0.03 0 0

5-1-2-3-15 Battle Creek(CNFH)

N/A N/A 34,680 61 30-Apr-97 11-May-97 4 2397 0.1387 0.11 0 0

Total 16-Apr-97 207,495 28-Apr-97 24-May-97 17 5167 0.1329 0.08

5-1-2-4-3 Battle Creek(CNFH)

N/A N/A 34,802 73 - - 0 - - 0 0

5-1-2-4-5 Battle Creek(CNFH)

N/A N/A 34,298 71 17-May-97 18-May-97 3 370 0.1285 0.09 12 0

5-1-2-4-4 Battle Creek(CNFH)

N/A N/A 35,000 73 16-May-97 4-Jun-97 2 3950 0.1372 0.05 12 0

Total 6-May-97 104,100 16-May-97 4-Jun-97 5 3950 0.1372 0.05

Sacramento-SanJoaquin Estuary

6-48-6 Woodbridge(MOK)

16-Oct-96 N/A 66 42,807 161 - - 0 - - 12 6

6-1-6-2-11 WestSacramento(FRH)

48 63 25,641 95 22-Apr-97 7-May-97 14 3147 0.1366 0.52 0 0

6-1-6-2-12 WestSacramento(FRH)

48 63 25,032 95 22-Apr-97 8-May-97 9 3347 0.1367 0.34 0 0

Total 15-Apr-97 50,673 22-Apr-97 8-May-97 23 3347 0.1367 0.43

87

6-49-10 New HopeLanding(MOK)

N/A N/A 52,424 78 30-Apr-97 5-May-97 6 1200 0.1389 0.11 0 0

6-49-11 New HopeLanding(MOK)

N/A N/A 51,032 76 29-Apr-97 11-May-97 10 2597 0.1387 0.18 0 0

Total 23-Apr-97 103,456 29-Apr-97 11-May-97 16 2597 0.1387 0.14

6-25-41 Gridley BoatRamp (FRH)

N/A N/A 52,669 97 4-May-97 18-May-97 18 2967 0.1374 0.32 0 0

6-25-42 Gridley BoatRamp (FRH)

N/A N/A 52,597 97 3-May-97 26-May-97 17 4567 0.1321 0.32 0 0

Total 24-Apr-97 105,266 3-May-97 26-May-97 35 4567 0.1321 0.33

6-2-31 San PabloBay (MOK)

24-Apr-97 N/A N/A 52,317 86 12-May-97 12-May-97 1 - - 0 0

6-25-43 Verona BoatRamp (FRH)

N/A N/A 50,757 96 30-Apr-97 11-May-97 12 2397 0.1387 0.22 0 0

6-25-44 Verona BoatRamp (FRH)

N/A N/A 48,561 96 29-Apr-97 12-May-97 18 2797 0.1387 0.35 0 0

Total 24-Apr-97 99,318 29-Apr-97 12-May-97 30 2797 0.1387 0.28

6-1-6-3-2 Mossdale (w/barrier)(FRH)

50 60 23,701 100 3-May-97 7-May-97 2 997 0.1385 0.08 96 10

6-1-6-3-3 Mossdale (w/barrier)(FRH)

50 60 25,073 100 5-May-97 18-May-97 8 2767 0.1373 0.30 96 24

Total 28-Apr-97 48,774 3-May-97 18-May-97 10 3167 0.1375 0.19

6-1-6-3-4 Dos Reis(FRH)

51 60 25,084 97 6-May-97 11-May-97 7 1197 0.1385 0.26 60 17

6-1-6-3-5 Dos Reis(FRH)

51 60 24,746 97 26-Apr-97 11-May-97 4 3147 0.1366 0.15 36 12

Total 29-Apr-97 49,830 26-Apr-97 11-May-97 11 3147 0.1366 0.21

6-25-45 Dos Reis(MRFF)

56 60 49,005 74 8-May-97 16-May-97 9 1800 0.1389 0.17 108 72

6-25-46 Dos Reis(MRFF)

56 60 53,475 74 10-May-97 15-May-97 7 1200 0.1389 0.12 156 58

Total 29-Apr-97 102,480 8-May-97 16-May-97 16 1800 0.1389 0.15

6-49-12 Jersey Point(MOK)

N/A N/A 52,022 75 2-May-97 11-May-97 27 1997 0.1387 0.49 0 0

6-49-13 Jersey Point(MOK)

N/A N/A 51,978 70 2-May-97 10-May-97 36 1797 0.1387 0.65 0 8

Total 30-Apr-97 104,000 2-May-97 11-May-97 63 1997 0.1387 0.57

6-1-6-2-13 WestSacramento(FRH)

48 64 25,829 102 5-May-97 15-May-97 15 2197 0.1387 0.54 0 0

88

6-1-6-2-14 WestSacramento(FRH)

48 64 26,315 102 7-May-97 10-May-97 7 800 0.1389 0.25 0 0

Total 1-May-97 52,144 5-May-97 15-May-97 22 2197 0.1387 0.40

6-1-6-2-7 Jersey Point(FRH)

48 63 24,815 99 3-May-97 10-May-97 27 1597 0.1386 1.02 12 0

6-1-6-2-8 Jersey Point(FRH)

48 63 25,049 99 4-May-97 11-May-97 28 1597 0.1386 1.05 0 0

Total 2-May-97 49,864 3-May-97 11-May-97 55 1797 0.1387 1.03

6-25-47 Jersey Point(MRFF)

2-May-97 55 64 51,588 75 4-May-97 19-May-97 27 3167 0.1375 0.50 12 12

6-1-6-3-1 Port Chicago(FRH)

58 64 23,772 99 8-May-97 10-May-97 4 - - 0 0

6-1-6-2-15 Port Chicago(FRH)

58 64 24,766 99 8-May-97 15-May-97 6 - - 0 0

Total 5-May-97 48,538 8-May-97 15-May-97 10

6-25-48 Dos Reis(MRFF)

8-May-97 57 66 46,728 75 15-May-97 22-May-97 5 1370 0.1189 0.12 24 54

6-25-49 Jersey Point(MRFF)

12-May-97 58 67 47,254 74 15-May-97 25-May-97 18 1970 0.1244 0.40 12 2

6-1-6-2-9 WestSacramento(FRH)

52 72 25,152 107 - - 0 - - 0 0

6-1-6-2-10 WestSacramento(FRH)

82 72 25,069 107 21-May-97 21-May-97 1 200 0.1389 0.04 0 0

Total 15-May-97 50,221 21-May-97 21-May-97 1 200 0.1389 0.02

6-1-6-3-6 Benicia(FRH)

19-May-97 N/A N/A 52,345 100 28-May-97 3-Jun-97 4 - - 0 8

6-1-6-3-7 Benicia(FRH)

19-May-97 N/A N/A 53,261 100 29-May-97 29-May-97 2 - - 0 0

6-1-6-3-8 Benicia(FRH)

19-May-97 N/A N/A 52,818 100 28-May-97 30-May-97 3 - - 0 0

6-1-6-3-9 Benicia(FRH)

19-May-97 N/A N/A 50,672 100 29-May-97 29-May-97 2 - - 0 0

6-1-6-3-10 Benicia(FRH)

19-May-97 N/A N/A 52,023 100 29-May-97 4-Jun-97 3 - - 0 0

6-1-6-3-11 Benicia(FRH)

19-May-97 N/A N/A 53,054 100 29-May-97 5-Jun-97 7 - - 0 0

Total 0 0 314,173 600 21 0 0.0000

6-25-50 Dos Reis(MRFF)

27-May-97 55 72 49,139 77 4-Jun-97 10-Jun-97 7 1130 0.1121 0.17 312 36

Upper San JoaquinRiver and Tributaries

89

6-1-11-5-11 UpperMerced(MRFF)

N/A 53 26,045 77 6-May-97 6-May-97 1 197 0.1368 0.04 0 18

6-1-11-5-12 UpperMerced(MRFF)

N/A 53 27,683 77 6-May-97 8-May-97 3 597 0.1382 0.10 24 3

6-1-11-5-13 UpperMerced(MRFF)

N/A 53 31,930 77 9-May-97 9-May-97 1 200 0.1389 0.03 36 0

6-1-11-6-12 UpperMerced(MRFF)

N/A 53 24,880 77 - - 0 - - 0 0

Total 20-Apr-97 110,538 6-May-97 9-May-97 5 797 0.1384 0.04

6-1-11-5-15 LowerMerced(MRFF)

54 61 24,398 75 4-May-97 14-May-97 6 2197 0.1387 0.23 24 18

6-1-11-6-1 LowerMerced(MRFF)

54 61 29,011 75 4-May-97 9-May-97 3 1197 0.1385 0.10 72 12

6-1-11-6-2 LowerMerced(MRFF)

54 61 25,761 75 3-May-97 12-May-97 7 1997 0.1387 0.25 24 2

6-1-11-6-3 LowerMerced(MRFF)

54 61 25,317 75 - - 0 - - 24 4

Total 22-Apr-97 104,487 3-May-97 14-May-97 16 2397 0.1387 0.14

6-1-11-6-7 UpperTuolumne(MRFF)

55 48 31,112 71 18-May-97 18-May-97 1 170 0.1181 0.04 72 12

6-1-11-6-8 UpperTuolumne(MRFF)

55 48 29,947 71 - - 0 - - 180 16

6-1-11-6-9 UpperTuolumne(MRFF)

55 48 24,551 71 24-May-97 24-May-97 1 200 0.1389 0.04 96 8

6-1-11-6-10 UpperTuolumne(MRFF)

55 48 7,897 71 18-May-97 18-May-97 1 170 0.1181 0.14 12 0

Total 22-Apr-97 93,507 18-May-97 24-May-97 3 1170 0.1161 0.04

6-1-11-6-4 LowerTuolumne(MRFF)

56 56 25,241 75 11-May-97 18-May-97 6 1570 0.1363 0.23 48 28

6-1-11-6-5 LowerTuolumne(MRFF)

56 56 25,692 75 11-May-97 18-May-97 2 1570 0.1363 0.07 60 14

6-1-11-6-6 LowerTuolumne(MRFF)

56 56 21,531 75 8-May-97 21-May-97 4 2570 0.1275 0.19 84 6

Total 23-Apr-97 72,464 8-May-97 21-May-97 12 2570 0.1275 0.17

6-1-11-6-11 UpperMerced(MRFF)

12-May-97 N/A 55 28,031 76 - - 0 - - 12 0

90

6-1-11-6-14 LowerMerced(MRFF)

61 66 33,064 67 - - 0 - - 180 8

6-1-11-6-15 LowerMerced(MRFF)

61 66 28,294 67 28-May-97 28-May-97 1 200 0.1389 0.03 132 18

6-1-11-7-1 LowerMerced(MRFF)

61 66 24,943 67 - - 0 - - 96 0

6-1-11-7-2 LowerMerced(MRFF)

61 66 5,856 67 - - 0 - - 24 0

Total 14-May-97 92,157 28-May-97 28-May-97 1 200 0.1389 0.01

1996

Late-fall run releases

Upper SacramentoRiver and Tributaries5-36-27 Battle Creek

(CNFH)N/A N/A 61,790 122 20-Dec-95 20-Dec-95 2 155 0.1076 0.04 0 24 210

5-41-16 Battle Creek(CNFH)

N/A N/A 64,794 116 28-Dec-95 24-Jan-96 3 3101 0.0769 0.08 0 9 201

Total 9-Nov-95 126,584 20-Dec-95 24-Jan-96 5 3256 0.0628 0.08

5-41-7 Battle Creek(CNFH)

N/A N/A 77,196 123 20-Dec-95 29-Jan-96 17 4256 0.0721 0.40 24 38 393

5-41-9 Battle Creek(CNFH)

N/A N/A 63,618 126 28-Dec-95 1-Feb-96 6 4701 0.0907 0.14 36 24 564

Total 8-Dec-95 140,814 20-Dec-95 1-Feb-96 23 4835 0.0763 0.28

5-34-16 Battle Creek(CNFH)

N/A N/A 61,858 121 11-Jan-96 15-Mar-96 31 9027 0.0964 0.68 72 194 257

5-36-18 Battle Creek(CNFH)

N/A N/A 133,985 134 12-Jan-96 26-Mar-96 56 9927 0.0919 0.59 108 625 1120

Total 2-Jan-96 195,843 11-Jan-96 26-Mar-96 87 10027 0.0916 0.63

5-41-17 Battle Creek(CNFH)

N/A N/A 67,737 143 17-Jan-96 21-Mar-96 35 8526 0.0911 0.74 84 271 667

5-41-18 Battle Creek(CNFH)

N/A N/A 64,801 110 17-Jan-96 7-Mar-96 16 6926 0.0943 0.34 12 26 301

5-41-8 Battle Creek(CNFH)

N/A N/A 68,931 132 14-Jan-96 4-Mar-96 28 7126 0.0970 0.54 60 308 470

Total 3-Jan-96 201,469 14-Jan-96 21-Mar-96 79 9126 0.0932 0.55

5-41-19 Battle Creek(CNFH)

10-Jan-96 N/A N/A 67,076 114 21-Jan-96 25-Mar-96 13 7906 0.0845 0.30 36 34 341

5-36-28 Battle Creek(CNFH)

11-Jan-96 N/A N/A 65,457 127 19-Jan-96 21-Mar-96 24 8106 0.0894 0.53 72 126 384

91

Sacramento-SanJoaquin Estuary

5-41-12 Courtland(CNFH)

9-Jan-96 53 52 34,961 131 15-Jan-96 13-Feb-96 26 5340 0.1236 0.78 72 469 227

5-41-13 Georgiana Sl.(CNFH)

10-Jan-96 55 52 33,670 125 19-Jan-96 16-Feb-96 5 4720 0.1130 0.17 180 588 147

5-41-14 Ryde (CNFH) 11-Jan-96 52 51 30,494 122 17-Jan-96 27-Jan-96 21 2160 0.1364 0.66 12 0 242

5-41-11 Port Chicago(CNFH)

11-Jan-96 NA NA 34,596 145 17-Jan-96 28-Jan-96 20 - - 0 0 265

Fall run releases

Upper SacramentoRiver and Tributaries

5-1-2-1-14 Battle Creek(CNFH)

14-Mar-96 N/A N/A 295,384 65 29-Mar-96 26-May-96 62 9600 0.1130 0.24 0 4 712

5-1-2-1-15 Battle Creek(CNFH)

29-Mar-96 N/A N/A 308,443 68 8-Apr-96 27-May-96 89 8940 0.1242 0.30 0 0 1366

6-1-14-5-13 Feather River(FRH)

N/A N/A 51,844 58 17-Apr-96 20-May-96 27 6740 0.1377 0.49 0 0 376

6-1-14-5-14 Feather River(FRH)

N/A N/A 57,529 58 30-Apr-96 20-May-96 29 4140 0.1369 0.48 0 0 385

6-1-14-5-15 Feather River(FRH)

N/A N/A 50,724 58 28-Apr-96 17-May-96 22 3940 0.1368 0.41 0 0 322

6-1-14-6-5 Feather River(FRH)

N/A N/A 53,612 58 15-Apr-96 17-May-96 32 6540 0.1376 0.56 0 0 405

Total 5-Apr-96 213,709 15-Apr-96 20-May-96 110 7340 0.1416 0.47

5-1-2-2-1 Battle Creek(CNFH)

23-Apr-96 N/A N/A 268,960 80 1-May-96 28-May-96 125 5540 0.1374 0.44 0 0 1928

6-1-6-1-3 Feather River(FRH)

3-May-96 N/A N/A 100,033 80 8-May-96 30-May-96 57 4540 0.1371 0.54 0 0 1016

6-1-14-6-1 Yuba City(FRH)

N/A N/A 50,890 87 19-May-96 31-May-96 58 2600 0.1389 1.07 0 0 741

6-1-14-6-2 Yuba City(FRH)

N/A N/A 51,610 87 19-May-96 31-May-96 70 2600 0.1389 1.27 0 0 874

6-1-14-6-3 Yuba City(FRH)

N/A N/A 51,300 87 19-May-96 30-May-96 67 2400 0.1389 1.22 0 0 776

6-1-14-6-4 Yuba City(FRH)

N/A N/A 50,371 87 19-May-96 3-Jun-96 53 2760 0.1198 1.14 0 0 763

Total 15-May-96 204,171 19-May-96 3-Jun-96 248 2760 0.1198 1.32

Sacramento-San

93

Joaquin Estuary

6-1-13-1-7 WoodbridgeDam (MOK)

10-Apr-96 N/A N/A 3,852 93 23-May-96 23-May-96 1 200 0.1389 0.24 0 0 17

6-1-14-5-5 Turner Cut(FRH)

17-Apr-96 52 63 50,103 79 30-Apr-96 15-May-96 5 3140 0.1363 0.10 12 0 19

6-1-6-1-8 Miller Park(FRH)

25-Apr-96 48 57 49,708 81 30-Apr-96 16-May-96 58 3340 0.1364 1.11 0 0 632

6-1-6-2-2 Miller Park(FRH)

6-May-96 58 65 49,881 83 10-May-96 23-May-96 30 2740 0.1359 0.58 12 0 542

6-1-6-1-11 Turner Cut(FRH)

56 70 48,100 82 9-May-96 13-May-96 3 940 0.1306 0.06 12 0 29

6-1-6-1-12 Turner Cut(FRH)

62 70 49,923 84 11-May-96 11-May-96 1 180 0.1250 0.02 12 0 43

Total 2-May-96 98,023 9-May-96 13-May-96 4 940 0.1306 0.04

6-1-14-5-6 Benicia(FRH)

7-May-96 51 66 51,288 84 11-May-96 16-May-96 2 - - 0 0 774

6-2-16 Mokelumne(MOK)

N/A N/A 49,946 90 20-May-96 3-Jun-96 14 2560 0.1185 0.31 0 24 252

6-2-17 Mokelumne(MOK)

N/A N/A 52,123 91 20-May-96 25-May-96 11 1200 0.1389 0.20 0 0 233

Total 15-May-96 102,069 20-May-96 3-Jun-96 25 2560 0.1185 0.27

6-2-20 Mokelumne(MOK)

N/A N/A 52,382 107 8-Jun-96 8-Jun-96 1 200 0.1389 0.02 12 0 14

6-2-21 Mokelumne(MOK)

N/A N/A 52,205 102 8-Jun-96 8-Jun-96 1 200 0.1389 0.02 0 4 4

Total 4-Jun-96 104,587 8-Jun-96 8-Jun-96 2 200 0.1389 0.02

6-1-6-1-14 Mossdale(FRH)

49.5 59.5 49,024 78 - - 0 - - 480 32 31

6-1-6-1-15 Mossdale(FRH)

49.5 59.5 51,718 78 25-Apr-96 27-Apr-96 2 600 0.1389 0.04 576 2 68

Total 15-Apr-96 100,742 25-Apr-96 27-Apr-96 2 600 0.1389 0.02

6-1-6-1-13 Jersey Point(FRH)

18-Apr-96 50 62 50,041 78 21-Apr-96 3-Jun-96 25 8300 0.1310 0.50 0 0 330

6-1-6-2-1 Mossdale(FRH)

61.5 64 50,462 81 7-May-96 7-May-96 1 200 0.1389 0.02 552 70 15

6-1-6-2-5 Mossdale(FRH)

61.5 64 49,194 81 - - 0 - - 780 35 15

Total 30-Apr-96 99,656 7-May-96 7-May-96 1 200 0.1389 0.01

94

6-1-6-2-3 Dos Reis(FRH)

52 63 49,868 83 9-May-96 23-May-96 2 2940 0.1361 0.04 0 0 42

6-1-6-1-10 Dos Reis(FRH)

52 63 48,770 84 11-May-96 11-May-96 1 180 0.1250 0.02 0 0 27

Total 1-May-96 98,819 9-May-96 23-May-96 3 2940 0.1361 0.03

6-1-11-4-12 Dos Reis(MRFF)

57 63 25,530 84 8-May-96 10-May-96 2 600 0.1389 0.07 0 0 3

6-1-11-4-14 Dos Reis(MRFF)

57 63 18,459 84 6-May-96 6-May-96 1 200 0.1389 0.05 0 0 8

6-1-11-4-13 Dos Reis(MRFF)

57 63 28,079 84 5-May-96 7-May-96 2 600 0.1389 0.07 0 0 37

6-1-11-4-15 Dos Reis(MRFF)

57 63 35,893 84 8-May-96 12-May-96 5 980 0.1361 0.13 0 0 10

Total 1-May-96 107,961 5-May-96 12-May-96 10 1580 0.1372 0.09

6-1-6-1-9 Jersey Point(FRH)

3-May-96 51 64 50,820 87 6-May-96 19-May-96 24 2740 0.1359 0.45 12 0 309

6-1-11-5-1 Jersey Point(MRFF)

3-May-96 50 66 51,737 77 5-May-96 22-May-96 39 3540 0.1366 0.72 0 0 180

6-1-6-2-6 Dos Reis(FRH)

9-May-96 54 60 50,168 83 - - 0 - - 0 8 25

6-1-6-2-4 Dos Reis(FRH)

16-May-96 51 62 50,243 88 - - 0 - - 12 36 92

6-2-18 Jersey Point(MOK)

N/A N/A 50,832 97 22-May-96 29-May-96 88 1600 0.1389 1.62 0 0 1044

6-2-19 Jersey Point(MOK)

N/A N/A 52,389 90 21-May-96 30-May-96 107 2000 0.1389 1.91 0 0 992

Total 20-May-96 103,221 21-May-96 30-May-96 195 2000 0.1389 1.77

6-57-61 Mokelumne(MOK)

26-Sep-95 75,248 146 16-Feb-96 16-Feb-96 1 200 0.1389 0.01 0.01 299

Upper San JoaquinRiver and Tributaries

6-1-11-4-8 UpperMerced(MRFF)

N/A N/A 21,011 80 - - 0 - - 36 1 12

6-1-11-4-9 UpperMerced(MRFF)

N/A N/A 21,069 80 - - 0 - - 12 7 5

6-1-11-4-10 UpperMerced(MRFF)

N/A N/A 22,638 80 8-May-96 8-May-96 1 200 0.1389 0.04 144 0 5

6-1-11-4-11 UpperMerced(MRFF)

N/A N/A 21,693 80 - - 0 - - 96 1 0

Total 25-Apr-96 86,411 8-May-96 8-May-96 1 200 0.1389 0.01

95

6-1-11-5-3 LowerMerced(MRFF)

N/A N/A 21,705 93 - - 0 - - 36 3 1

6-1-11-5-4 LowerMerced(MRFF)

N/A N/A 22,019 93 5-May-96 5-May-96 1 200 0.1389 0.04 72 1 8

6-1-11-5-5 LowerMerced(MRFF)

N/A N/A 20,613 93 - - 0 - - 144 8 3

Total 26-Apr-96 64,337 5-May-96 5-May-96 1 200 0.1389 0.01

6-1-11-5-6 UpperTuolumne(MRFF)

N/A N/A 21,601 88 - - 0 - - 168 19 7

6-1-11-5-7 UpperTuolumne(MRFF)

N/A N/A 22,864 88 2-May-96 6-May-96 2 1000 0.1389 0.08 84 9 9

6-1-11-5-8 UpperTuolumne(MRFF)

26-Apr-96 N/A N/A 22,984 88 6-May-96 6-May-96 1 200 0.1389 0.04 132 26 8

Total 67,449 2-May-96 6-May-96 3 1000 0.1389 0.04

6-1-11-5-9 UpperTuolumne(MRFF)

N/A N/A 22,756 90 2-May-96 2-May-96 1 200 0.1389 0.04 156 13 3

6-1-11-5-10 UpperTuolumne(MRFF)

N/A N/A 27,779 90 1-May-96 8-May-96 3 1600 0.1389 0.10 204 2 13

Total 27-Apr-96 50,535 90 1-May-96 8-May-96 4 1600 0.1389 0.07

1995

Late-fall run releases

Upper SacramentoRiver and Tributaries

5-36-22 Battle Creek(CNFH)

10-Nov-94 N/A N/A 61,673 120 6-Dec-94 21-Jan-95 19 8435 0.1246 0.32 36 53 263

5-37-42 Battle Creek(CNFH)

7-Dec-94 N/A N/A 62,356 127 22-Dec-94 25-Jan-95 27 6034 0.1197 0.47 60 161 276

5-35-46 Battle Creek(CNFH)

N/A N/A 56,340 121 11-Jan-95 3-Mar-95 14 6797 0.0908 0.36 12 50 244

5-36-20 Battle Creek(CNFH)

N/A N/A 125,754 138 11-Jan-95 17-Mar-95 64 7829 0.0824 0.80 36 422 1698

5-36-21 Battle Creek(CNFH)

N/A N/A 128,159 127 11-Jan-95 7-Apr-95 34 9228 0.0737 0.47 96 136 1259

Total 5-Jan-95 310,253 11-Jan-95 7-Apr-95 112 9228 0.0737 0.64

5-37-43 Battle Creek(CNFH)

11-Jan-95 N/A N/A 62,847 114 18-Jan-95 8-Mar-95 20 5797 0.0805 0.51 12 44 330

96

Sacramento-SanJoaquin Estuary

5-34-25 Georgiana Sl.(CNFH)

5-Dec-94 N/A N/A 31,532 112 19-Dec-94 6-Jan-95 4 2880 0.1053 0.16 48 39 12

5-34-26 Isleton(CNFH)

5-Dec-94 N/A N/A 30,220 115 11-Dec-94 3-Jan-95 15 3879 0.1122 0.57 0 6 27

6-25-25 Georgiana Sl.(CNFH)

4-Jan-95 N/A N/A 31,328 128 12-Jan-95 16-Jan-95 2 1000 0.1389 0.06 120 717 101

6-25-24 Isleton(CNFH)

5-Jan-95 N/A N/A 31,557 132 9-Jan-95 14-Jan-95 13 1200 0.1389 0.39 48 183 246

Fall run releases

Upper SacramentoRiver and Tributaries

5-1-1-12-4 Below RBDD(CNFH)

N/A N/A 50,410 49 25-Apr-95 30-May-95 13 7016 0.1353 0.25 0 0 394

5-1-1-12-5 Below RBDD(CNFH)

N/A N/A 45,472 49 24-Apr-95 21-May-95 30 5399 0.1339 0.64 0 0 327

Total 10-Mar-95 95,882 24-Apr-95 30-May-95 43 7195 0.1350 0.43

6-1-6-1-4 Feather RiverHatchery

48 50 54,304 49 25-Apr-95 29-May-95 14 6816 0.1352 0.25 0 0 366

6-1-6-1-5 Feather RiverHatchery

48 50 52,394 49 10-Apr-95 22-May-95 19 7359 0.1188 0.40 0 0 331

6-1-6-1-6 Feather RiverHatchery

48 50 51,631 49 26-Apr-95 21-May-95 18 5020 0.1341 0.34 0 0 480

6-1-6-1-7 Feather RiverHatchery

48 50 38,635 49 24-Apr-95 26-May-95 14 6395 0.1346 0.35 0 0 249

Total 3-Apr-95 196,964 10-Apr-95 29-May-95 65 8755 0.1216 0.35

5-1-1-12-6 Battle Creek(CNFH)

N/A N/A 52,442 79 2-May-95 16-May-95 20 2820 0.1306 0.38 0 0 513

5-1-1-12-7 Battle Creek(CNFH)

N/A N/A 49,636 75 1-May-95 30-May-95 26 5816 0.1346 0.51 0 0 492

5-1-1-12-8 Battle Creek(CNFH)

N/A N/A 50,109 64 5-May-95 23-Jun-95 12 9416 0.1308 0.24 0 0 337

Total 24-Apr-95 152,187 1-May-95 23-Jun-95 58 10216 0.1314 0.38

6-25-26 Yuba CityRamp (FRH)

N/A N/A 52,249 77 22-May-95 4-Jun-95 22 2796 0.1387 0.39 0 0 578

6-25-27 Yuba CityRamp (FRH)

N/A N/A 53,398 77 23-May-95 7-Jun-95 22 3196 0.1387 0.39 0 0 705

6-25-28 Yuba CityRamp (FRH)

N/A N/A 53,486 77 22-May-95 8-Jun-95 24 3596 0.1387 0.42 0 0 829

6-25-29 Yuba CityRamp (FRH)

N/A N/A 42,525 77 23-May-95 8-Jun-95 16 3396 0.1387 0.35 0 0 697

97

Total 18-May-95 201,658 22-May-95 8-Jun-95 84 3596 0.1387 0.39

Sacramento-SanJoaquin Estuary

6-63-47 L.Mokelumne(MOK)

17-Oct-94 N/A N/A 49,982 160 28-Oct-94 28-Dec-94 2 7079 0.0793 0.07 36 30 117

6-63-48 L.Mokelumne(MOK)

18-Oct-94 N/A N/A 48,142 160 26-Oct-94 14-Nov-94 4 1600 0.0556 0.19 12 36 195

6-1-14-5-1 Mossdale(FRH)

51 57 50,849 70 25-Apr-95 24-May-95 10 5820 0.1347 0.19 1212 12 187

6-1-14-4-14 Mossdale(FRH)

51 57 50,120 70 26-Apr-95 17-May-95 10 4220 0.1332 0.19 1434 24 224

Total 17-Apr-95 100,969 25-Apr-95 24-May-95 20 5999 0.1389 0.19

6-1-14-4-12 Dos Reis(FRH)

17-Apr-95 51 57 50,848 70 5-May-95 26-May-95 8 4216 0.1331 0.15 0 0 198

6-2-11 New HopeLanding(MOK)

N/A N/A 48,345 80 25-Apr-95 18-May-95 27 4620 0.1337 0.54 0 0 362

6-2-12 New HopeLanding(MOK)

N/A N/A 49,531 80 25-Apr-95 21-May-95 23 5220 0.1343 0.45 0 0 353

Total 18-Apr-95 97,876 25-Apr-95 21-May-95 50 5220 0.1343 0.49

6-1-14-4-13 Jersey Point(FRH)

19-Apr-95 51 60 50,779 70 24-Apr-95 11-May-95 26 3579 0.1381 0.48 0 0 254

6-2-13 New HopeLanding(MOK)

N/A N/A 49,837 83 2-May-95 17-May-95 26 3020 0.1311 0.52 0 0 325

6-2-14 New HopeLanding(MOK)

N/A N/A 49,625 83 1-May-95 20-May-95 24 3820 0.1326 0.47 0 0 306

Total 25-Apr-95 99,462 1-May-95 20-May-95 50 3820 0.1326 0.49

6-1-14-5-2 Ryde (FRH) 1-May-95 57 59 51,597 81 3-May-95 22-May-95 47 3820 0.1326 0.89 0 0 644

6-1-14-5-3 Miller Park(FRH)

1-May-95 59.5 58.5 50,292 81 4-May-95 21-May-95 32 3420 0.1319 0.63 12 0 743

6-31-50 Mossdale(FRH)

49 62 52,297 76 12-May-95 24-May-95 10 2420 0.1293 0.19 981 20 178

6-31-51 Mossdale(FRH)

49 62 50,265 75 12-May-95 2-Jun-95 3 4216 0.1331 0.06 816 54 166

Total 5-May-95 102,562 12-May-95 2-Jun-95 13 4216 0.1331 0.12

98

6-31-47 Dos Reis(FRH)

5-May-95 50 63 52,097 76 11-May-95 7-Jun-95 21 5416 0.1343 0.39 0 0 362

6-1-14-5-4 Mossdale(FRH)

50 63 52,703 79 29-May-95 29-May-95 1 200 0.1389 0.02 720 66 157

6-31-48 Mossdale(FRH)

50 63 51,422 76 21-May-95 29-May-95 7 1796 0.1386 0.13 780 62 161

Total 17-May-95 104,125 21-May-95 29-May-95 8 1796 0.1386 0.07

6-31-49 Dos Reis(FRH)

17-May-95 56 65 51,665 77 23-May-95 2-Jun-95 9 2196 0.1386 0.16 12 0 211

6-2-10 Thornton(MOK)

15-Jun-95 N/A N/A 51,757 100 19-Jun-95 25-Jun-95 18 1400 0.1389 0.33 0 0 213

6-29-32 Rodeo (FRH) N/A N/A 147,816 N/A - - 0 - - 0 0 627

6-29-33 Rodeo (FRH) N/A N/A 139,443 N/A - - 0 - - 0 0 1687

Total 16-Jun-95 287,259

Upper San JoaquinRiver and Tributaries

6-46-23 Mercedhatchery

N/A N/A 7,586 169 12-Dec-94 12-Dec-94 1 200 0.1389 0.12 384 110 22

6-46-24 Mercedhatchery

N/A N/A 10,021 164 - - 0 - - 84 86 23

6-46-25 Mercedhatchery

N/A N/A 8,904 164 19-Dec-94 19-Dec-94 1 200 0.1389 0.11 240 62 21

Total 17-Nov-94 26,511 12-Dec-94 19-Dec-94 2 1599 0.1388 0.07

6-1-2-1-11 Mercedhatchery

18-Nov-94 N/A N/A 48,889 169 10-Dec-94 11-Jan-95 5 5639 0.1187 0.11 2058 565 135

6-1-2-1-12 Mercedhatchery

N/A N/A 48,943 164 18-Dec-94 24-Jan-95 4 6634 0.1212 0.09 996 498 114

6-46-22 Mercedhatchery

N/A N/A 7,600 169 19-Dec-94 19-Dec-94 1 200 0.1389 0.12 264 91 6

Total 28-Nov-94 56,543 18-Dec-94 24-Jan-95 5 6634 0.1212 0.09

6-1-11-4-1 UpperMerced(MRFF)

51 51 28,349 84 8-May-95 29-May-95 5 4216 0.1331 0.17 348 108 228

6-1-11-4-2 UpperMerced(MRFF)

51 51 27,961 84 21-May-95 13-Jun-95 3 4796 0.1388 0.10 300 146 192

6-1-11-4-3 UpperMerced(MRFF)

51 51 26,839 84 28-May-95 12-Jun-95 4 3200 0.1389 0.14 596 193 125

6-1-11-4-4 UpperMerced(MRFF)

51 51 28,138 84 23-May-95 6-Jun-95 6 2996 0.1387 0.20 432 137 115

Total 3-May-95 111,287 8-May-95 13-Jun-95 18 7216 0.1354 0.16

99

6-1-11-4-5 LowerMerced(MRFF)

51 59 27,318 82 21-May-95 3-Jun-95 7 2796 0.1387 0.24 384 136 218

6-1-11-4-6 LowerMerced(MRFF)

51 59 27,643 82 21-May-95 9-Jun-95 4 3996 0.1388 0.14 504 125 177

6-1-11-4-7 LowerMerced(MRFF)

51 59 28,054 82 20-May-95 29-May-95 7 1996 0.1386 0.23 432 150 171

Total 4-May-95 83,015 20-May-95 9-Jun-95 18 4196 0.1388 0.20

6-1-11-3-11 UpperTuolumne(MRFF)

51 48 28,068 86 31-May-95 13-Jun-95 8 2800 0.1389 0.27 696 472 276

6-1-11-3-12 UpperTuolumne(MRFF)

51 48 27,132 86 21-May-95 25-Jun-95 6 6796 0.1311 0.22 660 211 327

6-1-11-3-13 UpperTuolumne(MRFF)

51 48 28,347 86 29-May-95 14-Jun-95 8 3400 0.1389 0.26 804 274 354

Total 4-May-95 83,547 21-May-95 25-Jun-95 22 6796 0.1311 0.26

6-1-11-3-14 LowerTuolumne(MRFF)

48 51 26,007 89 18-May-95 8-Jun-95 5 4396 0.1388 0.18 756 268 305

6-1-11-3-15 LowerTuolumne(MRFF)

48 51 27,290 89 20-May-95 26-Jun-95 7 7196 0.1315 0.25 861 207 295

Total 5-May-95 53,299 18-May-95 26-Jun-95 12 7596 0.1319 0.22

1994

Late-fall run releases

Upper SacramentoRiver and Tributaries

5-33-16 Battle Creek(CNFH)

N/A N/A 52,984 129 18-Jan-94 18-Mar-94 15 5358 0.0620 0.59 48 23 273

5-33-17 Battle Creek(CNFH)

N/A N/A 55,231 122 - - 0 - - 12 4 116

5-34-8 Battle Creek(CNFH)

N/A N/A 67,645 134 31-Jan-94 9-Mar-94 11 3358 0.0614 0.34 36 6 237

5-34-9 Battle Creek(CNFH)

N/A N/A 72,236 130 31-Jan-94 25-Feb-94 8 2362 0.0631 0.23 48 4 217

Total 3-Jan-94 248,096 18-Jan-94 18-Mar-94 34 5358 0.0620 0.29

5-34-11 Battle Creek(CNFH)

N/A N/A 78,506 124 31-Jan-94 9-Mar-94 7 3358 0.0614 0.19 24 2 150

5-34-12 Battle Creek(CNFH)

N/A N/A 69,894 129 2-Feb-94 18-Mar-94 6 3958 0.0611 0.18 24 15 221

5-34-13 Battle Creek(CNFH)

N/A N/A 78,561 136 28-Jan-94 7-Mar-94 22 3362 0.0599 0.61 72 18 466

5-34-14 Battle Creek(CNFH)

N/A N/A 65,609 128 2-Feb-94 23-Feb-94 3 1962 0.0619 0.10 24 8 227

Total 4-Jan-94 292,570 28-Jan-94 18-Mar-94 38 4358 0.0605 0.28

100

5-34-15 Battle Creek(CNFH)

N/A N/A 54,248 123 28-Jan-94 15-Mar-94 13 3958 0.0585 0.53 144 0 220

5-34-10 Battle Creek(CNFH)

N/A N/A 73,882 127 7-Feb-94 15-Mar-94 7 3171 0.0595 0.21 0 4 145

Total 5-Jan-94 128,130 28-Jan-94 15-Mar-94 20 3958 0.0585 0.35

Sacramento-SanJoaquin Estuary

6-45-21 Georgiana Sl.(CNFH)

2-Dec-93 N/A N/A 33,668 119 12-Dec-93 4-Mar-94 5 8337 0.0698 0.28 169 79 79

6-45-22 Ryde (CNFH) 2-Dec-93 N/A N/A 34,929 129 6-Dec-93 16-Mar-94 37 10553 0.0726 1.90 0 10 287

5-34-17 Clifton CourtF. (CNFH)

2-Dec-93 N/A N/A 12,960 124 1-Dec-93 9-Dec-93 4 1597 0.1232 0.33 0 3 16

Fall run releases

Upper SacramentoRiver and Tributaries

6-1-6-1-1 Feather River(FRH)

16-Mar-94 49 N/A 103,558 61 15-Apr-94 6-May-94 6 4314 0.1362 0.06 0 0 189

5-1-1-9-8 Below RBDD(CNFH)

N/A N/A 54,191 45 25-Apr-94 29-Apr-94 2 1000 0.1389 0.03 0 0 24

5-1-1-9-9 Below RBDD(CNFH)

N/A N/A 57,084 45 23-Apr-94 28-Apr-94 3 1200 0.1389 0.05 0 0 52

Total 10-Mar-94 111,275 23-Apr-94 29-Apr-94 5 1400 0.1389 0.04

5-34-27 Coleman(CNFH)

N/A N/A 54,892 64 28-Apr-94 1-May-94 2 800 0.1389 0.03 0 0 139

5-34-28 Coleman(CNFH)

N/A N/A 53,430 71 28-Apr-94 8-May-94 8 2200 0.1389 0.14 0 0 251

5-34-29 Coleman(CNFH)

N/A N/A 52,483 76 24-Apr-94 8-May-94 12 3000 0.1389 0.21 0 0 416

Total 14-Apr-94 160,805 24-Apr-94 8-May-94 22 3000 0.1389 0.13

6-1-6-1-2 Feather River(FRH)

2-May-94 49 N/A 100,377 81 14-May-94 14-May-94 1 200 0.1389 0.01 0 0 97

Sacramento-SanJoaquin Estuary

6-57-62 MokelumneRiver (MOK)

19-Oct-93 N/A N/A 52,398 135 10-Nov-93 10-Nov-93 3 200 0.1389 0.05 36 55 271

6-57-63 Mokelumne 20-Oct-93 N/A N/A 52,398 135 9-Nov-93 10-Nov-93 2 400 0.1389 0.04 122 52 346

101

River (MOK)

6-1-14-3-14 Lower OldRiver (FRH)

11-Apr-94 55 62 50,032 74 - - 0 - - 84 6 3

6-1-14-3-15 Mossdale(FRH)

11-Apr-94 53 63 51,084 74 - - 0 - - 636 69 62

6-1-14-4-1 Ryde (FRH) 12-Apr-94 54 63 51,819 76 19-Apr-94 1-May-94 11 2600 0.1389 0.20 0 0 375

6-1-14-4-2 Georgiana Sl. (FRH)

12-Apr-94 55 62 51,485 77 20-Apr-94 25-Apr-94 3 1200 0.1389 0.05 0 0 214

6-1-14-4-3 Jersey Point(FRH)

13-Apr-94 57 64 50,689 72 23-Apr-94 3-May-94 10 2200 0.1389 0.18 12 2 410

6-1-14-4-6 Ryde (FRH) 25-Apr-94 54 62 56,139 76 27-Apr-94 11-May-94 10 3000 0.1389 0.17 0 0 664

6-1-14-4-7 Georgiana Sl.(FRH)

25-Apr-94 53 62 50,235 73 3-May-94 20-May-94 6 3600 0.1389 0.11 0 0 151

6-1-14-4-5 Lower OldRiver (FRH)

26-Apr-94 51 62 50,259 76 - - 0 - - 72 4 5

6-1-14-4-4 Mossdale(w/barrier)(FRH)

26-Apr-94 49 60 50,726 77 11-May-94 14-May-94 2 800 0.1389 0.04 0 0 87

6-1-14-4-8 Jersey Point(FRH)

27-Apr-94 51 63 53,810 78 2-May-94 22-May-94 16 4200 0.1389 0.28 0 0 748

6-31-41 Mossdale(w/barrier)(FRH)

2-May-94 53 66 51,632 82 - - 0 - - 12 24 40

6-31-42 Miller Park(FRH)

3-May-94 52 67 53,232 83 7-May-94 15-May-94 4 1800 0.1389 0.07 0 0 219

6-25-17 Benecia(FRH)

4-May-94 102,991 88 - - 0 - - 0 0 3341

6-31-43 Mossdale(w/barrier)(FRH)

9-May-94 51 68 53,880 88 22-May-94 22-May-94 1 200 0.1389 0.02 0 12 31

6-48-3 New HopeLanding(MOK)

N/A 68 53,606 87 15-May-94 26-May-94 5 2340 0.1354 0.09 0 12 135

6-48-4 New HopeLanding(MOK)

N/A 68 49,864 92 15-May-94 31-May-94 6 3340 0.1364 0.11 12 18 169

102

Total 10-May-94 103,470 15-May-94 31-May-94 11 3160 0.1291 0.11

6-31-44 Benicia(FRH)

10-May-94 58 67 54,297 87 - - 0 - - 0 0 1154

6-48-1 New HopeLanding(MOK)

N/A 67 51,314 97 27-May-94 31-May-94 9 1000 0.1389 0.16 0 0 386

6-48-2 New HopeLanding(MOK)

N/A 67 51,418 96 27-May-94 6-Jun-94 10 2200 0.1389 0.18 0 2 355

Total 23-May-94 102,732 27-May-94 6-Jun-94 19 2200 0.1389 0.17

6-31-45 Miller Park(FRH)

24-May-94 49 71 49,976 91 - - 0 - - 0 0 10

6-31-46 Benicia(FRH)

31-May-94 N/A N/A 51,804 88 - - 0 - - 0 0 1453

Upper San JoaquinRiver and Tributaries

6-45-16 Mercedhatchery

55 55 32,891 165 14-Dec-93 2-May-94 3 15247 0.0756 0.16 1753 205 223

6-45-17 Mercedhatchery

55 55 35,064 165 1-Apr-94 1-Apr-94 1 200 0.1389 0.03 1549 173 206

Total 5-Nov-93 67,955 14-Dec-93 2-May-94 4 15247 0.0756 0.10

6-1-11-2-10 Mercedhatchery

53 51 28,315 88 1-May-94 2-May-94 2 400 0.1389 0.07 24 8 54

6-1-11-2-11 Mercedhatchery

53 51 25,328 88 1-May-94 1-May-94 1 200 0.1389 0.04 48 1 149

6-1-11-2-12 Mercedhatchery

53 51 28,532 88 1-May-94 8-May-94 2 1600 0.1389 0.07 24 28 80

6-1-11-2-13 Mercedhatchery

53 51 17,390 88 15-May-94 15-May-94 1 200 0.1389 0.05 24 46 48

Total 22-Apr-94 99,565 1-May-94 15-May-94 6 3000 0.1389 0.06

6-1-11-2-14 LowerMerced(MRFF)

48 62 35,017 87 - - 0 - - 24 15 103

6-1-11-2-15 LowerMerced(MRFF)

48 62 23,324 87 1-May-94 3-May-94 2 600 0.1389 0.08 48 4 43

6-1-11-3-1 LowerMerced(MRFF)

48 62 23,750 87 - - 0 - - 0 0 86

Total 22-Apr-94 82,091 1-May-94 3-May-94 2 600 0.1389 0.02

6-1-11-3-2 UpperTuolumne(MRFF)

53 51 58,859 85 5-May-94 14-May-94 2 2000 0.1389 0.03 12 6 86

6-1-11-3-3 Upper 53 51 4,281 85 12-May-94 12-May-94 1 200 0.1389 0.22 12 22 86

103

Tuolumne(MRFF)

6-1-11-3-4 UpperTuolumne(MRFF)

53 51 20,274 85 - - 0 - - 0 4 82

Total 23-Apr-94 83,414 5-May-94 14-May-94 3 2000 0.1389 0.03

6-1-11-3-5 LowerTuolumne(MRFF)

48 62 36,429 82 6-May-94 6-May-94 1 200 0.1389 0.03 48 0 109

6-1-11-3-6 LowerTuolumne(MRFF)

48 62 13,626 82 8-May-94 8-May-94 1 200 0.1389 0.07 24 14 48

Total 24-Apr-94 50,055 6-May-94 8-May-94 2 600 0.1389 0.04

1993

Late-fall run releases

Upper SacramentoRiver and Tributaries5-31-21 Battle Creek

(CNFH)N/A N/A 62,121 N/A - - 0 - - 12 254 600

5-31-22 Battle Creek(CNFH)

N/A N/A 155,214 N/A - - 0 - - 24 574 1518

5-28-59 Battle Creek(CNFH)

N/A N/A 52,245 N/A - - 0 - - 0 93 436

5-28-62 Battle Creek(CNFH)

N/A N/A 52,666 N/A - - 0 - - 0 72 369

Total 4-Jan-93 322,246

Fall run releases

Upper SacramentoRiver and Tributaries

5-1-1-8-1 Below RBDD(CNFH)

N/A N/A 60,509 53 18-Apr-93 6-May-93 22 3679 0.1345 0.35 0 0 439

5-1-1-8-2 Below RBDD(CNFH)

N/A N/A 63,238 53 19-Apr-93 14-May-93 21 5079 0.1357 0.32 0 0 433

Total 10-Mar-93 123,747 18-Apr-93 14-May-93 43 5279 0.1358 0.33

6-1-14-11-1 Battle Creek(CNFH)

N/A 50 31,665 72 22-Apr-93 8-May-93 18 3313 0.1353 0.55 0 4 586

6-1-14-11-2 Battle Creek(CNFH)

N/A 50 28,676 72 21-Apr-93 8-May-93 27 3513 0.1355 0.90 12 6 508

Total 13-Apr-93 59,076 21-Apr-93 8-May-93 45 3493 0.1348 0.73

5-1-1-8-3 Battle Creek(CNFH)

N/A 54 60,361 62 5-May-93 7-Jun-93 22 6615 0.1351 0.35 0 0 808

5-1-1-8-4 Battle Creek N/A 54 61,615 75 3-May-93 2-Jun-93 57 6015 0.1347 0.89 0 0 1283

104

(CNFH)5-1-1-8-5 Battle Creek

(CNFH)N/A 54 61,981 79 3-May-93 28-May-93 51 5220 0.1394 0.77 0 0 1363

Total 26-Apr-93 183,957 3-May-93 7-Jun-93 130 6995 0.1349 0.68

Sacramento-SanJoaquin Estuary

6-1-14-3-6 Mossdale(FRH)

6-Apr-93 52 64 50,016 59 26-Apr-93 20-May-93 2 4936 0.1371 0.04 1272 52 38

6-1-14-3-8 Lower OldRiver (FRH)

13-Apr-93 56 62 52,747 64 - - 0 - - 564 174 39

6-1-14-3-5 Benicia (splitrelease)(FRH)

7&15-Apr-93

55 60,61 53,066 58 14-Apr-93 12-May-93 12 5697 0.1364 0.22 0 0 434

6-1-14-3-9 Ryde (FRH) 14-Apr-93 57 58 53,265 61 23-Apr-93 22-May-93 23 5936 0.1374 0.41 0 0 527

6-1-14-3-10 Georgiana Sl.(FRH)

14-Apr-93 55 58 53,857 63 2-May-93 17-May-93 7 3140 0.1363 0.12 24 0 204

6-1-14-3-7 Benicia(FRH)

15-Apr-93 53 61 49,335 63 28-Apr-93 23-May-93 5 - - 0 0 531

6-1-14-11-4 Clifton CourtF. (FRH)

21-Apr-93 57 67 25,899 69 - - 0 - - 0 84 0

6-1-14-3-11 Miller Park(FRH)

23-Apr-93 53 61 54,454 68 1-May-93 25-May-93 36 4940 0.1372 0.63 12 0 769

6-1-14-11-3 Rio Vista(FRH)

26-Apr-93 54 61 28,056 69 29-Apr-93 18-Jun-93 19 9868 0.1344 0.66 24 0 326

6-1-14-3-12 Mossdale(FRH)

28-Apr-93 57 64 55,742 71 7-May-93 16-May-93 4 2020 0.1403 0.07 1044 60 94

6-1-14-3-13 Miller Park(FRH)

3-May-93 56 62 51,574 71 7-May-93 1-Jun-93 23 5015 0.1339 0.43 24 0 685

6-31-35 Mossdale(FRH)

4-May-93 52 61 51,937 72 11-May-93 21-May-93 4 2220 0.1402 0.07 900 78 111

6-63-41 New HopeLanding(MOK)

N/A 63 50,403 78 13-May-93 27-May-93 15 3020 0.1398 0.28 12 12 298

6-63-42 New HopeLanding(MOK)

N/A 63 50,040 78 14-May-93 4-Jun-93 13 4215 0.1330 0.25 12 0 311

Total 6-May-93 100,443 13-May-93 4-Jun-93 28 4395 0.1327 0.27

105

6-31-37 Ryde (FRH) 10-May-93 59 59 49,699 75 13-May-93 30-May-93 43 3400 0.1312 0.86 0 0 1115

6-31-36 Georgiana Sl.(FRH)

10-May-93 62 65 51,560 75 15-May-93 6-Jun-93 15 4395 0.1327 0.29 36 15 356

6-31-38 Mossdale(FRH)

12-May-93 56 65 52,616 75 19-May-93 22-May-93 4 800 0.1389 0.07 1320 134 88

6-63-40

6-46-51

6-63-43 New HopeLanding(MOK)

N/A 64 49,543 87 28-May-93 2-Jun-93 4 995 0.1152 0.09 60 0 388

6-63-44 New HopeLanding(MOK)

N/A 64 49,719 87 27-May-93 2-Jun-93 6 1195 0.1186 0.13 60 0 391

Total 20-May-93 99,262 27-May-93 2-Jun-93 10 1195 0.1186 0.11

6-31-39 Miller Park(FRH)

21-May-93 51 65 49,786 80 25-May-93 17-Jun-93 18 4592 0.1329 0.35 0 0 563

6-31-40 Miller Park(FRH)

28-May-93 55 64 50,116 82 31-May-93 17-Jun-93 40 3592 0.1386 0.75 0 16 1177

1992

Fall Run Releases

Upper SacramentoRiver and Tributaries

5-28-12 Battle Creek(CNFH)

N/A N/A 54,433 79 29-Apr-92 21-May-92 8 4508 0.1361 0.14 0 0 51

5-28-13 Battle Creek(CNFH)

N/A N/A 49,507 76 25-Apr-92 20-May-92 9 5128 0.1370 0.17 0 0 40

5-28-14 Battle Creek(CNFH)

N/A N/A 53,886 69 29-Apr-92 20-May-92 3 4328 0.1366 0.05 0 0 7

Total 14-Apr-92 157,826 25-Apr-92 21-May-92 20 5318 0.1368 0.12

5-28-18 Red Bluff(CNFH)

15-Apr-92 N/A N/A 49,373 75 27-Apr-92 19-May-92 18 4528 0.1367 0.35 0 0 36

5-28-19 Princeton(CNFH)

17-Apr-92 N/A N/A 53,332 74 24-Apr-92 3-May-92 24 1992 0.1383 0.42 2 0 154

Sacramento-San

106

Joaquin Estuary

6-1-14-2-11 Ryde (FRH) 6-Apr-92 54 64 53,630 77 11-Apr-92 24-Apr-92 78 2796 0.1387 1.36 34 0 360

6-1-14-2-10 Georgiana Sl.(FRH)

6-Apr-92 55 64 51,846 74 14-Apr-92 25-Apr-92 23 2396 0.1387 0.42 4 10 144

6-1-14-2-12 Mossdale(FRH)

58 64 54,073 78 13-Apr-92 5-May-92 9 4588 0.1385 0.16 2603 25 45

6-1-14-2-13 Mossdale(FRH)

58 64 53,030 79 13-Apr-92 1-May-92 11 3788 0.1385 0.19 2777 46 31

Total 7-Apr-92 107,103 13-Apr-92 5-May-92 20 4588 0.1385 0.18

6-1-14-2-14 Mossdale(FRH)

55 63 53,754 81 16-Apr-92 27-Apr-92 10 2396 0.1387 0.17 1734 37 8

6-1-14-2-15 Mossdale(FRH)

55 63 49,958 82 21-Apr-92 1-May-92 3 2190 0.1383 0.06 1651 64 12

Total 13-Apr-92 103,712 16-Apr-92 1-May-92 13 3188 0.1384 0.12

6-1-14-3-1 Ryde (FRH) 14-Apr-92 55 63 42,534 82 17-Apr-92 7-May-92 97 (1) 4188 0.1385 2.14 0 0 464 (1)

6-1-14-3-2 Georgiana Sl.(FRH)

14-Apr-92 55 64 52,374 81 17-Apr-92 6-May-92 41 3988 0.1385 0.73 8 12 240

6-63-38 New HopeLanding(MOK)

21-Apr-92 52 66 100,508 110 29-Apr-92 14-May-92 15 3128 0.1358 0.14 8 4 17

6-1-14-3-3 Mossdale(w/barrier)(FRH)

60 69 53,294 85 3-May-92 6-May-92 7 800 0.1389 0.12 24 15 28

6-1-14-3-4 Mossdale(w/barrier)(FRH)

61 69 51,445 83 4-May-92 19-May-92 2 3136 0.1361 0.04 4 13 15

Total 24-Apr-92 104,739 3-May-92 19-May-92 9 3338 0.1364 0.08

6-31-29 Ryde (FRH) 27-Apr-92 57 67 53,099 81 29-Apr-92 28-May-92 93 5863 0.1357 1.68 0 0 217

6-31-30 Georgiana Sl.(FRH)

27-Apr-92 57 67 51,914 83 1-May-92 10-May-92 11 1940 0.1347 0.20 4 1 35

5-28-30 Benicia(CNFH)

28-Apr-92 N/A N/A 54,055 80 10-May-92 10-May-92 1 - - 0 0 858

6-31-31 Mossdale(w/barrier)(FRH)

62 71 51,262 85 16-May-92 16-May-92 1 200 0.1389 0.02 12 0 0

6-31-32 Mossdale(w/barrier)(FRH)

62 71 48,455 83 - - 0 - - 16 8 0

Total 4-May-92 99,717 16-May-92 16-May-92 1 200 0.1389 0.01 0.01

107

6-63-39 New HopeLanding(MOK)

6-May-92 N/A 72 102,030 106 12-May-92 19-May-92 6 1598 0.1387 0.06 0 0 29

6-31-33 Mossdale(w/barrier)(FRH)

53 72 52,454 85 - - 0 - - 0 6 6

6-31-34 Mossdale(w/barrier)(FRH)

53 72 52,931 87 21-May-92 23-May-92 2 575 0.1331 0.04 0 6 3

Total 12-May-92 105,385 21-May-92 23-May-92 2 575 0.1331 0.02

1991

Fall Run Releases

Upper SacramentoRiver and Tributaries

5-1-1-1-13 Battle Creek(CNFH)

30-Apr-91 N/A N/A 64,373 78 11-May-91 28-May-91 14 3545 0.1368 0.21 0 0 274

5-1-1-1-12 Red Bluff(CNFH)

1-May-91 N/A N/A 64,118 77 11-May-91 30-May-91 24 3940 0.1368 0.36 0 0 375

5-18-45 Princeton(CNFH)

N/A N/A 12,474 80 14-May-91 19-May-91 4 1200 0.1389 0.30 0 0 28

5-18-47 Princeton(CNFH)

N/A N/A 18,713 80 11-May-91 21-May-91 10 2189 0.1382 0.50 0 0 70

5-18-48 Princeton(CNFH)

N/A N/A 20,792 80 10-May-91 30-May-91 10 4100 0.1356 0.46 0 0 75

Total 3-May-91 51,979 10-May-91 30-May-91 24 4100 0.1356 0.44

Sacramento-SanJoaquin Estuary

6-1-14-1-14 Dos Reis(FRH)

53 60 52,097 80 23-Apr-91 11-May-91 8 3760 0.1374 0.15 1282 2302 31

6-1-14-1-15 Dos Reis(FRH)

53 60 50,902 80 23-Apr-91 2-May-91 9 2000 0.1389 0.17 2302 1244 58

Total 15-Apr-91 102,999 23-Apr-91 11-May-91 17 3760 0.1374 0.16

6-1-14-2-1 Buckley Cove(FRH)

51,128 80 24-Apr-91 6-May-91 15 2600 0.1389 0.27 272 1860 43

6-1-14-2-2 Buckley Cove(FRH)

48,213 78 25-Apr-91 2-May-91 11 1600 0.1389 0.21 66 775 72

Total 16-Apr-91 53 59 99,341 24-Apr-91 6-May-91 26 2600 0.1389 0.24

108

6-1-14-2-3 Empire Tract(FRH)

54 61 48,255 79 24-Apr-91 9-May-91 25 3200 0.1389 0.48 66 792 83

6-1-14-2-4 Empire Tract(FRH)

54 61 47,347 77 24-Apr-91 12-May-91 29 3749 0.1370 0.58 74 609 72

Total 17-Apr-91 95,602 24-Apr-91 12-May-91 54 3749 0.1370 0.54

6-1-14-2-5 L.MokelumneRiver (FRH)

18-Apr-91 53 61 47,289 79 23-Apr-91 3-May-91 79 2200 0.1389 1.56 0 276 141

6-1-14-2-6 Jersey Point(FRH)

19-Apr-91 55 63 52,139 82 23-Apr-91 17-May-91 94 4949 0.1375 1.70 57 274 357

6-48-37 New HopeLanding(MOK)

NA NA 8,257 100 29-Apr-91 6-May-91 4 1600 0.1389 0.45 0 0 23

6-48-38 New HopeLanding(MOK)

NA NA 8,541 100 29-Apr-91 5-May-91 14 1400 0.1389 1.53 0 0 45

6-48-39 New HopeLanding(MOK)

NA NA 8,601 100 29-Apr-91 3-May-91 14 1000 0.1389 1.52 0 0 51

6-48-40 New HopeLanding(MOK)

NA NA 8,641 100 27-Apr-91 3-May-91 12 1400 0.1389 1.30 0 0 32

6-48-41 New HopeLanding(MOK)

NA NA 8,311 100 29-Apr-91 2-May-91 14 800 0.1389 1.58 6 0 22

6-48-42 New HopeLanding(MOK)

NA NA 7,705 100 28-Apr-91 2-May-91 17 1000 0.1389 2.07 0 48 80

6-48-43 New HopeLanding(MOK)

NA NA 8,335 100 28-Apr-91 2-May-91 14 1000 0.1389 1.57 0 12 43

6-48-44 New HopeLanding(MOK)

NA NA 8,614 100 28-Apr-91 2-May-91 12 1000 0.1389 1.30 0 12 10

6-48-45 New HopeLanding(MOK)

NA NA 9,126 100 29-Apr-91 5-May-91 24 1400 0.1389 2.46 0 12 9

6-48-46 New HopeLanding(MOK)

NA NA 8,683 100 28-Apr-91 6-May-91 14 1800 0.1389 1.51 4 28 53

Total 23-Apr-91 84,814 27-Apr-91 6-May-91 139 2000 0.1389 1.53

6-1-14-2-7 Miller Park(FRH)

54 62 51,392 80 1-May-91 6-May-91 34 1200 0.1389 0.62 8 0 354

6-1-14-2-8 Miller Park(FRH)

54 62 51,272 83 30-Apr-91 9-May-91 50 2000 0.1389 0.91 0 0 275

Total 25-Apr-91 102,664 30-Apr-91 9-May-91 84 2000 0.1389 0.77

6-1-14-2-9 Miller Park(FRH)

59 62 53,430 81 27-Apr-91 16-May-91 21 3949 0.1371 0.37 0 0 236

6-31-24 Miller Park(FRH)

59 62 51,086 79 4-May-91 10-May-91 34 1360 0.1349 0.64 1 0 230

109

Total 29-Apr-91 104,516 27-Apr-91 16-May-91 55 3949 0.1371 0.50

6-48-57 New HopeLanding(MOK)

NA NA 10,510 110 12-May-91 21-May-91 6 1989 0.1381 0.54 0 0 21

6-48-58 New HopeLanding(MOK)

NA NA 11,595 110 10-May-91 13-May-91 3 749 0.1300 0.26 0 4 57

6-48-59 New HopeLanding(MOK)

NA NA 10,596 110 11-May-91 16-May-91 7 1189 0.1376 0.62 0 8 13

6-48-60 New HopeLanding(MOK)

NA NA 11,554 110 10-May-91 13-May-91 5 749 0.1300 0.43 0 0 4

6-48-61 New HopeLanding(MOK)

NA NA 11,391 110 10-May-91 18-May-91 4 1749 0.1350 0.34 0 0 33

6-48-62 New HopeLanding(MOK)

NA NA 11,734 110 10-May-91 18-May-91 8 1749 0.1350 0.66 4 0 43

6-48-63 New HopeLanding(MOK)

NA NA 10,797 110 12-May-91 18-May-91 4 1389 0.1378 0.35 0 1 25

6-49-1 New HopeLanding(MOK)

NA NA 10,012 110 11-May-91 18-May-91 8 1589 0.1379 0.75 0 0 7

6-49-2 New HopeLanding(MOK)

NA NA 8,142 110 12-May-91 15-May-91 3 789 0.1370 0.35 0 0 12

6-49-7 New HopeLanding(MOK)

NA NA 5,142 110 12-May-91 13-May-91 2 389 0.1351 0.37 0 0 0

Total 6-May-91 101,473 10-May-91 21-May-91 50 2349 0.1359 0.47

6-31-25 Buckley Cove(FRH)

58 65 49,393 78 11-May-91 30-May-91 7 3940 0.1368 0.13 12 31 57

6-31-26 Buckley Cove(FRH)

58 65 50,427 85 11-May-91 16-May-91 13 1189 0.1376 0.24 40 33 46

Total 6-May-91 99,820 11-May-91 30-May-91 20 3940 0.1368 0.19

6-31-27 L.MokelumneRiver (FRH)

9-May-91 59 65 45,706 84 12-May-91 18-May-91 31 1389 0.1378 0.64 22 13 229

5-1-1-1-4 Benicia(CNFH)

13-May-91 N/A N/A 43,750 88 - - 0 - - 0 0 741

6-31-28 Jersey Point(FRH)

13-May-91 56 61 49,184 86 14-May-91 23-May-91 89 2000 0.1389 1.69 22 0 276

1990

Fall Run Releases

Upper Sacramento River andTributaries (2)

110

5-20-55 Battle Creek(CNFH)

11-May-90 N/A N/A 51,069 80 19-May-90 5-Jun-90 7 2780 0.1073 0.17 0 0 38

5-20-56 Red Bluff(CNFH)

12-May-90 N/A N/A 51,533 82 20-May-90 2-Jun-90 3 1980 0.0982 0.08 0 0 33

5-20-57 Princeton(CNFH)

14-May-90 N/A N/A 52,077 81 20-May-90 22-May-90 5 600 0.1389 0.09 0 0 12

Sacramento-SanJoaquin Estuary

6-1-14-1-8 Dos Reis(FRH)

55 68 53,254 73 26-Apr-90 13-May-90 2 3300 0.1273 0.04 332 566 12

6-1-14-1-7 Dos Reis(FRH)

55 68 52,488 71 12-May-90 15-May-90 2 800 0.1389 0.04 390 478 11

Total 16-Apr-90 105,742 26-Apr-90 15-May-90 4 3700 0.1285 0.04

6-1-14-1-6 Upper OldRiver (FRH)

52,954 72 - - 0 - - 396 845 5

6-1-14-1-5 Upper OldRiver (FRH)

53,313 73 24-Apr-90 1-May-90 2 1340 0.1163 0.04 552 884 9

Total 17-Apr-90 55 70 106,267 24-Apr-90 1-May-90 2 1340 0.1163 0.02

6-1-14-1-9 Jersey Point(FRH)

18-Apr-90 55 63 52,962 71 21-Apr-90 14-May-90 32 4480 0.1296 0.61 30 126 223

6-1-14-1-10 Dos Reis(FRH)

60 68 52,559 74 13-May-90 16-May-90 3 800 0.1389 0.05 18 34 8

6-1-14-1-11 Dos Reis(FRH)

60 68 50,974 75 16-May-90 16-May-90 1 200 0.1389 0.02 36 62 26

Total 2-May-90 103,533 13-May-90 16-May-90 4 800 0.1389 0.04

6-1-14-1-12 Upper OldRiver (FRH)

54 72 51,521 76 16-May-90 16-May-90 1 200 0.1389 0.02 224 477 5

6-1-14-1-13 Upper OldRiver (FRH)

54 72 52,074 78 - - 0 - - 202 443 6

Total 3-May-90 103,595 16-May-90 16-May-90 1 200 0.1389 0.01

6-31-19 Jersey Point(3) (FRH)

4-May-90 59 68 50,143 77 6-May-90 25-May-90 56 3660 0.1271 1.14 14 48 207

6-31-18 Sacramento(3) (FRH)

7-May-90 56 70 48,390 74 11-May-90 1-Jun-90 44 3520 0.1111 1.06 6 0 115

111

6-31-20 Ryde (3)(FRH)

9-May-90 54 69 51,878 79 12-May-90 29-May-90 89 2720 0.1049 2.13 0 0 174

5-20-58 Benicia(CNFH)

22-May-90 N/A N/A 52,446 82 - - 0 - - 0 0 244

6-31-23 Sutter Slough(FRH)

29-May-90 59 63 49,324 83 1-Jun-90 14-Jun-90 39 2760 0.1369 0.75 0 0 222

6-31-21 SteamboatSlough (FRH)

30-May-90 51 63 52,010 86 1-Jun-90 12-Jun-90 58 2380 0.1377 1.05 0 0 319

6-31-22 Ryde (FRH) 31-May-90 51 65 50,837 84 2-Jun-90 11-Jun-90 67 1980 0.1375 1.25 0 0 217

Upper San JoaquinRiver and Tributaries

6-1-11-1-14 UpperTuolumne(MRFF)

56 52 24,134 83 12-May-90 12-May-90 1 200 0.1389 0.04 152 253 12

6-1-11-1-15 UpperTuolumne(MRFF)

56 52 24,259 83 16-May-90 16-May-90 1 200 0.1389 0.04 94 231 5

6-1-11-2-1 UpperTuolumne(MRFF)

56 52 23,494 83 12-May-90 12-May-90 1 200 0.1389 0.04 134 244 0

6-1-11-2-2 UpperTuolumne(MRFF)

56 52 21,766 83 8-May-90 8-May-90 1 200 0.1389 0.04 60 150 0

Total 30-Apr-90 93,653 8-May-90 16-May-90 4 1740 0.1343 0.04

6-1-11-2-3 LowerTuolumne(TRFF)

48 66 27,263 72 12-May-90 12-May-90 1 200 0.1389 0.03 122 266 1

6-1-11-2-4 LowerTuolumne(TRFF)

55 66 26,067 72 - - 0 - - 92 183 17

6-1-11-2-5 LowerTuolumne(TRFF)

48 66 24,905 72 - - 0 - - 102 14 0

Total 1-May-90 78,235 12-May-90 12-May-90 1 200 0.1389 0.01

1989

Fall Run Releases

Upper SacramentoRiver and Tributaries

5-20-37 Battle Creek(CNFH)

8-May-89 N/A N/A 51,074 69 16-May-89 7-Jun-89 13 4178 0.1261 0.26 6 0 84

112

5-20-38 Red Bluff(CNFH)

9-May-89 N/A N/A 52,677 70 16-May-89 8-Jun-89 18 4378 0.1267 0.35 0 0 91

5-20-39 Princeton(CNFH)

10-May-89 N/A N/A 50,842 72 11-May-89 31-May-89 27 3800 0.1257 0.55 12 0 90

Sacramento-SanJoaquin Estuary

6-31-14 Dos Reis(FRH)

20-Apr-89 54 69 52,962 85 27-Apr-89 7-May-89 8 2200 0.1389 0.14 428 2286 34

6-31-13 Upper OldRiver (FRH)

21-Apr-89 54 67 51,972 81 25-Apr-89 4-May-89 5 2000 0.1389 0.09 658 2916 38

6-1-11-1-11 Jersey Point(FRH)

50 64 27,758 70 29-Apr-89 15-May-89 24 3390 0.1385 0.81 0 90 83

6-1-11-1-12 Jersey Point(FRH)

50 64 29,058 70 29-Apr-89 12-May-89 29 2790 0.1384 0.94 12 42 98

Total 24-Apr-89 56,816 29-Apr-89 15-May-89 53 3390 0.1385 0.88

6-1-11-1-7 Dos Reis(MRFF)

62 71 25,089 70 10-May-89 30-May-89 3 3800 0.1257 0.12 12 100 28

6-1-11-1-8 Dos Reis(MRFF)

62 71 25,631 70 8-May-89 24-May-89 7 3390 0.1385 0.26 36 78 32

6-1-11-1-13 Dos Reis(MRFF)

62 71 25,353 70 10-May-89 10-May-89 1 200 0.1389 0.04 36 166 18

Total 2-May-89 76,073 8-May-89 30-May-89 11 4190 0.1265 0.15

6-31-11 Courtland(FRH)

2-May-89 55 61 51,211 87 5-May-89 16-May-89 46 2390 0.1383 0.84 0 26 247

6-1-11-1-4 Upper OldRiver (MRFF)

62 70 25,087 70 8-May-89 8-May-89 1 200 0.1389 0.04 428 74 5

6-1-11-1-5 Upper OldRiver (MRFF)

62 70 24,472 70 9-May-89 9-May-89 1 190 0.1319 0.04 524 22 0

6-1-11-1-6 Upper OldRiver (MRFF)

62 70 24,782 70 8-May-89 15-May-89 2 1590 0.1380 0.08 107 284 11

Total 3-May-89 74,341 8-May-89 15-May-89 4 1590 0.1380 0.05

6-31-12 Ryde (FRH) 3-May-89 54 62 51,046 86 6-May-89 15-May-89 65 1990 0.1382 1.20 0 18 417

6-1-11-1-9 Jersey Point(FRH)

54 68 27,525 73 8-May-89 25-May-89 33 3590 0.1385 1.13 0 508 144

6-1-11-1-10 Jersey Point(FRH)

54 68 28,708 73 8-May-89 22-May-89 25 2990 0.1384 0.82 12 304 141

Total 5-May-89 56,233 8-May-89 25-May-89 58 3590 0.1385 0.97

5-20-40 Benicia 15-May-89 N/A N/A 39,379 72 - - 0 - - 0 0 196

113

(CNFH)

6-31-10 Miller Park(FRH)

1-Jun-89 51 67 52,612 88 5-Jun-89 8-Jun-89 14 800 0.1389 0.25 0 0 81

6-31-8 Courtland(FRH)

2-Jun-89 58 69 50,659 92 5-Jun-89 9-Jun-89 19 1000 0.1389 0.35 0 0 42

6-31-7 Ryde (FRH) 2-Jun-89 56 67 50,601 88 5-Jun-89 14-Jun-89 26 2000 0.1389 0.48 0 0 82

6-31-9 Port Chicago(FRH)

5-Jun-89 50 67 45,446 (5) 90 6-Jun-89 17-Jun-89 40 - - 0 0 180

6-31-15 Miller Park(FRH)

58 70 44,695 84 17-Jun-89 19-Jun-89 11 600 0.1389 0.23 0 0 33

6-31-17 Miller Park(FRH)

58 70 49,909 83 17-Jun-89 19-Jun-89 9 600 0.1389 0.17 0 0 35

Total 14-Jun-89 94,604 17-Jun-89 19-Jun-89 20 600 0.1389 0.20

6-1-14-1-3 Courtland(west) (FRH)

60 71 52,907 85 17-Jun-89 21-Jun-89 17 1000 0.1389 0.30 0 0 47

6-58-5 Courtland(east) (FRH)

57 71 37,813 98 18-Jun-89 22-Jun-89 4 1000 0.1389 0.10 0 0 37

Total 15-Jun-89 90,720 98 17-Jun-89 22-Jun-89 21 1200 0.1389 0.22

6-1-14-1-1 SteamboatSl. (FRH)

13-Jun-89 55 70 51,237 79 15-Jun-89 22-Jun-89 50 1600 0.1389 0.91 0 0 70

6-31-16 Sutter Slough(FRH)

13-Jun-89 57 69 49,762 83 15-Jun-89 29-Jun-89 57 2875 0.1331 1.12 0 0 152

6-1-14-1-2 Ryde (FRH) 16-Jun-89 56 73 51,134 85 19-Jun-89 26-Jun-89 8 1480 0.1285 0.16 0 0 10

6-1-14-1-4 Port Chicago(FRH)

19-Jun-89 54 71 48,329 86 20-Jun-89 22-Jun-89 30 - - 0 0 353

Upper San JoaquinRiver and Tributaries

B6-14-9 UpperStanislaus(MRFF)

50 54 52,445 78 29-Apr-89 11-May-89 3 2590 0.1384 0.05 416 1325 17

B6-14-10 UpperStanislaus(MRFF)

50 54 51,506 78 30-Apr-89 16-May-89 4 3390 0.1385 0.07 408 1060 17

Total 20-Apr-89 103,951 29-Apr-89 16-May-89 7 3590 0.1385 0.06

B6-1-1 Lower 50 65 25,525 76 24-Apr-89 2-May-89 11 1800 0.1389 0.40 260 1152 24

114

Stanislaus(MRFF)

B6-14-11 LowerStanislaus(MRFF)

50 65 48,695 76 24-Apr-89 27-Apr-89 6 800 0.1389 0.12 460 1754 35

Total 19-Apr-89 74,220 24-Apr-89 2-May-89 17 1800 0.1389 0.21

6-1-11-1-1 LowerMerced(MRFF)

56 70 25,357 66 3-May-89 10-May-89 3 1590 0.1380 0.11 236 490 3

6-1-11-1-2 LowerMerced(MRFF)

56 70 25,276 66 15-May-89 15-May-89 1 200 0.1389 0.04 387 324 2

6-1-11-1-3 LowerMerced(MRFF)

56 70 23,832 66 - - 0 - - 192 269 0

Total 21-Apr-89 74,465 3-May-89 15-May-89 4 2590 0.1384 0.05

B6-14-12 LowerStanislaus(MRFF)

3-May-89 68 66 46,169 72 - - 0 - - 680 408 12

1988

Fall Run

Upper SacramentoRiver and Tributaries

5-19-39 Battle Creek(CNFH)

9-May-88 N/A N/A 51,923 84 10-May-88 25-May-88 45 6315 0.2741 0.41 0 0 393

5-19-40 Red Bluff(CNFH)

10-May-88 N/A N/A 52,796 84 10-May-88 25-May-88 37 6315 0.2741 0.33 0 0 468

5-19-41 Princeton(CNFH)

11-May-88 N/A N/A 52,771 85 15-May-88 25-May-88 43 4315 0.2724 0.39 0 0 413

Sacramento-SanJoaquin Estuary

B6-14-2 Courtland(FRH)

51,388 7-May-88 21-May-88 71 5990 0.2773 0.65 42 506 559

B6-14-3 Courtland(FRH)

55,861 7-May-88 25-May-88 83 7515 0.2747 0.70 43 484 631

Total 3-May-88 50 62 107,249 76 7-May-88 25-May-88 154 7515 0.2747 0.68

6-31-1 Ryde (FRH) 4-May-88 51 63 52,741 86 6-May-88 17-May-88 105 4820 0.2789 0.93 0 0 1074

B6-14-6 Miller Park 51,005 8-May-88 23-May-88 77 6330 0.2747 0.71 0 210 574

115

(FRH)B6-14-7 Miller Park

(FRH)51,731 9-May-88 21-May-88 65 5190 0.2772 0.59 4 266 543

Total 5-May-88 54 62 102,736 78 8-May-88 23-May-88 142 6330 0.2747 0.65

B6-14-4 Courtland(FRH)

49 51,274 8-May-88 27-May-88 67 7310 0.2538 0.67 0 220 414

B6-14-5 Courtland(FRH)

51 51,206 10-May-88 21-May-88 80 4790 0.2772 0.73 26 204 521

Total 6-May-88 61 102,480 78 8-May-88 27-May-88 147 7310 0.2538 0.73

6-31-2 Ryde (FRH) 6-May-88 52 61 53,238 88 8-May-88 18-May-88 145 (6) 4400 0.2778 1.27 0 0 1324

B6-14-8 Port Chicago(FRH)

11-May-88 54 70 55,265 84 - - 0 - - 0 0 1116

5-18-42 Benicia(CNFH)

17-May-88 N/A N/A 51,651 88 - - 0 - - 0 0 328

6-62-59 Courtland(FRH)

51 73 54,997 87 23-Jun-88 29-Jun-88 25 2800 0.2778 0.21 0 0 551

6-62-60 Courtland(FRH)

51 73 51,904 87 23-Jun-88 3-Jul-88 14 4400 0.2778 0.13 0 0 488

Total 21-Jun-88 106,901 23-Jun-88 3-Jul-88 39 4400 0.2778 0.17

6-62-63 Ryde (FRH) 22-Jun-88 51 75 53,961 84 23-Jun-88 4-Jul-88 46 4800 0.2778 0.40 0 0 250

6-62-61 Miller Park(FRH)

55 74 49,245 89 26-Jun-88 7-Jul-88 7 (7) 3960 0.2292 0.08 0 0 79

6-62-62 Miller Park(FRH)

55 74 48,647 89 26-Jun-88 3-Jul-88 7 (7) 3200 0.2778 0.07 0 0 63

Total 23-Jun-88 97,892 26-Jun-88 7-Jul-88 14 3960 0.2292 0.08

6-62-50 Courtland(FRH)

24-Jun-88 53 76 99,827 74 28-Jun-88 3-Jul-88 5 2400 0.2778 0.02 0 0 71

6-31-5 SteamboatSlough (FRH)

55 76 49,342 88 26-Jun-88 3-Jul-88 39 3200 0.2778 0.37 0 0 183

6-31-6 SteamboatSlough (FRH)

55 76 47,975 88 25-Jun-88 1-Jul-88 40 2800 0.2778 0.39 0 0 207

Total 24-Jun-88 97,317 25-Jun-88 3-Jul-88 79 3600 0.2778 0.38

6-31-3 Ryde (FRH) 25-Jun-88 50 74 53,942 88 26-Jun-88 1-Jul-88 39 2400 0.2778 0.34 0 0 286

116

6-31-4 Port Chicago(FRH)

29-Jun-88 49 76 54,151 91 - - 0 - - 0 0 1032

Upper San JoaquinRiver and Tributaries

B6-11-5 UpperStanislaus(MRFF)

50 55 36,769 78 4-May-88 11-May-88 6 3220 0.2795 0.08 874 2166 35

B6-11-6 UpperStanislaus(MRFF)

50 55 34,906 78 12-May-88 21-May-88 5 3990 0.2771 0.07 838 1952 63

Total 26-Apr-88 71,675 4-May-88 21-May-88 11 7210 0.2782 0.07

B6-11-3 LowerStanislaus(MRFF)

62 66 35,249 79 3-May-88 19-May-88 6 6620 0.2704 0.08 2905 2116 156

B6-11-4 LowerStanislaus(MRFF)

62 66 33,539 79 7-May-88 22-May-88 7 6330 0.2747 0.10 3072 2303 112

Total 26-Apr-88 68,788 3-May-88 22-May-88 13 7750 0.2691 0.09

1987

Fall Run Releases

Upper SacramentoRiver and Tributaries

H6-7-7 Below RBDD(CNFH)

13-Mar-87 N/A N/A 52,977 52 27-Apr-87 11-May-87 4 - - 0 1* 113

B5-4-13 Battle Creek(CNFH)

12-Mar-87 N/A N/A 51,075 51 21-Apr-87 30-Apr-87 5 - - 1* 0 182

5-18-39 Battle Creek(CNFH)

12-May-87 N/A N/A 51,706 84 18-May-87 21-May-87 10 790 0.1372 0.18 0 0 458

5-18-40 Red Bluff(CNFH)

13-May-87 N/A N/A 51,807 84 19-May-87 22-May-87 6 790 0.1372 0.11 0 0 367

5-18-41 Princeton(CNFH)

14-May-87 N/A N/A 51,271 84 19-May-87 19-May-87 1 190 0.1319 0.02 0 0 176

Sacramento-SanJoaquin Estuary

H6-7-6 Courtland(CNFH)

5-Mar-87 N/A N/A 48,733 50 26-Apr-87 26-Apr-87 1 - - 4* 3* 28

6-45-3 Upper Old 60 72 31,099 79 30-Apr-87 6-May-87 8 1435 0.1424 0.23 6177 2149 171

117

River (MRFF)6-45-4 Upper Old

River (MRFF)60 72 29,253 79 30-Apr-87 5-May-87 5 1235 0.1429 0.16 5158 2153 149

6-45-5 Upper OldRiver (MRFF)

60 72 30,600 79 30-Apr-87 3-May-87 3 845 0.1467 0.09 6277 2105 179

Total 27-Apr-87 90,952 30-Apr-87 6-May-87 16 1435 0.1424 0.16

6-45-6 Dos Reis(MRFF)

55 70 30,919 80 5-May-87 13-May-87 30 1765 0.1362 0.93 524 1421 376

6-45-7 Dos Reis(MRFF)

55 70 31,634 80 5-May-87 20-May-87 22 3135 0.1361 0.66 472 1451 436

6-45-8 Dos Reis(MRFF)

55 70 30,059 80 5-May-87 12-May-87 28 1565 0.1359 0.89 532 1069 408

Total 27-Apr-87 92,612 5-May-87 20-May-87 80 3135 0.1361 0.83

6-62-53 Courtland(FRH)

57 67 49,781 81 1-May-87 12-May-87 32 2410 0.1395 0.60 27 28 995

6-62-54 Courtland(FRH)

55 67 50,521 81 1-May-87 14-May-87 39 2810 0.1394 0.72 13 114 987

Total 28-Apr-87 100,302 1-May-87 14-May-87 71 2810 0.1394 0.66

6-62-55 Ryde (FRH) 29-Apr-87 50 67 51,103 79 2-May-87 12-May-87 46 2210 0.1395 0.84 0 0 1612

6-62-56 Courtland(FRH)

57 67 49,083 79 4-May-87 15-May-87 20 2365 0.1369 0.39 0 0 739

6-62-57 Courtland(FRH)

55 67 51,836 79 5-May-87 22-May-87 23 3535 0.1364 0.42 7 180 695

Total 1-May-87 100,919 4-May-87 22-May-87 43 3735 0.1365 0.41

6-62-58 Ryde (FRH) 2-May-87 53 64 51,008 80 5-May-87 15-May-87 47 2165 0.1367 0.88 0 0 1038

Upper San JoaquinRiver and Tributaries

6-46-60 UpperTuolumne(MRFF)

58 55 29,959 85 25-Apr-87 1-May-87 2 1395 0.1384 0.06 520 98 33

6-46-61 UpperTuolumne(MRFF)

58 55 30,601 85 - - 0 - - 574 132 31

6-46-62 UpperTuolumne(MRFF)

58 55 29,040 85 28-Apr-87 30-Apr-87 3 595 0.1377 0.10 550 110 27

Total 16-Apr-87 89,600 25-Apr-87 1-May-87 5 1395 0.1384 0.05

6-45-1 LowerTuolumne(MRFF)

50 64 31,866 82 22-Apr-87 4-May-87 5 2640 0.1410 0.14 738 1810 141

6-45-2 Lower 50 64 30,936 82 22-Apr-87 5-May-87 9 2830 0.1404 0.27 934 1702 87

118

Tuolumne(MRFF)

6-46-63 LowerTuolumne(MRFF)

50 64 30,709 82 26-Apr-87 5-May-87 4 2030 0.1410 0.12 868 1451 143

Total 16-Apr-87 93,511 22-Apr-87 5-May-87 18 2830 0.1404 0.18

1986

Fall Run Releases

Upper SacramentoRiver and Tributaries

H6-7-5 Below RBDD(CNFH)

19-Mar-86 N/A N/A 51,426 50 25-Apr-86 8-May-86 7 - - 0 0 429

H5-7-7 Battle Creek(CNFH)

18-Mar-86 N/A N/A 51,371 50 29-Apr-86 17-May-86 8 - - 0 0 221

H5-4-2 Battle Creek(CNFH)

N/A 57 24,933 86 21-May-86 26-May-86 11 1200 0.1389 0.41 0 0 334

H5-4-3 Battle Creek(CNFH)

N/A 57 28,659 86 21-May-86 27-May-86 19 1400 0.1389 0.62 0 0 313

Total 13-May-86 53,592 21-May-86 27-May-86 30 1400 0.1389 0.52

H5-4-4 Below RBDD(CNFH)

N/A 58 26,900 87 21-May-86 31-May-86 9 2200 0.1389 0.31 0 0 365

H5-4-5 Below RBDD(CNFH)

N/A 58 27,606 87 20-May-86 1-Jun-86 17 2600 0.1389 0.58 0 0 442

Total 13-May-86 54,506 20-May-86 1-Jun-86 26 2600 0.1389 0.45

H5-4-6 Princeton(CNFH)

N/A 62 23,669 86 23-May-86 27-May-86 3 1000 0.1389 0.12 0 0 595

H5-4-7 Princeton(CNFH)

N/A 62 22,719 86 19-May-86 22-May-86 7 800 0.1389 0.29 0 0 421

Total 14-May-86 56,388 19-May-86 27-May-86 10 1800 0.1389 0.17

Sacramento-SanJoaquin Estuary

H6-6-7 Courtland(CNFH)

27-Feb-86 N/A N/A 50,961 45 19-Apr-86 19-Apr-86 1 - - 0 0 22

H6-7-3 Courtland(CNFH)

10-Mar-86 N/A N/A 53,831 50 17-Apr-86 17-Apr-86 2 - - 0 0 85

H6-7-2 Ryde (CNFH) 14-Mar-86 N/A N/A 52,635 47 - - 0 - - 0 0 83

119

H6-7-4 Ryde (CNFH) 12-Mar-86 N/A N/A 52,748 53 - - 0 - - 0 0 127

6-62-43 Courtland(FRH)

27-May-86 N/A 73 98,866 81 31-May-86 10-Jun-86 39 2198 0.1388 0.37 0 8 1692

6-62-46 South ForkMok. (FRH)

28-May-86 52 68 102,965 77 1-Jun-86 18-Jun-86 24 2978 0.1149 0.26 360 12 984

6-62-47 North ForkMok. (FRH)

29-May-86 60 72 101,949 74 2-Jun-86 18-Jun-86 33 2778 0.1135 0.37 0 0 1306

6-46-58 Dos Reis(MRH)

N/A 68 47,954 96 2-Jun-86 8-Jun-86 13 1398 0.1387 0.25 260 280 1053

B6-11-1 Dos Reis(MRH)

N/A 68 47,641 96 2-Jun-86 7-Jun-86 22 1198 0.1387 0.43 254 244 1015

Total 29-May-86 95,595 2-Jun-86 8-Jun-86 35 1398 0.1387 0.34

6-62-48 Ryde (FRH) 30-May-86 56 74 101,320 81 1-Jun-86 13-Jun-86 74 2598 0.1388 0.68 0 0 1979

6-46-59 Upper OldRiver (MRFF)

N/A 70 49,434 96 1-Jun-86 6-Jun-86 10 1198 0.1387 0.19 2072 1096 586

B6-11-2 Upper OldRiver (MRFF)

N/A 70 50,747 96 1-Jun-86 3-Jun-86 11 600 0.1389 0.20 2616 1428 554

Total 30-May-86 100,181 1-Jun-86 6-Jun-86 21 1198 0.1387 0.20

6-62-49 Lower OldRiver (FRH)

31-May-86 60 74 98,869 78 2-Jun-86 8-Jun-86 25 1398 0.1387 0.24 3192 2998 645

6-62-52 Fort Baker(FRH)

3-Jun-86 N/A N/A 49,583 73 - - 0 - - 0 0 1807

6-62-51 Port Chicago(FRH)

2-Jun-86 56 62 47,995 75 6-Jun-86 10-Jun-86 4 - - 0 0 1382

Upper San JoaquinRiver and Tributaries

6-46-54 UpperTuolumne(MRFF)

N/A 51 49,630 81 25-Apr-86 27-May-86 17 5557 0.1169 0.38 1406 1187 996

6-46-55 UpperTuolumne(MRFF)

N/A 51 49,518 81 23-Apr-86 21-May-86 18 4557 0.1091 0.43 1906 2125 946

Total 14-Apr-86 99,148 23-Apr-86 27-May-86 35 5757 0.1142 0.40

120

6-46-56 LowerTuolumne(MRFF)

N/A 51 51,300 80 23-Apr-86 7-May-86 10 1780 0.0824 0.31 1952 1247 992

6-46-57 LowerTuolumne(MRFF)

N/A 51 52,174 80 25-Apr-86 10-May-86 10 2180 0.0946 0.26 1512 1208 1066

Total 14-Apr-86 103,474 23-Apr-86 10-May-86 20 2380 0.0918 0.27

6-46-48 UpperStanislaus(MRFF)

N/A 52 31,120 86 3-May-86 16-Jun-86 17 8375 0.1292 0.55 1018 370 393

6-46-49 UpperStanislaus(MRFF)

N/A 52 31,148 86 5-May-86 20-May-86 11 3177 0.1379 0.33 1144 304 433

6-46-50 UpperStanislaus(MRFF)

N/A 52 24,751 86 7-May-86 7-Jun-86 4 6375 0.1383 0.15 744 434 343

6-46-53 UpperStanislaus(MRFF)

N/A 52 21,254 86 8-May-86 11-Jun-86 5 6975 0.1384 0.22 612 262 288

Total 28-Apr-86 108,273 3-May-86 16-Jun-86 37 8375 0.1292 0.34

6-46-45 LowerStanislaus(MRFF)

N/A 58 31,491 89 5-May-86 15-May-86 16 2197 0.1387 0.48 1355 1224 661

6-46-46 LowerStanislaus(MRFF)

N/A 58 31,310 89 5-May-86 25-May-86 18 4177 0.1381 0.54 1378 948 515

6-46-47 LowerStanislaus(MRFF)

N/A 58 30,530 89 3-May-86 18-May-86 20 2977 0.1292 0.66 1162 1598 672

6-46-52 LowerStanislaus(MRFF)

N/A 58 12,768 89 5-May-86 18-May-86 6 2777 0.1377 0.44 560 644 306

Total 29-Apr-86 106,169 3-May-86 25-May-86 60 4377 0.1322 0.56

1985

Fall Run Releases

Upper SacramentoRiver and Tributaries

H5-3-7 Battle Creek(CNFH)

N/A N/A 29,136 47 - - 0 - - 0 0 13

H5-4-1 Battle Creek(CNFH)

N/A N/A 23,045 47 - - 0 - - 0 0 10

Total 31-Mar-85 52,181

H6-5-5 Below RBDD(CNFH)

14-Feb-85 N/A N/A 49,155 47 - - 0 - - 0 2* 74

H6-6-5 Below RBDD(CNFH)

14-Mar-85 N/A N/A 52,313 48 - - 0 - - 0 0 198

121

5-39-4 Battle Creek(CNFH)

N/A N/A 11,484 80 21-May-85 23-May-85 2 600 0.1389 0.16 0 0 0

5-40-4 Battle Creek(CNFH)

N/A N/A 10,698 82 22-May-85 25-May-85 2 800 0.1389 0.17 0 0 21

5-41-4 Battle Creek(CNFH)

N/A N/A 10,330 80 21-May-85 23-May-85 3 600 0.1389 0.27 0 0 8

H5-1-5 Battle Creek(CNFH)

N/A N/A 22,558 80 20-May-85 22-May-85 3 600 0.1389 0.12 0 0 32

5-6-16 Battle Creek(CNFH)

N/A N/A 10,209 80 24-May-85 24-May-85 1 200 0.1389 0.09 0 0 0

Total 14-May-85 65,279 20-May-85 25-May-85 11 1200 0.1389 0.16

5-9-47 Below RBDD(CNFH)

N/A N/A 21,871 82 21-May-85 24-May-85 2 800 0.1389 0.09 0 0 30

5-42-4 Below RBDD(CNFH)

N/A N/A 10,610 82 21-May-85 31-May-85 5 2200 0.1389 0.44 0 0 47

5-43-4 Below RBDD(CNFH)

N/A N/A 9,756 82 22-May-85 23-May-85 3 400 0.1389 0.29 0 0 28

H5-1-6 Below RBDD(CNFH)

N/A N/A 23,378 82 22-May-85 24-May-85 9 600 0.1389 0.36 0 0 27

Total 14-May-85 65,615 21-May-85 31-May-85 19 2200 0.1389 0.27

5-9-48 Princeton(CNFH)

N/A N/A 21,943 82 21-May-85 24-May-85 3 800 0.1389 0.13 0 0 69

5-9-49 Princeton(CNFH)

N/A N/A 20,460 82 21-May-85 22-May-85 3 400 0.1389 0.14 0 0 68

H5-1-7 Princeton(CNFH)

N/A N/A 23,519 82 20-May-85 22-May-85 3 600 0.1389 0.12 0 0 34

Total 15-May-85 65,922 20-May-85 24-May-85 9 1000 0.1389 0.13

Sacramento-SanJoaquin Estuary

H6-5-6 Courtland(CNFH)

19-Feb-85 N/A N/A 51,201 48 - - 0 - - 0 0 103

H6-6-4 Courtland(CNFH)

7-Mar-85 N/A N/A 51,985 46 - - 0 - - 0 (3) 6* 89

H6-6-1 South ForkMok. (CNFH)

26-Feb-85 N/A N/A 50,052 48 - - 0 - - 2* (2) 1* 69

H6-6-2 North ForkMok. (CNFH)

28-Feb-85 N/A N/A 51,145 46 - - 0 - - 0 (1) 3* 78

H6-5-7 Ryde (CNFH) 21-Feb-85 N/A N/A 49,183 47 - - 0 - - 0 0 83

H6-6-3 Ryde (CNFH) 5-Mar-85 N/A N/A 50,550 47 - - 0 - - 1* (2) 8* 98

6-62-42 Lower Old 8-May-85 54 68 105,289 84 11-May-85 25-May-85 20 3000 0.1389 0.18 5136 9638 232

122

River (FRH)

6-62-34 South ForkMok. (FRH)

7-May-85 48 64 100,386 75 14-May-85 27-May-85 25 2800 0.1389 0.23 80 9 317

6-62-36 North ForkMok. (FRH)

9-May-85 54 65 101,236 77 14-May-85 27-May-85 30 2800 0.1389 0.28 10 4 656

6-62-38 Courtland(FRH)

60 64 54,457 78 14-May-85 25-May-85 23 2400 0.1389 0.40 0 0 230

6-62-39 Courtland(FRH)

60 64 14,731 78 14-May-85 25-May-85 2 2400 0.1389 0.13 0 0 24

6-62-40 Courtland(FRH)

60 64 10,887 78 14-May-85 25-May-85 3 2400 0.1389 0.26 0 0 49

6-62-41 Courtland(FRH)

60 64 20,551 78 14-May-85 25-May-85 9 2400 0.1389 0.41 0 0 83

Total 10-May-85 100,626 14-May-85 25-May-85 37 2400 0.1389 0.34

6-62-35 Ryde (FRH) 11-May-85 51 66 107,161 78 14-May-85 25-May-85 88 2400 0.1389 0.77 0 0 926

6-62-45 Port Chicago(FRH)

13-May-85 58 66 48,143 76 14-May-85 27-May-85 8 - - 0 0 465

6-62-44 Fort Baker(FRH)

14-May-85 N/A N/A 47,518 N/A - - 0 - - 0 0 537

1984

Fall Run Releases

Upper SacramentoRiver and Tributaries

H6-4-4 Below RBDD(CNFH)

1-Mar-84 N/A N/A 43,883 45 - - 0 - - 1* 0 124

H6-5-4 Below RBDD(CNFH)

24-Mar-84 N/A N/A 47,855 50 - - 0 - - 0 0 234

6-60-42 Battle Creek(CNFH)

N/A N/A 50,742 90 16-May-84 23-May-84 19 730 0.0634 0.77 0 0 920

6-60-43 Battle Creek(CNFH)

N/A N/A 49,479 90 16-May-84 23-May-84 16 730 0.0634 0.66 0 0 855

Total 9-May-84 100,221 16-May-84 23-May-84 35 730 0.0634 0.72

6-60-40 Below RBDD(CNFH)

N/A N/A 51,948 90 15-May-84 23-May-84 29 890 0.0687 1.06 0 0 1055

6-60-41 Below RBDD(CNFH)

N/A N/A 50,921 90 15-May-84 23-May-84 29 890 0.0687 1.08 0 0 1151

123

Total 9-May-84 102,869 15-May-84 23-May-84 58 890 0.0687 1.07

6-60-38 KnightsLanding(CNFH)

N/A N/A 49,400 90 13-May-84 23-May-84 19 930 0.0587 0.85 0 0 953

6-60-39 KnightsLanding(CNFH)

N/A N/A 49,351 90 15-May-84 23-May-84 17 890 0.0687 0.65 0 0 1002

Total 9-May-84 98,751 13-May-84 23-May-84 36 930 0.0587 0.81

Sacramento-SanJoaquin Estuary

H6-4-5 Courtland(CNFH)

5-Mar-84 N/A N/A 48,460 45 - - 0 - - 0 0 67

H6-5-3 Courtland(CNFH)

21-Mar-84 N/A N/A 48,157 48 - - 0 - - 0 0 179

H6-4-6 Ryde (CNFH) 8-Mar-84 N/A N/A 45,465 49 - - 0 - - 4* 0 82

H6-5-2 Ryde (CNFH) 19-Mar-84 N/A N/A 46,767 49 - - 0 - - 4* 0 142

H6-5-1 South ForkMok. (CNFH)

14-Mar-84 N/A N/A 45,036 49 - - 0 - - 3* 0 39

H6-4-7 North ForkMok. (CNFH)

12-Mar-84 N/A N/A 42,165 50 - - 0 - - 5* 0 61

6-62-27 Courtland(FRH)

11-Jun-84 54 66 62,604 82 14-Jun-84 28-Jun-84 37 2360 0.1093 0.70 0 0 399

6-62-28 South ForkMok. (FRH)

54 67 41,371 77 16-Jun-84 26-Jun-84 25 1720 0.1086 0.72 0 0 289

6-42-8 South ForkMok. (FRH)

54 67 14,916 77 17-Jun-84 22-Jun-84 9 1020 0.1181 0.66 0 0 62

Total 12-Jun-84 56,287 16-Jun-84 26-Jun-84 34 1720 0.1086 0.72

6-62-29 Ryde (FRH) 56 66 44,818 77 16-Jun-84 26-Jun-84 30 2100 0.1326 0.66 0 0 195

6-42-9 Ryde (FRH) 56 66 15,180 77 17-Jun-84 28-Jun-84 8 1900 0.1100 0.62 0 0 73

Total 13-Jun-84 59,998 16-Jun-84 28-Jun-84 38 2100 0.1122 0.73

6-62-32 North ForkMok. (FRH)

14-Jun-84 55 67 59,808 79 18-Jun-84 3-Jul-84 24 2149 0.0933 0.56 0 0 266

6-62-33 Lower Old 15-Jun-84 58 75 64,896 73 20-Jun-84 27-Jun-84 9 1300 0.1128 0.16 48 0 40

124

River (FRH)

6-48-22 Thornton(FRH)

N/A N/A 47,500 77 27-Jun-84 29-Jun-84 6 580 0.1343 0.12 0 0 45

6-48-23 Thornton(FRH)

N/A N/A 47,500 77 26-Jun-84 30-Jun-84 10 940 0.1306 0.21 0 0 34

Total 22-Jun-84 95,000 26-Jun-84 30-Jun-84 16 940 0.1306 0.17

6-62-31 Port Chicago(FRH)

59 72 18,442 80 30-Jun-84 30-Jun-84 9 - - 0 0 93

6-62-37 Port Chicago(FRH)

59 72 23,558 86 30-Jun-84 3-Jul-84 21 - - 0 0 223

Total 29-Jun-84 42,000 30-Jun-84 3-Jul-84 30

6-54-51 Port Chicago(NFH)

23-Jul-84 N/A N/A 50,114 N/A - - 0 - - 0 0 1159

6-54-52 Fort Baker(NFH)

25-Jul-84 N/A N/A 48,677 N/A - - 0 - - 0 0 1461

1983

Fall Run Releases

Upper SacramentoRiver and Tributaries

6-60-36 Battle Creek(CNFH)

N/A N/A 44,382 77 7-Jun-83 24-Jun-83 15 1753 0.0676 0.65 0 0 96

6-60-37 Battle Creek(CNFH)

N/A N/A 43,508 76 7-Jun-83 17-Jun-83 10 1373 0.0867 0.34 0 0 97

Total 2-Jun-83 87,890 7-Jun-83 24-Jun-83 25 1753 0.0676 0.55

6-60-34 Below RBDD(CNFH)

N/A N/A 44,498 76 7-Jun-83 15-Jun-83 16 1193 0.0921 0.51 0 0 22

6-60-35 Below RBDD(CNFH)

N/A N/A 45,343 75 7-Jun-83 21-Jun-83 10 1553 0.0719 0.40 0 0 72

Total 2-Jun-83 89,841 7-Jun-83 21-Jun-83 26 1553 0.0719 0.52

6-60-32 KnightsLanding(CNFH)

N/A N/A 45,986 75 5-Jun-83 15-Jun-83 45 1593 0.1006 1.26 0 0 72

6-60-33 KnightsLanding(CNFH)

N/A N/A 46,099 74 5-Jun-83 21-Jun-83 31 1953 0.0798 1.10 0 0 56

Total 2-Jun-83 92,085 5-Jun-83 21-Jun-83 76 1953 0.0798 1.34

Sacramento-SanJoaquin Estuary

125

H6-3-3 Isleton (FRH) 4-Mar-83 N/A N/A 45,775 44 - - 0 - - 0 0 9

H6-4-2 Isleton (FRH) 29-Mar-83 N/A N/A 47,518 49 8-Apr-83 29-May-83 3 - - 0 0 36

H6-3-4 Courtland(FRH)

9-Mar-83 N/A N/A 48,541 47 19-May-83 19-May-83 1 - - 0 0 14

H6-4-3 Courtland(FRH)

31-Mar-83 N/A N/A 48,501 51 12-Apr-83 24-May-83 6 - - 0 0 62

H6-3-5 LowerMokelumne(FRH)

14-Mar-83 N/A N/A 45,960 N/A 26-Apr-83 26-Apr-83 1 200 0.1389 0.02 0 0 11

H6-4-1 LowerMokelumne(FRH)

24-Mar-83 N/A N/A 47,367 48 15-Apr-83 19-Apr-83 2 380 0.0528 0.10 0 0 41

H6-3-6 Lower OldRiver (FRH)

17-Mar-83 N/A N/A 47,677 49 - - 0 - - 0 0 61

H6-3-7 Lower OldRiver (FRH)

22-Mar-83 N/A N/A 48,580 48 19-May-83 19-May-83 1 - - 0 0 60

6-62-24 Courtland(FRH)

16-May-83 52 60 96,706 79 19-May-83 10-Jun-83 92 3370 0.1018 1.22 0 0 428

6-62-26 Lower OldRiver (FRH)

17-May-83 53 63 89,500 76 22-May-83 10-Jun-83 23 2770 0.0962 0.35 0 0 99

6-62-25 LowerMokelumne(FRH)

19-May-83 56 63 83,435 75 24-May-83 15-Jun-83 72 3183 0.0961 1.17 0 0 270

6-62-23 Isleton (FRH) 20-May-83 57 61 92,693 81 22-May-83 7-Jun-83 95 2350 0.0960 1.39 0 0 368

6-62-30 Port Chicago(FRH)

23-May-83 50 67 43,374 75 - - 0 - - 129

1982

Fall Run Releases

Upper Sacramento Riverand Tributaries

H6-2-2 Below RBDD 5-Feb-82 N/A N/A 41,753 44 13-Apr-82 23-Apr-82 4 - - 0 0 114

126

(CNFH)

H6-2-6 Below RBDD(CNFH)

25-Feb-82 N/A N/A 43,673 44 3-May-82 21-May-82 5 - - 0 0 116

6-60-26 Battle Creek(CNFH)

N/A N/A 42,964 80 13-May-82 7-Jun-82 37 2540 0.0678 1.65 0 0 285

6-60-27 Battle Creek(CNFH)

N/A N/A 41,738 80 13-May-82 24-May-82 27 1920 0.1111 0.76 0 0 467

Total 5-May-82 84,702 13-May-82 7-Jun-82 64 2540 0.0678 1.45

6-60-28 Below RBDD(CNFH)

N/A N/A 44,308 82 13-May-82 15-Jun-82 34 3940 0.0805 1.24 0 0 339

6-60-29 Below RBDD(CNFH)

N/A N/A 43,817 82 10-May-82 24-May-82 35 2120 0.0981 1.06 0 0 390

Total 5-May-82 88,125 10-May-82 15-Jun-82 69 4340 0.0815 1.25

6-60-30 KnightsLanding(CNFH)

N/A N/A 44,735 81 10-May-82 24-May-82 50 2120 0.0981 1.48 0 0 398

6-60-31 KnightsLanding(CNFH)

N/A N/A 44,540 81 10-May-82 24-May-82 41 2120 0.0981 1.22 0 0 304

Total 5-May-82 89,275 10-May-82 24-May-82 91 2120 0.0981 1.35

Sacramento-SanJoaquin Estuary

H6-2-3 Isleton(CNFH)

11-Feb-82 N/A N/A 43,248 44 - - 0 - - 0 0 32

H6-2-7 Isleton(CNFH)

2-Mar-82 N/A N/A 40,508 45 17-May-82 17-May-82 1 - - 0 0 11

H6-2-4 Mouth ofMok. R.(CNFH)

17-Feb-82 N/A N/A 43,849 43 - - 0 - - 0 0 24

H6-3-2 Mouth ofMok. R.(CNFH)

10-Mar-82 N/A N/A 41,470 44 - - 0 - - 0 0 22

Total 85,319

H6-2-5 Berkeley(CNFH)

22-Feb-82 N/A N/A 40,699 44 - - 0 - - 0 0 5

H6-3-1 Berkeley(CNFH)

8-Mar-82 N/A N/A 39,321 44 - - 0 - - 0 0 0

127

6-46-28 Dos Reis(MRFF)

24-Apr-82 N/A N/A 48,227 67 10-May-82 20-May-82 23 1720 0.1086 0.57 0 0 552

6-62-20 DiscoveryPark (FRH)

11-May-82 N/A 60 85,885 78 14-May-82 17-Jun-82 100 4080 0.0810 1.87 0 0 1282

6-62-18 DiscoveryPark (CNFH)

12-May-82 N/A 60 89,780 78 15-May-82 9-Jun-82 136 2580 0.0689 2.86 0 0 1085

6-62-19 Port Chicago(CNFH)

17-May-82 N/A N/A 86,877 76 - - 0 - - 782

6-62-21 DiscoveryPark (FRH)

4-Jun-82 56 68 60,822 76 9-Jun-82 17-Jun-82 30 1520 0.1173 0.55 0 0 392

6-62-22 Port Chicago(FRH)

8-Jun-82 N/A N/A 63,221 72 8-Jun-82 17-Jun-82 41 - - 365

Upper San JoaquinRiver and Tributaries

6-46-17 Merced RiverFish Facility

22-Apr-82 N/A N/A 49,217 68 13-May-82 16-Jun-82 19 4060 0.0806 0.62 24 0 428

1981

Fall Run Releases

Upper SacramentoRiver and Tributaries

H6-1-1 Below RBDD(CNFH)

6-Feb-81 N/A N/A 35,905 41 - - 0 - - 0 0 42

H6-1-5 Below RBDD(CNFH)

28-Feb-81 N/A N/A 47,019 40 11-May-81 11-May-81 2 - - 0 0 65

5-5-58 Coyote Creek(TCFF)

8-May-81 N/A N/A 11,031 89 14-May-81 14-May-81 1 200 0.1389 0.08 0 0 155

5-5-57 Coyote Creek(TCFF)

13-May-81 N/A N/A 10,823 89 21-May-81 21-May-81 3 200 0.1389 0.26 0 0 177

6-60-16 Battle Creek(CNFH)

18-May-81 N/A N/A 86,213 79 26-May-81 28-May-81 5 360 0.0833 0.09 0 0 281

6-60-17 Below RBDD(CNFH)

18-May-81 N/A N/A 84,967 79 26-May-81 28-May-81 8 360 0.0833 0.15 0 0 394

6-60-20 KnightsLanding

N/A N/A 43,059 77 28-May-81 28-May-81 3 160 0.1111 0.08 0 0 175

129

(CNFH)6-60-21 Knights

Landing(CNFH)

N/A N/A 43,562 77 28-May-81 4-Jun-81 2 480 0.0417 0.14 0 0 246

Total 18-May-81 86,621 28-May-81 4-Jun-81 5 480 0.0417 0.18

6-62-13 Feather RiverHatchery

97,438 90 - - 0 - - 0 0 8

6-62-16 Feather RiverHatchery

81,393 89 - - 0 - - 0 0 12

Total 1-Jun-81 55 55 178,831

Sacramento-SanJoaquin Estuary

H6-1-4 Berkeley(CNFH)

25-Feb-81 N/A N/A 49,705 44 - - 0 - - 0 0 6

H6-2-1 Berkeley(CNFH)

8-Mar-81 N/A N/A 36,901 43 - - 0 - - 0 0 0

H6-1-3 Mouth ofMok. R.(CNFH)

20-Feb-81 N/A N/A 45,193 44 - - 0 - - 2* 0 10

H6-1-7 Mouth ofMok. R.(CNFH)

6-Mar-81 N/A N/A 45,796 43 - - 0 - - 2* 0 36

H6-1-2 Isleton(CNFH)

12-Feb-81 N/A N/A 40,916 45 - - 0 - - 3* 0 16

H6-1-6 Isleton(CNFH)

4-Mar-81 N/A N/A 45,949 43 - - 0 - - 0 0 72

Total 86,865

6-58-23 Rio Vista(FRH)

2-Jun-81 N/A 72 8,864 83 4-Jun-81 8-Jun-81 9 860 0.1194 1.11 0 0 219

6-62-14 DiscoveryPark (FRH)

71,932 91 10-Jun-81 10-Jun-81 1 160 0.1111 0.02 0 0 24

6-62-17 DiscoveryPark (FRH)

68,318 88 - - 0 - - 0.00 0 0 22

Total 4-Jun-81 57 76 140,249 90 10-Jun-81 10-Jun-81 1 160 0.1111 0.01

6-62-15 Port Chicago(FRH)

8-Jun-81 55 75 78,339 90 9-Jun-81 9-Jun-81 2 160 0.1111 0.03 0 0 2198

130

1980

Fall Run Releases

Upper SacramentoRiver and Tributaries

H5-3-1 Below RBDD(CNFH)

N/A N/A 25,618 47 - - 0 - - 0 0 134

H5-3-2 Below RBDD(CNFH)

N/A N/A 22,560 47 - - 0 - - 0 0 121

Total 28-Feb-80 48,178

H5-3-5 Below RBDD(CNFH)

N/A N/A 21,786 45 15-May-80 15-May-80 1 - - 0 0 189

H5-3-6 Below RBDD(CNFH)

N/A N/A 21,836 45 - - 0 - - 0 0 130

Total 31-Mar-80 43,622

6-62-7 Feather RiverHatchery

3-Jun-80 55 55 88,335 94 10-Jun-80 23-Jun-80 15 2733 0.1356 0.16 0 0 292

6-62-10 Feather RiverHatchery

5-Jun-80 55 55 88,516 93 12-Jun-80 22-Jun-80 15 2176 0.1374 0.16 0 0 497

Sacramento-SanJoaquin Estuary

H5-2-4 Berkeley(CNFH)

N/A N/A 21,939 46 - - 0 - - 0 0 3

H5-2-5 Berkeley(CNFH)

N/A N/A 20,788 46 - - 0 - - 0 0 0

Total 28-Feb-80 42,727

H5-2-6 Clarksburg(CNFH)

N/A N/A 22,121 50 - - 0 - - 0 0 29

H5-2-7 Clarksburg(CNFH)

N/A N/A 21,624 50 - - 0 - - 0 0 59

Total 28-Feb-80 43,745

H5-3-3 Clarksburg(CNFH)

N/A N/A 23,908 46 17-Apr-80 1-May-80 2 - - 0 0 28

H5-3-4 Clarksburg(CNFH)

N/A N/A 22,829 44 24-Apr-80 1-May-80 2 - - 0 0 42

Total 31-Mar-80 46,737

6-62-8 DiscoveryPark (FRH)

3-Jun-80 52 62 98,586 96 6-Jun-80 27-Jun-80 33 4315 0.1362 0.32 0 0 951

131

6-62-11 DiscoveryPark (FRH)

5-Jun-80 52 62 84,643 96 8-Jun-80 23-Jun-80 34 3135 0.1361 0.38 0 0 678

6-62-9 Port Chicago(FRH)

10-Jun-80 55 65 88,700 92 16-Jun-80 16-Jun-80 2 - - 1882

6-62-12 Port Chicago(FRH)

13-Jun-80 55 63 79,443 92 12-Jun-80 15-Jun-80 4 - - 1786

1979

Fall Run Releases

Upper SacramentoRiver and Tributaries

6-62-4 Feather RiverHatchery

4-Jun-79 N/A N/A 181,028 79 - - 0 - - 0 0 9

Sacramento-SanJoaquin Estuary

6-62-5 DiscoveryPark (FRH)

6-Jun-79 54 68 160,151 75 10-Jun-79 25-Jun-79 50 2193 0.0952 0.43 0 0 99

6-62-6 Port Chicago(FRH)

6-Jun-79 67 69.5 110,122 87 15-Jun-79 15-Jun-79 1 - - 837

1978

Fall Run releases

Upper SacramentoRiver and Tributaries

6-62-1 Feather RiverHatchery

5-Jun-78 N/A N/A 178,998 88 - - 0 - - 0 0 0

Sacramento-SanJoaquin Estuary

6-62-2 DiscoveryPark (FRH)

5-Jun-78 57 73 162,253 91 - - 0 - - 0 0 54

6-62-3 Port Chicago(FRH)

5-Jun-78 57 68 164,766 89 9-Jun-78 9-Jun-78 1 200 0.1389 0.01 0 0 5360

Notes:

132

(1) 8 fish subtracted to correct for 10,500 inadvertantly released with the Georgiana Slough group on 4/14/92. 0.078% of the 6-1-14-3-2 code group released at Georgiana Slough was recovered at Chipps Island. Thus, we assume survival of the 10,500 6-1-14-3-1 fish released at Georgiana Slough to be 0.078%(8 fish). 39 fish were also subtracted from the expanded ocean recoveries(representing .078%).(2) These groups were at large during the period of non-sampling, May 24, 26, 27 and 28, thus estimates of survival are biased low by an unknown amount.(3) The original data has been changed to reflect only tagged fish caught before the non-sampling period. (4) 5 fish subtracted from Miller Park recoveries due to 6,315 fish inadvertantly being released with the Port Chicago group (tag # 6-31-9).(5) 6,315 fish subtracted from total number released due to 12.2% having tag # 6-31-10 (Miller Park).

(6) 1 fish was recovered at Chipps Island on June 26th, but was not included so that the survival indiex would not be biased.

(7) Total number recovered for both tag # 6-62-61 and 6-62-62 is reduced by 1 since onefish for each code. was recorded as being recovered at Chipps Island on the day ofrelease (6/23).(8) 1,230 fish were removed from this group duringMossdale efficiency studies.

* = Unexpanded recovery

Salvage numbers in parenthesis are unexanded and have an unknown location (eitherCVP or SWP)

In some cases average size was calculated from # fish / lb. using a conversion table (Table I-6, Fish Hatchery Management, USFWS,1982)


Recommended