25
New Zealand Fisheries Assessment Report 2006/1 June 2006 ISSN 1175-1584 Abundance of blue cod off Banks Peninsula in 2005 M. P. Beentjes G. D. Carbines
New Zealand Fisheries Assessment Report
2006/1June 2006
ISSN 1175-1584
Abundance of blue cod off Banks Peninsulain 2005
M. P. Beentjes G. D. Carbines

Abundance of blue cod off Banks Peninsula in 2005
M. P. Beentjes G. D. Carbines
NIWA POBox 6414
Dunedin
New Zealand Fisheries Assessment Report 2006/1 June 2006

Published by Ministry of Fisheries Wellington
2006
ISSN 1175-1584
© Ministry of Fisheries
2006
Citation: Beentjes, M.P.; Carbines, G.D. (2006).
Abundance of blue cod off Banks Peninsula in 2005. New Zealand Fisheries Assessment Report 2006/1. 24 p.
This series continues the informal New Zealand Fisheries Assessment Research Document series
which ceased at the end of 1999.

EXECUTIVE SUMMARY
Beentjes, M.P.; Carbines, G.D. (2006). Abundance of blue cod off Banks Peninsula in 2005.
New Zealand Fisheries Assessment Report 2006/1. 24 p.
This report describes the results of the second in the time series of blue cod (Parapercis colias) potting surveys off Banks Peninsula. The main objective of the survey was to estimate blue cod relative abundance, with data also collected on size structure, sex ratio, spawning condition, and length-weight. Otoliths were also collected for future ageing studies.
Forty stations were successfully surveyed (6 pots per station = 240 pot lifts) from five inshore strata (contiguous with the coastline) and two offshore strata (Pompeys Rocks and Le Bons Rocks) around Banks Peninsula between 20 April and 13 May 2005. Of the total 1170 kg of catch, 994 kg (85%) was blue cod, consisting of 1295 fish. Bycatch included 12 fish and 1 octopus species.
Mean catch rates of blue cod (all sizes) ranged from 1.02 kg per pot per hour in stratum 1 south of Akaroa Harbour entrance, to 7.27 kg per pot per hour for the offshore stratum 6 (Le Bons Rock). Overall mean catch rate was 4.43 kg per pot per hour and c.v. 5.71 %.
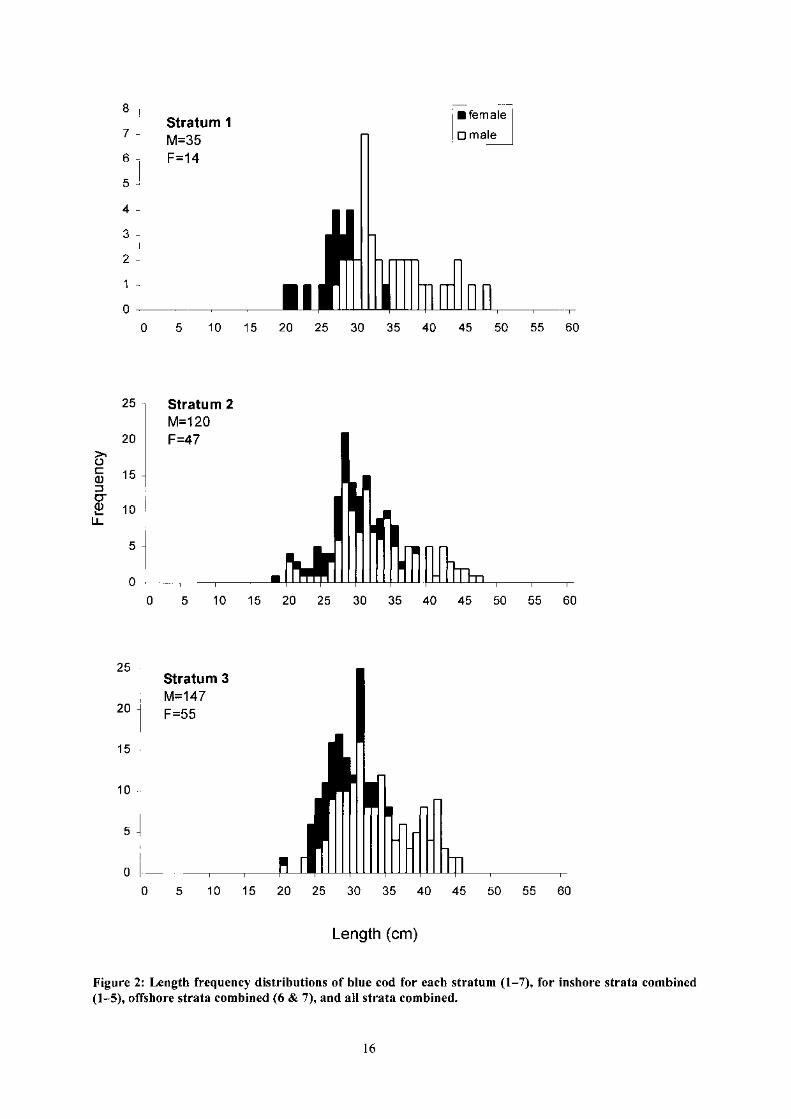
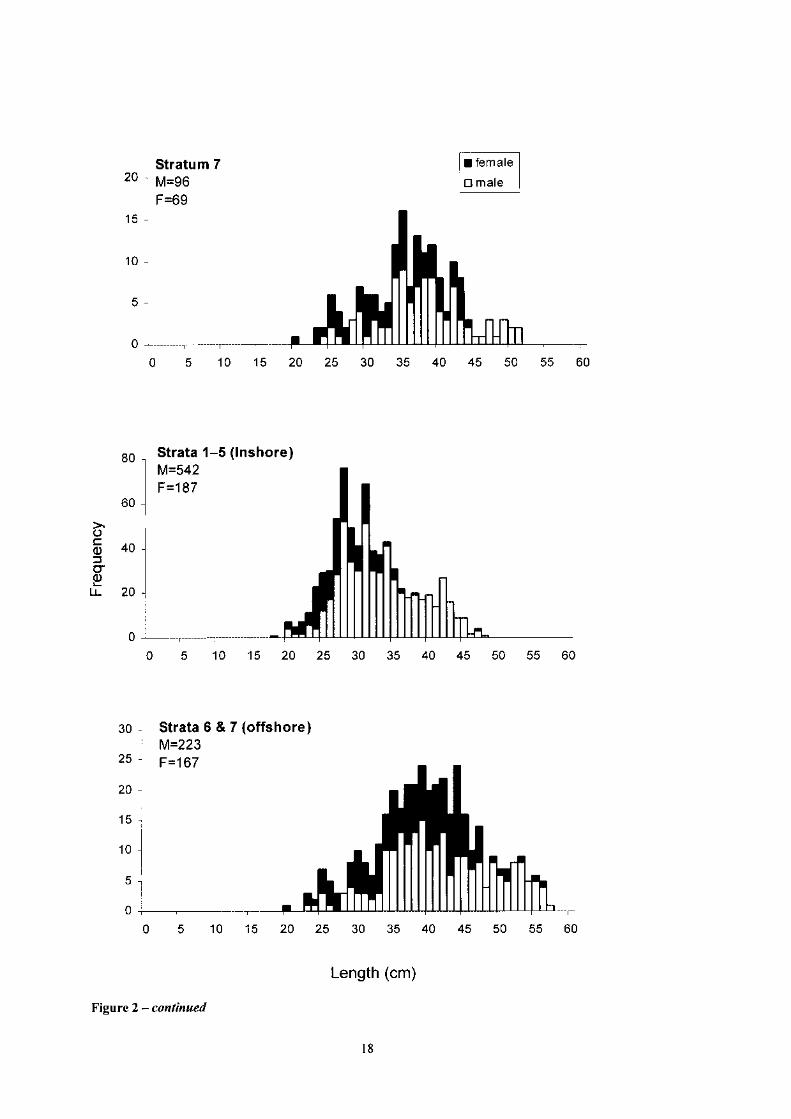
The sex ratio for inshore strata (1-5) was 2.9:1 (male:female), for offshore strata (6 and 7) 1.3:1, and overall 2.2: 1. Length frequency distributions for the five inshore strata were similar with a single modal peak at about 30 cm, while blue cod in the two offshore strata were larger with modes from 35 to 43 cm. Mean lengths of males averaged about 3 em more than females from all strata combined, and the largest fish were usually males. Otoliths were taken from 272 fish and stored.
The proportion of blue cod on the survey of minimum legal size (MLS)(30 em and over) was 68%.
The blue cod examined were not spawning at the time of the survey.
The parameters of the length weight relationship for blue cod V sing the model W = aLb were: males: a = 0.006941, b = 3.2320, and R2 = 0.98 (N = 136, range 24-57 em) females: a = 0.00895, b = 3.1532, and R2 = 0.98 (N=65, range 20-55 em).
Compared to 2002, blue cod mean size has increased in all strata, inshore and offshore. Overall, males were 5 cm and females 3 em longer in 2005, and 68% of blue cod were over the MLS in 2005 compared with 38% in 2002. Commensurate with this, the overall mean catch rate for all blue cod increased from 2.13 to 4.43, and the total number of blue cod caught increased from 837 to 1295 (both from 240 pot lifts). However, both catch rates and mean size of blue cod from the two offshore strata remain substantially greater than those from inshore strata, and males remain the predominant sex in the inshore strata.
3

1. INTRODUCTION
The national diary surveys of marine recreational fishing found blue cod (Parapercis calias) to be the second most frequently landed finfish species nationally, and the most frequently landed species off the South Island (Bradford 1998, James & Unwin 2000). It is also an important customary species for Maori, but the catch is unknown. In the South Island, blue cod is a highly desirable recreational finfish and is usually caught by line from small vessels fishing over reef edges and shingle/gravel or sandy bottoms close to rocky outcrops. In BCO 3, which extends from Clarence River to Slope Point, most blue cod is caught from Taieri Mouth, Karitane, Moeraki, and Motunau. Although the blue cod fishery off Banks Peninsula is comparatively small, a survey of recreational fishing from Akaroa in 1996 found that blue cod was the most common catch outside Akaroa Heads (Bell 1997).
The reef area around the Peninsula supporting blue cod is not extensive and recreational catch rates are reported to be low. Recreational fishers are also concerned that the recent lowering of the blue cod bag limit to 10 per day for the northern area of BCO 3 (from Waimakariri River to Clarence Point) may result in a transfer of fishing effort to Banks Peninsula blue cod populations. There are also concerns from both charter boat operators and commercial fishers that blue cod abundance has declined off Banks Peninsula. Submissions included in the Review of Sustainability Measures and other Management Controls for 2000-01 (Anonymous 2000) also provided anecdotal evidence of a decline in abundance of blue cod around Banks Peninsula. While commercial catches of blue cod in BCO 3 are similar to the recreational catch at about 150 t (Sullivan et al. 2005), around Banks Peninsula nearly all the catch is by recreational fishers.
In the Marlborough Sounds, blue cod catch rates (kg per pot per hour) from potting surveys in 1995 and 1996 were considered to provide a satisfactory index of relative abundance (Blackwell 1997, Blackwell 1998). Patterns of size and catch rates of blue cod in the Marlborough Sounds, and particularly the inner Sounds, indicate that local depletion and overfishing have occurred.
Previously there have been no baseline data available to assess the status of BCO 3 stocks to determine if abundance is declining. This report describes the results of the second in the time series of potting surveys for Banks Peninsula following the survey carried out in January and April 2002 (Beentjes & Carbines 2003). These surveys provide relative abundance indices as well as information on population size/age structure and sex ratio useful in monitoring the blue cod stocks in this area. It is envisaged a time series of relative abundance indices and age structure will be developed as the principal means to monitor the status of blue cod off Banks Peninsula and gauge the effectiveness of the prevailing management regime.
Overall objective (MFish project BC02004/01)
1. To estimate the relative abundance of blue cod (Parapercis calias) around Banks Peninsula.
Specific objectives
1. To estimate the relative abundance of blue cod around Banks Peninsula. 2. To collect otoliths and biological information from blue cod collected during
the survey.
4
2. METHODS
2.1 Timing
The Banks Peninsula survey was carried out between 20 April and 14 May 2005.
2.2 Survey area
The strata used in the current survey were identical to those from the initial 2002 survey (Beentjes & Carbines 2003). The southern and northern boundaries of the survey area off Banks Peninsula were based on discussions with a commercial blue cod fisher in Akaroa and several charter boat operators that regularly fish in this area. These fishers were given charts of the area and asked to mark discrete locations around Banks Peninsula where blue cod are most commonly caught. The survey area selected was between Snuffle Nose in the south and Le Bons Bay in the north, because outside this area water clarity is often poor and considered to reduce catchability. The survey area adjacent to the coast was arbitrarily divided into five strata of similar size with boundaries often determined by headlands or bays (Figure 1). The marine reserve extending off Flea Bay was excluded from the survey area. Discussions with fishers also indicated that much of the recreational catch of blue cod is now taken offshore in two large but discrete areas of foul: Pompeys Rocks (20 km southeast of Pompeys Pillar), and Le Bons Rocks (36 km east of Le Bons Bay) (Figure 1). These offshore areas were included by adding two strata to the survey design.
The blue cod habitat adjacent to Banks Peninsula comprises a narrow band of foul extending out from the cliff faces and exposed headland reefs. It was assumed that this habitat band was reasonably constant in width and that the length of the coastline was proportional to the amount of blue cod habitat. Thus the size of the inshore strata was recorded as length of coast rather than in square kilometres.
The area of the two offshore strata (Le Bons Rocks and Pompeys Rocks) could not be quantified in the same manner because they are discrete areas or islands of foul. To make inshore and offshore areas surveyed comparable, the boundaries of both offshore strata were defined by rectangles (roughly equivalent to the size of the area of foul), each subdivided into 12 smaller rectangles (3 wide and 4 long). The effective size of each offshore stratum was taken as three times the length of the longest side of each stratum. In this way the foul was artificially divided into bands analogous to those of inshore strata.
As this is the second survey in a time series, the same area and strata used in 2002 were resurveyed, but with fishing sites generated randomly from the possible sites identified in 2002 (Beentjes & Carbines 2003).
2.3 Survey design
The survey used a two-phase stratified random station design (Francis 1984), adapted to allow for the use of pots. Before the survey, a minimum of 10 stations or sampling sites per stratum were marked on charts as described above, ensuring that they were at least 300 m apart. These sites were the same as those identified for the 2002 survey. From this list, five stations per stratum were randomly selected for phase l. In phase 1,35 stations (35 sets x 6 pots per set = 210 pot lifts) (87%) were allocated with the remaining 5 (30 pot lifts) (l3 %) allocated in phase 2. Allocation of phase 2 stations was based on the mean catch rate (kg per pot per hour) of all blue cod per stratum and optimised using the "area mean
5
squared" method of Francis (1984). In this way, stations were assigned iteratively to the stratum in which the expected gain was greatest, where expected gain is given by:
expected gain; = A; 2 mean; 2 / (n;{n;+ 1))
where for the ith stratum mean, is the mean weight of blue cod per stratum, and A, is the area of the stratum (= length of coastline, or equivalent length of offshore strata) and n; is the number of pots. Pots were always allocated in groups of six.
2.4 Vessel and gear
The survey was again conducted from CherilynJ (registration number 63139), an Akaroa-based commercial vessel equipped to set and lift rock lobster and blue cod pots. The vessel was chartered by NIW A and skippered by the owner, John Wright. The vessel specifications are: 10.5 m length, 3.8 m breadth, 3.5 t, aluminium monohull, powered by a 230 hp Volvo Penta diesel engine with propeller propulsion.
Six custom designed and built cod pots were used to conduct the survey. Pot specifications were as follows: length 1200 mm, width 900 mm, depth 500 mm, synthetic inner mesh, 30 mm diameter; 50 mm cyclone wire outer mesh, four entrances. Pots were marked with a number from 1 to 6, and baited with paua guts and fish. These are the same pots used for the blue cod surveys of Banks Peninsula in 2002 (Beentjes & Carbines 2003), North Otago in 2005, (Carbines & Beentjes in press-a) and North Canterbury in 2004 and 2005 (Carbines & Beentjes in press-b).
2.5 Sampling methods
At each station six pots were set and left to fish (soak) for 1 h during daylight hours. Soak time was standardised to be consistent with previous potting surveys in the Marlborough Sounds and during the 2002 Banks Peninsula survey (Beentjes & Carbines 2003, Blackwell 1997, Blackwell 1998). The six pots were set in clusters, separated by about 100 m to avoid pots competing for the same fish. The position of each of the six pots was determined by the skipper using local knowledge and the vessel sounder to locate a suitable area of foul. After a station was completed (six pot lifts) the next closest station in the stratum was fished and no allowance was made for time of day or tides. The order in which strata and stations were surveyed was dependent on the prevailing weather conditions, as exposed offshore strata 6 and 7 could be surveyed only during calm weather.
As each pot was set, a record was made on customised forms of pot number, latitude and longitude from GPS, depth and bottom type from the sounder, and time of day. Pots were lifted aboard using the vessel's hydraulic pot lifter, emptied, and the contents sorted by species. Total weight per pot was recorded for each species to the nearest 109 using 5 kg Seaway scales, except for octopus. The number of individuals of each species per pot was also recorded. Total length down to the nearest centimetre, sex, and maturity were recorded for all blue cod except those from phase 1 stations 7B, 7D, 7E, and 7F because of time constraints. Length was recorded for fish from stratum 7 during phase 2. Blue cod otoliths were removed from a representative size range of males and females, from which the weight of each fish was recorded. Sex and maturity of blue cod were determined by dissection and macroscopic examination of the gonads (Carbines 1998). Gonads were recorded as one of five stages as follows: 1, immature or resting; 2, maturing (oocytes visible in females); 3, mature (hyaline oocytes in females, milt expressible in males); 4, running ripe (eggs and milt free flowing); 5, spent.
6

2.6 Data analysis
For each stratum and for all strata combined catch rates for all blue cod and for legal sized blue cod (30 cm and over) were estimated as the mean kilograms per pot per hour. Coefficients of variation (c.v.) for each stratum were determined from:
CV; = se;l mean;
where for the ith stratum se, is the standard error, and mean; is the mean catch rate (kg per pot per hour) .
The overall weighted mean catch rate for all strata was determined by weighting each stratum mean by the stratum coastline length (area;) divided by the sum of all coastline lengths (areatotal).
meanoverall = R(mean;*area;)lareatotat)
The overall weighted mean standard error of the means was determined by squaring each standard error times its weighting, summing them, and then taking the square root.
seoverall = SQRT (Rse,(area/areatotat )i)
The overall c.v. for the survey was then determined from the overall mean and standard errors to provide a weighted c.v.
CVoverall = seoveralll meanoverall
Length frequency for blue cod for each sex is presented by individual strata, inshore strata (1-5) and offshore strata (6 and 7). Length frequency data were not scaled because the area fished by a pot is unknown. Mean length for each sex was calculated for individual strata, inshore strata, offshore strata, and overall for all strata combined.
The length-weight relationship was determined from the linear regression model In W = b(ln L) + In a. where W = weight (g), L = length (cm), and a and b are the regression coefficients. Weights of individual blue cod that were not weighed were determined from the length-weight relationship (see results). Individual fish weights were used to determine catch rates of blue cod 30 cm and over (minimum legal size).
3. RESULTS
3.1 Stations surveyed
Forty stations (= sets) were surveyed (6 pots per station = 240 pot lifts) from five inshore strata and two offshore strata around Banks Peninsula (Table 1, Figure 1). Of the 40 stations (240 pot lifts), 35 were carried out in phase 1 (5 per stratum) and 5 allocated to stratum 7 in phase 2. Depth ranged from about 10 to 46 m inshore (strata 1-5), and 67 to 90 m for offshore strata 6 and 7.
7
3.2 Catch
A total of 1170 kg of catch was taken on the survey, of which 994 kg (85%) was blue cod, consisting of 1295 fish (Table 2). Bycatch included 12 fish and 1 octopus species. The five most common bycatch species by weight were banded wrasse (Notolabrus jucicola), octopus (Octopus cordiformis), scarlet wrasse (Pseudolabrus miles), sea perch (Helicolenus percoides), and swollenhead conger eel (Bassanago bulbiceps).
Mean catch rates of blue cod (all sizes) ranged from 1.02 kg per pot per hour in stratum I south of Akaroa Harbour entrance, to 7.27 kg per pot per hour for the offshore stratum 6 located over Le Bons Rock (Table 3). Overall mean catch rate and c.v. were 4.43 kg per pot per hour and 5.71%. For blue cod 30 cm and over (minimum legal size), highest catch rates were also in stratum 6 (7.39 kg per pot per hour) and lowest catch rates in stratum 1 (0.81 kg per pot per hour) (Table 4). Overall mean catch rate and c.v. for blue cod 30 cm and over were 3.95 kg per pot per hour and 7.0%.
The catch rate in stratum 7 for fish 30 cm and over is similar to that for all fish, and in stratum 6 it is slightly greater than that for all fish, which is counter intuitive. In stratum 7 the catch rates are similar because fish were measured from only 6 of the 10 stations and the mean catch rate from these was greater than that for all 10 stations. In addition, there may be some discrepancy between actual weights versus weights estimated from the length-weight relationship because catch rates of blue cod 30 cm and over are based on the length-weight relationship applied to length of measured fish. In stratum 6 there were only a few fish under 30 cm, and thus the higher catch rate for fish 30 cm and over is a result of this discrepancy.
3.3 Biological and length frequency data
Of the 1295 blue cod caught on the survey, 1119 were sexed and measured for length and of those, otoliths were taken from about 272 fish and stored. The sex ratio for inshore strata (1-5) was 2.9: 1 (male:female), for offshore strata (6 and 7) 1.3:1, and overall 2.2:1. Length frequency distributions for the five inshore strata were similar, with a single modal peak at about 30 cm, while blue cod in the two offshore strata were larger with modes at about 36 cm for stratum 7 and 43 cm for stratum 6 (Figure 2, Table 5). Mean lengths of males averaged about 3 cm more than females from all strata combined, and the largest fish were usually males.
The proportion of blue cod of legal size (30 cm and over) was 68%.
Of 1119 blue cod examined, 99% of males and 97% of females had maturing stage gonads (Table 6). This indicates that these blue cod were not spawning at the time of the survey.
The parameters of the length weight relationship for blue cod using the derived model W = aLb were: males: a = 0.006941, b = 3.2320, and R2 = 0.98 (N = 136, range 24-57 cm); females: a = 0.00895, b = 3.1532, and R2 = 0.98 (N=65, range 20-55 cm).
4. DISCUSSION
The results of this potting survey in 2005 provide the second index in the time series of abundance and population structure of blue cod around Banks Peninsula. Survey sampling methods and strata were identical to those in the 2002 survey and results are directly comparable. However, there is a slight difference in timing as the 2002 survey was split between January and April, whereas the 2005 survey took place in April-May. The overall c.v. of 5.7% for all blue cod indicates that the estimates of
8
abundance (= catch rates) are reasonably precise and are an improvement on the 2002 survey where the c.v. was 10.8%. To a large extent this was because there were more fish caught on this survey with few potlifts recording zero catch.
Unlike the 2002 survey, the weather was fine and there were no episodes of poor water clarity, often a feature of the inshore waters off Banks Peninsula. Advice from fishers, together with the results from stations sampled during poor water clarity in 2002, suggest that blue cod are not vulnerable to pots in these conditions and that sampling should take place only when water clarity is high.
Blue cod catches do not appear to be affected by time of day, but can be influenced by the state of the tide in areas where tidal flow is high, such as in Foveaux Strait (Warren et al. 1997). In our sampling design it was not practical to allow for the effect that tide might have on catch rates, and we cannot rule out the possibility that some catch rates may have been affected, although compared to Foveaux Strait, tidal flow around Banks Peninsula is low.
The mean catch rates varied between strata and were substantially higher in offshore strata where they were about 7 kg per pot per hour for all blue cod compared with about 1-4 kg per pot per hour from inshore strata. Similarly, there was a contrast in both the size and sex structure of blue cod between inshore and offshore strata; male blue cod were about 8 cm and females 10 cm longer offshore than inshore, and males outnumbered females 3: 1 in inshore strata, but the ratio was about 1: 1 offshore. Blue cod are protogynous hermaphrodites with females changing into males as they grow (Carbines 2004a). The finding that males were on average about 3 cm longer than females and that the largest fish were usually males is consistent with sex structure in protogynous hermaphrodites. It seems likely that the difference between relative abundance, size structure, and possibly sex ratios of these populations is a result of heavy fishing pressure on the more accessible inshore stocks. Similar conclusions were reached for blue cod in the Marlborough Sounds, where catch rates appear to be inversely proportional to recreational fishing effort (Blackwell 1998, Blackwell 2002). There are, however, other possible explanations for the difference between relative abundance (= catch rates) and size structure between inshore and offshore Banks Peninsula blue cod populations, including inshore/offshore migration, and/or that deeper offshore reefs provide a more productive environment. However, these would not explain the numerical dominance of males inshore, and tagging studies on open coast blue cod in Foveaux Strait have shown that 91% of blue cod travel less than 10 km (Carbines 2004a). It seems more plausible that the population structure difference is mainly a result of greater fishing pressure on the more accessible inshore reefs.
The skewed sex ratios in the inshore Banks Peninsula strata are contrary to an expected dominance of females resulting from selective removal of the larger final sex fish (males). Beentjes & Carbines (2005) suggested that the shift towards a higher proportion of males in heavily fished blue cod populations such as Banks Peninsula may be caused by removal of the inhibitory effect of large males, and a consequent higher rate (and possibly earlier onset) of sex inversion by primary females.
There are no obvious modes corresponding to year classes, and reading of the otoliths collected during this survey will provide information on the age structure of the Banks Peninsula blue cod population. Of interest will be the comparison of age from inshore and offshore blue cod, which may provide an indication of productivity in these areas.
Spawning of blue cod from Southland occurs mainly between September and November, but continues through to January (Carbines 1998) and blue cod sampled on the North Otago potting survey in mid January 2005 were spawning (Carbines & Beentjes in press-a). Blue cod from the potting survey of Motunau in mid February 2005 showed no signs of spawning, but those from the Kaikoura survey in early December 2005 had some gonads developing into the spawning condition (Carbines & Beentjes in press-b). This suggests that December-January is the peak spawning period for blue cod on the east coast, but the timing probably varies seasonally and regionally. Although the 2002 Banks Peninsula survey was split between January and April, there was an indication that spawning had occurred before
9

January and that the timing of spawning off Banks Peninsula is similar to that off Southland (Beentjes & Carbines 2003). The absence of spawning gonad conditions from blue cod from Banks Peninsula in April-May 2005 is therefore not surprising.
4.1 Comparison with the 2002 survey
A key finding of this survey was that blue cod mean size has increased compared to 2002 throughout all strata, inshore and offshore. Overall males were 5 cm and females 3 cm longer in 2005 and 68% of blue cod were over the MLS in 2005 compared with 38% in 2002. Commensurate with this was a substantial increase in catch rates in both catch per pot and numbers of blue cod caught per pot. For example, the overall mean catch rate for all blue cod in 2002 was 2.13 compared with 4.43 in 2005. Similarly the total number of blue cod caught in 240 pot lifts in 2002 was 837 compared with 1295 in 2005. Catch rates and mean size of blue cod from the two offshore strata, however, remain substantially greater than those from inshore strata.
Assuming that there were no catchability differences between these surveys, the increase in catch rates are explicable in terms of growth and the greater numbers of fish, whereas the latter suggest that recruitment into the fishery has been strong. Based on ageing of Foveaux Strait blue cod (Carbines 2004a, 2004b) growth of this magnitude can be expected to take about 2 years. We have no information to suggest that the growth and recruitment is related to a decrease in fishing pressure or a period of increased productivity as a result of favourable environmental conditions. A project ageing blue cod otoliths from the 2002 and the 2005 surveys (BC02005/04) may provide some indication as to whether increases in abundance are related to recruitment.
The predominance of males over females has persisted for inshore strata.
Blue cod made up a larger component of the total catch in 2005 and the bycatch species were similar, but there was a notable absence of hagfish in 2005, which was the second most abundant species after blue cod by weight and number in 2002.
5. ACKNOWLEDGMENTS
This research was carried out by NIWA under contract to the Ministry of Fisheries (MFish Project BC02004/01). We thank John Wright for providing his vessel and crew to undertake the survey. Thanks also to NIWA staff Derck Kater for attending part of the survey, Evan Baddock for graphics assistance, Russell Cole for reviewing the manuscript, and Mike Beardsell for editorial comments.
6. REFERENCES
Anonymous (2000). Review of Sustainability Measures and Other Management Controls for the 2000-01 Fishing Year: Final Advice Paper. 11 August 2000. (Unpublished report held by Ministry of Fisheries, Wellington.)
Beentjes, M.P.; Carbines, G. (2005). Population structure and relative abundance of blue cod (Parapercis colias) off Banks Peninsula and in Dusky Sound, New Zealand. New Zealand Journal of Marine and Freshwater Research 39: 77-90.
Beentjes, M.P.; Carbines, G.D. (2003). Abundance of blue cod in Banks Peninsula in 2002. New Zealand Fisheries Assessment Report 2003116.25 p.
lO

Bell, J.D. (1997). Results from the Akaroa Harbour recreational fishing survey 1997. Final Research Report for Ministry of Fisheries Project REC9705. 51 p. (Unpublished report held by Ministry of Fisheries, Wellington.)
Blackwell, R.G. (1997). Abundance, size composition, and sex ratio of blue cod in the Marlborough Sounds, September 1995. NIWA Technical Report 88.52 p.
Blackwell, R.G. (1998). Abundance, size and age composition, and yield-per-recruit of blue cod in the Marlborough Sounds, September 1996. NIWA Technical Report 30.47 p.
Blackwell, R.G. (2002). Abundance, size and age composition of recruited blue cod in the Marlborough Sounds, September 2001. Final Research Report for Ministry of Fisheries Project BC02001l01. (Unpublished report held by Ministry of Fisheries, Wellington.)
Bradford, E. (1998). Harvest estimates from the 1996 national marine recreational fishing surveys. New Zealand Fisheries Assessment Research Document 98116. 27 p. (Unpublished report held in NIWA library, Wellington.)
Carbines, G. (1998). Blue cod age validation, tagging feasibility and sex inversion. Final Research Report for Ministry of Fisheries Project SOBC04. 74 p. (Unpublished report held by Ministry of Fisheries, Wellington.)
Carbines, G.; Beentjes, M.P. (in press-a). Abundance of blue cod in north Otago in 2005. New Zealand Fisheries Assessment Report.
Carbines, G.; Beentjes, M.P. (in press-b). Abundance of blue cod in North Canterbury in 2004 and 2005. New Zealand Fisheries Assessment Report.
Carbines, G.D. (2004a). Age, growth, movement and reproductive biology of blue cod (Parapercis colias-Pinguipedidae): implications for fisheries management in the South Island of New Zealand. Unpublished PhD thesis, University of Otago, Dunedin, New Zealand. 211 p.
Carbines, G.D. (2004b). Age determination, validation, and growth of blue cod Parapercis colias, in Foveaux Strait, New Zealand. New Zealand Journal of Marine and Freshwater Research 38: 201-214.
Francis, R.I.C.C. (1984). An adaptive strategy for stratified random trawl surveys. New Zealand Journal of Marine and Freshwater Research 18: 59-71.
James, G.D.; Unwin, M.J. (2000). National marine diary survey of recreational fishing from charter vessels, 1997-98. NIWA Technical Report 70. 51 p.
Sullivan, K.J.; Mace, P.M.; Smith, N.W.M. et al. (2005). (Comp). Report from the Fishery Assessment Plenary, May 2005: stock assessments and yield estimates. 792 p. (Unpublished report held in NIWA library, Wellington.)
Warren, E.; Grindley, R.; Carbines, G.; Teimey, L. (1997). Characterisation of the Southland blue cod fishery (1991-1996).38 p. (Unpublished report held by Ministry of Fisheries, Dunedin.)
11
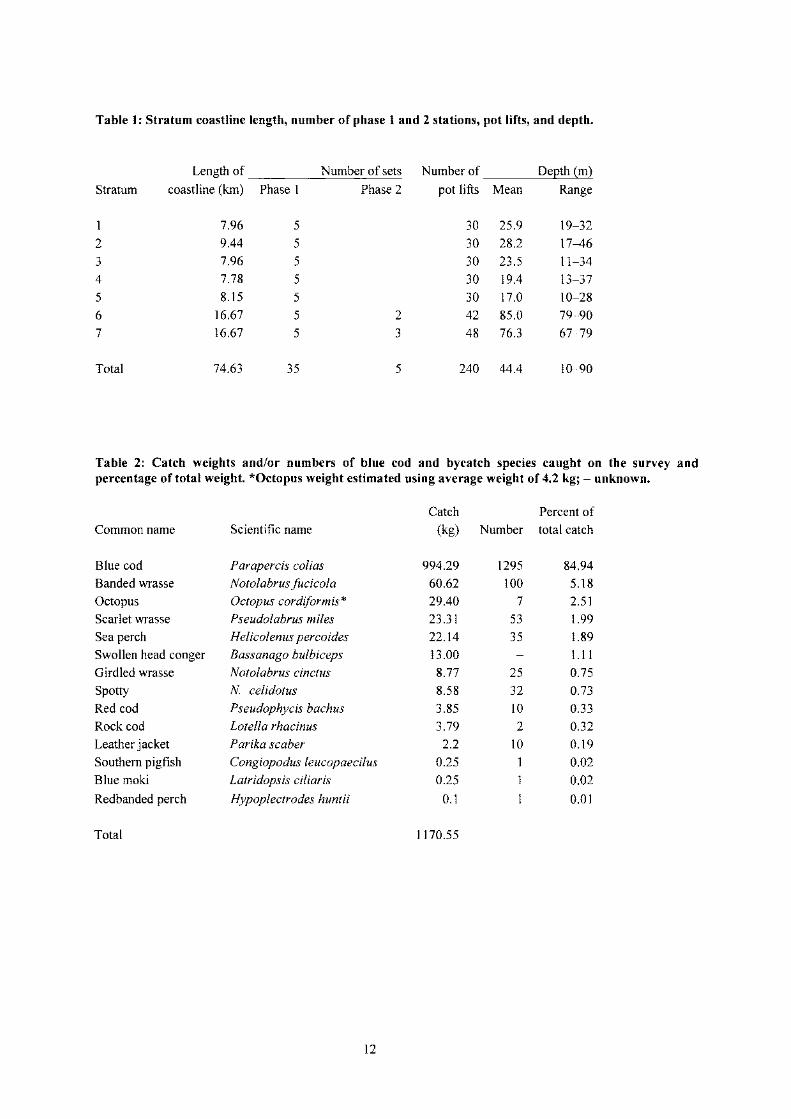
Table 1: Stratum coastline length, number of phase 1 and 2 stations, pot lifts, and depth.
Length of Number of sets Number of DeQth (m)
Stratum coastline (kro) Phase 1 Phase 2 pot lifts Mean Range
7.96 5 30 25.9 19-32
2 9.44 5 30 28.2 17-46
3 7.96 5 30 23.5 11-34 4 7.78 5 30 19.4 13-37
5 8.15 5 30 17.0 10-28
6 16.67 5 2 42 85.0 79-90
7 16.67 5 3 48 76.3 67-79
Total 74.63 35 5 240 44.4 10-90
Table 2: Catch weights and/or numbers of blue cod and bycatch species caught on the survey and percentage of total weight. *Octopus weight estimated using average weight of 4.2 kg; - unknown.
Catch Percent of Common name Scientific name (kg) Number total catch
Blue cod Parapercis colias 994.29 1295 84.94 Banded wrasse N otolabrus fucicola 60.62 100 5.18 Octopus Octopus cordiformis* 29.40 7 2.51 Scarlet wrasse Pseudolabrus miles 23.31 53 l.99 Sea perch Helicolenus percoides 22.14 35 l.89 Swollen head conger Bassanago bulbiceps 13.00 l.l1 Girdled wrasse Notolabrus cinctus 8.77 25 0.75 Spotty N. celidotus 8.58 32 0.73 Red cod Pseudophycis bachus 3.85 10 0.33 Rock cod Lotella rhacinus 3.79 2 0.32 Leather jacket Parika scaber 2.2 10 0.19 Southern pigfish Congiopodus leucopaecilus 0.25 0.02 Blue moki Latridopsis ciliaris 0.25 0.02
Redbanded perch Hypoplectrodes huntii 0.1 0.01
Total 1170.55
12

Table 3: Mean blue cod catch rate, standard error, and c.v. per stratum and overall for all blue cod.
Stratum Pot lifts (N) Mean (kg/lift) s.e. c.v. (%)
30 1.02 0.32 32.00
2 30 3.04 0.68 22.22
3 30 3.62 0.69 19.03
4 30 4.16 0.77 18.62
5 30 2.04 0.49 23.95
6 42 7.27 0.75 10.32
7 48 5.68 0.50 8.84
Overall 240 4.43 0.25 5.71
Table 4: Mean blue cod catch rate, standard error, and c.v. per stratum and overall for blue cod 30 cm and over.
Stratum Pot lifts (N) Mean (kg/lift) s.e. C.v. (%)
30 0.81 0.29 35.58
2 30 2.08 0.56 27.08
3 30 2.77 0.61 21.89
4 30 3.22 0.65 20.31
5 30 1.49 0.41 27.83
6 42 7.39 0.78 10.62
7 48 5.15 0.55 10.70
Overall 240 3.95 0.28 6.99
13
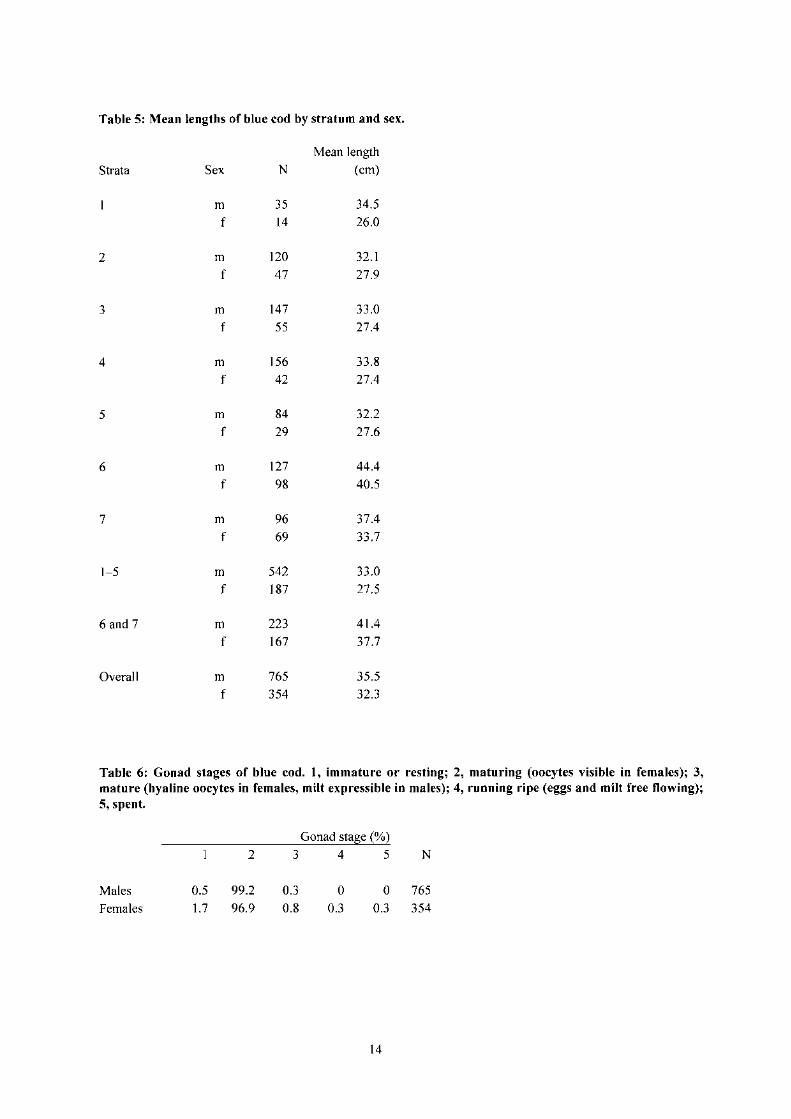
Table 5: Mean lengths of blue cod by stratum and sex.
Mean length
Strata Sex N (em)
m 35 34.5
f 14 26.0
2 m 120 32.1 f 47 27.9
3 m 147 33.0 f 55 27.4
4 m 156 33.8 f 42 27.4
5 m 84 32.2
f 29 27.6
6 m 127 44.4 f 98 40.5
7 m 96 37.4 f 69 33.7
1-5 m 542 33.0 f 187 27.5
6 and 7 m 223 4l.4
f 167 37.7
Overall m 765 35.5 f 354 32.3
Table 6: Gonad stages of blue cod. 1, immature or resting; 2, maturing (oocytes visible in females); 3, mature (hyaline oocytes in females, milt expressible in males); 4, running ripe (eggs and milt free flowing); 5, spent.
Males Females
0.5 l.7
2
99.2 96.9
Gonad stage (%)
3 4 5 N
0.3 0.8
o 0.3
o 765 0.3 354
14

Banks Peninsula
(J)
44'8
N
048 E!!!ftj
Kilometres
Pompeys Rocks
Figure 1: Map of Banks Peninsula showing strata (1-7) and stations surveyed (black dots).
15
43'40' 8
® 1-:,1 Le Bons Rocks
8 .female Stratum 1
7 M=35 omale
6 F=14
5
4
3
2
o -t----.-------,---,---
o 5 10 15 20 25 30 35 40 45 50 55 60
25 Stratum 2 M=120
20 F=47 >-() c 15 Q) ::::l C'" ~ 10
U.
5
0 0 5 10 15 20 25 30 35 40 45 50 55 60
Figure 2: Length frequency distributions of blue cod for each stratum (1-7), for inshore strata combined (1-5), offshore strata combined (6 & 7), and all strata combined.
16

25 l Stratum 4
.female
M=156 Dmale 20
F=42
15
10
5
0
0 5 10 15 20 25 30 35 40 45 50 55 60
15 Stratum 5 M=84 F=29
10 >-() c Q) ::::::l 0-Q) 5 .... u..
0
0 5 10 15 20 25 30 35 40 45 50 55 60
25 Stratum 6 M=127
20 F=98
15
10
o 5 10 15 20 25 30 35 40 45 50 55 60
Length (em)
Figure 2 - continued
17
>-u c: Q) :::::l C'" Q) ..... u..
Stratum 7 20 M=96
F=69 15
10
5
0
0 5 10 15 20
80 Strata 1-5 (Inshore) M=542 F=187
60
40
20
0
0 5 10 15 20
30 Strata 6 & 7 (offshore) M=223
25 F=167
20
15
10
5
.female
omale
25 30 35 40 45 50 55 60
25 30 35 40 45 50 55 60
o 5 10 15 20 25 30 35 40 45 50 55 60
Length (em)
Figure 2 - continued
18
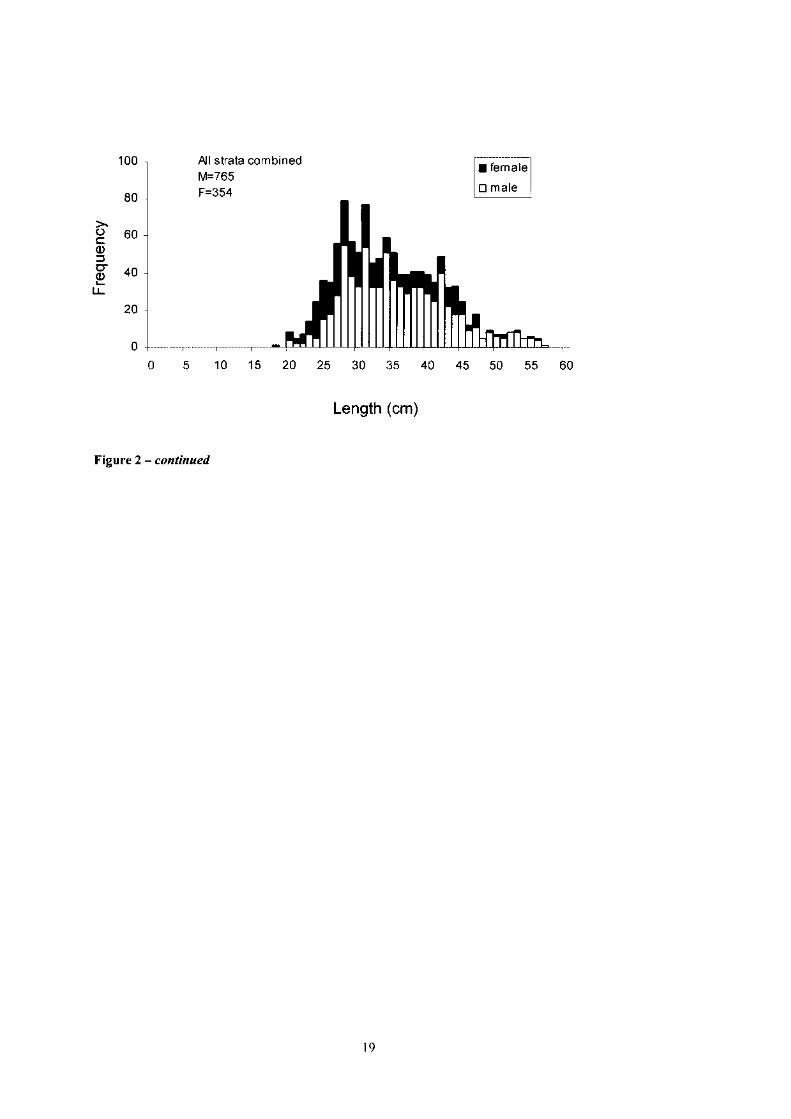
100 All strata combined • female
M=765 F=354 omale
80
>. u 60 c Q) :::J C'" 40 Q) .... u..
20
0 0 5 10 15 20 25 30 35 40 45 50 55 60
Length (em)
Figure 2 - continued
19

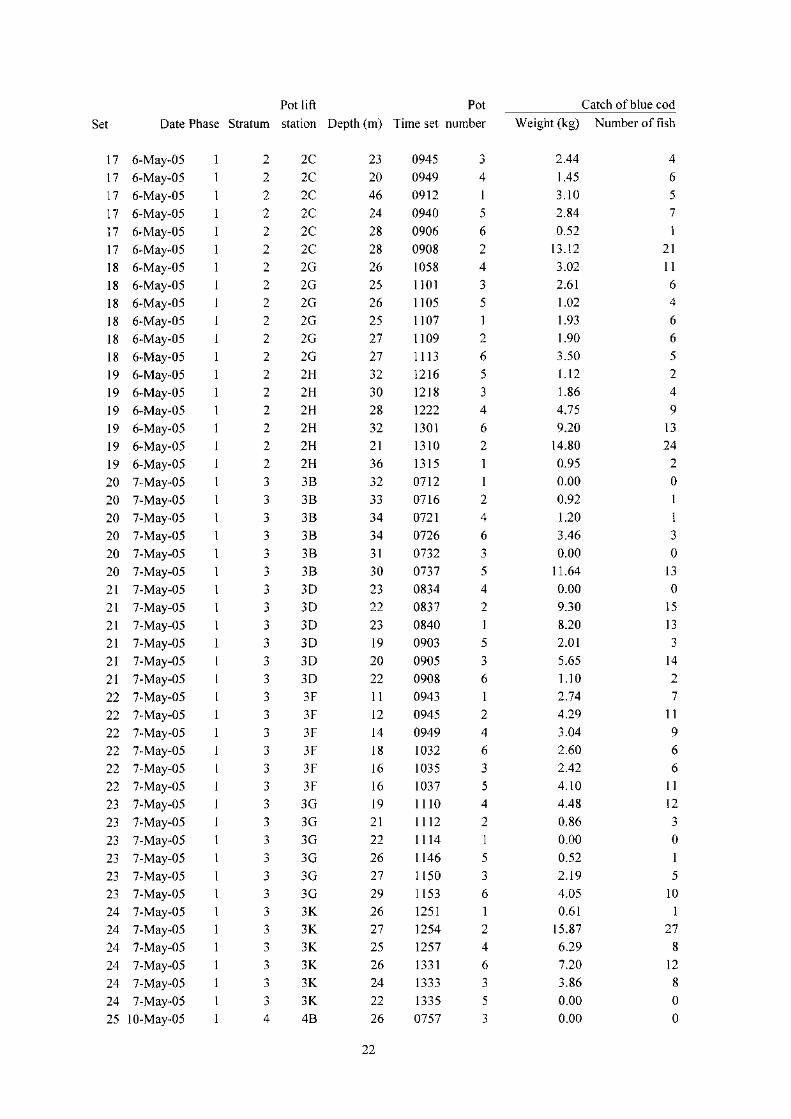
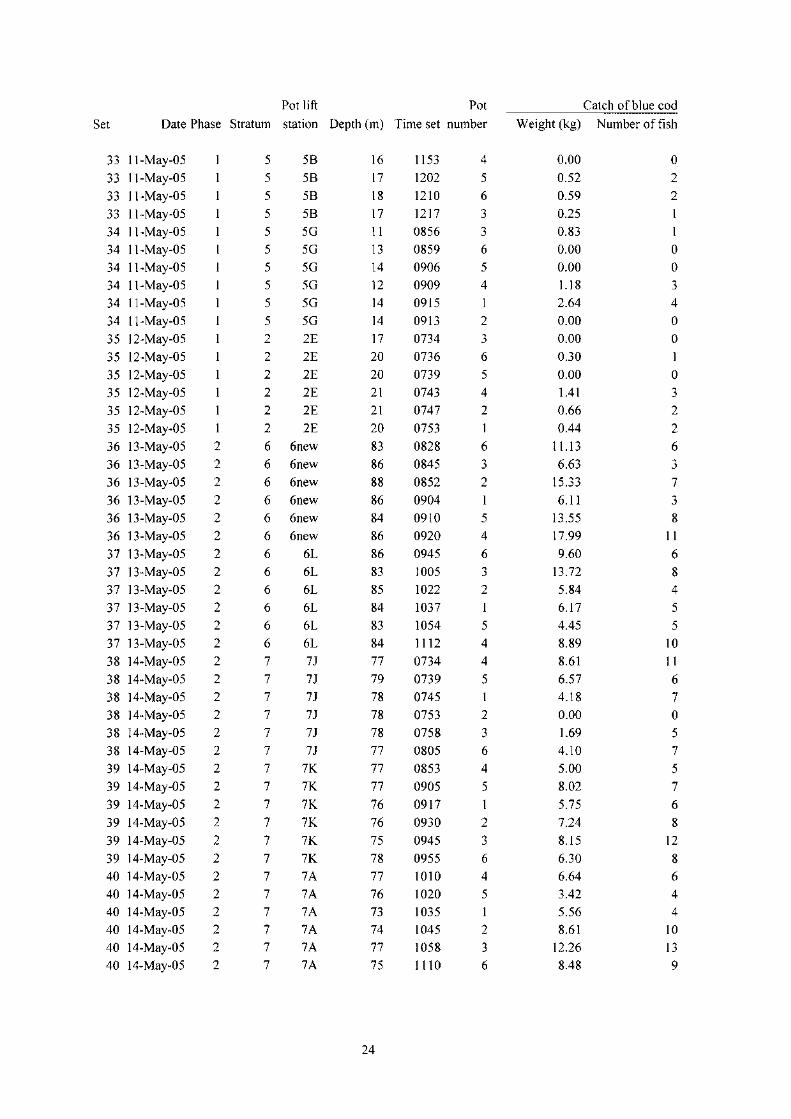
Appendix 1: Summary of pot lift station data.
Pot lift Pot
Set Date Phase Stratum station Depth (m) Time set number
20-Apr-05
20-Apr-05
20-Apr-05
20-Apr-05
20-Apr-05
20-Apr-05
2 20-Apr-05
2 20-Apr-05
2 20-Apr-05
2 20-Apr-05
2 20-Apr-05
2 20-Apr-05
3 20-Apr-05
3 20-Apr-05
3 20-Apr-05
3 20-Apr-05
3 20-Apr-05
3 20-Apr-05
4 20-Apr-05
4 20-Apr-05
4 20-Apr-05
4 20-Apr-05
4 20-Apr-05
4 20-Apr-05
5 20-Apr-05
5 20-Apr-05
5 20-Apr-05
5 20-Apr-05
5 20-Apr-05
5 20-Apr-05
6 22-Apr-05
6 22-Apr-05
6 22-Apr-05
6 22-Apr-05
6 22-Apr-05
6 22-Apr-05
7 22-Apr-05
7 22-Apr-05
7 22-Apr-05
7 22-Apr-05
7 22-Apr-05
7 22-Apr-05
8 22-Apr-05
8 22-Apr-05
8 22-Apr-05
8 22-Apr-05
8 22-Apr-05
7
7
7
7
7
7
7
7 7 7
7 7
7
7 7
7
7
lA
lA
IA
lA
lA
IA lC
lC
lC
lC
lC
lC
IE IE IE IE IE IE IF IF IF IF IF IF IH
1H 1H 1H 1H 1H 7B 7B 7B 7B 7B 7B 7D 7D 7D 7D 7D 7D 7E 7E 7E 7E 7E
29
25
28
28
27
30
20
19
21
21
19
20
23
25
25
25
26
22
27
22 26
28
25
30
31
32
30
31
32
29
77
77
76
78
79
78
76
77
78
79
79
78
78
76
76
67
77
20
0828
0830
0836
0840
0855
0848
1010
1013
1017
1021
1025
1029
1138
1142
1145
1148
1150
1158
1311
1314
1316
1320
1323
1329
1443
1450
1455
1459
1503
1505
0812
0813
0832
0842
0853
0905
0929
0940
0955
1009
1020
1032
1054
1106
1116
1133
1144
2 4
5 3
6
3
6
4
5
2
2
5 4
6
3
3
6
4
5 2
5 4
2 6
3
2
3
4
5
6
2
3
4 5
6
2
3
4
5
Catch of blue cod
Weight (kg) Number offish
0.00
0.00
0.61
0.00
0.00
0.00
0.83
0.40
0.31
l.04
l.39
0.00
0.00
0.55
0.00
0.00
0.57
0.37
7.74
2.10
5.26
0.46
2.07
4.24
0.00
0.00
0.00
0.00
l.39
1.13
9.62
6.26
l.31
9.03
0.00
0.00
6.78
10.03
12.18
0.72
7.20
9.10
2.05
7.71
13.40
4.40
10.50
o o 1
o o o 2
1
4
4
o o 1
o o 1
1 8 2 8
1
5 4
o o o o 3
2
12
9
3
11
o o 6
12
21
10
15
4
7
16
6
10

Pot lift Pot
Set Date Phase Stratum station Depth (m) Time set number
8 22-Apr-05
9 22-Apr-05
9 22-Apr-05
9 22-Apr-05
9 22-Apr-05
9 22-Apr-05
9 22-Apr-05
10 22-Apr-05
10 22-Apr-05
10 22-Apr-05
10 22-Apr-05
10 22-Apr-05
10 22-Apr-05
11 5-May-05
11 5-May-05
11 5-May-05
11 5-May-05
11 5-May-05
11 5-May-05
12 5-May-05
12 5-May-05
12 5-May-05
12 5-May-05
12 5-May-05
12 5-May-05
13 5-May-05
13 5-May-05
13 5-May-05
13 5-May-05
13 5-May-05
13 5-May-05
14 5-May-05
14 5-May-05
14 5-May-05
14 5-May-05
14 5-May-05
14 5-May-05
15 5-May-05
15 5-May-05
15 5-May-05
15 5-May-05
15 5-May-05
15 6-May-05
16 6-May-05
16 6-May-05
16 6-May-05
16 6-May-05
16 6-May-05
16 6-May-05
7
7
7
7
7
7
7
7
7
7
7
7
7
6
6
6
6
6
6
6
6
6
6
6
6
6
6
6
6
6
6
6
6
6
6
6
6
6
6
6
6
6
6
2
2
2
2
2
2
7E
7F 7F 7F 7F 7F 7F 7H 7H 7H 7H 7H 7H 6A
6A
6A
6A
6A
6A
6E 6E 6E 6E 6E 6E 6C 6C 6C 6C 6C 6C 6k 6k 6k 6k 6k 6k 61
61
61
61
61
61
2B 2B 2B 2B 2B 2B
76
77
77
75
76
77
76
74
75
74
76
73
74
82
80
81
82
85
82
87
87
80
79
85
80
88
85
86
85
83
84
89
85
86
87
87
85
89
86
90
89
89
89
36
40
39
38
38
33
21
1156
1211
1224
1235
1249
1301
1325
1340
1354
1401
1415
1430
1448
0830
0838
0846
0851
0859
0906
0952
1009
1021
1039
1053
1106
1127
1138
1153
1206
1222
1231
1315
1322
1353
1405
1333
1508
1425
1436
1450
1554
1520
1535
0740
0746
0749
0753
0758
0805
6
1
2
3
4
5
6
2
3
4
5
6
3
2
5
4
6
3
2
5 4
1
6
3
2
5
4
6
3
2
1
6
5
4
3
2
5
4
1
6
2
6
4
3
5
Catch of blue cod
Weight (kg) Number offish
5.03
4.50
0.88
2.40
7.22
1.29
2.60
3.74
4.20
2.61
1.30
7.93
8.20
13.36
9.50
6.48
9.80
3.11
14.06
0.00
1.79
3.57
7.48
4.12
4.30
0.64
12.05
5.20
0.31
4.97
8.25
2.22
2.55
7.92
13.50
12.01
4.84
10.20
15.20
1.20
0.00
6.29
0.92
1.85
2.12
3.95
8.88
0.00
1.42
7
6
3 3
7
2
3
3
4
3
2
13
12
7
6
5
7
2
13
o 2
2
4
4
5
1
7
5
3
6
2
2
8
10
13
4
6
18
1
o 5
1
4
2
6
9
o 2
Pot lift Pot
Set Date Phase Stratum station Depth (m) Time set number
17 6-May-OS
17 6-May-OS
17 6-May-OS
17 6-May-OS
17 6-May-OS
17 6-May-OS
18 6-May-OS
18 6-May-OS
18 6-May-OS
18 6-May-OS
18 6-May-OS
18 6-May-OS
19 6-May-OS
19 6-May-OS
19 6-May-OS
19 6-May-OS
19 6-May-OS
19 6-May-OS
20 7-May-OS
20 7-May-OS
20 7-May-OS
20 7-May-OS
20 7-May-OS
20 7-May-OS
21 7-May-OS
21 7-May-OS
21 7-May-OS
21 7-May-OS
21 7-May-OS
21 7-May-OS
22 7-May-OS
22 7-May-OS
22 7-May-OS
22 7-May-OS
22 7-May-OS
22 7-May-OS
23 7-May-OS
23 7-May-OS
23 7-May-OS
23 7-May-OS
23 7-May-OS
23 7-May-OS
24 7-May-OS
24 7-May-OS
24 7-May-OS
24 7-May-OS
24 7-May-OS
24 7-May-OS
2S 10-May-OS
2
2 2
2 2 2
2
2
2
2
2
2
2
2
2
2
2
2
3
3
3
3
3
3
3
3
3
3
3
3
3
3
3
3
3
3
3
3
3
3
3
3
3
3
3
3
3
3
4
2C 2C 2C 2C 2C 2C 2G 2G 2G 2G 2G 2G 2H 2H 2H 2H 2H 2H 3B 3B 3B 3B 3B 3B 3D 3D 3D 3D 3D 3D 3F 3F 3F 3F 3F 3F 3G 3G 3G 3G 3G 3G 3K 3K 3K 3K 3K 3K 4B
23
20
46
24
28
28
26
2S 26
2S 27
27
32
30
28
32
21
36
32
33
34
34
31 30
23
22
23
19
20
22 11
12
14
18
16
16
19
21
22
26
27
29
26
27
2S 26
24
22 26
22
094S 0949
0912
0940
0906
0908
IOS8 1101
11 OS 1107
1109
1113 1216
1218
1222
1301
1310
131S 0712
0716
0721
0726
0732
0737
0834
0837
0840
0903
090S 0908
0943
094S 0949
1032
103S 1037
1110
1112 1114
1146
I1S0 l1S3 12S1 12S4 12S7 1331
1333
133S 07S7
3
4
S
6
2
4
3
S
1
2
6
S 3
4
6
2
1
2
4
6
3
S
4
2
1 S
3
6
2
4
6
3
S 4
2
S 3
6
1
2
4
6
3
S 3
Catch of blue cod
Weight (kg) Number offish
2.44
I.4S 3.10
2.84
0.S2 13.12
3.02
2.61
1.02
1.93
1.90
3.S0 1.12
1.86
4.7S 9.20
14.80
0.9S 0.00
0.92
1.20
3.46
0.00
11.64
0.00
9.30
8.20
2.01
S.6S 1.10
2.74
4.29
3.04
2.60
2.42
4.10
4.48
0.86
0.00
0.S2 2.19
4.0S 0.61
IS.87 6.29
7.20
3.86
0.00
0.00
4
6
S 7
21
11 6
4
6
6
S 2
4
9
13
24
2
o
1
3
o 13 o
IS 13 3
14
2
7
11
9
6
6
11
12
3
o
S
10
27
8
12 8
o o

Pot lift Pot
Set Date Phase Stratum station Depth (m) Time set number
25 10-May-05
25 10-May-05
25 10-May-05
25 10-May-05
25 1O-May-05
26 10-May-05
26 1O-May-05
26 1O-May-05
26 10-May-05
26 10-May-05
26 10-May-05
27 1O-May-05
27 10-May-05
27 10-May-05
27 10-May-05
27 1O-May-05
27 10-May-05
28 1O-May-05
28 10-May-05
28 10-May-05
28 10-May-05
28 10-May-05
28 1O-May-05
29 10-May-05
29 10-May-05
29 10-May-05
29 10-May-05
29 10-May-05
29 10-May-05
30 11-May-05
30 11-May-05
30 11-May-05
30 11-May-05
30 11-May-05
30 II-May-05
31 11-May-05
31 11-May-05
31 11-May-05
31 11-May-05
31 11-May-05
31 11-May-05
32 11-May-05
32 11-May-05
32 11-May-05
32 11-May-05
32 11-May-05
32 II-May-05
33 II-May-05
33 II-May-05
4
4
4
4
4
4
4
4
4
4 4
4
4
4
4
4 4 4 4 4 4
4 4 4 4 4 4 4 4
5
5
5
5
5
5
5 5 5
5
5
5
5
5
5
5
5
5
5
5
4B 4B 4B 4B 4B 4E 4E 4E 4E 4E 4E 4F 4F 4F 4F 4F 4F 41
41
41
4I
41
4I
4J 4J 4J 4J 4J 4J
5H 5H 5H 5H 5H 5H 5A 5A 5A 5A 5A 5A 5C 5C 5C 5C 5C 5C 5B
5B
24
29
31
33
37
17
16
15
17
18
20
18
20
19
19
18
14
18
18
17
17
13
16
15
15
16
15
14
18
20
17
19
18
19
17
14
15
15
14
13
10
28
24
24
19
22 22 17
16
23
0801
0804
0808
0810
0814
0915
0917
0918
0940
0945
0948
1035
1038
1040
1055
1057
1100
1310
1314
1318
1340
1343
l348
1157
1200
1205
1218
1220
1225
0730
0734
0738
0740
0743
0748
1243
1249
1255
1302
l310
1318
1025
1029
1032
1034
1036
1040
1136
1145
6
5
4
2 1
5
6
3
2
4
3
6
5
4
2
3
6
5
4
2
5
6
3
2
4
1 2
4
5
6
3
4
2
5 6
3
2
4
5
6
3
2
Catch of blue cod
Weight (kg) Number offish
0.49
6.97
3.21
3.15
0.91
4.41
3.05
0.73
l.08
l.55
7.08
2.74
5.58
8.95
5.49
0.00
9.21
21.38
0.00
0.00
4.20
7.72
6.34
5.32
4.12
2.11
l.75
3.22
3.97
0.00
0.00
0.00
0.00
0.00
l.90
3.98
l.96
4.33
4.10
4.27
4.40
0.90
13.19
3.85
0.39
4.09
2.96
2.64
2.35
20
8 11
1
8
5
2 2
3
9
5
6
10
5
o 10
25
o o 8
9
14
11
4
5
4
6
7
o o o o o 3
14
4
11
5
11
9
2
15
5
1 7
3
7
3
Pot lift Pot
Set Date Phase Stratum station Depth (m) Time set number
3311-May-05
33 II-May-05
3311-May-05
33 II-May-05
34 II-May-05
34 II-May-05
34 II-May-05
34 II-May-05
34 II-May-05
34 II-May-05
35 12-May-05
35 12-May-05
35 12-May-05
35 12-May-05
35 12-May-05
35 12-May-05
36 13-May-05
36 13-May-05
36 13-May-05
36 13-May-05
36 13-May-05
36 13-May-05
37 13-May-05
37 13-May-05
37 13-May-05
37 13-May-05
37 13-May-05
37 13-May-05
38 14-May-05
38 14-May-05
38 14-May-05
38 14-May-05
38 14-May-05
38 14-May-05
39 14-May-05
39 14-May-05
39 14-May-05
39 14-May-05
39 14-May-05
39 14-May-05
40 14-May-05
40 14-May-05
40 14-May-05
40 14-May-05
40 14-May-05
40 14-May-05
2
2
2
2
2
2
2
2
2
2
2
2
2
2
2
2
2
2
2
2
2
2
2
2
2
2
2
2
2
2
5 5B
5 5B
5 5B
5 5B
5 5G
5 5G
5 5G
5 5G
5 5G
5 5G
2 2E
2 2E
2 2E
2 2E
2 2E
2 2E
6 6new
6 6new
6 6new
6 6new
6 6new
6 6new
6 6L
6 6L
6 6L
6 6L
6 6L
6 6L
7 7J
7 7J
7 7J
7 7J
7 7J
7 7J
7 7K
7 7K
7 7K
7 7K
7 7K
7 7K
7 7A
7 7A
7 7A
7 7A
7 7A
7 7A
16
17
18
17
11
13
14
12
14
14
17
20
20
21
21
20
83
86
88
86
84
86
86
83
85
84
83
84
77
79
78
78
78
77
77
77
76
76
75
78
77
76
73
74
77
75
24
1153
1202
1210
1217
0856
0859
0906
0909
0915
0913
0734
0736
0739
0743
0747
0753
0828
0845
0852
0904
0910
0920
0945
1005
1022
1037
1054
1112
0734
0739
0745
0753
0758
0805
0853
0905
0917
0930
0945
0955
1010
1020
1035
1045
1058
1110
4
5
6
3
3 6
5
4
1 2
3 6
5
4
2
1 6
3
2
1 5
4
6
3
2
1
5
4
4
5
1 2
3
6
4
5
1 2
3 6
4
5
2
3 6
Catch of blue cod
Weight (kg) Number offish
0.00
0.52
0.59
0.25
0.83
0.00
0.00
1.18
2.64
0.00
0.00
0.30
0.00
1.41
0.66
0.44
11.13
6.63
15.33
6.11
13.55
17.99
9.60
13.72
5.84
6.17
4.45
8.89
8.61
6.57
4.18
0.00
1.69
4.10
5.00
8.02
5.75
7.24
8.15
6.30
6.64
3.42
5.56
8.61
12.26
8.48
o 2
2
o o 3
4
o o
o 3 2
2
6
3
7
3
8
11
6
8
4
5
5
10
11
6
7 o 5
7
5
7
6
8
12
8
6
4
4
10
13
9


