33
AC 239 Managerial Accounting Unit 2 Chapter 17 Financial Statement Analysis Jerry Kreuze Kaplan University

AC 239 Managerial Accounting
Unit 2
Chapter 17
Financial Statement Analysis
Jerry Kreuze
Kaplan University

AC 239 Managerial Accounting
Basic Analytical Methods include:
1.Horizontal analysis
2.Vertical analysis
3.Common-sized statements

AC 239 Managerial Accounting
Horizontal Analysis• Has four columns:
1. Current year amounts
2. Last year amounts
3. Dollar increase/decrease
4. Percentage increase/decrease (computed by dividing the dollar increase (3 above) by last year amounts (2 above)
Horizontal analysis is illustrated by Exhibits 1 – 4 on pages 764 – 766.

AC 239 Managerial Accounting
Vertical Analysis consists of two columns per year. There is an amount column and a percent column.
On the balance sheet, all amounts are expressed as a percentage of TOTAL ASSETS.
On the income statement, all amounts are expressed as a percentage of NET SALES.
See Exhibits 5 and 6 on pages 767 and 768 for examples of vertical analysis.
AC 239 Managerial Accounting
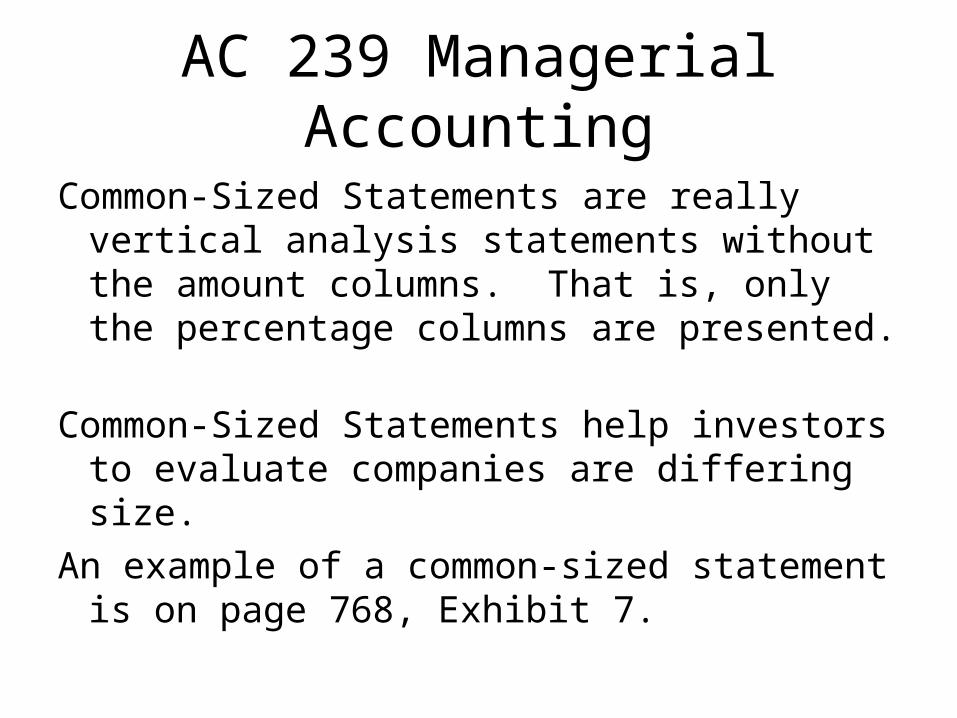
Common-Sized Statements are really vertical analysis statements without the amount columns. That is, only the percentage columns are presented.
Common-Sized Statements help investors to evaluate companies are differing size.
An example of a common-sized statement is on page 768, Exhibit 7.

AC 239 Managerial Accounting
The rest of the chapter deals with ratios and other measures to assess profitability and solvency.
We can start with solvency measures. On a short-term basis, there are three current position analysis that measure the company’s ability to meet its current obligations as they become due:
• Working capital• Current ratio• Quick ratio
AC 239 Managerial Accounting
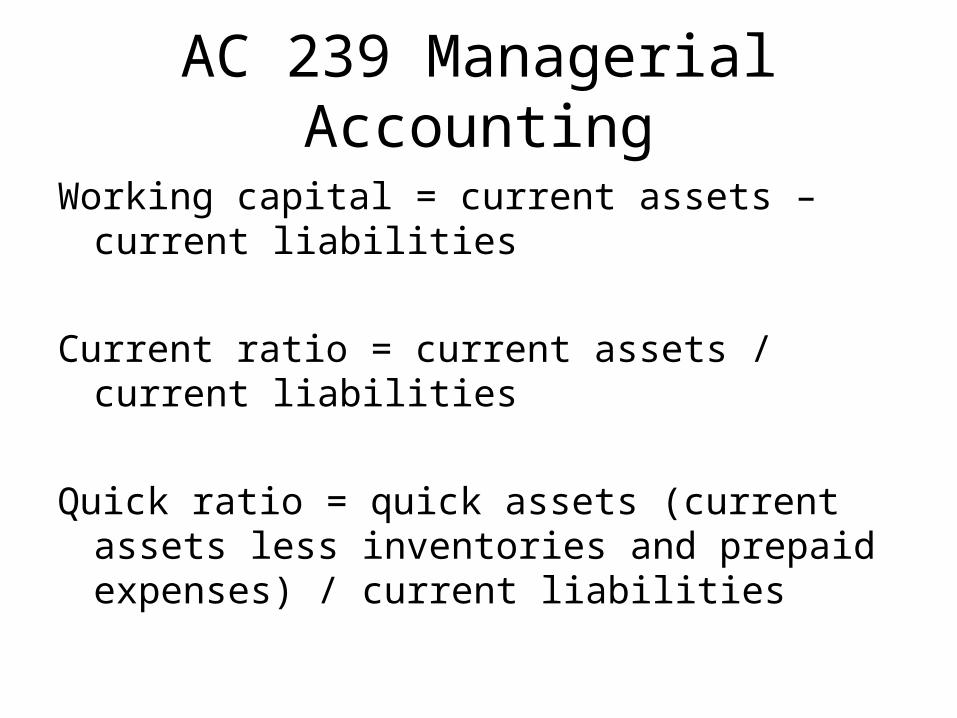
Working capital = current assets – current liabilities
Current ratio = current assets / current liabilities
Quick ratio = quick assets (current assets less inventories and prepaid expenses) / current liabilities

AC 239 Managerial Accounting
So, let us assume that a company has the following:
Assets Liabilities
Cash 10,000 Accounts Payable 17,000
Receivables 20,000 Salaries Payable 3,000
Inventory 30,000 Long-term liabilities 40,000
Compute:
a. Working capital

AC 239 Managerial Accounting
So, let us assume that a company has the following:
Assets Liabilities
Cash 10,000 Accounts Payable 17,000
Receivables 20,000 Salaries Payable 3,000
Inventory 30,000 Long-term liabilities 40,000
Compute:
a. Working capital = current assets – current liabilities
current assets = 10,000 + 20,000 + 30,000 = 60,000
current liabilities = 17,000 + 3,000 = 20,000
So, working capital = 60,000 – 20,000 = 40,000

AC 239 Managerial AccountingSo, let us assume that a company has the following:
Assets Liabilities
Cash 10,000 Accounts Payable 17,000
Receivables 20,000 Salaries Payable 3,000
Inventory 30,000 Long-term liabilities 40,000
Compute:
b. Current ratio
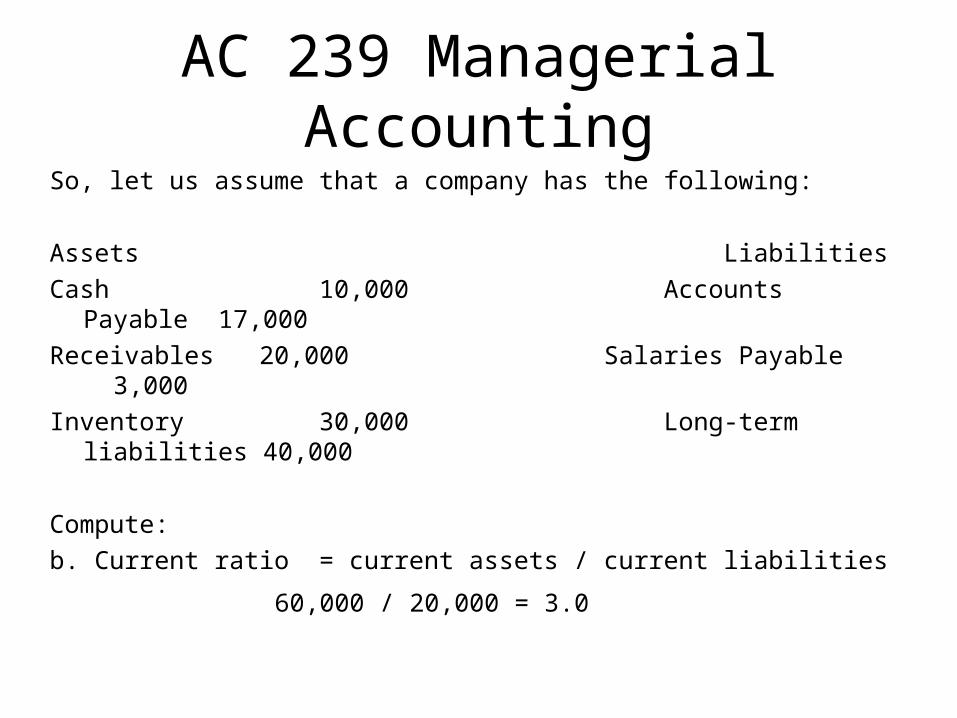
AC 239 Managerial AccountingSo, let us assume that a company has the following:
Assets Liabilities
Cash 10,000 Accounts Payable 17,000
Receivables 20,000 Salaries Payable 3,000
Inventory 30,000 Long-term liabilities 40,000
Compute:
b. Current ratio = current assets / current liabilities
60,000 / 20,000 = 3.0

AC 239 Managerial AccountingSo, let us assume that a company has the following:
Assets Liabilities
Cash 10,000 Accounts Payable 17,000
Receivables 20,000 Salaries Payable 3,000
Inventory 30,000 Long-term liabilities 40,000
Compute:
c. Quick ratio
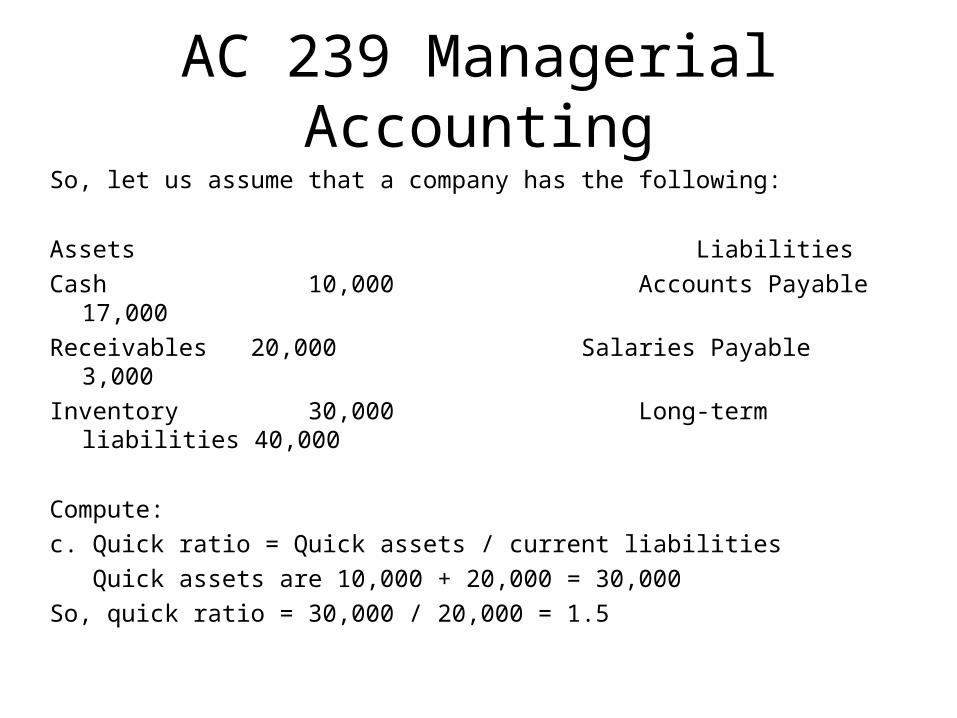
AC 239 Managerial AccountingSo, let us assume that a company has the following:
Assets Liabilities
Cash 10,000 Accounts Payable 17,000
Receivables 20,000 Salaries Payable 3,000
Inventory 30,000 Long-term liabilities 40,000
Compute:
c. Quick ratio = Quick assets / current liabilities
Quick assets are 10,000 + 20,000 = 30,000
So, quick ratio = 30,000 / 20,000 = 1.5

AC 239 Managerial Accounting
Next let us review Accounts Receivable Analysis, namely:
• Accounts receivable turnover = net sales / average accounts receivable
• Number of days’ sales in receivables = average accounts receivable / average daily sales (net sales / 365 days)

AC 239 Managerial Accounting
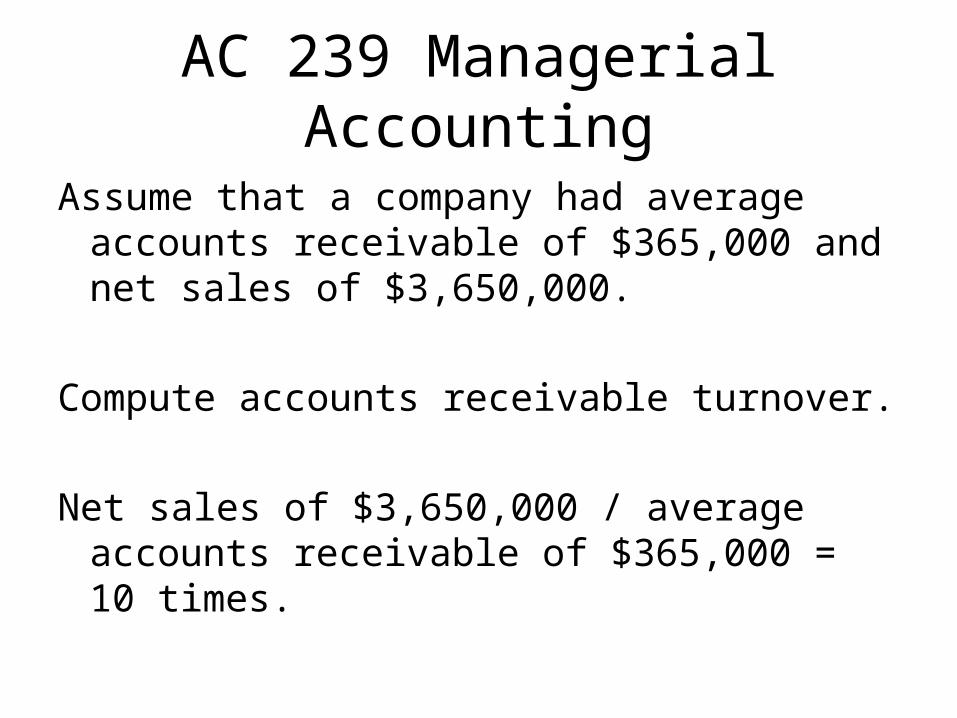
Assume that a company had average accounts receivable of $365,000 and net sales of $3,650,000.
Compute accounts receivable turnover.
AC 239 Managerial Accounting
Assume that a company had average accounts receivable of $365,000 and net sales of $3,650,000.
Compute accounts receivable turnover.
Net sales of $3,650,000 / average accounts receivable of $365,000 = 10 times.

AC 239 Managerial Accounting
Assume that a company had average accounts receivable of $365,000 and net sales of $3,650,000.
Now let us compute number of days’ sales in receivables.

AC 239 Managerial Accounting
Assume that a company had average accounts receivable of $365,000 and net sales of $3,650,000.
Now let us compute number of days’ sales in receivables.
Average accounts receivable of $365,000 / average daily sales ($3,650,000 / 365 days = $10,000) = 36.5 days

AC 239 Managerial Accounting
A similar analysis can be accomplished with inventory. That is, we compute inventory turnover and number of days’ sales in inventory.
Inventory turnover is computed by dividing cost of goods sold by average inventory.
Number of days’ sales in inventory is computed by dividing average inventory by average daily cost of goods sold (cost of goods sold / 365 days).

AC 239 Managerial Accounting
Assume that a company has cost of goods sold of $365,000 and average inventory of $100,000.
Then, inventory turnover would be:

AC 239 Managerial Accounting
Assume that a company has cost of goods sold of $365,000 and average inventory of $100,000.
Then, inventory turnover would be:
Cost of goods sold of $365,000 / average inventory of $100,000 = 3.65 times

AC 239 Managerial Accounting
Assume that a company has cost of goods sold of $365,000 and average inventory of $100,000.
The number of days’ sales in inventory would be:

AC 239 Managerial Accounting
Assume that a company has cost of goods sold of $365,000 and average inventory of $100,000.
The number of days’ sales in inventory would be:
Average inventory of $100,000 / average daily cost of goods sold of $1,000 = 100 days

AC 239 Managerial Accounting
Other ratios in this chapter include:
Ratio of fixed assets to long-term liabilities =
Fixed assets / long-term liabilities
Gives an indication of security for long-term creditors.

AC 239 Managerial Accounting
Ratio of Liabilities to Stockholders’ Equity = Total liabilities / total stockholders’ equity
Shows how the company financed its assets, by debt or by equity.

AC 239 Managerial Accounting
The last solvency ratio is the number of times interest charges earned.
This ratio is computed as EBIT / Interest Expense.
EBIT = Income before Interest and Income Taxes

AC 239 Managerial Accounting
The last solvency ratio is the number of times interest charges earned.
This ratio is computed as EBIT / Interest Expense.
EBIT = Income before Interest and Income Taxes
So, if a company has the following income statement items, compute the number of times interest charges earned ratio.
Net income = $30,000, interest expense = $20,000, income tax expense = $10,000.
Ratio = EBIT ($30,000 + $20,000 + $10,000) $60,000 / $20,000 interest expense = 3.0 times

AC 239 Managerial Accounting
Profitability ratios are many. They are listed on page 777.
The rest of chapter covers these profitability ratios.
For the rest of our Seminar, we are going to concentrate on earnings per share.

AC 239 Managerial Accounting
Earnings per share is an important measure of profitability that is widely used.
It is computed as (Net Income – Preferred Dividends) / shares of common stock outstanding
So, if a company had the following compute EPS:
Net income = 500,000
Common shares outstanding = 100,000
Preferred shares outstanding = 50,000
Common dividends paid = $50,000
Preferred dividends paid = $100,000

AC 239 Managerial Accounting
Earnings per share is an important measure of profitability that is widely used.
It is computed as (Net Income – Preferred Dividends) / shares of common stock outstanding
So, if a company had the following compute EPS:
Net income = $500,000
Common shares outstanding = 100,000
Preferred shares outstanding = 50,000
Common dividends paid = $50,000
Preferred dividends paid = $100,000
EPS = (Net income of $500,000 – P. Dividends of $100,000)/ 100,000 common shares o/s = $4.00 per common share

AC 239 Managerial Accounting
Earnings per share is an important measure of profitability that is widely used.
It is computed as (Net Income – Preferred Dividends) / shares of common stock outstanding
So, if a company had the following compute EPS:
Net income = $500,000
Common shares outstanding = 100,000
Preferred shares outstanding = 50,000
Common dividends paid = $50,000
Preferred dividends paid = $100,000
Now, what would dividends per share on common stock be (dividends/shares of common stock outstanding)
AC 239 Managerial Accounting
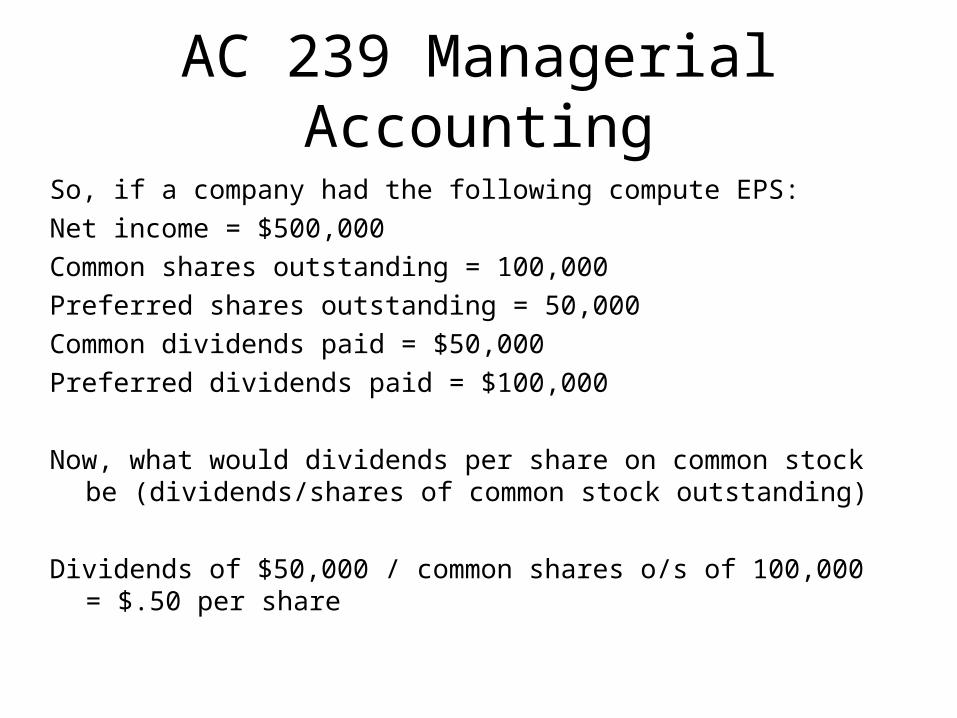
So, if a company had the following compute EPS:
Net income = $500,000
Common shares outstanding = 100,000
Preferred shares outstanding = 50,000
Common dividends paid = $50,000
Preferred dividends paid = $100,000
Now, what would dividends per share on common stock be (dividends/shares of common stock outstanding)
Dividends of $50,000 / common shares o/s of 100,000 = $.50 per share


