38
Academic Accountability HOUSE PUBLIC EDUCATION COMMITTEE JANUARY 30, 2019 1

Academic Accountability HOUSE PUBLIC EDUCATION COMMITTEE
JANUARY 30, 2019
1

TEA. Texas Educati o l'1 Agency
►
A-F Accountability: How It Was Designed
HB 2804
HB 22
84th Legislature 85th Legislature
“The commissioner shall evaluate school district and campus performance and assign each district and campus an overall performance rating of”
A B C D or F 2
Texas Education Agency
........................................................ £ .................................................. , ,«!!fr
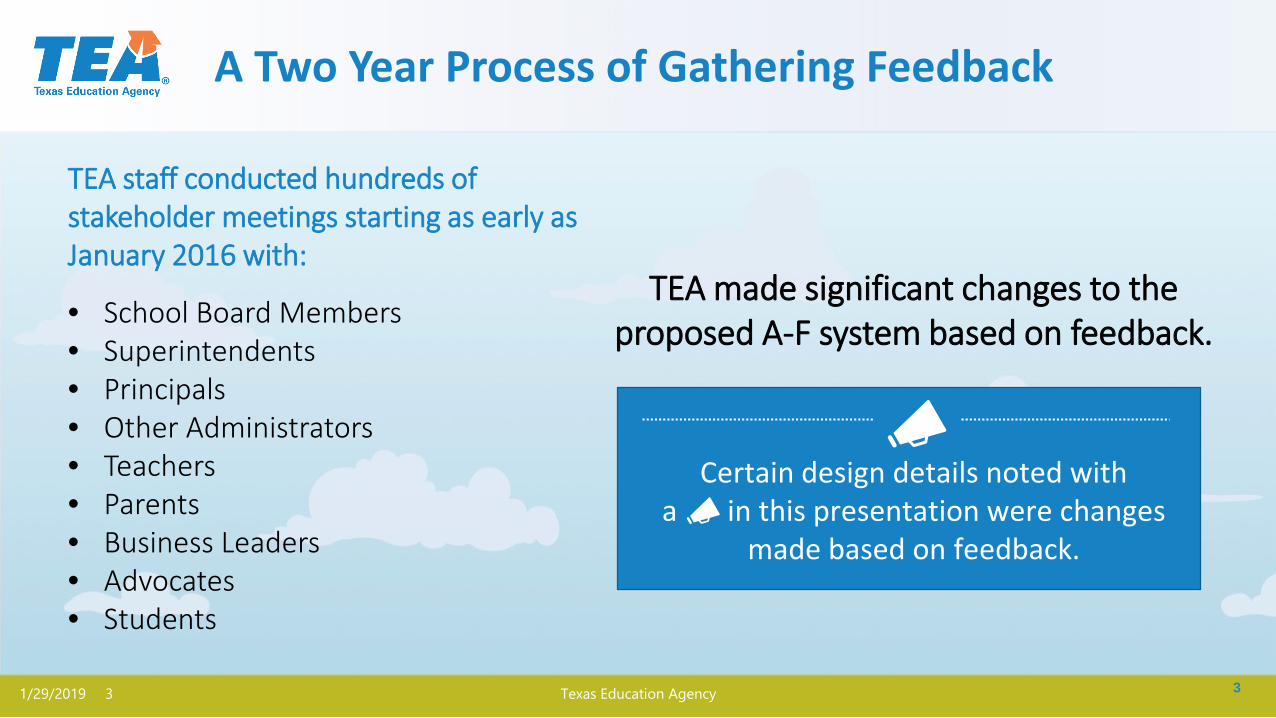
A Two Year Process of Gathering Feedback
TEA staff conducted hundreds of stakeholder meetings starting as early as January 2016 with:
TEA made significant changes to the • School Board Members proposed A-F system based on feedback. • Superintendents • Principals • Other Administrators • Teachers • Parents • Business Leaders • Advocates • Students
Certain design details noted with a in this presentation were changes
made based on feedback.
1/29/2019 3 Texas Education Agency 3

Texas Education Agency
A–F Accountability: New Labels/Grades
2017-18 – Labels applied to districts A = Exemplary Performance 2018-19 – Labels will apply to campuses
B = Recognized Performance
C = Acceptable Performance
D = In Need of Improvement
F = Unacceptable Performance
4
TEA® Texas Education Agency
2
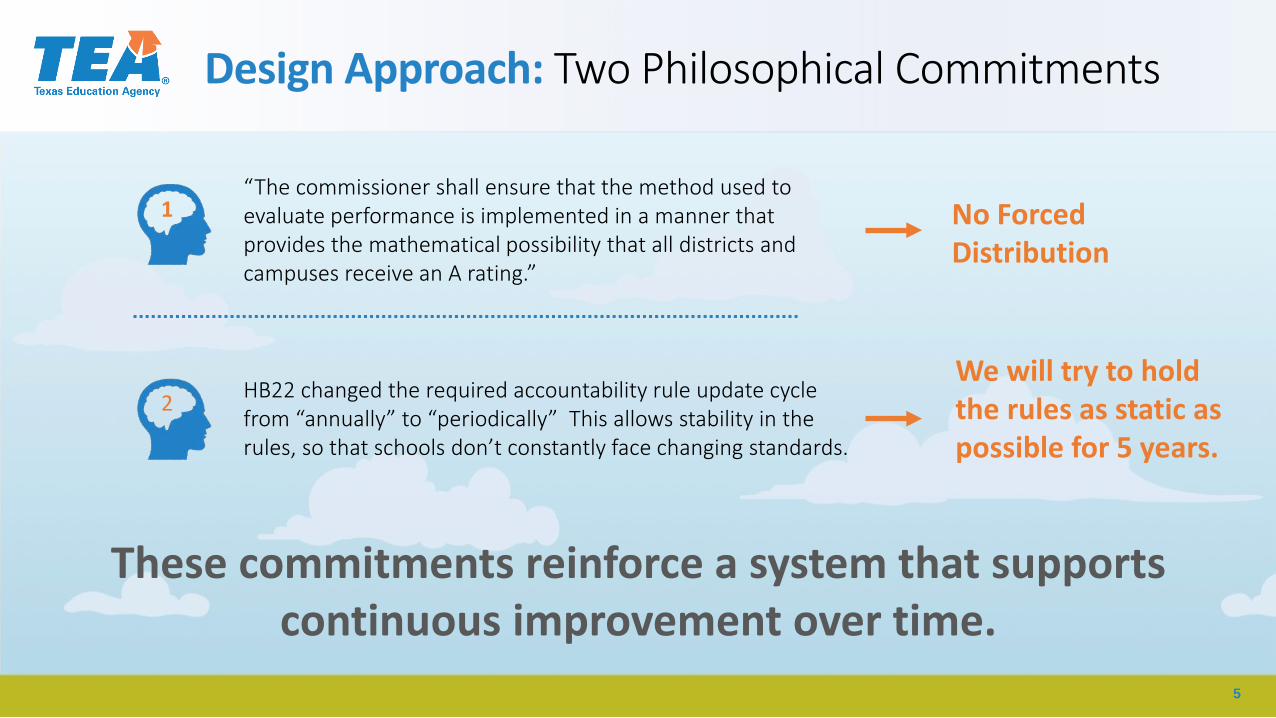
Design Approach: Two Philosophical Commitments
1 “The commissioner shall ensure that the method used to evaluate performance is implemented in a manner that No Forced provides the mathematical possibility that all districts and Distribution campuses receive an A rating.”
We will try to hold HB22 changed the required accountability rule update cycle
the rules as static as from “annually” to “periodically” This allows stability in the rules, so that schools don’t constantly face changing standards. possible for 5 years.
These commitments reinforce a system that supports continuous improvement over time.
5

TEA. Texas Educati o l'1 Agency
Three Domains: Combining for Overall Score
This design has produced ratings that are not strongly correlated with poverty.
Closing The Gaps
School Progress
Student Achievement
Best of Achievement or Progress: 70% 30% This design reflects a commitment:
• to recognize high student achievement and
• to recognize the impact of highly effective educators,
• while maintaining focus on the students most in need.
6
TEA ® Texas Education Agency
HUW'l'll:.U. IS. IHISOISllU(I
PE Rf ORM I NG OVBtAl L?
ST\ID!NT ActH\'l!t.l!NT
71~ $11,1d; m ,,;;hlo.~m: n ~orroln 1,c.., .,, ',t;n-:1: ·1,m:w,..-• ,,-~ 1,lfr ,:
W, IJ<M ~ ,•~ o • .lo,> ....... ( ~ •Al .
A N~W WftYO~ l.OOklNG AJ ACA1:lu .• ,c PEfl:FO~\ANCI:.
... , ,n·; . 1>:r~ ~•·:;M~t'IO,,ffi.1U':, m, mr.w,; ,II ,\ f"')M l,l'll { •'.f :rt~I.;,~ 6 ~ >!He:: ,; -... a:-.:. I '~ 'l:( l •t > l,...i:;, ,111,. , ,~ "'- •'!""'*• " j ,,._ ,lt,,•l • ~ * ' ~ ' ' • A , .. 1..-M•A U. " A'l"• lt s. ;,..,•, ,..,1-!; ' " A •
1 ::.dcn~; "<!OJr. :;J "~ ..... : ..... , ho ... h : or :-~ t ; do"' 1- d l'l'N:!"1 < ,z:;c~ :II: r.;?J;~r. :: "II :•: Ir ~, ~,,. .. .:, 1,· , rt ~ ~n ,· ~ •~ ~ ttr-.-~, n 1~• • It , ~ ~•~"' • t~ •·= t h, "" ""', , .,,.,., , ., on Arl::rl,nn - ~ T : 11, r i:<"•
, ... , '"*~ "' -~ • :,a,'"'"'" In" :I, ': ..... . ""·" • , .. . ... , ! Al ~ .n : ..-,~ A <~ ~ ~1-t,; ,.,. ""' ~ '""· -:~0,1 ri.,~n~: 1: 1 ir:wi lNt ;l'.lry 01.:, ::ie~,r an, ::i:. ·i«:. ::.:· u;en~ r::on ,~ 1J : ~11"tw:-r- 1oh~ o ~ ◄"-•~ ... "'r•··,.. ~.,._. · -~ •r ~ ,... -~ ,. F , r-,. ..... , ,1
l=l SCHOOL P''-0CiRISS
,.~ S;h<>~ h'<>zrt·z ~;~ ;h,:,..-.:,r, h,:.·,, , 1,d,,·,h n~ ~ : ,1·· • ., ,u -· 10, 111 ,. ·t: <>,W 1111<• ~ to. ""' I"'"' Lh , .
CLOSING ffi! GAPS
.. , I dlfr , •r l p1~ ,l,ri11 ·•:• ;I ..,_,k. ..-~~.,,•,. , h lO,
-
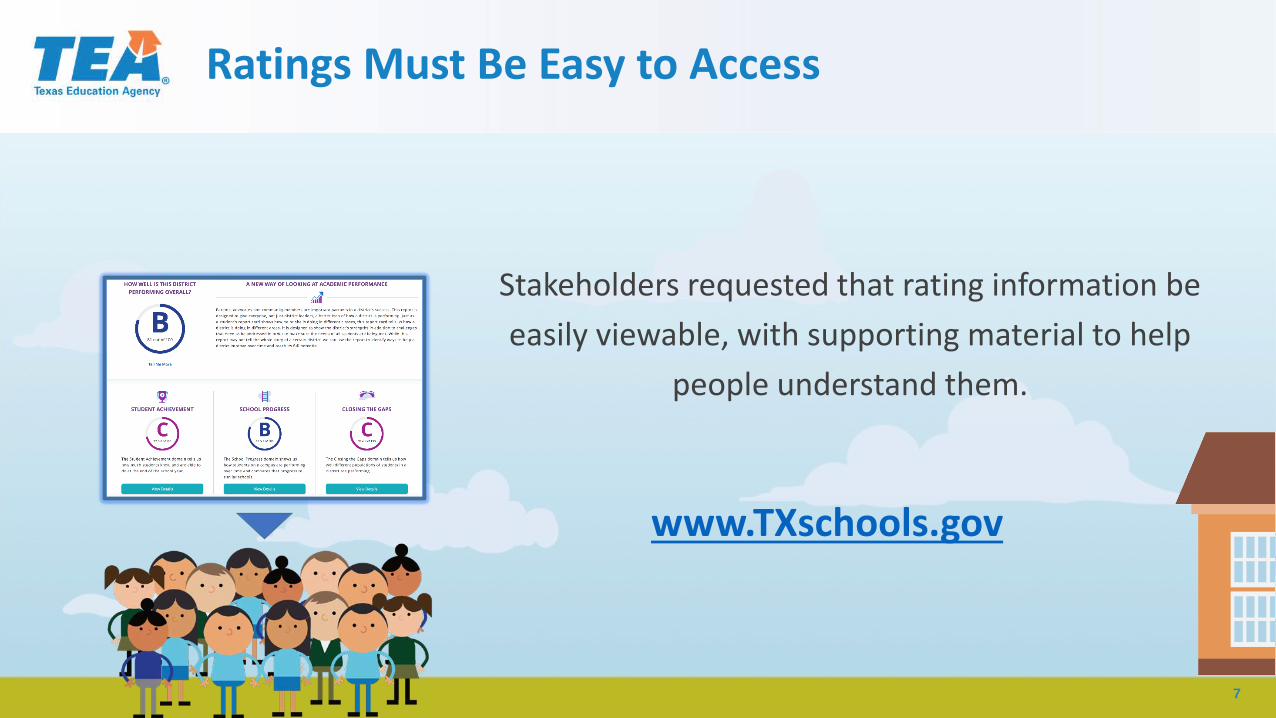
Ratings Must Be Easy to Access
Stakeholders requested that rating information be easily viewable, with supporting material to help
people understand them.
www.TXschools.gov
7

2017-18 Results
8

TEA ® Texas Education Agency
District Level Highlights
Including single campus districts* 1,187 ISDs/charters were evaluated**
A (90-100) – 16% - 153 districts
B (80-89) – 43%***
C (70-79) – 30%
D (60-69) – 8%
F (0-59) – 3% - 16 districts
*Excluding Single Campus Districts: A – 18% B – 43% C – 30% D – 7% F – 2%
* - 272 single campus districts/charters receive a Met Standard / Improvement Required label, but are still given a 0-100 point score ** - 83 districts/charters that received a Hurricane Harvey exception received either an A rating, or No Rating, but are still given a 0-100 point score *** - Districts receive a max score of 89 if they have any IR campuses, even if they would have otherwise received an A
9
TEA ® Texas Education Agency
}-
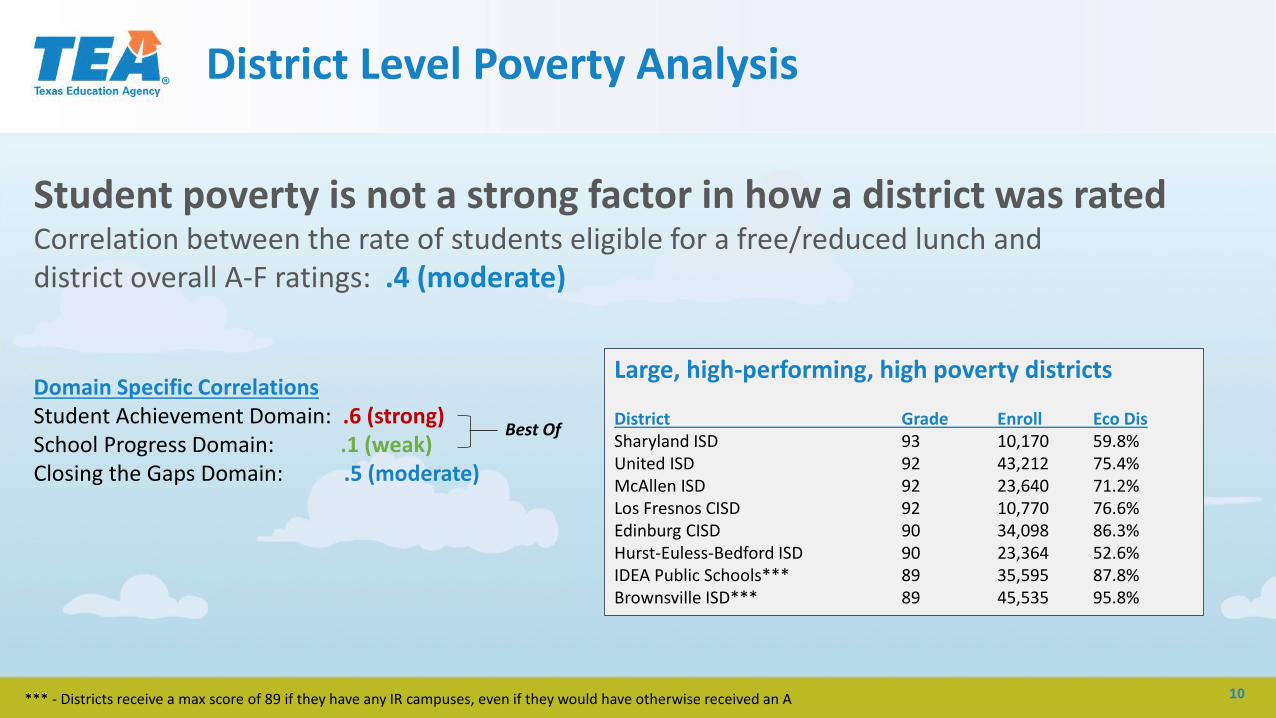
District Level Poverty Analysis
Student poverty is not a strong factor in how a district was rated Correlation between the rate of students eligible for a free/reduced lunch and district overall A-F ratings: .4 (moderate)
Large, high-performing, high poverty districts Domain Specific Correlations Student Achievement Domain: .6 (strong) School Progress Domain: .1 (weak) Closing the Gaps Domain: .5 (moderate)
Best Of District Sharyland ISD United ISD McAllen ISD
Grade 93 92 92
Enroll 10,170 43,212 23,640
Eco Dis 59.8% 75.4% 71.2%
Los Fresnos CISD 92 10,770 76.6% Edinburg CISD 90 34,098 86.3% Hurst-Euless-Bedford ISD 90 23,364 52.6% IDEA Public Schools*** 89 35,595 87.8% Brownsville ISD*** 89 45,535 95.8%
*** - Districts receive a max score of 89 if they have any IR campuses, even if they would have otherwise received an A 10

TEA ® Texas Education Agency
Campus Level Highlights
8,253 campuses were rated* (including 347 paired campuses):
Met Standard (90-100) [A] – 19% - 1,561 campuses
Met Standard (80-89) [B] – 36%
Met Standard (70-79) [C] – 30%
Met Standard (60-69) [D] – 10%
Improvement Required (0-59) [F] – 5% - 432 campuses (349)*
* - Because of Hurricane Harvey, about 1200 campuses were eligible to receive a “Not Rated” designation if they would have otherwise been rated Improvement Required. 86 campuses will receive a Not Rated designation, but the underlying 0-100 point score information is still visible. The total number of campuses receiving an “Improvement Required” rating is 349. The total number of rated campus is 8,167.
11

TEA ® Texas Education Agency
_}-
Campus Level Poverty Analysis
Student poverty is not a strong factor in how a campus was rated Correlation between the rate of students eligible for a free/reduced lunch and campus overall A-F ratings: .4 (moderate)
There are 259 high-poverty campuses (80-Domain Specific Correlations 100% Eco Dis) that received a score of 90-Student Achievement Domain: .7 (strong)
Best Of School Progress Domain: .1 (weak) 100 (ie, “A”). This represents 11% of all high-Closing the Gaps Domain: .4 (moderate) poverty campuses.
There are 169 low-poverty campuses (0-20% Eco Dis) that received a score below 90 (ie, less than an “A”).
12

Design Details
13

Texas Education Agency
Student Achievement Domain
Closing The Gaps
School Progress
Student Achievement
14

TEA® Texas Education Agency
■ ■ • ■
• • I • •
STII\R
STII\R Stalu ol Tl!•.1~
Asscs;,meN~ or Ac.iloemic R~.idln€$5
........................................................ '* .................................................. ,
Student Achievement: Calculating Score
Elementary School
Middle School
Rule adjusted proportional weighting for High School in the Student
Achievement domain to 40-40-20
ilitary Ready (CCMR)
•
• College, Career, MHigh School • Graduation Rates
15

Texas Education Agency
60x30TX
............... -................ . : :
Student Achievement: Calculating Score
Texas Higher Education Coordinating Board By 2030, at least 60% of Texans ages 25–34 will have a certificate or degree.
Student Achievement Score
All Students
Total Tests 3,212
# Approaches Grade Level or Above 2,977 # Meets Grade Level or Above 1,945 # Masters Grade Level 878 %
%
%
Approaches Grade Level or Above
Masters Grade Level
Meets Grade Level or Above
92.7% 60.6%
27.3%
A Average of 3
92.7 + 60.6 + 27.3 / 3 = 60.2
16

TEA. Texas Educati o l'1 Agency
El--
IJ __
........................................................ ,# .................................................. ,
Student Achievement: CCMR Indicators - HS
College Ready • Meet criteria on AP/IB exams • Meet TSI criteria (SAT/ACT/TSIA) in reading and
mathematics • Complete a college prep course offered by a
partnership between a district and higher education institution as required from HB5
• Complete a course for dual credit • Complete an OnRamps course • Earn an associate’s degree • Meet standards on a composite of indicators
indicating college readiness
Career Ready • Earn industry certification • Be admitted to post-secondary industry
certification program
Military Ready Enlist in the United States Armed Forces
Rule provided partial credit in the near term for coherent sequence students who participate in aligned coursework, even if they don’t receive
a certification.
17

TEA. Texas Educati o l'1 Agency
El--
IJ __
........................................................ ,# .................................................. ,
Student Achievement: CCMR Indicators - HS
College Ready • Meet criteria on AP/IB exams • Meet TSI criteria (SAT/ACT/TSIA) in reading and
mathematics • Complete a college prep course offered by a
partnership between a district and higher education institution as required from HB5
• Complete dual credit courses • Complete OnRamps courses • Earn an associate’s degree • Meet standards on a composite of indicators
indicating college readiness
Career Ready • Earn industry certification • Be admitted to post-secondary industry
certification program
Military Ready Enlist in the United States Armed Forces
Rule provided credit for a single course passed in English or math, or for 9 credit hours in any
subject area
18

TEA. Texas Educati o l'1 Agency
School Progress Domain
Closing The Gaps
Student Achievement
School Progress
19

TEA Texas Educati o l'1 Agency®
. ........................................... , '* ............................................. .
•• ••• •••••
·= • ·············································,* ............................................. .
School Progress Domain: Two Aspects
PART 1 PART 2
Student Growth Relative Performance
Even though growth measures are limited for HS, the Rule included best of credit in
HS for growth.
Rule provided credit for best campus rating between part 1 and part 2,
rather than an average, with caveat that an F in 3 out of 4 (sub)domains
(including these two parts) will be an F overall.
20

TEA ® Texas Educati o l'1 Agency
I I I I
• I i . I • • • • • • • • • • • • •
• • • • • • • • • • • • • • • ·-
·············································,# ··············································
School Progress Domain: Student Growth
STA
AR
Perfo
rman
ce Le
vel Masters Masters
Meets Meets
Approaches Approaches
Does Not Meet Does Not Meet
Exceeds + 1 Point Awarded For meeting or exceeding expected growth
Expected
+ .5 Points Awarded Maintains For maintaining proficiency but
failing to meet expected growth
+ 0 Points Awarded Limited For falling to a lower level
3rd Grade Example 4th Grade Example
Rule provided partial credit for maintaining Meets or Approaches Grade Level, even if
vertical scale scores don’t increase.
21

Texas Education Agency
............................................ , '* ............................................. .
School Progress Domain: Relative Performance
Higher Levels of Student
Achievement
Stud
ent A
chie
vem
ent
Dom
ain
Scor
e fo
r All S
tude
nts
% Economically Disadvantaged Students
Rule used a curved line of best fit (quadratic vs linear) to reduce rating biases of very low &
very high poverty campuses.
Higher Rates of Economically
Disadvantaged
22

TEA® Texas Education Agency
100%
• • • • +,I • C • • cu • • A• E • • cu • • • • • e • • > • • • • cu • • • ·- 48% .c • .•c • • u • • • <( • • • • D +,I
C • cu F "tJ ::::s +,I U)
0%
0% 65% 100%
Poverty
Relative Performance: Measuring School Progress
23
TEA. Texas Educati o l'1 Agency
Closing The Gaps Domain
Closing The Gaps
School Progress
Student Achievement
24

TEA. Texas Educati o l'1 Agency
............................................ , '* ............................................. .
·········:::::•~·······•=::::••····· .................................... ·:.·.·.·.-.-.·.-:.::::::: :: :. . ... .. .. I ....... = = =:: = = = _._._. _._._._._._._._._._._._._._._._._._._._._._._._._._._. .............................. .
•••••••••••••••• ••••••••• ■ •••••••••••••
····························· ·······•···•···
Closing the Gaps: Educational Equity
All Students
Domain 3 in the Rule complies with ESSA requirements, allowing a single state & federal
accountability system.
Continuously Enrolled English Economically Race/Ethnicity Special Education and Mobile Learners (ELs) Disadvantaged
x x
25

r~!.'!-Texas ..
. ...................................... '* .................................. ..
Closing the Gaps: Educational Equity
Student Groups (Up to 13) • All Students • African American • Hispanic • White • American Indian • Asian • Pacific Islander
Rule included weighting for growth at 50% of Domain 3 indicators
• Two or More Races • Economically Disadvantaged • Current and Former Special Education • Current and Monitored English Learners • Continuously Enrolled • Non-Continuously Enrolled
Indicators (Up to 6) • Academic Achievement on STAAR
in Reading and Mathematics at Meets Grade Level standard
• English Learner Language Proficiency Status
• Elementary & Middle School: • Growth in Reading and
Mathematics on STAAR • Student Achievement Domain
score • High School / K-12 / Districts:
• 4 Year Graduation Rates • College, Career, and Military
Readiness Performance
26

TEA ® Texas Educati o l'1 Agency
······································• ® ······································• ® ······································• ® ······································• ® ······································• ®
•• ••
♦
•• •• •• •• •• •• •• •• •• •• •• •• •• •• •••• •• ••••• •• •••• •• ••••••• ••• ••••••••• ••••
••••••••• •••• ..... ····•\'s
·························: .. •:•' . . . . .. . . . . . . ..... • ••• •• ••• •• ····· .. • ••• •• ••• •• •••• ••
•••• • •• •••• ••
•••• • •• •• • •• ••
•• •• •• ••
•• •• ••
•• •• •• •• ....................................... '* ····································
Closing the Gaps: Educational Equity
Achievement Target
% of Student Groups that meet target
Overall Grade
Rule includes targets for the first five years equal to current state averages.
Student Group
27

TEA. Texas Educati o l'1 Agency
"~= D= 13~
I
Local Accountability
*Example
Local Assessments
*Example
SaExtra-Curricular Activities
Local Accountability
Closing The Gaps
School Progress
Student Achievement
28
TEA. Texas Educati o l'1 Agency
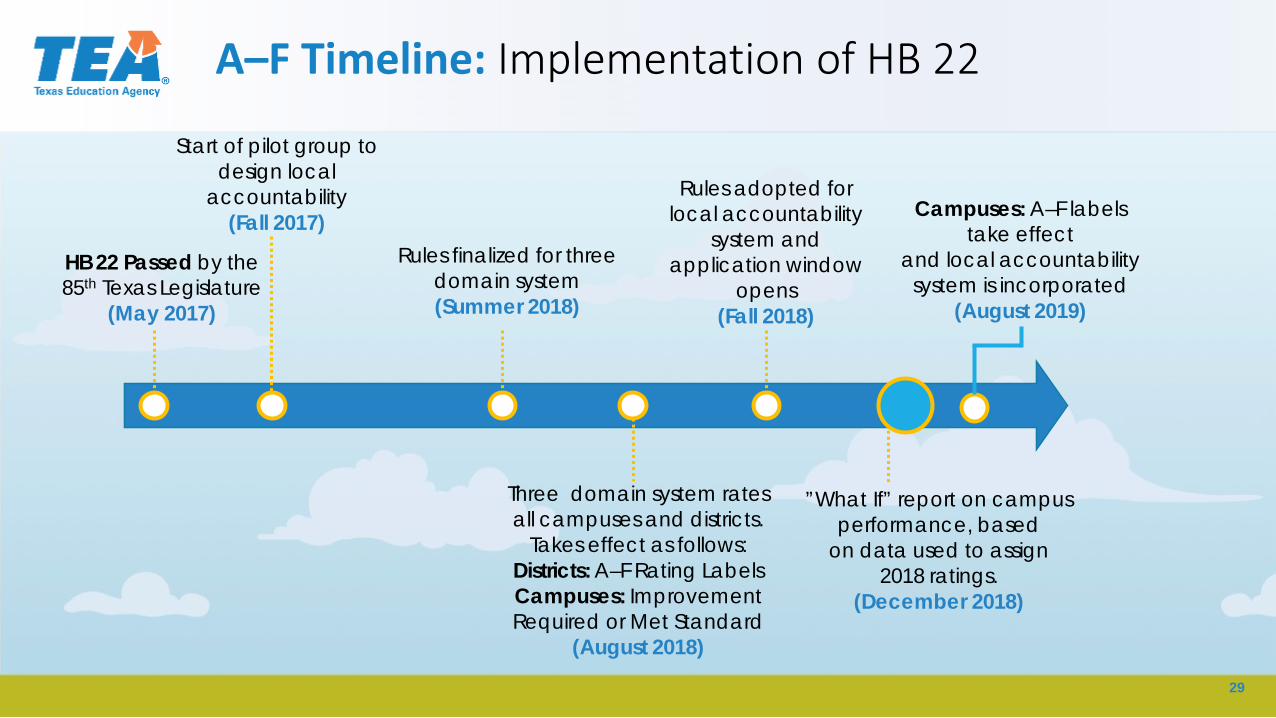
A–F Timeline: Implementation of HB 22
Start of pilot group to design local
Rules adopted for accountability local accountability Campuses: A–F labels (Fall 2017)
system and take effect Rules finalized for three and local accountability HB 22 Passed by the application window
85th Texas Legislature domain system opens system is incorporated (Summer 2018) (Fall 2018) (August 2019) (May 2017)
Three domain system rates ”What If” report on campus all campuses and districts. performance, based
Takes effect as follows: on data used to assign Districts: A–F Rating Labels 2018 ratings. Campuses: Improvement (December 2018) Required or Met Standard
(August 2018)
29

Appendix
30

TEA. Texas Education Agency
---------.: ..... --=---~ • ~ :t L__ ____ _
------------ J[
Ill Ill 1111 Ill -
STAAR is Based on SBOE Curriculum Standards
TEKS 3.5A: Represent one- and two-step problems involving addition and subtraction of whole numbers to 1,000 using pictorial models, number lines, and equations
Actual STAAR Question:
& Military Readiness
An art teacher had 736 crayons. She threw away 197 broken crayons. Then she bought 150 more crayons. Which equation shows how to find the number of crayons the art teacher has now?
A) 736 - 197 - 150 = ____ B) 736 - 197 + 150 = ____ C) 736 + 197 + 150 = ____ D) 736 + 197 - 150 = ____
Learn more at: www.texasassessment.com
ON TRACK
31

TEA ® Texas Education Agency
Ill Ill 1111 Ill -
The Texas Accountability System Has Been Proven toHelp Students in School & Life
Monitoring performance with school ratings has been shown to have long term benefits for students:
“Our analysis reveals that pressure on schools to avoid a low performance rating led low-scoring students to score significantly higher on a high-stakes math exam in 10th grade. These students were also more likely to accumulate significantly more math credits and to graduate from high school on time. Later in life, they were more likely to attend and graduate from a four-year college, and they had higher earnings at age 25.”
From the study, the biggest risks come if the system allows certain students to be exempted from accountability.
Source: https://www.educationnext.org/when-does-accountability-work-texas-system/ 32
TEA. Texas Educati o l'1 Agency
DM1 _SCORE 100
90
80
70
60
50
40
30
20
10
0
Student Performance Domain - ST AAR Performance
··- · ., ___ _ ··- - ·· ·-- -· -·- · ~-: ~=-=-.· ·· ··. ····... ·--- .. .. ··-·- ··. ■ ••• · - - · · · ... ····- · . . . --...
-.. ·--- .. . .. . .. . . .
10 20 30
.... - · ... -- ·
- - ·· .. . ■ - · ··-·· .. -- - - . -··- - . . ..... . - ···--· - ··· .. -··· - ··· -·· - .. . ··- ·· ... ·- ·· --- . . ---·· - . --- .. -· - ··--. -- ·-·-· ·- - ·- . - ·--··· . ·-·- ·-· .. - - - -·---···· ----· ·--~ ~-~i:~- ·.·
40 50 60 70 80 90
Campus 2017 Domain 1: Domain 1 - Meets Grade Level STD, Summed Grades 3-12, All Students All Tests Rate
Campus Type (B,E,M,S) Total Enrollment ••• • • • B ••• E ••• s
100
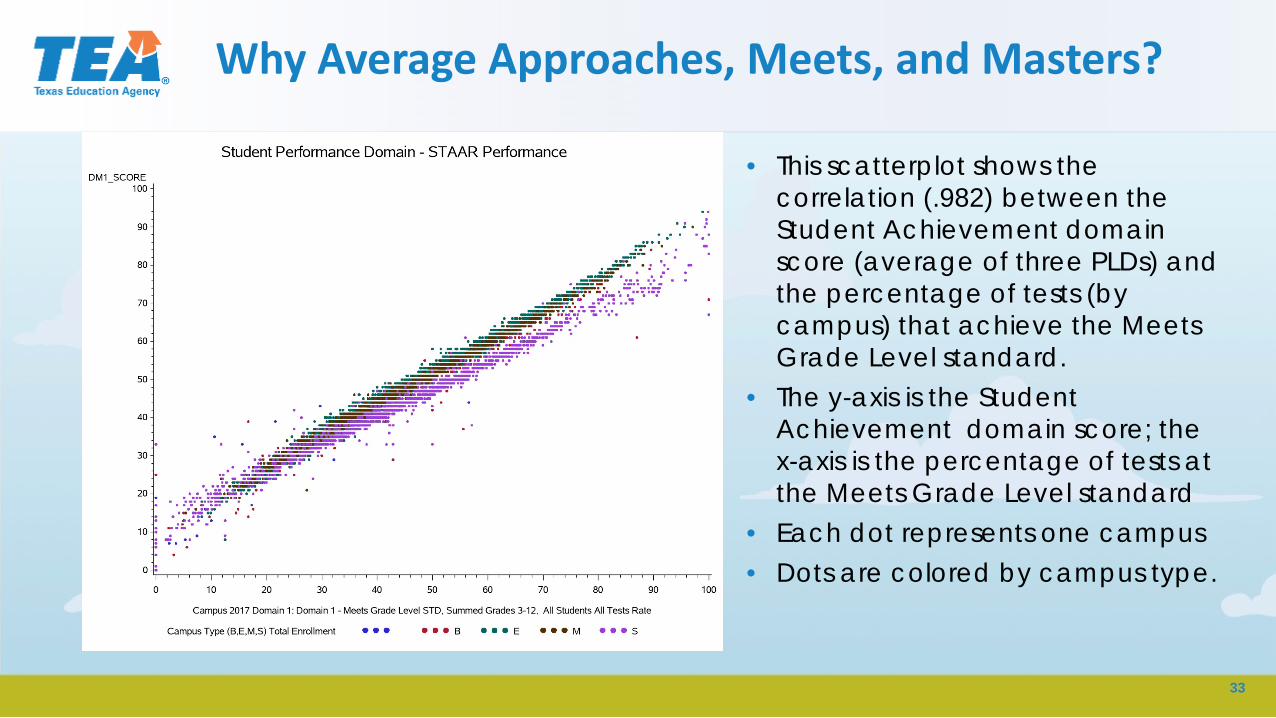
Why Average Approaches, Meets, and Masters?
• This scatterplot shows the correlation (.982) between the Student Achievement domain score (average of three PLDs) and the percentage of tests (by campus) that achieve the Meets Grade Level standard.
• The y-axis is the Student Achievement domain score; the x-axis is the percentage of tests at the Meets Grade Level standard
• Each dot represents one campus • Dots are colored by campus type.
33

Texas Education Agency
•• •
•• •• ••
• •• ••• •••
* ................. ====
CCMR Indicators
Computational Logic • Denominator is annual graduates. • Student who accomplishes any one is
in numerator. • All CCMR indicators lag by one year.
(CCMR data used in 2017–18 accountability will be from the 2016–17 school year.)
34

TEA. Texas Educati o 11 Agency
School Progress Domain: 2016-17 Benchmarking
Part A Scores: Frequency by Campus Type Elementary
(4,219) Middle School
(1,653) K–12 (334)
District (1,203)
Quantile Part A Score (based on modeling data from 2017 accountability)
100% (Max) 100 96 100 100 99% 88 85 87 86 95% 84 81 83 79 90% 82 78 80 77 75% (Q3) 78 75 76 73 50% (Med) 73 70 70 70 25% (Q1) 68 65 64 66 10% 63 61 59 62 5% 59 59 56 59 1% 52 54 45 49 0% (Min) 34 41 0 24
35
Texas Education Agency
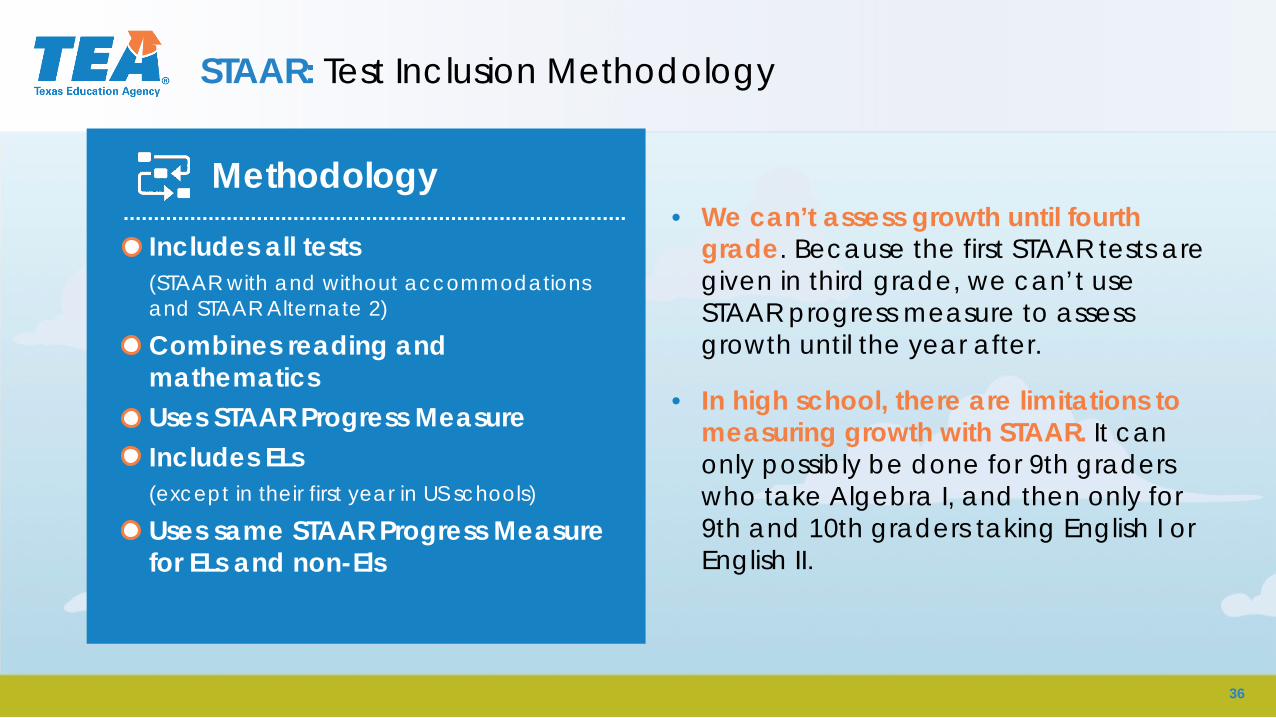
STAAR: Test Inclusion Methodology
Methodology • We can’t assess growth until fourth
Includes all tests grade. Because the first STAAR tests are (STAAR with and without accommodations given in third grade, we can’t use and STAAR Alternate 2) STAAR progress measure to assess Combines reading and growth until the year after. mathematics Uses STAAR Progress Measure Includes ELs
• In high school, there are limitations to measuring growth with STAAR. It can only possibly be done for 9th graders
(except in their first year in US schools) who take Algebra I, and then only for Uses same STAAR Progress Measure for ELs and non-Els
9th and 10th graders taking English I or English II.
36

37
All African American Pacific Two or Special Econ. Non-Hispanic White Asian ELL Continuous Students American Indian Islander more races Ed. Disadv. Continuous St
uden
t Ac
adem
ic
ELP
Gro
wth
Su
cces
s Ac
hiev
emen
t STAAR Performance Status (% at Meets Grade Level or Above) Elementary & Middle – 30% HS / K-12 – 50%
Reading Target 53% 43% 48% 67% 53% 78% 54% 63% 33% 44% 41% #% #%
Camp/Dis #% (Y) #% (Y) #% (Y) #% (Y) #% (Y) #% (Y) #% (Y) #% (Y) #% (Y) #% (Y) #% (Y) #% (Y) #% (Y)
Math Target 55% 43% 50% 66% 54% 85% 58% 62% 36% 47% 50% #% #%
Camp/Dis #% (Y) #% (Y) #% (Y) #% (Y) #% (Y) #% (Y) #% (Y) #% (Y) #% (Y) #% (Y) #% (Y) #% (Y) #% (Y)
STAAR Growth Status (Elementary and Middle Schools) 50% --
Reading Target 79% 75% 77% 82% 80% 90% 81% 81% 72% 76% 76% #% #%
Camp/Dis #% (Y) #% (Y) #% (Y) #% (Y) #% (Y) #% (Y) #% (Y) #% (Y) #% (Y) #% (Y) #% (Y) #% (Y) #% (Y)
Math Target 83% 80% 81% 81% 84% 98% 87% 86% 76% 80% 81% #% #%
Camp/Dis #% (Y) #% (Y) #% (Y) #% (Y) #% (Y) #% (Y) #% (Y) #% (Y) #% (Y) #% (Y) #% (Y) #% (Y) #% (Y)
4-Year Federal Graduation Status (High Schools and K-12) -- 10%
Grad Rate Target 90% 90% 90% 90% 90% 90% 90% 90% 90% 90% 90% #% #%
Camp/Dis #% (Y) #% (Y) #% (Y) #% (Y) #% (Y) #% (Y) #% (Y) #% (Y) #% (Y) #% (Y) #% (Y) #% (Y) #% (Y)
English Language Learner Proficiency Status 10% 10%
ELP Target 42%
Camp/Dis #% (Y)
College, Career and Military Readiness Performance Status (High Schools and K-12) -- 30%
CCMP Target 50% 34% 44% 62% 46% 84% 44% 58% 15% 39% 30% #% #%
Camp/Dis #% (Y) #% (Y) #% (Y) #% (Y) #% (Y) #% (Y) #% (Y) #% (Y) #% (Y) #% (Y) #% (Y) #% (Y) #% (Y)
Student Achievement Domain (STAAR Only) (Elementary and Middle Schools, certain K-12/HS) 10% --
STAAR Target 57% 46% 51% 68% 56% 83% 58% 65% 33% 48% 47% #% #%
Camp/Dis #% (Y) #% (Y) #% (Y) #% (Y) #% (Y) #% (Y) #% (Y) #% (Y) #% (Y) #% (Y) #% (Y) #% (Y) #% (Y)

TEA ® Texas Education Agency
2016-17 vs 2017-18
In 2016-17, the state used a 4 index system. There were 258 Improvement 2016-17 358 IR (Actual, 4 Index) Required (IR) campuses.
-----------------------------------------------------------
To perform an apples-to-apples comparison, TEA modeled what would happen if the new 3-domain A-F system were applied to the 2016-17 school year. Using the 2016-17 674 IR (Theoretical, 3 Domain)
A-F methodology, there would have been 674 IR campuses. -
In 2017-18, there are 432 IR campuses (including the Harvey exceptions). 2017-18 435 IR (3-Domain, incl Harvey)
==================================== This represents a one year reduction of 240 IR campuses. This is likely the largest improvement in low performing campuses in the state’s recent history.
Improvement 239 fewer IR
38


![2015 Adequate Yearly Progress Report - California … accountability system (or the Academic Performance Index [API]) for two years to focus on the development of a new state accountability](https://static.documents.pub/doc/80x56/5b4059637f8b9aff118d32fd/2015-adequate-yearly-progress-report-california-accountability-system-or-the.jpg)

