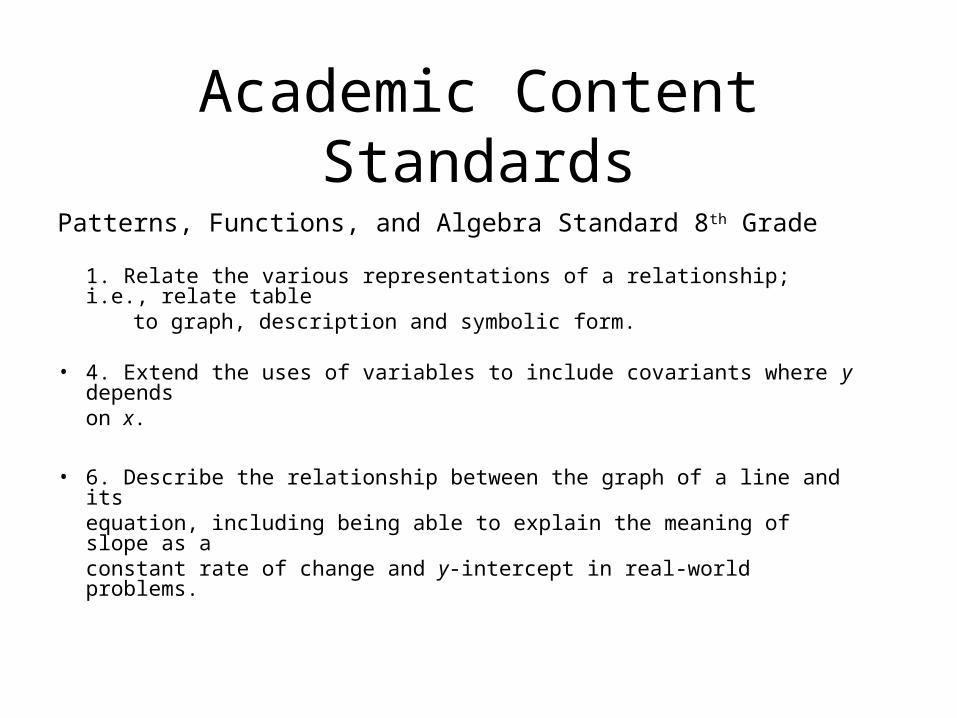
Academic Content Standards Patterns, Functions, and Algebra Standard 8 th Grade 1. Relate the various representations of a relationship; i.e., relate table to graph, description and symbolic form. • 4. Extend the uses of variables to include covariants where y depends on x. • 6. Describe the relationship between the graph of a line and its equation, including being able to explain the meaning of slope as a constant rate of change and y-intercept in real-world problems.
Transcript
Academic Content Standards
Patterns, Functions, and Algebra Standard 8th Grade
1. Relate the various representations of a relationship; i.e., relate table to graph, description and symbolic form.
• 4. Extend the uses of variables to include covariants where y dependson x.
• 6. Describe the relationship between the graph of a line and itsequation, including being able to explain the meaning of slope as aconstant rate of change and y-intercept in real-world problems.
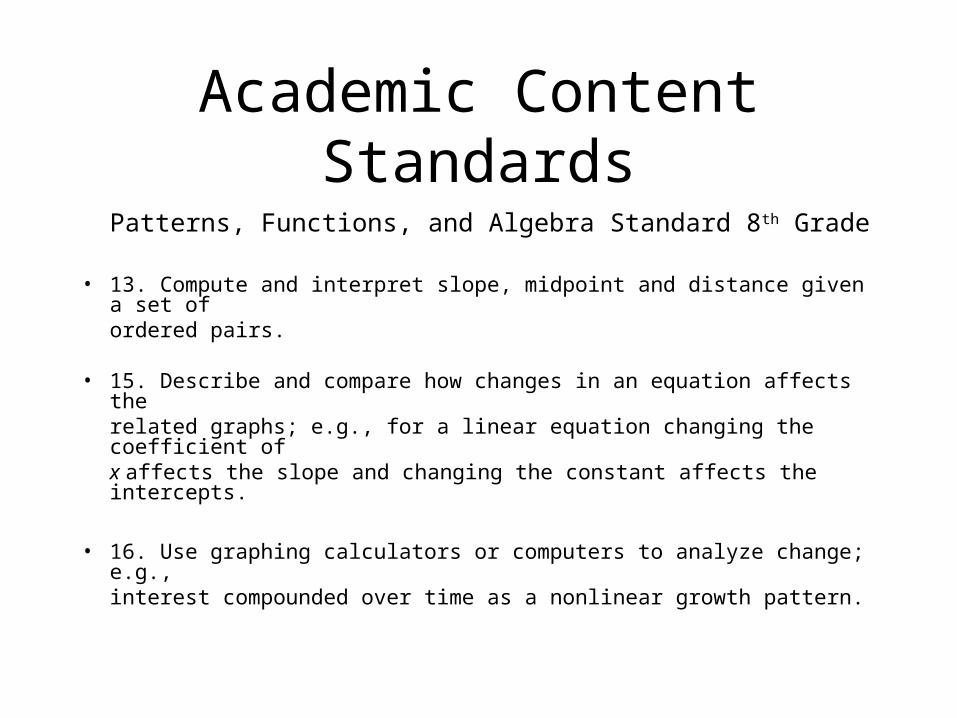
Academic Content Standards
Patterns, Functions, and Algebra Standard 8th Grade
• 13. Compute and interpret slope, midpoint and distance given a set ofordered pairs.
• 15. Describe and compare how changes in an equation affects therelated graphs; e.g., for a linear equation changing the coefficient ofx affects the slope and changing the constant affects the intercepts.
• 16. Use graphing calculators or computers to analyze change; e.g.,interest compounded over time as a nonlinear growth pattern.
Solve the following equation for “y”.
Solve the following equation for “y”.
24
3 xy
You just put the equation in slope-intercept form!!!
24
3 xy
5.3 Equation of Lines
Objectives:
1. Discover the slope intercept form of the equation of a line.
325
9 cf
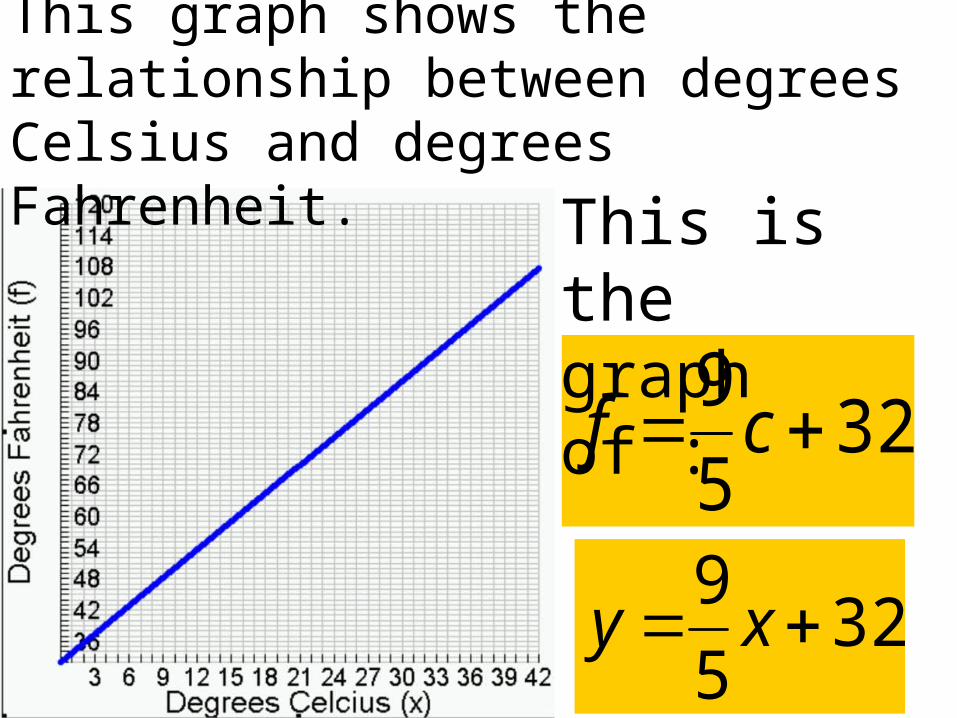
This graph shows the relationship between degrees Celsius and degrees Fahrenheit.
This is the graph of :
325
9 xy
To convert from C to F, pick some degrees Celsius to convert:
325
9 cf
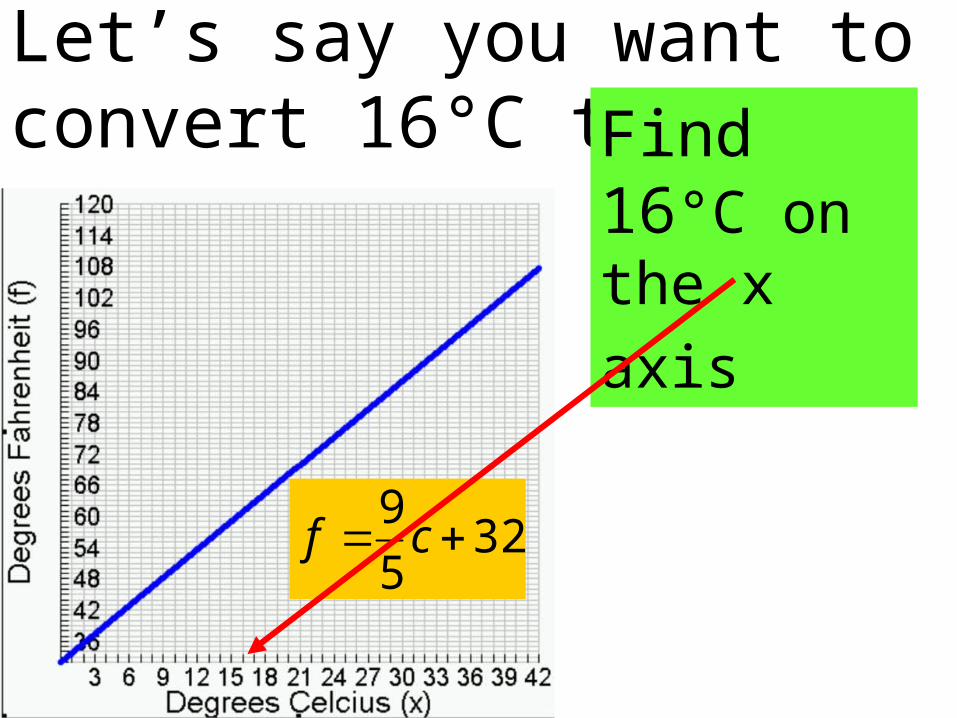
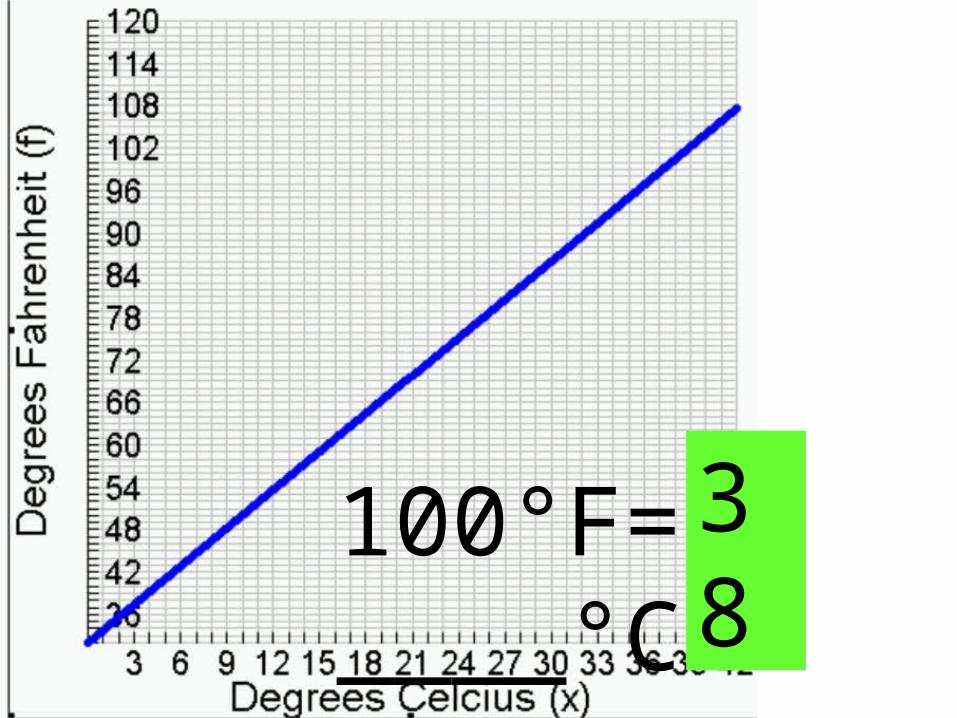
Let’s say you want to convert 16°C to °F.
325
9 cf
Find 16°C
on the x axis
325
9 cf
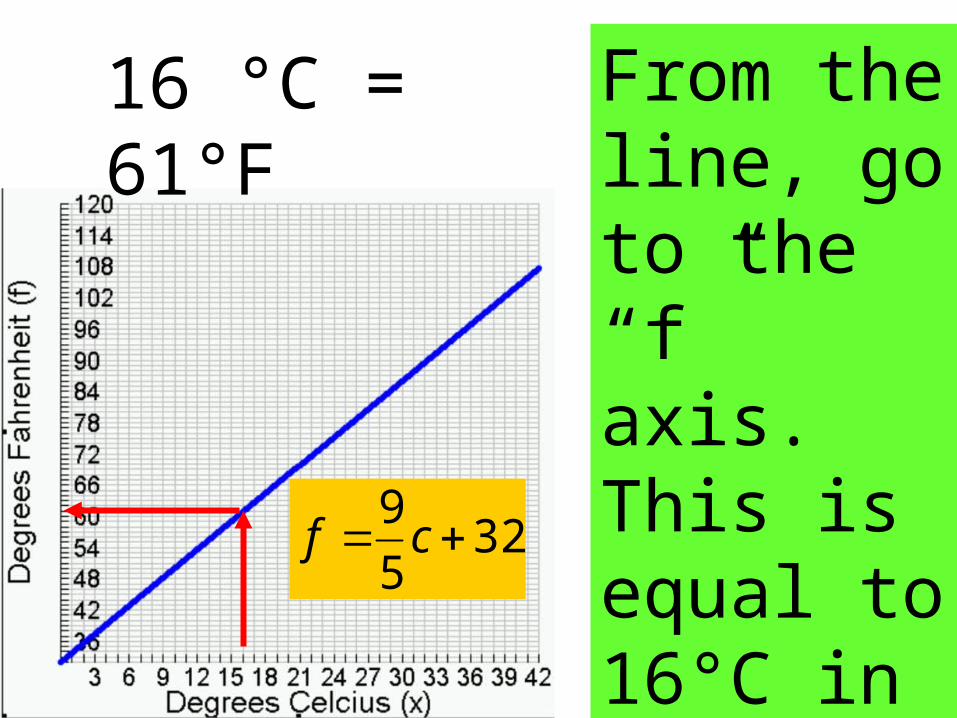
Go straight up from 16° to the line.
325
9 cf
From the line, go to the “f” axis. This is equal to 16°C in Fahrenheit!
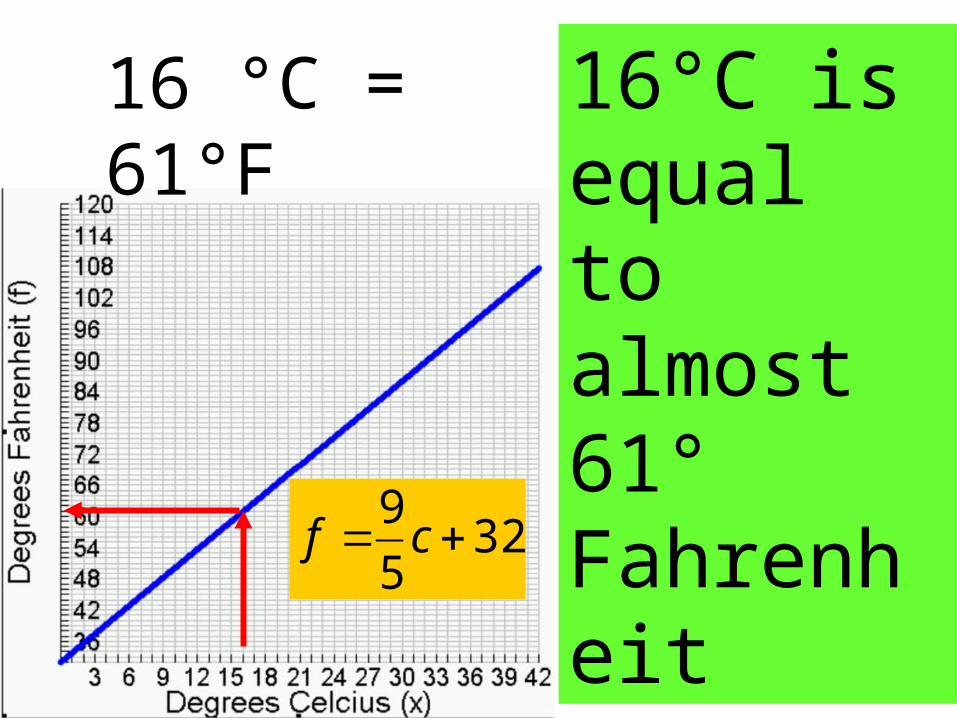
16 °C = 61°F
325
9 cf
16°C is equal to almost 61° Fahrenheit
16 °C = 61°F
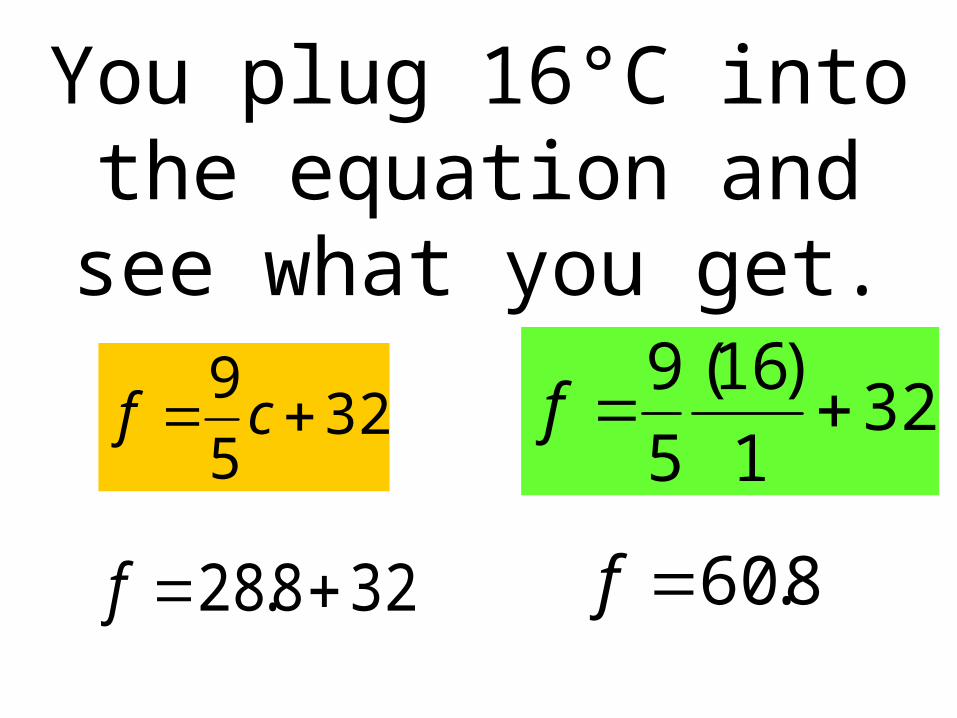
You plug 16°C into the equation and see what you
get.
325
9 cf 32
1
)16(
5
9f
328.28 f 8.60f
You will now be asked several questions about the
graph of:
325
9 cf
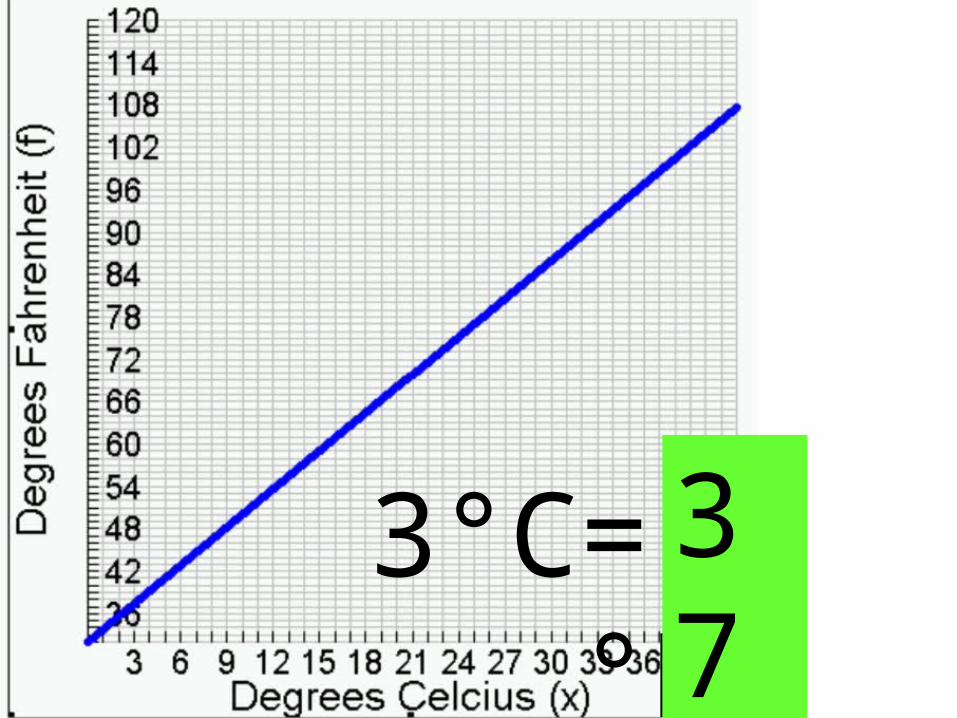
3°C= ___°F37
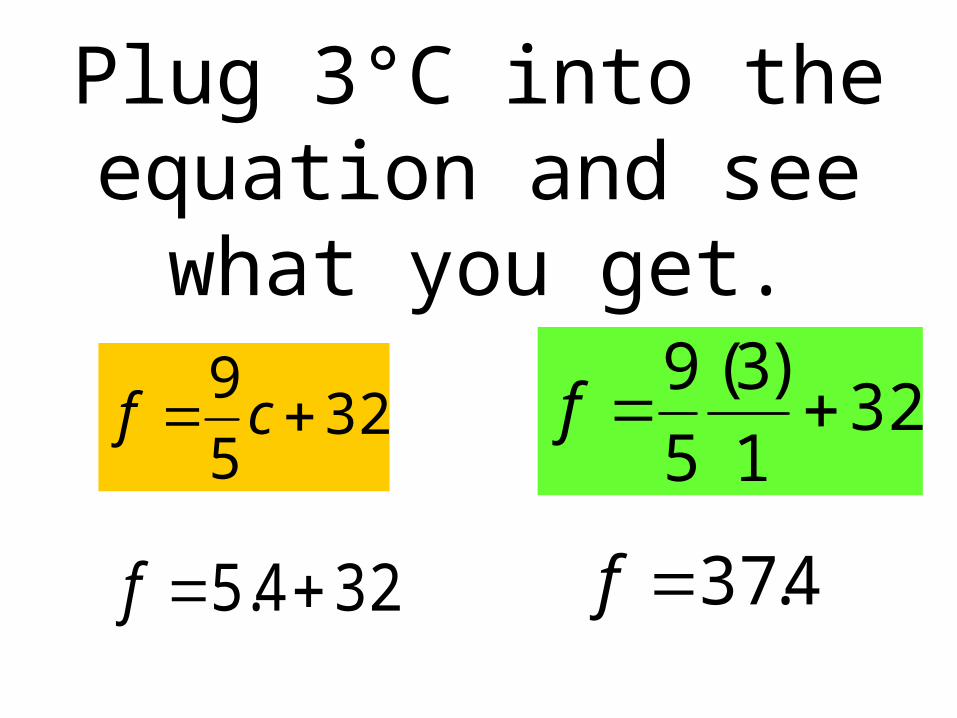
Plug 3°C into the equation and see what you get.
325
9 cf 32
1
)3(
5
9f
324.5 f 4.37f
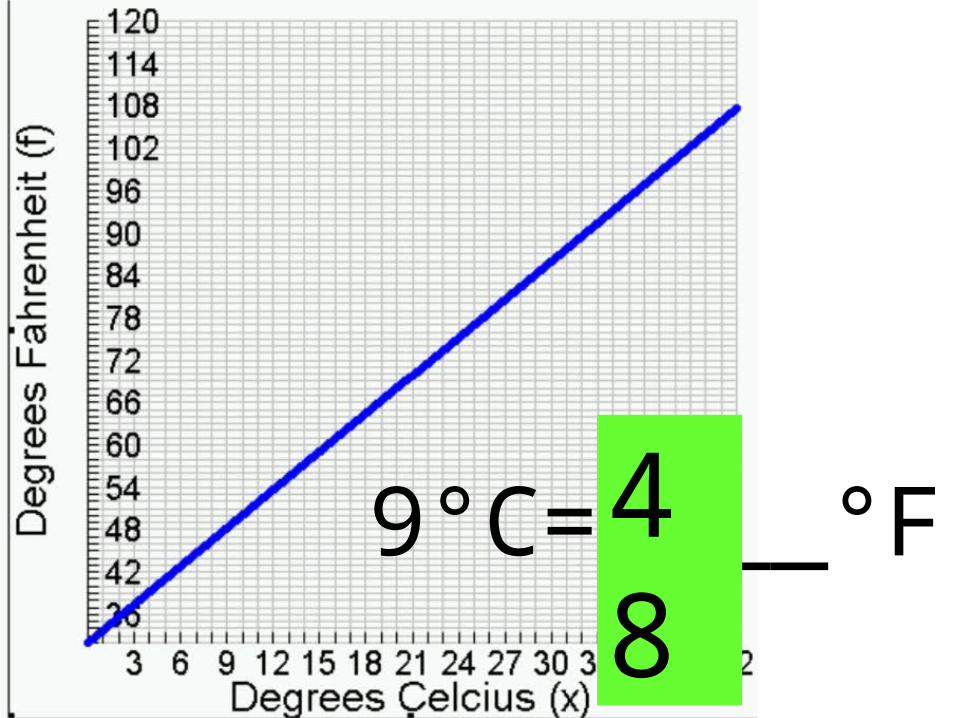
9°C= ___°F48
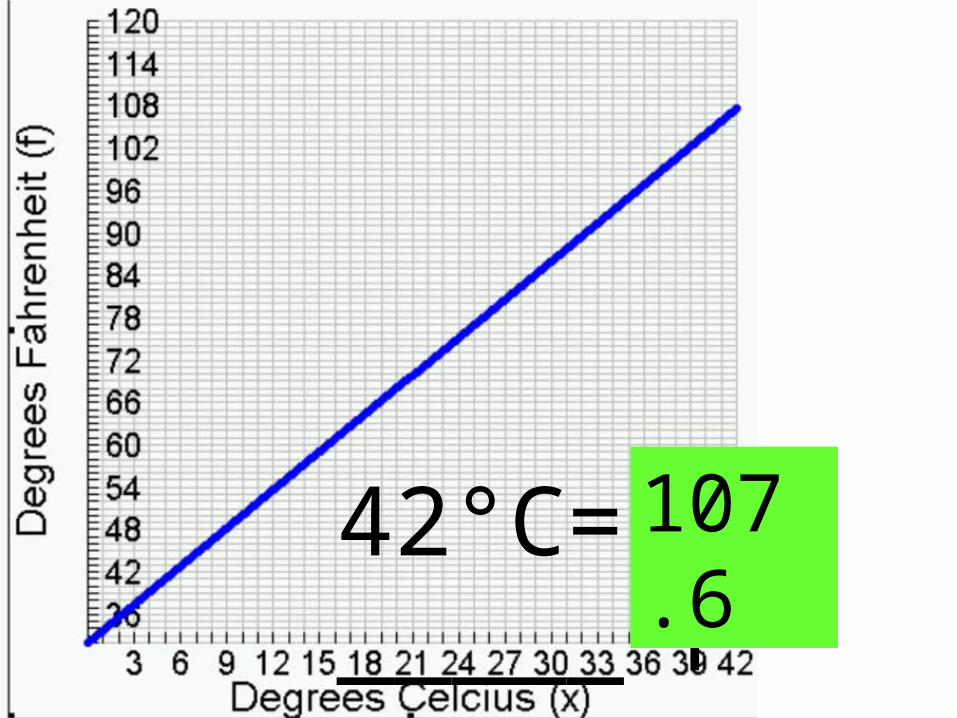
42°C= _____°F107.6
42°F= _____°C5
100°F= ____°C38
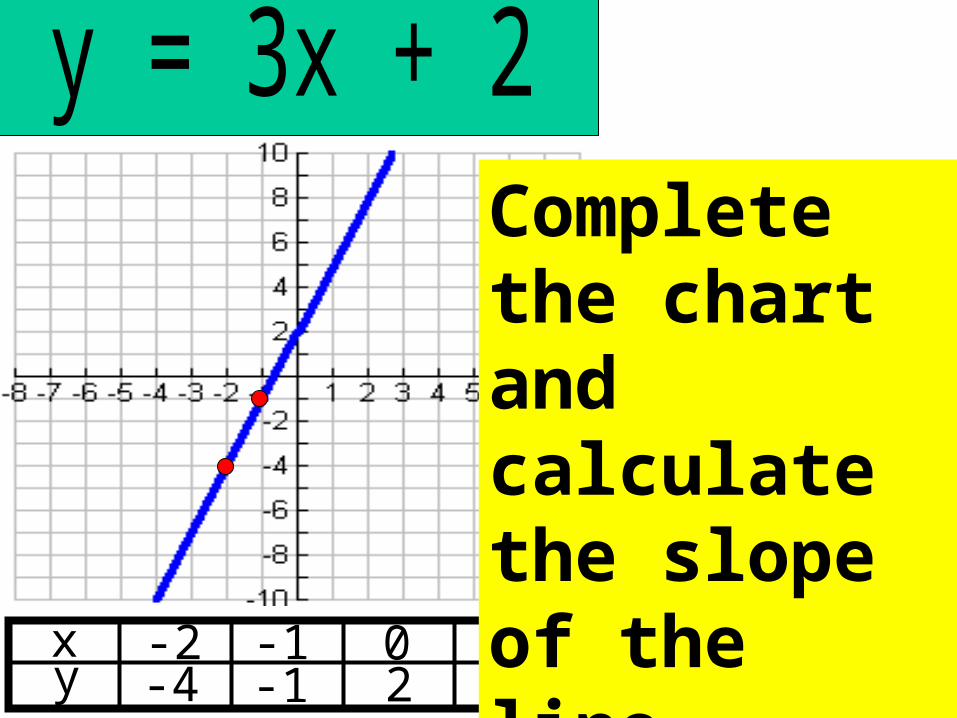
xy
-2-4
-1-1
051
228
Complete the chart and calculate the slope of the line.
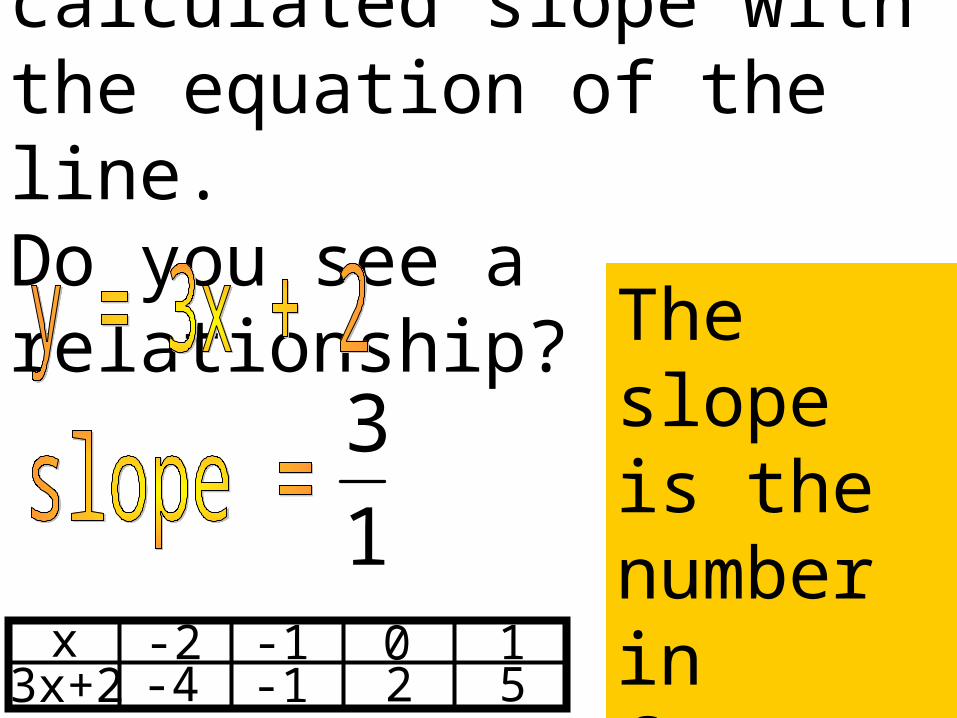
Compare your calculated slope with the equation of the line. Do you see a relationship?
The Slope Formula
•y2 - y1
x2 - x1x3x+2
-2-4
-1-1
051
2
1
3
Compare your calculated slope with the equation of the line. Do you see a relationship?
x3x+2
-2-4
-1-1
051
2
1
3
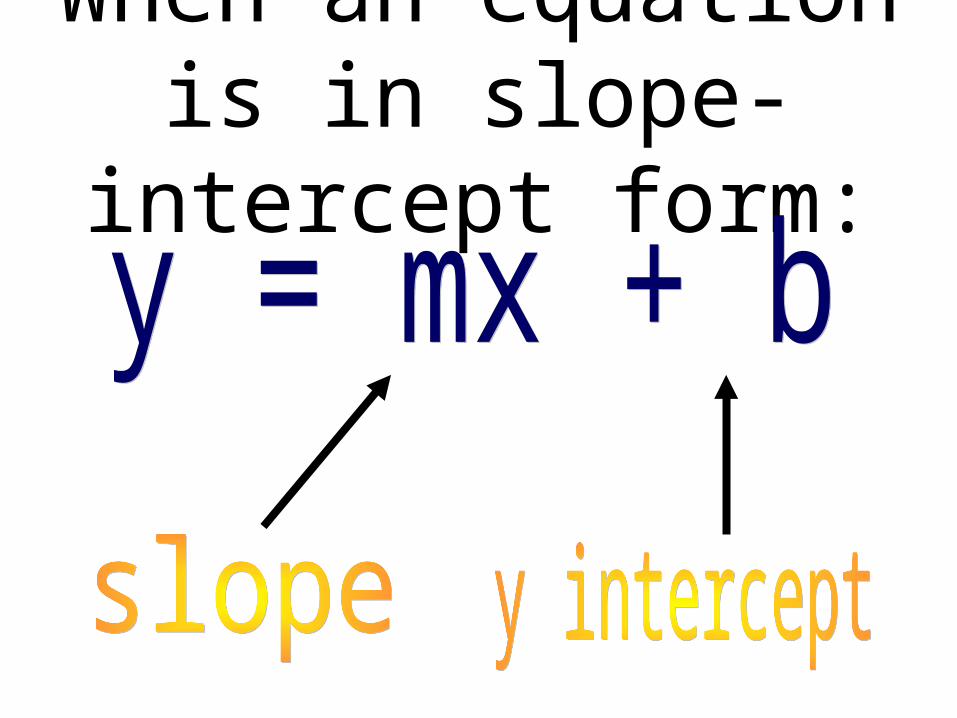
The slope is the number in front of the “x”.
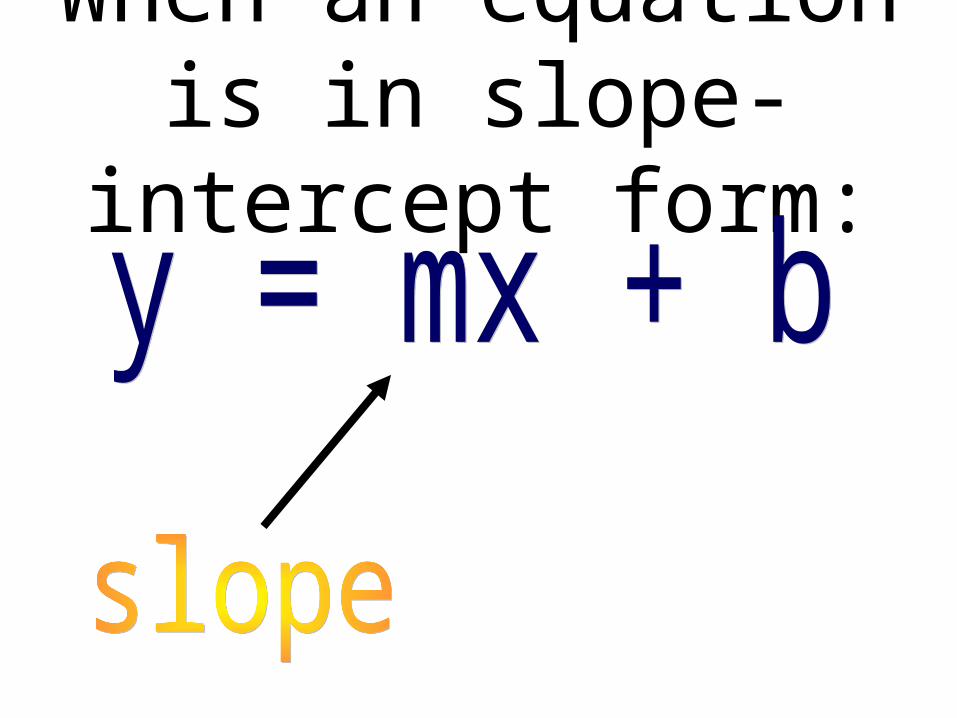
When an equation is in slope-intercept form:
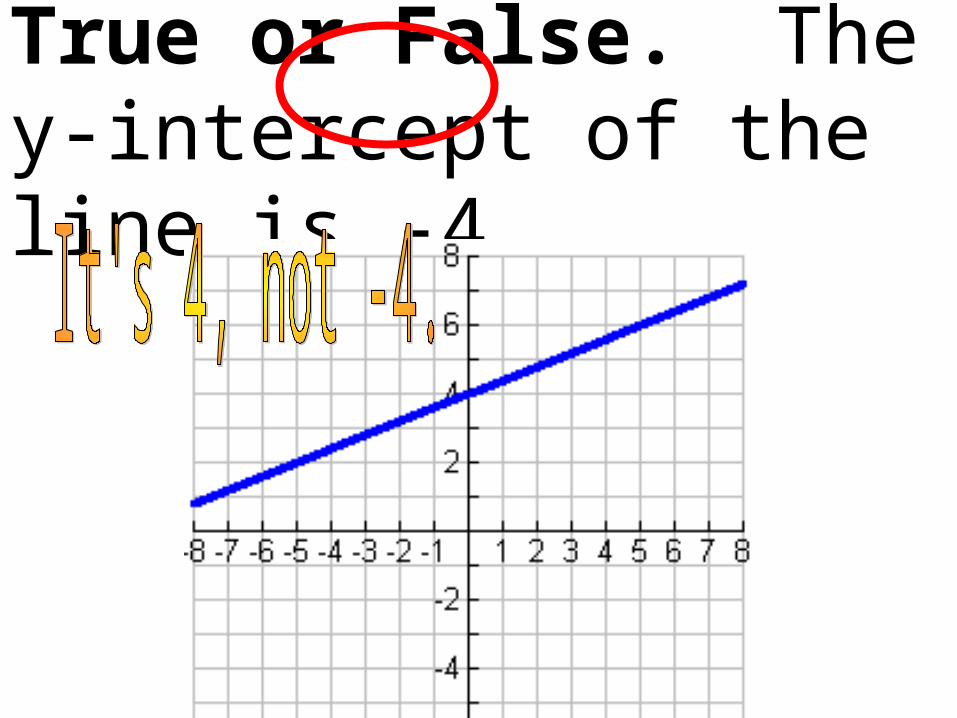
Now look at the graph of each line. Look at where the graph crosses the “y” axis.
What is the significance of this number in the equation?
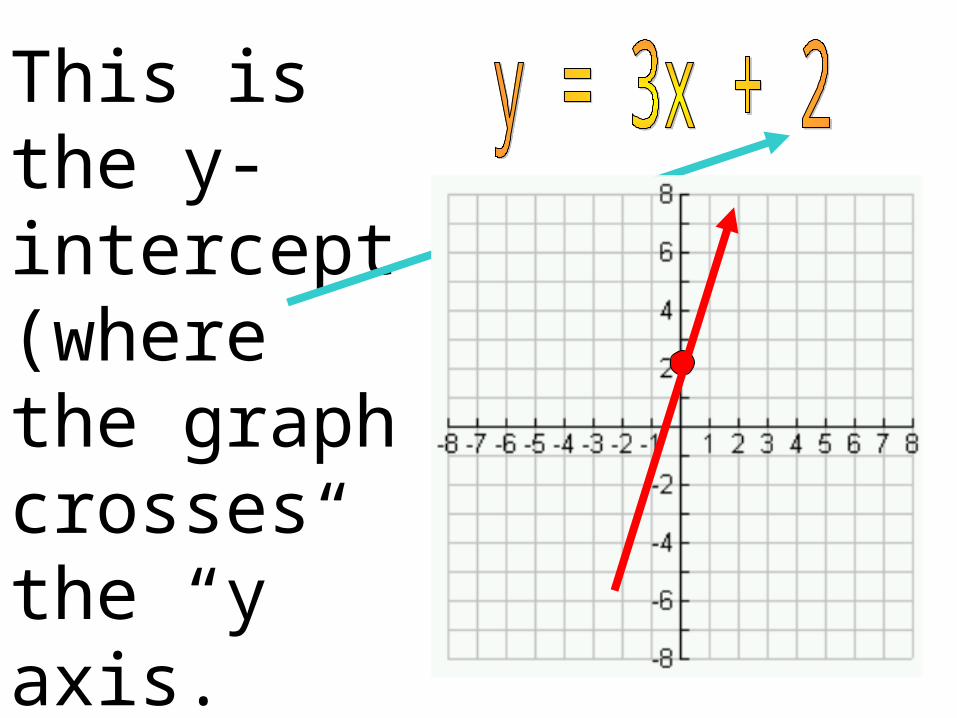
This is the y-intercept (where the graph crosses the “y” axis.
When an equation is in slope-intercept form:
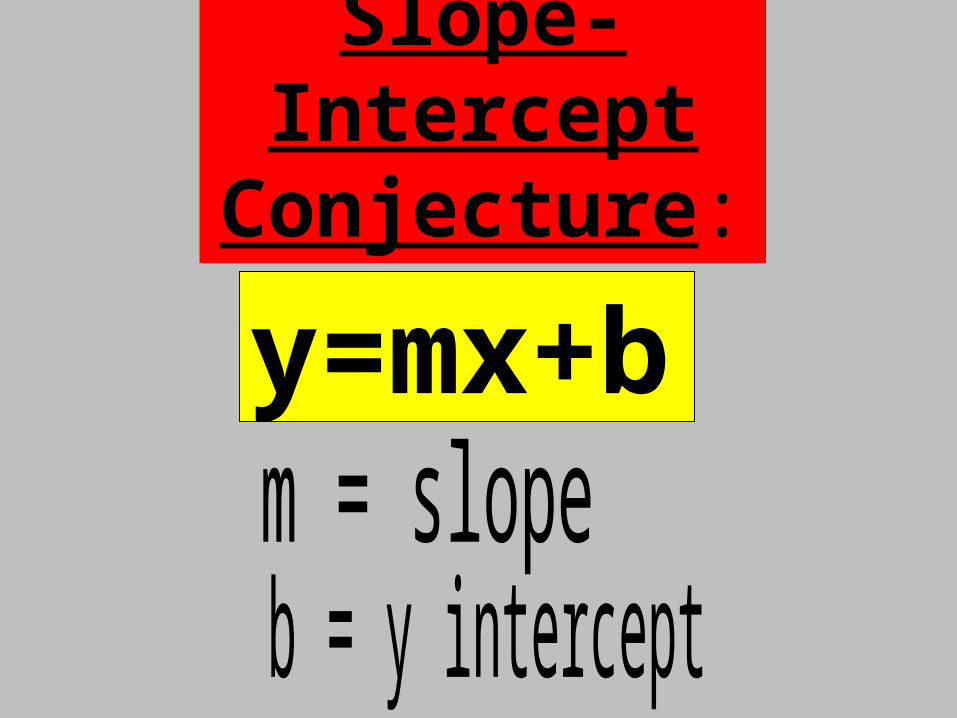
Slope-Intercept Conjecture:
y=mx+b
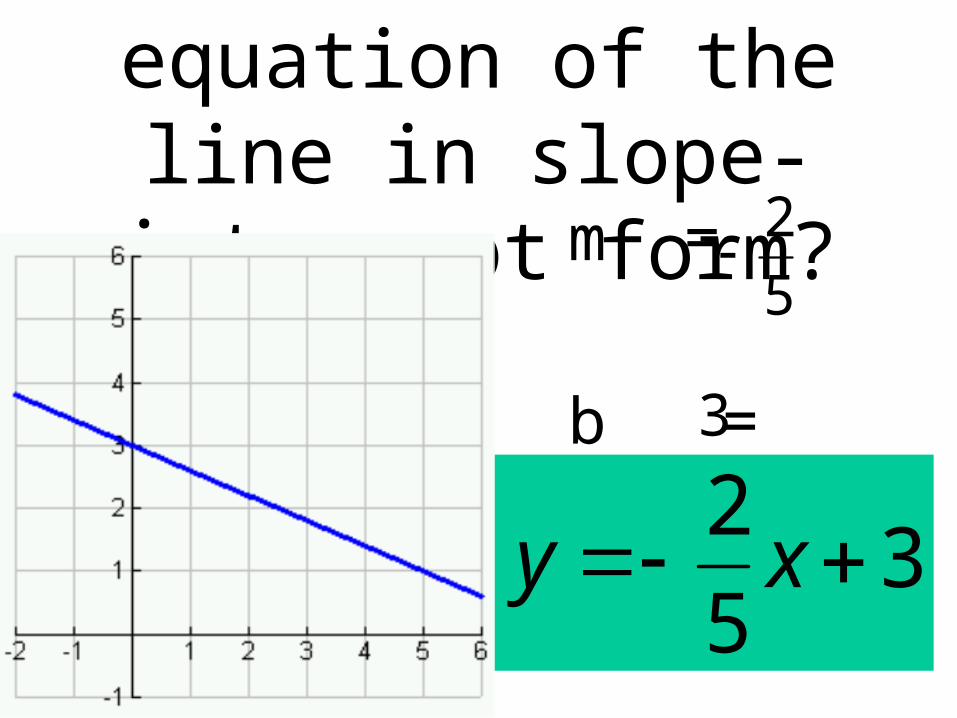
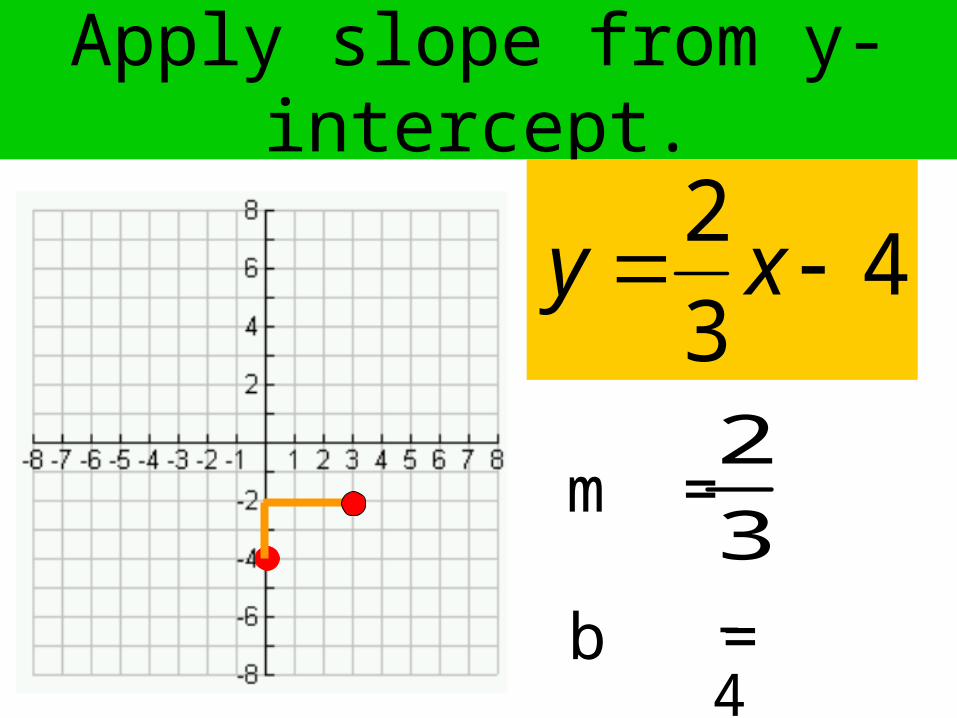
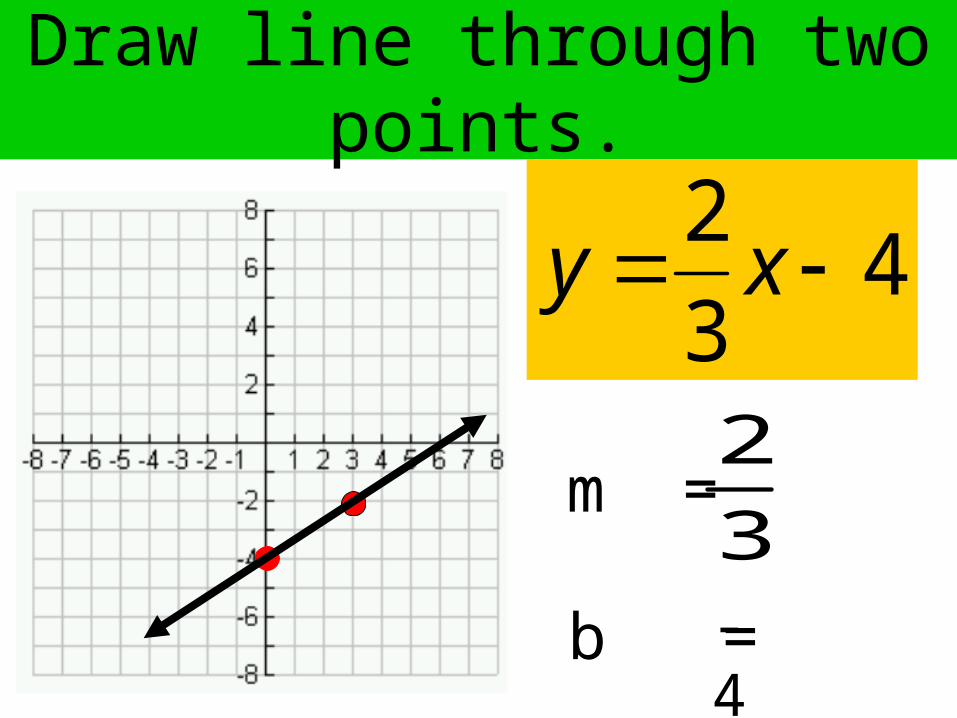
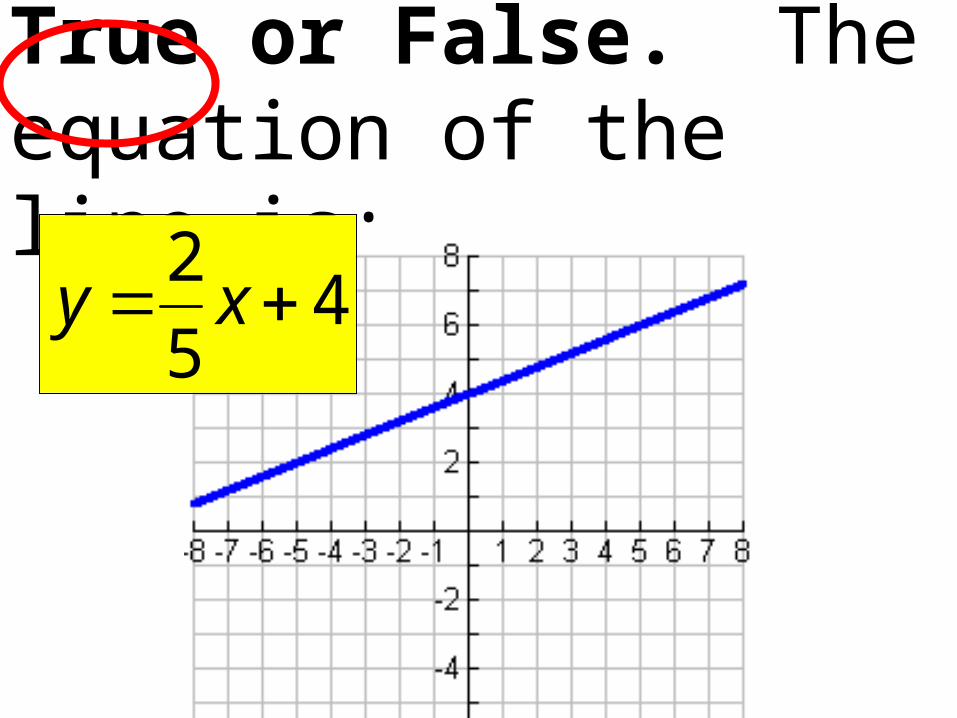
What is the equation of the line in slope-intercept form?
m =
b =
4
3
-2
24
3 xy
What is the equation of the line in slope-intercept form?
m =
b =
3
5
2
35
2 xy
What is the equation of the line in slope-intercept form?
m =
b =
4
2
1
42
1 xy
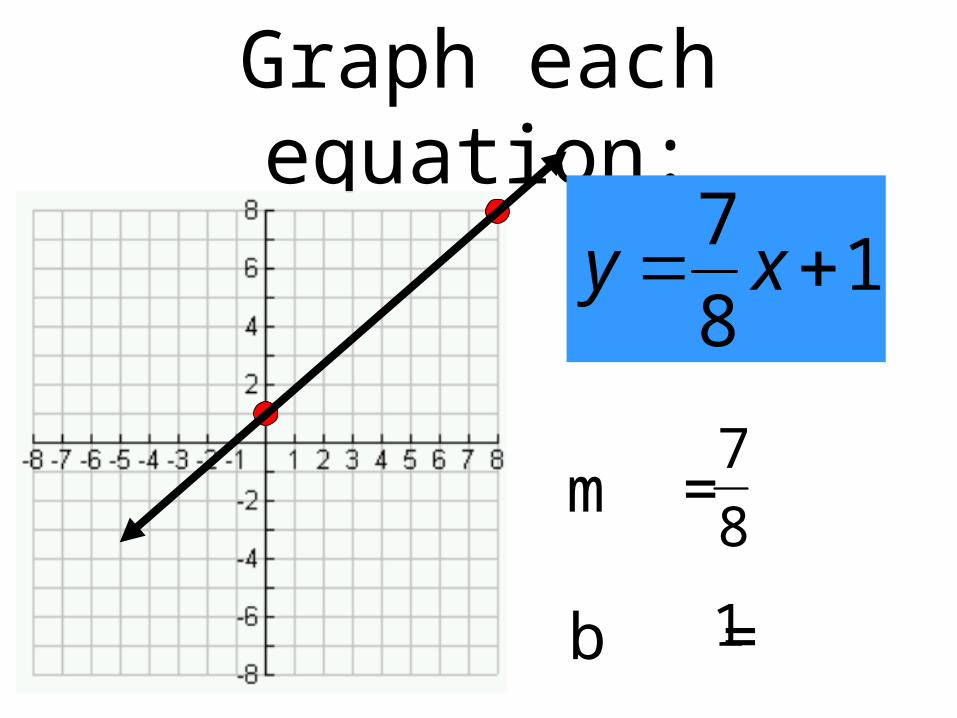
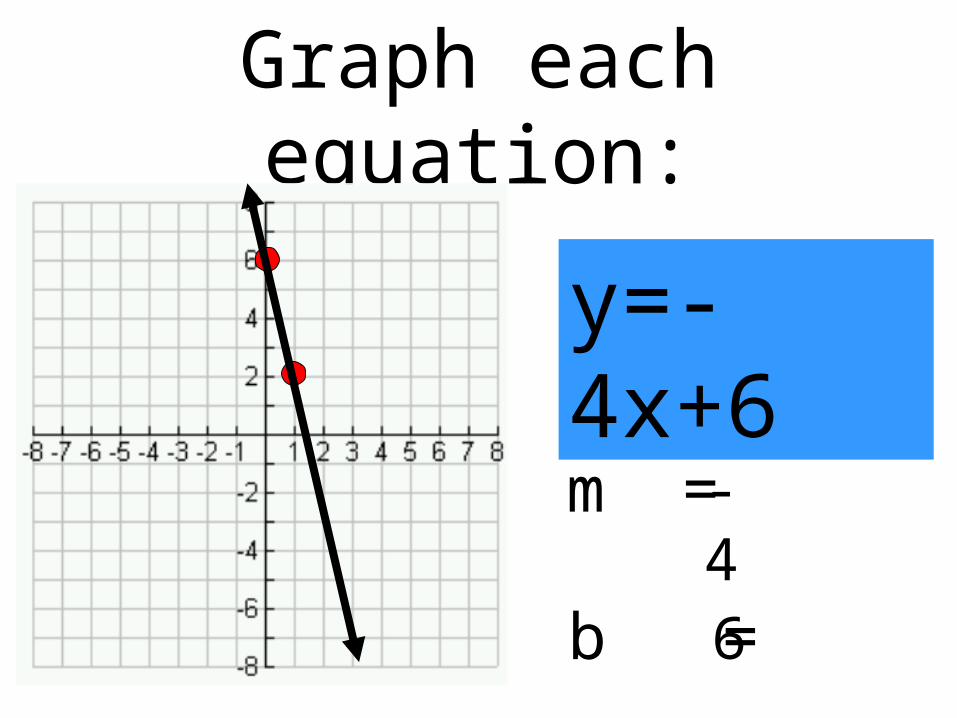
Graph the equation…. First calculate the slope and y-int.


![Geometric algebra colour image representations and derived ...angulo/publicat/Angulo_JVCIR_10.pdf · [32,26,39]. Quaternion algebra can be generalised in terms of Clifford algebra.](https://static.documents.pub/doc/80x56/5f3b1da8e636c85ef24c9195/geometric-algebra-colour-image-representations-and-derived-angulopublicatangulojvcir10pdf.jpg)


