October 22-26, 2014 Council of Great City Schools Fall Conference Academic Key Performance Indicators in America’s Urban Public Schools Executive Summary Achievement/Professional Development Task Force School Finance/Leadership, Governance and Management Task Force
Transcript
October 22-26, 2014
Council of Great City Schools Fall Conference
Academic Key Performance Indicators in
America’s Urban Public Schools
Executive SummaryAchievement/Professional Development Task Force
School Finance/Leadership, Governance and Management Task Force
ContextOperational KPI’s “Managing for Results in America’s Great City Schools “ have been in place for over 10 years. This performance management system of inputs, activities and outcomes started in Finance and was extended in subsequent years to include Operations, HR and IT.
Instruction needs performance measures as wellHow do we decide whether to:• …purchase a new basal, reduce class size, increase time allotted for
reading, provide summer school, invest in teacher coaches• KPIs use data in a way that helps instruction make choices among
programs• Currently comparable cross-state benchmark data is rare and…• …there is no authoritative source of comparative instructional
spending data
Overview and objectivesFunded by the Bill and Melinda Gates Foundation through February 2015Objective: Develop and field test a standardized set of academic performance indicators. We developed KPIs within three broad categories which reflect performance, activities and costs:
• Indicators that can be easily linked to both their costs and student outcome measures
• Indicators that can be linked to cost but may not present readily measureable student outcomes
• Indicators that can be linked to student outcomes but are difficult to trace back to their costs
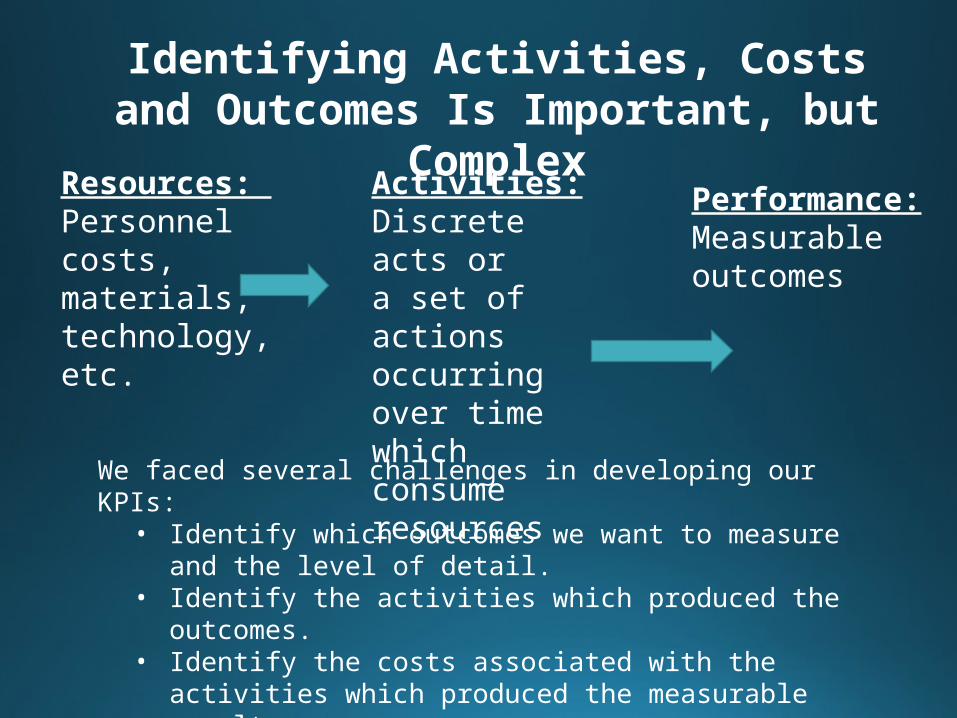
Resources: Personnel costs, materials, technology, etc.
Activities:Discrete acts or a set of actions occurring over time which consume resources
Performance:Measurable outcomes
We faced several challenges in developing our KPIs:• Identify which outcomes we want to measure and the level
of detail. • Identify the activities which produced the outcomes. • Identify the costs associated with the activities which
produced the measurable results.
Identifying Activities, Costs and Outcomes Is Important, but Complex
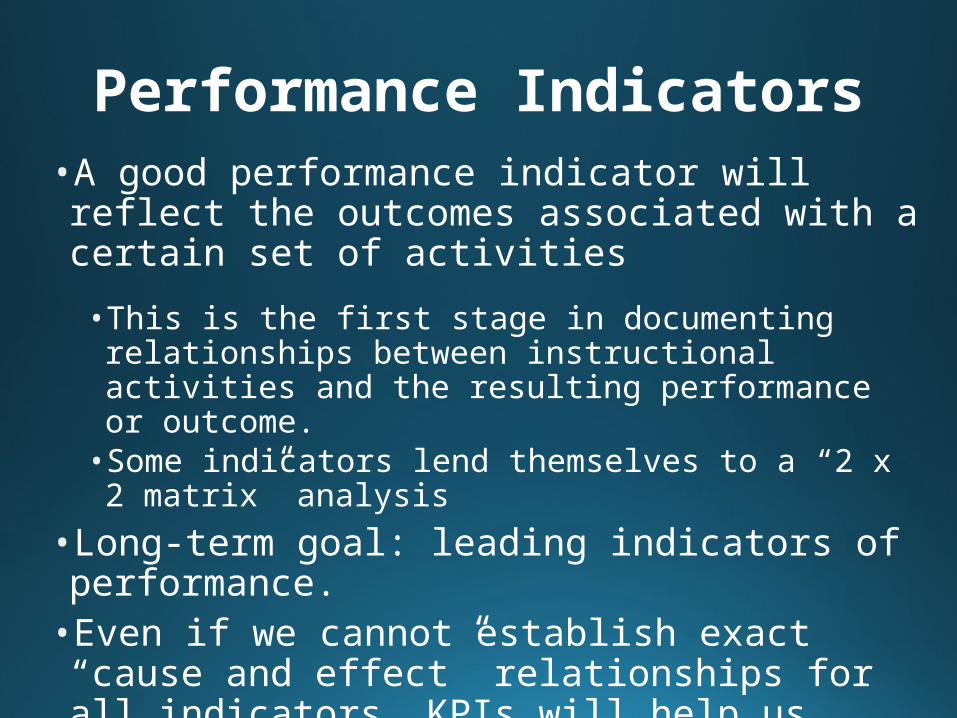
Performance Indicators•A good performance indicator will reflect the outcomes associated with a certain set of activities
• This is the first stage in documenting relationships between instructional activities and the resulting performance or outcome.
• Some indicators lend themselves to a “2 x 2 matrix” analysis
•Long-term goal: leading indicators of performance. •Even if we cannot establish exact “cause and effect” relationships for all indicators, KPIs will help us benchmark activity costs and performance levels with our peers
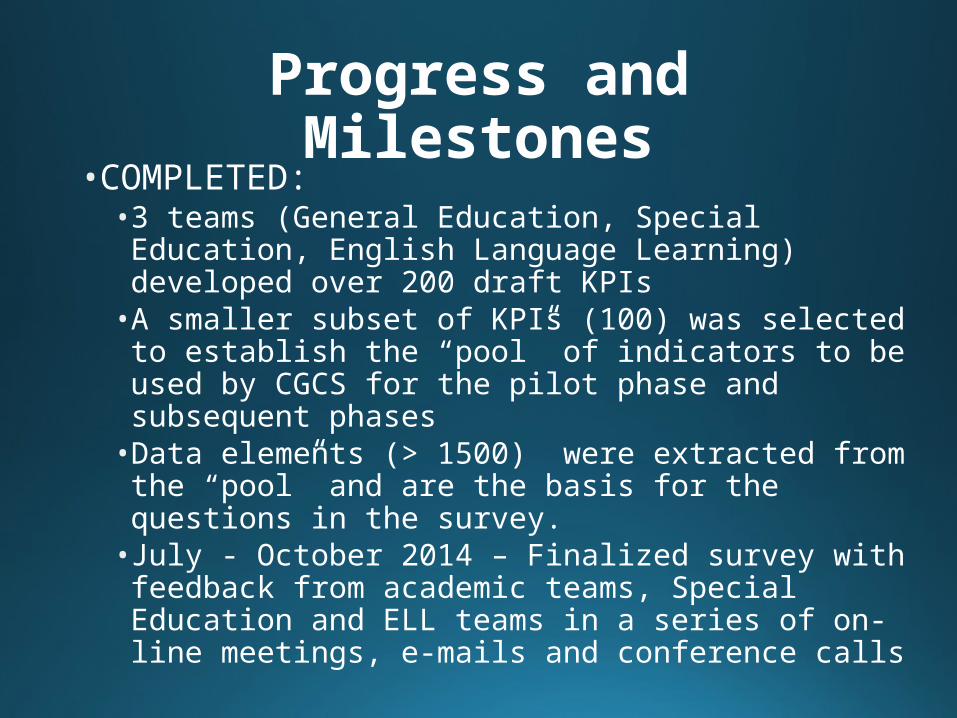
Progress and Milestones•COMPLETED:
• 3 teams (General Education, Special Education, English Language Learning) developed over 200 draft KPIs
• A smaller subset of KPIs (100) was selected to establish the “pool” of indicators to be used by CGCS for the pilot phase and subsequent phases
• Data elements (> 1500) were extracted from the “pool” and are the basis for the questions in the survey.
• July - October 2014 – Finalized survey with feedback from academic teams, Special Education and ELL teams in a series of on-line meetings, e-mails and conference calls
• Reduced pool to 58 performance measures (including derivatives) for the pilot survey which was released October 7th. Data is entered by responding to survey questions or completing excel tables. Responses are due December 1, 2014.
Next Steps:December 1 2014 to January 31 2015 • Review and analyze data, edit KPIs as needed• Design report formats, text and graphics (examples
follow)February 2015• Prepare final report to Gates Foundation and Analysis
Reports to pilot districts
Progress and Milestones
Data Collection now in Progress
The pilot involves the collection of various data points using two methods: an Excel document pre-populated with tables and an online survey. Using the Excel document, districts will be able to generate student subgroup data from their student information systems and enter them into the tables (or provide pivot tables with the data extracts for our staff to compile). The online survey contains questions that complement the data entered into the excel sheets, and the items may be more appropriately addressed by individuals in the English language learner department, the Chief Financial Officer, or individuals familiar with supports for diverse learners/special education students.
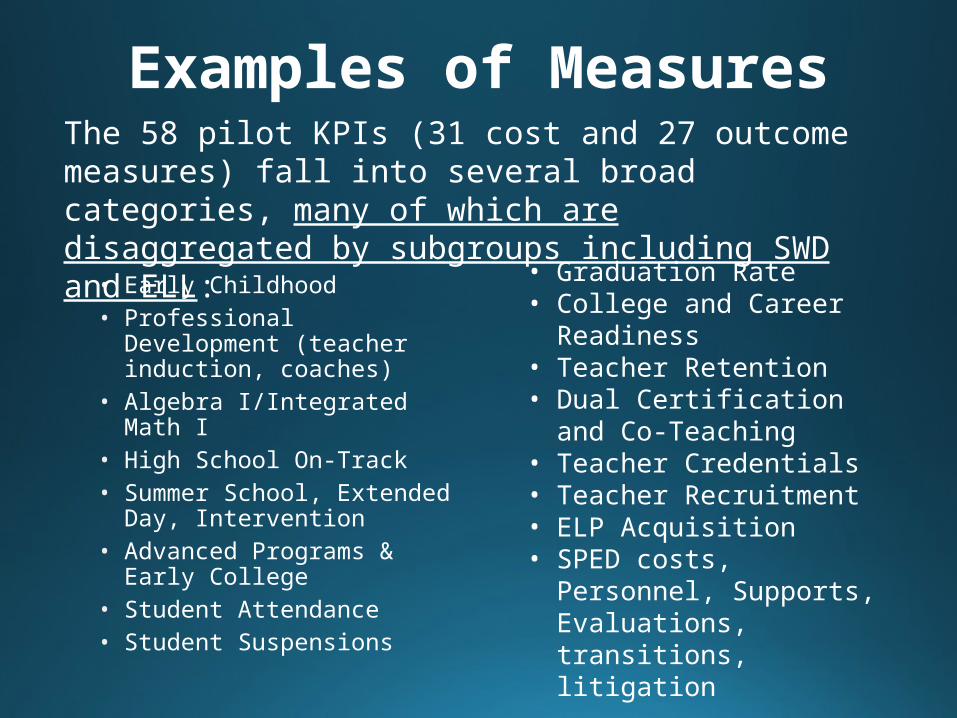
• Early Childhood• Professional Development
(teacher induction, coaches)
• Algebra I/Integrated Math I• High School On-Track• Summer School, Extended
Day, Intervention • Advanced Programs &
Early College• Student Attendance• Student Suspensions
Examples of Measures
• Graduation Rate• College and Career
Readiness• Teacher Retention• Dual Certification and Co-
The 58 pilot KPIs (31 cost and 27 outcome measures) fall into several broad categories, many of which are disaggregated by subgroups including SWD and ELL:
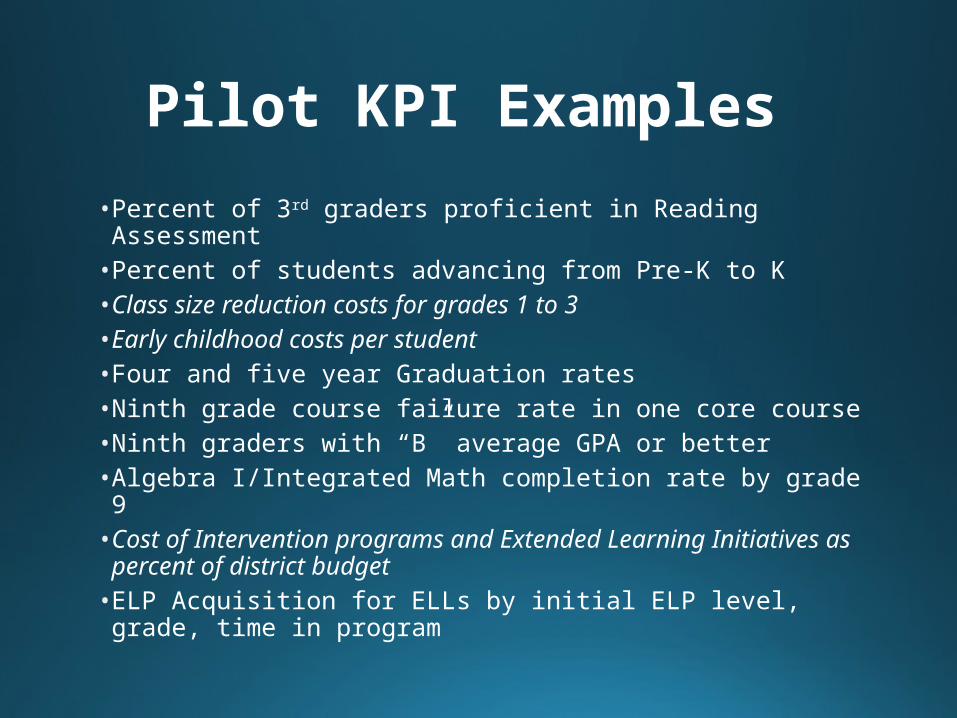
Pilot KPI Examples
• Percent of 3rd graders proficient in Reading Assessment• Percent of students advancing from Pre-K to K• Class size reduction costs for grades 1 to 3• Early childhood costs per student• Four and five year Graduation rates• Ninth grade course failure rate in one core course• Ninth graders with “B” average GPA or better• Algebra I/Integrated Math completion rate by grade 9• Cost of Intervention programs and Extended Learning
Initiatives as percent of district budget• ELP Acquisition for ELLs by initial ELP level, grade, time in
program
• Credit recovery success rate in High School summer school• Cost per student for HS credit recovery programs• AP exam pass rate • AP course costs per passing score• Early College Enrollment (HS)• Early College Costs per Participant• Percent of SPED referrals resulting in evaluations and percent of
evaluations resulting in eligibility • Average cost per initial SPED evaluation• Cost of initial evaluations per new IEP• Cost per student with IEP • Percent of students in each SPED educational setting• Private/Separate school placement costs• Average cost per IEP meeting
Example KPIs (continued)
Example KPIs (continued)
• Student Absence Rate by Grade Level• Student Suspension Rate by Subgroup• Instructional Days missed per student due to
suspensions • Cost of Instructional coaches as percent of budget• Cost of substitute teachers as percent of budget
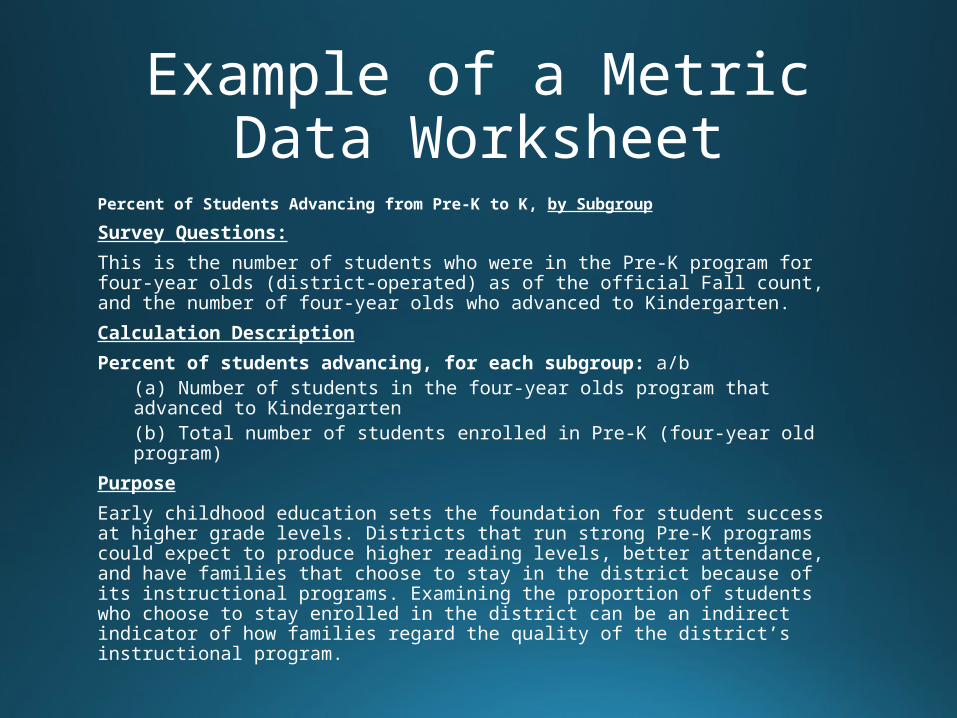
Example of a Metric Data Worksheet
Percent of Students Advancing from Pre-K to K, by Subgroup
Survey Questions:
This is the number of students who were in the Pre-K program for four-year olds (district-operated) as of the official Fall count, and the number of four-year olds who advanced to Kindergarten.
Calculation Description
Percent of students advancing, for each subgroup: a/b(a) Number of students in the four-year olds program that advanced to Kindergarten(b) Total number of students enrolled in Pre-K (four-year old program)
Purpose
Early childhood education sets the foundation for student success at higher grade levels. Districts that run strong Pre-K programs could expect to produce higher reading levels, better attendance, and have families that choose to stay in the district because of its instructional programs. Examining the proportion of students who choose to stay enrolled in the district can be an indirect indicator of how families regard the quality of the district’s instructional program.
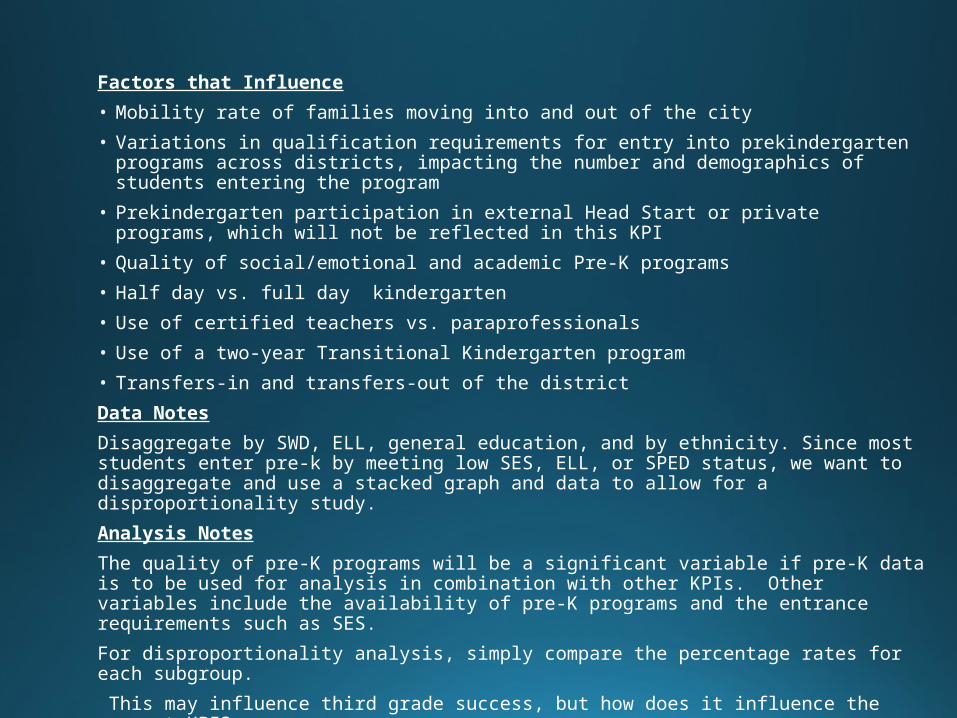
Factors that Influence
• Mobility rate of families moving into and out of the city
• Variations in qualification requirements for entry into prekindergarten programs across districts, impacting the number and demographics of students entering the program
• Prekindergarten participation in external Head Start or private programs, which will not be reflected in this KPI
• Quality of social/emotional and academic Pre-K programs
• Half day vs. full day kindergarten
• Use of certified teachers vs. paraprofessionals
• Use of a two-year Transitional Kindergarten program
• Transfers-in and transfers-out of the district
Data Notes
Disaggregate by SWD, ELL, general education, and by ethnicity. Since most students enter pre-k by meeting low SES, ELL, or SPED status, we want to disaggregate and use a stacked graph and data to allow for a disproportionality study.
Analysis Notes
The quality of pre-K programs will be a significant variable if pre-K data is to be used for analysis in combination with other KPIs. Other variables include the availability of pre-K programs and the entrance requirements such as SES.
For disproportionality analysis, simply compare the percentage rates for each subgroup.
This may influence third grade success, but how does it influence the current KPI?
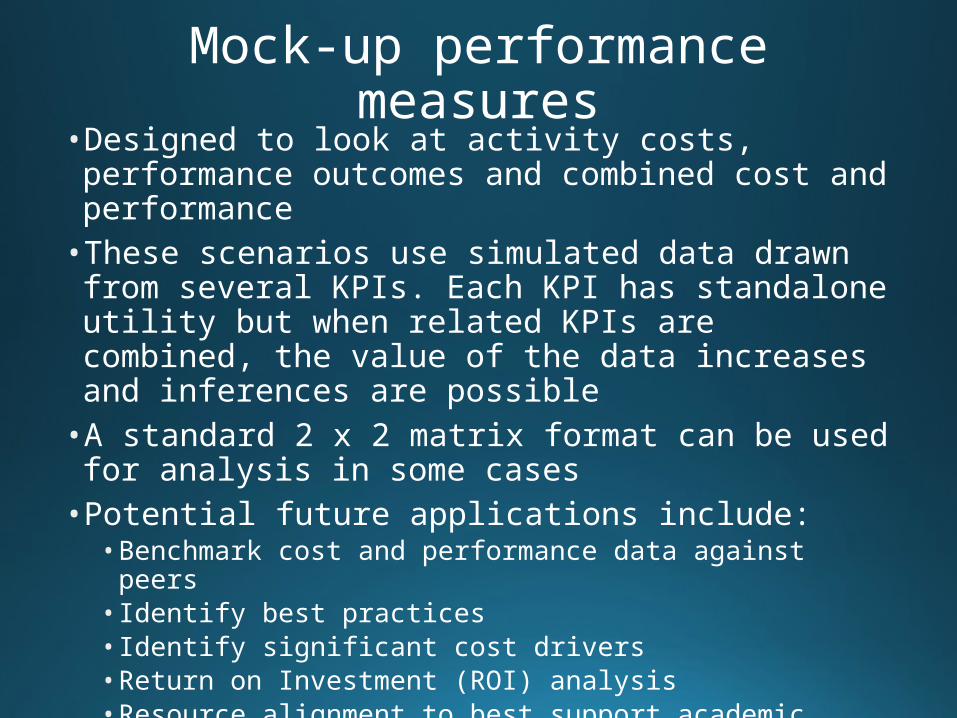
Mock-up performance measures• Designed to look at activity costs, performance outcomes
and combined cost and performance • These scenarios use simulated data drawn from several
KPIs. Each KPI has standalone utility but when related KPIs are combined, the value of the data increases and inferences are possible
• A standard 2 x 2 matrix format can be used for analysis in some cases
• Potential future applications include:• Benchmark cost and performance data against peers• Identify best practices• Identify significant cost drivers• Return on Investment (ROI) analysis• Resource alignment to best support academic success
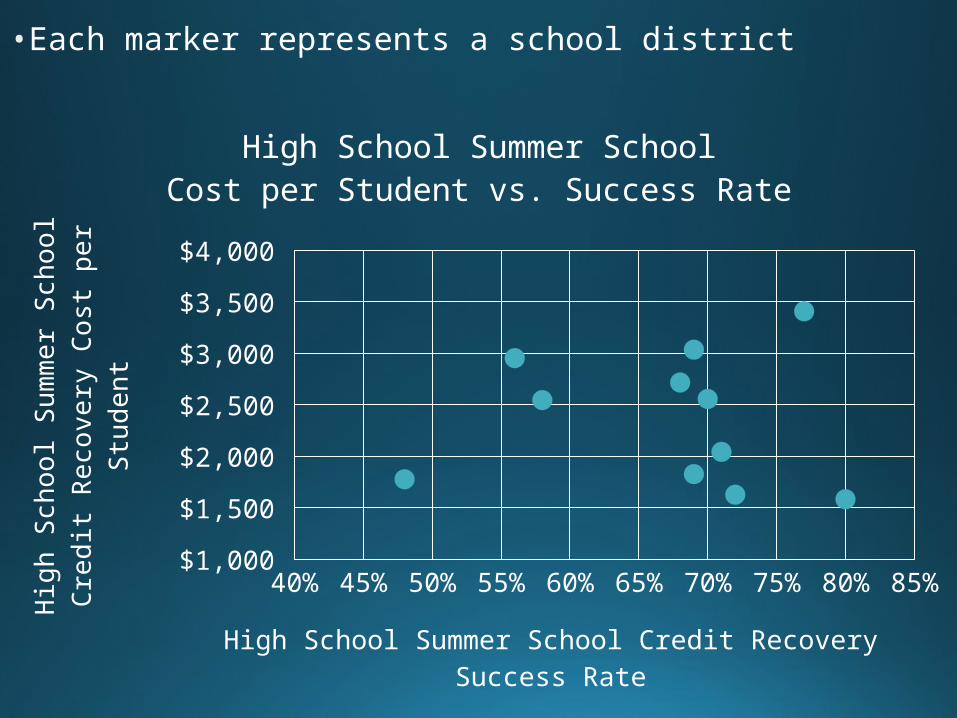
Example 1: High School Summer School•A cost analysis that compares summer school pass rate with the cost of summer school
• Each marker represents a school district
40% 45% 50% 55% 60% 65% 70% 75% 80% 85% $1,000
$1,500
$2,000
$2,500
$3,000
$3,500
$4,000
High School Summer SchoolCost per Student vs. Success Rate
High School Summer School Credit Recovery Success Rate
Hig
h Sc
hool
Sum
mer
Sch
ool C
redi
t Rec
over
y Co
st p
er S
tude
nt
Guidance for Quadrant Analysis (possible outcomes associated with data) LOW CREDIT RECOVERY
SUCCESS RATEHIGH CREDIT RECOVERY SUCCESS RATE
HIGH COST PER STUDENT Costs are high, even though the success rate of the program is low. The program should be reviewed for effectiveness.
Costs are high, but it could be worth the cost because of the impact of successful credit recovery. It may be useful to conduct a review of the program costs.
LOW COST PER STUDENT Costs are low, but so is the credit recovery success rate. Does the credit recovery program have adequate resources to successfully serve students?
Costs are low and the credit recovery success rate is high. This program appears to be cost-effective.
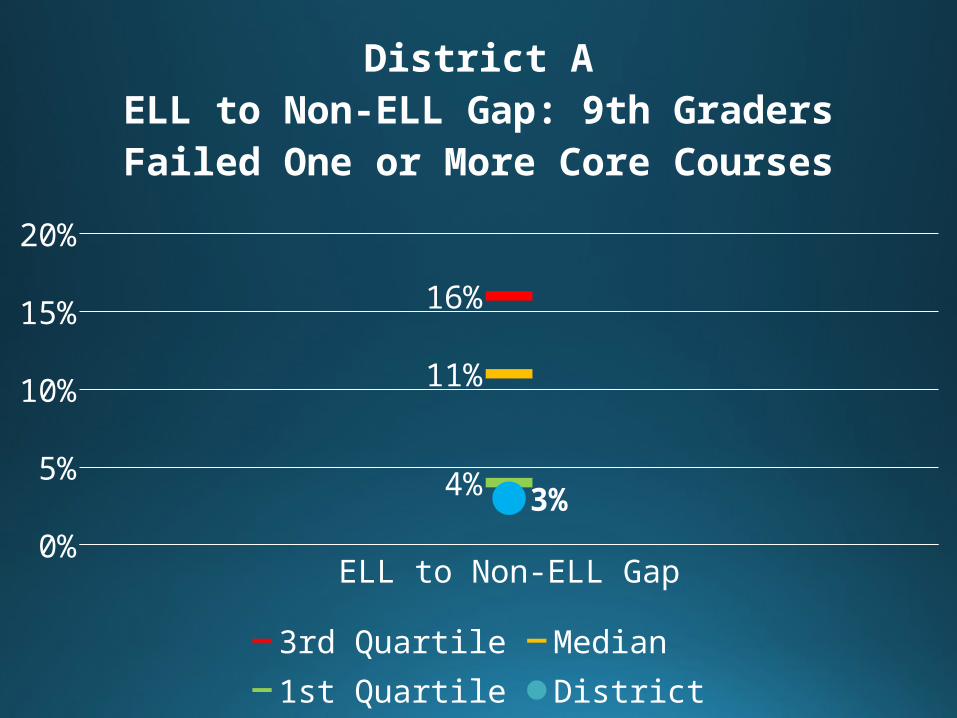
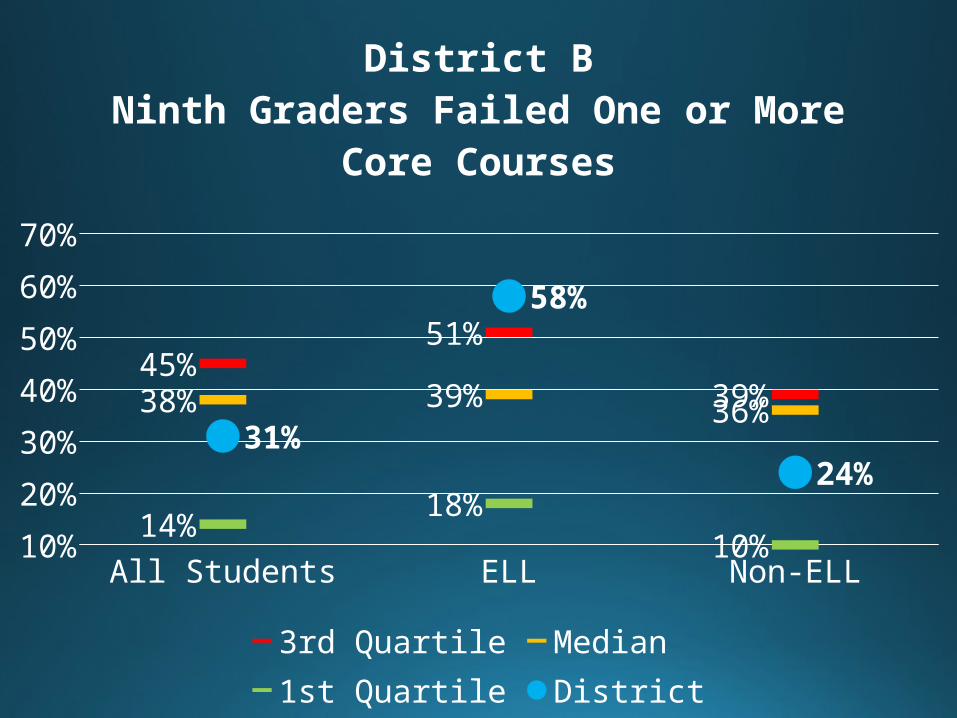
Example 2: Ninth Graders Failed One or More Core Courses
•This example examines two fictitious districts, District A and District B
•This specific analysis looks at ELLs compared to non-ELLs (but could be applied to other student groups)
All Students ELL Non-ELL10%
15%
20%
25%
30%
35%
40%
45%
50%
55%
45%
51%
39%38% 39%36%
14%18%
10%
49% 50%47%
District ANinth Graders Failed One or More Core Courses
3rd Quartile Median 1st Quartile District
ELL to Non-ELL Gap0%2%4%6%8%
10%12%14%16%18%
16%
11%
4%3%
District AELL to Non-ELL Gap: 9th Graders Failed One or
More Core Courses
3rd Quartile Median 1st Quartile District
All Students ELL Non-ELL10%
20%
30%
40%
50%
60%
70%
45%51%
39%38% 39%36%
14%18%
10%
31%
58%
24%
District BNinth Graders Failed One or More Core Courses
3rd Quartile Median 1st Quartile District
ELL to Non-ELL Gap0%
5%
10%
15%
20%
25%
30%
35%
40%
16%
11%
4%
34%
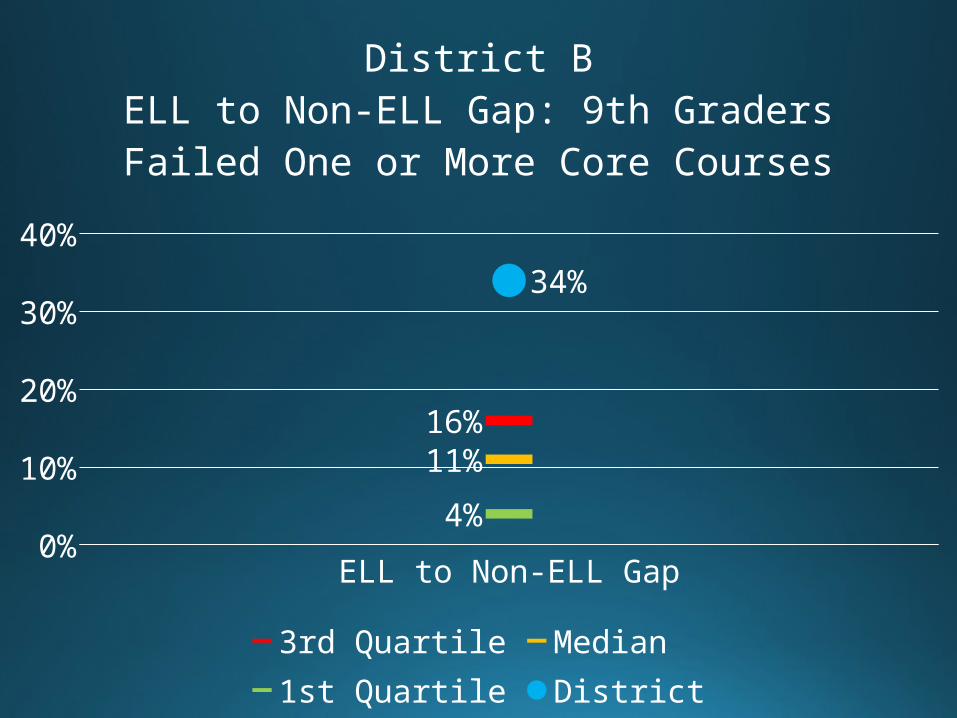
District BELL to Non-ELL Gap: 9th Graders Failed One or
More Core Courses
3rd Quartile Median 1st Quartile District
Example 2 Analysis
•District A has a high rate of course failures, but a low ELL-to-Non-ELL gap.
•District B has a moderate rate of course failures, but an astronomically high gap between ELLs and Non-ELLs.
Example 3: Absence Rates
•Series of charts to examine absence rate data
•Data will be collected by three dimensions:•Grade level•Number of absences•Student groups
•All data is fictitious mock data
• The chart below shows the percent of students that are absent 5+ days in the year. We could have also made this report for 10+ absences or 20+ absences.
• Wouldn’t it be nice to have some benchmarks?
Grade 3 Grade 6 Grade 8 Grade 90%5%
10%15%20%25%30%35%40%
14%
34% 36%33%
Students Absent 5+ Days, by Grade (All Students)
District
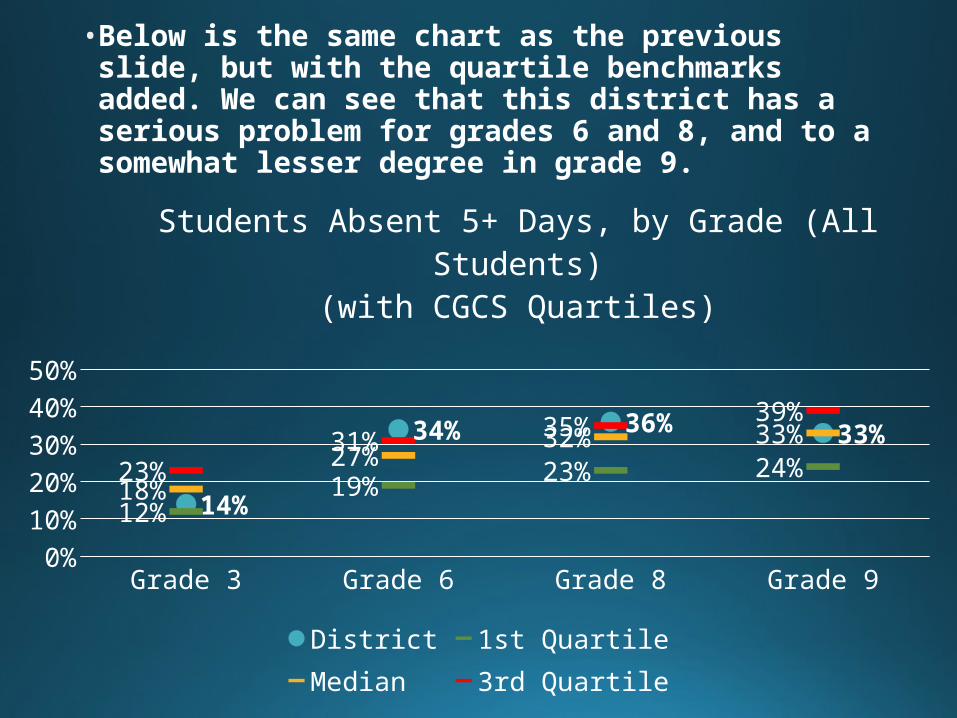
• Below is the same chart as the previous slide, but with the quartile benchmarks added. We can see that this district has a serious problem for grades 6 and 8, and to a somewhat lesser degree in grade 9.
Grade 3 Grade 6 Grade 8 Grade 90%5%
10%15%20%25%30%35%40%45%
14%
34% 36%33%
12%
19%23% 24%
18%
27%32% 33%
23%
31%35%
39%
Students Absent 5+ Days, by Grade (All Students)(with CGCS Quartiles)
District 1st Quartile Median 3rd Quartile
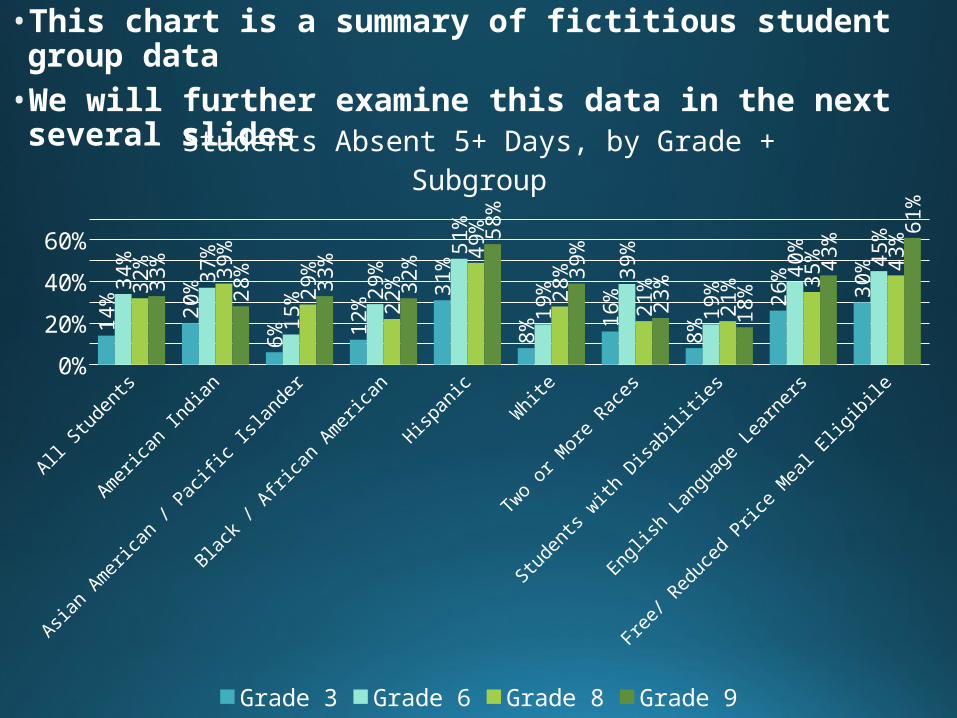
• This chart is a summary of fictitious student group data• We will further examine this data in the next several slides
All Studen
ts
America
n Indian
Asian Ameri
can / P
acific I
slander
Black /
Africa
n America
n
Hispan
icW
hite
Two or M
ore Rac
es
Studen
ts with
Disabiliti
es
Engli
sh La
nguag
e Lea
rners
Free/
Reduce
d Price M
eal E
ligibile
0%
10%
20%
30%
40%
50%
60%
70%
14% 20
%
6%
12%
31%
8%
16%
8%
26% 30
%34% 37
%
15%
29%
51%
19%
39%
19%
40% 45
%
32% 39
%
29%
22%
49%
28%
21%
21%
35% 43
%
33%
28% 33
%
32%
58%
39%
23%
18%
43%
61%
Students Absent 5+ Days, by Grade + Subgroup
Grade 3 Grade 6 Grade 8 Grade 9
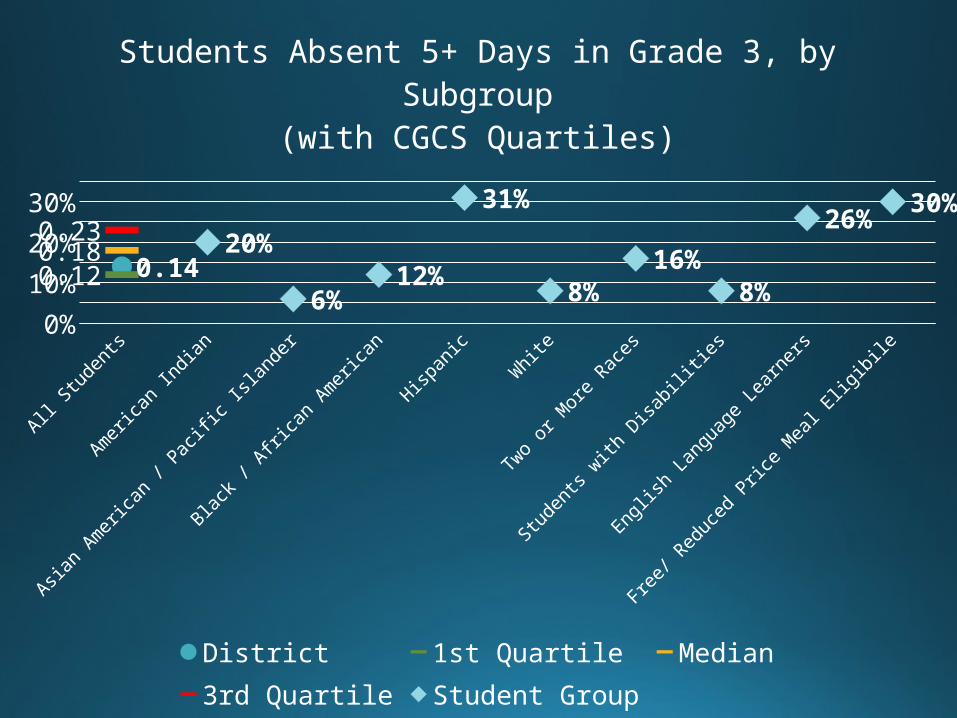
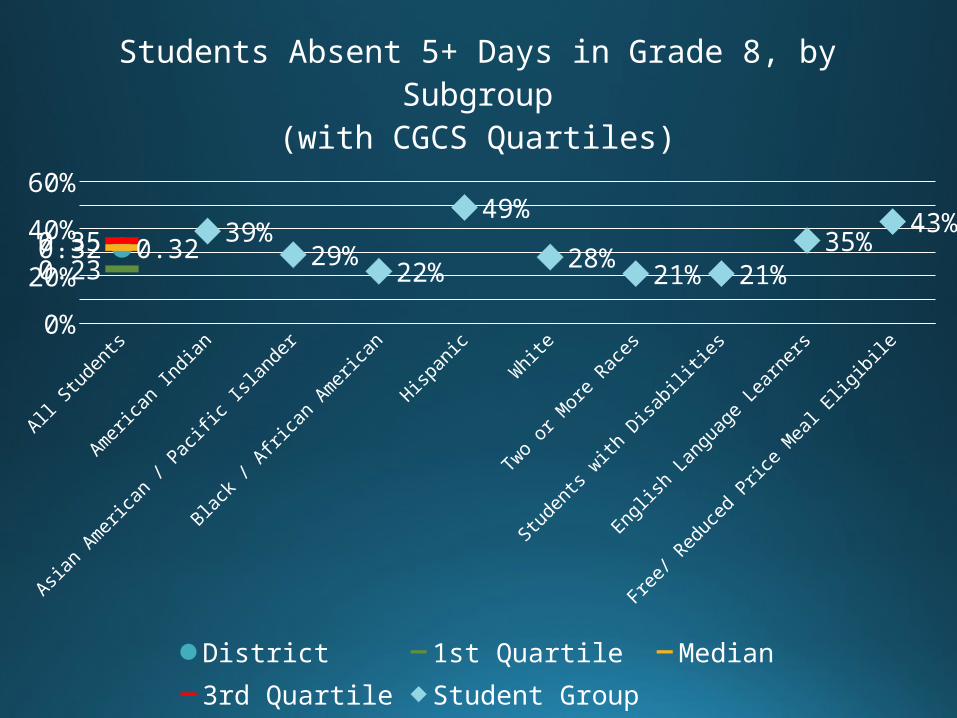
What’s the student group trend for each grade?•The next four charts are each focused on a specific grade level, starting with grade 3 (GRADE is the variable)
•On the left are the quartile benchmarks for all CGCS districts
•A district can quickly identify equity issues with absence rates in that grade
0%
5%
10%
15%
20%
25%
30%
35%
0.140.12
0.18
0.2320%
6%
12%
31%
8%
16%
8%
26%30%
Students Absent 5+ Days in Grade 3, by Subgroup(with CGCS Quartiles)
District 1st Quartile Median3rd Quartile Student Group
0%
10%
20%
30%
40%
50%
60%
0.34
0.190.270.31
37%
15%
29%
51%
19%
39%
19%
40%45%
Students Absent 5+ Days in Grade 6, by Subgroup(with CGCS Quartiles)
District 1st Quartile Median3rd Quartile Student Group
All Studen
ts
America
n Indian
Asian Ameri
can / P
acific I
slander
Black /
Africa
n America
n
Hispan
icW
hite
Two or M
ore Rac
es
Studen
ts with
Disabiliti
es
Engli
sh La
nguag
e Lea
rners
Free/
Reduce
d Price M
eal E
ligibile
0%
10%
20%
30%
40%
50%
60%
0.32
0.23
0.320.3539%
29%22%
49%
28%21% 21%
35%43%
Students Absent 5+ Days in Grade 8, by Subgroup(with CGCS Quartiles)
District 1st Quartile Median3rd Quartile Student Group
0%
10%
20%
30%
40%
50%
60%
70%
0.330.240.330.39
28%33% 32%
58%
39%
23%18%
43%
61%
Students Absent 5+ Days in Grade 9, by Subgroup(with CGCS Quartiles)
District 1st Quartile Median3rd Quartile Student Group
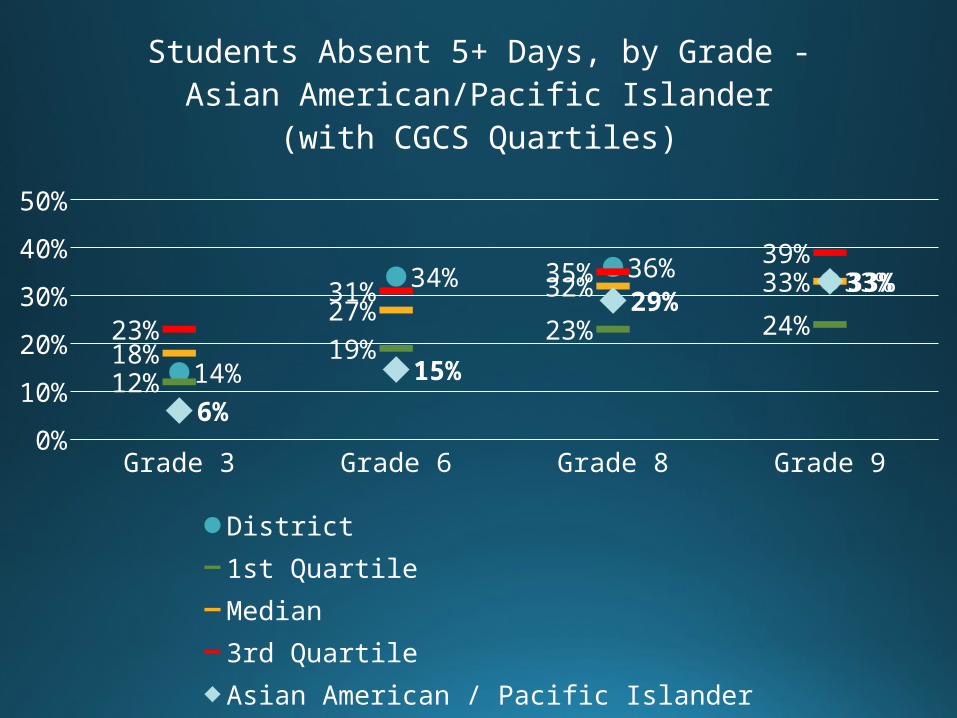
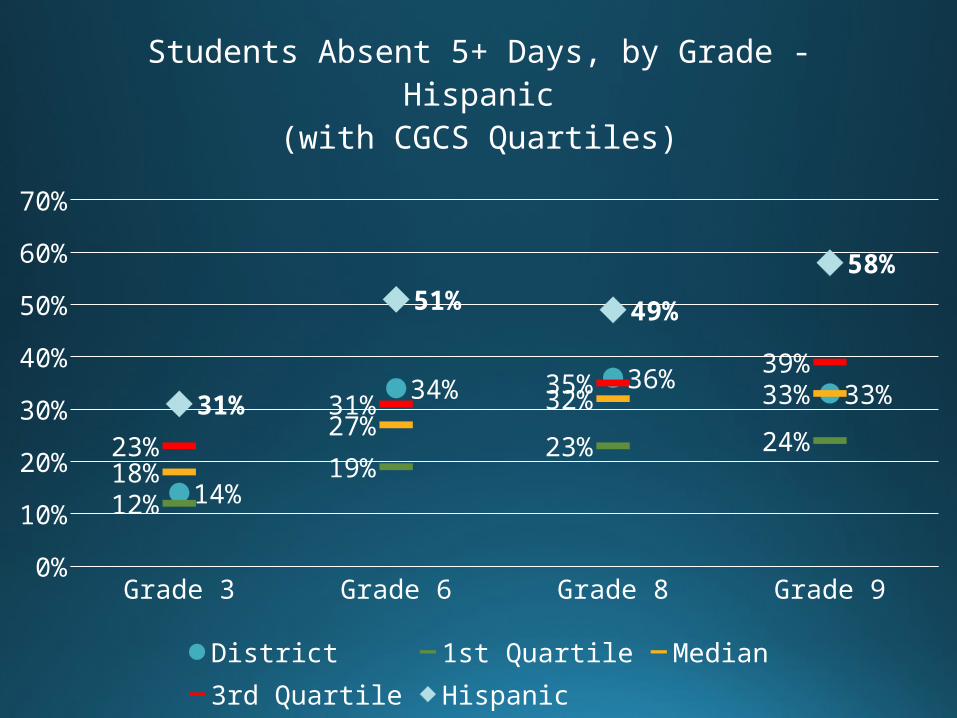
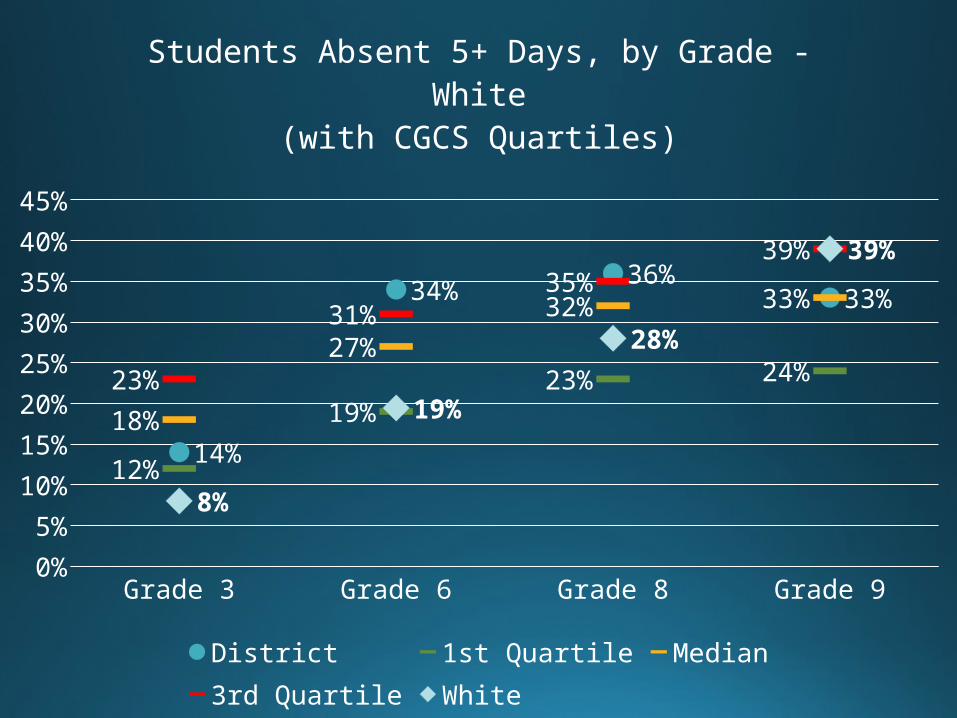
What’s the multi-grade trend for each student group?•The next nine charts are each focused on a specific student group (STUDENT GROUP is the variable)
•Provides a one-chart summary for a student group
•Shows grades 3, 6, 8, 9•Shows district average as well as CGCS quartile benchmarks
Grade 3 Grade 6 Grade 8 Grade 90%
5%
10%
15%
20%
25%
30%
35%
40%
45%
14%
34%36%
33%
12%
19%
23% 24%
18%
27%
32% 33%
23%
31%
35%
39%
20%
37%39%
28%
Students Absent 5+ Days, by Grade - American Indian(with CGCS Quartiles)
District 1st Quartile Median3rd Quartile American Indian
Grade 3 Grade 6 Grade 8 Grade 90%
5%
10%
15%
20%
25%
30%
35%
40%
45%
14%
34%36%
33%
12%
19%23% 24%
18%
27%
32% 33%
23%
31%35%
39%
6%
15%
29%33%
Students Absent 5+ Days, by Grade - Asian American/Pacific Islander
(with CGCS Quartiles)
District 1st QuartileMedian 3rd QuartileAsian American / Pacific Islander
Grade 3 Grade 6 Grade 8 Grade 90%
5%
10%
15%
20%
25%
30%
35%
40%
45%
14%
34%36%
33%
12%
19%23% 24%
18%
27%
32% 33%
23%
31%35%
39%
12%
29%
22%
32%
Students Absent 5+ Days, by Grade - Black / African Amer-ican
(with CGCS Quartiles)
District 1st Quartile Median3rd Quartile Black / African American
Grade 3 Grade 6 Grade 8 Grade 90%
10%
20%
30%
40%
50%
60%
70%
14%
34% 36%33%
12%
19%23% 24%
18%
27%32% 33%
23%
31%35%
39%
31%
51% 49%
58%
Students Absent 5+ Days, by Grade - Hispanic(with CGCS Quartiles)
District 1st Quartile Median 3rd Quartile Hispanic
Grade 3 Grade 6 Grade 8 Grade 90%
5%
10%
15%
20%
25%
30%
35%
40%
45%
14%
34%36%
33%
12%
19%
23% 24%
18%
27%
32% 33%
23%
31%
35%
39%
8%
19%
28%
39%
Students Absent 5+ Days, by Grade - White(with CGCS Quartiles)
District 1st Quartile Median 3rd Quartile White
Grade 3 Grade 6 Grade 8 Grade 90%
5%
10%
15%
20%
25%
30%
35%
40%
45%
14%
34%36%
33%
12%
19%
23% 24%
18%
27%
32% 33%
23%
31%
35%
39%
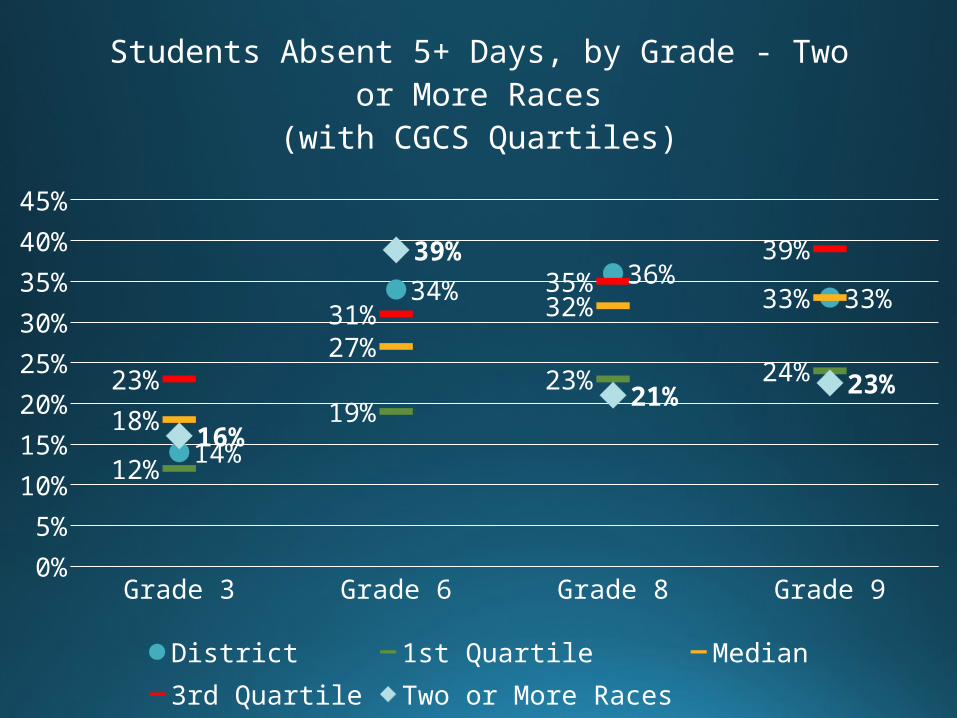
16%
39%
21% 23%
Students Absent 5+ Days, by Grade - Two or More Races(with CGCS Quartiles)
District 1st Quartile Median3rd Quartile Two or More Races
Grade 3 Grade 6 Grade 8 Grade 90%
5%
10%
15%
20%
25%
30%
35%
40%
45%
14%
34%36%
33%
12%
19%23% 24%
18%
27%
32% 33%
23%
31%35%
39%
8%
19% 21%18%
Students Absent 5+ Days, by Grade - Students with Disabilities
(with CGCS Quartiles)
District 1st Quartile Median3rd Quartile Students with Disabilities
Grade 3 Grade 6 Grade 8 Grade 90%5%
10%15%20%25%30%35%40%45%50%
14%
34% 36%33%
12%
19%23% 24%
18%
27%32% 33%
23%
31%35%
39%
26%
40%35%
43%
Students Absent 5+ Days, by Grade - English Language Learners
(with CGCS Quartiles)
District 1st QuartileMedian 3rd QuartileEnglish Language Learners
Grade 3 Grade 6 Grade 8 Grade 90%
10%
20%
30%
40%
50%
60%
70%
14%
34% 36%33%
12%19%
23% 24%18%
27%32% 33%
23%
31%35%
39%
30%
45% 43%
61%
Students Absent 5+ Days, by Grade - Free / Reduced Meal Eligibility
(with CGCS Quartiles)
District 1st QuartileMedian 3rd QuartileFree/ Reduced Price Meal Eligibile